3q17 results - unicreditgroup.eu transaction have been ... operating model transformation ahead ......
TRANSCRIPT

3Q17 Results
Milan, 9 November 2017

2
Disclaimer
This Presentation may contain written and oral “forward-looking statements”, which includes all statements that do not relate solely to historical or current facts and which are therefore inherently uncertain. All forward-looking statements rely on a number of assumptions, expectations, projections and provisional data concerning future events and are subject to a number of uncertainties and other factors, many of which are outside the control of UniCredit S.p.A. (the “Company”). There are a variety of factors that may cause actual results and performance to be materially different from the explicit or implicit contents of any forward-looking statements and thus, such forward-looking statements are not a reliable indicator of future performance. The Company undertakes no obligation to publicly update or revise any forward-looking statements, whether as a result of new information, future events or otherwise, except as may be required by applicable law. The information and opinions contained in this Presentation are provided as at the date hereof and are subject to change without notice. Neither this Presentation nor any part of it nor the fact of its distribution may form the basis of, or be relied on or in connection with, any contract or investment decision. The information, statements and opinions contained in this Presentation are for information purposes only and do not constitute a public offer under any applicable legislation or an offer to sell or solicitation of an offer to purchase or subscribe for securities or financial instruments or any advice or recommendation with respect to such securities or other financial instruments. None of the securities referred to herein have been, or will be, registered under the U.S. Securities Act of 1933, as amended, or the securities laws of any state or other jurisdiction of the United States or in Australia, Canada or Japan or any other jurisdiction where such an offer or solicitation would be unlawful (the “Other Countries”), and there will be no public offer of any such securities in the United States. This Presentation does not constitute or form a part of any offer or solicitation to purchase or subscribe for securities in the United States or the Other Countries. Pursuant the consolidated law on financial intermediation of 24 February 1998 (article 154-bis, paragraph 2) Francesco Giordano, in his capacity as manager responsible for the preparation of the Company’s financial reports declares that the accounting information contained in this Presentation reflects the UniCredit Group’s documented results, financial accounts and accounting records. This Presentation has been prepared on a voluntary basis since the financial disclosure additional to the half-year and annual ones is no longer compulsory pursuant to law 25/2016 in application of Directive 2013/50/EU, in order to grant continuity with the previous quarterly presentations. The UniCredit Group is therefore not bound to prepare similar presentations in the future, unless where provided by law. Neither the Company nor any member of the UniCredit Group nor any of its or their respective representatives, directors or employees accept any liability whatsoever in connection with this Presentation or any of its contents or in relation to any loss arising from its use or from any reliance placed upon it.

3
Agenda
Executive summary Transform 2019 update
Group quarterly highlights
Divisional quarterly highlights
Asset quality
Capital
Annex
1
2
3
4
5
6
7

4
Adjusted net profit(1) at 838m up 87% Y/Y thanks to tangible results of Transform 2019 and underlying Group-wide business momentum
(1) Adjusted net profit excluding the net impact from Pioneer (+2.1bn 3Q17) disposal and a one-off charge booked in Non Core (-80m in 3Q17) related to FINO. All costs and charges pertaining to the FINO transaction have been accounted for, including a one-off charge of 80m booked in Non Core in 3Q17 as included in the disclosure on 24 October 2017 of 3Q preliminary results.
(2) Calculated as difference between number of clients at beginning and end of period.
Executive Summary 1 2 3 4 5 6 7
Strong commercial dynamics thanks to network revamp. YTD: Number of clients increased by 423,000(2) and 52bn of new loan production. 9M17 vs. 9M16: AuM up 15.3bn (+7.8%) and fees up 261m (+5.5%) Operating model transformation ahead of plan, with 59% of planned branch closures and 51% of FTE reductions already achieved. FY17 total costs expected to be marginally lower than the 11.7bn target 3Q17 CoR at a low 53 bps. FY17 CoR estimated to be between 55 and 60bps. Expected Loss of the stock and new origination at 38bps and 34bps respectively, both down 1bp Q/Q, supported by strict risk discipline 3Q17 fully loaded CET1 ratio at a high 13.81%, thanks to Pioneer disposal and earnings generation

4,835 5,076 4,646 -8.5% -3.9% 15,190 14,776 -2.7%
-2,940 -2,858 -2,813 -1.6% -4.3% -8,898 -8,557 -3.8%
-977 -564 -598 +6.0% -38.8% -2,621 -1,833 -30.1%
447 945 2,820 n.m. n.m. 1,768 4,672 n.m.
447 1,255 838 -33.3% +87.4% 1,739 3,000 +72.5%
10.82% 12.80% 13.81% +1.0pp +3.0pp 10.82% 13.81% +3.0pp
390.9 352.7 350.0 -0.7% -10.5% 390.9 350.0 -10.5%
426.1 420.7 421.1 +0.1% -1.2% 426.1 421.1 -1.2%
74.8 53.0 51.3 -3.2% -31.5% 74.8 51.3 -31.5%
3.0% 9.5% 6.8% -2.7pp +3.8pp 4.2% 7.8% +3.5pp
60.8% 56.3% 60.5% +4.2pp -0.3pp 58.6% 57.9% -0.7pp
85 50 53 +3bps -32bps 77 54 -22bps
Total revenues, m
Operating costs, m
Fully loaded CET1 ratio(3)
Loans, exc. repos, bn
∆ % vs. 2Q17
Loan loss provisions, m
Net profit, m
Group key figures(1) 2Q17 3Q17
Gross NPE, bn
Adjusted RoTE(2)
Cost / Income
Cost of risk, bps
1 2 3 4 5 6 7 Executive Summary
Group – Adjusted RoTE at 7.8% in 9M17
RWA transitional, bn
3Q16 9M16 9M17 ∆ % vs. 3Q16
∆ % vs. 9M16
5
Adjusted net profit, m(2)
Net profit in 3Q17 impacted by Pioneer disposal (+2.1bn) and one-off charge booked in Non Core (-80m)(2) related to FINO
(1) Please consider that across the document, all 2016 and 2017 figures were restated for the consolidation effects arising from the intercompany fees relating to Bank Pekao and Pioneer, which until 2Q17 were classified as held for sale, in accordance to IFRS5 principle.
(2) Adjusted net profit and RoTE excluding the net impact from the Pekao (-310m FX reserve 2Q17) and Pioneer (+2.1bn 3Q17) disposals and a one-off charge booked in Non Core (-80m in 3Q17) related to FINO. All costs and charges pertaining to the FINO transaction have been accounted for, including a one-off charge of 80m booked in Non Core in 3Q17 as included in the disclosure on 24 October 2017 of 3Q preliminary results. Adjustments for 2016 according to table on page 44. RoTE calculated at CMD perimeter, considering also the capital increase and Pekao & Pioneer disposals as at 1 January 2017.
(3) Assuming foreseeable dividends calculated as at 30 September 2017 equals to 20% payout ratio on normalised earnings excluding the net impact of Bank Pekao and Pioneer disposals

6
Group quarterly highlights
Divisional quarterly highlights
Asset quality
Capital
Annex
1
3
4
5
6
7
Executive summary
Transform 2019 update 2
7
IMPROVE ASSET
QUALITY
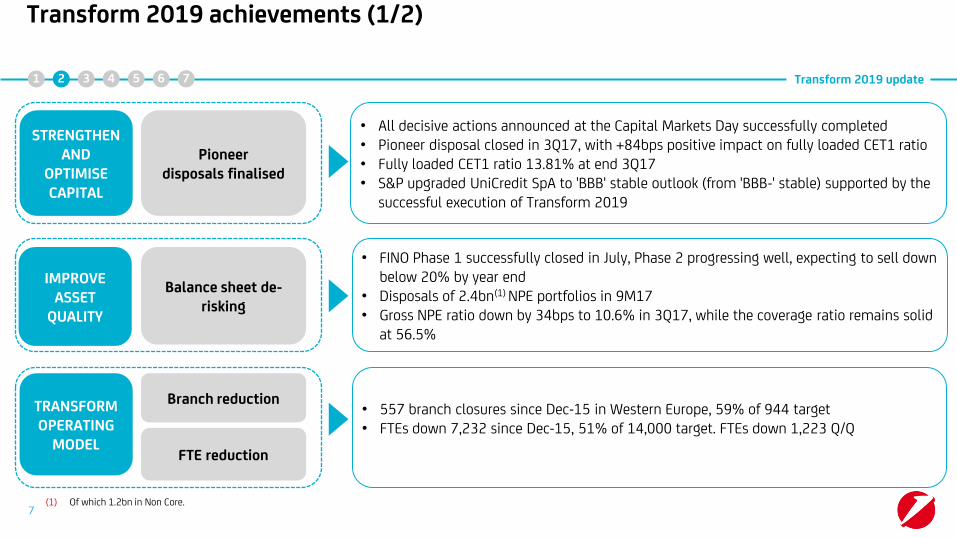
• FINO Phase 1 successfully closed in July, Phase 2 progressing well, expecting to sell down below 20% by year end
• Disposals of 2.4bn(1) NPE portfolios in 9M17 • Gross NPE ratio down by 34bps to 10.6% in 3Q17, while the coverage ratio remains solid
at 56.5%
Balance sheet de-risking
Transform 2019 achievements (1/2) 1 2 3 4 5 6 7 Transform 2019 update
STRENGTHEN AND
OPTIMISE CAPITAL
Pioneer disposals finalised
• All decisive actions announced at the Capital Markets Day successfully completed • Pioneer disposal closed in 3Q17, with +84bps positive impact on fully loaded CET1 ratio • Fully loaded CET1 ratio 13.81% at end 3Q17 • S&P upgraded UniCredit SpA to 'BBB' stable outlook (from 'BBB-' stable) supported by the
successful execution of Transform 2019
TRANSFORM OPERATING
MODEL
Branch reduction
FTE reduction
• 557 branch closures since Dec-15 in Western Europe, 59% of 944 target • FTEs down 7,232 since Dec-15, 51% of 14,000 target. FTEs down 1,223 Q/Q
(1) Of which 1.2bn in Non Core.

8
Transform 2019 achievements (2/2) 1 2 3 4 5 6 7 Transform 2019 update
• Since Dec-15 FTEs down 8.8% (-1,534 FTEs). Trend confirmed in 3Q17 • Weight of Group Corporate Centre on total costs at 3.9% in 3Q17 (2015 actual: 5.1%, 2019
target: 2.9%) down 30bps Q/Q
ADOPT LEAN BUT STEERING
CENTRE Group CC streamlining
8
MAXIMISE COMMERCIAL BANK VALUE E2E redesign and
streamlining
Strategic partnership
Multichannel offer/ customer experience
Capital markets
(1) Transactions concluded through ATM, online, mobile or Contact Centre. (2) Percentage of remote sales calculated on total bank products that have a direct selling process. (3) Source: Dealogic, as at 30 September 2017. Syndicated Loans: Italy , Germany and Austria by number of deals and deal value, CEE by deal value; EMEA All Covered Bonds in Euro by number of deals.
• 9M17 AuM net sales in Italy at 8bn, up more than twofold vs. 9M16, supported by the Amundi partnership
• Continued focus on client multichannel approach across the Group: - Number of remote sales1 increased in Italy by 40% Y/Y reaching 18.6% of total sales2 in
3Q17 - Number of online and mobile users in CEE increased to 39.7% and 28.3% respectively in
3Q17, with mobile users growing at a higher rate • Further progress in E2E process/product redesign:
- First three products (Current Accounts, Credit Cards, Receivable Financing) available for Network and Clients already with tangible results for both clients (improved customer experience) and UniCredit (FTE reduction)
- Another three products in redesign phase (Residential Mortgages, Advisory, Assets under Management) evolving according to plan
- Redesign of further two new products just launched (Corporate Mortgages, Debit Cards) • Ranking #1 in “Syndicated Loans” in Italy, Germany and Austria, #2 in “Syndicated Loans in
CEE” and #1 in “EMEA All Covered Bonds in Euro”3

9
Divisional quarterly highlights
Asset quality
Capital
Annex
1
4
5
6
7
Executive summary
Group quarterly highlights 3
2 Transform 2019 update

Stated net profit, m Adjusted(1) net profit by division 3Q17, m
Adj. RoTE(1)
1 2 3 4 5 6 7 Group quarterly highlights
Group – Good performance in all business divisions with CEE, CIB and CBK Italy main contributors to the bottom line
• Group adjusted RoTE 6.8% in 3Q17 and 7.8% in 9M17
• CBK Germany, CBK Austria and CIB RoAC positively impacted by non-recurring items in 3Q17 (+38m, +82m and +84m respectively)(2)
10
9.5% 4.2%
(1) Adjusted net profit and RoTE excluding the net impact from the Pekao (-310m FX reserve 2Q17) and Pioneer (+2.1bn 3Q17) disposals and a one-off charge booked in Non Core (-80m in 3Q17) related to FINO. All costs and charges pertaining to the FINO transaction have been accounted for, including a one-off charge of 80m booked in Non Core in 3Q17 as included in the disclosure on 24 October 2017 of 3Q preliminary results. Adjustments for 2016 according to table on page 44. RoTE calculated at CMD perimeter, considering also the capital increase and Pekao & Pioneer disposals as at 1 January 2017.
(2) Please refer to page 44 in annex for non-recurring items.
7.8%
1.3bn adjusted(1)
945447
9M17
4,672
9M16
1,768
3Q17
2,820
2Q17 3Q16
10%
13%
27%
15%
13%
54%
n.m.
n.m.
6.8%excl. Pioneer disposal (+2.1bn)
c.3bn adjusted(1)
838m adjusted(1)
excl. one-off charge (-80m )
3.0%
246
156
188
413
299
838Group
Non Core -127
Group CC -352
Fineco 16
CIB
CEE
CBK Austria
CBK Germany
CBK Italy
RoAC

11
Key drivers(1)
1 2 3 4 5 6 7 Group quarterly highlights
Group – Adjusted net profit up 87% Y/Y thanks to strong underlying commercial performance, down 33% Q/Q impacted by seasonality
• Net interest in 3Q17 decreased 5.7% Q/Q or 2.4% excluding one-off in CBK Germany in 2Q17 (+90m). Down 3.5% Y/Y mainly due to continued spread compression
• Fees increased 4.2% Y/Y thanks to investment and transactional fees. Q/Q down 7.9% due to seasonality
• Costs down 1.6% Q/Q thanks to lower HR costs (-2.3% Q/Q) and Non HR costs (-0.4% Q/Q). FY17 total costs expected to be marginally lower than the 11.7bn target
• Low level of LLP at 598m in 3Q17 leading to 53bps CoR, FY17 CoR estimated to be between 55 and 60bps
• Systemic charges increased 130m Q/Q mainly due to Deposit Guarantee Scheme and Voluntary Scheme in Italy
• Net profit from discontinued operations includes Pioneer disposal (+2.1bn)
(1) Please consider that across the document, all 2016 and 2017 figures were restated for the consolidation effects arising from the intercompany fees relating to Bank Pekao and Pioneer, which until 2Q17 were classified as held for sale, in accordance to IFRS5 principle.
(2) Adjusted net profit excluding the net impact from the Pekao (-310m FX reserve 2Q17) and Pioneer (+2.1bn 3Q17) disposals and a one-off charge booked in Non Core (-80m in 3Q17) related to FINO. All costs and charges pertaining to the FINO transaction have been accounted for, including a one-off charge of 80m booked in Non Core in 3Q17 as included in the disclosure on 24 October 2017 of 3Q preliminary results. Adjustments for 2016 according to table on page 44.
Data in m
Total revenues 4,835 5,076 4,646 -8.5% -3.9% 15,190 14,776 -2.7%
o/w Net interest 2,591 2,652 2,500 -5.7% -3.5% 7,893 7,716 -2.2%
o/w Fees 1,527 1,730 1,592 -7.9% +4.2% 4,763 5,025 +5.5%
o/w Trading 478 462 381 -17.6% -20.3% 1,675 1,434 -14.4%
Operating costs -2,940 -2,858 -2,813 -1.6% -4.3% -8,898 -8,557 -3.8%
Gross operating profit 1,896 2,218 1,833 -17.4% -3.3% 6,292 6,220 -1.2%
Loan loss provisions -977 -564 -598 +6.0% -38.8% -2,621 -1,833 -30.1%
Net operating profit 919 1,654 1,235 -25.3% +34.4% 3,672 4,387 +19.5%
Other charges &
provisions-247 -135 -273 n.m. +10.5% -1,105 -871 -21.2%
o/w Systemic charges -173 -19 -149 n.m. -13.5% -788 -603 -23.5%
Profit before taxes 638 1,338 926 -30.8% +45.2% 2,181 3,318 +52.1%
Income taxes -277 -143 -181 +27.0% -34.5% -630 -543 -13.8%
Net profit from
discontinued operations190 -133 2,126 n.m. n.m. 564 2,155 n.m.
Net profit 447 945 2,820 n.m. n.m. 1,768 4,672 n.m.
Adjusted net profit(2) 447 1,255 838 -33.3% +87.4% 1,739 3,000 +72.5%
9M16 9M17∆ % vs.
9M162Q17 3Q17
∆ % vs.
3Q16
∆ % vs.
2Q173Q16

-3.2%
3Q17 stated
Other(3)
-56
TLTRO benefit
-1
Term funding
+7
Deposits rate
+28
Loans rate
-53
Deposits volume
-3 2,500 -11
2Q17 baseline
2,582
One off(2)
-90
Loans volume
+20
2Q17 stated
2,652
Invest. ptf &
markets/treasury
+7
Days effects & FX effect
Net interest(1) bridge Q/Q, m
Commercial dynamics: -33m
12
-0.33%
(flat Q/Q)
Net interest margin(4)
1 2 3 4 5 6 7 Group quarterly highlights
(1) Contribution from macro hedging strategy on non naturally hedged sight deposits in 3Q17 at 381m, +1.2m Q/Q and -10.3m Y/Y.
(2) Release of a tax provision in net interest line in CBK Germany (+90m) in 2Q17.
(3) Including one-off in CBK Austria (+14m).
(4) Net interest margin calculated as interest income divided by interest earning assets minus interest expenses divided by interest bearing liabilities.
Group – NII positive contribution from deposits rate and term funding partially offsetting effects from lower rates and average loan volumes. FY17 guidance confirmed at 10.2bn
Average Euribor 3M
1.42% 1.35% 1.38%

-0.5%
3Q17
391.5
2.69%
2Q17
393.6
2.76%
3Q16
398.1
2.86%
13
Avg. commercial loans(1) and rates
Cust. rates
Avg. vol., bn
Cust. rates
Avg. vol., bn
Customer spreads(2) 3Q17
CEE 3.36%
CBK Austria 1.46%
CBK Germany 2.27%
CBK Italy 2.75%
Group 2.50%
CIB 2.18%
1 2 3 4 5 6 7 Group quarterly highlights
Q/Q Y/Y
(1) Average commercial volumes are managerial figures that exclude debt securities booked in loans and are calculated as daily averages. Loans net of provisions.
(2) Customer spread defined as the difference between rate on customer loans and rate on customer deposits.
+1bp +7bps
-5bps -15bps
-3bps -10bps
At const. FX Q/Q
-
+1.4%
-0.4%
Group – Customer rates expected to bottom out in 2H18
+1.1%
3Q17
388.0
0.19%
2Q17
383.8
0.24%
3Q16
376.0
0.26%
Avg. commercial deposits(1) and rates At const. FX
Q/Q
+1.2bn excl. Non Core (+0.3% Q/Q)
-6bps
-8bps -26bps
-6bps -21bps
+2bps -13bps
14
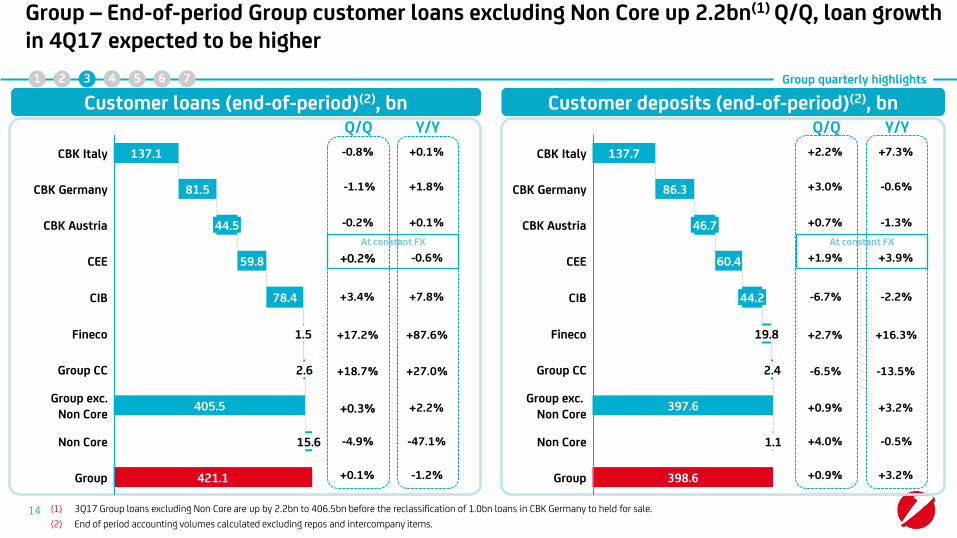
Customer loans (end-of-period)(2), bn Customer deposits (end-of-period)(2), bn
1 2 3 4 5 6 7 Group quarterly highlights
(1) 3Q17 Group loans excluding Non Core are up by 2.2bn to 406.5bn before the reclassification of 1.0bn loans in CBK Germany to held for sale.
(2) End of period accounting volumes calculated excluding repos and intercompany items.
Q/Q Y/Y
-0.8%
-1.1%
-0.2%
+0.2%
+3.4%
+17.2%
+18.7%
+0.1%
+1.8%
+0.1%
-0.6%
+7.8%
+87.6%
+27.0%
Q/Q Y/Y
+2.2%
+3.0%
+0.7%
+1.9%
-6.7%
+2.7%
-6.5%
+7.3%
-0.6%
-1.3%
+3.9%
-2.2%
+16.3%
-13.5%
+0.3%
-4.9%
+0.1%
+2.2%
-47.1%
-1.2% Group 398.6
Non Core 1.1
Group exc. Non Core
397.6
Group CC 2.4
Fineco 19.8
CIB 44.2
CEE 60.4
CBK Austria 46.7
CBK Germany 86.3
CBK Italy 137.7
+0.9%
+4.0%
+0.9%
+3.2%
-0.5%
+3.2%Group 421.1
Non Core 15.6
Group exc. Non Core
405.5
Group CC 2.6
Fineco 1.5
CIB 78.4
CEE 59.8
CBK Austria 44.5
CBK Germany 81.5
CBK Italy 137.1
Group – End-of-period Group customer loans excluding Non Core up 2.2bn(1) Q/Q, loan growth in 4Q17 expected to be higher
At constant FX At constant FX

15 4. RateAna
Annex – P&L
+1.9% +7.7%
Q/Q Y/Y
Group – Fees up 4.2% Y/Y supported by investment and transactional fees. Seasonally lower contribution Q/Q of investment and financing fees
531 548 559 559
428 450 386 396
569
732638 638
-8.5%
Transactional fees
Financing fees
Investment fees
3Q17 stated
1,592
Non commercial
Items(3)
+10
3Q17 baseline (2)
1,583
Transactional
+10
Financing
-64
Investment
-94
2Q17 stated
1,730
3Q16 stated
1,527
(1) Please consider that across the document, all 2016 and 2017 figures were restated for the consolidation effects arising from the intercompany fees relating to Bank Pekao and Pioneer, which until 2Q17 were classified as held for sale, in accordance to IFRS5 principle.
(2) Baseline data excluding non commercial items.
(3) Non commercial items include securitisation expenses and outsourced workout costs.
1 2 3 4 5 6 7 Group quarterly highlights
-12.8% +12.2%
-12.0% -7.5%
+1.9% +5.2%
-7.9% +4.2%
Fees bridge in 3Q17, m – stated figures(1)

• TFAs increased to 804bn in 3Q17 (+10.1bn Q/Q) mainly thanks to: Assets under Management at 211.4bn up 2.1% Q/Q
and 7.8% Y/Y. Higher net sales of 3.4bn up c.40% Y/Y, up 112% from 6.3bn to 13.3bn 9M/9M
Assets under Custody at 203.4bn up 0.3% Q/Q, higher in CBK Germany (+4% Q/Q), offset by lower AuC in other divisions
Deposits at 389bn increased 1.4% Q/Q mainly in CBK Italy and CBK Germany, compensating lower deposits in CIB
+26.2bn (+3.4%)
+10.1bn (+1.3%)
Deposits
AuC
AuM
3Q17
803.8
389.0
203.4
211.4
2Q17
793.7
383.7
202.9
207.2
3Q16
777.7
374.6
207.0
196.1
Main drivers
Q/Q Y/Y
GROUP TFAs(1) 3Q17, bn
1 2 3 4 5 6 7 Group quarterly highlights
16 (1) Refers to Group Commercial Total Financial Assets. Non-commercial elements, i.e. Group Corporate Centre, Non-Core, Leasing/Factoring and Market Counterparts, are excluded. Numbers are managerial figures.
(25%)
(27%)
(48%)
(26%)
(26%)
(48%)
(26%)
(25%)
(48%)
+4.3bn +15.3bn
(+2.1%) (+7.8%)
+0.5bn -3.6bn(+0.3%) (-1.7%)
+5.3bn +14.4bn
(+1.4%) (+3.9%)
+10.1bn +26.2bn
Group – Strong growth of AuM, up 15.3bn Y/Y Continued increase of TFAs, up 10bn Q/Q and 26bn Y/Y
(+1.3%) (+3.4%)

17
Dividends(1), m Trading income, m
179386
652202353382
-17.6%
-20.3%
-14.4%
9M17
1,434
1,048
9M16
1,675
1,023
3Q17
381
2Q17
462
110
3Q16
478
97
321 26287 97 80
375
256
86102 85
-12.8%
-10.0%
-25.5%
9M17
518
9M16
696
3Q17
165
2Q17
183
3Q16
189
(1) Figures include dividends and equity investments. Turkey contribution at equity based on divisional view.
(2) Client driven trading includes value adjustments equal to +8m in 3Q17: credit value adjustments of -5m, funding value adjustment of +10m and fair value adjustment of +2m.
(3) 3Q17 non-recurring capital gains pre tax: +87m in CIB and +39m in CBK Germany.
Turkey (at equity) Other dividends and equity investments
1 2 3 4 5 6 7 Group quarterly highlights
Group – Trading income down 17.6% Q/Q in an unfavourable sector-wide environment
Client driven
Other trading
• Lower client(2) activity by 43% Q/Q due to unfavourable sector-wide environment
• Other trading income excluding non-recurring capital gains(3) in 3Q17 down by 51.8% Q/Q
• Turkey's contribution flat Q/Q mainly due to FX movement (at constant FX, +4.1% Q/Q)
• Other dividends down to 80m due to lower contribution from insurance and other participations
669m exc. Visa Europe

C/I
Costs, m
18
-4.3%
-1.6%
-3.8%
9M17
8,557
9M16
8,898
3Q17
2,813
2Q17
2,858
3Q16
2,940
• Execution of Transform 2019 progressing well:
51% of FTE reduction target achieved
59% of branch closures reached
• FTE down 5,117 Y/Y
• Branches in Western Europe further down 377 Y/Y
• C/I down to 58% in 9M17
• FY17 total costs expected to be marginally lower than the 11.7bn target, despite seasonal increase in HR and Non HR costs in 4Q17
• FY19 10.6bn total costs target confirmed
1 2 3 4 5 6 7
Group – Costs 1.6% lower Q/Q and 4.3% Y/Y, ahead of plan on better FTE and branch
reduction
FTEs
-1,223
-5,117
WE
CEE
3Q17
94,066
69,932
24,134
2Q17
95,288
71,035
24,254
3Q16
99,183
74,693
24,490
Q/Q
-0.5%
-1.6%
Branches(1)
-134
-515
WE
CEE
3Q17
4,975
3,252
1,723
2Q17
5,109
3,345
1,764
3Q16
5,490
3,629
1,861
Q/Q
-2.8%
Main drivers Group quarterly highlights
-2.3%60.8% 56.3% 60.5% 58.6% 57.9%
(1) Branch figures consistent with CMD perimeter.

(1) Non HR costs include "other administrative expenses", "recovery of expenses" and "amortisation, depreciation and impairment losses on intangible and tangible assets".
Staff expenses, m
Group – Cost reduction on track with HR and Non HR costs down Q/Q and Y/Y driven by
disciplined cost control
-4.7%
-2.3%
-4.8%
WE
CEE
9M17
5,204
4,648
556
9M16
5,459
4,921
538
3Q17
1,704
1,518 186
2Q17
1,744
1,560 184
3Q16
1,791
1,608
183
Non HR costs(1), m
• Staff expenses down 2.3% Q/Q and 4.8% Y/Y
• Significant reduction Q/Q in CBK Austria down 9.7%, Corporate Centre down 4.5% and CBK Italy down 1.3%
19
Group quarterly highlights
• Non HR costs down 3.5% Y/Y mainly driven by Corporate Centre, CBK Austria and CIB
• Q/Q non HR costs are down 0.4%
949 910 918
590587-0.4%
-2.5%
WE
CEE
9M17
3,353
2,763
9M16
3,438
2,852
3Q17
1,108 190
2Q17
1,113 203
3Q16
1,149 200
-3.5%
1 2 3 4 5 6 7

20
Loan loss provisions, m
Cost of risk
Cov. ratio gross NPE
Main drivers(1)
1 2 3 4 5 6 7 Group quarterly highlights
Gross NPE ratio
• LLPs on a low level at 598m, with CoR at 53bps in 3Q17 and at 54bps at 9M17
• Gross NPE ratio down 34bps to 10.6% with solid coverage ratio at 56.5%
• CoR across divisions in 3Q17:
i. CBK Italy down to 61bps
ii. 0bps in CBK Germany below normalised level, driven by write-backs
iii. 12bps in CBK Austria after 1H17 net write-backs
iv. In CEE 106bps (+53bps Q/Q, +5bps Y/Y), back at normalised levels, after write-backs in 2Q17
v. CIB's CoR at normalised levels of 20bps
Group – Low CoR of 53bps in 3Q17, FY17 CoR expected to be between 55 and 60bps
598564977
-30.1%
-38.8%
+6.0%
9M17
1,833
9M16
2,621
3Q17 2Q17 3Q16
(1) Starting from 31 December 2016 the credit exposures belonging to the so-called “FINO Portfolio” were recognised in the item “Non-current assets and disposal groups classified as held for sale”. Following the “FINO portfolio” disposal occurred in July 2017 and the application of the IAS 39 principle, the credit exposures related to such a portfolio have been derecognised for accounting purposes from the balance sheet assets. Group asset quality ratios calculated, on a pro forma basis, including the underlying credit positions of the whole FINO portfolio as at 30 September 2017 are the following: gross NPE ratio of 13.5% (13.9%in 2Q17); net NPE ratio of 5.3% (5.5% in 2Q17); NPE coverage ratio of 64.3% (64.0%in 2Q17); gross bad loans ratio of 9.1% (9.3% in 2Q17); net bad loans ratio of 2.6% (2.6% in 2Q17); bad loans coverage ratio of 74.4% (74.4% in 2Q17).
+85bps +50bps +53bps
52.2% 56.3% 56.5%
15.2% 11.0% 10.6%
+77bps +54bps

21
Group quarterly highlights
Asset quality
Capital
Annex
1
3
5
6
7
Executive summary
Divisional quarterly highlights 4
2 Transform 2019 update

Main drivers 1 2 3 4 5 6 7 Divisional quarterly highlights
(1) Branch figures consistent with CMD perimeter.
(2) Managerial figures.
Data in m
Total revenues 1,835 1,927 1,759 -8.7% -4.1% 5,756 5,542 -3.7%
o/w Net interest 976 923 907 -1.8% -7.1% 2,976 2,753 -7.5%
o/w Fees 832 971 861 -11.3% +3.5% 2,672 2,779 +4.0%
Operating costs -1,139 -1,121 -1,108 -1.2% -2.8% -3,459 -3,347 -3.2%
Gross operating profit 696 805 651 -19.1% -6.4% 2,297 2,195 -4.5%
LLP -240 -227 -210 -7.7% -12.7% -711 -678 -4.6%
Net operating profit 456 578 441 -23.7% -3.1% 1,586 1,516 -4.4%
Net profit 226 323 246 -24.0% +8.6% 826 881 +6.7%
RoAC 8.3% 12.8% 9.7% -3.1pp +1.4pp 10.4% 11.7% +1.3pp
C/I 62.1% 58.2% 63.0% +4.8pp +0.9pp 60.1% 60.4% +0.3pp
CoR (bps) 70 66 61 -5bps -9bps 70 66 -3bps
Branches(1) 3,140 2,874 2,784 -3.1% -11.3% 3,140 2,784 -11.3%
FTEs 35,559 34,270 33,531 -2.2% -5.7% 35,559 33,531 -5.7%
Gross NPE ratio 6.4% 6.6% 6.7% +14bps +30bps 6.4% 6.7% +30bps
9M16 9M17∆ % vs.
9M16
∆ % vs.
2Q17
∆ % vs.
3Q163Q16 2Q17 3Q17
CBK Italy – Net profit up 8.6% Y/Y, RoAC at 11.7% 9M17 Fees up 3.5% Y/Y, down 11.3% Q/Q impacted by seasonality
• NII lower 1.8% Q/Q due to further pressure on customer spread down 8bps Q/Q
• New loans production(2) at 14.9bn in 9M17 up 1% 9M/9M, supported by corporates up 21% 9M/9M
• Fees up 3.5% Y/Y, mostly supported by investment fees. AuM Net Sales of 2.5bn in 3Q17, up 184% Y/Y. AuM volumes at 123bn up 2.4bn Q/Q
• YTD c. 260,000 gross new clients
• Continued reduction of HR costs 1.3% Q/Q and Non HR costs 3.9% Q/Q. Cost income flat at 60.4% at 9M17
• FTEs down 739 Q/Q and branches down 90 Q/Q
• Systemic charges up 67m Q/Q due to Deposit Guarantee Scheme
• CoR down 5bps Q/Q to 61bps in 3Q17
• RoAC at 11.7% in 9M17
22

Main drivers 1 2 3 4 5 6 7 Divisional quarterly highlights
Data in m
Total revenues 597 731 660 -9.7% +10.6% 1,856 2,091 +12.7%
o/w Net interest 374 478 390 -18.4% +4.4% 1,142 1,263 +10.6%
o/w Fees 180 187 178 -4.7% -0.7% 546 599 +9.7%
Operating costs -474 -462 -454 -1.8% -4.4% -1,435 -1,391 -3.1%
Gross operating profit 122 268 206 -23.2% +68.7% 421 700 +66.4%
LLP -21 -32 0 -98.9% -98.3% 8 -53 n.m.
Net operating profit 101 236 206 -12.8% n.m. 429 647 +51.0%
Net profit 68 238 156 -34.6% n.m. 269 506 +88.1%
RoAC 4.7% 20.8% 13.4% -7.3pp +8.7pp 6.6% 14.5% +7.9pp
C/I 79.5% 63.3% 68.8% +5.5pp -10.8pp 77.3% 66.5% -10.8pp
CoR (bps) 10 16 0 -16bps -10bps -1 9 +10bps
Branches(1) 342 341 341 +0.0% -0.3% 342 341 -0.3%
FTEs 11,030 10,346 10,296 -0.5% -6.7% 11,030 10,296 -6.7%
Gross NPE ratio 2.9% 2.5% 2.2% -30bps -70bps 2.9% 2.2% -70bps
2Q17 3Q173Q16 9M16 9M17∆ % vs.
9M16
∆ % vs.
3Q16
∆ % vs.
2Q17
CBK Germany – Normalised RoAC at 8.2% in 9M17 NII up 4.4% Y/Y, flat Q/Q excluding positive one-off in 2Q17
(1) Branch figures consistent with CMD perimeter.
(2) 2Q17 one-off on net interest (90m) related to release of a tax provision.
(3) Managerial figures.
(4) Normalised RoAC for a net capital gain on disposal in 3Q17 (+38m) and in 2Q17 (+170m) related to the release of a tax provision.
• NII flat in 3Q17 excluding 90m positive one-off(2) in 2Q17. Customer spread down 6bps Q/Q
• New loans production(3) at 7.4bn in 9M17 up 17.0% 9M/9M
• Fees lower 4.7% Q/Q. Investment fees lower due to seasonality while transaction fees increased by 4.5% Q/Q driven by GTB
• YTD c. 37,000 gross new clients
• AuM volumes increased 2% Q/Q reaching 28bn in 3Q17
• Costs lower 1.8% Q/Q and 4.4% Y/Y
• FTE further reduced, down 200 Q/Q when excluding the hiring of 150 apprentices in 3Q17
• CoR at 0bps driven by write backs
• Net profit benefitted from a 38m capital gain on disposal
• Normalised(4) RoAC at 8.2% in 9M17
23

Main drivers
1 2 3 4 5 6 7 Divisional quarterly highlights
24
Data in m
Total revenues 412 402 385 -4.4% -6.5% 1,238 1,153 -6.9%
o/w Net interest 208 173 180 +4.1% -13.2% 602 525 -12.8%
o/w Fees 146 154 151 -1.9% +3.6% 438 459 +4.8%
Operating costs -295 -272 -261 -4.2% -11.7% -927 -816 -11.9%
Gross operating profit 117 130 124 -4.7% +6.3% 311 337 +8.3%
LLP 21 30 -14 n.m. n.m. 28 68 n.m.
Net operating profit 138 160 110 -31.5% -20.1% 339 404 +19.4%
Net profit 98 205 188 -8.6% +91.7% -20 461 n.m.
RoAC 12.3% 28.2% 26.7% -1.4pp +14.4pp -1.7% 21.2% +22.9pp
C/I 71.6% 67.6% 67.7% +0.1pp -3.9pp 74.9% 70.8% -4.1pp
CoR (bps) -17 -25 12 +38bps +29bps -8 -19 -12bps
Branches(1) 147 130 127 -2.3% -13.6% 147 127 -13.6%
FTEs 5,535 5,246 5,199 -0.9% -6.1% 5,535 5,199 -6.1%
Gross NPE ratio 5.0% 4.6% 4.4% -27bps -60bps 5.0% 4.4% -60bps
9M16 9M17∆ % vs.
9M16
∆ % vs.
3Q163Q16
∆ % vs.
2Q172Q17 3Q17
(1) Branch figures consistent with CMD perimeter.
(2) Managerial figures.
(3) Non recurring items in 3Q17: real estate disposals (+65m) and tax effects (+17m) for a total of +82m.
CBK Austria – Normalised RoAC of 17.3% in 9M17 excluding non-recurring items
• NII increased 4.1% Q/Q driven by a positive one-off of 14m in 3Q17. Excluding extraordinary items NII Q/Q stable
• New loans production(2) at 4.6bn in 9M17 slightly lower by 2.3% 9M/9M
• Fees up 3.6% Y/Y driven by investment fees, down 1.9% Q/Q affected by seasonality. AuM Q/Q up 1.5% to 22.9bn
• YTD c. 39,000 gross new clients
• Restructuring plan ongoing, costs down 4.2% Q/Q (2Q17 impacted by positive one-offs) and 11.7% Y/Y
• Net profit benefitted from 65m related to real estate disposals and 17m from tax effects(3)
• CoR at 12bps after 1H17 net write-backs
• Normalised(3) RoAC at 17.3% in 9M17

1 2 3 4 5 6 7 Divisional quarterly highlights
25
Data in m (1)
Total revenues 1,057 1,074 1,040 -1.7% -1.0% 3,167 3,183 -0.9%
o/w Net interest 640 641 645 +2.2% -0.5% 1,852 1,933 +0.4%
o/w Fees 210 221 217 -1.4% +2.0% 607 649 +4.4%
Operating costs -383 -388 -376 -2.0% -3.2% -1,125 -1,146 -1.2%
Gross operating profit 674 686 663 -1.5% +0.3% 2,042 2,038 -0.8%
LLP -151 -81 -161 n.m +6.3% -477 -427 -13.6%
Net operating profit 522 605 503 -15.2% -1.4% 1,565 1,611 +3.1%
Net profit 437 495 413 -14.6% -0.7% 1,211 1,239 +4.2%
RoAC 14.6% 17.4% 14.7% -2.6pp +0.2pp 13.5% 14.4% +0.9pp
C/I 36.2% 36.1% 36.2% +0.1pp -0.1pp 35.5% 36.0% +0.5pp
CoR (bps) 102 53 106 +53bps +5bps 109 94 -15bps
Branches 1,861 1,764 1,723 -2.3% -7.4% 1,861 1,723 -7.4%
FTEs 24,490 24,254 24,134 -0.5% -1.5% 24,490 24,134 -1.5%
Gross NPE ratio 10.3% 9.2% 8.9% -26bps -137bps 10.3% 8.9% -137bps
9M16 9M17∆ % vs
9M16 (1)
∆ % vs.
3Q16 (1)3Q16∆ % vs.
2Q17 (1)2Q17 3Q17Main drivers
(1) Stated numbers at current FX. Variations Q/Q and Y/Y at constant FX (RoAC, C/I, NPEs and CoR variations at current FX).
(2) Calculated as difference between number of clients at beginning and end of period.
CEE – RoAC of 14.4% in 9M17 CoR back to normalised levels at 106bps
• Revenues down 1.7% Q/Q at constant FX
NII higher at 645m in 3Q17 mainly as a result of lower cost of funding
Fees lower by 1.4% Q/Q at constant FX due to seasonality of financing fees, up 2.0% Y/Y at constant FX supported by financing and transactional fees
Dividends from Turkey up 4.0% Q/Q at constant FX
• YTD Number of clients increased by c. 439,000(2)
• Continued cost reduction, expenses lower 2% Q/Q and 3.2% Y/Y at constant FX. C/I ratio at 36.0% in 9M17 below the 2017 target of 38.5%
• CoR back to normalised levels at 106bps (+53bps Q/Q, +5bps Y/Y), after write-backs in 2Q17
• RoAC of 14.4% in 9M17

1 2 3 4 5 6 7 Divisional quarterly highlights
26
Data in m
Total revenues 1,061 1,026 890 -13.2% -16.1% 3,266 3,071 -6.0%
o/w Net interest 553 548 497 -9.2% -10.0% 1,754 1,575 -10.2%
o/w Fees 161 176 143 -18.7% -11.2% 495 463 -6.4%
o/w Trading 366 281 251 -10.9% -31.6% 961 988 +2.8%
Operating costs -436 -412 -397 -3.6% -8.8% -1,300 -1,240 -4.6%
Gross operating profit 626 614 493 -19.7% -21.2% 1,966 1,831 -6.9%
LLP -29 3 -55 n.m. +91.6% -158 -125 -21.0%
Net operating profit 597 617 438 -29.1% -26.7% 1,808 1,706 -5.6%
Net profit 379 400 299 -25.2% -21.2% 1,059 1,050 -0.8%
RoAC 15.1% 17.4% 13.1% -4.3pp -2.0pp 14.5% 15.1% +0.6pp
C/I 41.1% 40.2% 44.6% +4.5pp +3.6pp 39.8% 40.4% +0.6pp
CoR (bps) 11 -1 20 +21bps +9bps 20 15 -5bps
FTEs 3,535 3,447 3,371 -2.2% -4.6% 3,535 3,371 -4.6%
Gross NPE ratio 4.3% 3.5% 3.1% -36bps -117bps 4.3% 3.1% -117bps
9M16 9M17∆ % vs.
9M16
∆ % vs.
3Q163Q16
∆ % vs.
2Q172Q17 3Q17Main drivers
• NII down 9.2% Q/Q due to lower contribution of investment portfolio related to BTP repositioning and positive non-recurring item in 2Q17
• Fees down 18.7% Q/Q due to Capital Markets seasonality and a cautious approach to leveraged finance
• Trading benefitted from a 87m capital gain
• Client driven revenues at 75% of total up from 71% in 2Q17
• Costs decreased 3.6% Q/Q and 8.8% Y/Y. C/I ratio at 40.4% in 9M17 ahead of FY17 target of 44.6%
• CIB's CoR at normalised levels of 20bps
• Normalised(1) RoAC at 13.9% in 9M17
CIB – Normalised RoAC of 13.9% in 9M17. Q3 affected by unfavourable sector-wide environment
(1) Normalised RoAC for a capital gain on disposal in 3Q17 (+84m).

Fineco – Clients increased 7% Y/Y reaching 1.2m, AuM up 2.4% Q/Q 1 2 3 4 5 6 7 Divisional quarterly highlights
27
• Strong revenue generation, up 12.5% Y/Y mainly supported by fees
• TFAs at 65.4bn mainly thanks to AuM (+2.4% Q/Q)
• Operating costs well under control, with C/I ratio down 4.4pp Y/Y to 36.2% confirming the strong focus on efficiency while expanding the business
• Net profit(1) at 16m in 3Q17
• RoAC of 61.3% in 9M17
Data in m
Total revenues 132 141 148 +5.3% +12.5% 420 430 +2.4%
o/w Net interest 62 64 67 +4.8% +7.7% 186 194 +4.6%
o/w Fees 59 65 70 +7.2% +17.6% 177 199 +12.6%
Operating costs -53 -60 -54 -11.4% +0.3% -171 -175 +2.1%
Gross operating profit 78 80 94 +17.9% +20.8% 249 256 +2.6%
LLP -1 -1 -2 +52.5% n.m. -4 -3 -12.8%
Net operating profit 77 79 93 +17.4% +19.9% 246 252 +2.8%
Minorities -29 -34 -30 -11.1% +4.9% -105 -97 -7.0%
Net profit 16 19 16 -11.1% +4.9% 57 53 -7.0%
RoAC 70.8% 70.9% 54.5% -16.5pp -16.3pp 87.3% 61.3% -26.0pp
C/I 40.6% 43.0% 36.2% -6.8pp -4.4pp 40.7% 40.6% -0.1pp
AuM 27,522 30,614 31,339 +2.4% +13.9% 27,522 31,339 +13.9%
AuM/TFA % 47.8% 48.1% 48.0% -0.2pp +0.1pp 47.8% 48.0% +0.1pp
9M16 9M17∆ % vs.
9M16
∆ % vs.
3Q163Q16
∆ % vs.
2Q172Q17 3Q17Main drivers
(1) Consolidated view, i.e. 35% ownership by UniCredit, for net profit only. First three quarters 2016 restated.
(1)

Data in m
Total revenues(1) -191 -176 -207 +17.9% +8.7% -370 -576 +55.6%
Operating costs -122 -121 -110 -8.6% -9.6% -375 -323 -13.8%
Gross operating profit -313 -296 -317 +7.1% +1.6% -745 -899 +20.7%
LLP -11 -1 -18 n.m. +60.6% -17 -21 +21.8%
Profits on investments 0 -168 8 n.m. n.m. 21 -119 n.m.
Profit before taxes -380 -454 -418 -8.0% +9.9% -1,104 -1,152 +4.3%
Income Taxes -71 169 63 -62.4% n.m. 134 347 n.m.
Net profit from
discontinued operations182 -167 2,068 n.m. n.m. 560 2,040 n.m.
Net loss/profit -331 -518 1,709 n.m. n.m. -579 1,110 n.m.
FTEs 17,466 16,158 15,970 -1.2% -8.6% 17,466 15,970 -8.6%
Costs GCC/ Tot. costs 4.1% 4.2% 3.9% -0.3pp -0.2pp 4.2% 3.8% -0.4pp
9M16 9M17∆ % vs.
9M16
∆ % vs.
3Q163Q16
∆ % vs.
2Q172Q17 3Q17
1 2 3 4 5 6 7 Divisional quarterly highlights
28
Main drivers
Group Corporate Centre – Bottom line positively affected by capital gain of Pioneer disposal, adjusted net loss at 352m
• Negative revenues improved by 17.9% Q/Q mainly related to lower dividends and impact of FX
• Costs down 8.6% Q/Q driven by both HR and Non HR, benefitting from further FTEs reduction (-188 Q/Q)
• Lean but steering Corporate Centre transformation on track with a reduction of 1,496 FTEs Y/Y
• Corporate Centre costs/Total costs at 3.9% in 3Q17, down 0.2pp Y/Y. Expected to increase in 4Q17
• Systemic charges up 63m Q/Q mainly due to Voluntary Scheme in Italy
• Adjusted net loss at 352m in 3Q17, excluding the capital gain from Pioneer disposal (2.1bn)

1 2 3 4 5 6 7 Divisional quarterly highlights
29
Data in m
Total revenues -67 -49 -28 -42.2% -57.9% -142 -118 -17.2%
Operating costs -37 -21 -53 n.m. +44.0% -106 -119 +11.9%
Gross operating profit -104 -70 -82 +16.9% -21.4% -248 -236 -4.8%
LLP -545 -255 -138 -45.6% -74.6% -1,289 -594 -53.9%
Net loss -447 -216 -207 -4.4% -53.8% -1,054 -628 -40.4%
Gross customer loans 56,312 33,768 32,488 -3.8% -42.3% 56,312 32,488 -42.3%
o/w NPEs 49,636 29,701 28,822 -3.0% -41.9% 49,636 28,822 -41.9%
o/w Performing 6,676 4,066 3,666 -9.8% -45.1% 6,676 3,666 -45.1%
NPE coverage ratio, % 53.5% 57.0% 57.1% +7bps +358bps 53.5% 57.1% +358bps
Net NPEs 23,066 12,759 12,362 -3.1% -46.4% 23,066 12,362 -46.4%
RWA 26,251 22,742 21,712 -4.5% -17.3% 26,251 21,712 -17.3%
2Q17 3Q173Q16 9M16 9M17∆ % vs.
9M16
∆ % vs.
2Q17
∆ % vs.
3Q16Main drivers(1)
• Negative revenues lower by 42.2% Q/Q primarily due to lower servicing fees
• Higher operating costs due to lower recoveries of legal expenses from clients. Expected to reverse in 4Q17
• LLPs at 138m in 3Q17, decreasing 116m Q/Q with solid coverage ratio at 57.1%
• All costs and charges pertaining to the FINO transaction have been accounted for, including a one-off charge of 80m booked in Non Core in 3Q17
• Net loss at 207m, reduced by 53.8% Y/Y
• Net NPEs continued to reduce by 3.1% Q/Q to 12.4bn. FY17 guidance of 11.4bn confirmed
Non Core – Net loss reduced mainly thanks to lower LLPs Continued de-risking of Non Core with Net NPEs down 3.1% Q/Q to 12.4bn
(1) Starting from 31 December 2016 the credit exposures belonging to the so-called “FINO Portfolio” were recognised in the item “Non-current assets and disposal groups classified as held for sale”. Following the “FINO portfolio” disposal occurred in July 2017 and the application of the IAS 39 principle, the credit exposures related to such a portfolio have been derecognised for accounting purposes from the balance sheet assets.

30
Group quarterly highlights
Divisional quarterly highlights
Capital
Annex
1
3
4
6
7
Executive summary
Asset quality 5
2 Transform 2019 update

31
Group excluding Non Core – Further reduction in gross and net NPEs with coverage ratio up to 55.7% Non performing exposures(1), bn
-3.6%
-10.9%
3Q17
22.5
10.0
2Q17
23.3
10.4
3Q16
25.2
12.7
Coverage ratio
Gross NPE ratio
Net NPEs
o.w. Gross bad loans, bn
o.w. Gross unlikely to pay, bn
-5.9%
-5.9%
3Q17
10.0
5.7
2Q17
10.7
6.2
3Q16
10.7
7.0
Coverage ratio
Net UTP
-3%
-13.9%
3Q17
11.2
3.4
2Q17
11.5
3.5
3Q16
13.0
4.7
Coverage ratio
Net bad loans
1 2 3 4 5 6 7 Asset quality
Net NPE ratio
(1) Gross NPEs including gross bad loans, gross unlikely-to-pay and gross past due. Gross past due at 1.2bn in 3Q17 (+8.5% Q/Q and -20.2% Y/Y).
55.4%
5.2%
2.4%
69.8%
42.0%
69.5%
42.8%
5.8%
3.0%
49.6%
64.0%
34.8%
5.0%
2.3%
55.7%

32
Flow from UTP to Bad loan
Write-offs
Recovery(2) 12.3% Cure rate
4.3%
Net flows
1.3% Default rate 1.8%
Migration rate
14.6% 16.7%
438400490
473477
224
656697 740
3Q17 2Q17 3Q16
-764-432Outflows to
performing
Inflows to NPE
3Q17
700
1,132
2Q17
616
1,379
3Q16
1,503
-279
1,782
Group excl. Non Core – Loan evolution driver, m Group excl. Non Core – net flows to NPE(1), m
1.1%
7.0%
16.0%
Group excl. Non Core – Default rate improved further to 1.1%, confirming UniCredit's strict risk discipline
(1) Managerial figures. Default rate: Net inflow to NPEs for UniCredit SpA + Gross inflow to NPEs for Factoring/Leasing on performing previous year.
(2) 2Q17 recovery restated to 740m, for a homogenous definition of recoveries in 2Q17 (now excluding disposals) and 3Q17.
1 2 3 4 5 6 7 Asset quality

33
+1.3%
+5.6%
2Q17
9.6
4.6
9.5
4.5
9.1
5.1
3Q17 3Q16
Coverage ratio
Gross NPE ratio
Net NPEs
o.w. Gross unlikely to pay, bn
+6.9%
2Q17
4.3
2.6
3Q17
4.3
2.6
4.1
2.7
3Q16
Coverage ratio
Net UTP
+2.0%
+12.9%
3Q17
4.6
1.6
2Q17
4.6
1.5
4.1
1.6
3Q16
Coverage ratio
Net bad loans
1 2 3 4 5 6 7 Asset quality
Net NPE ratio
Non performing exposures(1), bn o.w. Gross bad loans, bn
CBK Italy – Stable gross NPEs at 9.6bn, with coverage ratio at 52%
(1) Gross NPEs including gross bad loans, gross unlikely-to-pay and gross past due. Gross past due at 655m in 3Q17 (+6.7% Q/Q and -31.4% Y/Y).
67.0%
40.1%
44.1% 52.3% 52.0%
3.7% 3.3% 3.4%
6.4% 6.6% 6.7%
65.8%
32.2% 40.6%
60.4%

34
CBK Italy – Loan evolution driver, m
Flow from UTP to Bad loan
Write-offs
7.3% 12.2% Cure rate
4.3%
Net flows
1.9% 2.0% Default rate 2.6%
-293
825672 643
-175
2Q17
Inflows to NPEs
Outflows to performing
3Q17
467 378
3Q16
-86
739
Migration rate
21.5% 23.6% 27.8%
239263268
146
335
41
192227248
3Q17 2Q17 3Q16
CBK Italy – Lower inflows to NPEs and improved migration rate confirming positive asset quality trend
1 2 3 4 5 6 7 Asset quality
(1) Managerial figures. Default rate: Net inflow to NPEs for UniCredit SpA + Gross inflow to NPEs for Factoring/Leasing on performing previous year.
(2) 2Q17 recovery restated to 227m, for a homogenous definition of recoveries in 2Q17 and 3Q17.
Recovery(2)
CBK Italy – Net flows to NPE(1), m

35
Gross loans, bn
1 2 3 4 5 6 7 Asset quality
Actions of Non Core run down(1)
Write-offs
Recoveries
Disposals
FINO FINO Phase 1 successfully closed in July, Phase 2 portfolio expected to be sold down below 20% by year end
0.2bn in 3Q17, 1.2bn in 9M17
0.3bn in 3Q17
0.5bn in 3Q17
Non Core – FINO Phase 1 successfully closed in July, Phase 2 progressing well Gross loans further reduced by 1.3bn Q/Q
Back to Core 0.3bn in 3Q17
6.7
-1.3bn
-23.8bn
Perfoming
NPEs
3Q17
32.5
3.7
2Q17
33.8
4.1
3Q16
56.3
49.6
29.7 28.8
Repayments c. 0.1bn in 3Q17
(1) Starting from 31 December 2016 the credit exposures belonging to the so-called “FINO Portfolio” were recognised in the item “Non-current assets and disposal groups classified as held for sale”. Following the “FINO portfolio” disposal occurred in July 2017 and the application of the IAS 39 principle, the credit exposures related to such a portfolio have been derecognised for accounting purposes from the balance sheet assets. Managerial figures.

5.7
10.4
-5.8%
-13.0%
3Q17 2Q17 3Q16
6.1
11.1 12.0
8.0
36
29.7 28.8
12.4
2Q17
-3.0%
-41.9%
3Q17
12.8
3Q16
49.6
23.1 Net NPEs
o.w. Gross unlikely to pay, bn
Coverage ratio
Net UTP
3Q16 2Q17
18.4
6.6
3Q17
18.2
6.5
-1.4%
-51.0%
37.1
14.6
Coverage ratio
Net bad loans
1 2 3 4 5 6 7 Asset quality
(1) Starting from 31 December 2016 the credit exposures belonging to the so-called “FINO Portfolio” were recognised in the item “Non-current assets and disposal groups classified as held for sale”. Following the “FINO portfolio” disposal occurred in July 2017 and the application of the IAS 39 principle, the credit exposures related to such a portfolio have been derecognised for accounting purposes from the balance sheet assets. Gross NPEs including gross bad loans, gross unlikely-to-pay and gross past due. Gross past due at 204m in 3Q17 (+7.0% Q/Q and -63.6% Y/Y).
Coverage ratio
Gross NPE ratio
Net NPE ratio
Non performing exposures(1), bn o.w. Gross bad loans, bn
Non Core – Net NPEs down, on track to reach FY17 11.4bn target
76.7%
57.0%
88.0%
64.4%
45.2%
88.1% 88.7%
78.2% 78.0%
53.5% 57.1%
60.5% 64.2%
33.3% 45.1%

37
Group quarterly highlights
Divisional quarterly highlights
Asset quality
Annex
1
3
4
5
7
Executive summary
Capital 6
2 Transform 2019 update

3Q17
+22bps
Other
-5bps
RWA dynamics exc. Pioneer
disposal
-4bps
AFS, FX, DBO reserves
+8bps
20% dividends accrual & coupons(1)
-4bps
Net profit 3Q17
Pioneer disposal
13.81 +84bps
2Q17
12.80
38
Fully loaded Common Equity Tier 1 ratio, %
AFS: -1bps FX: -3bps DBO: flat
• Fully loaded CET1 ratio up 101bps mainly thanks to Pioneer disposal in July (+84bps) and earnings generation net of dividends accrual and coupons (+17bps)
• Dividend accrual for FY17 based on 20% payout on normalised earnings, excluding the net impact from Pioneer and Pekao disposals
• Expected negative CET1 ratio impact of model changes and procyclicality in 4Q17 of 30 to 40bps and of IFRS9 first time adoption on 1 January 2018 of 38 to 42bps
1 2 3 4 5 6 7 Capital
Group – Fully loaded CET1 ratio at a high 13.81% thanks to Pioneer disposal and earnings generation
+2.1bn Capital gain (+58bps) +0.9bn Goodwill (+24bps) -0.6bn RWA (+2bps)
+0.8bn excl. Pioneer
(1) Coupons on AT1 instruments paid in 3Q17 equal to 34m before tax.

2Q17 352.7
-2.0bn
3Q17
-0.6
Market & op. risk +0.2
Other credit -1.9
FX effect -1.4
Business actions -0.5
Regulation, Procyclicality & models
+3.4
Business evolution -1.8
2Q17 adj 352.1
Pioneer disposal
350.0
Credit Market & operational
Main drivers of RWA transitional(1), bn
• FX: -1.4bn, mainly due to currency depreciation of Turkish Lira and USD
• Business evolution: -1.8bn, mainly thanks to change in risk density distribution
• Regulation, procyclicality & models: +3.4bn, new models introduction impacting all divisions
• Business actions: -0.5bn related to disposals and guarantees
• Other credit risk: -1.9bn mostly related to disposals and consolidation effects due to the sale of Pioneer
1 2 3 4 5 6 7 Capital
Group – RWA down 2.6bn Q/Q mainly due to lower credit risks
Credit RWA -2.2bn Q/Q (excl. Pioneer disposal)
• Market risk: -0.7bn Q/Q thanks also to change in FX risk calculation
Market RWA -0.7bn Q/Q (excl. Pioneer disposal)
Operational risk RWA +0.9bn(2) Q/Q (excl. Pioneer disposal)
(1) Business evolution: changes related to loan evolution; Regulation: changes (eg. CRR or CRD) determining variations of RWA; Procyclicality: change in macroeconomy or client's credit worthiness; Models: methodological changes to existing or new models; Business actions: initiatives to decrease RWA (e.g. securitisations, changes in collaterals); FX effect: impact from other exposures in foreign currencies.
(2) Pioneer disposal reduces diversification effect.
39
o.w -0.4bn Credit RWA

+3.7pp
+0.9pp
2Q17
18.19%
3Q17
17.25%
3Q16
14.50%
2Q17
+3.5pp
+1.0pp
15.32% 14.31%
11.81%
3Q17 3Q16
+2.9pp
+1.0pp
2Q17
13.94%
3Q17
12.93%
11.00%
3Q16
40
CET1 transitional(1) Tier 1 transitional(1) Total capital transitional(1)
2016 Basel 3 phase-in 60%
2017 Basel 3 phase-in 80%
2016 Basel 3 phase-in 60%
2017 Basel 3 phase-in 80%
2016 Basel 3 phase-in 60%
2017 Basel 3 phase-in 80%
57bn 61bn 64bn
1 2 3 4 5 6 7 Capital
46bn 50bn 54bn 43bn 46bn 49bn
(1) As an exception phase-in of net liability related to Defined Benefit Obligation at 40% in 2016 and 60% in 2017.
Absolute amount for CET1 transitional, Tier1 capital transitional and total capital transitional.
Group – Transitional capital ratios well above MDA levels
8.78% MDA 3Q17
10.28% MDA 3Q17
12.28% MDA 3Q17
xxbn

Group – Leverage ratio fully loaded at 5.42%, strongly up Q/Q and Y/Y
• Leverage ratio fully loaded at 5.42% in 3Q17 (+33bps Q/Q and +93bps Y/Y) mainly thanks to Pioneer disposal
• Leverage ratio transitional at 5.60% in 3Q17 (+33bps Q/Q and +90bps Y/Y) in line with fully loaded evolution
1 2 3 4 5 6 7
41
Capital
(1) As an exception phase-in of net liability related to Defined Benefit Obligation at 40% in 2016 and 60% in 2017.
Basel 3 leverage ratio fully loaded(1)
+93bps
+33bps
3Q17 2Q17 3Q16
5.42% 5.09%
4.49%
+90bps
+33bps
3Q17 2Q17
5.26%
3Q16
4.70% 5.60%
Basel 3 leverage ratio transitional(1)
2016 Basel 3 phase-in 60%
2017 Basel 3 phase-in 80%
42
Concluding remarks – Transform 2019 delivering tangible results Concluding remarks 1 2 3 4 5 6 7
(1) Adjusted RoTE excluding the net impact from the Pekao (-310m FX reserve 2Q17) and Pioneer (+2.1bn 3Q17) disposals and a one-off charge booked in Non Core (-80m in 3Q17) related to FINO. All costs and charges pertaining to the FINO transaction have been accounted for, including a one-off charge of 80m booked in Non Core in 3Q17 as included in the disclosure on 24 October 2017 of 3Q preliminary results. RoTE calculated at CMD perimeter, considering also the capital increase and Pekao & Pioneer disposals as at 1 January 2017.
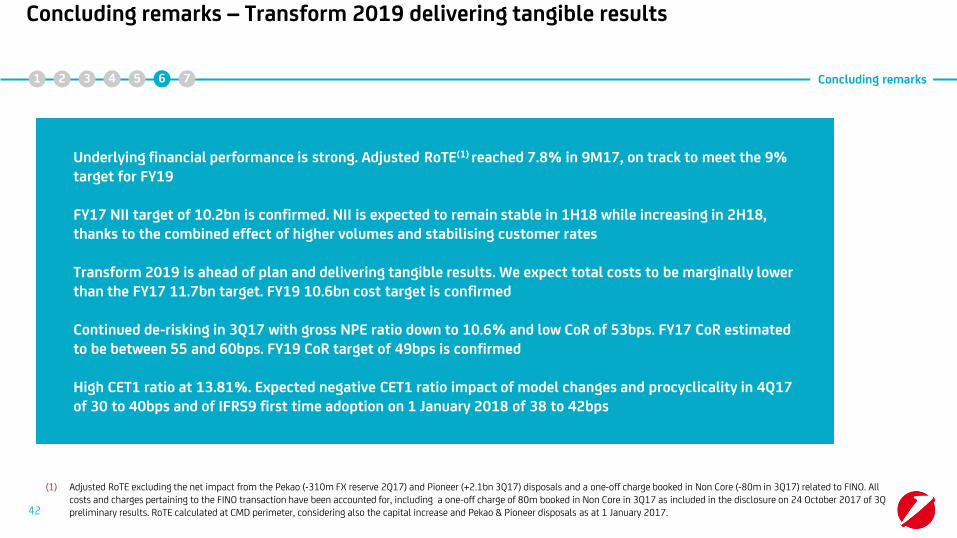
Underlying financial performance is strong. Adjusted RoTE(1) reached 7.8% in 9M17, on track to meet the 9% target for FY19 FY17 NII target of 10.2bn is confirmed. NII is expected to remain stable in 1H18 while increasing in 2H18, thanks to the combined effect of higher volumes and stabilising customer rates Transform 2019 is ahead of plan and delivering tangible results. We expect total costs to be marginally lower than the FY17 11.7bn target. FY19 10.6bn cost target is confirmed Continued de-risking in 3Q17 with gross NPE ratio down to 10.6% and low CoR of 53bps. FY17 CoR estimated to be between 55 and 60bps. FY19 CoR target of 49bps is confirmed High CET1 ratio at 13.81%. Expected negative CET1 ratio impact of model changes and procyclicality in 4Q17 of 30 to 40bps and of IFRS9 first time adoption on 1 January 2018 of 38 to 42bps

43
Group quarterly highlights
Divisional quarterly highlights
Asset quality
1
3
4
5
Executive summary
Annex 7
2 Transform 2019 update
Capital 6

44
Group – 2016 and 2017 non recurring items
2016
Net profit, m
1Q
2Q
One-off trading gain
LLP release
Restructuring costs
DBO Austria
DTA fee
Visa Europe gain
2Q
Pekao Disposal
Atlante 1 impairment
Release of tax provision
2017
Division
All divisions
CBK Austria
Group CC
All divisions
Non Core
Non recurring items(1)
CBK Germany
Group CC -310
-135
+170
-207
-32
+96
+100
+216
-88
Restructuring costs All divisions -55
3Q
Pioneer disposal +2.1bn Group CC
One-off charge in Non Core -80 Non Core
1 2 3 4 5 6 7 Annex - KPIs
Capital gain
Real Estate disposals(2)
Capital gain
CBK Germany
CBK Austria
CIB
+38
+65
+84
(1) No non recurring items in 3Q16 and 1Q17. (2) o/w 51m net profit from discontinued operations and 14m in NII.
Tax effects CBK Austria +17

14.8 n.a. 20.4
57.9% n.a. <52%
54bp 55 to 60bps 49bp
51.3 n.a. 44.3
22.3 n.a. 20.2
56.5% >54% >54%
44.0% >38% >38%
66.2% >65% >63%
4.67 2.6 4.7
350.0 389.4 404.0
7.8% n.a. >9%
13.81% 12.00% >12.50%
421.1 440.8 466.9
398.6 441.1 400.9
Group (bn)
45
1 2 3 4 5 6 7 Annex - KPIs
Revenues
Cost/income, %
Net NPE stock
NPE coverage
Cost of Risk(2)
Gross NPE stock
UTP coverage
Bad loans cov.
Loan volumes(4)
Net Income
RWA
Adj. RoTE(3)
FL CET1 ratio
Deposit volumes(4)
Risk Management & Capital Governance (bn)
2019(1) 2017(1)
Group – Monitoring KPIs
2019(1) 9M17 2017(1) 9M17
(1) 2017 and 2019 figures equal to CMD perimeter.
(2) FY17 CoR target estimated to be between 55 and 60bps as communicated with 3Q17 results.
(3) Adjusted RoTE excluding the net impact from the Pekao (-310m FX reserve 2Q17) and Pioneer (+2.1bn 3Q17) disposals and a one-off charge booked in Non Core (-80m in 3Q17) related to FINO. All costs and charges pertaining to the FINO transaction have been accounted for, including a one-off charge of 80m booked in Non Core in 3Q17 as included in the disclosure on 24 October 2017 of 3Q preliminary results. RoTE calculated at CMD perimeter, considering also the capital increase and Pekao & Pioneer disposals as at 1 January 2017.
(4) Excluding repos.

2,091 2,461 2,441
-1,391 -1,886 -1,698
66.5% 76.6% 69.6%
+9bps +15bps +15bps
81,499 85,634 90,794
34,974 35,674 36,871
14.5% 4.2% 7.1%
2.2% n.a. 3.1%
10,296 10,437 9,170
341 341
5,542 7,378 7,613
-3,347 -4,504 -3,972
60.4% 61.0% 52.2%
+66bps +67bps +53bps
137,146 144,535 154,322
81,496 87,845 90,687
11.7% 11.5% 15.7%
6.7% n.a. 5.2%
33,531 33,030 29,018
2,995 2,400
1,153 2,461 1,636
-816 -1,886 -1,015
70.8% 76.6% 62.1%
-19bps +15bps +23bps
44,547 85,634 49,117
21,581 35,674 24,446
21.2% 4.2% 13.3%
4.4% 5.0%
5,199 4,730
134 124
2019(1) 9M17 2017(1)
46
2019(1) 9M17 2017(1) 2019(1) 9M17 2017(1)
CBK Italy CBK Germany CBK Austria
1 2 3 4 5 6 7 Annex - KPIs
Revenues, m
Costs, m
Loans(2), m
RWA, m
Cost/income
Cost of Risk
RoAC
NPE ratio
(1) 2017 and 2019 figures equal to CMD presentation. (2) Excluding Intercompany and repos.
Divisional monitoring KPIs for CBK Italy, Germany, Austria

3,183 4,106 4,443
-1,146 -1,579 -1,647
36.0% 38.5% 37.1%
+94bps +133bps +110bps
59,791 62,435 69,377
86,700 100,519 108,390
14.4% 10.5% 12.3%
8.9% n.a. 8.0%
24,134 24,516 24,126
1,793
3,071 3,865 3,796
-1,240 -1,723 -1,571
40.4% 44.6% 41.4%
+15bps +24bps +19bps
78,356 82,291 89,221
71,470 85,199 88,277
15.1% 11.1% 11.0%
3.1% n.a. 4.3%
3,371 3,714 3,535
47
CEE CIB
1 2 3 4 5 6 7 Annex - KPIs
2019(1) 9M17 2017(1) 2019(1) 9M17 2017(1)
Divisional monitoring KPIs for CIB, CEE
Revenues, m
Costs, m
Loans(2), m
RWA, m
Cost/income
Cost of Risk
RoAC
NPE ratio
(1) 2017 and 2019 figures equal to CMD presentation. (2) Excluding Intercompany and repos
.

142.9 159.6
9.6 8.3
4.6 n.a.
52.0% >52%
40.6% >38%
4.6 4.1
65.8% >68%
8.3% n.a
32.5 19.2
28.8 19.2
12.4 8.1
57.1% >57%
45.1% >38%
18.2 15.0
64.2% >63%
4.5% 5.0%
2019(2) 9M17
Gross NPE, bn
Net NPE, bn
NPE cov. ratio
UTP cov. ratio
Gross bad loans, bn
Bad loans cov. ratio
Gross loans, bn
1 2 3 4 5 6 7 Annex - KPIs
48
Divisional monitoring AQ KPIs for CBK Italy and Non Core
2019(2) 9M17
CBK Italy Non Core(1)
Recovery rate ratio(3)
(1) Starting from 31 December 2016 the credit exposures belonging to the so-called “FINO Portfolio” were recognised in the item “Non-current assets and disposal groups classified as held for sale”. Following the “FINO portfolio” disposal occurred in July 2017 and the application of the IAS 39 principle, the credit exposures related to such a portfolio have been derecognised for accounting purposes from the balance sheet assets.
(2) 2019 figures equal to CMD presentation. (3) Managerial ratio annualised calculated on bad loans, UTP and past due non performing exposure.

-3.8%
3Q17 stated
2,500
Other
+28
Invest. ptf &
markets/treasury
-135
TLTRO benefit
+59
Term funding
+106
Deposits rate
+66
Loans rate
-162
Deposits volume
-7
Loans volume
-53
3Q16 Baseline
2,599
FX effect
+8
3Q16 stated
2,591
Net interest(1) bridge Y/Y, m
49
(-7bps Y/Y)
1 2 3 4 5 6 7 Annex – P&L
(1) Contribution from macro hedging strategy on non naturally hedged sight deposits in 3Q17 at 381m, +1.2m Q/Q and -10.3m Y/Y.
Group – Lower NII Y/Y because of lower customer rates and reduced investment portfolio contribution, partially compensated by lower cost of funding
-0.33%
Average Euribor 3M
Commercial dynamics: c.+8m

-68 0 -68 0
-6 0 -6 0
5 0 0 5
-12 0 -10 -2
-3 0 -2 -1
-20 0 -20 0
-45 0 -45 0
0 0 0 0
-149 -1 -151 2
CBK Italy
CBK Germany
CBK Austria
CIB
Fineco
CEE
Non Core
Group
o/w bank levies 3Q17, m
1 2 3 4 5 6 7 Annex – P&L
o/w DGS o/w SRF Systemic charges
Group CC
Systemic charges – Breakdown by division
50

51
LLP breakdown 3Q17, m
210
Non Core 138
Group CC 18
Fineco 2
CIB 55
CEE 161
CBK Austria 14
CBK Germany 0
CBK Italy
Group 598
CoR breakdown 3Q17, bps
341
61
Group 53
Non Core
Group CC n.m.
Fineco 38
CIB 20
CEE 106
CBK Austria 12
CBK Germany 0
CBK Italy
1 2 3 4 5 6 7 Annex – P&L
LLPs and CoR by division
Q/Q Y/Y Q/Q Y/Y
-7.7%
-98.9%
n.m.
+98.9%
n.m.
+52.5%
n.m.
-45.6%
+6.0%
-12.7%
-98.3%
n.m.
+6.2%
+91.6%
n.m.
+60.6%
-74.6%
-38.8%
-5bps
-16bps
+38bps
+53bps
+21bps
+8bps
n.m.
-239bps
+3bps
-9bps
-10bps
+29bps
+5bps
+9bps
+7bps
n.m.
-383bps
-32bps

52
Branches(2) breakdown 3Q17
Total 4,975
CEE 1,723
Retail Austria 127
Retail Germany 341
Retail Italy 2,784
Group 94,066
Non Core 496
Group CC 15,970
Fineco 1,069
CIB 3,371
CEE 24,134
CBK Austria 5,199
CBK Germany 10,296
CBK Italy 33,531
1 2 3 4 5 6 7 Annex – Staff & branches
(1) Excluding FTEs related to industrial legal entities fully consolidated (149 in 3Q17). FTE in units.
(2) Branch figures consistent with CMD perimeter. Branches in units.
FTEs and branches by division
Q/Q Y/Y FTE(1) breakdown 3Q17
-739
-51
-47
-120
-76
+2
-188
-5
- 1,223
- 2,027
-734
-336
-356
-164
+36
- 1,496
-42
- 5,117
Q/Q Y/Y
-90
0
-3
-41
-134
-356
-1
-20
-138
-515
-739
3Q17
33,531
2Q17
34,270
3Q16
35,559
53
Costs,m
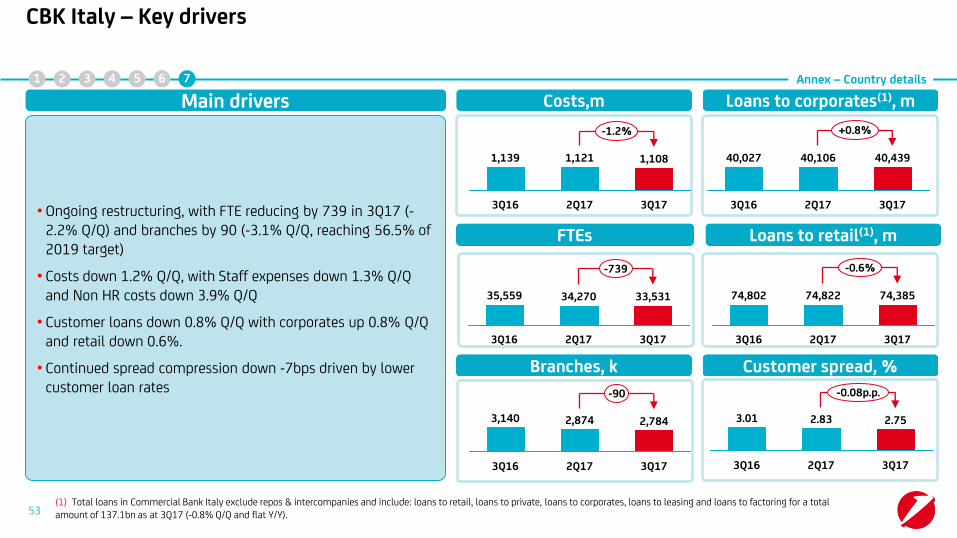
• Ongoing restructuring, with FTE reducing by 739 in 3Q17 (-2.2% Q/Q) and branches by 90 (-3.1% Q/Q, reaching 56.5% of 2019 target)
• Costs down 1.2% Q/Q, with Staff expenses down 1.3% Q/Q and Non HR costs down 3.9% Q/Q
• Customer loans down 0.8% Q/Q with corporates up 0.8% Q/Q and retail down 0.6%.
• Continued spread compression down -7bps driven by lower customer loan rates
Main drivers Loans to corporates(1), m
1 2 3 4 5 6 7 Annex – Country details
CBK Italy – Key drivers
-1.2%
3Q17
1,108
2Q17
1,121
3Q16
1,139
-90
3Q17
2,784
2Q17
2,874
3Q16
3,140
-0.6%
3Q17
74,385
2Q17
74,822
3Q16
74,802
+0.8%
3Q17
40,439
2Q17
40,106
3Q16
40,027
Loans to retail(1), m
-0.08p.p.
3Q17
2.75
2Q17
2.83
3Q16
3.01
FTEs
Customer spread, % Branches, k
(1) Total loans in Commercial Bank Italy exclude repos & intercompanies and include: loans to retail, loans to private, loans to corporates, loans to leasing and loans to factoring for a total amount of 137.1bn as at 3Q17 (-0.8% Q/Q and flat Y/Y).

54
Revenues(1) in CEE, 3Q17
Loans/Depos
3Q17
• EU related countries representing the major component
• RoAC of 14.4% in 9M17. While some pressure on customer spreads, higher margin business in CEE confirmed
• Loan/deposit ratio in CEE, with Russia confirming a sound liquidity position
Main drivers
Customer
spreads(2), 3Q17
EU related
3.30%
Turkey
2.76%
Russia
4.47%
1 2 3 4 5 6 7 Annex – Country details
CEE – Key drivers
22.3%
15.5% 62.1% Turkey
Russia
EU related
EU related Russia
84%
127% 102%
Turkey
74%
107% 129% 2Q17
3Q17
(1) Managerial view. Turkey on a proportional basis.
(2) Customer spreads defined the difference between Rate on customer loans and Rate on customer deposits.
Group 2.50%
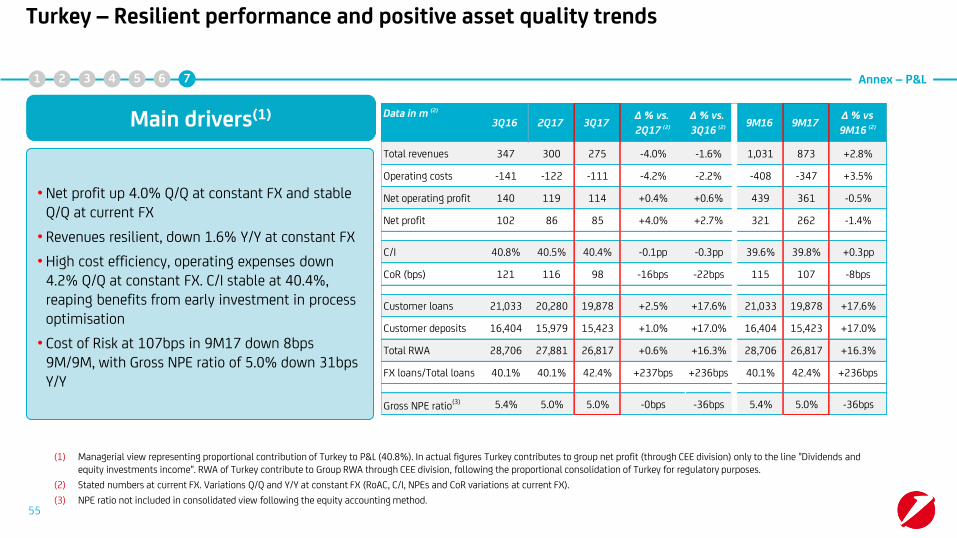
• Net profit up 4.0% Q/Q at constant FX and stable Q/Q at current FX
• Revenues resilient, down 1.6% Y/Y at constant FX
• High cost efficiency, operating expenses down 4.2% Q/Q at constant FX. C/I stable at 40.4%, reaping benefits from early investment in process optimisation
• Cost of Risk at 107bps in 9M17 down 8bps 9M/9M, with Gross NPE ratio of 5.0% down 31bps Y/Y
Main drivers(1)
(1) Managerial view representing proportional contribution of Turkey to P&L (40.8%). In actual figures Turkey contributes to group net profit (through CEE division) only to the line "Dividends and equity investments income". RWA of Turkey contribute to Group RWA through CEE division, following the proportional consolidation of Turkey for regulatory purposes.
(2) Stated numbers at current FX. Variations Q/Q and Y/Y at constant FX (RoAC, C/I, NPEs and CoR variations at current FX).
(3) NPE ratio not included in consolidated view following the equity accounting method.
55
1 2 3 4 5 6 7 Annex – P&L
Turkey – Resilient performance and positive asset quality trends
Data in m (2)
Total revenues 347 300 275 -4.0% -1.6% 1,031 873 +2.8%
Operating costs -141 -122 -111 -4.2% -2.2% -408 -347 +3.5%
Net operating profit 140 119 114 +0.4% +0.6% 439 361 -0.5%
Net profit 102 86 85 +4.0% +2.7% 321 262 -1.4%
C/I 40.8% 40.5% 40.4% -0.1pp -0.3pp 39.6% 39.8% +0.3pp
CoR (bps) 121 116 98 -16bps -22bps 115 107 -8bps
Customer loans 21,033 20,280 19,878 +2.5% +17.6% 21,033 19,878 +17.6%
Customer deposits 16,404 15,979 15,423 +1.0% +17.0% 16,404 15,423 +17.0%
Total RWA 28,706 27,881 26,817 +0.6% +16.3% 28,706 26,817 +16.3%
FX loans/Total loans 40.1% 40.1% 42.4% +237bps +236bps 40.1% 42.4% +236bps
Gross NPE ratio(3) 5.4% 5.0% 5.0% -0bps -36bps 5.4% 5.0% -36bps
2Q17∆ % vs.
2Q17 (2)3Q173Q16 9M16 9M17∆ % vs
9M16 (2)
∆ % vs.
3Q16 (2)

Russia – Continued strong performance in a competitive environment
• NII up 13.5% Q/Q. Still high liquidity in the market, but pressure on margins easing and loan volumes up
• Fee up 8.2% Y/Y
• High cost efficiency with C/I of 32.2% in 9M17
• Solid performance with net profit up 29.2% Y/Y, primarily due to positive development of CoR (141bps in 9M17 vs. 196bps in 9M16)
Main drivers
56
1 2 3 4 5 6 7 Annex – P&L
Data in m (1)
Total revenues 182 193 191 +8.9% +0.8% 526 593 -3.9%
o/w Net interest 161 144 148 +13.5% -11.4% 436 466 -9.0%
o/w Fees 23 28 26 +1.2% +8.2% 59 80 +14.3%
Operating costs -57 -66 -61 +2.9% +4.1% -158 -191 +2.7%
Gross operating profit 126 127 129 +12.0% -0.7% 368 402 -6.7%
LLP -55 -36 -42 +26.6% -28.1% -156 -106 -42.2%
Net operating profit 70 91 87 +6.2% +21.2% 212 296 +19.4%
Net profit 50 69 66 +7.0% +29.2% 157 227 +23.2%
RoAC 11.5% 15.7% 16.4% +0.7pp +4.9pp 11.7% 17.6% +6.0pp
C/I 31.2% 34.1% 32.3% -1.9pp +1.1pp 30.1% 32.2% +2.1pp
CoR (bps) 211 145 176 +32bps -34bps 196 141 -55bps
FTEs 4,183 4,083 4,137 +1.3% -1.1% 4,183 4,137 -1.1%
Gross NPE ratio 8.0% 8.5% 8.6% +16bp +60bp 8.0% 8.6% +60bp
2Q173Q16∆ %
9M16 (1)3Q17∆ % vs.
2Q17 (1)
∆ % vs.
3Q16 (1) 9M16 9M17
(1) Stated numbers at current FX. Variations Q/Q and Y/Y at constant FX (RoAC, C/I, NPEs and CoR variations at current FX).

TFAs – Division breakdown
57
Group
803.8
Fineco
65.4
CIB
88.6
CEE
74.3
CBK Austria
89.5
CBK Germany
143.9
CBK Italy
342.2
3Q17 TFAs(1) divisional breakdown, bn
• Group TFAs amounted to 803.8bn in 3Q17, increasing by 3.4% Y/Y and 1.3% Q/Q:
CBK Italy: TFAs up by 1.4% Q/Q to 342.2bn mainly thanks to strong AuM net sales of 2.5bn in 3Q17, up 184% Y/Y
CBK Germany(2): TFAs up by 3.5% Q/Q, mainly due to net sales in AuC and increase in deposits
CBK Austria: TFAs slightly up to 89.5bn mainly thanks to increase in deposits (+0.7%)
CEE: TFAs increased to 74.3bn (+0.7% Q/Q), mainly from deposits
CIB(2): TFAs down by 2bn (-2.2%), almost entirely driven by deposit outflows
Fineco: TFAs up to 65.4bn mainly thanks to AuM (+2.4% Q/Q)
Main drivers 1 2 3 4 5 6 7 Annex - Balance sheet
(1) Refers to Group Commercial Total Financial Assets. Non-commercial elements, i.e. Group Corporate Centre, Non-Core, Leasing/Factoring and Market Counterparts, are excluded. Numbers are managerial figures.
(2) There was a perimeter shift from CBK Germany to CIB. Previous quarters recasted.

CBK Germany, bn CBK Austria, bn
1 2 3 4 5 6 7
-22.5%
Net NPEs
3Q17
1.8
0.8
2Q17
2.1
1.0
3Q16
2.4
1.3
-12.9%
Coverage ratio
Gross NPE ratio
Net NPE ratio
-7.0%
-16.4%
Net NPEs
3Q17
2.1
0.8
2Q17
2.2
0.9
3Q16
2.5
0.9
Coverage ratio
Gross NPE ratio
Net NPE ratio
Asset quality – CBK Germany and CBK Austria
Gross NPEs Gross
NPEs
2.5%
52.7%
1.2%
57.8%
2.0%
4.6%
Annex - Asset quality
58
45.7%
2.9% 2.2%
1.6% 1.0%
57.6% 63.5%
1.9%
5.0%
60.7%
4.4%
1.8%

2Q17
-9.0%
-22.0%
Net NPEs
3Q17
3.5
1.7
3Q16
3.9
1.8
4.5
2.6
CIB, bn
1 2 3 4 5 6 7 Annex - Asset quality
2Q17 3Q16
-2.7%
-13.0%
Net NPEs
3Q17
5.7
2.2
5.9
2.3
6.6
2.7
Coverage ratio
Gross NPE ratio
Net NPE ratio
Coverage ratio
Gross NPE ratio
Net NPE ratio
Asset quality – CEE and CIB
CEE, bn
59
Gross NPEs
Gross NPEs
9.2%
3.8%
60.6% 53.3%
3.5%
1.7%
10.3% 8.9%
4.6% 3.7%
58.4% 61.4%
4.3% 3.1%
2.5% 1.6%
43.1% 50.6%

32,488
88.7%
56.0%
32.1%
0.6%
57.1%
64.2%
45.1%
64,263
8.9%
3.8%
4.6%
0.5%
61.4%
81.7%
47.5%
112,517
3.1%
1.4%
1.6%
0.1%
50.6%
59.7%
44.1%
47,953
4.4%
2.2%
2.1%
0.1%
60.7%
87.7%
33.5%
82,949
2.2%
1.9%
0.3%
0.0%
57.6%
61.6%
31.2%
481,593
10.6%
6.1%
4.3%
0.3%
56.5%
66.2%
44.0%
Gross Loans
Gross NPE ratio
Bad loans ratio
UTP ratio
Past due ratio
NPE coverage
Bad loans coverage
142,899
6.7%
3.2%
3.0%
0.5%
52.0%
65.8%
40.6%
Gross Loans, m
Group(1), 3Q17 CBK Italy
Gross NPE ratio
Bad loans ratio
UTP ratio
Past due ratio
NPE coverage
UTP coverage
CBK Germany
CBK Austria
CEE CIB Non Core
Bad loans coverage
1 2 3 4 5 6 7 Annex – Asset quality
Asset quality – Across all divisions
60
(1) Starting from 31 December 2016 the credit exposures belonging to the so-called “FINO Portfolio” were recognised in the item “Non-current assets and disposal groups classified as held for sale”. Following the “FINO portfolio” disposal occurred in July 2017 and the application of the IAS 39 principle, the credit exposures related to such a portfolio have been derecognised for accounting purposes from the balance sheet assets. Group asset quality ratios calculated, on a pro forma basis, including the underlying credit positions of the whole FINO portfolio as at 30 September 2017 are the following: gross NPE ratio of 13.5% (13.9%in 2Q17); net NPE ratio of 5.3% (5.5% in 2Q17); NPE coverage ratio of 64.3% (64.0%in 2Q17); gross bad loans ratio of 9.1% (9.3% in 2Q17); net bad loans ratio of 2.6% (2.6% in 2Q17); bad loans coverage ratio of 74.4% (74.4% in 2Q17).

Asset quality – Forborne exposures by region
CEE
ITALY
GERMANY AUSTRIA
GROUP
3.6
1.4 2.2
3Q17
3.4
1.3 2.1
2Q17
3.3
1.4 2.0
3Q16
3Q17
3.7
0.8 2.9
2Q17
4.0
0.8 3.2
3Q16
4.6
1.1 3.6
3Q17
1.0
0.3 0.7
2Q17
1.0
0.3 0.7
3Q16
1.7
0.5
1.3
3Q17
22.5
5.9 16.5
2Q17
23.2
6.4 16.7
3Q16
25.2
7.1
18.1
Performing Exposure
NPEs
14.4
3.6
3Q17 3Q16
14.4
10.3
4.1
2Q17
14.9
10.9
4.0
10.8
Forborne loans(1), bn
34.7% Coverage ratio
28.0%
34.2% 32.0% Coverage ratio
30.2% 33.5% Coverage ratio
33.1%
24.9% 35.2% Coverage ratio
34.3%
33.9% 35.2% Coverage ratio
31.3%
61 (1) Regulatory reporting data.
1 2 3 4 5 6 7 Annex – Asset quality
34.3%
33.5%

Net flows to NPEs, recoveries and write-offs – 3Q17, m Migrations from Unlikely-to-pay to Bad loans – 3Q17, m
CIB
245
-234
480
CEE(2)
861
-473
1,333
CBK Austria
99
-142
240
CBK Germany
115
-174
289
Default rate
Cure rate
0.5% 0.7% 3.3% 0.6%
10.0% 7.7% 11.0% 7.1%
CIB
47
CEE(2)
303
CBK Austria
90
CBK Germany
5
Migration rate 1.8% 11.2% 16.9% 2.7%
UTP to Bad Loans
Recoveries
Write-off
187 355 487
327 148 197
445
248
(1) Managerial figures.
(2) Including Profit Centre Milan.
62
Asset quality – NPE dynamics(1) CBK Germany, CBK Austria, CEE and CIB
Inflow to NPEs
Outflows to performing
Inflows to NPE
1 2 3 4 5 6 7 Annex – Asset quality
Outflow to perfoming

63
-12.8%
-43.9%
3Q17
22.4
2Q17
25.7
3Q16
40.0
Loans – Deposits(1), bn RWA on total assets, % Tangible equity, eop, bn
1 2 3 4 5 6 7 Annex - Balance sheet
Group – Balance sheet
(1) Loans and deposits excluding repos and intercompany.
-0.3p.p.
-2.4p.p.
3Q17
42.3
2Q17
42.6
3Q16
44.7
+7.1%
+17.6%
3Q17 2Q17
47.5
3Q16
43.2
50.8

(1) End of period tangible book value per share; end of period number of shares of 2,216m in 3Q17 and 2Q17 excluding Treasury shares and usufruct shares related to CASHES.
(2) Adjusted earnings for the P&L impact of Pioneer disposal in 3Q17 (+2.1bn) and Pekao disposal in 2Q17 (-310m FX reserve) and the payment of coupons for AT1 net of tax (-36m in 2Q17 and -24m in 3Q17) and CASHES .
64
3Q17
0.33
2Q17
0.55
Tangible book value per share(1) Adj. Earnings(2) per share(1)
3Q17
22.93
2Q17
21.41
1 2 3 4 5 6 7 Annex - EPS
Group – Tangible book value per shares Adjusted earnings(2) per share(1)

Balance sheet assets Sept. 17
827.1
Total exposure
958.5
Regulatory adj. Tier 1 Transitional
-4.0
Regulatory perimeter adj. & other
26.4
Off-balance sheet exposure
110.2
Derivatives
-1.8
SFT(2)
0.6
(1) Tangible equity including AT1 and goodwill related to Pioneer classified under IFRS5 and excluded from Tier 1 capital in the regulatory walk.
(2) SFT: Securities Financing Transactions, i.e. Repos.
Tier 1 and total exposure for Basel 3 leverage ratio transitional, bn
Delta regulatory vs accounting
1 2 3 4 5 6 7 Annex - Balance sheet
65
AVA/DVA & other
deductions
-0.3
Deduction of Securitisation
0.3
Cash flow hedge
-0.3
Minorities computable
as CET 1
-0.3
Tax losses carry
forward
0.6
Filter unreal. gains on AFS
-0.2
Other T1 Grandfathered instrum. incl. in T1 Trans
53.6
Other Deductions
Tier 1 Capital
-0.2 -0.5
Tang. equity Jun-17(1)
51.9
Net profit exc. coupons
2.8
AFS, FX, DBO and other
-0.3
Tang. equity Sep - 17
54.4
Filter on DBO (IAS19)
0.6
Dividend accrual
-0.6
Tier 1
Total exposure
Group – Tier 1 and total exposure transitional
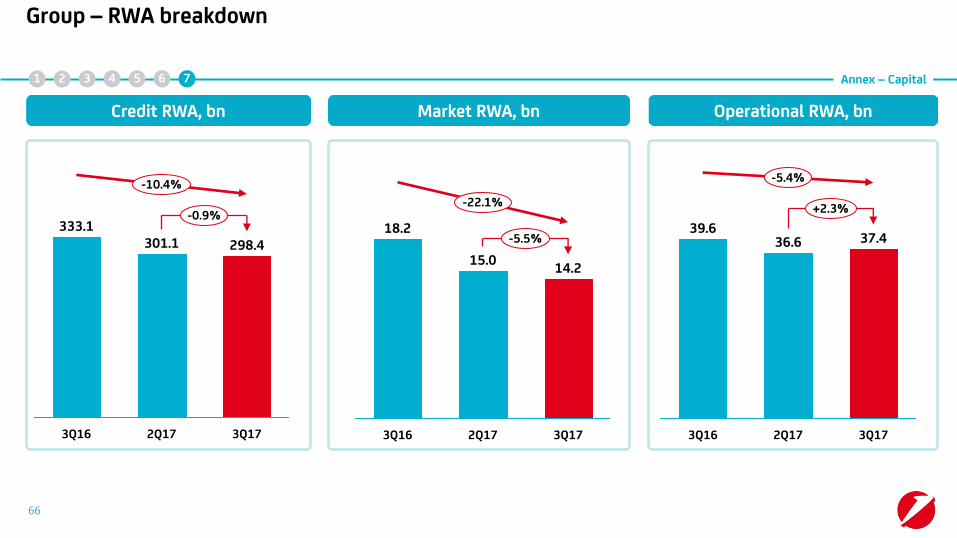
66
Credit RWA, bn Market RWA, bn Operational RWA, bn
1 2 3 4 5 6 7 Annex – Capital
-0.9%
-10.4%
3Q17
298.4
2Q17
301.1
3Q16
333.1 -5.5%
-22.1%
14.2 15.0
18.2
2Q17 3Q17 3Q16
+2.3%
-5.4%
37.4 36.6 39.6
3Q17 2Q17 3Q16
Group – RWA breakdown

(1) Loans and deposits excluding repos.
(2) Adjusted RoTE excluding the net impact from the Pekao (-310m FX reserve 2Q17) and Pioneer (+2.1bn 3Q17) disposals and a one-off charge booked in Non Core (-80m in 3Q17) related to FINO. All costs and charges pertaining to the FINO transaction have been accounted for, including a one-off charge of 80m booked in Non Core in 3Q17 as included in the disclosure on 24 October 2017 of 3Q preliminary results. Adjustments for 2016 according to table on page 44. RoTE calculated at CMD perimeter, considering also the capital increase and Pekao & Pioneer disposals as at 1 January 2017.
67
Group – P&L and volumes
1 2 3 4 5 6 7 Annex - Financials
Data in m (1) 1Q16 2Q16 3Q16 4Q16 1Q17 2Q17 3Q17 ∆ % vs. ∆ % vs. 9M16 9M17 ∆ % vs.
2Q17 3Q16 9M16
Total revenues 4,890 5,464 4,835 4,405 5,055 5,076 4,646 -8.5% -3.9% 15,190 14,776 -2.7%
Operating costs -2,976 -2,982 -2,940 -3,555 -2,886 -2,858 -2,813 -1.6% -4.3% -8,898 -8,557 -3.8%
Gross operating profit 1,914 2,482 1,896 850 2,168 2,218 1,833 -17.4% -3.3% 6,292 6,220 -1.2%
LLPs -760 -884 -977 -9,586 -670 -564 -598 +6.0% -38.8% -2,621 -1,833 -30.1%
Profit before taxes 504 1,039 638 -12,364 1,054 1,338 926 -30.8% +45.2% 2,181 3,318 +52.1%
Net profit from
discontinued 190 184 190 -707 162 -133 2,126 n.m. n.m. 564 2,155 n.m.
Net profit 406 916 447 -13,558 907 945 2,820 n.m. n.m. 1,768 4,672 n.m.
Cost / Income ratio, % 60.9% 54.6% 60.8% 80.7% 57.1% 56.3% 60.5% +4.2pp -0.3pp 58.6% 57.9% -0.7pp
Cost of risk, bps 67 77 85 855 60 50 53 +3bps -32bps 77 54 -22bps
RoTE(2), % 4.8% 4.9% 3.0% n.m. 7.0% 9.5% 6.8% -2.7pp +3.8pp 4.2% 7.8% +3.5pp.
Customer loans 421,077 428,459 426,150 417,868 419,267 420,655 421,064 +0.1% -1.2% 426,150 421,064 -1.2%
Customer deposits 379,626 380,401 386,139 395,979 391,645 394,944 398,632 +0.9% +3.2% 386,139 398,632 +3.2%
Total RWA 394,359 399,260 390,901 387,136 385,262 352,669 350,024 -0.7% -10.5% 390,901 350,024 -10.5%
FTEs (#) 100,139 99,831 99,183 98,304 96,423 95,288 94,066 -1.3% -5.2% 99,183 94,066 -5.2%

(1) Loans and deposits excluding repos and intercompany. 68
Group exc. Non Core – P&L and volumes 1 2 3 4 5 6 7 Annex - Financials
Data in m (1) 1Q16 2Q16 3Q16 4Q16 1Q17 2Q17 3Q17 ∆ % vs. ∆ % vs. 9M16 9M17 ∆ % vs.
2Q17 3Q16 9M16
Total revenues 4,901 5,530 4,902 4,536 5,096 5,124 4,674 -8.8% -4.7% 15,332 14,894 -2.9%
Operating costs -2,929 -2,961 -2,902 -3,501 -2,842 -2,836 -2,759 -2.7% -4.9% -8,792 -8,438 -4.0%
Gross operating profit 1,972 2,569 2,000 1,034 2,253 2,288 1,915 -16.3% -4.2% 6,541 6,456 -1.3%
LLPs -417 -482 -432 -2,027 -470 -310 -460 +48.5% +6.4% -1,332 -1,239 -7.0%
Profit before taxes 935 1,550 1,294 -4,572 1,365 1,672 1,226 -26.7% -5.3% 3,780 4,263 +12.8%
Net profit 697 1,231 894 -5,230 1,113 1,161 3,026 n.m. n.m. 2,822 5,301 +87.8%
Cost / Income ratio, % 59.8% 53.5% 59.2% 77.2% 55.8% 55.4% 59.0% +3.7pp -0.2pp 57.3% 56.7% -0.7pp
Cost of risk, bps 40 45 40 191 44 29 42 +14bps +2bps 42 38 -4bps
RoAC, % 5.8% 10.1% 7.4% n.m. 10.3% 10.9% 29.4% +18.5pp +22.0pp 7.8% 16.7% +8.9pp.-
Customer loans 387,915 397,785 396,655 398,906 401,029 404,264 405,473 +0.3% +2.2% 396,655 405,473 +2.2%
Customer deposits 378,288 379,335 385,056 395,009 390,653 393,908 397,555 +0.9% +3.2% 385,056 397,555 +3.2%
Total RWA 365,256 371,908 364,650 360,940 360,032 329,926 328,312 -0.5% -10.0% 364,650 328,312 -10.0%
FTEs (#) 99,461 99,278 98,646 97,776 95,913 94,788 93,570 -1.3% -5.1% 98,646 93,570 -5.1%

69
Commercial Bank Italy – P&L and volumes
1 2 3 4 5 6 7 Annex - Financials
Data in m (1) 1Q16 2Q16 3Q16 4Q16 1Q17 2Q17 3Q17 ∆ % vs. ∆ % vs. 9M16 9M17 ∆ % vs.
2Q17 3Q16 9M16
Total revenues 1,931 1,990 1,835 1,678 1,856 1,927 1,759 -8.7% -4.1% 5,756 5,542 -3.7%
Operating costs -1,168 -1,152 -1,139 -1,115 -1,118 -1,121 -1,108 -1.2% -2.8% -3,459 -3,347 -3.2%
Gross operating profit 763 838 696 563 738 805 651 -19.1% -6.4% 2,297 2,195 -4.5%
LLPs -228 -243 -240 -1,292 -241 -227 -210 -7.7% -12.7% -711 -678 -4.6%
Profit before taxes 451 427 326 -1,757 445 485 348 -28.2% +6.8% 1,204 1,279 +6.3%
Net profit 309 291 226 -1,429 312 323 246 -24.0% +8.6% 826 881 +6.7%
Cost / Income ratio, % 60.5% 57.9% 62.1% 66.4% 60.2% 58.2% 63.0% +4.8pp +0.9pp 60.1% 60.4% +0.3pp
Cost of risk, bps 68 71 70 380 71 66 61 -5bps -9bps 70 66 -3bps
RoAC, % 11.7% 11.2% 8.3% n.m. 12.6% 12.8% 9.7% -3.1pp +1.4pp 10.4% 11.7% +1.3pp.-
Customer loans 135,620 138,282 136,991 134,906 135,597 138,209 137,146 -0.8% +0.1% 136,991 137,146 +0.1%
Customer deposits 125,440 126,683 128,391 134,495 132,662 134,830 137,745 +2.2% +7.3% 128,391 137,745 +7.3%
Total RWA 79,040 79,488 78,826 79,043 78,747 81,405 81,496 +0.1% +3.4% 78,826 81,496 +3.4%
FTEs (#) 36,294 36,355 35,559 35,222 34,602 34,270 33,531 -2.2% -5.7% 35,559 33,531 -5.7%
(1) Loans and deposits excluding repos and intercompany.

70
Commercial Bank Germany – P&L and volumes 1 2 3 4 5 6 7 Annex - Financials
Data in m (1) 1Q16 2Q16 3Q16 4Q16 1Q17 2Q17 3Q17 ∆ % vs. ∆ % vs. 9M16 9M17 ∆ % vs.
2Q17 3Q16 9M16
Total revenues 653 606 597 616 701 731 660 -9.7% +10.6% 1,856 2,091 +12.7%
Operating costs -480 -480 -474 -469 -475 -462 -454 -1.8% -4.4% -1,435 -1,391 -3.1%
Gross operating profit 173 126 122 147 225 268 206 -23.2% +68.7% 421 700 +66.4%
LLPs 22 7 -21 36 -20 -32 0 -98.9% -98.3% 8 -53 n.m.
Profit before taxes 158 138 106 -214 170 201 202 +0.5% +89.7% 403 572 +41.9%
Net profit 108 93 68 -149 112 238 156 -34.6% n.m. 269 506 +88.1%
Cost / Income ratio, % 73.5% 79.3% 79.5% 76.1% 67.8% 63.3% 68.8% +5.5pp -10.8pp 77.3% 66.5% -10.8pp
Cost of risk, bps -11 -3 10 -18 10 16 0 -16bps -10bps -1 9 +10bps
RoAC, % 8.2% 6.9% 4.7% n.m. 9.2% 20.8% 13.4% -7.3pp +8.7pp 6.6% 14.5% +7.9pp.-
Customer loans 78,744 79,818 80,060 80,519 81,732 82,412 81,499 -1.1% +1.8% 80,060 81,499 +1.8%
Customer deposits 81,462 85,079 86,834 86,043 83,244 83,822 86,304 +3.0% -0.6% 86,834 86,304 -0.6%
Total RWA 34,322 34,931 34,603 35,970 35,728 34,686 34,974 +0.8% +1.1% 34,603 34,974 +1.1%
FTEs (#) 11,165 10,991 11,030 10,910 10,770 10,346 10,296 -0.5% -6.7% 11,030 10,296 -6.7%
(1) Loans and deposits excluding repos and intercompany.

71
Commercial Bank Austria – P&L and volumes 1 2 3 4 5 6 7 Annex - Financials
Data in m (1) 1Q16 2Q16 3Q16 4Q16 1Q17 2Q17 3Q17 ∆ % vs. ∆ % vs. 9M16 9M17 ∆ % vs.
2Q17 3Q16 9M16
Total revenues 381 446 412 401 366 402 385 -4.4% -6.5% 1,238 1,153 -6.9%
Operating costs -313 -319 -295 -309 -284 -272 -261 -4.2% -11.7% -927 -816 -11.9%
Gross operating profit 68 126 117 92 82 130 124 -4.7% +6.3% 311 337 +8.3%
LLPs -4 10 21 -60 52 30 -14 n.m. n.m. 28 68 n.m.
Profit before taxes -205 111 101 -342 52 170 114 -32.7% +13.6% 7 336 n.m.
Net profit -206 89 98 -364 68 205 188 -8.6% +91.7% -20 461 n.m.
Cost / Income ratio, % 82.2% 71.6% 71.6% 77.0% 77.6% 67.6% 67.7% +0.1pp -3.9pp 74.9% 70.8% -4.1pp
Cost of risk, bps 3 -9 -17 49 -44 -25 12 +38bps +29bps -8 -19 -12bps
RoAC, % n.m. 11.0% 12.3% n.m. 9.0% 28.2% 26.7% -1.4pp +14.4pp -1.7% 21.2% +22.9pp.-
Customer loans 44,708 44,383 44,512 44,984 44,960 44,626 44,547 -0.2% +0.1% 44,512 44,547 +0.1%
Customer deposits 47,251 47,060 47,322 47,096 46,711 46,375 46,687 +0.7% -1.3% 47,322 46,687 -1.3%
Total RWA 24,735 23,685 23,536 23,675 22,423 21,960 21,581 -1.7% -8.3% 23,536 21,581 -8.3%
FTEs (#) 5,654 5,561 5,535 5,486 5,317 5,246 5,199 -0.9% -6.1% 5,535 5,199 -6.1%
(1) Loans and deposits excluding repos and intercompany.

72
Central and Eastern Europe – P&L and volumes
1 2 3 4 5 6 7 Annex - Financials
Data in m (1) 1Q16 2Q16 3Q16 4Q16 1Q17 2Q17 3Q17 ∆ const ∆ const 9M16 9M17 ∆ const
% 2Q17 % 3Q16 % 9M16
Total revenues 942 1,169 1,057 998 1,070 1,074 1,040 -1.7% -1.0% 3,167 3,183 -0.9%
Operating costs -362 -380 -383 -371 -382 -388 -376 -2.0% -3.2% -1,125 -1,146 -1.2%
Gross operating profit 580 789 674 627 688 686 663 -1.5% +0.3% 2,042 2,038 -0.8%
LLPs -139 -187 -151 -316 -185 -81 -161 +111.9% +6.3% -477 -427 -13.6%
Profit before taxes 372 569 503 265 376 590 482 -16.4% -1.7% 1,444 1,447 +0.5%
Net profit 315 458 437 198 330 495 413 -14.6% -0.7% 1,211 1,239 +4.2%
Cost / Income ratio, % 38.4% 32.5% 36.2% 37.2% 35.7% 36.1% 36.2% +0.1pp -0.1pp 35.5% 36.0% +0.5pp
Cost of risk, bps 96 128 102 210 122 53 106 +53bps +5bps 109 94 -15bps
RoAC, % 10.5% 15.4% 14.6% 6.7% 11.3% 17.4% 14.7% -2.6pp +0.2pp 13.5% 14.4% +0.9pp
Customer loans 57,721 58,919 59,541 59,935 60,458 59,774 59,791 +0.2% -0.6% 59,541 59,791 -0.6%
Customer deposits 57,874 56,524 57,522 59,175 60,929 59,677 60,433 +1.9% +3.9% 57,522 60,433 +3.9%
Total RWA 92,452 94,277 93,421 91,403 91,098 87,390 86,700 +0.8% -0.8% 93,421 86,700 -0.8%
FTEs (#) 24,179 24,267 24,490 24,302 24,208 24,254 24,134 n.m. n.m. 24,490 24,134 n.m.
(1) Loans and deposits excluding repos and intercompany. Variations Q/Q and Y/Y at constant FX (RoAC, C/I, NPEs and CoR variations at current FX). Stated numbers at current FX.

73
Corporate & Investment Banking – P&L and volumes 1 2 3 4 5 6 7 Annex - Financials
Data in m (1) 1Q16 2Q16 3Q16 4Q16 1Q17 2Q17 3Q17 ∆ % vs. ∆ % vs. 9M16 9M17 ∆ % vs.
2Q17 3Q16 9M16
Total revenues 1,074 1,131 1,061 968 1,155 1,026 890 -13.2% -16.1% 3,266 3,071 -6.0%
Operating costs -425 -439 -436 -430 -431 -412 -397 -3.6% -8.8% -1,300 -1,240 -4.6%
Gross operating profit 649 691 626 538 724 614 493 -19.7% -21.2% 1,966 1,831 -6.9%
LLPs -62 -67 -29 -408 -72 3 -55 n.m. +91.6% -158 -125 -21.0%
Profit before taxes 444 578 572 -256 524 603 427 -29.1% -25.3% 1,594 1,554 -2.5%
Net profit 300 380 379 117 352 400 299 -25.2% -21.2% 1,059 1,050 -0.8%
Cost / Income ratio, % 39.6% 38.9% 41.1% 44.4% 37.3% 40.2% 44.6% +4.5pp +3.6pp 39.8% 40.4% +0.6pp
Cost of risk, bps 24 25 11 156 27 -1 20 +21bps +9bps 20 15 -5bps
RoAC, % 12.9% 15.5% 15.1% 4.8% 14.8% 17.4% 13.1% -4.3pp -2.0pp 14.5% 15.1% +0.6pp.-
Customer loans 68,604 73,726 72,685 75,611 75,423 75,744 78,356 +3.4% +7.8% 72,685 78,356 +7.8%
Customer deposits 46,555 44,307 45,240 46,331 45,772 47,410 44,237 -6.7% -2.2% 45,240 44,237 -2.2%
Total RWA 73,205 80,072 74,626 75,143 72,466 70,951 71,470 +0.7% -4.2% 74,626 71,470 -4.2%
FTEs (#) 3,605 3,551 3,535 3,480 3,447 3,447 3,371 -2.2% -4.6% 3,535 3,371 -4.6%
(1) Loans and deposits excluding repos and intercompany.

74
Fineco – P&L and volumes
1 2 3 4 5 6 7 Annex - Financials
Data in m (1) 1Q16 2Q16 3Q16 4Q16 1Q17 2Q17 3Q17 ∆ % vs. ∆ % vs. 9M16 9M17 ∆ % vs.
3Q17 3Q16 9M16
Total revenues 140 149 132 138 142 141 148 +5.3% +12.5% 420 430 +2.4%
Operating costs -60 -58 -53 -55 -61 -60 -54 -11.4% +0.3% -171 -175 +2.1%
Gross operating profit 80 91 78 83 81 80 94 +17.9% +20.8% 249 256 +2.6%
LLPs -1 -1 -1 -1 -1 -1 -2 +52.5% n.m. -4 -3 -12.8%
Profit before taxes 77 89 66 74 78 78 70 -9.7% +6.5% 232 226 -2.2%
Net profit 18 24 16 17 18 19 16 -11.1% +4.9% 57 53 -7.0%
Cost / Income ratio, % 43.0% 38.7% 40.6% 40.0% 42.9% 43.0% 36.2% -6.8pp -4.4pp 40.7% 40.6% -0.1pp
Cost of risk, bps 66 64 31 27 20 30 38 +8bps +7bps 53 30 -23bps
RoAC, % 84.9% 106.1% 70.8% 61.3% 59.8% 70.9% 54.5% -16.5pp -16.3pp 87.3% 61.3% -26.0pp.-
Customer loans 701 781 815 910 1,015 1,303 1,528 +17.2% +87.6% 815 1,528 +87.6%
Customer deposits 16,513 16,981 17,029 18,570 18,707 19,281 19,797 +2.7% +16.3% 17,029 19,797 +16.3%
Total RWA 1,838 1,805 1,778 1,890 1,937 2,063 2,184 +5.9% +22.9% 1,778 2,184 +22.9%
FTEs (#) 1,021 1,025 1,033 1,052 1,044 1,067 1,069 +0.2% +3.5% 1,033 1,069 +3.5%
(1) Loans and deposits excluding repos and intercompany.
(2) Consolidated view, i.e. 35% ownership by UniCredit, for net profit only. 1Q16-3Q16 restated..
(2)

75
Group Corporate Centre & Other – P&L and volumes 1 2 3 4 5 6 7 Annex - Financials
Data in m (1) 1Q16 2Q16 3Q16 4Q16 1Q17 2Q17 3Q17 ∆ % vs. ∆ % vs. 9M16 9M17 ∆ % vs.
2Q17 3Q16 9M16
Total revenues -220 40 -191 -263 -194 -176 -207 +17.9% +8.7% -370 -576 +55.6%
Operating costs -121 -132 -122 -753 -92 -121 -110 -8.6% -9.6% -375 -323 -13.8%
Gross operating profit -340 -92 -313 -1,016 -286 -296 -317 +7.1% +1.6% -745 -899 +20.7%
LLPs -6 -1 -11 12 -3 -1 -18 n.m. +60.6% -17 -21 +21.8%
Profit before taxes -363 -362 -380 -2,342 -280 -454 -418 -8.0% +9.9% -1,104 -1,152 +4.3%
Net profit -147 -102 -331 -3,620 -81 -518 1,709 n.m. n.m. -579 1,110 n.m.
Cost / Income ratio, % n.m. n.m. n.m. n.m. n.m. n.m. n.m. n.m. n.m. n.m. n.m. n.m.
Cost of risk, bps n.m. n.m. n.m. n.m. n.m. n.m. n.m. n.m. n.m. n.m. n.m. n.m..-
Customer loans 1,817 1,877 2,052 2,041 1,844 2,195 2,606 +18.7% +27.0% 2,052 2,606 +27.0%
Customer deposits 3,192 2,702 2,719 3,300 2,630 2,514 2,351 -6.5% -13.5% 2,719 2,351 -13.5%
Total RWA 59,664 57,650 57,860 53,816 57,633 31,472 29,905 -5.0% -48.3% 57,860 29,905 -48.3%
FTEs (#) 17,544 17,529 17,466 17,324 16,524 16,158 15,970 -1.2% -8.6% 17,466 15,970 -8.6%
(1) Loans and deposits excluding repos and intercompany.

76
Non Core – P&L and volumes
1 2 3 4 5 6 7 Annex - Financials
Data in m (1) 1Q16 2Q16 3Q16 4Q16 1Q17 2Q17 3Q17 ∆ % vs. ∆ % vs. 9M16 9M17 ∆ % vs.
2Q17 3Q16 9M16
Total revenues -10 -65 -67 -130 -41 -49 -28 -42.2% -57.9% -142 -118 -17.2%
Operating costs -47 -22 -37 -54 -44 -21 -53 n.m. +44.0% -106 -119 +11.9%
Gross operating profit -58 -87 -104 -184 -85 -70 -82 +16.9% -21.4% -248 -236 -4.8%
LLPs -343 -401 -545 -7,559 -201 -255 -138 -45.6% -74.6% -1,289 -594 -53.9%
Profit before taxes -431 -511 -656 -7,792 -311 -334 -300 -10.2% -54.3% -1,599 -945 -40.9%
Net profit -291 -316 -447 -8,329 -206 -216 -207 -4.4% -53.8% -1,054 -628 -40.4%
Cost / Income ratio, % n.m. n.m. n.m. n.m. n.m. n.m. n.m. n.m. n.m. n.m. n.m. n.m.
Cost of risk, bps 398 503 724 n.m. 426 580 341 n.m. n.m. 535 451 -83bps
RoAC n.m. n.m. n.m. n.m. n.m. n.m. n.m. n.m. n.m. n.m. n.m. n.m..-
Customer loans 33,163 30,674 29,495 18,962 18,237 16,391 15,590 -4.9% -47.1% 29,495 15,590 -47.1%
Customer deposits 1,339 1,066 1,083 970 992 1,035 1,077 +4.0% -0.5% 1,083 1,077 -0.5%
Total RWA 29,103 27,352 26,251 26,196 25,230 22,742 21,712 -4.5% -17.3% 26,251 21,712 -17.3%
FTEs (#) 677 553 537 529 510 500 496 -0.9% -7.7% 537 496 -7.7%
(1) Loans and deposits excluding repos and intercompany.

Glossary
77

Glossary
Glossary(1) (1/9)
Bps Basis points
AuM Assets under Management
AuC Assets under Custody
AFS Available for Sale
Adj. Data adjusted for non recurring items
(1) All financial data reported in the presentation are in Euro. Numbers may not add up due to rounding.
AT1 Additional Tier 1 Capital
AVA Additional Value Adjustment
78
Avg. Average
Bad loans Exposures to borrowers in a state of insolvency or in an essentially similar situation, regardless of any loss forecasts made by the bank
Branches Consistent with CMD perimeter

Constant
Corporate Centre
Commercial Banking
"buoni poliennali del tesoro" Multiannual Treasury Bond issued by Italy
C/I
Const.
Glossary
Glossary (2/9)
CC
CBK
BTP
79
CEE
Calculated as per EBA methodology, with collateral value capped at net (gross) loan level
CET1 Ratio Common Equity Tier 1 ratio fully loaded throughout the document unless otherwise stated
CIB Corporate & Investment Banking
CMD Capital Markets Day – CMD perimeter as announced at CMD on 13 December 2016: variations related to disposals of Immo Holding, Ukraine, 30% Fineco, Pekao and Pioneer
Collateral coverage ratio
Central Eastern Europe includes: Czech Republic, Slovakia, Hungary, Slovenia, Croatia, Bosnia and Herz., Serbia, Russia, Romania, Bulgaria, Turkey (at equity), Baltics (Latvia, Lithuania, Estonia) only for Leasing
Cost/Income ratio calculated as operating expenses to total revenues

Defined Benefit Obligation
Contribution to Deposit Guarantee Scheme
Customer
Back to performing (annualized) on stock of NPEs at the beginning of the period
Stock Loan loss reserves on NPEs on Gross NPEs
Cost of Risk calculated as LLP of the period annualised / Average loans volume
DBO
Glossary
DGS
Cust.
Glossary (3/9)
Cure rate
Coverage ratio
CoR
80
Customer spread Rate on customer loans – Rate on customer deposits
Default rate Percentage of gross loans migrating from performing to NPEs over a given period (annualized) divided by the initial amount of gross loans
De-risking De-risking refers to the phenomenon of financial institutions terminating or restricting business relationships with clients or categories of clients to avoid, rather than manage, risk
DTA Deferred Tax Asset
DVA Debt Value Adjustment

Glossary
Glossary (4/9)
81
FTEs Full time Equivalent
FINO Failure Is Not an Option: project name for the disposal of a NPE portfolio (original gross book value of 17.7bn)
Forborne loan Exposure to which forbearance measures have been applied, i.e. concessions towards a debtor who is facing or about to face financial difficulties
EL
EPS Earning per shares
Euribor 3M Daily reference rate, published by the European Money Market Institute
EMEA Europe, Middle East and Africa
E2E End-to-End
Expected Loss
FICC Fixed Income Currencies and Commodities
FL Fully Loaded
EOP End of Period

Glossary (5/9)
KPIs Key performance indicators
HR Human Resources
GTB Global Transaction Banking
Group Corporate Center (Group CC)
Corresponding to the divisional database section: "Global Corporate Center" including Corporate Center, COO Services and Elisions
IFRS5 Accounting principle related to assets held for sale
FTEs Industrial FTEs related to industrial legal entities (non financial and non instrumental) fully consolidated within the Group
82
FX Foreign Exchange
LCR Liquidity Coverage Ratio (amount of liquidity available for a bank to meet its short term liquidity needs)
JVs Joint Ventures
Leverage ratio The leverage ratio is defined as Tier 1 capital divided by a non-risk-based measure (exposure) of on- and off-balance sheet items

Glossary (6/9)
Net Interest Income
Glossary
NII
Migration rate
n.a.
Inflows (from gross performing loans to gross impaired loans) – outflows (collections and flows from gross impaired loans back to gross performing loans)
LLPs Loan Loss Provisions
Representing the percentage of UTP that turn into bad loans
83
n.m.
Not available
Non meaningful
Net Inflows
Net Outflows Outflows (collections and flows from gross impaired loans back to gross performing loans) – inflows (from gross performing loans to gross impaired loans)
Non-Performing Exposures shall be classified in the following risk classes: Bad Loans (“Sofferenze”), Unlikely to Pay ("Inadempienze Probabili") and Past Due ("Esposizioni scadute e/o sconfinanti deteriorate")
NPEs
In 2013 UniCredit ring-fenced the so-called "Non-Core" portfolio in Italy with a target to reduce clients exposure considered as not strategic; selected assets in Italy to be managed with a risk mitigation approach
Non Core
Glossary
Glossary (7/9)
Q/Q Quarter on quarter
p.p. percentage points
NSFR Net Stable Funding Ratio
Non HR costs Other administrative expenses (including indirect costs) net of expenses recovery, plus depreciation and amortization
NPE Ratio (Gross or Net) Non-performing exposure as a percentage of total loans.
84
OCS Own Credit Spread
Pro-forma Pro-forma data excluding the temporary effect of Pioneer & Pekao classified under IFRS5
Past Due Problematic exposures that, at the reporting date, are more than 90 days past due on any material obligation
Repos Repurchase agreement
Recovery rate NPE exposure reduction (gross Book Value) due to recovery activity on stock of NPEs at the beginning of the period

Glossary
Glossary (8/9)
85
SFT Securities financing transaction
RoTE Return on Tangible Equity (Annualised Net income / Average Tangible Equity)
RWA Risk Weighted Assets
RoAC
Return on Allocated Capital (Annualised net profit / Allocated Capital), Allocated Capital based on RWA equivalent figures calculated with a CET1 ratio target of 12.5% as for plan horizon, including deductions for shortfall and securitizations
UTP
TFAs Total Financial Assets, commercial figures summary of AuM, AuC and Deposits
Unlikely To Pay: the classification in this category is the result of the judgment of the bank about the unlikeliness, without recourse to actions such as realizing collaterals, that the obligor will pay in full (principal and / or interest) its credit obligations
TLTRO Targeted long term refinancing operation
SRF Contribution to Single Resolution Fund
Tangible equity Tangible equity excluding AT1

Glossary
Glossary (9/9)
86
WE Western Europe includes: Italy, Germany and Austria
Y/Y Year on year
YTD Year to date