3q21 earnings release - ri.taesa.com.br
TRANSCRIPT

3Q21 Earnings ReleaseNovember 11, 2021

The individual and consolidated financial statements were prepared in accordance with accounting practices adopted in Brazil, comprising the Brazilian Corporation Law, Statements, Guidance and Interpretations issued by Accounting Pronouncement Committee (“CPC”) and thestandards of the Brazilian Securities Exchange Commission (CVM), combined with specific legislation issued by Electricity Regulatory Agency -ANEEL. ANEEL, as a regulatory agency, has the power to regulate concessions. Results will be presented in both formats, IFRS format and the regulatory format to allow comparison with other years. Note that Regulatory results will not be audited. Taesa's dividend declaration is performed based on the reviewed IFRS results.
Statements in this document related to business perspectives, projections on operating and financial income, and those related to Taesa’sgrowth perspective are merely projections and, as such, are based solely on Executive Board’s expectations about business future. Theseexpectations depend substantially on changes in market conditions, on Brazilian economy performance, and on industry and internationalmarket performance; therefore, subject to unannounced changes.
EBITDA is net income before taxes, net financial expenses, and depreciation, amortization and income expenses. EBITDA is not recognized byaccounting practices adopted in Brazil or in IFRS, does not represent cash flow for presented periods, and should not be considered asalternative net income. Presented EBITDA is used by Taesa to measure its own performance. Taesa understands that some financial investorsand analysts use EBITDA as an operating performance index.
“Net Debt” is not recognized by accounting practices adopted in Brazil nor by IFRS and does not represent cash flow for presented periods.Presented Net Debt is used by Taesa to measure its own performance. Taesa understands that some investors and financial analysts use NetDebt as an indication of its financial performance.
Presented managerial results are the sum of Taesa consolidated income with equity in its partially-owned subsidiaries and associatedcompanies. The purpose of this information is to permit better understanding of Taesa business.
Disclaimer
2

Sustainability Agenda - EnvironmentFight against climate change: actions under way
3
• Scope 1: Direct emissions from sources that
belong to or are controlled by the organization.
• Scope 2: Emissions resulting from the
generation of electricity that is lost during
transmission.
3.0%
4,499
54.7%
15.5%
Owned fleet
Vegetation removal
26.8%
Scope 1
Isulating gas
Others
Green House Gases Inventory
Taesa 2020
Mitigation Actions
(Scope 1)
Review of operational processes and procedures seeking
better eco-efficiency
Efficiency in the maintenance of assets containing SF6
insulating gases
Review of cleaning and maintenance procedures for line
easements
Prioritize biofuel consumption
Upgrading to a hybrid electric vehicle fleet
Educational socio-
environmental campaigns
Prevention and reduction
against wildfires
Additional Initiatves
Reforestation
Plant nurseries and seedling
distribution
(in tCO2e)
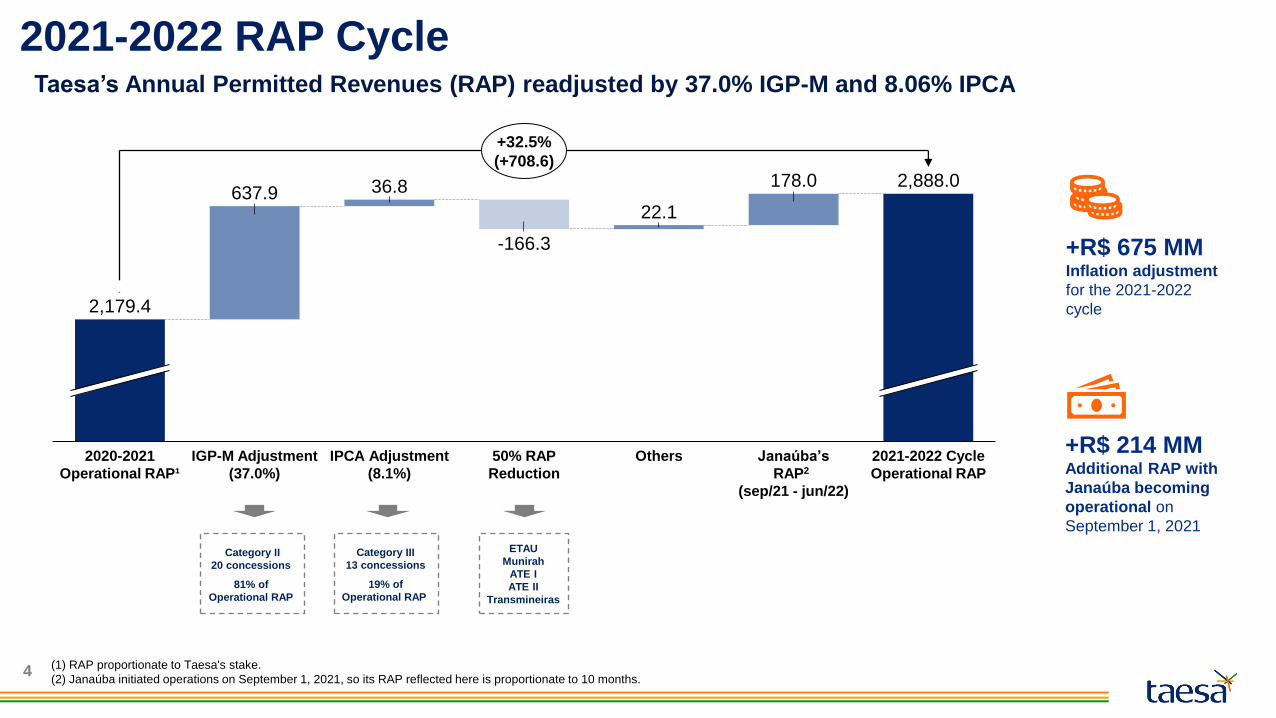
2021-2022 RAP Cycle
4
-166.3
2020-2021
Operational RAP¹
IGP-M Adjustment
(37.0%)
637.92,888.0
Janaúba’s
RAP2
(sep/21 - jun/22)
Others
178.0
50% RAP
Reduction
2,179.4
IPCA Adjustment
(8.1%)
36.8
22.1
2021-2022 Cycle
Operational RAP
+32.5%
(+708.6)
Taesa’s Annual Permitted Revenues (RAP) readjusted by 37.0% IGP-M and 8.06% IPCA
Category II
20 concessions
81% of
Operational RAP
+R$ 675 MMInflation adjustment
for the 2021-2022
cycle
Category III
13 concessions
19% of
Operational RAP
ETAU
Munirah
ATE I
ATE II
Transmineiras
+R$ 214 MMAdditional RAP with
Janaúba becoming
operational on
September 1, 2021
(1) RAP proportionate to Taesa's stake.
(2) Janaúba initiated operations on September 1, 2021, so its RAP reflected here is proportionate to 10 months.
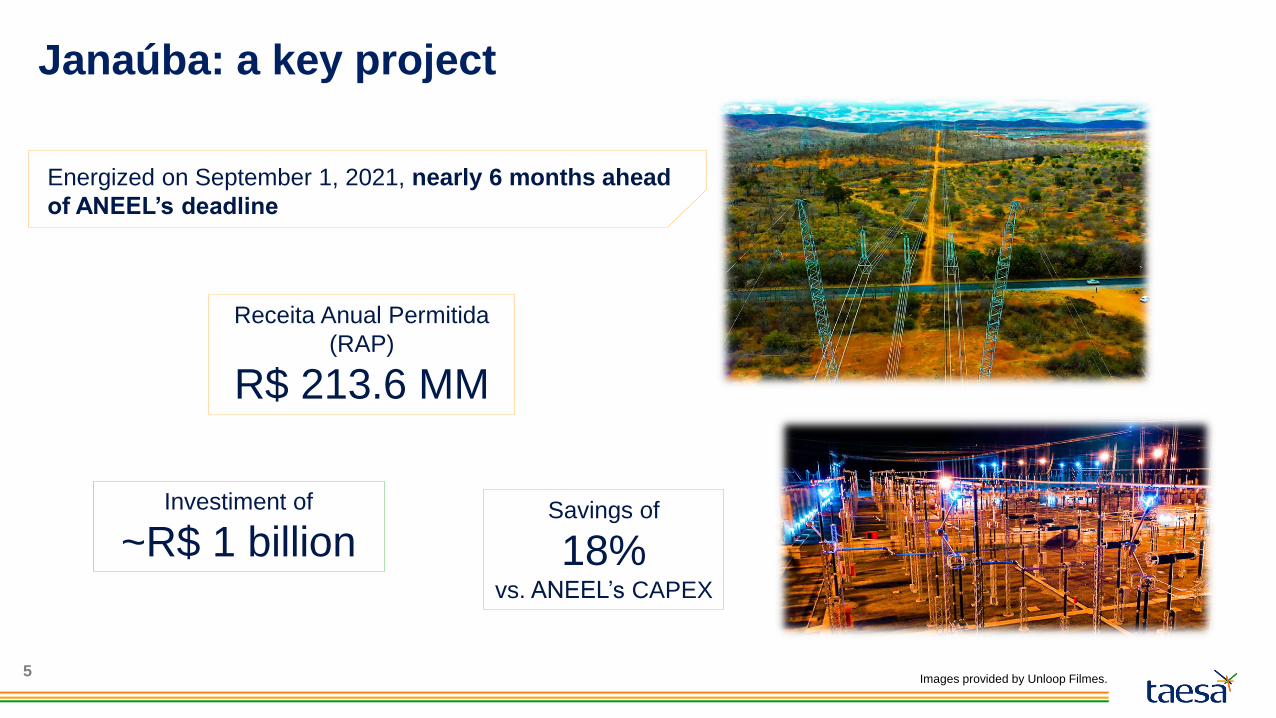
5
Janaúba: a key project
Energized on September 1, 2021, nearly 6 months ahead
of ANEEL’s deadline
Receita Anual Permitida
(RAP)
R$ 213.6 MM
Savings of
18%vs. ANEEL’s CAPEX
Investiment of
~R$ 1 billion
Images provided by Unloop Filmes.

6
26crossings
3substations
Employing
881people per
monthUtilizing
12k tons of structure
More than
12.5ktons of power cables
Janaúba: a key project
Images given by Unloop Filmes.

7Images shared by Renata Hossell Schiffer.
Integration of the power transmission systems
between the states of Bahia and Minas Gerais
Capacity
1,600 MW To service more than
5 million people
Outflow from renewable energy plants in the Northeast
to the Southeast and Central-West regions
Janaúba: a key project

8
RAP/CAPEX*: 87.4 / 341
ANEEL construction deadline: Feb 22
End of concession: Feb 47
SUDENE benefit
50% Taesa
%
208 km
50% Taesa
RAP/CAPEX*: 130,4 / 510
SUDENE benefit
%
338 km
ESTE RAP/CAPEX*: 123.6 / 486
ANEEL construction deadline: Feb 22
End of concession: Feb 4749.98% Taesa
%
236 km
SUDENE benefit
100 100 100 94
Land Licenses Funding Physical
100 100 100 93
FundingLicensesLand Physical
Paraguaçu
Aimorés
Investments(in R$ mm)
2014 2015 2016
3
2017 202020192018
5 22109
209
718
1,535
Ivaí
50% Taesa
RAP/CAPEX*: 323.7 / 1.937
ANEEL construction deadline: Aug 22
End of concession: Aug 47
%
600 km(CD)
98 100 100 89
PhysicalLand Licenses Funding
Sant’Ana RAP/CAPEX*: 67.1 / 610
ANEEL construction deadline: Mar 23100% Taesa
%
End of concession: Mar 49
591 km
99 100 10076
Land Licenses Funding Physical
9M219M20
1,109
819
-26.1%
R$ 3.4 billionTotal investments by
TAESA in theses projects
(2014 to 2021)
RAP/CAPEX*: 130.4 / 510
End of concession: Feb 47
338 km
99 100 100 91
Land FundingLicenses Physical
ANEEL construction deadline: Feb 22
* R$ million (2021-2022 RAP cycle / ANEEL CAPEX)** Funding does not consider the fundraising of Taesa’s partners in each project
Projects under Construction
Status of Projects

Regulatory Results
3Q20 3T21
383.3497.5
+29.8%
Net Revenues(in R$ mm – Taesa consolidated)
82.9% 84.6%
EBITDA margin
EBITDA(in R$ mm – Taesa consolidated)
3Q20 3Q21
421.0317.6
+32.6%
Net Income(in R$ mm – Taesa consolidated)
3Q20
192.1
3Q21
165.5
+16.0%
9
Operating Performance(in %)
Availability Rate
9M219M20
1,141.81,286.3
+12.6%
947.11,068.8
9M20 9M21
+12.8%
83.1%82.9%
258.4
9M20
Δ Financial Result
(net of IR*)
411.8
9M21
562.4
-26.8%99.97
9M219M20
99.92
-0.05pp
* IR estimated with an effective rate of 15%.

IFRS Net Income
10
(in R$ mm)
• Monetary restatement revenues and equity method negatively impacted by lower IGP-M index between the compared
periods (2.05% accumulated in 3Q21 versus 6.67% in 3Q20).
• Operation and Maintenance Revenue (O&M) readjusted by the same indexes from 2021-2022 RAP Cycle (37.04%
IGP-M and 8.06% IPCA).
• Growth of implementation margin and of remuneration of the contractual asset due to higher-than-expected inflation
in the quarter, which expanded the balance of these contracts' assets.
• Reduction of the operational costs due to lower investments in projects under construction.
• Growth of Net Financial Expenses (Financial Result) due to the growth of IPCA and CDI and to the reduction of
average cash balance.
(1) The Company performed the adjustments and reclassifications of its balance sheets as of September 30, 2020, in order to present such amounts for comparative purposes with the interim information as of September 30, 2021, due to the impact of OFFICIAL-NOTICE/CVM/SNC/SEP/nº 04/2020 referring to CPC 47.
54.6
3Q20 Net
Income1
Δ Net
Revenues
1.7
Δ OpEx
81.6
Δ Equity
Method
111.1
Δ Net Financial
Results
19.3
Others 3Q21 Net
Income
657.4
536.9
-18.3%
(-120.5)
1,790.6
9M219M201
1,512.8
+18.4%

Financial Results
3Q20
1,915
3Q21
1,937
4,797
23 14
4,937
6,735 6,888
IPCACDI Others
Financial Expenses(in R$ mm)
Financial Revenues(in R$ mm)
Average cash
balance(in R$ mm)
Average debt
balance(in R$ mm)
3Q20 3Q21
10.78.7
-18.6%
(-2.0)
838
1,600
3Q20 3Q21
Profitability(% of CDI)
3Q20 3Q21
-130.0
-239.0
+83.9%
(-109.1)
3Q20 3Q21
-119.3
-230.4
+93.1%
(-111.1)
Financial Results(in R$ mm)
Indexes(%)
100.9 100.4
3Q20 3Q21
1.21
3Q20
0.50
3Q21
1,243,02
3Q20 3Q21
1) Reduction in the average cash
balance impacted the financial
revenues by R$ 2.0mm.
2) Rising macroeconomic
indexes (IPCA and CDI) influenced
the growth of financial expenses by
R$ 109.1mm.
11
0.501.21
CDI(average - %)
(avg.)(avg.)
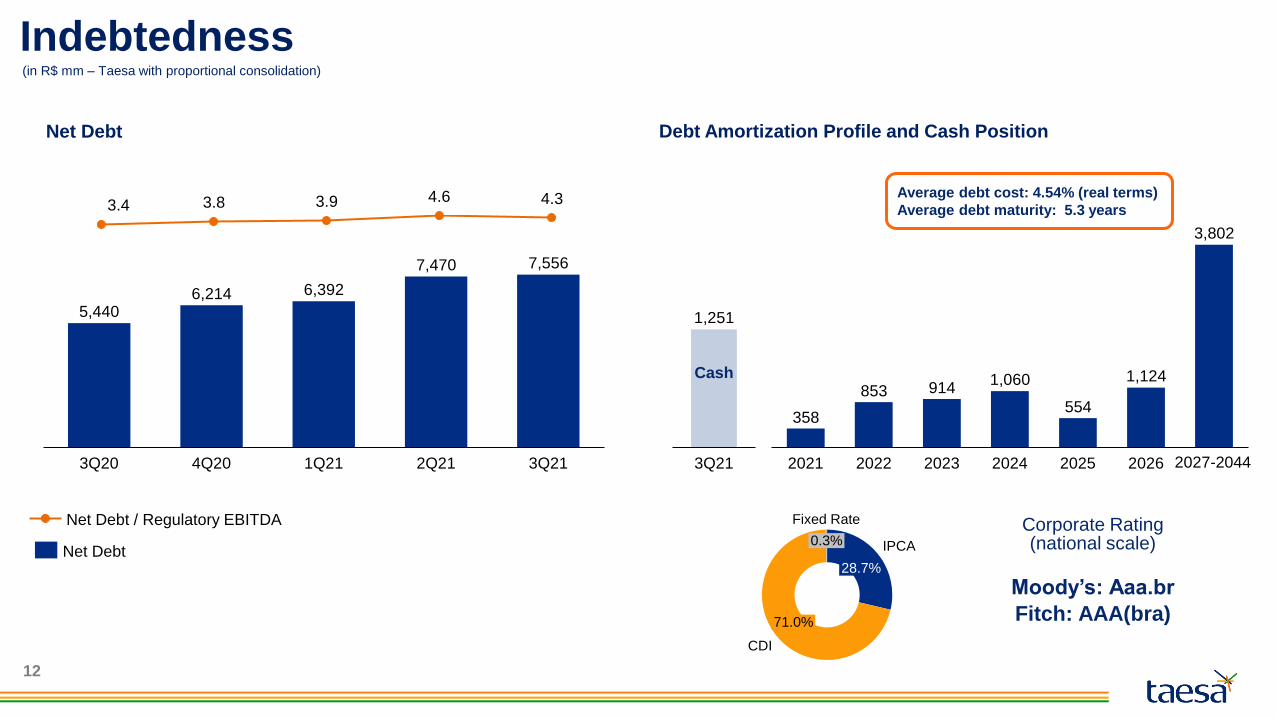
3.83.4 4.33.9 4.6
Indebtedness
12
6,214
3Q20 4Q20 3Q211Q21 2Q21
5,440
6,392
7,470 7,556
Net Debt / Regulatory EBITDA
Net Debt
358
853 914
554
2021 2023 20262022 2024
1,060
2025
1,124
3,802
1,251
3Q21
Cash
Average debt cost: 4.54% (real terms)
Average debt maturity: 5.3 years
Net Debt Debt Amortization Profile and Cash Position
2027-2044
Fixed Rate
28.7%
IPCA
CDI
71.0%
0.3%Corporate Rating(national scale)
Moody’s: Aaa.br
Fitch: AAA(bra)
(in R$ mm – Taesa with proportional consolidation)

SEE YOU THERE!
Scan below to
register now:
SUSTAINABILITY, DIVERSITY AND STRATEGY. BUILD TODAY FOR A BETTER TOMORROW.
VIRTUAL EVENT
DECEMBER 3rd
8:00-10:30 AM (EDT)
10 AM-12:30 PM (BRT)