3q21 quarterly supplement
TRANSCRIPT

3Q21 Quarterly Supplement
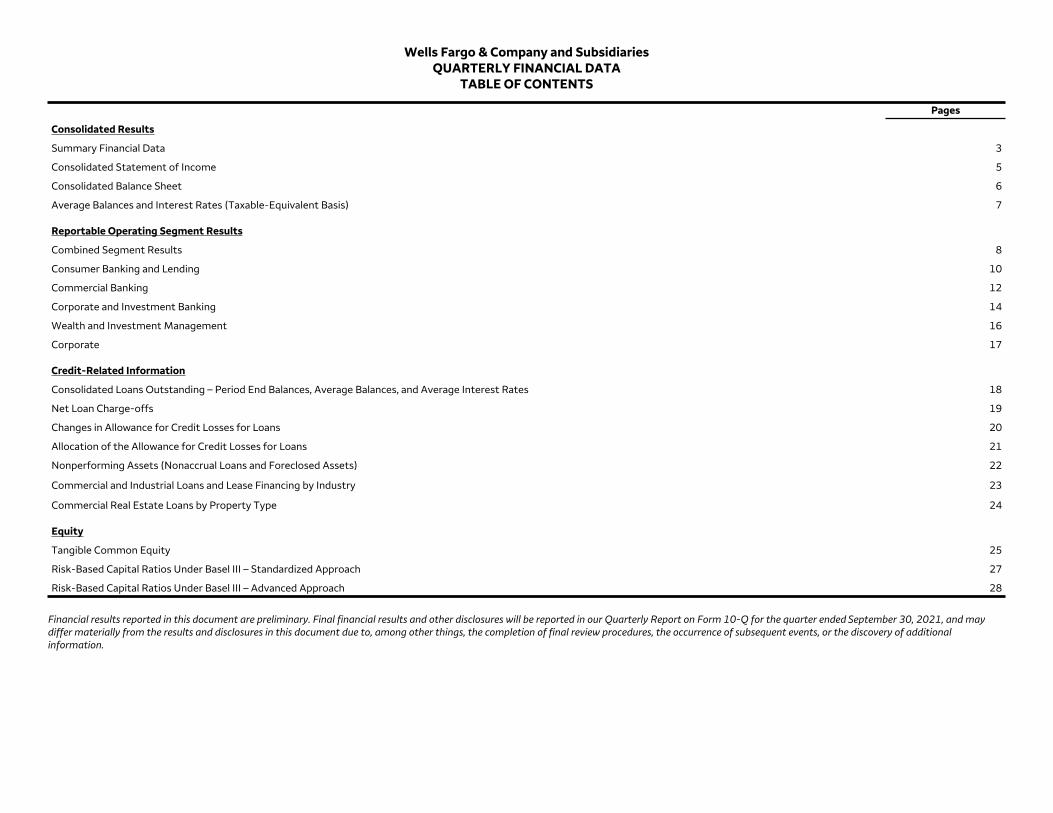
Wells Fargo & Company and Subsidiaries QUARTERLY FINANCIAL DATA
TABLE OF CONTENTS
Pages
Consolidated Results
Summary Financial Data 3
Consolidated Statement of Income 5
Consolidated Balance Sheet 6
Average Balances and Interest Rates (Taxable-Equivalent Basis) 7
Reportable Operating Segment Results
Combined Segment Results 8
Consumer Banking and Lending 10
Commercial Banking 12
Corporate and Investment Banking 14
Wealth and Investment Management 16
Corporate 17
Credit-Related Information
Consolidated Loans Outstanding – Period End Balances, Average Balances, and Average Interest Rates 18
Net Loan Charge-offs 19
Changes in Allowance for Credit Losses for Loans 20
Allocation of the Allowance for Credit Losses for Loans 21
Nonperforming Assets (Nonaccrual Loans and Foreclosed Assets) 22
Commercial and Industrial Loans and Lease Financing by Industry 23
Commercial Real Estate Loans by Property Type 24
Equity
Tangible Common Equity 25
Risk-Based Capital Ratios Under Basel III – Standardized Approach 27
Risk-Based Capital Ratios Under Basel III – Advanced Approach 28
Financial results reported in this document are preliminary. Final financial results and other disclosures will be reported in our Quarterly Report on Form 10-Q for the quarter ended September 30, 2021, and may differ materially from the results and disclosures in this document due to, among other things, the completion of final review procedures, the occurrence of subsequent events, or the discovery of additional information.
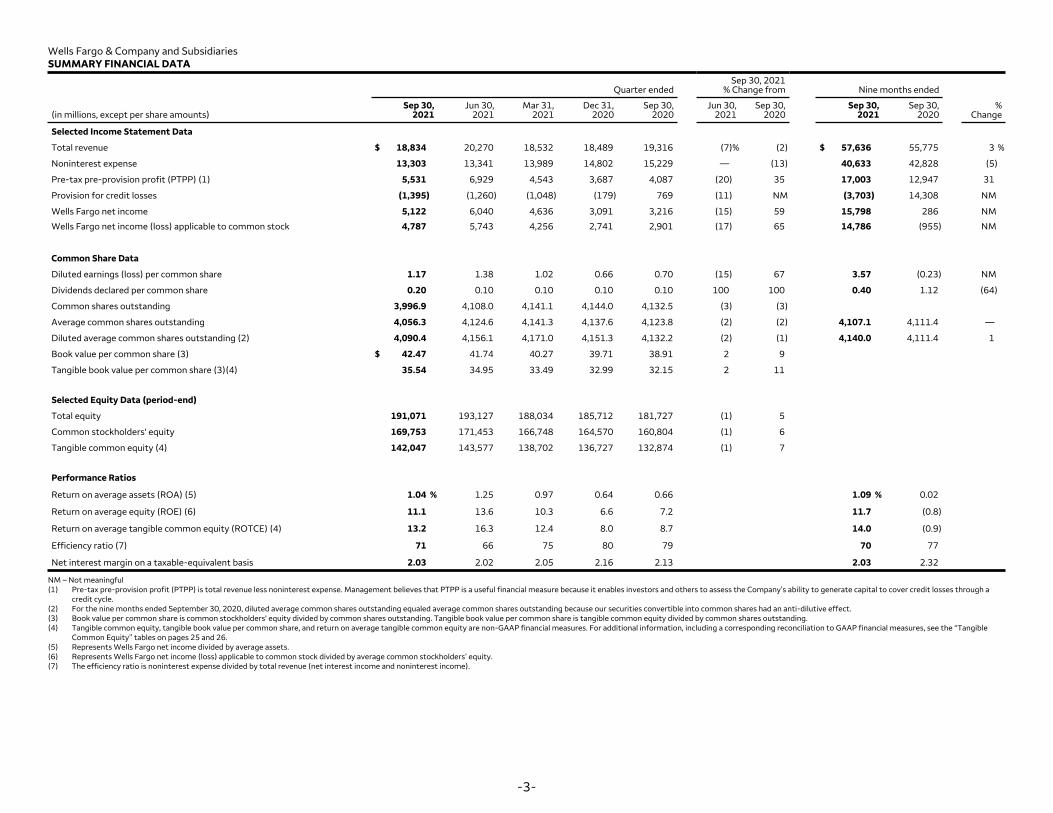
Wells Fargo & Company and Subsidiaries SUMMARY FINANCIAL DATA
Sep 30, 2021 Quarter ended % Change from Nine months ended
Sep 30, Jun 30, Mar 31, Dec 31, Sep 30, Jun 30, Sep 30, Sep 30, Sep 30, % (in millions, except per share amounts) 2021 2021 2021 2020 2020 2021 2020 2021 2020 Change
Selected Income Statement Data
Total revenue $ 18,834 20,270 18,532 18,489 19,316 (7) % (2) $ 57,636 55,775 3 %
Noninterest expense 13,303 13,341 13,989 14,802 15,229 — (13) 40,633 42,828 (5)
Pre-tax pre-provision profit (PTPP) (1) 5,531 6,929 4,543 3,687 4,087 (20) 35 17,003 12,947 31
Provision for credit losses (1,395) (1,260) (1,048) (179) 769 (11) NM (3,703) 14,308 NM
Wells Fargo net income 5,122 6,040 4,636 3,091 3,216 (15) 59 15,798 286 NM
Wells Fargo net income (loss) applicable to common stock 4,787 5,743 4,256 2,741 2,901 (17) 65 14,786 (955) NM
Common Share Data
Diluted earnings (loss) per common share 1.17 1.38 1.02 0.66 0.70 (15) 67 3.57 (0.23) NM
Dividends declared per common share 0.20 0.10 0.10 0.10 0.10 100 100 0.40 1.12 (64)
Common shares outstanding 3,996.9 4,108.0 4,141.1 4,144.0 4,132.5 (3) (3)
Average common shares outstanding 4,056.3 4,124.6 4,141.3 4,137.6 4,123.8 (2) (2) 4,107.1 4,111.4 —
Diluted average common shares outstanding (2) 4,090.4 4,156.1 4,171.0 4,151.3 4,132.2 (2) (1) 4,140.0 4,111.4 1
Book value per common share (3) $ 42.47 41.74 40.27 39.71 38.91 2 9
Tangible book value per common share (3)(4) 35.54 34.95 33.49 32.99 32.15 2 11
Selected Equity Data (period-end)
Total equity 191,071 193,127 188,034 185,712 181,727 (1) 5
Common stockholders' equity 169,753 171,453 166,748 164,570 160,804 (1) 6
Tangible common equity (4) 142,047 143,577 138,702 136,727 132,874 (1) 7
Performance Ratios
Return on average assets (ROA) (5) 1.04 % 1.25 0.97 0.64 0.66 1.09 % 0.02
Return on average equity (ROE) (6) 11.1 13.6 10.3 6.6 7.2 11.7 (0.8)
Return on average tangible common equity (ROTCE) (4) 13.2 16.3 12.4 8.0 8.7 14.0 (0.9)
Efficiency ratio (7) 71 66 75 80 79 70 77
Net interest margin on a taxable-equivalent basis 2.03 2.02 2.05 2.16 2.13 2.03 2.32
NM – Not meaningful (1) Pre-tax pre-provision profit (PTPP) is total revenue less noninterest expense. Management believes that PTPP is a useful financial measure because it enables investors and others to assess the Company’s ability to generate capital to cover credit losses through a
credit cycle. (2) For the nine months ended September 30, 2020, diluted average common shares outstanding equaled average common shares outstanding because our securities convertible into common shares had an anti-dilutive effect. (3) Book value per common share is common stockholders' equity divided by common shares outstanding. Tangible book value per common share is tangible common equity divided by common shares outstanding. (4) Tangible common equity, tangible book value per common share, and return on average tangible common equity are non-GAAP financial measures. For additional information, including a corresponding reconciliation to GAAP financial measures, see the “Tangible
Common Equity” tables on pages 25 and 26. (5) Represents Wells Fargo net income divided by average assets. (6) Represents Wells Fargo net income (loss) applicable to common stock divided by average common stockholders’ equity. (7) The efficiency ratio is noninterest expense divided by total revenue (net interest income and noninterest income).
-3-

Wells Fargo & Company and Subsidiaries SUMMARY FINANCIAL DATA (continued)
Sep 30, 2021 Quarter ended % Change from Nine months ended
Sep 30, Jun 30, Mar 31, Dec 31, Sep 30, Jun 30, Sep 30, Sep 30, Sep 30, % ($ in millions, unless otherwise noted) 2021 2021 2021 2020 2020 2021 2020 2021 2020 Change
Selected Balance Sheet Data (average)
Loans
Assets
Deposits
$ 854,024
1,949,700
1,450,941
854,747
1,939,879
1,435,824
873,439
1,934,425
1,393,472
899,704
1,925,013
1,380,100
931,708
1,945,911
1,399,028
— %
1
1
(8)
—
4
$ 860,666
1,941,391
1,426,956
955,918
1,947,315
1,374,638
(10) %
—
4
Selected Balance Sheet Data (period-end)
Debt securities
Loans
Allowance for credit losses for loans
Equity securities
Assets
Deposits
542,993
862,827
14,705
66,526
1,954,901
1,470,379
533,565
852,300
16,391
64,547
1,945,996
1,440,472
505,826
861,572
18,043
57,702
1,957,264
1,437,119
501,207
887,637
19,713
60,008
1,952,911
1,404,381
476,421
920,082
20,471
49,348
1,920,399
1,383,215
2
1
(10)
3
—
2
14
(6)
(28)
35
2
6
Headcount (#) (period-end) 253,871 259,196 264,513 268,531 274,931 (2) (8)
Capital and other metrics (1)
Risk-based capital ratios and components (2):
Standardized Approach:
CET1 11.6 % 12.1 11.8 11.6 11.4
Tier 1 capital
Total capital
Risk-weighted assets (RWAs) (in billions)
13.2
16.2
$ 1,219.1
13.7
16.8
1,188.7
13.5
16.8
1,179.0
13.3
16.5
1,193.7
13.1
16.3
1,185.6 3 3
Advanced Approach:
CET1 12.4 % 12.7 12.6 11.9 11.5
Tier 1 capital
Total capital
Risk-weighted assets (RWAs) (in billions)
14.1
16.5
$ 1,138.3
14.5
16.9
1,126.5
14.4
16.9
1,109.4
13.7
16.1
1,158.4
13.2
15.7
1,172.0 1 (3)
Tier 1 leverage ratio
Supplementary Leverage Ratio (SLR)
Total Loss Absorbing Capacity (TLAC) Ratio (3)
Liquidity Coverage Ratio (LCR) (4)
8.4 %
6.9
23.7
119
8.5
7.1
25.1
123
8.4
7.9
25.2
127
8.3
8.1
25.7
133
8.1
7.8
25.8
134
(1) (2)
(3) (4)
Ratios and metrics for September 30, 2021, are preliminary estimates. See the tables on pages 27 and 28 for more information on Common Equity Tier 1 (CET1), tier 1 capital, and total capital. The information presented reflects fully phased-in CET1, tier 1 capital, and RWAs, but reflects total capital in accordance with transition requirements. Represents TLAC divided by the greater of RWAs determined under the Standardized and Advanced Approaches, which is our binding TLAC ratio. Represents high-quality liquid assets divided by projected net cash outflows, as each is defined under the LCR rule.
-4-

Wells Fargo & Company and Subsidiaries CONSOLIDATED STATEMENT OF INCOME
Quarter ended Sep 30, 2021
% Change from Nine months ended
(in millions, except per share amounts) Sep 30,
2021 Jun 30,
2021 Mar 31,
2021 Dec 31,
2020 Sep 30,
2020 Jun 30, Sep 30,
2021 2020 Sep 30, Sep 30,
2021 2020 %
Change
Interest income $ 9,834 9,693 10,046 10,550 10,811 1 % (9) $ 29,573 37,369 (21)%
Interest expense 925 893 1,238 1,195 1,432 4 (35) 3,056 6,768 (55)
Net interest income 8,909 8,800 8,808 9,355 9,379 1 (5) 26,517 30,601 (13)
Noninterest income
Deposit-related fees 1,416 1,342 1,255 1,333 1,299 6 9 4,013 3,888 3
Lending-related fees 365 362 361 356 352 1 4 1,088 1,025 6
Investment advisory and other asset-based fees 2,882 2,794 2,756 2,598 2,505 3 15 8,432 7,265 16
Commissions and brokerage services fees 525 580 636 589 568 (9) (8) 1,741 1,795 (3) Investment banking fees 547 570 568 486 441 (4) 24 1,685 1,379 22
Card fees 1,078 1,077 949 943 912 — 18 3,104 2,601 19
Mortgage banking 1,259 1,336 1,326 1,207 1,590 (6) (21) 3,921 2,286 72
Net gains (losses) from trading activities 92 21 348 (60) 361 338 (75) 461 1,232 (63) Net gains on debt securities 283 — 151 160 264 NM 7 434 713 (39) Net gains (losses) from equity securities 869 2,696 392 884 649 (68) 34 3,957 (219) NM
Lease income 322 313 315 224 333 3 (3) 950 1,021 (7) Other 287 379 667 414 663 (24) (57) 1,333 2,188 (39)
Total noninterest income 9,925 11,470 9,724 9,134 9,937 (13) — 31,119 25,174 24
Total revenue 18,834 20,270 18,532 18,489 19,316 (7) (2) 57,636 55,775 3
Provision for credit losses (1,395) (1,260) (1,048) (179) 769 (11) NM (3,703) 14,308 NM
Noninterest expense
Personnel 8,690 8,818 9,558 8,948 8,624 (1) 1 27,066 25,863 5
Technology, telecommunications and equipment 741 815 844 838 791 (9) (6) 2,400 2,261 6
Occupancy 738 735 770 826 851 — (13) 2,243 2,437 (8) Operating losses 540 303 213 621 1,219 78 (56) 1,056 2,902 (64) Professional and outside services 1,417 1,450 1,388 1,664 1,760 (2) (19) 4,255 5,042 (16) Leases (1) 220 226 226 227 291 (3) (24) 672 795 (15) Advertising and promotion 153 132 90 138 144 16 6 375 462 (19) Restructuring charges 1 (4) 13 781 718 125 (100) 10 718 (99) Other 803 866 887 759 831 (7) (3) 2,556 2,348 9
Total noninterest expense 13,303 13,341 13,989 14,802 15,229 — (13) 40,633 42,828 (5)
Income (loss) before income tax expense (benefit) 6,926 8,189 5,591 3,866 3,318 (15) 109 20,706 (1,361) NM
Income tax expense (benefit) 1,521 1,445 901 574 (83) 5 NM 3,867 (1,731) NM
Net income before noncontrolling interests 5,405 6,744 4,690 3,292 3,401 (20) 59 16,839 370 NM
Less: Net income from noncontrolling interests 283 704 54 201 185 (60) 53 1,041 84 NM
Wells Fargo net income $ 5,122 6,040 4,636 3,091 3,216 (15) 59 $ 15,798 286 NM
Less: Preferred stock dividends and other 335 297 380 350 315 13 6 1,012 1,241 (18)
Wells Fargo net income (loss) applicable to common stock $ 4,787 5,743 4,256 2,741 2,901 (17) 65 $ 14,786 (955) NM
Per share information
Earnings (loss) per common share $ 1.18 1.39 1.03 0.66 0.70 (15) 69 $ 3.60 (0.23) NM
Diluted earnings (loss) per common share 1.17 1.38 1.02 0.66 0.70 (15) 67 3.57 (0.23) NM
NM – Not meaningful (1) Represents expenses for assets we lease to customers.
-5-

Wells Fargo & Company and Subsidiaries CONSOLIDATED BALANCE SHEET
Sep 30, 2021% Change from
Sep 30, Jun 30, Mar 31, Dec 31, Sep 30, Jun 30, Sep 30,(in millions) 2021 2021 2021 2020 2020 2021 2020
Assets
Cash and due from banks $ 25,509 25,304 28,339 28,236 25,535 1 % —
Interest-earning deposits with banks 241,178 248,869 258,394 236,376 221,235 (3) 9
Total cash, cash equivalents, and restricted cash 266,687 274,173 286,733 264,612 246,770 (3) 8
Federal funds sold and securities purchased under resale agreements 67,807 70,149 79,502 65,672 69,304 (3) (2) Debt securities:
Trading, at fair value 94,943 82,727 72,784 75,095 73,253 15 30
Available-for-sale, at fair value 185,557 189,897 200,850 220,392 220,573 (2) (16) Held-to-maturity, at amortized cost 262,493 260,941 232,192 205,720 182,595 1 44
Loans held for sale 24,811 25,594 35,434 36,384 25,004 (3) (1) Loans 862,827 852,300 861,572 887,637 920,082 1 (6) Allowance for loan losses (13,517) (15,148) (16,928) (18,516) (19,463) 11 31
Net loans 849,310 837,152 844,644 869,121 900,619 1 (6)
Mortgage servicing rights 8,148 8,009 8,832 7,437 7,680 2 6
Premises and equipment, net 8,599 8,745 8,760 8,895 8,977 (2) (4) Goodwill 26,191 26,194 26,290 26,392 26,387 — (1) Derivative assets 27,060 25,415 25,429 25,846 23,715 6 14
Equity securities 66,526 64,547 57,702 60,008 49,348 3 35
Other assets 66,769 72,453 78,112 87,337 86,174 (8) (23)
Total assets
Liabilities
Noninterest-bearing deposits
Interest-bearing deposits
Total deposits
Short-term borrowings
Derivative liabilities
Accrued expenses and other liabilities
Long-term debt
$
$
1,954,901
529,051
941,328
1,470,379
41,980
12,976
75,513
162,982
1,945,996
504,108
936,364
1,440,472
45,635
14,551
72,555
179,656
1,957,264
494,087
943,032
1,437,119
58,920
14,930
74,949
183,312
1,952,911
467,068
937,313
1,404,381
58,999
16,509
74,360
212,950
1,920,399
447,011
936,204
1,383,215
55,224
13,767
70,755
215,711
—
5
1
2
(8) (11)
4
(9)
1
(3) —
—
2
NM
(7) —
(1) 10
(1)
—
2
18
1
6
(24) (6) 7
(24)
1
(4) —
—
9
(57) (8) —
5
138
5
2
Total liabilities
Equity
Wells Fargo stockholders’ equity: Preferred stock
Common stock – $1-2/3 par value, authorized 9,000,000,000 shares; issAdditional paid-in capital Retained earnings
Cumulative other comprehensive income (loss) Treasury stock (1) Unearned ESOP shares
Total Wells Fargo stockholders’ equity
Noncontrolling interests
Total equity
Total liabilities and equity
ued 5,481,811,474 shares
$
1,763,830
20,270
9,136
60,134
175,709
(1,177)
(74,169)
(875)
189,028
2,043
191,071
1,954,901
1,752,869
20,820
9,136
60,018
171,765
(564) (69,038)
(875)
191,262
1,865
193,127
1,945,996
1,769,230
21,170
9,136
59,854
166,458
(1,250) (67,589)
(875)
186,904
1,130
188,034
1,957,264
1,767,199
21,136
9,136
60,197
162,683
194
(67,791) (875)
184,680
1,032
185,712
1,952,911
1,738,672
21,098
9,136
60,035
160,607
(750) (68,384)
(875)
180,867
860
181,727
1,920,399
NM – Not meaningful (1) Number of shares of treasury stock were 1,484,890,493, 1,373,813,200, 1,340,691,115, 1,337,799,931, and 1,349,294,592 at September 30, June 30, and March 31, 2021, and December 31, and September 30, 2020, respectively.
-6-
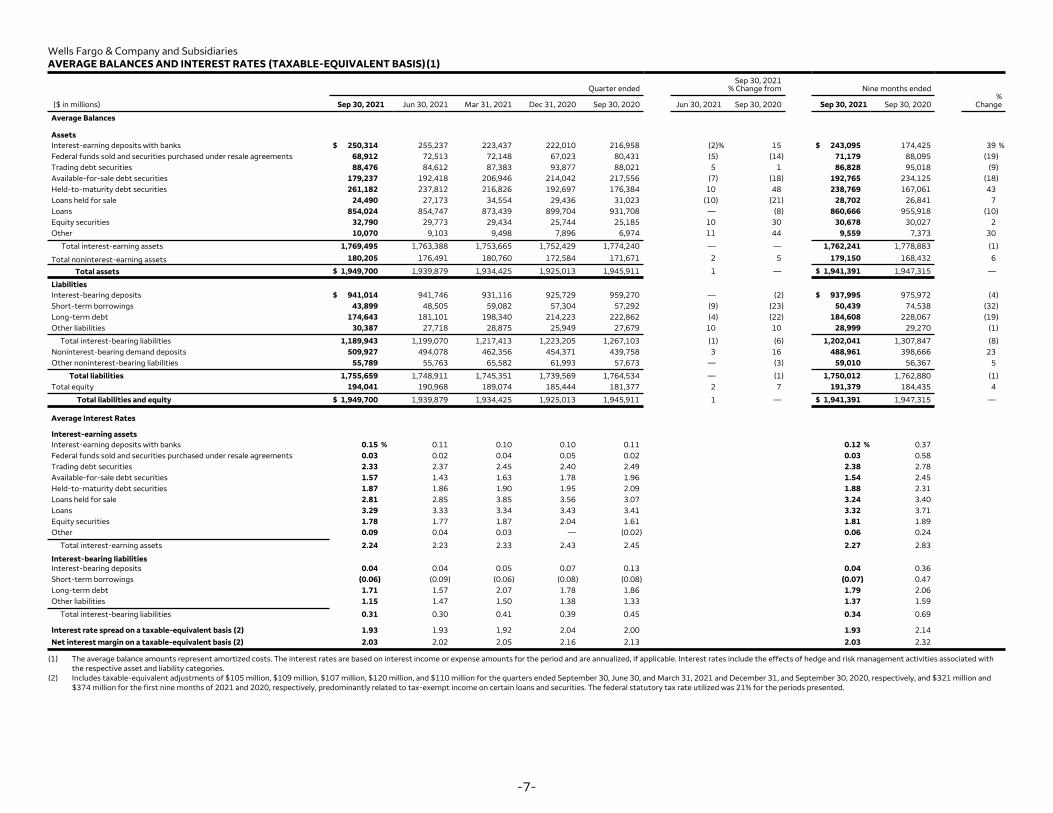
Wells Fargo & Company and Subsidiaries AVERAGE BALANCES AND INTEREST RATES (TAXABLE-EQUIVALENT BASIS)(1)
Quarter ended Sep 30, 2021
% Change from Nine months ended %
($ in millions) Sep 30, 2021 Jun 30, 2021 Mar 31, 2021 Dec 31, 2020 Sep 30, 2020 Jun 30, 2021 Sep 30, 2020 Sep 30, 2021 Sep 30, 2020 Change
Average Balances
Assets Interest-earning deposits with banks $ 250,314 255,237 223,437 222,010 216,958 (2)% 15 $ 243,095 174,425 39 % Federal funds sold and securities purchased under resale agreements 68,912 72,513 72,148 67,023 80,431 (5) (14) 71,179 88,095 (19) Trading debt securities 88,476 84,612 87,383 93,877 88,021 5 1 86,828 95,018 (9) Available-for-sale debt securities 179,237 192,418 206,946 214,042 217,556 (7) (18) 192,765 234,125 (18) Held-to-maturity debt securities 261,182 237,812 216,826 192,697 176,384 10 48 238,769 167,061 43 Loans held for sale 24,490 27,173 34,554 29,436 31,023 (10) (21) 28,702 26,841 7 Loans 854,024 854,747 873,439 899,704 931,708 — (8) 860,666 955,918 (10) Equity securities 32,790 29,773 29,434 25,744 25,185 10 30 30,678 30,027 2 Other 10,070 9,103 9,498 7,896 6,974 11 44 9,559 7,373 30
Total interest-earning assets
Total noninterest-earning assets
1,769,495
180,205
1,763,388
176,491
1,753,665
180,760
1,752,429
172,584
1,774,240
171,671
—
2
—
5
1,762,241
179,150
1,778,883
168,432
(1) 6
Total assets $ 1,949,700 1,939,879 1,934,425 1,925,013 1,945,911 1 — $ 1,941,391 1,947,315 —
Liabilities Interest-bearing deposits $ 941,014 941,746 931,116 925,729 959,270 — (2) $ 937,995 975,972 (4) Short-term borrowings 43,899 48,505 59,082 57,304 57,292 (9) (23) 50,439 74,538 (32) Long-term debt 174,643 181,101 198,340 214,223 222,862 (4) (22) 184,608 228,067 (19) Other liabilities 30,387 27,718 28,875 25,949 27,679 10 10 28,999 29,270 (1)
Total interest-bearing liabilities 1,189,943 1,199,070 1,217,413 1,223,205 1,267,103 (1) (6) 1,202,041 1,307,847 (8) Noninterest-bearing demand deposits 509,927 494,078 462,356 454,371 439,758 3 16 488,961 398,666 23 Other noninterest-bearing liabilities 55,789 55,763 65,582 61,993 57,673 — (3) 59,010 56,367 5
Total liabilities Total equity
1,755,659 194,041
1,748,911 190,968
1,745,351 189,074
1,739,569 185,444
1,764,534 181,377
— 2
(1) 7
1,750,012 191,379
1,762,880 184,435
(1) 4
Total liabilities and equity $ 1,949,700 1,939,879 1,934,425 1,925,013 1,945,911 1 — $ 1,941,391 1,947,315 —
Average Interest Rates
Interest-earning assets Interest-earning deposits with banks 0.15 % 0.11 0.10 0.10 0.11 0.12 % 0.37 Federal funds sold and securities purchased under resale agreements 0.03 0.02 0.04 0.05 0.02 0.03 0.58 Trading debt securities 2.33 2.37 2.45 2.40 2.49 2.38 2.78 Available-for-sale debt securities 1.57 1.43 1.63 1.78 1.96 1.54 2.45 Held-to-maturity debt securities 1.87 1.86 1.90 1.95 2.09 1.88 2.31 Loans held for sale 2.81 2.85 3.85 3.56 3.07 3.24 3.40 Loans 3.29 3.33 3.34 3.43 3.41 3.32 3.71 Equity securities 1.78 1.77 1.87 2.04 1.61 1.81 1.89 Other 0.09 0.04 0.03 — (0.02) 0.06 0.24
Total interest-earning assets 2.24 2.23 2.33 2.43 2.45 2.27 2.83
Interest-bearing liabilities Interest-bearing deposits 0.04 0.04 0.05 0.07 0.13 0.04 0.36 Short-term borrowings (0.06) (0.09) (0.06) (0.08) (0.08) (0.07) 0.47 Long-term debt 1.71 1.57 2.07 1.78 1.86 1.79 2.06 Other liabilities 1.15 1.47 1.50 1.38 1.33 1.37 1.59
Total interest-bearing liabilities 0.31 0.30 0.41 0.39 0.45 0.34 0.69
Interest rate spread on a taxable-equivalent basis (2) 1.93 1.93 1.92 2.04 2.00 1.93 2.14
Net interest margin on a taxable-equivalent basis (2) 2.03 2.02 2.05 2.16 2.13 2.03 2.32
(1) The average balance amounts represent amortized costs. The interest rates are based on interest income or expense amounts for the period and are annualized, if applicable. Interest rates include the effects of hedge and risk management activities associated with the respective asset and liability categories.
(2) Includes taxable-equivalent adjustments of $105 million, $109 million, $107 million, $120 million, and $110 million for the quarters ended September 30, June 30, and March 31, 2021 and December 31, and September 30, 2020, respectively, and $321 million and $374 million for the first nine months of 2021 and 2020, respectively, predominantly related to tax-exempt income on certain loans and securities. The federal statutory tax rate utilized was 21% for the periods presented.
-7-
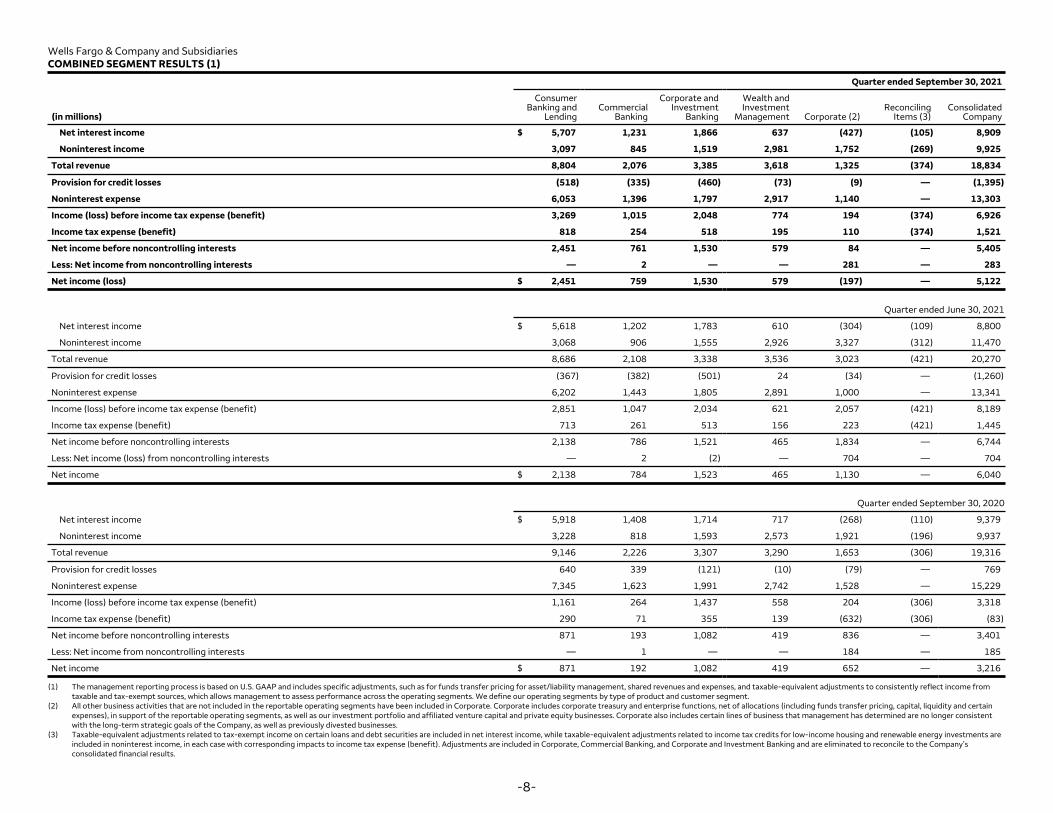
Wells Fargo & Company and Subsidiaries COMBINED SEGMENT RESULTS (1)
Quarter ended September 30, 2021
(in millions)
Consumer Banking and
Lending Commercial
Banking
Corporate andInvestment
Banking
Wealth and Investment
Management Corporate (2) Reconciling
Items (3) Consolidated
Company
Net interest income $ 5,707 1,231 1,866 637 (427) (105) 8,909
Noninterest income 3,097 845 1,519 2,981 1,752 (269) 9,925
Total revenue 8,804 2,076 3,385 3,618 1,325 (374) 18,834
Provision for credit losses (518) (335) (460) (73) (9) — (1,395)
Noninterest expense 6,053 1,396 1,797 2,917 1,140 — 13,303
Income (loss) before income tax expense (benefit) 3,269 1,015 2,048 774 194 (374) 6,926
Income tax expense (benefit) 818 254 518 195 110 (374) 1,521
Net income before noncontrolling interests 2,451 761 1,530 579 84 — 5,405
Less: Net income from noncontrolling interests — 2 — — 281 — 283
Net income (loss) $ 2,451 759 1,530 579 (197) — 5,122
Quarter ended June 30, 2021
Net interest income $ 5,618 1,202 1,783 610 (304) (109) 8,800
Noninterest income 3,068 906 1,555 2,926 3,327 (312) 11,470
Total revenue 8,686 2,108 3,338 3,536 3,023 (421) 20,270
Provision for credit losses (367) (382) (501) 24 (34) — (1,260)
Noninterest expense 6,202 1,443 1,805 2,891 1,000 — 13,341
Income (loss) before income tax expense (benefit) 2,851 1,047 2,034 621 2,057 (421) 8,189
Income tax expense (benefit) 713 261 513 156 223 (421) 1,445
Net income before noncontrolling interests 2,138 786 1,521 465 1,834 — 6,744
Less: Net income (loss) from noncontrolling interests — 2 (2) — 704 — 704
Net income $ 2,138 784 1,523 465 1,130 — 6,040
Quarter ended September 30, 2020
Net interest income $ 5,918 1,408 1,714 717 (268) (110) 9,379
Noninterest income 3,228 818 1,593 2,573 1,921 (196) 9,937
Total revenue 9,146 2,226 3,307 3,290 1,653 (306) 19,316
Provision for credit losses 640 339 (121) (10) (79) — 769
Noninterest expense 7,345 1,623 1,991 2,742 1,528 — 15,229
Income (loss) before income tax expense (benefit) 1,161 264 1,437 558 204 (306) 3,318
Income tax expense (benefit) 290 71 355 139 (632) (306) (83)
Net income before noncontrolling interests 871 193 1,082 419 836 — 3,401
Less: Net income from noncontrolling interests — 1 — — 184 —
Net income $ 871 192 1,082 419 652 — 3,216
(1) The management reporting process is based on U.S. GAAP and includes specific adjustments, such as for funds transfer pricing for asset/liability management, shared revenues and expenses, and taxable-equivalent adjustments to consistently reflect income from taxable and tax-exempt sources, which allows management to assess performance across the operating segments. We define our operating segments by type of product and customer segment.
(2) All other business activities that are not included in the reportable operating segments have been included in Corporate. Corporate includes corporate treasury and enterprise functions, net of allocations (including funds transfer pricing, capital, liquidity and certain expenses), in support of the reportable operating segments, as well as our investment portfolio and affiliated venture capital and private equity businesses. Corporate also includes certain lines of business that management has determined are no longer consistent with the long-term strategic goals of the Company, as well as previously divested businesses.
(3) Taxable-equivalent adjustments related to tax-exempt income on certain loans and debt securities are included in net interest income, while taxable-equivalent adjustments related to income tax credits for low-income housing and renewable energy investments are included in noninterest income, in each case with corresponding impacts to income tax expense (benefit). Adjustments are included in Corporate, Commercial Banking, and Corporate and Investment Banking and are eliminated to reconcile to the Company’s consolidated financial results.
-8-
185
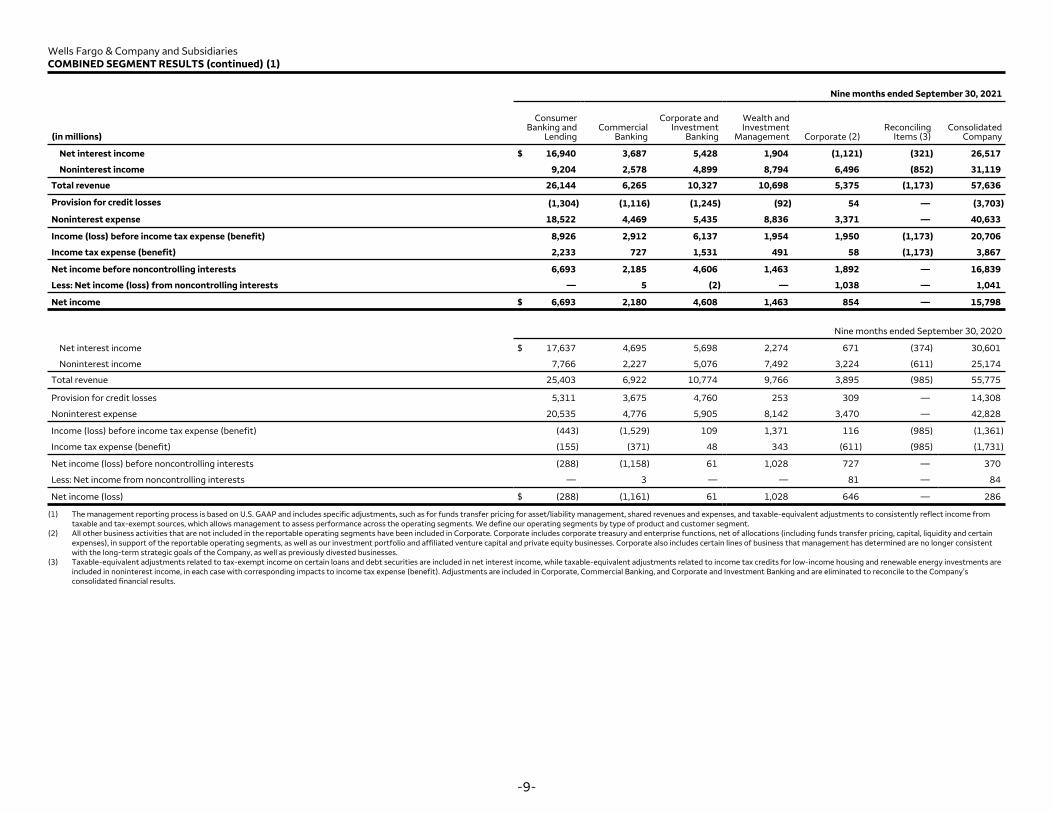
Wells Fargo & Company and Subsidiaries COMBINED SEGMENT RESULTS (continued) (1)
Nine months ended September 30, 2021
(in millions)
Consumer Banking and
Lending Commercial
Banking
Corporate andInvestment
Banking
Wealth and Investment
Management Corporate (2) Reconciling
Items (3) Consolidated
Company
Net interest income $ 16,940 3,687 5,428 1,904 (1,121) (321) 26,517
Noninterest income 9,204 2,578 4,899 8,794 6,496 (852) 31,119
Total revenue 26,144 6,265 10,327 10,698 5,375 (1,173) 57,636
Provision for credit losses (1,304) (1,116) (1,245) (92) 54 — (3,703)
Noninterest expense 18,522 4,469 5,435 8,836 3,371 — 40,633
Income (loss) before income tax expense (benefit) 8,926 2,912 6,137 1,954 1,950 (1,173) 20,706
Income tax expense (benefit) 2,233 727 1,531 491 58 (1,173) 3,867
Net income before noncontrolling interests 6,693 2,185 4,606 1,463 1,892 — 16,839
Less: Net income (loss) from noncontrolling interests — 5 (2) — 1,038 — 1,041
Net income $ 6,693 2,180 4,608 1,463 854 — 15,798
Nine months ended September 30, 2020
Net interest income $ 17,637 4,695 5,698 2,274 671 (374) 30,601
Noninterest income 7,766 2,227 5,076 7,492 3,224 (611) 25,174
Total revenue 25,403 6,922 10,774 9,766 3,895 (985) 55,775
Provision for credit losses 5,311 3,675 4,760 253 309 — 14,308
Noninterest expense 20,535 4,776 5,905 8,142 3,470 — 42,828
Income (loss) before income tax expense (benefit) (443) (1,529) 109 1,371 116 (985) (1,361)
Income tax expense (benefit) (155) (371) 48 343 (611) (985) (1,731)
Net income (loss) before noncontrolling interests (288) (1,158) 61 1,028 727 — 370
Less: Net income from noncontrolling interests — 3 — — 81 — 84
Net income (loss) $ (288) (1,161) 61 1,028 646 —
(1) The management reporting process is based on U.S. GAAP and includes specific adjustments, such as for funds transfer pricing for asset/liability management, shared revenues and expenses, and taxable-equivalent adjustments to consistently reflect income from taxable and tax-exempt sources, which allows management to assess performance across the operating segments. We define our operating segments by type of product and customer segment.
(2) All other business activities that are not included in the reportable operating segments have been included in Corporate. Corporate includes corporate treasury and enterprise functions, net of allocations (including funds transfer pricing, capital, liquidity and certain expenses), in support of the reportable operating segments, as well as our investment portfolio and affiliated venture capital and private equity businesses. Corporate also includes certain lines of business that management has determined are no longer consistent with the long-term strategic goals of the Company, as well as previously divested businesses.
(3) Taxable-equivalent adjustments related to tax-exempt income on certain loans and debt securities are included in net interest income, while taxable-equivalent adjustments related to income tax credits for low-income housing and renewable energy investments are included in noninterest income, in each case with corresponding impacts to income tax expense (benefit). Adjustments are included in Corporate, Commercial Banking, and Corporate and Investment Banking and are eliminated to reconcile to the Company’s consolidated financial results.
-9-
286
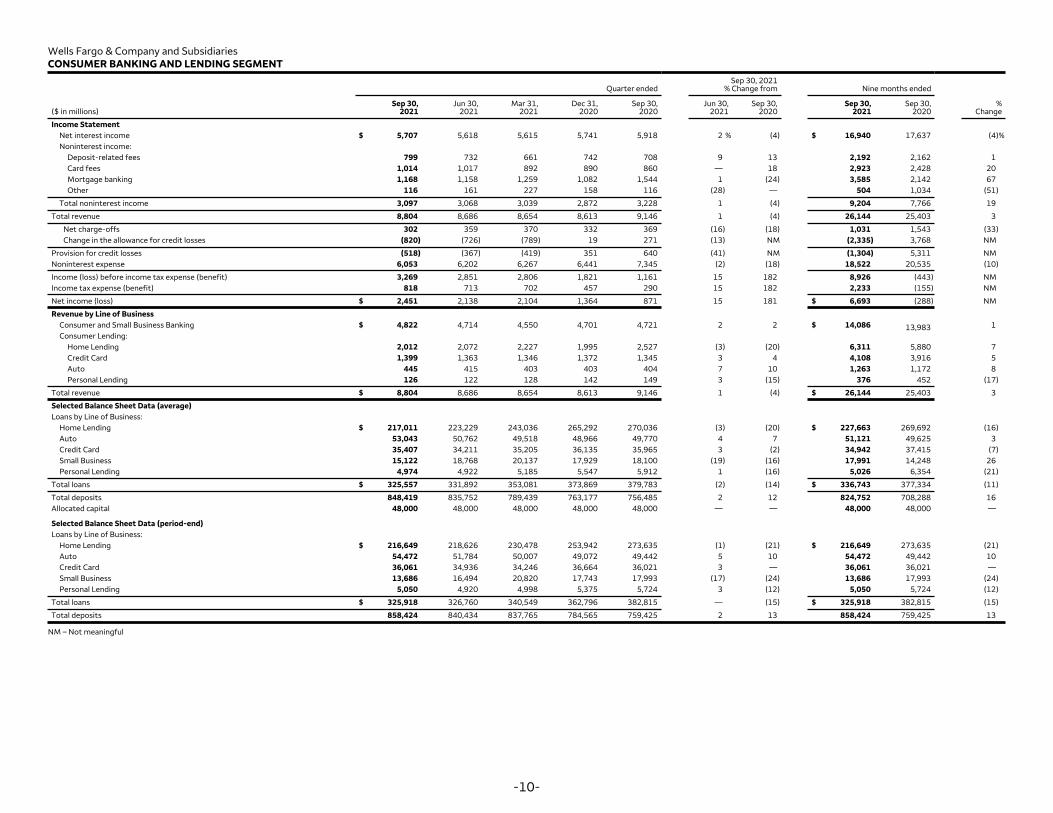
Wells Fargo & Company and Subsidiaries CONSUMER BANKING AND LENDING SEGMENT
Sep 30, 2021 Quarter ended % Change from Nine months ended
Sep 30, Jun 30, Mar 31, Dec 31, Sep 30, Jun 30, Sep 30, Sep 30, Sep 30, % ($ in millions) 2021 2021 2021 2020 2020 2021 2020 2021 2020 Change
Income Statement Net interest income $ 5,707 5,618 5,615 5,741 5,918 2 % (4) $ 16,940 17,637 (4)% Noninterest income:
Deposit-related fees 799 732 661 742 708 9 13 2,192 2,162 1 Card fees 1,014 1,017 892 890 860 — 18 2,923 2,428 20 Mortgage banking 1,168 1,158 1,259 1,082 1,544 1 (24) 3,585 2,142 67 Other 116 161 227 158 116 (28) — 504 1,034 (51)
Total noninterest income 3,097 3,068 3,039 2,872 3,228 1 (4) 9,204 7,766 19
Total revenue 8,804 8,686 8,654 8,613 9,146 1 (4) 26,144 25,403 3
Net charge-offs 302 359 370 332 369 (16) (18) 1,031 1,543 (33) Change in the allowance for credit losses (820) (726) (789) 19 271 (13) NM (2,335) 3,768 NM
Provision for credit losses (518) (367) (419) 351 640 (41) NM (1,304) 5,311 NM Noninterest expense 6,053 6,202 6,267 6,441 7,345 (2) (18) 18,522 20,535 (10)
Income (loss) before income tax expense (benefit) 3,269 2,851 2,806 1,821 1,161 15 182 8,926 (443) NM Income tax expense (benefit) 818 713 702 457 290 15 182 2,233 (155) NM
Net income (loss) $ 2,451 2,138 2,104 1,364 871 15 181 $ 6,693 (288) NM
Revenue by Line of Business Consumer and Small Business Banking $ 4,822 4,714 4,550 4,701 4,721 2 2 $ 14,086 13,983 1 Consumer Lending:
Home Lending 2,012 2,072 2,227 1,995 2,527 (3) (20) 6,311 5,880 7 Credit Card 1,399 1,363 1,346 1,372 1,345 3 4 4,108 3,916 5 Auto 445 415 403 403 404 7 10 1,263 1,172 8 Personal Lending 126 122 128 142 149 3 (15) 376 452 (17)
Total revenue $ 8,804 8,686 8,654 8,613 9,146 1 (4) $ 26,144 25,403 3
Selected Balance Sheet Data (average) Loans by Line of Business:
Home Lending $ 217,011 223,229 243,036 265,292 270,036 (3) (20) $ 227,663 269,692 (16) Auto 53,043 50,762 49,518 48,966 49,770 4 7 51,121 49,625 3 Credit Card 35,407 34,211 35,205 36,135 35,965 3 (2) 34,942 37,415 (7) Small Business 15,122 18,768 20,137 17,929 18,100 (19) (16) 17,991 14,248 26 Personal Lending 4,974 4,922 5,185 5,547 5,912 1 (16) 5,026 6,354 (21)
Total loans $ 325,557 331,892 353,081 373,869 379,783 (2) (14) $ 336,743 377,334 (11)
Total deposits 848,419 835,752 789,439 763,177 756,485 2 12 824,752 708,288 16 Allocated capital 48,000 48,000 48,000 48,000 48,000 — — 48,000 48,000 —
Selected Balance Sheet Data (period-end) Loans by Line of Business:
Home Lending $ 216,649 218,626 230,478 253,942 273,635 (1) (21) $ 216,649 273,635 (21) Auto 54,472 51,784 50,007 49,072 49,442 5 10 54,472 49,442 10 Credit Card 36,061 34,936 34,246 36,664 36,021 3 — 36,061 36,021 — Small Business 13,686 16,494 20,820 17,743 17,993 (17) (24) 13,686 17,993 (24) Personal Lending 5,050 4,920 4,998 5,375 5,724 3 (12) 5,050 5,724 (12)
Total loans $ 325,918 326,760 340,549 362,796 382,815 — (15) $ 325,918 382,815 (15)
Total deposits 858,424 840,434 837,765 784,565 759,425 2 13 858,424 759,425 13
NM – Not meaningful
-10-

Wells Fargo & Company and Subsidiaries CONSUMER BANKING AND LENDING SEGMENT (continued)
Sep 30, 2021 Quarter ended % Change from Nine months ended
Sep 30, Jun 30, Mar 31, Dec 31, Sep 30, Jun 30, Sep 30, Sep 30, Sep 30, % ($ in millions, unless otherwise noted) 2021 2021 2021 2020 2020 2021 2020 2021 2020 Change
Selected Metrics
Consumer Banking and Lending: Return on allocated capital (1) 19.7 % 17.3 17.2 10.7 6.6 18.1 % (1.4) Efficiency ratio (2) 69 71 72 75 80 71 81 Headcount (#) (period-end) 114,334 116,185 123,547 125,034 131,516 114,334 131,516 (2)% (13) (13)%
Retail bank branches (#) 4,796 4,878 4,944 5,032 5,229 4,796 5,229 (2) (8) (8)
Digital active customers (# in millions) (3) 32.7 32.6 32.9 32.0 32.0 32.7 32.0 — 2 2
Mobile active customers (# in millions) (3) 27.0 26.8 26.7 26.0 25.9 27.0 25.9 1 4 4
Consumer and Small Business Banking: Deposit spread (4) 1.5 % 1.5 1.6 1.7 1.8 1.5 % 1.9 Debit card purchase volume ($ in billions) (5) $ 118.6 122.0 108.5 105.3 102.9 $ 349.1 286.6 (3) 15 22
Debit card purchase transactions (# in millions) (5) 2,515 2,504 2,266 2,297 2,273 7,285 6,495 — 11 12
Home Lending: Mortgage banking:
Net servicing income $ 109 (76) (123) (82) 331 $ (90) (78) 243 (67) (15)
Net gains on mortgage loan originations/sales 1,059 1,234 1,382 1,164 1,213 (14) (13) 3,675 2,220 66
Total mortgage banking $ 1,168 1,158 1,259 1,082 1,544 1 (24) $ 3,585 2,142
Originations ($ in billions): Retail $ 35.2 36.9 33.6 32.3 32.8 $ 105.7 86.4 (5) 7 22
Correspondent 16.7 16.3 18.2 21.6 28.8 2 (42) 51.2 82.4 (38)
Total originations $ 51.9 53.2 51.8 53.9 61.6 (2) (16) $ 156.9 168.8 (7)
% of originations held for sale (HFS) 60.6 % 65.6 75.8 75.2 78.1 67.3 % 73.2 Third party mortgage loans serviced (period-end) ($ in billions) (6) $ 739.5 769.4 801.0 856.7 917.6 $ 739.5 917.6 (4) (19) (19)
Mortgage servicing rights (MSR) carrying value (period-end) 6,862 6,717 7,536 6,125 6,355 6,862 6,355 2 8 8
Ratio of MSR carrying value (period-end) to third party mortgage loans serviced 0.93 % 0.87 0.94 0.71 0.69 0.93 % 0.69 Home lending loans 30+ days or more delinquency rate (7)(8) 0.45 0.51 0.56 0.64 0.56 0.45 0.56
Credit Card: Point of sale (POS) volume ($ in billions) $ 26.5 25.5 21.1 22.9 21.3 $ 73.1 58.7 4 24 25
New accounts (# in thousands) (9) 526 323 266 240 212 1,115 782 63 148 43
Credit card loans 30+ days or more delinquency rate (8) 1.40 % 1.46 2.01 2.17 1.76 1.40 % 1.76
Auto: Auto originations ($ in billions) $ 9.2 8.3 7.0 5.3 5.4 $ 24.5 17.5 11 70 40
Auto loans 30+ days or more delinquency rate (8) 1.46 % 1.30 1.22 1.77 1.67 1.46 % 1.67
Personal Lending: New funded balances $ 731 565 413 294 323 29 126 $ 1,709 1,305 31
(1) Return on allocated capital is segment net income (loss) applicable to common stock divided by segment average allocated capital. Segment net income (loss) applicable to common stock is segment net income (loss) less allocated preferred stock dividends. (2) Efficiency ratio is segment noninterest expense divided by segment total revenue (net interest income and noninterest income). (3) Digital and mobile active customers is the number of consumer and small business customers who have logged on via a digital or mobile device, respectively, in the prior 90 days. Digital active customers includes both online and mobile customers. (4) Deposit spread is (i) the internal funds transfer pricing credit on segment deposits minus interest paid to customers for segment deposits, divided by (ii) average segment deposits. (5) Debit card purchase volume and transactions reflect combined activity for both consumer and business debit card purchases. (6) Excludes residential mortgage loans subserviced for others. (7) Excludes residential mortgage loans insured by the Federal Housing Administration (FHA) or guaranteed by the Department of Veterans Affairs (VA) and loans held for sale. (8) Beginning in second quarter 2020, customer payment deferral activities instituted in response to the COVID-19 pandemic may have delayed the recognition of delinquencies for those customers who would have otherwise moved into past due status. (9) Excludes certain private label new account openings.
-11-
67

Wells Fargo & Company and Subsidiaries COMMERCIAL BANKING SEGMENT
Sep 30, 2021 Quarter ended % Change from Nine months ended
Sep 30, Jun 30, Mar 31, Dec 31, Sep 30, Jun 30, Sep 30, Sep 30, Sep 30, % ($ in millions) 2021 2021 2021 2020 2020 2021 2020 2021 2020 Change
Income Statement
Net interest income $ 1,231 1,202 1,254 1,439 1,408 2 % (13) $ 3,687 4,695 (21)%
Noninterest income:
Deposit-related fees 323 325 317 311 309 (1) 5 965 908 6
Lending-related fees 132 135 136 138 140 (2) (6) 403 393 3
Lease income 165 173 174 73 186 (5) (11) 512 573 (11)
Other 225 273 200 292 183 (18) 23 698 353 98
Total noninterest income 845 906 827 814 818 (7) 3 2,578 2,227 16
Total revenue 2,076 2,108 2,081 2,253 2,226 (2) (7) 6,265 6,922 (9)
Net charge-offs 16 53 39 81 219 (70) (93) 108 509 (79)
Change in the allowance for credit losses (351) (435) (438) (12) 120 19 NM (1,224) 3,166 NM
Provision for credit losses (335) (382) (399) 69 339 12 NM (1,116) 3,675 NM
Noninterest expense 1,396 1,443 1,630 1,547 1,623 (3) (14) 4,469 4,776 (6)
Income (loss) before income tax expense (benefit) 1,015 1,047 850 637 264 (3) 284 2,912 (1,529) 290
Income tax expense (benefit) 254 261 212 163 71 (3) 258 727 (371) 296
Less: Net income from noncontrolling interests 2 2 1 2 1 — 100 5 3 67
Net income (loss) $ 759 784 637 472 192 (3) 295 $ 2,180 (1,161) 288
Revenue by Line of Business
Middle Market Banking $ 1,165 1,151 1,159 1,149 1,196 1 (3) $ 3,475 3,918 (11)
Asset-Based Lending and Leasing 911 957 922 1,104 1,030 (5) (12) 2,790 3,004 (7)
Total revenue $ 2,076 2,108 2,081 2,253 2,226 (2) (7) $ 6,265 6,922 (9)
Revenue by Product
Lending and leasing $ 1,190 1,207 1,202 1,262 1,335 (1) (11) $ 3,599 4,170 (14)
Treasury management and payments 713 680 721 733 749 5 (5) 2,114 2,472 (14)
Other 173 221 158 258 142 (22) 22 552 280 97
Total revenue $ 2,076 2,108 2,081 2,253 2,226 (2) (7) $ 6,265 6,922 (9)
Selected Metrics
Return on allocated capital 14.5 % 15.2 12.3 8.6 2.9 14.0 % (9.0)
Efficiency ratio 67 68 78 69 73 71 69
Headcount (#) (period-end) 18,638 19,647 20,486 20,241 21,900 (5) (15) 18,638 21,900 (15)
NM – Not meaningful
-12-

Wells Fargo & Company and Subsidiaries COMMERCIAL BANKING SEGMENT (continued)
Sep 30, 2021 Quarter ended % Change from Nine months ended
Sep 30, Jun 30, Mar 31, Dec 31, Sep 30, Jun 30, Sep 30, Sep 30, Sep 30, % ($ in millions) 2021 2021 2021 2020 2020 2021 2020 2021 2020 Change
Selected Balance Sheet Data (average)
Loans:
Commercial and industrial
Commercial real estate
Lease financing and other
$ 118,039
46,576
14,007
117,585
47,203
13,784
120,929
48,574
13,640
125,525
50,441
14,937
134,531
52,017
15,345
— %
(1)
2
(12)
(10)
(9)
$ 118,840
47,444
13,812
149,220
52,818
16,293
(20)%
(10)
(15)
Total loans $ 178,622 178,572 183,143 190,903 201,893 — (12) $ 180,096 218,331 (18)
Loans by Line of Business:
Middle Market Banking
Asset-Based Lending and Leasing
$ 101,523
77,099
102,054
76,518
104,379
78,764
102,692
88,211
110,289
91,604
(1)
1
(8)
(16)
$ 102,642
77,454
116,258
102,073
(12)
(24)
Total loans $ 178,622 178,572 183,143 190,903 201,893 — (12) $ 180,096 218,331 (18)
Total deposits
Allocated capital
199,226
19,500
192,586
19,500
189,364
19,500
184,864
19,500
178,997
19,500
3
—
11
—
193,761
19,500
176,959
19,500
9
—
Selected Balance Sheet Data (period-end)
Loans:
Commercial and industrial
Commercial real estate
Lease financing and other
$ 120,203
46,318
14,018
117,782
46,905
14,218
119,322
47,832
13,534
124,253
49,903
14,821
128,270
51,297
15,180
2
(1)
(1)
(6)
(10)
(8)
$ 120,203
46,318
14,018
128,270
51,297
15,180
(6)
(10)
(8)
Total loans $ 180,539 178,905 180,688 188,977 194,747 1 (7) $ 180,539 194,747 (7)
Loans by Line of Business:
Middle Market Banking
Asset-Based Lending and Leasing
$ 102,279
78,260
102,062
76,843
102,372
78,316
101,193
87,784
105,851
88,896
—
2
(3)
(12)
$ 102,279
78,260
105,851
88,896
(3)
(12)
Total loans $ 180,539 178,905 180,688 188,977 194,747 1 (7) $ 180,539 194,747 (7)
Total deposits 204,853 197,461 191,948 188,292 180,948 4 13 204,853 180,948 13
-13-
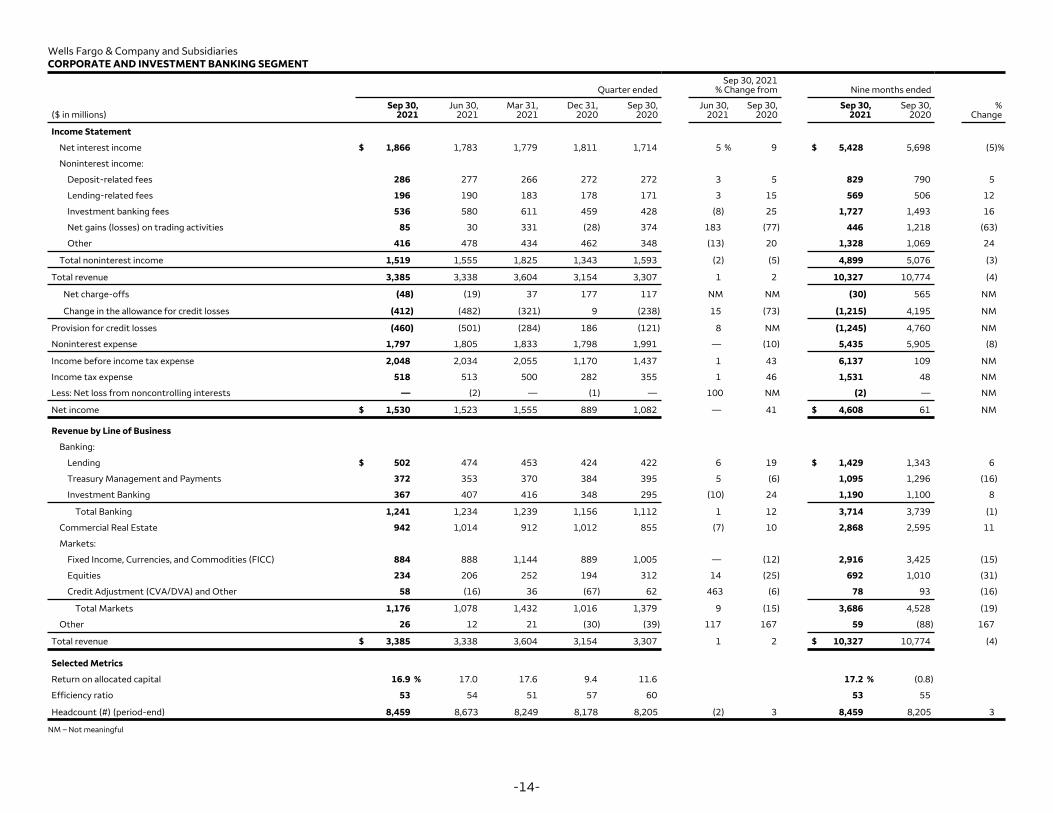
Wells Fargo & Company and Subsidiaries CORPORATE AND INVESTMENT BANKING SEGMENT
Sep 30, 2021 Quarter ended % Change from Nine months ended
Sep 30, Jun 30, Mar 31, Dec 31, Sep 30, Jun 30, Sep 30, Sep 30, Sep 30, % ($ in millions) 2021 2021 2021 2020 2020 2021 2020 2021 2020 Change
Income Statement
Net interest income $ 1,866 1,783 1,779 1,811 1,714 5 % 9 $ 5,428 5,698 (5)%
Noninterest income:
Deposit-related fees 286 277 266 272 272 3 5 829 790 5
Lending-related fees 196 190 183 178 171 3 15 569 506 12
Investment banking fees 536 580 611 459 428 (8) 25 1,727 1,493 16
Net gains (losses) on trading activities 85 30 331 (28) 374 183 (77) 446 1,218 (63)
Other 416 478 434 462 348 (13) 20 1,328 1,069 24
Total noninterest income 1,519 1,555 1,825 1,343 1,593 (2) (5) 4,899 5,076 (3)
Total revenue 3,385 3,338 3,604 3,154 3,307 1 2 10,327 10,774 (4)
Net charge-offs (48) (19) 37 177 117 NM NM (30) 565 NM
Change in the allowance for credit losses (412) (482) (321) 9 (238) 15 (73) (1,215) 4,195 NM
Provision for credit losses (460) (501) (284) 186 (121) 8 NM (1,245) 4,760 NM
Noninterest expense 1,797 1,805 1,833 1,798 1,991 — (10) 5,435 5,905 (8)
Income before income tax expense 2,048 2,034 2,055 1,170 1,437 1 43 6,137 109 NM
Income tax expense 518 513 500 282 355 1 46 1,531 48 NM
Less: Net loss from noncontrolling interests — (2) — (1) — 100 NM (2) — NM
Net income $ 1,530 1,523 1,555 889 1,082 — 41 $ 4,608 61 NM
Revenue by Line of Business
Banking:
Lending $ 502 474 453 424 422 6 19 $ 1,429 1,343 6
Treasury Management and Payments 372 353 370 384 395 5 (6) 1,095 1,296 (16)
Investment Banking 367 407 416 348 295 (10) 24 1,190 1,100 8
Total Banking 1,241 1,234 1,239 1,156 1,112 1 12 3,714 3,739 (1)
Commercial Real Estate 942 1,014 912 1,012 855 (7) 10 2,868 2,595 11
Markets:
Fixed Income, Currencies, and Commodities (FICC) 884 888 1,144 889 1,005 — (12) 2,916 3,425 (15)
Equities 234 206 252 194 312 14 (25) 692 1,010 (31)
Credit Adjustment (CVA/DVA) and Other 58 (16) 36 (67) 62 463 (6) 78 93 (16)
Total Markets 1,176 1,078 1,432 1,016 1,379 9 (15) 3,686 4,528 (19)
Other 26 12 21 (30) (39) 117 167 59 (88) 167
Total revenue $ 3,385 3,338 3,604 3,154 3,307 1 2 $ 10,327 10,774 (4)
Selected Metrics
Return on allocated capital 16.9 % 17.0 17.6 9.4 11.6 17.2 % (0.8)
Efficiency ratio 53 54 51 57 60 53 55
Headcount (#) (period-end) 8,459 8,673 8,249 8,178 8,205 (2) 3 8,459 8,205 3
NM – Not meaningful
-14-

Wells Fargo & Company and Subsidiaries CORPORATE AND INVESTMENT BANKING SEGMENT (continued)
Sep 30, 2021 Quarter ended % Change from Nine months ended
Sep 30, Jun 30, Mar 31, Dec 31, Sep 30, Jun 30, Sep 30, Sep 30, Sep 30, % ($ in millions) 2021 2021 2021 2020 2020 2021 2020 2021 2020 Change
Selected Balance Sheet Data (average)
Loans:
Commercial and industrial
Commercial real estate
$ 170,486
86,809
167,076
85,346
162,290
83,858
155,669
84,175
165,445
84,408
2 %
2
3
3
$ 166,647
85,349
178,140
82,382
(6)%
4
Total loans $ 257,295 252,422 246,148 239,844 249,853 2 3 $ 251,996 260,522 (3)
Loans by Line of Business:
Banking
Commercial Real Estate
Markets
$ 95,911
110,683
50,701
90,839
108,893
52,690
86,536
107,609
52,003
82,413
107,838
49,593
88,936
109,482
51,435
6
2
(4)
8
1
(1)
$ 91,130
109,073
51,793
97,224
108,428
54,870
(6)
1
(6)
Total loans $ 257,295 252,422 246,148 239,844 249,853 2 3 $ 251,996 260,522 (3)
Trading-related assets:
Trading account securities
Reverse repurchase agreements/securities borrowed
Derivative assets
$ 112,148
56,758
25,191
104,743
62,066
24,731
106,358
63,965
27,102
108,972
57,835
23,604
100,193
68,818
23,640
7
(9)
2
12
(18)
7
$ 107,771
60,903
25,668
110,082
76,069
21,443
(2)
(20)
20
Total trading-related assets $ 194,097 191,540 197,425 190,411 192,651 1 1 $ 194,342 207,594 (6)
Total assets
Total deposits
Allocated capital
524,124
189,424
34,000
513,414
190,810
34,000
511,528
194,501
34,000
495,994
205,797
34,000
503,627
226,129
34,000
2
(1)
—
4
(16)
—
516,401
191,560
34,000
530,082
243,913
34,000
(3)
(21)
—
Selected Balance Sheet Data (period-end)
Loans:
Commercial and industrial
Commercial real estate
$ 177,002
86,955
166,969
86,290
163,808
84,836
160,000
84,456
157,193
83,920
6
1
13
4
$ 177,002
86,955
157,193
83,920
13
4
Total loans $ 263,957 253,259 248,644 244,456 241,113 4 9 $ 263,957 241,113 9
Loans by Line of Business:
Banking
Commercial Real Estate
Markets
$ 99,683
112,050
52,224
92,758
108,885
51,616
88,042
108,508
52,094
84,640
107,207
52,609
83,128
108,240
49,745
7
3
1
20
4
5
$ 99,683
112,050
52,224
83,128
108,240
49,745
20
4
5
Total loans $ 263,957 253,259 248,644 244,456 241,113 4 9 $ 263,957 241,113 9
Trading-related assets:
Trading account securities
Reverse repurchase agreements/securities borrowed
Derivative assets
$ 114,187
55,123
27,096
108,291
57,351
25,288
100,586
71,282
24,228
109,311
57,248
25,916
100,157
61,027
23,844
5
(4)
7
14
(10)
14
$ 114,187
55,123
27,096
100,157
61,027
23,844
14
(10)
14
Total trading-related assets $ 196,406 190,930 196,096 192,475 185,028 3 6 $ 196,406 185,028 6
Total assets
Total deposits
535,385
191,786
516,518
188,219
512,045
188,920
508,518
203,004
490,373
212,532
4
2
9
(10)
535,385
191,786
490,373
212,532
9
(10)
-15-
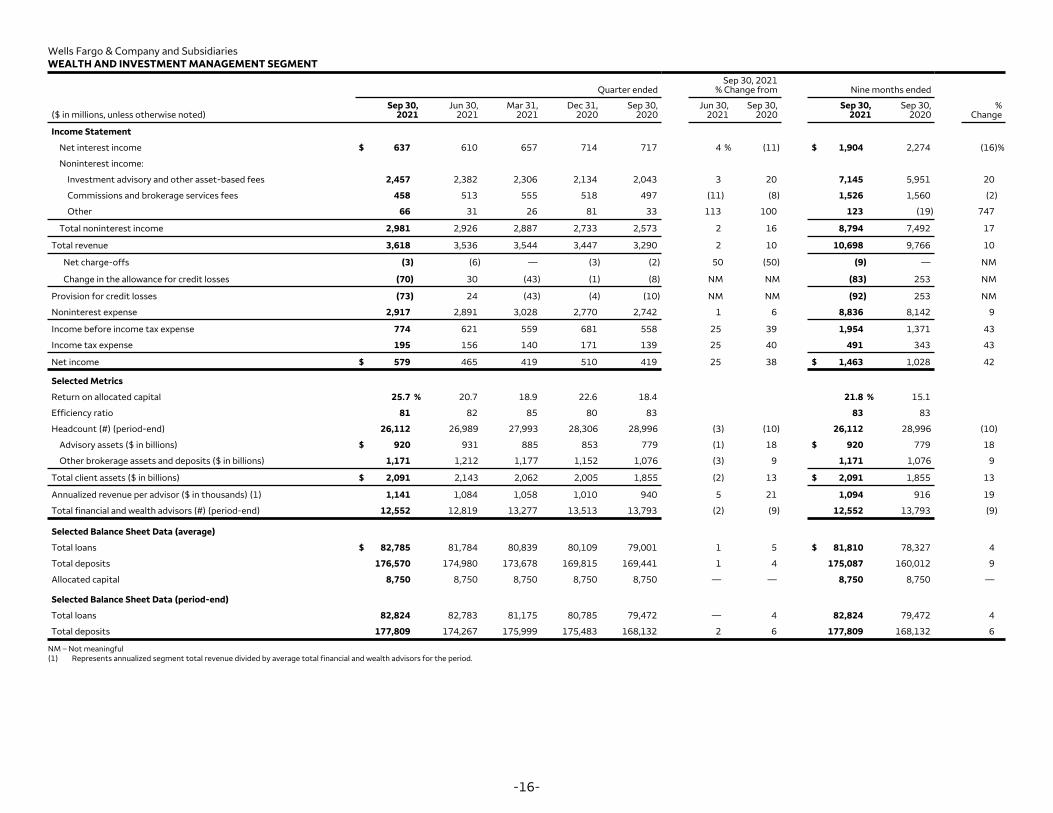
Wells Fargo & Company and Subsidiaries WEALTH AND INVESTMENT MANAGEMENT SEGMENT
Sep 30, 2021 Quarter ended % Change from Nine months ended
Sep 30, Jun 30, Mar 31, Dec 31, Sep 30, Jun 30, Sep 30, Sep 30, Sep 30, % ($ in millions, unless otherwise noted) 2021 2021 2021 2020 2020 2021 2020 2021 2020 Change
Income Statement
Net interest income $ 637 610 657 714 717 4 % (11) $ 1,904 2,274 (16)%
Noninterest income:
Investment advisory and other asset-based fees 2,457 2,382 2,306 2,134 2,043 3 20 7,145 5,951 20
Commissions and brokerage services fees 458 513 555 518 497 (11) (8) 1,526 1,560 (2)
Other 66 31 26 81 33 113 100 123 (19) 747
Total noninterest income 2,981 2,926 2,887 2,733 2,573 2 16 8,794 7,492 17
Total revenue 3,618 3,536 3,544 3,447 3,290 2 10 10,698 9,766 10
Net charge-offs (3) (6) — (3) (2) 50 (50) (9) — NM
Change in the allowance for credit losses (70) 30 (43) (1) (8) NM NM (83) 253 NM
Provision for credit losses (73) 24 (43) (4) (10) NM NM (92) 253 NM
Noninterest expense 2,917 2,891 3,028 2,770 2,742 1 6 8,836 8,142 9
Income before income tax expense 774 621 559 681 558 25 39 1,954 1,371 43
Income tax expense 195 156 140 171 139 25 40 491 343 43
Net income $ 579 465 419 510 419 25 38 $ 1,463 1,028 42
Selected Metrics
Return on allocated capital 25.7 % 20.7 18.9 22.6 18.4 21.8 % 15.1
Efficiency ratio 81 82 85 80 83 83 83
Headcount (#) (period-end) 26,112 26,989 27,993 28,306 28,996 (3) (10) 26,112 28,996 (10)
Advisory assets ($ in billions) $ 920 931 885 853 779 (1) 18 $ 920 779 18
Other brokerage assets and deposits ($ in billions) 1,171 1,212 1,177 1,152 1,076 (3) 9 1,171 1,076 9
Total client assets ($ in billions) $ 2,091 2,143 2,062 2,005 1,855 (2) 13 $ 2,091 1,855 13
Annualized revenue per advisor ($ in thousands) (1) 1,141 1,084 1,058 1,010 940 5 21 1,094 916 19
Total financial and wealth advisors (#) (period-end) 12,552 12,819 13,277 13,513 13,793 (2) (9) 12,552 13,793 (9)
Selected Balance Sheet Data (average)
Total loans $ 82,785 81,784 80,839 80,109 79,001 1 5 $ 81,810 78,327 4
Total deposits 176,570 174,980 173,678 169,815 169,441 1 4 175,087 160,012 9
Allocated capital 8,750 8,750 8,750 8,750 8,750 — — 8,750 8,750 —
Selected Balance Sheet Data (period-end)
Total loans 82,824 82,783 81,175 80,785 79,472 — 4 82,824 79,472 4
Total deposits 177,809 174,267 175,999 175,483 168,132 2 6 177,809 168,132 6
NM – Not meaningful (1) Represents annualized segment total revenue divided by average total financial and wealth advisors for the period.
-16-
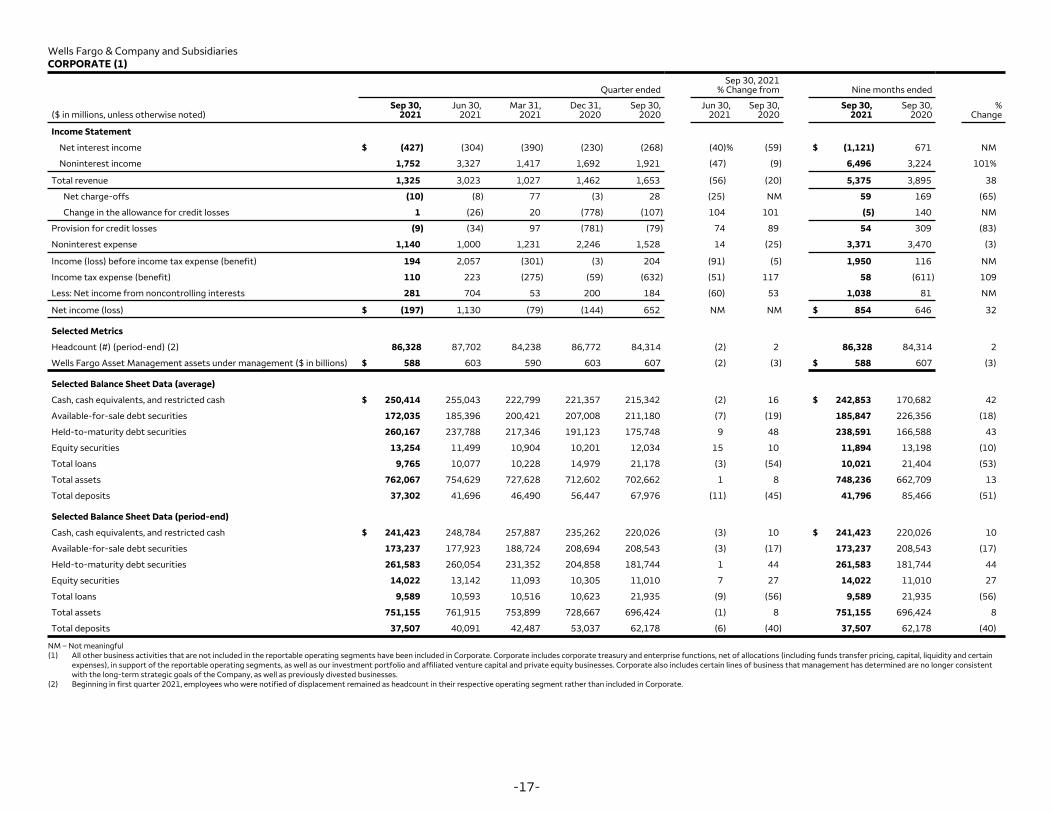
Wells Fargo & Company and Subsidiaries CORPORATE (1)
Sep 30, 2021 Quarter ended % Change from Nine months ended
Sep 30, Jun 30, Mar 31, Dec 31, Sep 30, Jun 30, Sep 30, Sep 30, Sep 30, % ($ in millions, unless otherwise noted) 2021 2021 2021 2020 2020 2021 2020 2021 2020 Change
Income Statement
Net interest income $ (427) (304) (390) (230) (268) (40)% (59) $ (1,121) 671 NM
Noninterest income 1,752 3,327 1,417 1,692 1,921 (47) (9) 6,496 3,224 101%
Total revenue 1,325 3,023 1,027 1,462 1,653 (56) (20) 5,375 3,895 38
Net charge-offs (10) (8) 77 (3) 28 (25) NM 59 169 (65)
Change in the allowance for credit losses 1 (26) 20 (778) (107) 104 101 (5) 140 NM
Provision for credit losses (9) (34) 97 (781) (79) 74 89 54 309 (83)
Noninterest expense 1,140 1,000 1,231 2,246 1,528 14 (25) 3,371 3,470 (3)
Income (loss) before income tax expense (benefit) 194 2,057 (301) (3) 204 (91) (5) 1,950 116 NM
Income tax expense (benefit) 110 223 (275) (59) (632) (51) 117 58 (611) 109
Less: Net income from noncontrolling interests 281 704 53 200 184 (60) 53 1,038 81 NM
Net income (loss) $ (197) 1,130 (79) (144) 652 NM NM $ 854 646 32
Selected Metrics
Headcount (#) (period-end) (2) 86,328 87,702 84,238 86,772 84,314 (2) 2 86,328 84,314 2
Wells Fargo Asset Management assets under management ($ in billions) $ 588 603 590 603 607 (2) (3) $ 588 607 (3)
Selected Balance Sheet Data (average)
Cash, cash equivalents, and restricted cash $ 250,414 255,043 222,799 221,357 215,342 (2) 16 $ 242,853 170,682 42
Available-for-sale debt securities 172,035 185,396 200,421 207,008 211,180 (7) (19) 185,847 226,356 (18)
Held-to-maturity debt securities 260,167 237,788 217,346 191,123 175,748 9 48 238,591 166,588 43
Equity securities 13,254 11,499 10,904 10,201 12,034 15 10 11,894 13,198 (10)
Total loans 9,765 10,077 10,228 14,979 21,178 (3) (54) 10,021 21,404 (53)
Total assets 762,067 754,629 727,628 712,602 702,662 1 8 748,236 662,709 13
Total deposits 37,302 41,696 46,490 56,447 67,976 (11) (45) 41,796 85,466 (51)
Selected Balance Sheet Data (period-end)
Cash, cash equivalents, and restricted cash $ 241,423 248,784 257,887 235,262 220,026 (3) 10 $ 241,423 220,026 10
Available-for-sale debt securities 173,237 177,923 188,724 208,694 208,543 (3) (17) 173,237 208,543 (17)
Held-to-maturity debt securities 261,583 260,054 231,352 204,858 181,744 1 44 261,583 181,744 44
Equity securities 14,022 13,142 11,093 10,305 11,010 7 27 14,022 11,010 27
Total loans 9,589 10,593 10,516 10,623 21,935 (9) (56) 9,589 21,935 (56)
Total assets 751,155 761,915 753,899 728,667 696,424 (1) 8 751,155 696,424 8
Total deposits 37,507 40,091 42,487 53,037 62,178 (6) (40) 37,507 62,178 (40)
NM – Not meaningful (1) All other business activities that are not included in the reportable operating segments have been included in Corporate. Corporate includes corporate treasury and enterprise functions, net of allocations (including funds transfer pricing, capital, liquidity and certain
expenses), in support of the reportable operating segments, as well as our investment portfolio and affiliated venture capital and private equity businesses. Corporate also includes certain lines of business that management has determined are no longer consistent with the long-term strategic goals of the Company, as well as previously divested businesses.
(2) Beginning in first quarter 2021, employees who were notified of displacement remained as headcount in their respective operating segment rather than included in Corporate.
-17-
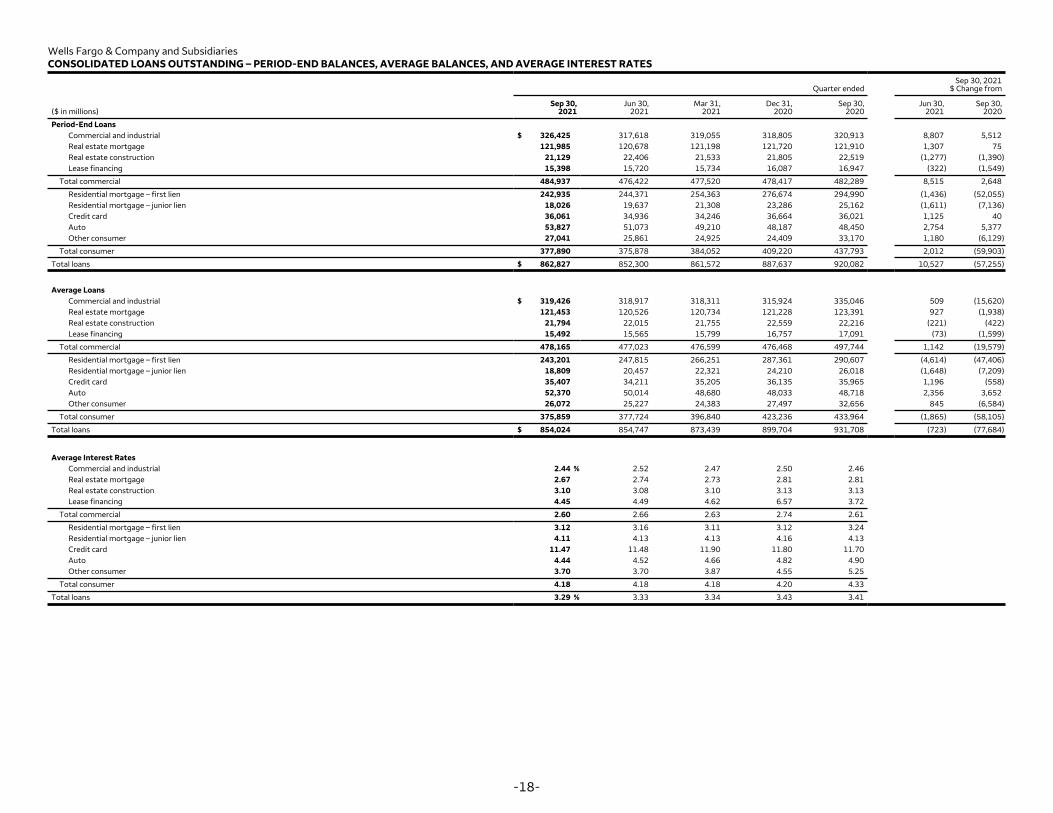
Wells Fargo & Company and Subsidiaries CONSOLIDATED LOANS OUTSTANDING – PERIOD-END BALANCES, AVERAGE BALANCES, AND AVERAGE INTEREST RATES
Quarter ended Sep 30, 2021
$ Change from
($ in millions) Sep 30,
2021 Jun 30,
2021 Mar 31,
2021 Dec 31,
2020 Sep 30,
2020 Jun 30, Sep 30,
2021 2020
Period-End Loans Commercial and industrial $ 326,425 317,618 319,055 318,805 320,913 8,807 5,512 Real estate mortgage 121,985 120,678 121,198 121,720 121,910 1,307 75 Real estate construction 21,129 22,406 21,533 21,805 22,519 (1,277) (1,390) Lease financing 15,398 15,720 15,734 16,087 16,947 (322) (1,549)
Total commercial 484,937 476,422 477,520 478,417 482,289 8,515 2,648
Residential mortgage – first lien 242,935 244,371 254,363 276,674 294,990 (1,436) (52,055) Residential mortgage – junior lien 18,026 19,637 21,308 23,286 25,162 (1,611) (7,136) Credit card 36,061 34,936 34,246 36,664 36,021 1,125 40 Auto 53,827 51,073 49,210 48,187 48,450 2,754 5,377 Other consumer 27,041 25,861 24,925 24,409 33,170 1,180 (6,129)
Total consumer 377,890 375,878 384,052 409,220 437,793 2,012 (59,903)
Total loans $ 862,827 852,300 861,572 887,637 920,082 10,527 (57,255)
Average Loans Commercial and industrial $ 319,426 318,917 318,311 315,924 335,046 509 (15,620) Real estate mortgage 121,453 120,526 120,734 121,228 123,391 927 (1,938) Real estate construction 21,794 22,015 21,755 22,559 22,216 (221) (422) Lease financing 15,492 15,565 15,799 16,757 17,091 (73) (1,599)
Total commercial 478,165 477,023 476,599 476,468 497,744 1,142 (19,579)
Residential mortgage – first lien 243,201 247,815 266,251 287,361 290,607 (4,614) (47,406) Residential mortgage – junior lien 18,809 20,457 22,321 24,210 26,018 (1,648) (7,209) Credit card 35,407 34,211 35,205 36,135 35,965 1,196 (558) Auto 52,370 50,014 48,680 48,033 48,718 2,356 3,652 Other consumer 26,072 25,227 24,383 27,497 32,656 845 (6,584)
Total consumer 375,859 377,724 396,840 423,236 433,964 (1,865) (58,105)
Total loans $ 854,024 854,747 873,439 899,704 931,708 (723) (77,684)
Average Interest Rates Commercial and industrial 2.44 % 2.52 2.47 2.50 2.46 Real estate mortgage 2.67 2.74 2.73 2.81 2.81 Real estate construction 3.10 3.08 3.10 3.13 3.13 Lease financing 4.45 4.49 4.62 6.57 3.72
Total commercial 2.60 2.66 2.63 2.74 2.61
Residential mortgage – first lien 3.12 3.16 3.11 3.12 3.24 Residential mortgage – junior lien 4.11 4.13 4.13 4.16 4.13 Credit card 11.47 11.48 11.90 11.80 11.70 Auto 4.44 4.52 4.66 4.82 4.90 Other consumer 3.70 3.70 3.87 4.55 5.25
Total consumer 4.18 4.18 4.18 4.20 4.33
Total loans 3.29 % 3.33 3.34 3.43 3.41
-18-
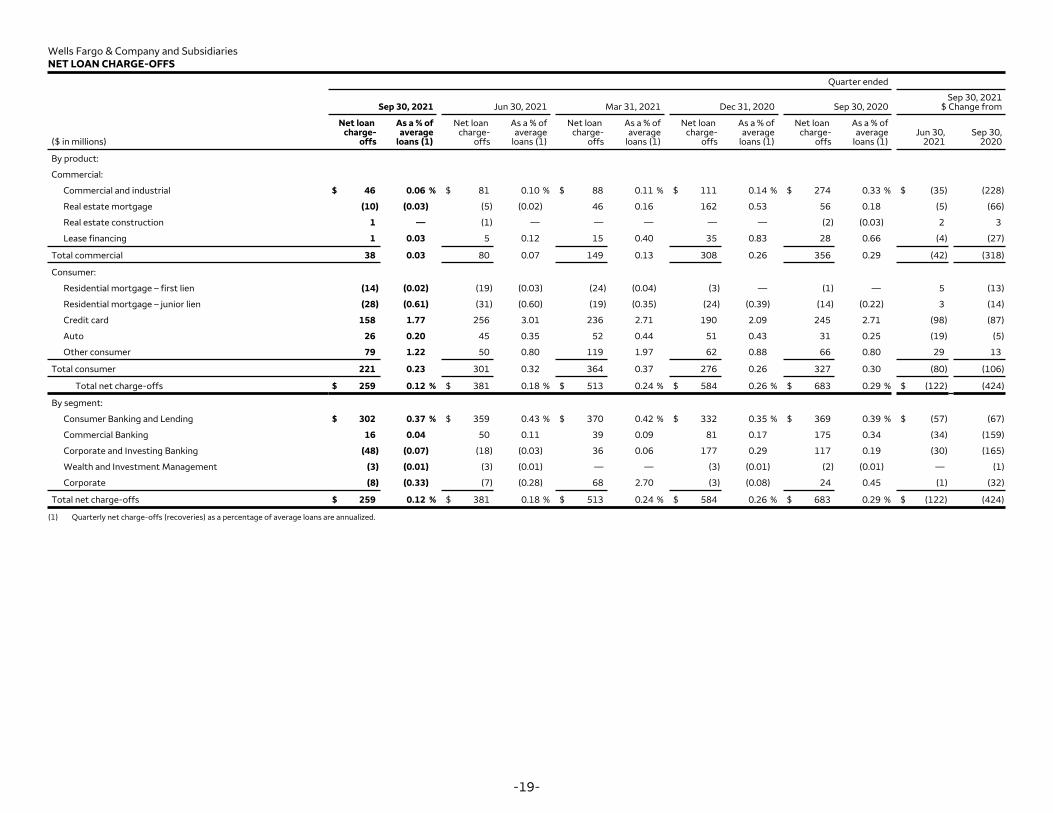
Wells Fargo & Company and Subsidiaries NET LOAN CHARGE-OFFS
Quarter ended
Sep 30, 2021 Jun 30, 2021 Mar 31, 2021 Dec 31, 2020 Sep 30, 2020 Sep 30, 2021
$ Change from
Net loan As a % of Net loan As a % of Net loan As a % of Net loan As a % of Net loan As a % of
($ in millions) charge-
offs average
loans (1) charge-
offs average
loans (1) charge-
offs average
loans (1) charge-
offs average
loans (1) charge-
offs average
loans (1) Jun 30,
2021 Sep 30,
2020
By product:
Commercial:
Commercial and industrial $ 46 0.06 % $ 81 0.10 % $ 88 0.11 % $ 111 0.14 % $ 274 0.33 % $ (35) (228)
Real estate mortgage (10) (0.03) (5) (0.02) 46 0.16 162 0.53 56 0.18 (5) (66)
Real estate construction 1 — (1) — — — — — (2) (0.03) 2 3
Lease financing 1 0.03 5 0.12 15 0.40 35 0.83 28 0.66 (4) (27)
Total commercial 38 0.03 80 0.07 149 0.13 308 0.26 356 0.29 (42) (318)
Consumer:
Residential mortgage – first lien (14) (0.02) (19) (0.03) (24) (0.04) (3) — (1) — 5 (13)
Residential mortgage – junior lien (28) (0.61) (31) (0.60) (19) (0.35) (24) (0.39) (14) (0.22) 3 (14)
Credit card 158 1.77 256 3.01 236 2.71 190 2.09 245 2.71 (98) (87)
Auto 26 0.20 45 0.35 52 0.44 51 0.43 31 0.25 (19) (5)
Other consumer 79 1.22 50 0.80 119 1.97 62 0.88 66 0.80 29 13
Total consumer 221 0.23 301 0.32 364 0.37 276 0.26 327 0.30 (80) (106)
Total net charge-offs $ 259 0.12 % $ 381 0.18 % $ 513 0.24 % $ 584 0.26 % $ 683 0.29 % $ (122) (424)
By segment:
Consumer Banking and Lending $ 302 0.37 % $ 359 0.43 % $ 370 0.42 % $ 332 0.35 % $ 369 0.39 % $ (57) (67)
Commercial Banking 16 0.04 50 0.11 39 0.09 81 0.17 175 0.34 (34) (159)
Corporate and Investing Banking (48) (0.07) (18) (0.03) 36 0.06 177 0.29 117 0.19 (30) (165)
Wealth and Investment Management (3) (0.01) (3) (0.01) — — (3) (0.01) (2) (0.01) — (1)
Corporate (8) (0.33) (7) (0.28) 68 2.70 (3) (0.08) 24 0.45 (1) (32)
Total net charge-offs $ 259 0.12 % $ 381 0.18 % $ 513 0.24 % $ 584 0.26 % $ 683 0.29 % $ (122) (424)
(1) Quarterly net charge-offs (recoveries) as a percentage of average loans are annualized.
-19-

Wells Fargo & Company and Subsidiaries CHANGES IN ALLOWANCE FOR CREDIT LOSSES FOR LOANS
Sep 30, 2021 Nine months Quarter ended $ Change from ended Sep 30,
Sep 30, Jun 30, Mar 31, Dec 31, Sep 30, Jun 30, Sep 30, (in millions) 2021 2021 2021 2020 2020 2021 2020 2021 2020 $ Change
Balance, beginning of period $ 16,391 18,043 19,713 20,471 20,436 (1,652) (4,045) 19,713 10,456 9,257
Cumulative effect from change in accounting policies (1) — — — — — — — — (1,337) 1,337
Allowance for purchased credit-deteriorated (PCD) loans (2) — — — — — — — — 8 (8)
Balance, beginning of period, adjusted 16,391 18,043 19,713 20,471 20,436 (1,652) (4,045) 19,713 9,127 10,586
Provision for credit losses (1,387) (1,239) (1,117) (144) 751 (148) (2,138) (3,743) 14,149 (17,892)
Interest income on certain loans (3) (35) (36) (41) (36) (41) 1 6 (112) (117) 5
Net loan charge-offs:
Commercial:
Commercial and industrial (46) (81) (88) (111) (274) 35 228 (215) (1,128) 913
Real estate mortgage 10 5 (46) (162) (56) 5 66 (31) (121) 90
Real estate construction (1) 1 — — 2 (2) (3) — 19 (19)
Lease financing (1) (5) (15) (35) (28) 4 27 (21) (52) 31
Total commercial (38) (80) (149) (308) (356) 42 318 (267) (1,282) 1,015
Consumer:
Residential mortgage – first lien 14 19 24 3 1 (5) 13 57 2 55
Residential mortgage – junior lien 28 31 19 24 14 (3) 14 78 31 47
Credit card (158) (256) (236) (190) (245) 98 87 (650) (949) 299
Auto (26) (45) (52) (51) (31) 19 5 (123) (219) 96
Other consumer (79) (50) (119) (62) (66) (29) (13) (248) (288) 40
Total consumer (221) (301) (364) (276) (327) 80 106 (886) (1,423)
Net loan charge-offs (259) (381) (513) (584) (683) 122 424 (1,153) (2,705) 1,552
Other (5) 4 1 6 8 (9) (13) — 17 (17)
Balance, end of period $ 14,705 16,391 18,043 19,713 20,471 (1,686) (5,766) 14,705 20,471 (5,766)
Components:
Allowance for loan losses $ 13,517 15,148 16,928 18,516 19,463 (1,631) (5,946) 13,517 19,463 (5,946)
Allowance for unfunded credit commitments 1,188 1,243 1,115 1,197 1,008 (55) 180 1,188 1,008 180
Allowance for credit losses for loans $ 14,705 16,391 18,043 19,713 20,471 (1,686) (5,766) 14,705 20,471 (5,766)
Ratio of allowance for loan losses to total net loan charge-offs (annualized) 13.14x 9.93 8.13 7.97 7.16 8.77 5.39
Allowance for loan losses as a percentage of:
Total loans 1.57 % 1.78 1.96 2.09 2.12 1.57 2.12
Nonaccrual loans 192 205 210 212 243 192 243
Allowance for credit losses for loans as a percentage of:
Total loans 1.70 1.92 2.09 2.22 2.22 1.70 2.22
Nonaccrual loans 208 222 224 226 255 208 255
(1) Represents the overall decrease in our allowance for credit losses for loans as a result of our adoption of Accounting Standards Update (ASU) 2016-13, Financial Instruments – Credit Losses (CECL), on January 1, 2020. (2) Represents the allowance for credit losses for purchased credit-impaired (PCI) loans that automatically became PCD loans with the adoption of ASU 2016-13. (3) Loans with an allowance for credit losses measured by discounting expected cash flows using the loan’s effective interest rate over the remaining life of the loan recognize changes in the allowance for credit losses attributable to the passage of time as interest income.
-20-
537
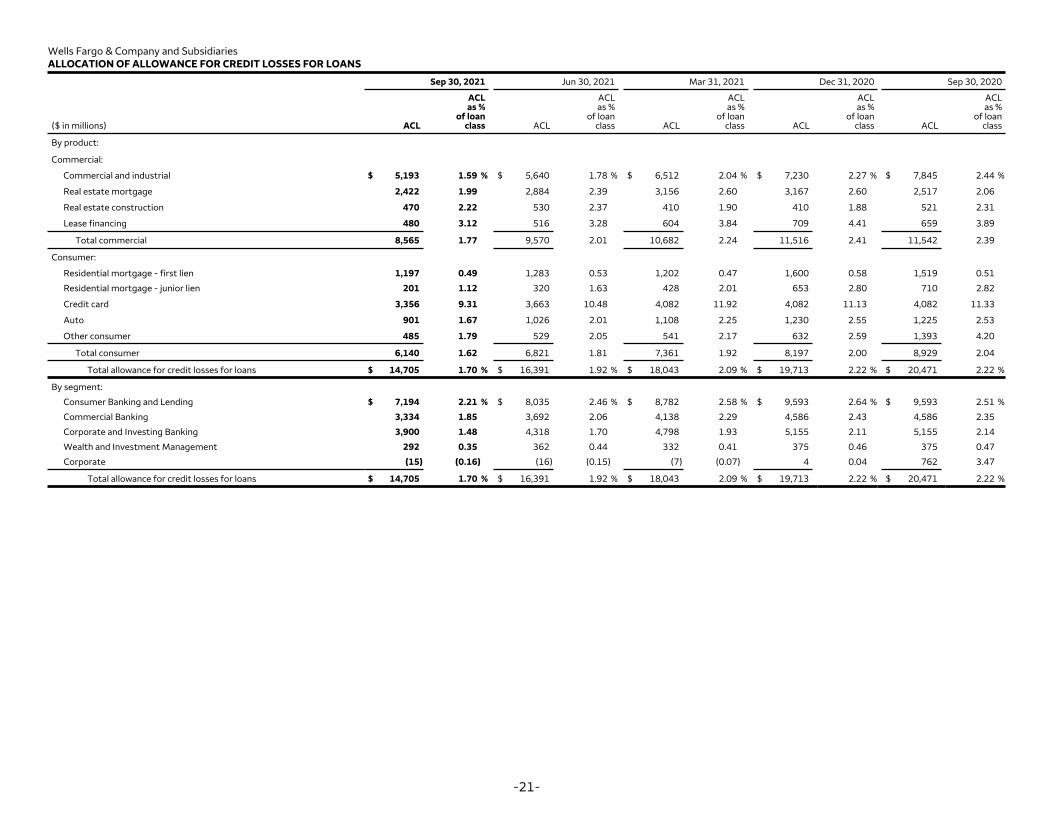
Wells Fargo & Company and Subsidiaries ALLOCATION OF ALLOWANCE FOR CREDIT LOSSES FOR LOANS
Sep 30, 2021 Jun 30, 2021 Mar 31, 2021 Dec 31, 2020 Sep 30, 2020
ACL ACL ACL ACL ACL as % as % as % as % as %
of loan of loan of loan of loan of loan ($ in millions) ACL class ACL class ACL class ACL class ACL class
By product:
Commercial:
Commercial and industrial $ 5,193 1.59 % $ 5,640 1.78 % $ 6,512 2.04 % $ 7,230 2.27 % $ 7,845 2.44 %
Real estate mortgage 2,422 1.99 2,884 2.39 3,156 2.60 3,167 2.60 2,517 2.06
Real estate construction 470 2.22 530 2.37 410 1.90 410 1.88 521 2.31
Lease financing 480 3.12 516 3.28 604 3.84 709 4.41 659 3.89
Total commercial 8,565 1.77 9,570 2.01 10,682 2.24 11,516 2.41 11,542 2.39
Consumer:
Residential mortgage - first lien 1,197 0.49 1,283 0.53 1,202 0.47 1,600 0.58 1,519 0.51
Residential mortgage - junior lien 201 1.12 320 1.63 428 2.01 653 2.80 710 2.82
Credit card 3,356 9.31 3,663 10.48 4,082 11.92 4,082 11.13 4,082 11.33
Auto 901 1.67 1,026 2.01 1,108 2.25 1,230 2.55 1,225 2.53
Other consumer 485 1.79 529 2.05 541 2.17 632 2.59 1,393 4.20
Total consumer 6,140 1.62 6,821 1.81 7,361 1.92 8,197 2.00 8,929 2.04
Total allowance for credit losses for loans $ 14,705 1.70 % $ 16,391 1.92 % $ 18,043 2.09 % $ 19,713 2.22 % $ 20,471 2.22 %
By segment:
Consumer Banking and Lending $ 7,194 2.21 % $ 8,035 2.46 % $ 8,782 2.58 % $ 9,593 2.64 % $ 9,593 2.51 %
Commercial Banking 3,334 1.85 3,692 2.06 4,138 2.29 4,586 2.43 4,586 2.35
Corporate and Investing Banking 3,900 1.48 4,318 1.70 4,798 1.93 5,155 2.11 5,155 2.14
Wealth and Investment Management 292 0.35 362 0.44 332 0.41 375 0.46 375 0.47
Corporate (15) (0.16) (16) (0.15) (7) (0.07) 4 0.04 762 3.47
Total allowance for credit losses for loans $ 14,705 1.70 % $ 16,391 1.92 % $ 18,043 2.09 % $ 19,713 2.22 % $ 20,471 2.22 %
-21-

Wells Fargo & Company and Subsidiaries NONPERFORMING ASSETS (NONACCRUAL LOANS AND FORECLOSED ASSETS)
Sep 30, 2021 Jun 30, 2021 Mar 31, 2021 Dec 31, 2020 Sep 30, 2020 Sep 30, 2021
$ Change from
% of % of % of % of % of
($ in millions) Balance total loans Balance
total loans Balance
total loans Balance
total loans Balance
total loans
Jun 30, 2021
Sep 30,2020
By product:
Nonaccrual loans:
Commercial:
Commercial and industrial $ 1,274 0.39% $ 1,691 0.53% $ 2,223 0.70% $ 2,698 0.85% $ 2,834 0.88% $ (417) (1,560)
Real estate mortgage 1,538 1.26 1,598 1.32 1,703 1.41 1,774 1.46 1,343 1.10 (60) 195
Real estate construction 20 0.09 45 0.20 55 0.26 48 0.22 34 0.15 (25) (14)
Lease financing 188 1.22 215 1.37 249 1.58 259 1.61 187 1.10 (27) 1
Total commercial 3,020 0.62 3,549 0.74 4,230 0.89 4,779 1.00 4,398 0.91 (529) (1,378)
Consumer:
Residential mortgage – first lien (1) 3,093 1.27 2,852 1.17 2,859 1.12 2,957 1.07 2,641 0.90 241 452
Residential mortgage – junior lien (1) 702 3.89 713 3.63 747 3.51 754 3.24 767 3.05 (11) (65)
Auto 206 0.38 221 0.43 181 0.37 202 0.42 176 0.36 (15) 30
Other consumer 37 0.14 36 0.14 38 0.15 36 0.15 40 0.12 1 (3)
Total consumer 4,038 1.07 3,822 1.02 3,825 1.00 3,949 0.97 3,624 0.83 216 414
Total nonaccrual loans 7,058 0.82 7,371 0.86 8,055 0.93 8,728 0.98 8,022 0.87 (313) (964)
Foreclosed assets 121 129 140 159 156 (8) (35)
Total nonperforming assets $ 7,179 0.83% $ 7,500 0.88% $ 8,195 0.95% $ 8,887 1.00% $ 8,178 0.89% $ (321) (999)
By segment:
Consumer Banking and Lending $ 3,955 1.21% $ 3,730 1.14% $ 3,763 1.10% $ 3,895 1.07% $ 3,625 0.95% $ 225 330
Commercial Banking 1,827 1.01 2,096 1.17 2,511 1.39 2,511 1.33 1,899 0.98 (269) (72)
Corporate and Investing Banking 1,073 0.41 1,310 0.52 1,618 0.65 2,198 0.90 2,402 1.00 (237) (1,329)
Wealth and Investment Management 324 0.39 364 0.44 294 0.36 262 0.32 224 0.28 (40) 100
Corporate — — — — 9 0.09 21 0.20 28 0.13 — (28)
Total nonperforming assets $ 7,179 0.83% $ 7,500 0.88% $ 8,195 0.95% $ 8,887 1.00% $ 8,178 0.89% $ (321) (999)
(1) Residential mortgage loans predominantly insured by the Federal Housing Administration (FHA) or guaranteed by the Department of Veterans Affairs (VA) are not placed on nonaccrual status because they are insured or guaranteed.
-22-
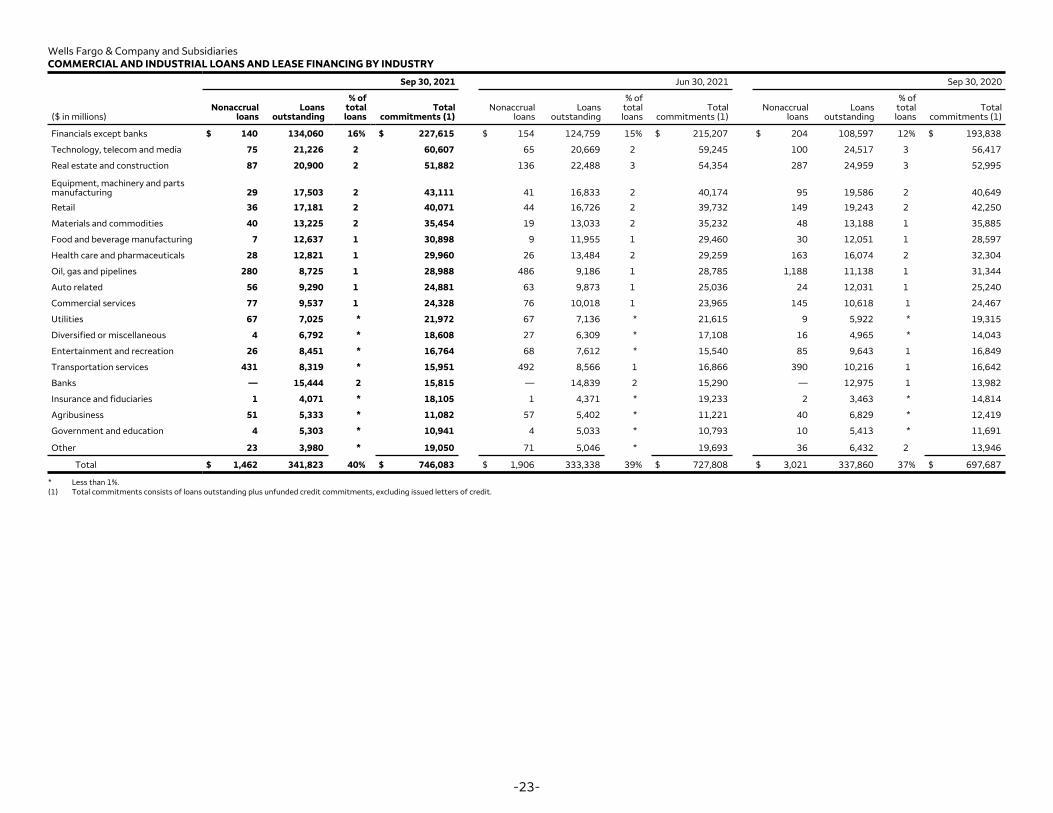
Wells Fargo & Company and Subsidiaries COMMERCIAL AND INDUSTRIAL LOANS AND LEASE FINANCING BY INDUSTRY
Sep 30, 2021 Jun 30, 2021 Sep 30, 2020
($ in millions) Nonaccrual
loans Loans
outstanding
% of total loans
Total commitments (1)
Nonaccrual loans
Loans outstanding
% of total loans
Total commitments (1)
Nonaccrual loans
Loans outstanding
% of total loans
Total commitments (1)
Financials except banks $ 140 134,060 16% $ 227,615 $ 154 124,759 15% $ 215,207 $ 204 108,597 12% $ 193,838
Technology, telecom and media 75 21,226 2 60,607 65 20,669 2 59,245 100 24,517 3 56,417
Real estate and construction 87 20,900 2 51,882 136 22,488 3 54,354 287 24,959 3 52,995
Equipment, machinery and partsmanufacturing 29 17,503 2 43,111 41 16,833 2 40,174 95 19,586 2 40,649
Retail 36 17,181 2 40,071 44 16,726 2 39,732 149 19,243 2 42,250
Materials and commodities 40 13,225 2 35,454 19 13,033 2 35,232 48 13,188 1 35,885
Food and beverage manufacturing 7 12,637 1 30,898 9 11,955 1 29,460 30 12,051 1 28,597
Health care and pharmaceuticals 28 12,821 1 29,960 26 13,484 2 29,259 163 16,074 2 32,304
Oil, gas and pipelines 280 8,725 1 28,988 486 9,186 1 28,785 1,188 11,138 1 31,344
Auto related 56 9,290 1 24,881 63 9,873 1 25,036 24 12,031 1 25,240
Commercial services 77 9,537 1 24,328 76 10,018 1 23,965 145 10,618 1 24,467
Utilities 67 7,025 * 21,972 67 7,136 * 21,615 9 5,922 * 19,315
Diversified or miscellaneous 4 6,792 * 18,608 27 6,309 * 17,108 16 4,965 * 14,043
Entertainment and recreation 26 8,451 * 16,764 68 7,612 * 15,540 85 9,643 1 16,849
Transportation services 431 8,319 * 15,951 492 8,566 1 16,866 390 10,216 1 16,642
Banks — 15,444 2 15,815 — 14,839 2 15,290 — 12,975 1 13,982
Insurance and fiduciaries 1 4,071 * 18,105 1 4,371 * 19,233 2 3,463 * 14,814
Agribusiness 51 5,333 * 11,082 57 5,402 * 11,221 40 6,829 * 12,419
Government and education 4 5,303 * 10,941 4 5,033 * 10,793 10 5,413 * 11,691
Other 23 3,980 * 19,050 71 5,046 * 19,693 36 6,432 2 13,946
Total $ 1,462 341,823 40% $ 746,083 $ 1,906 333,338 39% $ 727,808 $ 3,021 337,860 37% $ 697,687
* Less than 1%. (1) Total commitments consists of loans outstanding plus unfunded credit commitments, excluding issued letters of credit.
-23-

Wells Fargo & Company and Subsidiaries COMMERCIAL REAL ESTATE LOANS BY PROPERTY TYPE
Sep 30, 2021 Jun 30, 2021 Sep 30, 2020
% of % of % of Nonaccrual Loans total Total Nonaccrual Loans total Total Nonaccrual Loans total Total
($ in millions) loans outstanding loans commitments (1) loans outstanding loans commitments (1) loans outstanding loans commitments (1)
Office buildings $ 167 36,206 4% $ 41,932 $ 148 36,271 4% $ 42,072 $ 280 37,347 4% $ 42,855
Apartments 14 28,948 3 37,988 27 28,853 3 36,462 30 27,435 3 35,038
Industrial/warehouse 97 17,758 2 20,758 90 17,077 2 19,948 77 17,730 2 19,887
Retail (excluding shopping center) 141 13,116 2 13,789 233 13,233 2 13,947 172 14,053 2 14,603
Hotel/motel 297 12,113 1 12,529 361 12,271 1 12,706 159 12,288 1 13,038
Shopping center 593 10,712 1 11,321 509 10,913 1 11,581 408 11,732 1 12,422
Institutional 64 7,184 * 9,037 74 6,908 * 8,213 95 6,215 * 7,667
Mixed use properties 94 6,233 * 7,360 98 6,244 * 7,280 91 6,217 * 7,434
Collateral pool — 3,095 * 3,770 — 3,138 * 3,770 — 2,850 * 3,420
1-4 family structure — 1,336 * 3,176 — 1,356 * 3,307 — 1,523 * 3,517
Other 91 6,413 * 7,708 103 6,820 * 8,852 65 7,039 * 8,995
Total $ 1,558 143,114 17% $ 169,368 $ 1,643 143,084 17% $ 168,138 $ 1,377 144,429 16% $ 168,876
* Less than 1%. (1) Total commitments consists of loans outstanding plus unfunded credit commitments, excluding issued letters of credit.
-24-
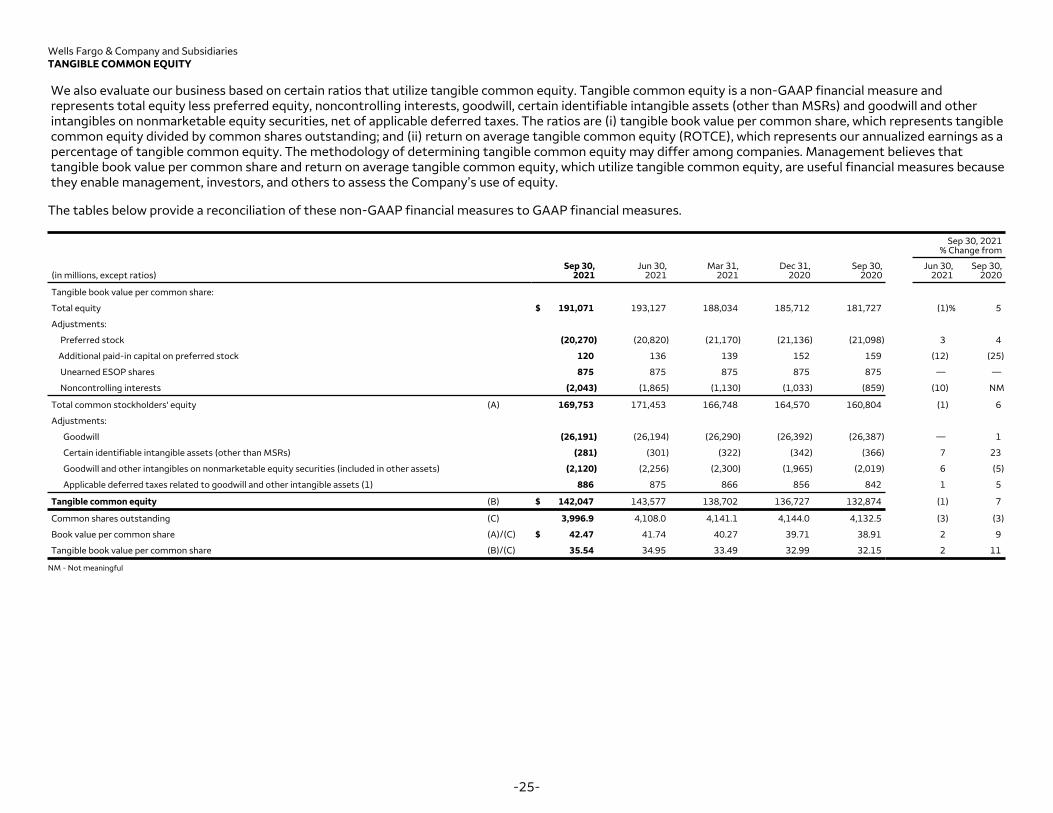
Wells Fargo & Company and Subsidiaries TANGIBLE COMMON EQUITY
We also evaluate our business based on certain ratios that utilize tangible common equity. Tangible common equity is a non-GAAP financial measure and represents total equity less preferred equity, noncontrolling interests, goodwill, certain identifiable intangible assets (other than MSRs) and goodwill and other intangibles on nonmarketable equity securities, net of applicable deferred taxes. The ratios are (i) tangible book value per common share, which represents tangible common equity divided by common shares outstanding; and (ii) return on average tangible common equity (ROTCE), which represents our annualized earnings as a percentage of tangible common equity. The methodology of determining tangible common equity may differ among companies. Management believes that tangible book value per common share and return on average tangible common equity, which utilize tangible common equity, are useful financial measures because they enable management, investors, and others to assess the Company’s use of equity.
The tables below provide a reconciliation of these non-GAAP financial measures to GAAP financial measures.
Sep 30, 2021% Change from
(in millions, except ratios) Sep 30,
2021 Jun 30,
2021 Mar 31,
2021 Dec 31,
2020 Sep 30,
2020 Jun 30,
2021 Sep 30,
2020
Tangible book value per common share:
Total equity $ 191,071 193,127 188,034 185,712 181,727 (1)% 5
Adjustments:
Preferred stock
Additional paid-in capital on preferred stock
(20,270)
120
(20,820)
136
(21,170)
139
(21,136)
152
(21,098)
159
3
(12)
4
(25)
Unearned ESOP shares 875 875 875 875 875 — —
Noncontrolling interests (2,043) (1,865) (1,130) (1,033) (859) (10) NM
Total common stockholders' equity (A) 169,753 171,453 166,748 164,570 160,804 (1) 6
Adjustments:
Goodwill
Certain identifiable intangible assets (other than MSRs)
Goodwill and other intangibles on nonmarketable equity securities (included in other assets)
Applicable deferred taxes related to goodwill and other intangible assets (1)
(26,191)
(281)
(2,120)
886
(26,194)
(301)
(2,256)
875
(26,290)
(322)
(2,300)
866
(26,392)
(342)
(1,965)
856
(26,387)
(366)
(2,019)
842
—
7
6
1
1
23
(5)
5
Tangible common equity (B) $ 142,047 143,577 138,702 136,727 132,874 (1) 7
Common shares outstanding (C) 3,996.9 4,108.0 4,141.1 4,144.0 4,132.5 (3) (3)
Book value per common share (A)/(C) $ 42.47 41.74 40.27 39.71 38.91 2 9
Tangible book value per common share (B)/(C) 35.54 34.95 33.49 32.99 32.15 2 11
NM - Not meaningful
-25-
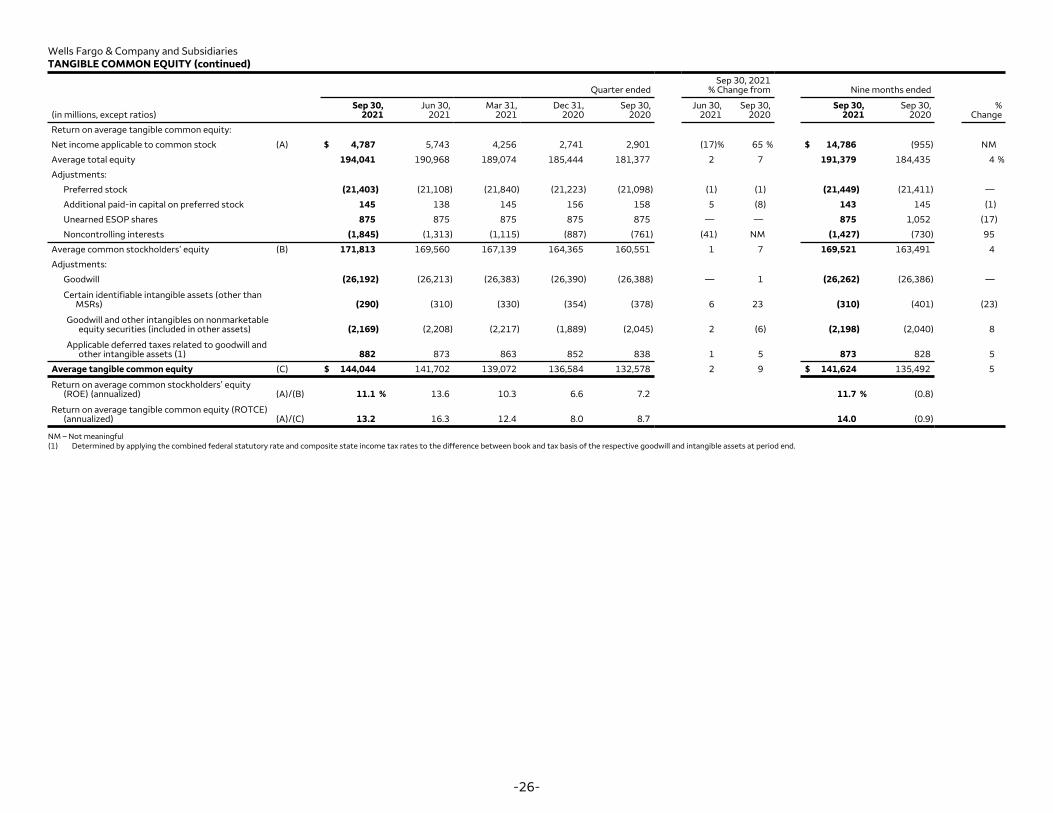
Wells Fargo & Company and Subsidiaries TANGIBLE COMMON EQUITY (continued)
Sep 30, 2021 Quarter ended % Change from Nine months ended
Sep 30, Jun 30, Mar 31, Dec 31, Sep 30, Jun 30, Sep 30, Sep 30, Sep 30, % (in millions, except ratios) 2021 2021 2021 2020 2020 2021 2020 2021 2020 Change
Return on average tangible common equity:
Net income applicable to common stock (A) $ 4,787 5,743 4,256 2,741 2,901 (17)% 65 % $ 14,786 (955) NM
Average total equity 194,041 190,968 189,074 185,444 181,377 2 7 191,379 184,435 4 %
Adjustments:
Preferred stock (21,403) (21,108) (21,840) (21,223) (21,098) (1) (1) (21,449) (21,411) —
Additional paid-in capital on preferred stock 145 138 145 156 158 5 (8) 143 145 (1)
Unearned ESOP shares 875 875 875 875 875 — — 875 1,052 (17)
Noncontrolling interests
Average common stockholders’ equity (B)
(1,845)
171,813
(1,313)
169,560
(1,115)
167,139
(887)
164,365
(761)
160,551
(41)
1
NM
7
(1,427)
169,521
(730)
163,491
95
4
Adjustments:
Goodwill (26,192) (26,213) (26,383) (26,390) (26,388) — 1 (26,262) (26,386) —
Certain identifiable intangible assets (other thanMSRs) (290) (310) (330) (354) (378) 6 23 (310) (401) (23)
Goodwill and other intangibles on nonmarketableequity securities (included in other assets) (2,169) (2,208) (2,217) (1,889) (2,045) 2 (6) (2,198) (2,040) 8
Applicable deferred taxes related to goodwill andother intangible assets (1) 882 873 863 852 838 1 5 873 828 5
Average tangible common equity (C) $ 144,044 141,702 139,072 136,584 132,578 2 9 $ 141,624 135,492 5
Return on average common stockholders’ equity (ROE) (annualized) (A)/(B) 11.1 % 13.6 10.3 6.6 7.2 11.7 % (0.8)
Return on average tangible common equity (ROTCE)(annualized) (A)/(C) 13.2 16.3 12.4 8.0 8.7 14.0 (0.9)
NM – Not meaningful (1) Determined by applying the combined federal statutory rate and composite state income tax rates to the difference between book and tax basis of the respective goodwill and intangible assets at period end.
-26-
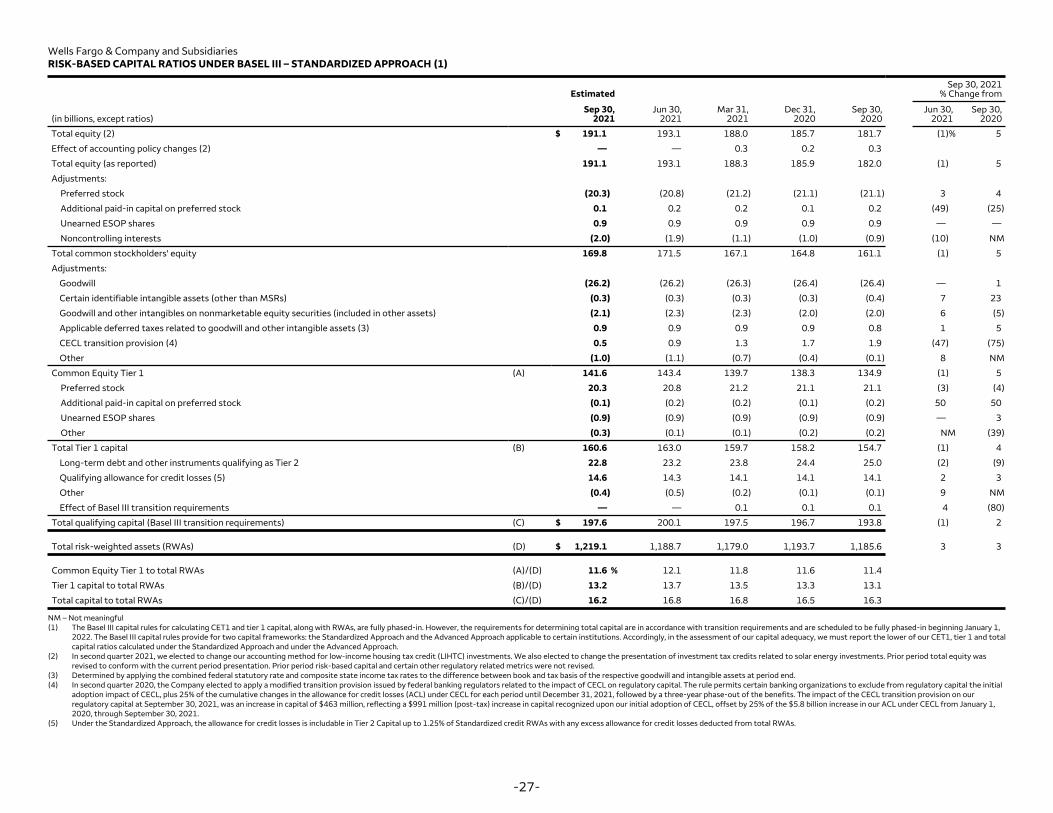
Wells Fargo & Company and Subsidiaries RISK-BASED CAPITAL RATIOS UNDER BASEL III – STANDARDIZED APPROACH (1)
Sep 30, 2021 Estimated % Change from
Sep 30, Jun 30, Mar 31, Dec 31, Sep 30, Jun 30, Sep 30, (in billions, except ratios) 2021 2021 2021 2020 2020 2021 2020
Total equity (2) $ 191.1 193.1 188.0 185.7 181.7 (1)% 5
Effect of accounting policy changes (2) — — 0.3 0.2 0.3
Total equity (as reported) 191.1 193.1 188.3 185.9 182.0 (1) 5
Adjustments:
Preferred stock (20.3) (20.8) (21.2) (21.1) (21.1) 3 4
Additional paid-in capital on preferred stock 0.1 0.2 0.2 0.1 0.2 (49) (25)
Unearned ESOP shares 0.9 0.9 0.9 0.9 0.9 — —
Noncontrolling interests (2.0) (1.9) (1.1) (1.0) (0.9) (10) NM
Total common stockholders' equity 169.8 171.5 167.1 164.8 161.1 (1) 5
Adjustments:
Goodwill (26.2) (26.2) (26.3) (26.4) (26.4) — 1
Certain identifiable intangible assets (other than MSRs) (0.3) (0.3) (0.3) (0.3) (0.4) 7 23
Goodwill and other intangibles on nonmarketable equity securities (included in other assets) (2.1) (2.3) (2.3) (2.0) (2.0) 6 (5)
Applicable deferred taxes related to goodwill and other intangible assets (3) 0.9 0.9 0.9 0.9 0.8 1 5
CECL transition provision (4) 0.5 0.9 1.3 1.7 1.9 (47) (75)
Other (1.0) (1.1) (0.7) (0.4) (0.1) 8 NM
Common Equity Tier 1
Preferred stock
Additional paid-in capital on preferred stock
Unearned ESOP shares
Other
Total Tier 1 capital
Long-term debt and other instruments qualifying as Tier 2
Qualifying allowance for credit losses (5)
Other
Effect of Basel III transition requirements
Total qualifying capital (Basel III transition requirements)
(A)
(B)
(C) $
141.6
20.3
(0.1)
(0.9)
(0.3)
160.6
22.8
14.6
(0.4)
—
197.6
143.4
20.8
(0.2)
(0.9)
(0.1)
163.0
23.2
14.3
(0.5)
—
200.1
139.7
21.2
(0.2)
(0.9)
(0.1)
159.7
23.8
14.1
(0.2)
0.1
197.5
138.3
21.1
(0.1)
(0.9)
(0.2)
158.2
24.4
14.1
(0.1)
0.1
196.7
134.9
21.1
(0.2)
(0.9)
(0.2)
154.7
25.0
14.1
(0.1)
0.1
193.8
(1)
(3)
50
—
NM
(1)
(2)
2
9
4
(1)
5
(4)
50
3
(39)
4
(9)
3
NM
(80)
2
Total risk-weighted assets (RWAs) (D) $ 1,219.1 1,188.7 1,179.0 1,193.7 1,185.6 3 3
Common Equity Tier 1 to total RWAs
Tier 1 capital to total RWAs
Total capital to total RWAs
(A)/(D)
(B)/(D)
(C)/(D)
11.6 %
13.2
16.2
12.1
13.7
16.8
11.8
13.5
16.8
11.6
13.3
16.5
11.4
13.1
16.3
NM – Not meaningful (1) The Basel III capital rules for calculating CET1 and tier 1 capital, along with RWAs, are fully phased-in. However, the requirements for determining total capital are in accordance with transition requirements and are scheduled to be fully phased-in beginning January 1,
2022. The Basel III capital rules provide for two capital frameworks: the Standardized Approach and the Advanced Approach applicable to certain institutions. Accordingly, in the assessment of our capital adequacy, we must report the lower of our CET1, tier 1 and total capital ratios calculated under the Standardized Approach and under the Advanced Approach.
(2) In second quarter 2021, we elected to change our accounting method for low-income housing tax credit (LIHTC) investments. We also elected to change the presentation of investment tax credits related to solar energy investments. Prior period total equity was revised to conform with the current period presentation. Prior period risk-based capital and certain other regulatory related metrics were not revised.
(3) Determined by applying the combined federal statutory rate and composite state income tax rates to the difference between book and tax basis of the respective goodwill and intangible assets at period end. (4) In second quarter 2020, the Company elected to apply a modified transition provision issued by federal banking regulators related to the impact of CECL on regulatory capital. The rule permits certain banking organizations to exclude from regulatory capital the initial
adoption impact of CECL, plus 25% of the cumulative changes in the allowance for credit losses (ACL) under CECL for each period until December 31, 2021, followed by a three-year phase-out of the benefits. The impact of the CECL transition provision on our regulatory capital at September 30, 2021, was an increase in capital of $463 million, reflecting a $991 million (post-tax) increase in capital recognized upon our initial adoption of CECL, offset by 25% of the $5.8 billion increase in our ACL under CECL from January 1, 2020, through September 30, 2021.
(5) Under the Standardized Approach, the allowance for credit losses is includable in Tier 2 Capital up to 1.25% of Standardized credit RWAs with any excess allowance for credit losses deducted from total RWAs.
-27-
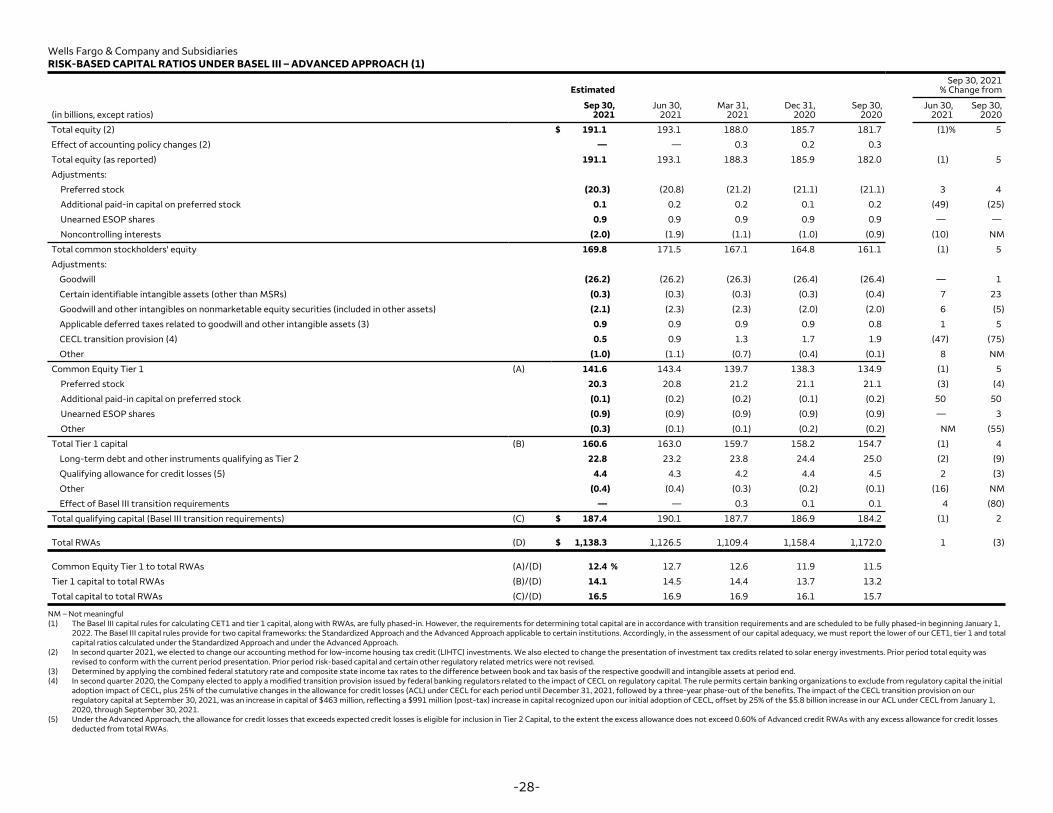
Wells Fargo & Company and Subsidiaries RISK-BASED CAPITAL RATIOS UNDER BASEL III – ADVANCED APPROACH (1)
Sep 30, 2021 Estimated % Change from
Sep 30, Jun 30, Mar 31, Dec 31, Sep 30, Jun 30, Sep 30, (in billions, except ratios) 2021 2021 2021 2020 2020 2021 2020
Total equity (2) $ 191.1 193.1 188.0 185.7 181.7 (1)% 5
Effect of accounting policy changes (2) — — 0.3 0.2 0.3
Total equity (as reported) 191.1 193.1 188.3 185.9 182.0 (1) 5
Adjustments:
Preferred stock (20.3) (20.8) (21.2) (21.1) (21.1) 3 4
Additional paid-in capital on preferred stock 0.1 0.2 0.2 0.1 0.2 (49) (25)
Unearned ESOP shares 0.9 0.9 0.9 0.9 0.9 — —
Noncontrolling interests (2.0) (1.9) (1.1) (1.0) (0.9) (10) NM
Total common stockholders' equity 169.8 171.5 167.1 164.8 161.1 (1) 5
Adjustments:
Goodwill (26.2) (26.2) (26.3) (26.4) (26.4) — 1
Certain identifiable intangible assets (other than MSRs) (0.3) (0.3) (0.3) (0.3) (0.4) 7 23
Goodwill and other intangibles on nonmarketable equity securities (included in other assets) (2.1) (2.3) (2.3) (2.0) (2.0) 6 (5)
Applicable deferred taxes related to goodwill and other intangible assets (3) 0.9 0.9 0.9 0.9 0.8 1 5
CECL transition provision (4) 0.5 0.9 1.3 1.7 1.9 (47) (75)
Other (1.0) (1.1) (0.7) (0.4) (0.1) 8 NM
Common Equity Tier 1
Preferred stock
Additional paid-in capital on preferred stock
Unearned ESOP shares
Other
Total Tier 1 capital
Long-term debt and other instruments qualifying as Tier 2
Qualifying allowance for credit losses (5)
Other
Effect of Basel III transition requirements
Total qualifying capital (Basel III transition requirements)
(A)
(B)
(C) $
141.6
20.3
(0.1)
(0.9)
(0.3)
160.6
22.8
4.4
(0.4)
—
187.4
143.4
20.8
(0.2)
(0.9)
(0.1)
163.0
23.2
4.3
(0.4)
—
190.1
139.7
21.2
(0.2)
(0.9)
(0.1)
159.7
23.8
4.2
(0.3)
0.3
187.7
138.3
21.1
(0.1)
(0.9)
(0.2)
158.2
24.4
4.4
(0.2)
0.1
186.9
134.9
21.1
(0.2)
(0.9)
(0.2)
154.7
25.0
4.5
(0.1)
0.1
184.2
(1)
(3)
50
—
NM
(1)
(2)
2
(16)
4
(1)
5
(4)
50
3
(55)
4
(9)
(3)
NM
(80)
2
Total RWAs (D) $ 1,138.3 1,126.5 1,109.4 1,158.4 1,172.0 1 (3)
Common Equity Tier 1 to total RWAs
Tier 1 capital to total RWAs
Total capital to total RWAs
(A)/(D)
(B)/(D)
(C)/(D)
12.4 %
14.1
16.5
12.7
14.5
16.9
12.6
14.4
16.9
11.9
13.7
16.1
11.5
13.2
15.7
NM – Not meaningful (1) The Basel III capital rules for calculating CET1 and tier 1 capital, along with RWAs, are fully phased-in. However, the requirements for determining total capital are in accordance with transition requirements and are scheduled to be fully phased-in beginning January 1,
2022. The Basel III capital rules provide for two capital frameworks: the Standardized Approach and the Advanced Approach applicable to certain institutions. Accordingly, in the assessment of our capital adequacy, we must report the lower of our CET1, tier 1 and total capital ratios calculated under the Standardized Approach and under the Advanced Approach.
(2) In second quarter 2021, we elected to change our accounting method for low-income housing tax credit (LIHTC) investments. We also elected to change the presentation of investment tax credits related to solar energy investments. Prior period total equity was revised to conform with the current period presentation. Prior period risk-based capital and certain other regulatory related metrics were not revised.
(3) Determined by applying the combined federal statutory rate and composite state income tax rates to the difference between book and tax basis of the respective goodwill and intangible assets at period end. (4) In second quarter 2020, the Company elected to apply a modified transition provision issued by federal banking regulators related to the impact of CECL on regulatory capital. The rule permits certain banking organizations to exclude from regulatory capital the initial
adoption impact of CECL, plus 25% of the cumulative changes in the allowance for credit losses (ACL) under CECL for each period until December 31, 2021, followed by a three-year phase-out of the benefits. The impact of the CECL transition provision on our regulatory capital at September 30, 2021, was an increase in capital of $463 million, reflecting a $991 million (post-tax) increase in capital recognized upon our initial adoption of CECL, offset by 25% of the $5.8 billion increase in our ACL under CECL from January 1, 2020, through September 30, 2021.
(5) Under the Advanced Approach, the allowance for credit losses that exceeds expected credit losses is eligible for inclusion in Tier 2 Capital, to the extent the excess allowance does not exceed 0.60% of Advanced credit RWAs with any excess allowance for credit losses deducted from total RWAs.
-28-