3rd year igen project - economic analysis
TRANSCRIPT

1

Table of Contents Table of Contents 2 Market Research & Analysis 3
Market 3 Customer Description 3 Competitors & Market Power 4 Complements 4 Regulators 5 Rivals 5 New Entrants 5 Substitutes 5 Customers 5 Suppliers 6
Create, Capture and Sustain Value 6 Positioning Statement 6 Pricing 6 Roadmap 7 Revenue Model Options & Choices 8
Market Plan 9 Market Segmentation, Penetration Strategy & Rationale, timing 9 Ops/Finance Plan and Valuation Model 9 Comparables and Discount rates 10 Source and Use of Proceeds 10 Share Projections 10
References 11 Appendix 1 12
2

Market Research & Analysis
Market Optical quality assessment, more commonly known as Automated Optical Inspection (AOI), is
used in a variety of industries in which the accuracy of the final product is of great importance and the possible defects are difficult or costly to detect by eye.
The printing industry is a massive industry making use of printing technologies to produce a variety of products. According to Industry Canada there are 234 canadian commercial screen printing companies[1] , and is also predicted to grow between 1 and 4 percent per year until 2018[2].
The primary focus within this market will be on the largescale screen printing industry, as
companies such as Ampco expressed the need for improved quality assessment. Screen printing is used for products such as tshirts, posters, stickers, signage, banners, vehicle wraps, warning labels, and more. Potential customers of this type of printing include companies with vehicle fleets, the shipping industry, car manufacturers.
Customer Description The intended customers of this product are medium scale printing companies that use solvent
based ink for their products.
At Ampco, a printing company located in metro Vancouver, label batches vary between approximately 20,000 to 500,000 labels per batch . The largest customers demand large batches with high quality standards. Ampco sees an error rate of 110%, depending on the customer’s quality demands. Small errors are unacceptable, and 85% of such errors occur in the screen printing stage. However, since the quality assessment is done at the very end of the label creation process, the company loses approximately $100,000 in scrapped labels per year [3].
Due to the high standards of quality assurance, Ampco employs a team of workers to manually check every label before it is sent out to the customer. The inspection viewing time for varys between 115 seconds depending on the size of the label. (Assuming wages of $20, a team of 10 costs Ampco an estimated $380,000 annually) [3].
The label creation process includes several stages after the printing stage, most of which are more complicated and more costly than printing. Implementing an AOI system into the screen printing processes allows for flaws to be detected before the later stages of the process. Production time is reduced if prints with errors are removed from the production line immediately and feedback is given so that the errors are not replicated.
3
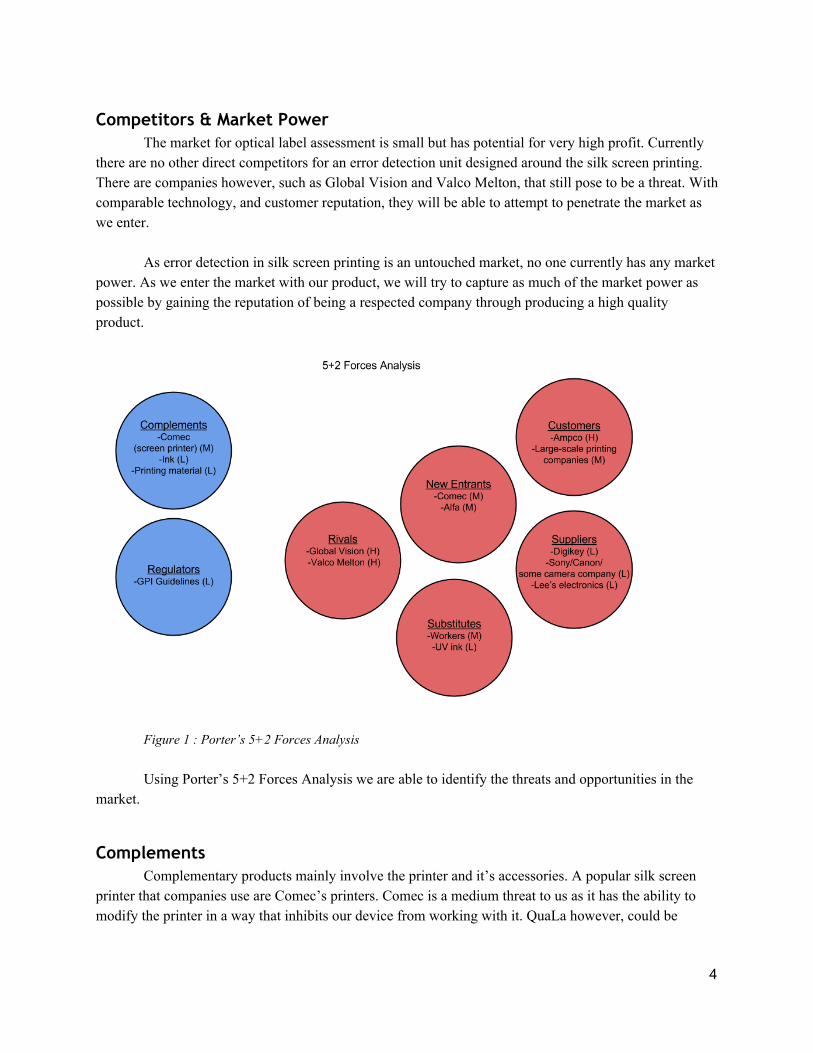
Competitors & Market Power The market for optical label assessment is small but has potential for very high profit. Currently
there are no other direct competitors for an error detection unit designed around the silk screen printing. There are companies however, such as Global Vision and Valco Melton, that still pose to be a threat. With comparable technology, and customer reputation, they will be able to attempt to penetrate the market as we enter.
As error detection in silk screen printing is an untouched market, no one currently has any market power. As we enter the market with our product, we will try to capture as much of the market power as possible by gaining the reputation of being a respected company through producing a high quality product.
Figure 1 : Porter’s 5+2 Forces Analysis
Using Porter’s 5+2 Forces Analysis we are able to identify the threats and opportunities in the
market.
Complements Complementary products mainly involve the printer and it’s accessories. A popular silk screen
printer that companies use are Comec’s printers. Comec is a medium threat to us as it has the ability to modify the printer in a way that inhibits our device from working with it. QuaLa however, could be
4

designed so that it can be adapted to different printer models and work regardless of printer model choices and modifications.
Regulators Labeling companies such as Ampco must comply with certain industry standards in terms of label
quality, such as GPI regulators.This is a low threat for our company, as the coding for QuaLa will be easily modifiable, to keep up with the standards.
Rivals Our rivals are indirectly related companies such as Global Vision and Valco Melton. They pose a
high threat to us as they have comparable technology and customer reputation allowing them to penetrate the market. We would combat this by grabbing as much market power with our initial product and build our company on a high reputation, so that when they try to enter the market, we will already be the market standard.
New Entrants The new entrants identified are rated with medium market power because they are established
companies in the printing industry, but do not currently have production AOI systems to accompany their products. They could, however, use their capital or market power to bring a new product to the market or buy a small AOI company and take its market power from low to high. Our strategy to combat new entrants will be to work quickly to establish ourselves in the market.
Substitutes Substitutes to a quality inspection system include workers, or alternative methods of printing.
Workers have a medium market power because companies may wish to refrain from laying off their workforce. To reduce the market power of labourers, we must stress the monetary savings that could be made by using QuaLa.UV printing is an alternative to silk screen printing and is a low threat for us. As UV is unlikely to takeover solvent based printing in the near future, its market power is low, and no actions are needed to reduce its market power.
Customers Our customers include companies that use silk screen printing devices. Because of the resources
they offer (time and expertise) to our R&D, they have a great deal of influence over the direction of our project.
Other largescale printing companies have a medium market power share because they are our target market. If they desire alternative (price or system) then we must adjust QuaLa to meet their demands.
5

Suppliers Suppliers for our company include a variety of different companies, such as Digikey, Canon and
others. This provides us with the option of many different supplies of different qualities and prices. From this, we are able to vary what we buy, and where, to minimize our costs. We ranked the market power of all of the suppliers as low, since there are a huge variety of suppliers to choose from. No actions are required to reduce their already low market power.
Create, Capture and Sustain Value
Positioning Statement Our product is for small to medium scale silk screen printing companies who need to reduce the
rate of errors and the associated costs of the errors and quality control. Our product is an optical error detection system for silk screen printers that provides reliable high resolution assessment, which detects up to 85% of printing errors. Existing automated inspection systems such as ClearVision, are very expensive and can process large volumes at low resolutions. In contrast, our product provides optimized, high resolution scanning for companies that use slow printing processes, such as silk screening. Our company also provides installation and maintenance services.
Pricing Figure 2: Price Curve: Canadian Screenprinting Market
In Canada there are 234 [1] screen printing companies. Based on the assumption that these companies vary in size, revenue, and error costs, we predict that the price companies will be willing to pay for our product will vary linearly between some maximum and zero. Using Ampco (one of the largest screen printers in Canada) as a model, we predict the maximum price we can charge for our product to be $220,000. This number aims for a oneyear return time on the investment, taking into account Ampco’s scrap cost of $100,000 per year and the salaries of 10 quality control employees [3]. From this data we constructed the above price curve. Our marginal cost is placed at $500, based on it being our maximum budget. Maximizing the area under the curve for a
6

single pricepoint we find that the ideal price point is $110,000, at which we are projected to sell 117 units.
Our product creates its value by recognizing and eliminating errors early in the printing process, prior to later, costlier processes. The cost of errors includes not only the actual material costs, but the processing and operating costs. Since the product will be able to notify workers of errors immediately, they will be able to reduce the number of prints made with errors. Doing so will also reduce the number of quality control workers or time needed, thus allowing for reduced employment costs.
In order to address consumer surplus, we are able to discriminate our price by establishing different tiers of product based on customer needs. For example, we can increase or decrease the size of our camera array, thus changing the processable size of label. Ampco produces labels up to a maximum size of 52 x 48 inches, but not all companies will produce such large sizes and thus may not need such a large array. Thus in order to extract more consumer surplus we can price discriminate based on area processed.
Roadmap
Figure 3: Product Roadmap
The first iteration of our product will offer a system optimized for screen printers of large sheet sizes. It will be the first to launch in an untapped market, making it easy to obtain market power. There are several large existing error detection companies that will be able to enter the market, making it imperative to gain control of the market early. By establishing ourselves as the industry standard, it will
7

be easy to compete with companies that have lower marginal costs and can price below us. To stay competitive and lower costs, proprietary parts, such as the cameras will be replaced.
To maintain dominance over other companies, profits will be directed into developing the second iteration of our product. It will be released to compete with substitute systems two years after the first iteration is launched. This is based on the assumption that developing a competing product would take 2 years. This 2 year interval will also give time for all early adopters to buy the first model. The second version of our product will offer a variable camera array size, making it suitable for larger variety of screen printers. This allows for multiple price points, to extract more of the consumer surplus
In the event that UV ink becomes as or more durable than solvent based ink, the two most common errors, dots and pinholes would no longer be an issue. The focus of our product would switch to dust particles and misalignment. High resolution would no longer be needed, so the resolution of QuaLa would be lowered, as well as the price. An estimated price would be $50,000, based on $15,000 in errors from Ampco, and the salaries of 2 minimum wage workers.
Revenue Model Options & Choices
Figure 4: Revenue Model
There are revenue models included for each version of the product. For the first product, 20% of the revenue is set aside for research and development (R&D), and a profit of $87,500 is made after taking into account the cost of supplies for selling one unit.
For the second version of the product, the profit varies as there is price discrimination. A lower
grade system designed for smaller companies will sell for $40,000, in contrast to a higher grade system for bigger companies selling for $220,000. The $40k price is derived from taking the higher grade system and lowering specifications and reducing size to meet the needs of smaller companies. A system that would detect simple labels would sit at the $40k price range. After taking into account the 10% of revenue
8

going into R&D, and $500$1000 going towards the cost of supplies, profits will range from $35,500 to $197,000 depending on how many, and what grade of unit is sold.
Market Plan
Market Segmentation, Penetration Strategy & Rationale, timing The targeted market for our product is printing companies. Specifically, our targeted segment is
medium to large scale companies that utilise silk screen printers. Other segments, such as smaller printing companies, companies that use alternative technology to silk screen printers, and UV printing will be taken into consideration as time progresses and after some form of market control is established.
Following the roadmap (Fig 3), the initial iteration of the product will target medium sized companies, in particular Ampco, and sell for $110,000. By selling our product to Ampco, we will gain a reputable name in the market, as Ampco is one of Metro Vancouver’s largest printing companies. Ampco, as they have already expressed the need for this product, have communicated with us and would see a relatively quick payback by investing in our product and saving $100,000 from errors annually. This allows us to use Ampco as a beachhead to our product.
As there are no other substitutes to our product currently in the market, we will become the market standard. This provides us with a strong advantage over other companies that try to enter the market later.
As seen on the roadmap (Fig 3), our expected timeline will take a few years. Initially, we will be the only product on the market and will secure our position. We will know our success depending how many systems we can sell, and to what size companies.
Eventually competitors will try to enter the market. With QuaLa already having the reputation, competitors will try to respond by promising an optimized product with superior technology. To respond to this we will invest in R&D and focus more on channel selection.
For our channels, we would scale our business to a vertical scale. We would sell different
iterations of the product for different prices in the same channel. This allows us to maximize profit by capturing more consumer surplus. For our most loyal customers we would provide custom made products depending on their needs of quality assessment.
Ops/Finance Plan and Valuation Model Objectives For starting up our company there are 3 objectives in mind which are as follows:
1. Prove that an optical quality assessment system can be optimized for screenprinting.
9

2. Prove that QuaLa can work well for a variety of setups and needs (ie. different scales, printers, product types)
3. Expand from initial beach head customer Ampco to other screenprinting companies. Proves that our product has market value.
Comparables and Discount rates ClearVision, a cardboard box assessment company, located in British Columbia, followed a
similar path to that of the projected path QuaLa will take. Mehdi Bahrami of ClearVision, stated that the company sold their units for $30,000 to $100,000 [4]. The company continued on for 6 years until American company Valco Melton bought them out in 2011 for an undisclosed amount. This follows to the projected path of QuaLa, as our units will sell for a similar price, and we expected to be internationally known within 6 years.
YESTech Inc., a leader provider of AOI systems, was acquired by Nordson Corporation in a multimillion dollar deal in 2007. The exact value that YESTech was purchased for is unclear, but Nordson purchased it along with PICODOSTEC, manufacturer or piezoelectric technology dispersing systems for $53 million. Before the acquisition, the two companies grew at an average of 57% in revenue from 20042006 and had combined revenues of $20 million in 2006 [5] [6]. These values are comparable to our company as we expect to grow at 58% in revenues a year.
Source and Use of Proceeds For our product, the annual costs are estimated as follows:
$50 000 60 000 per year per engineer; team of 7: ~$400 000 per year Office space; 400 ft²: ~$2000 per month $24 000 per year [6] Later Stages: R&D / Storage Space (10%20% of profit) Materials: cost of prototypes + manufacturing (stage dependent)
This will roughly sum up to $500,000 of costs annually. The costs related to the team of engineers and the office space would increase over the years as QuaLa expands, whereas the costs related to R&D and prototypes decrease as the product is fully optimized.
To account for these initial costs, we will receive money through funds and selling stocks of QuaLa. After, to break even annually, we would need to sell 5 products.
Share Projections Initially QuaLa will start off with 100,000 shares worth $5 each. According to our company
valuation spreadsheet (Appendix 1), we estimated initially for the first year, due to startup costs and time to break into the market, the value of QuaLa’s shares will drop. After our reputation is built and we have control of the market, the value of shares will roughly increase by $15 per year, until we have reached a final amount of $67.78 at the end of 6 years.
10

References
1. Industry Canada Screen Printing Statistics 2. Ibisworld Key Statistics 3. Tour with Brian Fewtrell
Sr. Manager of Engineering & Quality of Ampco October 6th 2014
4. Text Messages with Mehdi Bahrami Sales Director of ClearVision Technologies Inc. November 27th 2014
5. http://www.nordson.com/enus/aboutnordson/news/Pages/NordsonCorporationAddsTwoBusinessestoitsAdvancedTechnologySystemsSegment.aspx
6. http://www.nordson.com/enus/aboutnordson/news/Pages/NordsonCorporationExceeds$1BillioninAnnualRevenue;ReportsRecordFourthQuarterandFullYearSales,NetIncomeandEarningsPerShare.aspx
7. Email from Barb Puallos Office Manager OfficeSuites Services Inc. Recieved 17/11/2014
11

Appendix 1 (Please refer to attached spreadsheet file if image below is unclear)
12