(4. -...
TRANSCRIPT
(4. jMDTA I Maryland
Transportat ion Authority
Larry Hogan Governor
Boyd K. Rutherford Lt Governor
Pete K. Rahn Chairman
Kather•ne Bays Armstrong Peter J . Basso
William H. Cox. Jr William C. Ensor Il l W Lee Garnes. Jr
Wil iam K. Hellmann John Von Paris
Kevin C Re1grut E ~ecutive Direclor
2310 Broening Highway , Baltimore MD 21224
410-537-1000 410-537· 003 (fax)
711 MD Relay) 1-866-713- 596
e ·rnail n1dtd 1@
mdta. maryland.gov
www.mdta .maryland gov
Januar) 8. 2017
f 1e Honorable Thomas V. \1 ike \ ti ller. Jr. President The Senate of \1aryland State House. If- I 07 Annapolis \-ID 21401-1991
The Honorable \-tichael E. Busch Speaker The \1aryland House of Delegates State I louse. H-101 Annapolis \10 21401- 1991
Dear President \1iller and Speaker Busch:
I \\Tite to provide a copy of the Maryland Transportation Authority's (\1DTA) financial fon:cast supporting the FY 2017 to FY 2022 Consolidated Transportation Program, as required by Transportation Article.§ 4-210 (St:nate Bill 182. Chapter 567. Acts 2008). The statute directs in part:
"fa) Each yew'. the Authority \'hall dew/op and adopt a 6-yeur financ:ialfiJrec:asl jiJr the operations oft he Authority.
" fh) In accordance with§ 2-12-16 C?lthe State Government Article. the Authority shal/ .rnhmit to the General Assemhly
"(/ J A drafi olthe financial /iJrec:ast on .rnhmission ol . . . . . the budget hill to the presidinx 1?fticer.\· olthe (;eneral . bwmh(v: and
" fl) The /inancial_furec:m·r as approved hy the .-1 ul hori~r on or he.fore .July I ol euch yt!ar . ..
The \-tDT A forecasts measun: the agency· s financial position through various ratios. assuming currently projected re\ enues and capital and operating expenses. These include the ratio related to the rate covenant in the [rust Agreement and those pertaining to two financial policy goals established by ~OT A. including debt service coverage and minimum cash balances. These goals conform to the relevant provisions the Budget Reconciliation and Financing Act (BRFA) of 2015. The forecasts are structured to · ndicate the potential need for adjustments to revenues. \\hich might he requi red to adhere to these rate covenant and financial policy goals.
The llonorab e Thomas V. Mike ~tiller The Honorable \-tichad E. Rusch Page Two
Adherence to the rate covenant and policy goals are intended to comp!) "With the legal obligations in the Trust Agreement and maintain the MDT A· s tin orable bond rating, assuring it the lowest cost access to capital markets.
The attached forecast. which includes the construction of a new :\ ice Bridge beginning in FY 2020, indicates that with currently anticipated revenues and expenditures during the FY 2017-2022 Consolidated Transportation Program period MD r A will be able to adhere to its legal and poliC) requirements without a need for a system-wide toll increase. Please note that the timing of any toll increases on the InterCounty Connector (ICC) and I-95 Express Toll Lanes \Viii depend primarily on the need to manage congestion on those facilities. and thus toll rates on those facilities could be adjusted should conditions warrant.
If you have any questions or comments. please do not hesitate to contact Mr. Kevin C. Reigrut. MDTA Executive Director. at 410-537-1001. Of course. you may ah-.ays contact me directly.
Sincerely.
,_ \ . -.--.... (. ___ ., .. __ . ..... _.
Pete K. Rahn Chairman
Anachment
cc: The Honorable Edward J. Kasemeyer. Chair. Senat1: Budget and Taxation Committee The Honorable Thomas M. ~·1iddlcton. Chair Senate Finance Committee The Honorable Sheila E. Hixson. Chair, House Ways and :Vleans Committee The Honorable Maggie Mcintosh, Chair. House Appropriations Committee Mr. Ke\ in C. Reigrut, Executive Director. \'IDT A
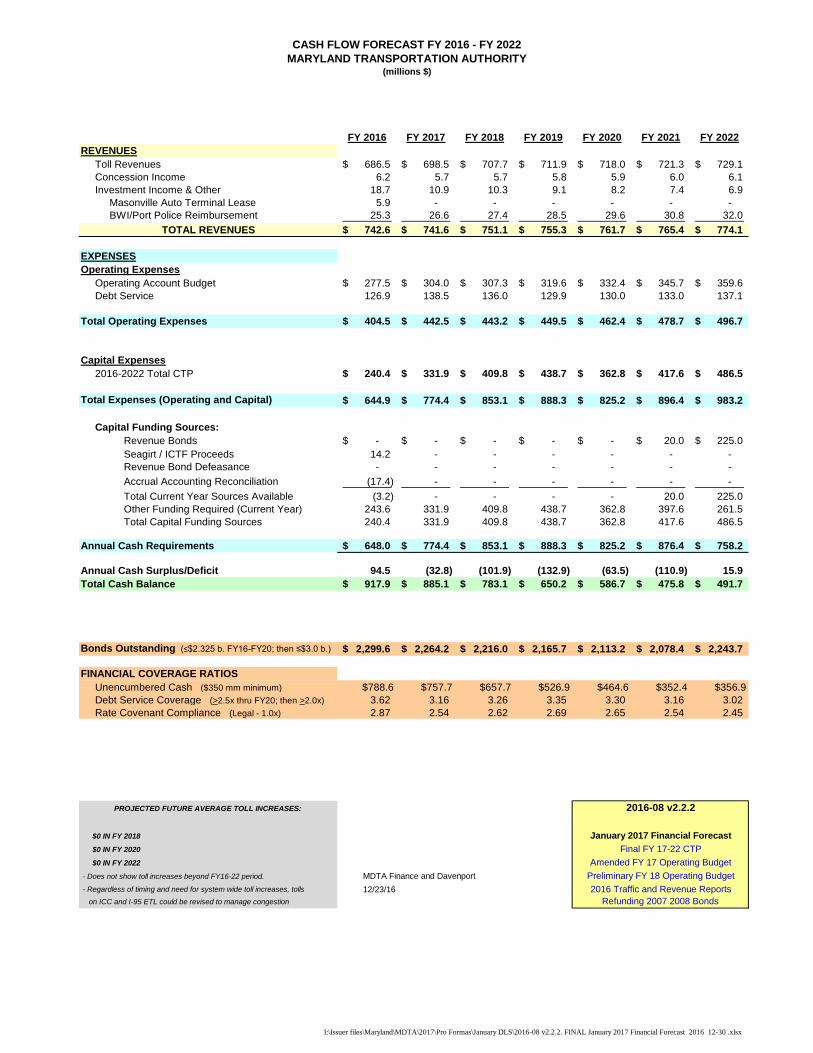
CASH FLOW FORECAST FY 2016 - FY 2022
MARYLAND TRANSPORTATION AUTHORITY(millions $)
FY 2016 FY 2017 FY 2018 FY 2019 FY 2020 FY 2021 FY 2022
REVENUES
Toll Revenues 686.5$ 698.5$ 707.7$ 711.9$ 718.0$ 721.3$ 729.1$
Concession Income 6.2 5.7 5.7 5.8 5.9 6.0 6.1
Investment Income & Other 18.7 10.9 10.3 9.1 8.2 7.4 6.9
Masonville Auto Terminal Lease 5.9 - - - - - -
BWI/Port Police Reimbursement 25.3 26.6 27.4 28.5 29.6 30.8 32.0
TOTAL REVENUES 742.6$ 741.6$ 751.1$ 755.3$ 761.7$ 765.4$ 774.1$
EXPENSES
Operating Expenses
Operating Account Budget 277.5$ 304.0$ 307.3$ 319.6$ 332.4$ 345.7$ 359.6$
Debt Service (net of capitalized interest) 126.9 138.5 136.0 129.9 130.0 133.0 137.1
Total Operating Expenses 404.5$ 442.5$ 443.2$ 449.5$ 462.4$ 478.7$ 496.7$
Capital Expenses
2016-2022 Total CTP 240.4$ 331.9$ 409.8$ 438.7$ 362.8$ 417.6$ 486.5$
Total Expenses (Operating and Capital) (and M&O) 644.9$ 774.4$ 853.1$ 888.3$ 825.2$ 896.4$ 983.2$
Capital Funding Sources:
Revenue Bonds -$ -$ -$ -$ -$ 20.0$ 225.0$
Seagirt / ICTF Proceeds 14.2 - - - - - -
Revenue Bond Defeasance - - - - - - -
Accrual Accounting Reconciliation (17.4) - - - - - -
Total Current Year Sources Available (3.2) - - - - 20.0 225.0
Other Funding Required (Current Year) 243.6 331.9 409.8 438.7 362.8 397.6 261.5
Total Capital Funding Sources 240.4 331.9 409.8 438.7 362.8 417.6 486.5
Annual Cash Requirements 648.0$ 774.4$ 853.1$ 888.3$ 825.2$ 876.4$ 758.2$
Annual Cash Surplus/Deficit 94.5 (32.8) (101.9) (132.9) (63.5) (110.9) 15.9
Total Cash Balance 917.9$ 885.1$ 783.1$ 650.2$ 586.7$ 475.8$ 491.7$
Bonds Outstanding (≤$2.325 b. FY16-FY20; then ≤$3.0 b.) 2,299.6$ 2,264.2$ 2,216.0$ 2,165.7$ 2,113.2$ 2,078.4$ 2,243.7$
FINANCIAL COVERAGE RATIOS
Unencumbered Cash ($350 mm minimum) $788.6 $757.7 $657.7 $526.9 $464.6 $352.4 $356.9
Debt Service Coverage (>2.5x thru FY20; then >2.0x) 3.62 3.16 3.26 3.35 3.30 3.16 3.02
Rate Covenant Compliance (Legal - 1.0x) 2.87 2.54 2.62 2.69 2.65 2.54 2.45
PROJECTED FUTURE AVERAGE TOLL INCREASES:
$0 IN FY 2018
$0 IN FY 2020
$0 IN FY 2022
- Does not show toll increases beyond FY16-22 period. MDTA Finance and Davenport
- Regardless of timing and need for system wide toll increases, tolls
on ICC and I-95 ETL could be revised to manage congestion
2016-08 v2.2.2
January 2017 Financial Forecast
Final FY 17-22 CTP
Amended FY 17 Operating Budget
Preliminary FY 18 Operating Budget
2016 Traffic and Revenue Reports12/23/16
Refunding 2007 2008 Bonds
I:\Issuer files\Maryland\MDTA\2017\Pro Formas\January DLS\2016-08 v2.2.2. FINAL January 2017 Financial Forecast 2016 12-30 .xlsx
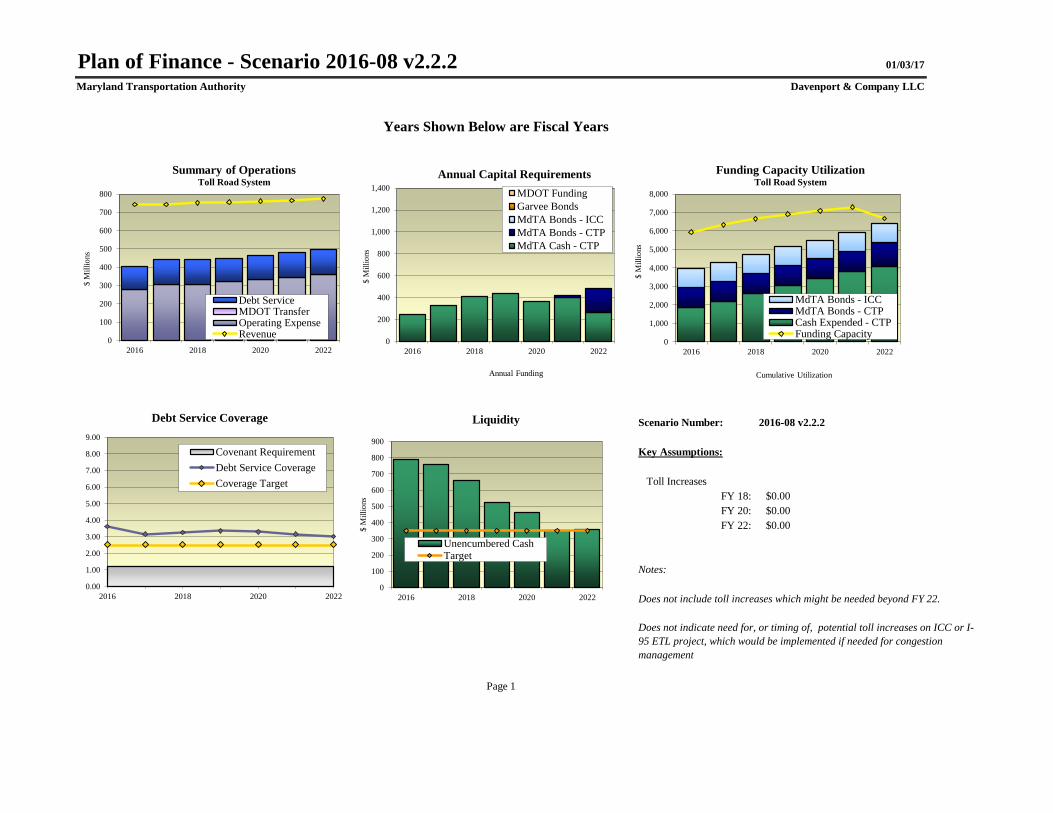
Plan of Finance - Scenario 2016-08 v2.2.2 01/03/17
Maryland Transportation Authority Davenport & Company LLC
Years Shown Below are Fiscal Years
Scenario Number: 2016-08 v2.2.2
Key Assumptions:
Toll Increases
FY 18: $0.00
FY 20: $0.00
FY 22: $0.00
Notes:
Does not include toll increases which might be needed beyond FY 22.
Page 1
Does not indicate need for, or timing of, potential toll increases on ICC or I-
95 ETL project, which would be implemented if needed for congestion
management
0
100
200
300
400
500
600
700
800
2016 2018 2020 2022
$ M
illi
ons
Summary of OperationsToll Road System
Debt ServiceMDOT TransferOperating ExpenseRevenue
0
200
400
600
800
1,000
1,200
1,400
2016 2018 2020 2022
$ M
illi
ons
Annual Funding
Annual Capital Requirements
MDOT Funding
Garvee Bonds
MdTA Bonds - ICC
MdTA Bonds - CTP
MdTA Cash - CTP
0
1,000
2,000
3,000
4,000
5,000
6,000
7,000
8,000
2016 2018 2020 2022
$ M
illi
ons
Cumulative Utilization
Funding Capacity UtilizationToll Road System
MdTA Bonds - ICCMdTA Bonds - CTPCash Expended - CTPFunding Capacity
0
100
200
300
400
500
600
700
800
900
2016 2018 2020 2022
$ M
illi
ons
Liquidity
Unencumbered CashTarget
0.00
1.00
2.00
3.00
4.00
5.00
6.00
7.00
8.00
9.00
2016 2018 2020 2022
Debt Service Coverage
Covenant Requirement
Debt Service Coverage
Coverage Target

Summary of Operations 01/03/17
Maryland Transportation Authority Davenport & Company LLC
Fiscal Year 2016 2017 2018 2019 2020 2021 2022
1 Revenue (millions)
2 Toll and Concession Revenue 693 704 713 718 724 727 735
3 Other Revenue 50 37 38 38 38 38 39
4 Total Revenue 743$ 742$ 751$ 755$ 762$ 765$ 774$
5 Expense (millions)
6 Operating Expense 278 304 307 320 332 346 360
7 MDOT Transfer 0 0 0 0 0 0 0
8 Total Expense 278 304 307 320 332 346 360
9 Net Revenue 465$ 438$ 444$ 436$ 429$ 420$ 415$
10 Net Debt Service (millions) 127 138 136 130 130 133 137
11 Surplus (millions) 338 299 308 306 299 287 277
12 Capital Expenditures (Cash) (millions) 244 332 410 439 363 398 261
13 Change in Total Cash (millions) 95$ (33)$ (102)$ (133)$ (63)$ (111)$ 16$
14 Total Cash Balance (millions) 918$ 885$ 783$ 650$ 587$ 476$ 492$
15 Ratio of Cash to Toll Revenue 133% 126% 110% 91% 81% 65% 67%
16 Debt Service Coverage 3.62 3.16 3.26 3.35 3.30 3.16 3.02
Page 2
0
100
200
300
400
500
600
700
800
900
2016 2017 2018 2019 2020 2021 2022
$ M
illi
on
s
Cash Reserves
Unencumbered Cash
Target
0
100
200
300
400
500
600
700
800
2016 2017 2018 2019 2020 2021 2022
$ M
illi
on
s
Summary of OperationsToll Road System
Debt Service
MDOT Transfer
Operating Expense
Revenue

Outstanding Debt 01/03/17
Davenport & Company LLC Maryland Transportation Authority Davenport & Company LLC
Transportation Facilities Bonds: Conduit Financings:
Series 2007 295.61$ Airport Parking Revenue Bonds:
Series 2008 535.57$ Series 2012A & B 148.06$
Series 2009 549.39$ Airport Car Rental Facility Bonds:
Series 2010 321.90$ Series 2002 90.90$
TIFIA 529.52$ Airport PFC Bonds (4):
Series 2012 67.61$ Series 2012A, B, & C, 2014 200.25$
WMATA Parking Bonds:
Total 2,299.58$ Series 2014 25.44$
Calvert Street Parking Bonds:
Series 2015 18.01$
Total 482.66$
Page 3
Bonds Outstanding - June 30, 2016
(Millions)
0
10
20
30
40
50
60
2016 2019 2022 2025 2028 2031
$ M
illi
on
s
Conduit Financings
Annual Debt Service
Calvert Street Parking BondsAirport Passenger Facility BondsAirport Parking BondsWMATAAirport Car Rental Bonds
0
20
40
60
80
100
120
140
160
180
200
20
16
20
19
20
22
20
25
20
28
20
31
20
34
20
37
20
40
20
43
20
46
20
49
$ M
illi
on
s
Transportation Facilities
Annual Debt Service
TIFIA
Series 2012
Series 2010
Series 2009
Series 2008
Series 2007

Planned Debt 01/03/17
Davenport & Company LLC Maryland Transportation AuthorityMaryland Transportation Authority Davenport & Company LLC
Fiscal Year 2016 2017 2018 2019 2020 2021 2022
1 Bonds Issued (millions)
2 MdTA Bonds Issued (1) -$ -$ -$ -$ -$ 20$ 225$
3 Garvee Bonds Issued - - - - - - -
4 Total Bonds Issued -$ -$ -$ -$ -$ 20$ 225$
5 Debt Service (millions)
6 MdTA Debt Service 127$ 138$ 136$ 130$ 130$ 133$ 137$
7 Garvee Bond Debt Service 87 87 87 87 51 - -
8 Coverage (millions)
9 Net Revenue 465$ 438$ 444$ 436$ 429$ 420$ 415$
10 MdTA Debt Service 127 138 136 130 130 133 137
11 Debt Service Coverage 3.62 3.16 3.26 3.35 3.30 3.16 3.02
(1) Total Bonds Issued
Page 4
0.00
1.00
2.00
3.00
4.00
5.00
6.00
7.00
8.00
9.00
2016 2017 2018 2019 2020 2021 2022
Debt Service Coverage
Including Planned Issues
Covenant Requirement
Debt Service Coverage
Coverage Target
0
50
100
150
200
250
300
350
400
20
16
20
17
20
18
20
19
20
20
20
21
20
22
$ M
illi
on
s
Debt Service Payments
Including Planned Issues
Series 2007 Series 2008 Series 2009
Series 2010 Series 2012 TIFIA
Future Debt
Capital Program 01/03/17
Maryland Transportation Authority Davenport & Company LLC
2016 2017 2018 2019 2020 2021 2022
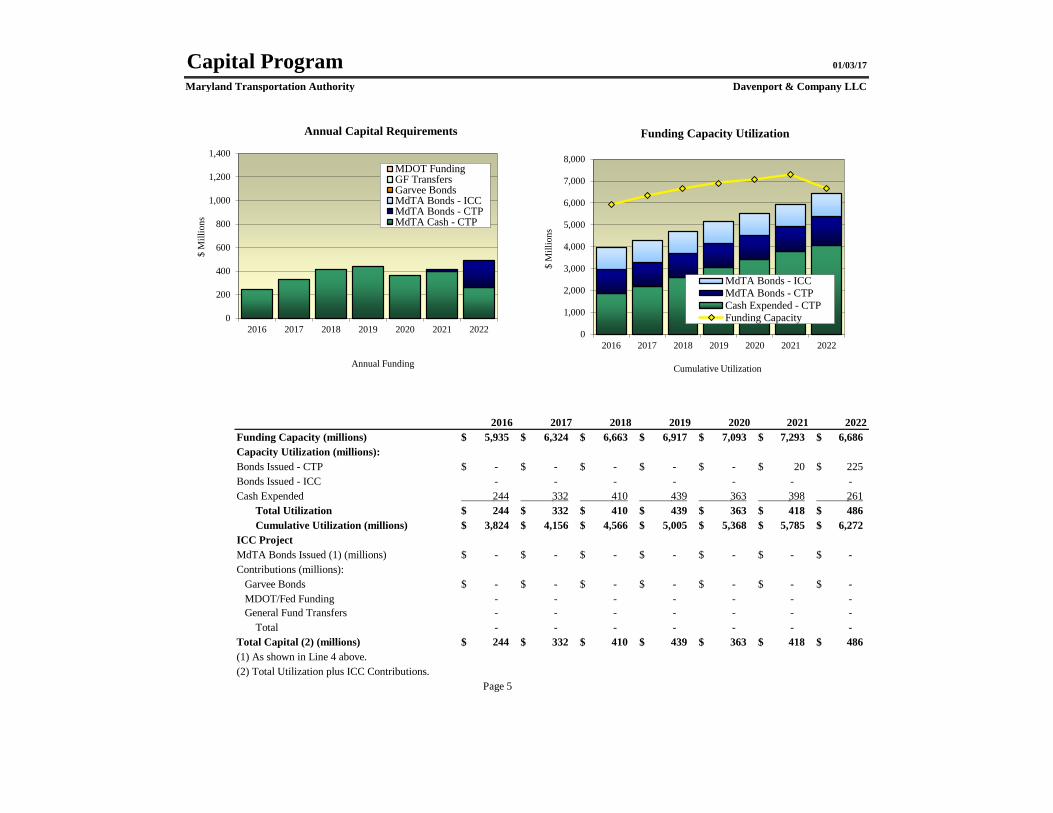
Funding Capacity (millions) 5,935$ 6,324$ 6,663$ 6,917$ 7,093$ 7,293$ 6,686$
Capacity Utilization (millions):
Bonds Issued - CTP -$ -$ -$ -$ -$ 20$ 225$
Bonds Issued - ICC - - - - - - -
Cash Expended 244 332 410 439 363 398 261
Total Utilization 244$ 332$ 410$ 439$ 363$ 418$ 486$
Cumulative Utilization (millions) 3,824$ 4,156$ 4,566$ 5,005$ 5,368$ 5,785$ 6,272$
ICC Project
MdTA Bonds Issued (1) (millions) -$ -$ -$ -$ -$ -$ -$
Contributions (millions):
Garvee Bonds -$ -$ -$ -$ -$ -$ -$
MDOT/Fed Funding - - - - - - -
General Fund Transfers - - - - - - -
Total - - - - - - -
Total Capital (2) (millions) 244$ 332$ 410$ 439$ 363$ 418$ 486$
(1) As shown in Line 4 above.
(2) Total Utilization plus ICC Contributions.
Page 5
0
200
400
600
800
1,000
1,200
1,400
2016 2017 2018 2019 2020 2021 2022
$ M
illi
on
s
Annual Funding
Annual Capital Requirements
MDOT FundingGF TransfersGarvee BondsMdTA Bonds - ICCMdTA Bonds - CTPMdTA Cash - CTP
0
1,000
2,000
3,000
4,000
5,000
6,000
7,000
8,000
2016 2017 2018 2019 2020 2021 2022
$ M
illi
on
s
Cumulative Utilization
Funding Capacity Utilization
MdTA Bonds - ICC
MdTA Bonds - CTP
Cash Expended - CTP
Funding Capacity
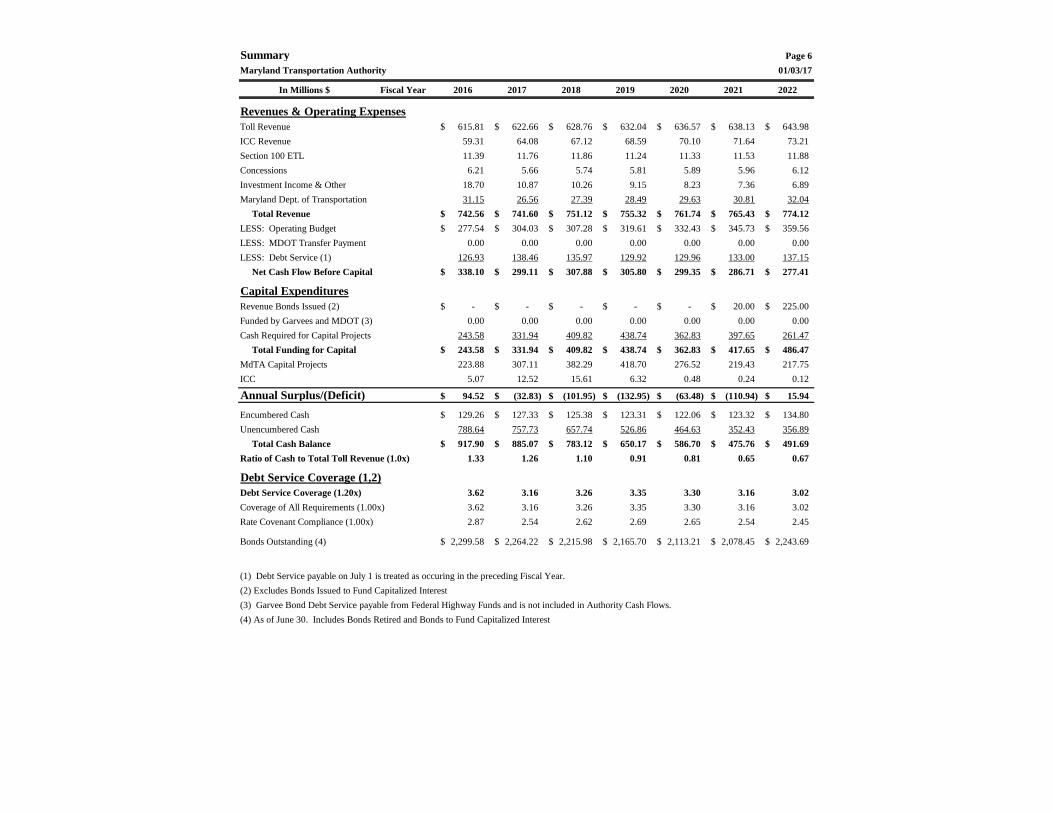
Summary Page 6
Maryland Transportation Authority 01/03/17
In Millions $ Fiscal Year 2016 2017 2018 2019 2020 2021 2022
Revenues & Operating Expenses
Toll Revenue 615.81$ 622.66$ 628.76$ 632.04$ 636.57$ 638.13$ 643.98$
ICC Revenue 59.31 64.08 67.12 68.59 70.10 71.64 73.21
Section 100 ETL 11.39 11.76 11.86 11.24 11.33 11.53 11.88
Concessions 6.21 5.66 5.74 5.81 5.89 5.96 6.12
Investment Income & Other 18.70 10.87 10.26 9.15 8.23 7.36 6.89
Maryland Dept. of Transportation 31.15 26.56 27.39 28.49 29.63 30.81 32.04
Total Revenue 742.56$ 741.60$ 751.12$ 755.32$ 761.74$ 765.43$ 774.12$
LESS: Operating Budget 277.54$ 304.03$ 307.28$ 319.61$ 332.43$ 345.73$ 359.56$
LESS: MDOT Transfer Payment 0.00 0.00 0.00 0.00 0.00 0.00 0.00
LESS: Debt Service (1) 126.93 138.46 135.97 129.92 129.96 133.00 137.15
Net Cash Flow Before Capital 338.10$ 299.11$ 307.88$ 305.80$ 299.35$ 286.71$ 277.41$
Capital Expenditures
Revenue Bonds Issued (2) -$ -$ -$ -$ -$ 20.00$ 225.00$
Funded by Garvees and MDOT (3) 0.00 0.00 0.00 0.00 0.00 0.00 0.00
Cash Required for Capital Projects 243.58 331.94 409.82 438.74 362.83 397.65 261.47
Total Funding for Capital 243.58$ 331.94$ 409.82$ 438.74$ 362.83$ 417.65$ 486.47$
MdTA Capital Projects 223.88 307.11 382.29 418.70 276.52 219.43 217.75
ICC 5.07 12.52 15.61 6.32 0.48 0.24 0.12
Annual Surplus/(Deficit) 94.52$ (32.83)$ (101.95)$ (132.95)$ (63.48)$ (110.94)$ 15.94$
Encumbered Cash 129.26$ 127.33$ 125.38$ 123.31$ 122.06$ 123.32$ 134.80$
Unencumbered Cash 788.64 757.73 657.74 526.86 464.63 352.43 356.89
Total Cash Balance 917.90$ 885.07$ 783.12$ 650.17$ 586.70$ 475.76$ 491.69$
Ratio of Cash to Total Toll Revenue (1.0x) 1.33 1.26 1.10 0.91 0.81 0.65 0.67
Debt Service Coverage (1,2)
Debt Service Coverage (1.20x) 3.62 3.16 3.26 3.35 3.30 3.16 3.02
Coverage of All Requirements (1.00x) 3.62 3.16 3.26 3.35 3.30 3.16 3.02
Rate Covenant Compliance (1.00x) 2.87 2.54 2.62 2.69 2.65 2.54 2.45
Bonds Outstanding (4) 2,299.58$ 2,264.22$ 2,215.98$ 2,165.70$ 2,113.21$ 2,078.45$ 2,243.69$
(1) Debt Service payable on July 1 is treated as occuring in the preceding Fiscal Year.
(2) Excludes Bonds Issued to Fund Capitalized Interest
(3) Garvee Bond Debt Service payable from Federal Highway Funds and is not included in Authority Cash Flows.
(4) As of June 30. Includes Bonds Retired and Bonds to Fund Capitalized Interest

Revenue and Expense Summary Page 7
Maryland Transportation Authority 01/03/17
In Millions $ Fiscal Year 2016 2017 2018 2019 2020 2021 2022
Revenue
Tolls 581.41$ 589.62$ 595.53$ 598.62$ 602.96$ 604.31$ 609.97$
Other Toll Revenue 34.40 33.05 33.24 33.43 33.62 33.81 34.00
Concessions 6.21 5.66 5.74 5.81 5.89 5.96 6.12
ICC Revenue 59.31 64.08 67.12 68.59 70.10 71.64 73.21
Section 100 ETL 11.39 11.76 11.86 11.24 11.33 11.53 11.88
Other Revenue 4.19 1.90 1.96 2.02 2.08 2.08 2.08
Investment Income 14.51 8.97 8.30 7.13 6.15 5.29 4.81
Maryland Dept. of Transportation:
Seagirt 0.00 0.00 0.00 0.00 0.00 0.00 0.00
BWI & Port Police 25.28 26.56 27.39 28.49 29.63 30.81 32.04
Annual Funding Agreement, MDOT 0.00 0.00 0.00 0.00 0.00 0.00 0.00
Misc 0.00 0.00 0.00 0.00 0.00 0.00 0.00
Masonville 5.87 0.00 0.00 0.00 0.00 0.00 0.00
Total Revenue 742.56$ 741.60$ 751.12$ 755.32$ 761.74$ 765.43$ 774.12$
Expenses
Operations (Basic and M&O) 243.27$ 266.65$ 268.51$ 279.25$ 290.42$ 302.04$ 314.12$
ICC Operations & Maintenance 8.66 10.22 10.78 11.21 11.66 12.13 12.61
Equipment and Insurance 0.00 0.00 0.00 0.00 0.00 0.00 0.00
Section 100 ETL 0.33 0.60 0.60 0.66 0.73 0.76 0.79
BWI and Port Police 25.28 26.56 27.39 28.49 29.63 30.81 32.04
MDOT Transit Initiative 0.00 0.00 0.00 0.00 0.00 0.00 0.00
Other Expense 0.00 0.00 0.00 0.00 0.00 0.00 0.00
Total Expense 277.54$ 304.03$ 307.28$ 319.61$ 332.43$ 345.73$ 359.56$
Surplus 465.02$ 437.57$ 443.84$ 435.71$ 429.31$ 419.70$ 414.56$
Debt Service (1,2) 126.93 138.46 135.97 129.92 129.96 133.00 137.15
Net Cash Flow Before Capital 338.10$ 299.11$ 307.88$ 305.80$ 299.35$ 286.71$ 277.41$
Capital Projects
M&O Reserve Expenditures -$ -$ -$ -$ -$ -$ -$
CTP Projects 223.88 307.11 382.29 418.70 276.52 219.43 217.75
ICC 5.07 12.52 15.61 6.32 0.48 0.24 0.12
Nice Bridge Funding Requirements 11.46 12.31 11.93 13.73 85.83 197.98 268.60
Total Capital Projects 240.42$ 331.94$ 409.82$ 438.74$ 362.83$ 417.65$ 486.47$
Less: Seagirt / ICTF Proceeds (14.20) 0.00 0.00 0.00 0.00 0.00 0.00
Less: Other Funding / Reconciling Item (2) 17.36 0.00 0.00 0.00 0.00 0.00 0.00
Less: Revenue Bonds Issued 0.00 0.00 0.00 0.00 0.00 (20.00) (225.00)
Cash Required for Cap. 243.58$ 331.94$ 409.82$ 438.74$ 362.83$ 397.65$ 261.47$
Other / Revenue Bond Defeasance 0.00 0.00 0.00 0.00 0.00 0.00 0.00
Ending Cash Balance* 917.90$ 885.07$ 783.12$ 650.17$ 586.70$ 475.76$ 491.69$
Encumbered Cash Balance 129.26$ 127.33$ 125.38$ 123.31$ 122.06$ 123.32$ 134.80$
Unencumbered Cash Balance 788.64 757.73 657.74 526.86 464.63 352.43 356.89
(1) Debt Service payable on July 1 is treated as occuring in the preceding Fiscal Year.
(2) Includes Reconciling Item for FY 13-16.
*FY 08 Restated to reflect Cash Balances equivalent to Investment Values on a cost Basis
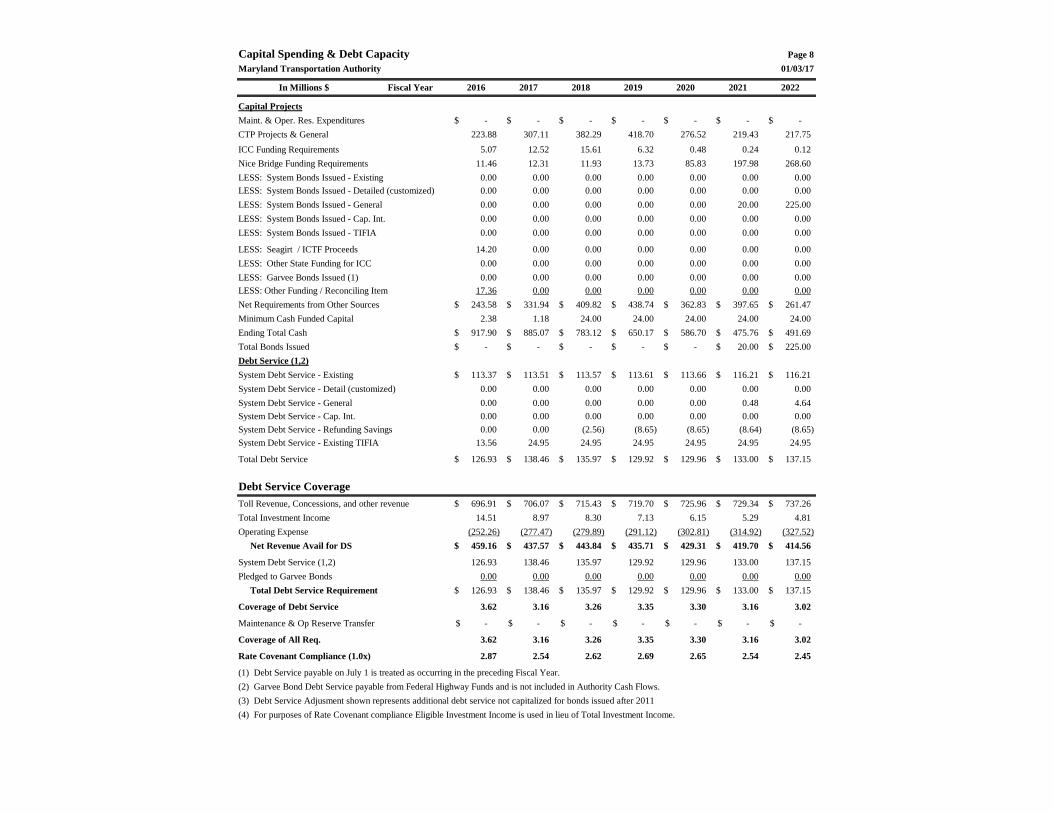
Capital Spending & Debt Capacity Page 8
Maryland Transportation Authority 01/03/17
In Millions $ Fiscal Year 2016 2017 2018 2019 2020 2021 2022
Capital Projects
Maint. & Oper. Res. Expenditures -$ -$ -$ -$ -$ -$ -$
CTP Projects & General 223.88 307.11 382.29 418.70 276.52 219.43 217.75
ICC Funding Requirements 5.07 12.52 15.61 6.32 0.48 0.24 0.12
Nice Bridge Funding Requirements 11.46 12.31 11.93 13.73 85.83 197.98 268.60
LESS: System Bonds Issued - Existing 0.00 0.00 0.00 0.00 0.00 0.00 0.00
LESS: System Bonds Issued - Detailed (customized) 0.00 0.00 0.00 0.00 0.00 0.00 0.00
LESS: System Bonds Issued - General 0.00 0.00 0.00 0.00 0.00 20.00 225.00
LESS: System Bonds Issued - Cap. Int. 0.00 0.00 0.00 0.00 0.00 0.00 0.00
LESS: System Bonds Issued - TIFIA 0.00 0.00 0.00 0.00 0.00 0.00 0.00
LESS: Seagirt / ICTF Proceeds 14.20 0.00 0.00 0.00 0.00 0.00 0.00
LESS: Other State Funding for ICC 0.00 0.00 0.00 0.00 0.00 0.00 0.00
LESS: Garvee Bonds Issued (1) 0.00 0.00 0.00 0.00 0.00 0.00 0.00
LESS: Other Funding / Reconciling Item 17.36 0.00 0.00 0.00 0.00 0.00 0.00
Net Requirements from Other Sources 243.58$ 331.94$ 409.82$ 438.74$ 362.83$ 397.65$ 261.47$
Minimum Cash Funded Capital 2.38 1.18 24.00 24.00 24.00 24.00 24.00
Ending Total Cash 917.90$ 885.07$ 783.12$ 650.17$ 586.70$ 475.76$ 491.69$
Total Bonds Issued -$ -$ -$ -$ -$ 20.00$ 225.00$
Debt Service (1,2)
System Debt Service - Existing 113.37$ 113.51$ 113.57$ 113.61$ 113.66$ 116.21$ 116.21$
System Debt Service - Detail (customized) 0.00 0.00 0.00 0.00 0.00 0.00 0.00
System Debt Service - General 0.00 0.00 0.00 0.00 0.00 0.48 4.64
System Debt Service - Cap. Int. 0.00 0.00 0.00 0.00 0.00 0.00 0.00
System Debt Service - Refunding Savings 0.00 0.00 (2.56) (8.65) (8.65) (8.64) (8.65)
System Debt Service - Existing TIFIA 13.56 24.95 24.95 24.95 24.95 24.95 24.95
Total Debt Service 126.93$ 138.46$ 135.97$ 129.92$ 129.96$ 133.00$ 137.15$
Debt Service Coverage
Toll Revenue, Concessions, and other revenue 696.91$ 706.07$ 715.43$ 719.70$ 725.96$ 729.34$ 737.26$
Total Investment Income 14.51 8.97 8.30 7.13 6.15 5.29 4.81
Operating Expense (252.26) (277.47) (279.89) (291.12) (302.81) (314.92) (327.52)
Net Revenue Avail for DS 459.16$ 437.57$ 443.84$ 435.71$ 429.31$ 419.70$ 414.56$
System Debt Service (1,2) 126.93 138.46 135.97 129.92 129.96 133.00 137.15
Pledged to Garvee Bonds 0.00 0.00 0.00 0.00 0.00 0.00 0.00
Total Debt Service Requirement 126.93$ 138.46$ 135.97$ 129.92$ 129.96$ 133.00$ 137.15$
Coverage of Debt Service 3.62 3.16 3.26 3.35 3.30 3.16 3.02
Maintenance & Op Reserve Transfer -$ -$ -$ -$ -$ -$ -$
Coverage of All Req. 3.62 3.16 3.26 3.35 3.30 3.16 3.02
Rate Covenant Compliance (1.0x) 2.87 2.54 2.62 2.69 2.65 2.54 2.45
(1) Debt Service payable on July 1 is treated as occurring in the preceding Fiscal Year.
(2) Garvee Bond Debt Service payable from Federal Highway Funds and is not included in Authority Cash Flows.
(3) Debt Service Adjusment shown represents additional debt service not capitalized for bonds issued after 2011
(4) For purposes of Rate Covenant compliance Eligible Investment Income is used in lieu of Total Investment Income.
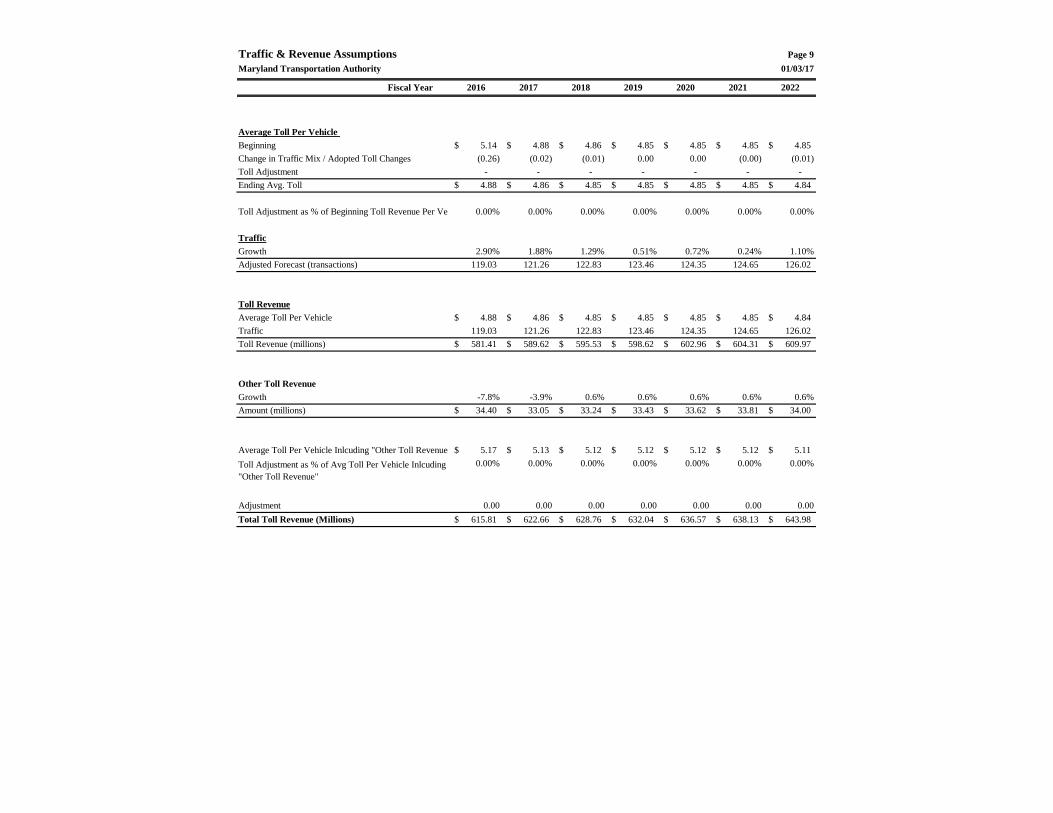
Traffic & Revenue Assumptions Page 9
Maryland Transportation Authority 01/03/17
Fiscal Year 2016 2017 2018 2019 2020 2021 2022
Average Toll Per Vehicle
Beginning 5.14$ 4.88$ 4.86$ 4.85$ 4.85$ 4.85$ 4.85$
Change in Traffic Mix / Adopted Toll Changes (0.26) (0.02) (0.01) 0.00 0.00 (0.00) (0.01)
Toll Adjustment - - - - - - -
Ending Avg. Toll 4.88$ 4.86$ 4.85$ 4.85$ 4.85$ 4.85$ 4.84$
Toll Adjustment as % of Beginning Toll Revenue Per Vehicle 0.00% 0.00% 0.00% 0.00% 0.00% 0.00% 0.00%
Traffic
Growth 2.90% 1.88% 1.29% 0.51% 0.72% 0.24% 1.10%
Adjusted Forecast (transactions) 119.03 121.26 122.83 123.46 124.35 124.65 126.02
Toll Revenue
Average Toll Per Vehicle 4.88$ 4.86$ 4.85$ 4.85$ 4.85$ 4.85$ 4.84$
Traffic 119.03 121.26 122.83 123.46 124.35 124.65 126.02
Toll Revenue (millions) 581.41$ 589.62$ 595.53$ 598.62$ 602.96$ 604.31$ 609.97$
Other Toll Revenue
Growth -7.8% -3.9% 0.6% 0.6% 0.6% 0.6% 0.6%
Amount (millions) 34.40$ 33.05$ 33.24$ 33.43$ 33.62$ 33.81$ 34.00$
Average Toll Per Vehicle Inlcuding "Other Toll Revenue" 5.17$ 5.13$ 5.12$ 5.12$ 5.12$ 5.12$ 5.11$
0.00% 0.00% 0.00% 0.00% 0.00% 0.00% 0.00%
Adjustment 0.00 0.00 0.00 0.00 0.00 0.00 0.00
Total Toll Revenue (Millions) 615.81$ 622.66$ 628.76$ 632.04$ 636.57$ 638.13$ 643.98$
Toll Adjustment as % of Avg Toll Per Vehicle Inlcuding
"Other Toll Revenue"

General Assumptions Page 10
Maryland Transportation Authority 01/03/17
Fiscal Year 2016 2017 2018 2019 2020 2021 2022
Other Revenue
Concessions 22.54% -8.84% 1.27% 1.31% 1.31% 1.31% 2.62%
Other Revenue 134.07% -54.68% 3.00% 3.00% 3.00% 0.00% 0.00%
Seagirt 0.00% 0.00% 0.00% 0.00% 0.00% 0.00% 0.00%
DOT - BWI/ Port Police 1.41% 5.06% 3.13% 4.00% 4.00% 4.00% 4.00%
Annual Funding Agreement, MDOT 0.00% 0.00% 0.00% 0.00% 0.00% 0.00% 0.00%
Misc 0.00% 0.00% 0.00% 0.00% 0.00% 0.00% 0.00%
Masonville (millions) 5.866 0.000 0.000 0.000 0.000 -100.00% 0.00%
Investment Yield 14.51 1.00% 1.00% 1.00% 1.00% 1.00% 1.00%
Expenses
Operations (Basic)
Operations (M&O)
Operations (Basic and M&O) (millions) 243.27 266.65 268.51 4.00% 4.00% 4.00% 4.00%
Section 100 ETL 0.33 0.60 0.00% 10.00% 10.00% 4.00% 4.00%
Equipment and Insurance 0.00 0.00 0.00 0.00 0.00 0.00 0.00
BWI and Port Police (millions) 25.28 26.56 27.39 4.00% 4.00% 4.00% 4.00%
MDOT Transit Initiative 0.00% 0.00% 0.00% 0.00% 0.00% 0.00% 0.00%
Other Expense 0.00% 0.00% 0.00% 0.00% 0.00% 0.00% 0.00%
M&O Reserve Transfer (millions)
M&O CTP -$ -$ -$ -$ -$ -$ -$
Other Requirements 0.00 0.00 0.00 0.00 0.00 0.00 0.00
LESS: Advanced Funding 0.00 0.00 0.00 0.00 0.00 0.00 0.00
LESS: Other Funding 0.00 0.00 0.00 0.00 0.00 0.00 0.00
Required Transfer -$ -$ -$ -$ -$ -$ -$
Encumbered Cash (millions)
Operating Account 52.89$ 52.89$ 52.89$ 52.89$ 52.89$ 52.89$ 52.89$
Maintenance & Operating Reserve 0.00 0.00 0.00 0.00 0.00 0.00 0.00
Advanced Payments - M&O Reserve 0.00 0.00 0.00 0.00 0.00 0.00 0.00
Seagirt Proceeds Account 0.00 0.00 0.00 0.00 0.00 0.00 0.00
GARVEE Debt Service Reserve Fund 7.20 5.27 3.32 1.25 0.00 0.00 0.00
Unspent Bond Proceeds 0.00 0.00 0.00 0.00 0.00 0.00 0.00
TRB Debt Service Reserve Fund 69.17 69.17 69.17 69.17 69.17 70.43 81.91
ICC Depository 0.00 0.00 0.00 0.00 0.00 0.00 0.00
Encumberance for Nice Bridge Projects 0.00 0.00 0.00 0.00 0.00 0.00 0.00
Total Encumbered Cash 129.26$ 127.33$ 125.38$ 123.31$ 122.06$ 123.32$ 134.80$
Section 100 ETL Traffic and Revenue
Section 100 ETL Revenue (millions) 11.39$ 11.76$ 11.86$ 11.24$ 11.33$ 11.53$ 11.88$
Section 100 ETL Traffic (millions) 8.27 8.55 8.64 8.21 8.29 8.46 8.71
Section 100 ETL Average Toll 1.38$ 1.38$ 1.37$ 1.37$ 1.37$ 1.36$ 1.36$
ICC Revenue and Expenses
Traffic Growth 24.28% 8.39% 4.80% 2.19% 2.19% 2.20% 2.20%
ICC Traffic 29.975 32.49 34.05 34.80 35.56 36.34 37.14
Average Toll/Vehicle Adjustment (0.34)$ (0.01)$ (0.00)$ (0.00)$ 0.00$ (0.00)$ (0.00)$
Average Toll 1.98$ 1.97$ 1.97$ 1.97$ 1.97$ 1.97$ 1.97$
ICC Revenue (millions) 59.31$ 64.08$ 67.12$ 68.59$ 70.10$ 71.64$ 73.21$
Operating and Maintenance (Growth) -8.52% 18.01% 5.48% 4.00% 4.00% 4.00% 4.00%
ICC O&M (millions) 8.66$ 10.22$ 10.78$ 11.21$ 11.66$ 12.13$ 12.61$
Note: ICC Revenue derived from WSA Forecast and includes an evasion factor.
ICC Revenue Adjustment 0.00 0.00 0.00 0.00 0.00 0.00 0.00

ICC Project - Conceptual Finance Plan Summary Scenario: Page 11
Maryland Transportation Authority Davenport & Company LLC
In Millions Total FY 2004 FY 2005 FY 2006 FY 2007 FY 2008 FY 2009 FY 2010 FY 2011 FY 2012 FY 2013 FY 2014 FY 2015 FY 2016 FY 2017 FY 2018 FY 2019 FY 2020 FY 2021 FY 2022
Funding Requirement 2,386.47$ 6.96$ 37.92$ 29.84$ 145.74$ 277.30$ 385.70$ 565.89$ 532.28$ 194.76$ 68.05$ 77.75$ 24.04$ 5.07$ 12.52$ 15.61$ 6.32$ 0.48$ 0.24$ 0.12$
Sources of Funds (millions)Garvee Bonds 750.00$ -$ -$ -$ 325.00$ -$ 425.00$ -$ -$ -$ -$ -$ -$ -$ -$ -$ -$ -$ -$ -$
Additional Funds from GARVEE Sale (0.00) 0.00 0.00 0.00 16.91 0.00 0.00 0.00 0.00 (16.91) 0.00 0.00 0.00 0.00 0.00 0.00 0.00 0.00 0.00 0.00
MDOT- P.A.Y.G. 180.00 0.00 22.00 38.00 30.00 30.00 30.00 30.00 0.00 0.00 0.00 0.00 0.00 0.00 0.00 0.00 0.00 0.00 0.00 0.00
General Funds / General Obligation Bonds 264.91 0.00 0.00 0.00 53.00 0.00 0.00 55.00 89.28 46.15 0.00 21.48 0.00 0.00 0.00 0.00 0.00 0.00 0.00 0.00
Spec. Fed Funds - P.A.Y.G. 19.27 0.00 0.00 0.58 18.00 0.69 0.00 0.00 0.00 0.00 0.00 0.00 0.00 0.00 0.00 0.00 0.00 0.00 0.00 0.00
MdTa Bonds - TRB 496.40 0.00 0.00 0.00 0.00 176.77 0.00 235.59 84.06 0.00 0.00 0.00 0.00 0.00 0.00 0.00 0.00 0.00 0.00 0.00
MdTa Bonds - TIFIA Loan 516.00 0.00 0.00 0.00 0.00 0.00 0.00 0.00 347.23 36.74 0.00 0.00 132.02 0.00 0.00 0.00 0.00 0.00 0.00 0.00
MdTA Reserves(1)
159.89 6.960 19.840 0.00 0.00 0.00 0.00 0.00 0.00 132.02 4.23 87.89 (131.30) 5.07 12.52 15.61 6.32 0.48 0.24 0.12
Total Sources of Funds 2,386.47$ 6.96$ 41.84$ 38.58$ 442.91$ 207.46$ 455.00$ 320.59$ 520.57$ 198.01$ 4.23$ 109.37$ 0.72$ 5.07$ 12.52$ 15.61$ 6.32$ 0.48$ 0.24$ 0.12$
Cumulative Surplus (Deficit) 0.00 3.92 12.63 309.80 239.96 309.27 63.97 52.26 55.51 (8.30) 23.32 0.00 0.00 0.00 0.00 0.00 0.00 0.00 0.00
Debt Service (millions)Garvee Bonds - W/O Support -$ -$ -$ -$ 36.09$ 40.36$ 87.46$ 87.46$ 87.46$ 87.45$ 87.46$ 87.45$ 87.45$ 87.45$ 87.46$ 87.45$ 51.36$ -$ -$
Total Garvee Debt Service -$ -$ -$ -$ 36.09$ 40.36$ 87.46$ 87.46$ 87.46$ 87.45$ 87.46$ 87.45$ 87.45$ 87.45$ 87.46$ 87.45$ 51.36$ -$ -$
Existing MdTa Bonds - System 0.00 0.00 0.00 0.00 0.00 0.00 0.00 0.10 16.79 22.03 27.66 28.83 33.72 33.76 33.77 33.80 33.83 34.51 34.51
Planned MdTa Bonds - System 0.00 0.00 0.00 0.00 0.00 0.00 0.00 0.00 0.00 10.18 10.18 10.32 13.56 24.95 24.95 24.95 24.95 24.95 24.95
Total MdTA Debt Service -$ -$ -$ -$ -$ -$ -$ 0.10$ 16.79$ 32.21$ 37.84$ 39.15$ 47.27$ 58.71$ 58.73$ 58.75$ 58.78$ 59.46$ 59.46$
Total All Debt Service -$ -$ -$ -$ 36.09$ 40.36$ 87.46$ 87.56$ 104.25$ 119.66$ 125.29$ 126.61$ 134.72$ 146.17$ 146.18$ 146.20$ 110.14$ 59.46$ 59.46$
MdTA Rev. Recvd From (Pledged To) Garvees 0.00 0.00 0.00 0.00 0.00 0.00 0.00 0.00 0.00 0.00 0.00 0.00 0.00 0.00 0.00 0.00 0.00 0.00
MdTA Debt Capacity Provided (Used) By Garvees 0.00 0.00 0.00 0.00 0.00 0.00 0.00 0.00 0.00 0.00 0.00 0.00 0.00 0.00
Financing Assumptions Final Mat. Rate Def. Int.(Yr) DS Per $100 MM
Future MdTa Bonds - System 30 4.75% N/A 6.32
(1) Adjusted 2006 Surplus in December 2008 from 12.66 to 12.63 per PB Consult.
2016-08 v2.2.2
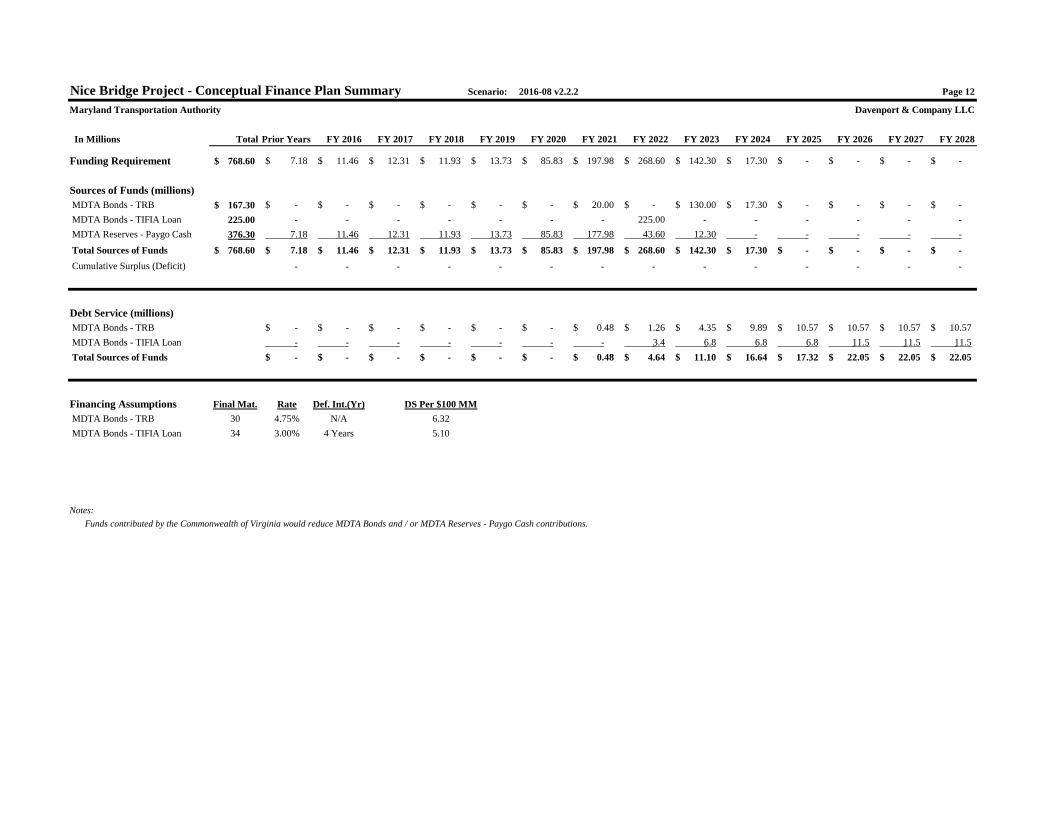
Nice Bridge Project - Conceptual Finance Plan Summary Scenario: 2016-08 v2.2.2 Page 12
Maryland Transportation Authority Davenport & Company LLC
In Millions Total Prior Years FY 2016 FY 2017 FY 2018 FY 2019 FY 2020 FY 2021 FY 2022 FY 2023 FY 2024 FY 2025 FY 2026 FY 2027 FY 2028
Funding Requirement 768.60$ 7.18$ 11.46$ 12.31$ 11.93$ 13.73$ 85.83$ 197.98$ 268.60$ 142.30$ 17.30$ -$ -$ -$ -$
Sources of Funds (millions)
MDTA Bonds - TRB 167.30$ -$ -$ -$ -$ -$ -$ 20.00$ -$ 130.00$ 17.30$ -$ -$ -$ -$
MDTA Bonds - TIFIA Loan 225.00 - - - - - - - 225.00 - - - - - -
MDTA Reserves - Paygo Cash 376.30 7.18 11.46 12.31 11.93 13.73 85.83 177.98 43.60 12.30 - - - - -
Total Sources of Funds 768.60$ 7.18$ 11.46$ 12.31$ 11.93$ 13.73$ 85.83$ 197.98$ 268.60$ 142.30$ 17.30$ -$ -$ -$ -$
Cumulative Surplus (Deficit) - - - - - - - - - - - - - -
Debt Service (millions)
MDTA Bonds - TRB -$ -$ -$ -$ -$ -$ 0.48$ 1.26$ 4.35$ 9.89$ 10.57$ 10.57$ 10.57$ 10.57$
MDTA Bonds - TIFIA Loan - - - - - - - 3.4 6.8 6.8 6.8 11.5 11.5 11.5
Total Sources of Funds -$ -$ -$ -$ -$ -$ 0.48$ 4.64$ 11.10$ 16.64$ 17.32$ 22.05$ 22.05$ 22.05$
Financing Assumptions Final Mat. Rate Def. Int.(Yr) DS Per $100 MM
MDTA Bonds - TRB 30 4.75% N/A 6.32
MDTA Bonds - TIFIA Loan 34 3.00% 4 Years 5.10
Notes:
Funds contributed by the Commonwealth of Virginia would reduce MDTA Bonds and / or MDTA Reserves - Paygo Cash contributions.

DAVENPORT & COMPANY
Maryland Transportation Authority
Pro Forma 2016-08 v2.2.2 Planned Debt Issuance Summary
$ millions
Planned Debt Issuance2016 2017 2018 2019 2020 2021 2022
Bonds Issued to Fund Projects -$ -$ -$ -$ -$ 20.00$ 225.00$ Bonds Issued to Fund Cap. Int. - - - - - - - Total Bonds Issued - - - - - 20.00 225.00

DAVENPORT & COMPANY
Maryland Transportation Authority
Existing and Projected Debt Amortization Schedule$ millions
Amount 162.1$ Amount 160.0$ Amount 300.0$ TIC 6.03% TIC 4.87% TIC 4.54%
Series 1992 Series 2004 Series 2007FY Principal Interest Total FY Principal Interest Total FY Principal Interest Total
Total 24.4 - 24.4 Total 29.5 13.7 43.2 Total 300.0 265.0 565.0 2012 15.4 - 15.4 2012 1.3 6.0 7.3 2012 1.0 13.8 14.8 2013 3.0 - 3.0 2013 13.8 4.2 18.0 2013 1.1 13.8 14.8 2014 3.0 - 3.0 2014 14.5 3.5 18.0 2014 1.1 13.7 14.9 2015 3.0 - 3.0 2015 - - - 2015 1.2 13.7 14.9 2016 - - - 2016 - - - 2016 6.3 13.6 20.0 2017 - - - 2017 - - - 2017 6.6 13.4 20.0 2018 - - - 2018 - - - 2018 6.9 13.1 20.1 2019 - - - 2019 - - - 2019 7.3 12.8 20.0 2020 - - - 2020 - - - 2020 7.6 12.4 20.0 2021 - - - 2021 - - - 2021 8.0 12.0 20.0 2022 - - - 2022 - - - 2022 8.4 11.6 20.0 2023 - - - 2023 - - - 2023 8.8 11.2 20.0 2024 - - - 2024 - - - 2024 9.2 10.8 20.0 2025 - - - 2025 - - - 2025 9.6 10.4 20.0 2026 - - - 2026 - - - 2026 10.1 10.0 20.0 2027 - - - 2027 - - - 2027 10.5 9.5 20.0 2028 - - - 2028 - - - 2028 11.0 9.0 20.0 2029 - - - 2029 - - - 2029 11.6 8.5 20.0 2030 - - - 2030 - - - 2030 12.1 7.9 20.1 2031 - - - 2031 - - - 2031 12.7 7.3 20.0 2032 - - - 2032 - - - 2032 13.3 6.7 20.0 2033 - - - 2033 - - - 2033 13.9 6.1 20.0 2034 - - - 2034 - - - 2034 14.6 5.5 20.1 2035 - - - 2035 - - - 2035 15.3 4.8 20.1 2036 - - - 2036 - - - 2036 16.0 4.1 20.1 2037 - - - 2037 - - - 2037 16.8 3.4 20.2 2038 - - - 2038 - - - 2038 17.6 2.7 20.2 2039 - - - 2039 - - - 2039 18.4 1.9 20.3 2040 - - - 2040 - - - 2040 19.3 1.0 20.3 2041 - - - 2041 - - - 2041 3.9 0.2 4.1 2042 - - - 2042 - - - 2042 - - - 2043 - - - 2043 - - - 2043 - - - 2044 - - - 2044 - - - 2044 - - - 2045 - - - 2045 - - - 2045 - - - 2046 - - - 2046 - - - 2046 - - - 2047 - - - 2047 - - - 2047 - - - 2048 - - - 2048 - - - 2048 - - - 2049 - - - 2049 - - - 2049 - - - 2050 - - - 2050 - - - 2050 - - - 2051 - - - 2051 - - - 2051 - - - 2052 - - - 2052 - - - 2052 - - - 2053 - - - 2053 - - - 2053 - - - 2054 - - - 2054 - - - 2054 - - - 2055 - - - 2055 - - - 2055 - - -
DAVENPORT & COMPANY
Maryland Transportation Authority
Existing and Projected Debt Amortization Schedule$ millions
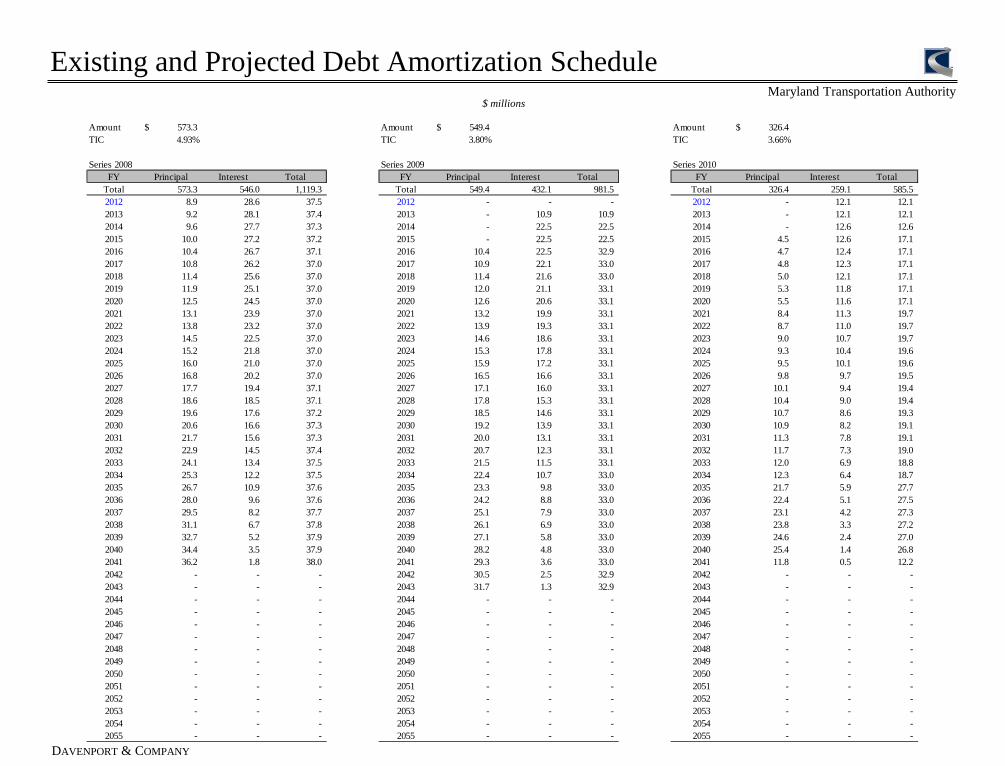
Amount 573.3$ Amount 549.4$ Amount 326.4$ TIC 4.93% TIC 3.80% TIC 3.66%
Series 2008 Series 2009 Series 2010FY Principal Interest Total FY Principal Interest Total FY Principal Interest Total
Total 573.3 546.0 1,119.3 Total 549.4 432.1 981.5 Total 326.4 259.1 585.5 2012 8.9 28.6 37.5 2012 - - - 2012 - 12.1 12.1 2013 9.2 28.1 37.4 2013 - 10.9 10.9 2013 - 12.1 12.1 2014 9.6 27.7 37.3 2014 - 22.5 22.5 2014 - 12.6 12.6 2015 10.0 27.2 37.2 2015 - 22.5 22.5 2015 4.5 12.6 17.1 2016 10.4 26.7 37.1 2016 10.4 22.5 32.9 2016 4.7 12.4 17.1 2017 10.8 26.2 37.0 2017 10.9 22.1 33.0 2017 4.8 12.3 17.1 2018 11.4 25.6 37.0 2018 11.4 21.6 33.0 2018 5.0 12.1 17.1 2019 11.9 25.1 37.0 2019 12.0 21.1 33.1 2019 5.3 11.8 17.1 2020 12.5 24.5 37.0 2020 12.6 20.6 33.1 2020 5.5 11.6 17.1 2021 13.1 23.9 37.0 2021 13.2 19.9 33.1 2021 8.4 11.3 19.7 2022 13.8 23.2 37.0 2022 13.9 19.3 33.1 2022 8.7 11.0 19.7 2023 14.5 22.5 37.0 2023 14.6 18.6 33.1 2023 9.0 10.7 19.7 2024 15.2 21.8 37.0 2024 15.3 17.8 33.1 2024 9.3 10.4 19.6 2025 16.0 21.0 37.0 2025 15.9 17.2 33.1 2025 9.5 10.1 19.6 2026 16.8 20.2 37.0 2026 16.5 16.6 33.1 2026 9.8 9.7 19.5 2027 17.7 19.4 37.1 2027 17.1 16.0 33.1 2027 10.1 9.4 19.4 2028 18.6 18.5 37.1 2028 17.8 15.3 33.1 2028 10.4 9.0 19.4 2029 19.6 17.6 37.2 2029 18.5 14.6 33.1 2029 10.7 8.6 19.3 2030 20.6 16.6 37.3 2030 19.2 13.9 33.1 2030 10.9 8.2 19.1 2031 21.7 15.6 37.3 2031 20.0 13.1 33.1 2031 11.3 7.8 19.1 2032 22.9 14.5 37.4 2032 20.7 12.3 33.1 2032 11.7 7.3 19.0 2033 24.1 13.4 37.5 2033 21.5 11.5 33.1 2033 12.0 6.9 18.8 2034 25.3 12.2 37.5 2034 22.4 10.7 33.0 2034 12.3 6.4 18.7 2035 26.7 10.9 37.6 2035 23.3 9.8 33.0 2035 21.7 5.9 27.7 2036 28.0 9.6 37.6 2036 24.2 8.8 33.0 2036 22.4 5.1 27.5 2037 29.5 8.2 37.7 2037 25.1 7.9 33.0 2037 23.1 4.2 27.3 2038 31.1 6.7 37.8 2038 26.1 6.9 33.0 2038 23.8 3.3 27.2 2039 32.7 5.2 37.9 2039 27.1 5.8 33.0 2039 24.6 2.4 27.0 2040 34.4 3.5 37.9 2040 28.2 4.8 33.0 2040 25.4 1.4 26.8 2041 36.2 1.8 38.0 2041 29.3 3.6 33.0 2041 11.8 0.5 12.2 2042 - - - 2042 30.5 2.5 32.9 2042 - - - 2043 - - - 2043 31.7 1.3 32.9 2043 - - - 2044 - - - 2044 - - - 2044 - - - 2045 - - - 2045 - - - 2045 - - - 2046 - - - 2046 - - - 2046 - - - 2047 - - - 2047 - - - 2047 - - - 2048 - - - 2048 - - - 2048 - - - 2049 - - - 2049 - - - 2049 - - - 2050 - - - 2050 - - - 2050 - - - 2051 - - - 2051 - - - 2051 - - - 2052 - - - 2052 - - - 2052 - - - 2053 - - - 2053 - - - 2053 - - - 2054 - - - 2054 - - - 2054 - - - 2055 - - - 2055 - - - 2055 - - -
DAVENPORT & COMPANY
Maryland Transportation Authority
Existing and Projected Debt Amortization Schedule$ millions
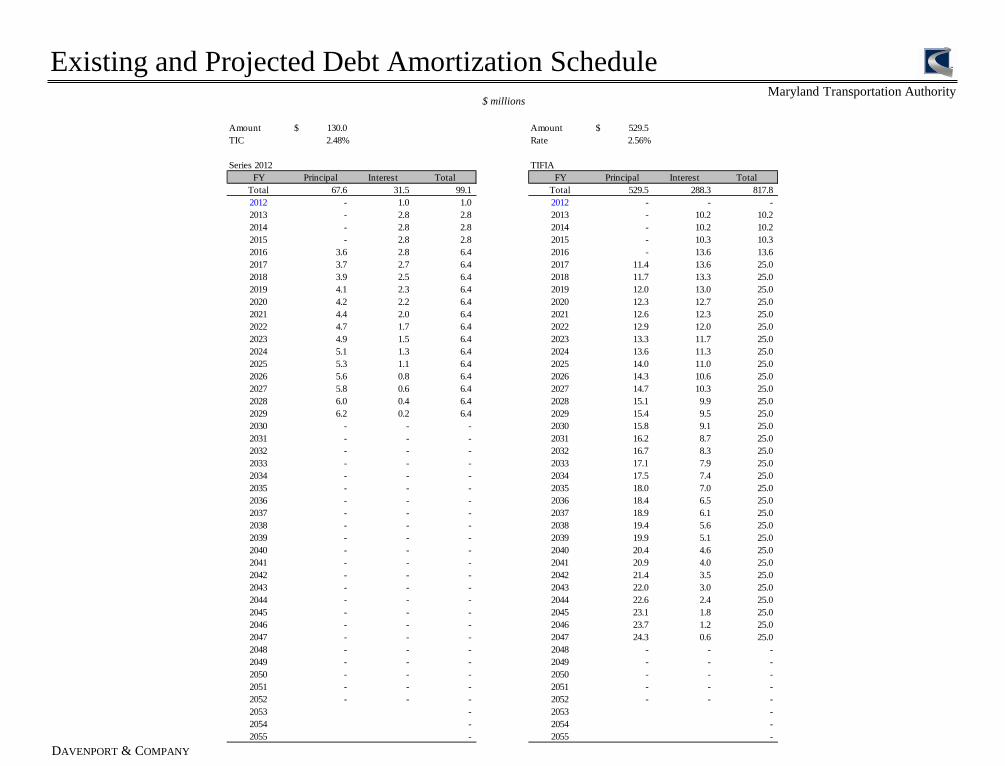
Amount 130.0$ Amount 529.5$ TIC 2.48% Rate 2.56%
Series 2012 TIFIA FY Principal Interest Total FY Principal Interest Total
Total 67.6 31.5 99.1 Total 529.5 288.3 817.8 2012 - 1.0 1.0 2012 - - - 2013 - 2.8 2.8 2013 - 10.2 10.2 2014 - 2.8 2.8 2014 - 10.2 10.2 2015 - 2.8 2.8 2015 - 10.3 10.3 2016 3.6 2.8 6.4 2016 - 13.6 13.6 2017 3.7 2.7 6.4 2017 11.4 13.6 25.0 2018 3.9 2.5 6.4 2018 11.7 13.3 25.0 2019 4.1 2.3 6.4 2019 12.0 13.0 25.0 2020 4.2 2.2 6.4 2020 12.3 12.7 25.0 2021 4.4 2.0 6.4 2021 12.6 12.3 25.0 2022 4.7 1.7 6.4 2022 12.9 12.0 25.0 2023 4.9 1.5 6.4 2023 13.3 11.7 25.0 2024 5.1 1.3 6.4 2024 13.6 11.3 25.0 2025 5.3 1.1 6.4 2025 14.0 11.0 25.0 2026 5.6 0.8 6.4 2026 14.3 10.6 25.0 2027 5.8 0.6 6.4 2027 14.7 10.3 25.0 2028 6.0 0.4 6.4 2028 15.1 9.9 25.0 2029 6.2 0.2 6.4 2029 15.4 9.5 25.0 2030 - - - 2030 15.8 9.1 25.0 2031 - - - 2031 16.2 8.7 25.0 2032 - - - 2032 16.7 8.3 25.0 2033 - - - 2033 17.1 7.9 25.0 2034 - - - 2034 17.5 7.4 25.0 2035 - - - 2035 18.0 7.0 25.0 2036 - - - 2036 18.4 6.5 25.0 2037 - - - 2037 18.9 6.1 25.0 2038 - - - 2038 19.4 5.6 25.0 2039 - - - 2039 19.9 5.1 25.0 2040 - - - 2040 20.4 4.6 25.0 2041 - - - 2041 20.9 4.0 25.0 2042 - - - 2042 21.4 3.5 25.0 2043 - - - 2043 22.0 3.0 25.0 2044 - - - 2044 22.6 2.4 25.0 2045 - - - 2045 23.1 1.8 25.0 2046 - - - 2046 23.7 1.2 25.0 2047 - - - 2047 24.3 0.6 25.0 2048 - - - 2048 - - - 2049 - - - 2049 - - - 2050 - - - 2050 - - - 2051 - - - 2051 - - - 2052 - - - 2052 - - - 2053 - 2053 - 2054 - 2054 - 2055 - 2055 -

DAVENPORT & COMPANY
Maryland Transportation Authority
Existing and Projected Debt Amortization Schedule$ millions
Amount 20.0$ Amount 225.0$ Rate 4.75% Rate 3.00%
Series 2021 Series 2022 - TIFIAFY Principal Interest Total FY Principal Interest Total
Total 20.0 18.4 38.4 Total 225.0 143.0 368.0 2012 - 2012 - 2013 - 2013 - 2014 - 2014 - 2015 - 2015 - 2016 - 2016 - 2017 - 2017 - 2018 - 2018 - 2019 - 2019 - 2020 - 2020 - 2021 - 0.5 0.5 2021 - 2022 0.3 1.0 1.3 2022 - 3.4 3.4 2023 0.3 0.9 1.3 2023 - 6.8 6.8 2024 0.3 0.9 1.3 2024 - 6.8 6.8 2025 0.4 0.9 1.3 2025 - 6.8 6.8 2026 0.4 0.9 1.3 2026 4.7 6.8 11.5 2027 0.4 0.9 1.3 2027 4.9 6.6 11.5 2028 0.4 0.8 1.3 2028 5.0 6.5 11.5 2029 0.4 0.8 1.3 2029 5.2 6.3 11.5 2030 0.5 0.8 1.3 2030 5.3 6.2 11.5 2031 0.5 0.8 1.3 2031 5.5 6.0 11.5 2032 0.5 0.8 1.3 2032 5.6 5.8 11.5 2033 0.5 0.7 1.3 2033 5.8 5.7 11.5 2034 0.5 0.7 1.3 2034 6.0 5.5 11.5 2035 0.6 0.7 1.3 2035 6.2 5.3 11.5 2036 0.6 0.7 1.3 2036 6.4 5.1 11.5 2037 0.6 0.6 1.3 2037 6.5 4.9 11.5 2038 0.7 0.6 1.3 2038 6.7 4.7 11.5 2039 0.7 0.6 1.3 2039 6.9 4.5 11.5 2040 0.7 0.5 1.3 2040 7.2 4.3 11.5 2041 0.8 0.5 1.3 2041 7.4 4.1 11.5 2042 0.8 0.5 1.3 2042 7.6 3.9 11.5 2043 0.8 0.4 1.3 2043 7.8 3.7 11.5 2044 0.9 0.4 1.3 2044 8.1 3.4 11.5 2045 0.9 0.4 1.3 2045 8.3 3.2 11.5 2046 1.0 0.3 1.3 2046 8.5 2.9 11.5 2047 1.0 0.3 1.3 2047 8.8 2.7 11.5 2048 1.1 0.2 1.3 2048 9.1 2.4 11.5 2049 1.1 0.2 1.3 2049 9.3 2.1 11.5 2050 1.2 0.1 1.3 2050 9.6 1.9 11.5 2051 1.2 0.1 1.3 2051 9.9 1.6 11.5 2052 - - - 2052 10.2 1.3 11.5 2053 - - - 2053 10.5 1.0 11.5 2054 - - - 2054 10.8 0.7 11.5 2055 - - - 2055 11.1 0.3 11.5