4. advances in impact evaluation - world health organization
TRANSCRIPT
4. Advances in impact evaluation
Rigour in impact evaluation
without the intervention – known as the ‘counterfactual’
– in order to be able to attribute the observed change to
the intervention under study. Methodological develop-
ment in this field has focused to a substantial degree on
different approaches to establishing this counterfactual, Kara Hansonand on how best to minimize different forms of selection London School of Hygiene and Tropical Medicine, bias.United Kingdom of Great Britain and Northern Ireland
This body of work also recognizes the importance of Although there is a rich body of literature on health external validity – the extent to which findings can be programme evaluation, the work that focuses on system-
level interventions is smaller. However, recent years have generalized to other settings. This requires understanding
seen a growth of interest in understanding the ‘impact’ the causal mechanism, looking more closely at its causal
of development interventions, including health system pathway and testing the validity of assumptions that are
interventions, in order to guide development practice and made about the route between intervention and impact, investments using evidence about ‘what works’ and an in order to assess whether those assumptions are likely understanding of why it works (Evaluation Gap Working to hold in other contexts. It also means paying careful Group, 2006). New bodies have been established to attention to the implementation setting and how this promote and finance impact evaluations, such as the mediates the effects of the intervention.International Initiative for Impact Evaluation (3IE)
Two main types of study design are currently used within ( ), and bilateral donors and
impact evaluations:other funders have given renewed emphasis to streng-
Experimental design: This involves a random assign-thening their approaches to evaluation and their capacity ment of the programme to an intervention group and to use this evidence in their decision-making. At the a control group, with the effect that potential unobs-
same time, influenced by trends within social pro-erved confounding factors are also randomly distri-
gramme evaluation in higher-income countries (Harrison, buted between the two groups, minimizing risks of 2001), there is an emerging interest in critical realist bias.approaches to evaluation (for example see FEMhealth: Quasi-experimental designs: These can involve
). Such approaches ‘natural experiments’ which take advantage of a policy or other change that generates an appropriate consider the question: What works for whom in what control group. Study designs then compare groups or circumstances? All approaches to impact evaluation, thus, areas with and without the intervention; make aim to explain health policy and systems changes and before-and-after comparisons; adopt ‘difference-in-
interventions.difference’ approaches (before and after with a control group); or take advantage of a phased implementation that provides variation in the duration of exposure to the programme. Another
There are different meanings of ‘impact’ in the general approach is to use matching methods (such as propensity score matching) in a cross-sectional evaluation literature, but in the contemporary literature, design to create a control group that is matched on impact is understood to refer to a causal mechanism – as many observable factors as possible.the change in an outcome that is caused by a particular
programme. This focus on causal mechanisms has meant Health system interventions have some particular that a lot of attention is paid to methods for arriving at features that influence the choice of evaluation approach. an unbiased measure of the change that is due to the First, they often work through complex causal pathways programme or intervention. A starting point to measure and are particularly influenced by features of the policy such impacts is to consider what would have happened and implementation context. Recent guidance on the
http://www.3ieimpact.org
http://www.abdn.ac.uk/femhealth
n
n
Part 4 - Empirical Papers 253
(impact) evaluation of complex public health inter- Another feature of evaluation designs for health system
ventions can also be applied to health system inter- interventions is that it is often difficult to use a ‘control
ventions, and emphasizes the need to: group’ to establish the counterfactual because, for
example, a policy change takes place at national level develop a good theoretical understanding of the (the ‘small n’ (sample size) problem). For instance, change mechanism;changes in regulatory or health financing systems often address explicitly the risk of implementation failure by
including a process evaluation; occur across a whole country at one time so there is no
other unit to use as a comparison group.recognize the higher level influences on individual behaviour, and design studies that take these into
For both reasons – complexity and the need for alter-account;
native approaches to establish the counterfactual – adopt multiple measures of outcome, including poten-
it seems appropriate to recommend that to enhance tial unintended consequences of an intervention;their rigour all evaluations of health system interventions
recognize that strict fidelity to a protocol is unlikely, should be based on a strong programme theory (White, and allow for local adaptation in the intervention 2009).model (Craig et al., 2008).
Indeed, theory-based evaluation approaches represent a Writing about interventions from a public health pers-third form of study design for impact evaluation. These pective, Victora, Habicht & Bryce (2004) challenge the approaches are based on an explicit programme theory primacy of the randomized controlled trial as contri-that sets out the links between inputs, outputs and buting the best evidence for policy-making when causal impacts and tests these causal links using a mix of pathways are complex. They describe the value of qualitative and quantitative methods. Realist evaluation, ‘plausibility designs’ in which studies that are non-meanwhile, focuses attention on the links between randomized nonetheless aim at making causal state-context, mechanisms of change and outcomes, given its ments using observational designs with a comparison interest in how the intervention leads to which effects, group. This form of causal reasoning can be supported by under what circumstances (Pawson & Tilley, 1997). It evidence that implementation has been adequate, requires that middle range theory, the analysts’ initial demonstrating progress in intermediate steps along the ideas about these links is developed prior to, and then causal pathway, analysing the temporal sequence of tested through, the evaluation. Realist evaluation tends events and using ‘dose-response’ reasoning to link the to rely on mixed-methods, with greater use of qualitative strength of programme implementation to changes in methods than other impact evaluations, and adopts the outcome. de Savigny & Adam (2009) also identify the approaches to generalization which rely more on need for adaptations to conventional study designs when analytic, rather than statistical, generalization. Its rigour evaluating health system interventions, emphasizing the is then safeguarded by the adoption of approaches need to measure a wide variety of outcomes (intended or common in case-study practice (see section on the case unintended) and for a comprehensive analysis of the study approach).contextual factors that may help to explain the success
or failure of an intervention.
n
n
n
n
n
Gilson L, ed. (2012). Health Policy and Systems Research: A Methodology Reader
Alliance for Health Policy and Systems Research, World Health Organization254
References Overview of selected papersCraig et al. (2008). Developing and evaluating complex The papers in this section were chosen because they interventions: new guidance. Medical Research Council, address system-level interventions and reflect a broad ( , range of approaches to impact evaluation.accessed 6 September 2011).
Björkman and Svensson (2009) use a randomized study design to evaluate the impact of a report-card de Savigny D, Adam T (2009). Systems thinking for health approach to improving community accountability. This
system strengthening. Geneva, World Health Organization.paper was selected because of its focus on a novel health system intervention and its use of an experi-Evaluation Gap Working Group (2006). When will we mental design to measure impact.
ever learn? Improving lives through impact evaluation. Macinko et al. (2007) examine a large-scale health Washington DC, Center for Global Development.system intervention (a national community-based primary care programme in Brazil) using a quasi-Harrison S (2001). Policy Analysis. In Fulop et al., eds. experimental design which takes advantage of the Studying the organisation and delivery of health services: gradual expansion of the programme to generate an research methods. London, Routledge:90–106.internal control group to measure impact.
Pawson R, Tilley N (1997). Realistic evaluation. London, Marchal, Dedzo & Kegels (2010) use realist evalu-Sage Publications. ation methods to examine the impact of a particular
human resource management approach within one Victora C, Habicht JP, Bryce J (2004). Evidence-based hospital in Ghana. It looks at the link between public health: moving beyond randomized trials. organizational practices and performance, has strong
theoretical underpinnings, and uses exclusively American Journal of Public Health, 94(3):400–405.qualitative methods to explore the causal links
White, H (2009). Theory-based impact evaluation: between management practice and behaviour within the organization.principles and practice. International Initiative for Impact
Evaluation Working Paper No. 3 ( Wang et al. (2009) look at the impact on health status of a community-based health insurance , accessed 6 September 2011).scheme in China, in which increased financial risk protection was accompanied by service innovations including more selective purchasing, changes to the provider payment mechanism, and changes to the prescription system. They both adopt a quasi-experimental approach (before-and-after with a control group) and employ propensity score matching to construct a comparison group.
http://www.mrc.ac.uk/complexinterventionsguidance
http://www.3ieimpact.org
/admin/pdfs_papers/51.pdf
n
n
n
n
Part 4 - Empirical Papers 255
References for selected papers
Björkman M, Svensson J (2009). Power to the people:
evidence from a randomized field experiment on
community-based monitoring in Uganda. The Quarterly
Journal of Economics, 124(2) :735–769.
Reproduced by permission of Oxford University
Press. Copyright Oxford University Press, 2009.
Macinko J et al. (2007). Going to scale with community-
based primary care: an analysis of the family health
programme and infant mortality in Brazil. Social Science
& Medicine, 65:2070–2080.
Reproduced by permission of Elsevier. Copyright
Elsevier, 2007.
Marchal B, Dedzo M, Kegels G (2010). A realist evalu-
ation of the management of a well-performing regional
hospital in Ghana. BMC Health Services Research, 10:24.
Wang H et al. (2009). The impact of rural mutual health
care on health status: evaluation of a social experiment in
rural China. Health Economics 18(S2):S65–S82
http://dx.doi.org/10.1162/qjec.2009.124.2.735
http://dx.doi.org/10.1016/j.socscimed.2007.06.028
http://dx.doi.org/10.1186/1472-6963-10-24
http://dx.doi.org/10.1002/hec.1465
n
n
nReproduced in the print version only, by permission
of Wiley. Copyright Wiley, 2009.
Gilson L, ed. (2012). Health Policy and Systems Research: A Methodology Reader
Alliance for Health Policy and Systems Research, World Health Organization256
POWER TO THE PEOPLE: EVIDENCE FROM A
RANDOMIZED FIELD EXPERIMENT ON
COMMUNITY-BASED MONITORING IN UGANDA∗
MARTINA BJORKMAN AND JAKOB SVENSSON
This paper presents a randomized field experiment on community-based mon-itoring of public primary health care providers in Uganda. Through two rounds ofvillage meetings, localized nongovernmental organizations encouraged communi-ties to be more involved with the state of health service provision and strengthenedtheir capacity to hold their local health providers to account for performance. Ayear after the intervention, treatment communities are more involved in moni-toring the provider, and the health workers appear to exert higher effort to servethe community. We document large increases in utilization and improved healthoutcomes—reduced child mortality and increased child weight—that compare fa-vorably to some of the more successful community-based intervention trials re-ported in the medical literature.
I. INTRODUCTION
Approximately eleven million children under five years dieeach year and almost half of these deaths occur in sub-SaharanAfrica. More than half of these children will die of diseases (e.g.,diarrhea, pneumonia, malaria, measles, and neonatal disorders)that could easily have been prevented or treated if the childrenhad had access to a small set of proven, inexpensive services(Black, Morris, and Bryce 2003; Jones et al. 2003).
Why are these services not provided? Anecdotal, and re-cently more systematic, evidence points to one possible reason—ineffective systems of monitoring and weak accountability
∗This project is a collaborative exercise involving many people. Foremost, weare deeply indebted to Frances Nsonzi and Ritva Reinikka for their contributionsat all stages of the project. We would also like to acknowledge the importantcontributions of Gibwa Kajubi, Abel Ojoo, Anthony Wasswa, James Kanyesigye,Carolyn Winter, Ivo Njosa, Omiat Omongin, Mary Bitekerezo, and the field anddata staff with whom we have worked over the years. We thank the Uganda Min-istry of Health, Planning Division, the World Bank’s Country Office in Uganda,and the Social Development Department, the World Bank, for their cooperation.We are grateful for comments and suggestions by Paul Gertler, Esther Duflo, Ab-hijit Banerjee, and seminar and conference participants at Stanford, Berkeley,LSE, Oxford, IGIER, MIT, World Bank, NTNU, Namur, UPF, CEPR/EUDN con-ference in Paris, and BREAD & CESifo conference in Venice. We also thank threeanonymous referees and the editor, Lawrence Katz, for very constructive sugges-tions. Financial support from the Bank-Netherlands Partnership Program, theWorld Bank Research Committee, the World Bank Africa Region division, and theSwedish International Development Agency, Department for Research Coopera-tion is gratefully acknowledged. Bjorkman also thanks Jan Wallander’s and TomHedelius’ Research Foundation for funding.
C© 2009 by the President and Fellows of Harvard College and the Massachusetts Institute of
Technology.
The Quarterly Journal of Economics, May 2009
735
257

736 QUARTERLY JOURNAL OF ECONOMICS
relationships.1 This paper focuses on one of these accountabilityrelationships, citizen-clients’ ability to hold providers accountable,using primary health care provision in rural Uganda as a testingground.
To examine whether community-based monitoring works, wedesigned and conducted a randomized field experiment in fiftycommunities from nine districts in Uganda. In the experiment, lo-cal nongovernmental organizations (NGOs) facilitated village andstaff meetings in which members of the communities discussedbaseline information on the status of health service delivery rela-tive to other providers and the government standard. Communitymembers were also encouraged to develop a plan identifying keyproblems and steps the providers should take to improve healthservice provision. The primary objective of the intervention was toinitiate a process of community-based monitoring that was thenup to the community to sustain and lead.
The community-based monitoring project increased the qual-ity and quantity of primary health care provision. A year after thefirst round of meetings, we found a significant difference in theweight of infants—0.14 z-score increase—and a markedly lowernumber of deaths among children under five—33 percent reduc-tion in under-5 mortality—in the treatment communities. Uti-lization for general outpatient services was 20 percent higher inthe treatment compared to the control facilities and the overalleffect across a set of utilization measures is large and signifi-cantly positive. Treatment practices, including immunization ofchildren, waiting time, examination procedures, and absenteeism,improved significantly in the treatment communities, thus sug-gesting that the changes in quality and quantity of health careprovision are due to behavioral changes of the staff. We find evi-dence that the treatment communities became more engaged andbegan to monitor the health unit more extensively. Using varia-tion in treatment intensity across districts we show that there isa significant relationship between the degree of community moni-toring and health utilization and health outcomes, consistent withthe community-based monitoring mechanism.
Community-based, randomized, controlled field trials havebeen used extensively in medical research to evaluate the
1. For anecdotal and case study evidence, see World Bank (2003). Chaudhuryet al. (2006) provide evidence on the rates of absenteeism. On misappropriationof public funds and drugs, see McPake et al. (1999) and Reinikka and Svensson(2004).
258
COMMUNITY-BASED MONITORING IN UGANDA 737
effectiveness of various health interventions (see footnote 14). Ourpaper is related but differs in one important dimension. Whereasthe medical field trials address the question of impact of a biolog-ical agent or treatment practice when the health workers compe-tently carry out their tasks, we focus on how to ensure that thehealth workers actually carry out their tasks and the impact thatmay have on health utilization and health outcomes.
This paper also relates to a small literature on improving gov-ernance and public service delivery through community partici-pation. Olken (2007) finds minor effects of an intervention aimedat increasing community participation in the monitoring of cor-ruption in Indonesia. Our work differs in several ways. First, theintervention we evaluate was structured in a way to reduce therisk of elite capture. Second, unlike corruption, which is not easilyobservable, the information discussed in the meetings was basicfacts on utilization and quality of services based on the commu-nity’s own experience. Finally, the intervention sought to addresstwo constraints highlighted in the literature on community mon-itoring: lack of relevant information and inadequate participa-tion. Banerjee, Deaton, and Duflo (2004) evaluate a project inRajasthan in India where a member of the community was paidto check whether the nurse-midwife assigned to the health centerwas present at the center. The intervention had no impact on at-tendance and the authors speculate that a key reason for this isthat the individual community member did not manage to use hisor her information on absenteeism to invoke community partici-pation. Here, on the contrary, we explicitly try to address the par-ticipation constraint by involving a large number of communitymembers and encouraging them to jointly develop a monitoringplan.
Finally, the paper links to a growing empirical literature onthe relationship between information dissemination and account-ability (Besley and Burgess 2002; Stromberg 2004; Ferraz andFinan 2008). In this paper, however, we focus on mechanismsthrough which citizens can make providers, rather than politi-cians, accountable. Thus, we do not study the design or allocationof public resources across communities, but rather how these re-sources are utilized. Second, we use microdata from householdsand clinics rather than disaggregated national accounts data. Fi-nally, we identify impact using an experimental design.
The next section describes the institutional environment.The community-based monitoring intervention is described in
259
738 QUARTERLY JOURNAL OF ECONOMICS
Section III. Section IV lays out the evaluation design and the re-sults are presented in Section V. Section VI concludes. Detailsabout the experiment and additional results are reported in theOnline Supplemental Appendix.
II. INSTITUTIONAL SETTING
Uganda, like many newly independent countries in Africa,had a functioning health care system in the early 1960s. The1970s and 1980s saw the collapse of government services as thecountry underwent political upheaval. Health indicators fell dra-matically during this period until peace was restored in the late1980s. Since then, the government has been implementing ma-jor infrastructure rehabilitation programs in the public healthsector.
The health sector in Uganda is composed of four types offacilities: hospitals, health centers, dispensaries, and aid postsor subdispensaries. These facilities can be government-operatedand -owned, private for-profit, or private not-for-profit. The impactevaluation focuses on public dispensaries. Dispensaries are in thelowest tier of the health system where a professional interactionbetween users and providers takes place. Most dispensaries arerural. According to the government health sector strategic plan,the standard for dispensaries includes preventive, promotional,outpatient care, maternity, general ward, and laboratory services(Republic of Uganda 2000). As of 2001, public health services arefree. In our sample, on average, a dispensary was staffed by an in-charge or clinical officer (a trained medical worker), two nurses,and three nursing aids or other assistants.
The health sector in Uganda is decentralized, and a numberof actors are responsible for supervision and control of the dispen-saries. At the lowest tier, the Health Unit Management Committee(HUMC) is supposed to be the main link between the communityand the facility. Each dispensary has an HUMC, which consistsof both health workers and nonpolitical representatives from thecommunity. The HUMC should monitor the day-to-day runningof the facility but it has no authority to sanction workers. Thenext level in the institutional hierarchy is the health subdistrict.The health subdistrict monitors funds, drugs, and service deliveryat the dispensary. Supervision meetings by the health subdistrictare supposed to appear quarterly but, in practice, monitoring is in-frequent. The health subdistrict has the authority to reprimand,
260
COMMUNITY-BASED MONITORING IN UGANDA 739
but not dismiss, staff for indiscipline. Thus in severe cases ofindiscipline, the errand will be referred to the chief administra-tive officer of the district and the District Service Commission,which are the appointing authorities for the district. They havethe authority to suspend or dismiss staff.
Various local NGOs, so-called community-based organiza-tions (CBOs), focusing primarily on health education, are alsoactive in the sector.
III. EXPERIMENTAL DESIGN AND DATA
III.A. Overview
In response to perceived weak health care delivery at theprimary level, a pilot project (citizen report cards) aimed at en-hancing community involvement and monitoring in the deliveryof primary health care was initiated in 2004. The project was de-signed by staff from Stockholm University and the World Bank,and implemented in cooperation with a number of Ugandan prac-titioners and eighteen community-based organizations.
The main objective of the intervention was to strengthenproviders’ accountability to citizen-clients by initiating a process,using trained local actors (CBOs) as facilitators, which the com-munities themselves could manage and sustain.
Based on a small but rigorous empirical literature on com-munity participation and oversight, and extensive piloting in thefield, our conjecture was that lack of relevant information on thestatus of service delivery and the community’s entitlements, andfailure to agree on, or coordinate expectations of, what is rea-sonable to demand from the provider, were holding back initia-tives to pressure and monitor the provider. Although individualcommunity members have private information—for example, theyknow whether their own child has died and whether the healthworkers did anything to help them—they typically do not haveany information on aggregate outcomes, such as how many chil-dren in their community did not survive beyond the age of 5 orwhere citizens, on average, seek care, or what the communitycan expect in terms of quality and quantity of service provision(Khemani 2006). Partly as a response to this information problem,and partly because monitoring a public facility is a public goodthat may be subject to serious free-rider problems, few people ac-tively participate in monitoring their service providers. Relaxing
261
740 QUARTERLY JOURNAL OF ECONOMICS
these two constraints was therefore the main objective of theintervention.
The key behavioral change induced by more extensivecommunity-based monitoring was expected to be increased effortby the health unit staff to serve the community. In Uganda, asin many other developing countries, health workers have few pe-cuniary incentives to exert high effort. Public money does notfollow patients, and hiring, salaries, and promotions are largelydetermined by seniority and educational qualifications—not byhow well the staff performs. An individual worker may of coursestill put in high effort if shirking deviates from her ideal choice(Akerlof and Kranton 2005). The effort choice may also be influ-enced by social rewards from community members or social sanc-tions against shirking workers. Social rewards and sanctions arekey instruments available to the community to boost the healthworker’s effort.
III.B. Experimental Design
The experiment involved fifty public dispensaries, and healthcare users in the corresponding catchment areas, in nine districtscovering all four regions in Uganda. All project facilities werelocated in rural areas. We define a facility’s catchment area, orthe community, as the five-kilometer radius around the facility.2
A community in our sample has, on average, 2,500 householdsresiding within the five-kilometer radius of the clinic, of which 350live within a one-kilometer radius. For the experimental design,the facilities were first stratified by location (districts) and then bypopulation size. From each group, half of the units were randomlyassigned to the treatment group and the remaining 25 units wereassigned to the control group.
III.C. Data
Data collection was governed by two objectives. First, datawere required to assess how the community at large views thequality and efficacy of service delivery. We also wanted to contrastthe citizens’ view with that of the health workers. Second, datawere required to evaluate impact. To meet these objectives, twosurveys were implemented: a survey of the fifty providers and
2. Dispensaries are designed to serve households in a catchment area roughlycorresponding to the five-kilometer radius around the facility (Republic of Uganda2000).
262
COMMUNITY-BASED MONITORING IN UGANDA 741
a survey of users. Both surveys were implemented prior to theintervention (data from these surveys formed the basis for theintervention) and one year after the project had been initiated.
A quantitative service delivery survey was used to collectdata from the providers. Because agents in the service deliverysystem may have a strong incentive to misreport key data, thedata were obtained directly from the records kept by facilitiesfor their own need (i.e., daily patient registers, stock cards, etc.)rather than from administrative records. The former, often avail-able in a highly disaggregate format, were considered to suffer theleast from any incentive problems in record keeping. Data werealso collected through visual checks by enumerators.
The household survey collected data on both households’health outcomes and health facility performance as experiencedby the household. A stratified random sample of households withinthe catchment area of each facility was surveyed. In total, roughly5,000 households were surveyed in each round.3 To the extentthat it was possible, patient records (i.e., patient exercise booksand immunization cards) supported the household’s response. Thepostintervention household survey also included a shorter mod-ule on health outcomes. Specifically, data on under-5 mortalitywere collected and we measured the weight of all infants in thesurveyed households.
III.D. Intervention
A smaller subset of the findings from the preintervention sur-veys, including utilization, quality of services, and comparisonsvis-a-vis other health facilities, were assembled in report cards.Each treatment facility and its community had a unique reportcard, translated into the main language spoken in the community,summarizing the key findings from the surveys conducted in theirarea.
The process of disseminating the report card information, andencouraging participation, was initiated through a series of meet-ings: a community meeting, a staff meeting, and an interface meet-ing. Staff from various local NGOs (CBOs) acted as facilitators in
3. The sampling strategy for the baseline household survey was designed togenerate representative information on the core users’ variables in each commu-nity (such as the proportion of patients being examined with equipment). In total,88% of the households surveyed in the baseline survey were resurveyed in theex-post survey. The households that could not be surveyed were replaced.
263

742 QUARTERLY JOURNAL OF ECONOMICS
Treatment areas
Control areas
Time line
End of 2004 Beginning of 2005 Beginning of 2006
Community-based monitoring Collection of
baseline
household and
facility data
Intervention (5 days):
• report card dissemination;
• facilitate the agreement of
a community contract.
Collection of
household and
facility data for
program
evaluation
FIGURE ITiming of the Project
these meetings.4 A time line of the intervention is depicted inFigure I.
The community meeting was a two-afternoon event with ap-proximately 100 invited participants from the community. Toavoid elite capture, the invited participants consisted of a se-lection of representatives from different spectra of society (i.e.,young, old, disabled, women, mothers, leaders). The facilitatorsmobilized the village members by cooperating with village councilrepresentatives in the catchment area. Invited participants wereasked to spread the word about the meeting and, in the end, alarge number of uninvited participants also attended the meet-ing. More than 150 participants per day attended a typical villagemeeting.
In the community meeting, the facilitators used a varietyof participatory methods to disseminate the information in thereport cards and encouraged community members to develop ashared view on how to improve service delivery and monitor theprovider. Information on patients’ rights and entitlements wasalso discussed. The participants were divided into focus groupsso that also more marginalized groups such as women and youthcould raise their voices and discuss issues specific to their group.
4. The eighteen participating CBOs had been active in 64% of the treatmentcommunities and half of the control communities prior to the intervention. Ahandful of them covered more than one treatment community. The CBOs wereprimarily focused on health, including issues of health education and HIV/AIDSprevention, although other objectives such as agricultural development, women’sempowerment, support of orphans and vulnerable children, and peace-buildinginitiatives, were also common. The CBO facilitators were trained for seven daysin data interpretation and dissemination, utilization of the participatory method-ology, and conflict resolution and management. Various other CBOs also operatein the project communities.
264
COMMUNITY-BASED MONITORING IN UGANDA 743
At the end of the meeting, the community’s suggestions for im-provements, and how to reach them without additional resources,were summarized in an action plan. The action plan containedinformation on health issues/services that had been identified bythe community as the most important to address, how these is-sues could be addressed, and how the community could monitorimprovements (or lack thereof). Although the issues raised in theaction plans differed across communities, a common set of con-cerns included high rates of absenteeism, long waiting time, weakattention of health staff, and differential treatment.
The health facility meeting was a one-afternoon event held atthe facility with all staff present. In the meeting, the facilitatorscontrasted the information on service provision as reported by theprovider with the findings from the household survey.
An interface meeting with members from the community, cho-sen in the community meeting, and health workers followed thecommunity and health facility meetings. During the interfacemeeting, the community representatives and the health work-ers discussed suggestions for improvements. The participantsdiscussed their rights and responsibilities as patients or medi-cal staff. The outcome was a shared action plan, or a contract,outlining the community’s and the service provider’s agreementon what needs to be done, and how, when, and by whom. The“community contract” also identified how the community couldmonitor the agreements and a time plan. Because the problemsthat were raised in the community meetings constituted the coreissues discussed during the interface meetings, the communitycontract was in many respects similar to the community’s actionplan.
The three separate meetings aimed at kick-starting the pro-cess of community monitoring. Thus, after the initial meetingsthe communities were themselves in charge of establishing waysof monitoring the provider. After a period of six months, the com-munities and health facilities were revisited. The CBOs facili-tated a one-afternoon community meeting and a one-afternooninterface meeting with the aim of tracking the implementationof the community contract. Health facility staff and communitymembers jointly discussed suggestions for sustaining or improv-ing progress, or in the case of no improvements, why so.5
5. Details on the report cards and the participatory methods used, as well asan example of an action plan, are provided in the Online Supplemental Appendix.
265
744 QUARTERLY JOURNAL OF ECONOMICS
IV. EVALUATION DESIGN AND EXPECTED OUTCOMES
IV.A. Outcomes
The main outcome of interest is whether the interventionincreased the quantity and quality of health care provision andhence resulted in improved health outcomes. We are also inter-ested in evaluating changes in all steps in the accountabilitychain: Did the treatment communities become more involved inmonitoring the health workers? Did the intervention change thehealth workers’ behavior?
As a robustness test we also assess alternative explanations.One concern is spillovers. Another concern is that the interventiondid not only (or primarily) increase the extent of community mon-itoring, but had an impact on other agents in the service deliverychain, such as the health subdistrict. The intervention could alsohave affected the health workers’ behavior directly, or affected itthrough the actions of the CBOs, rather than through more in-tense community-based monitoring as we hypothesize. Althoughthis would not invalidate the causal effect of the intervention, itwould, of course, affect the interpretation. Therefore, these alter-native hypotheses are also subject to a battery of tests.
IV.B. Statistical Framework
To assess the causal effect of the intervention we estimate
yi jd = α + βT jd + X jdπ + θd + εi jd,(1)
where yi jd is the outcome of household i (when applicable) in com-munity/health facility j in district d, T jd is an indicator variablefor assignment to treatment, and εi jd is an error term. Equation(1) also includes a vector, X, of preintervention facility-specificcovariates and district fixed effects (θd).6 Because of random as-signment, T should be orthogonal to X, and the consistency of β
does not depend on the inclusion of X in the model. The regres-sion adjustment is used to improve estimation precision and toaccount for stratification and chance differences between groups
6. The baseline covariates included are number of villages in the catchmentarea, number of days without electricity in the past month, indicator variablefor whether the facility has a separate maternity unit, distance to nearest publichealth provider, number of staff with less than advanced A-level education, indi-cator variable for whether the staff could safely drink from the water source, andaverage monthly supply of quinine.
266
COMMUNITY-BASED MONITORING IN UGANDA 745
in the distribution of pre-random assignment (Kling, Liebman,and Katz 2007).
We report the results of estimating equation (1) with X andθ excluded in the Online Supplemental Appendix. For a subset ofvariables we can also stack the pre- and postdata and explore thedifference-in-differences in outcomes; that is, we estimate7
yi jt = γ POSTt + βDD(T j ∗ POSTt ) + µj + εijt ,(2)
where POST is an indicator variable for the postintervention pe-riod, µ j is a facility/community specific fixed effect, and βDD is thedifference-in-differences estimate (program impact).
For some outcomes we have several outcome measures. Toform judgment about the impact of the intervention on a familyof K related outcomes, we follow Kling et al. (2004) and estimatea seemingly unrelated regression system,
Y = [IK ⊗ (T X)]θ + υ,(3)
where IK is a K by K identity matrix. We then derive average stan-dardized treatment effects, β = 1/K
∑Kk=1 βk/σk, where βk and σk
are the point estimate and standard error, respectively, for eacheffect (see Duflo, Glennerster, and Kremer [2007]). The point esti-mate, standard error, and p-value for β are based on the parame-ters, βk and σk, jointly estimated as elements of θ in (3).
V. RESULTS
V.A. Preintervention Differences
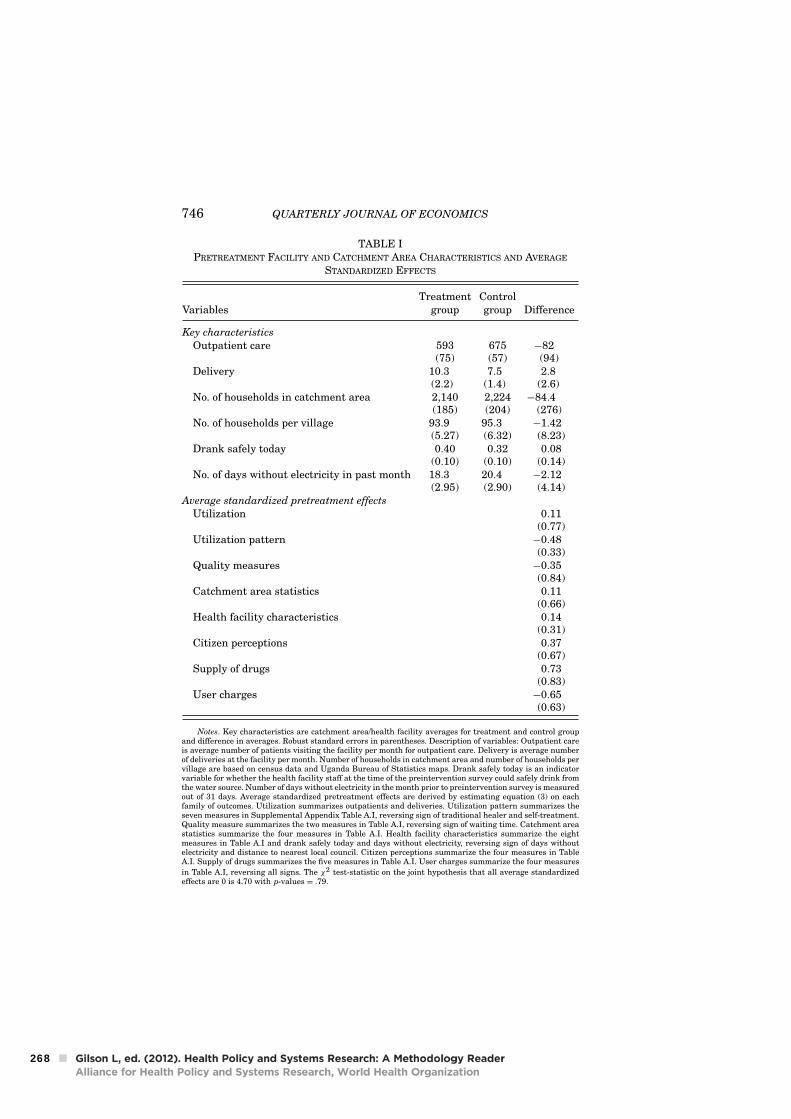
The treatment and the control group were similar on mostcharacteristics prior to the intervention. Average standardizedpretreatment effects are estimated for each family of outcomes(utilization, utilization pattern, quality, catchment area statis-tics, health facility characteristics, citizen perceptions, supply ofresources, and user charges) using preintervention data. As shownin Table I, we cannot reject the null hypotheses of no differencebetween the treatment and the control group.8
7. It is a subset of variables because the postintervention surveys collectedinformation on more variables and outcomes.
8. We report the test of difference in means across control and treatmentgroups for each individual variable in the Online Supplemental Appendix.
267
746 QUARTERLY JOURNAL OF ECONOMICS
TABLE IPRETREATMENT FACILITY AND CATCHMENT AREA CHARACTERISTICS AND AVERAGE
STANDARDIZED EFFECTS
Treatment ControlVariables group group Difference
Key characteristics
Outpatient care 593 675 −82(75) (57) (94)
Delivery 10.3 7.5 2.8(2.2) (1.4) (2.6)
No. of households in catchment area 2,140 2,224 −84.4(185) (204) (276)
No. of households per village 93.9 95.3 −1.42(5.27) (6.32) (8.23)
Drank safely today 0.40 0.32 0.08(0.10) (0.10) (0.14)
No. of days without electricity in past month 18.3 20.4 −2.12(2.95) (2.90) (4.14)
Average standardized pretreatment effects
Utilization 0.11(0.77)
Utilization pattern −0.48(0.33)
Quality measures −0.35(0.84)
Catchment area statistics 0.11(0.66)
Health facility characteristics 0.14(0.31)
Citizen perceptions 0.37(0.67)
Supply of drugs 0.73(0.83)
User charges −0.65(0.63)
Notes. Key characteristics are catchment area/health facility averages for treatment and control groupand difference in averages. Robust standard errors in parentheses. Description of variables: Outpatient careis average number of patients visiting the facility per month for outpatient care. Delivery is average numberof deliveries at the facility per month. Number of households in catchment area and number of households pervillage are based on census data and Uganda Bureau of Statistics maps. Drank safely today is an indicatorvariable for whether the health facility staff at the time of the preintervention survey could safely drink fromthe water source. Number of days without electricity in the month prior to preintervention survey is measuredout of 31 days. Average standardized pretreatment effects are derived by estimating equation (3) on eachfamily of outcomes. Utilization summarizes outpatients and deliveries. Utilization pattern summarizes theseven measures in Supplemental Appendix Table A.I, reversing sign of traditional healer and self-treatment.Quality measure summarizes the two measures in Table A.I, reversing sign of waiting time. Catchment areastatistics summarize the four measures in Table A.I. Health facility characteristics summarize the eightmeasures in Table A.I and drank safely today and days without electricity, reversing sign of days withoutelectricity and distance to nearest local council. Citizen perceptions summarize the four measures in TableA.I. Supply of drugs summarizes the five measures in Table A.I. User charges summarize the four measures
in Table A.I, reversing all signs. The χ2 test-statistic on the joint hypothesis that all average standardizedeffects are 0 is 4.70 with p-values = .79.
268
COMMUNITY-BASED MONITORING IN UGANDA 747
V.B. Processes
The initial phase of the project, that is, the three sepa-rate meetings, followed a predesign structure. A parallel systemwhereby a member of the survey team originating from the dis-trict participated as part of the CBO team also confirmed thatthe initial phase of the intervention was properly implemented.After these initial meetings, it was up to the community to sus-tain and lead the process. In this section we study whether thetreatment communities became more involved in monitoring theproviders.
To avoid influencing local initiatives, we did not have exter-nal agents visiting the communities and could therefore not doc-ument all actions taken by the communities in response to theintervention. Still, we have some information on how processes inthe community have changed. Specifically, the CBOs submittedreports on what type of changes they observed in the treatmentcommunities and we also surveyed the local councils in the treat-ment communities. We use facility and household survey data tocorroborate these reports.
According to the CBO reports and the local council survey, thecommunity-based monitoring process that followed the first set ofmeetings was a joint effort mainly managed by the local councils,HUMC, and community members. A typical village in the treat-ment group had, on average, six local council meetings in 2005. Inthose meetings, 89% of the villages discussed issues concerningthe project health facility. The main subject of discussion in thevillages concerned the community contract or parts of it, such asbehavior of the staff.
The CBOs reported that concerns raised by the village mem-bers were carried forward by the local council to the facilityor the HUMC. However, although the HUMC is an entity thatshould play an important role in monitoring the provider, it wasin many cases viewed as being ineffective. As a result, misman-aged HUMCs were dissolved and new members elected. Theseclaims are confirmed in the survey data: more than one-third ofthe HUMCs in the treatment communities were dissolved andnew members were elected or received following the intervention,whereas we observed no dissolved HUMCs in the control commu-nities. Further, the CBOs report that the community, or individualmembers, also monitored the health workers during visits to theclinic, when they rewarded and questioned issues in the commu-nity contract that had or had not been addressed, suggesting a
269
748 QUARTERLY JOURNAL OF ECONOMICS
more systematic use of nonpecuniary rewards. Monitoring toolssuch as suggestion boxes, numbered waiting cards, and duty ros-ters were also reported to be put in place in several treatmentfacilities.
In Table II, we formally look at the program impact on thesemonitoring tools. We use data collected through visual checks byenumerators during the postintervention facility survey. As shownin columns (1) and (2), one year into the project, treatment facil-ities are significantly more likely to have suggestion boxes (nocontrol facility had these, but 36% of the treatment facilities did)and numbered waiting cards (only one control facility had one,but 20% of the treatment facilities did). Columns (3) and (4) showthat a higher share of the treatment facilities also posted infor-mation on free services and patients’ rights and obligations. Theenumerators could visually confirm that 70% of the treatment fa-cilities had at least one of these monitoring tools, whereas only 4of 25 control clinics had at least one of them. The difference is sta-tistically significant (Online Supplemental Appendix, Table A.II).Column (5) reports the average standardized effect of the moni-toring tools. The estimate is significantly different from zero atthe 1% level.
The results based on household data mirror the findingsreported in columns (1)–(5). The performance of the staff ismore often discussed in local council meetings in the treatmentcommunities, shown in column (6), and community members inthe treatment group are, on average, better informed about theHUMC’s roles and responsibilities, as reported in column (7).Combining the evidence from the CBO reports and the householdsurvey data thus suggests that both the “quantity” of discussionsabout the project facility and the subject, from general to specificdiscussions about the community contract, changed in responseto the intervention.
V.C. Treatment Practices
The qualitative evidence from the CBOs and, to the extentthat we can measure them, the findings reported in Table IIsuggest that the treatment communities became more involvedin monitoring the provider. Did the intervention also affect thehealth workers’ behavior and performance? We turn to thisnext.
We start by looking at examination procedures. The esti-mate based on equation (2) with the dependent variable being
270

COMMUNITY-BASED MONITORING IN UGANDA 749
TA
BL
EII
PR
OG
RA
MIM
PA
CT
ON
MO
NIT
OR
ING
AN
DIN
FO
RM
AT
ION
Dep
end
ent
Pos
ter
Pos
ter
onA
ver
age
Dis
cuss
Rec
eived
va
ria
ble
Su
gges
tion
Nu
mb
ered
info
rmin
gp
ati
ents
’st
an
da
rdiz
edfa
cili
tyin
LC
info
rma
tion
box
wa
itin
gca
rds
free
serv
ices
righ
tsef
fect
mee
tin
gs
ab
out
HU
MC
Sp
ecifi
cati
on:
(1)
(2)
(3)
(4)
(5)
(6)
(7)
Pro
gra
mim
pa
ct0.3
2∗∗∗
0.1
6∗
0.2
7∗∗∗
0.1
42.5
5∗∗∗
0.1
3∗∗∗
0.0
4∗∗∗
(0. 0
8)
(0.0
9)
(0.0
9)
(0.1
0)
(0.5
5)
(0.0
3)
(0.0
1)
Mea
nco
ntr
olgro
up
00.0
40.1
20.1
2—
0.3
30.0
8O
bse
rva
tion
s5
05
05
05
05
03
,11
94
,99
6
Note
s.R
obu
stst
an
dard
erro
rsin
pare
nth
eses
.D
istu
rban
cete
rms
are
clu
ster
edby
catc
hm
ent
are
as
inco
lum
ns
(6)–
(7).
Poi
nt
esti
mate
s,st
an
dard
erro
rs,an
daver
age
stan
dard
ized
effe
ct,
colu
mn
s(1
)–(5
),are
der
ived
from
equ
ati
on(3
).P
rogra
mim
pact
mea
sure
sth
eco
effi
cien
ton
the
ass
ign
men
tto
trea
tmen
tin
dic
ato
r.O
utc
ome
mea
sure
sin
colu
mn
s(1
)–(4
)are
base
don
data
coll
ecte
dth
rou
gh
vis
ual
chec
ks
by
the
enu
mer
ato
rsd
uri
ng
the
pos
tin
terv
enti
onfa
cili
tysu
rvey
.O
utc
ome
mea
sure
sin
colu
mn
s(6
)an
d(7
)are
from
the
pos
tin
terv
enti
onh
ouse
hol
dsu
rvey
.T
he
esti
mate
deq
uati
ons
all
incl
ud
ed
istr
ict
fixed
effe
cts
an
dth
efo
llow
ing
base
lin
eco
vari
ate
s:n
um
ber
ofvil
lages
inca
tch
men
tare
a,
nu
mber
ofd
ays
wit
hou
tel
ectr
icit
yin
the
past
mon
th,
ind
icato
rvari
able
for
wh
eth
erth
efa
cili
tyh
as
ase
para
tem
ate
rnit
yu
nit
,d
ista
nce
ton
eare
stp
ubli
ch
ealt
hp
rovid
er,
nu
mber
ofst
aff
wit
hle
ssth
an
ad
van
ced
A-l
evel
edu
cati
on,
ind
icato
rvari
able
for
wh
eth
erth
est
aff
cou
ldsa
fely
dri
nk
from
the
wate
rso
urc
e,an
daver
age
mon
thly
sup
ply
ofqu
inin
e.S
pec
ifica
tion
:(1
)in
dic
ato
rvari
able
for
wh
eth
erth
eh
ealt
hfa
cili
tyh
as
asu
gges
tion
box
for
com
pla
ints
an
dre
com
men
dati
ons;
(2)
ind
icato
rvari
able
for
wh
eth
erth
efa
cili
tyh
as
nu
mber
edw
ait
ing
card
sfo
rit
sp
ati
ents
;(3
)in
dic
ato
rvari
able
for
wh
eth
erth
efa
cili
tyh
as
ap
oste
rin
form
ing
abou
tfr
eeh
ealt
hse
rvic
es;(4
)in
dic
ato
rvari
able
for
wh
eth
erth
efa
cili
tyh
as
ap
oste
ron
pati
ents
’rig
hts
an
dob
ligati
ons;
(5)
aver
age
stan
dard
ized
effe
ctof
the
esti
mate
sin
colu
mn
s(1
)–(4
);(6
)in
dic
ato
rvari
able
for
wh
eth
erth
eh
ouse
hol
dd
iscu
ssed
the
fun
ctio
nin
gof
the
hea
lth
faci
lity
at
alo
cal
cou
nci
lm
eeti
ng
du
rin
gth
ep
ast
yea
r;(7
)in
dic
ato
rvari
able
for
wh
eth
erth
eh
ouse
hol
dh
as
rece
ived
info
rmati
onabou
tth
eH
ealt
hU
nit
Man
agem
ent
Com
mit
tee’
s(H
UM
C’s
)ro
les
an
dre
spon
sibil
itie
s.*S
ign
ifica
nt
at
10%
.**
Sig
nifi
can
tat
5%
.**
*Sig
nifi
can
tat
1%
.
271
750 QUARTERLY JOURNAL OF ECONOMICS
TABLE IIIPROGRAM IMPACT ON TREATMENT PRACTICES AND MANAGEMENT
Program Mean controlSpec. Dep. variable Model impact 2005 group 2005 Obs.
(1) Equipment used DD 0.08∗∗ −0.07∗∗∗ 0.41 5,280(0.03) (0.02)
(2) Equipment used OLS 0.01 0.41 2,758(0.02)
(3) Waiting time DD −12.3∗ −12.4∗∗ 131 6,602(7.1) (5.2)
(4) Waiting time OLS −5.16 131 3,426(5.51)
(5) Absence rate OLS −0.13∗∗ 0.47 46(0.06)
(6) Management of clinic OLS 1.20∗∗∗ −0.49 50(0.33)
(7) Health information OLS 0.07∗∗∗ 0.32 4,996(0.02)
(8) Importance of family OLS 0.06∗∗∗ 0.31 4,996planning (0.02)
(9) Stockouts OLS −0.15∗∗ 0.50 42(0.07)
Notes. Each row is based on a separate regression. The DD model is from equation (2). The OLS modelis from equation (1) with district fixed effects and baseline covariates as listed in Table II. Robust standarderrors, clustered by catchment areas, are in columns (1)–(4) and (7)–(8), in parentheses. Program impactmeasures the coefficient on the assignment to treatment indicator in the OLS models and the assignment totreatment indicator interacted with an indicator variable for 2005 in the DD models. Specifications: (1) and(2) indicator variable for whether the staff used any equipment during examination when the patient visitedthe health facility; (3) and (4) difference between the time the citizen left the facility and the time the citizenarrived at the facility, minus the examination time; (5) ratio of workers not physically present at the timeof the postintervention survey to the number of workers employed preintervention (see text for details); (6)first component from a principal components analysis of the variables Condition of the floors of the healthclinic, Condition of the walls, Condition of furniture, and Smell of the facility, where each condition is rankedfrom 1 (dirty) to 3 (clean) by the enumerators; (7) indicator variable for whether the household has receivedinformation about the importance of visiting the health facility and the danger of self-treatment; (8) indicatorvariable for whether the household has received information about family planning; (9) share of months in2005 in which stock cards indicated no availability of drugs (see text for details).
*Significantly different from zero at 90% confidence level.**Significantly different from zero at 95% confidence level.***Significantly different from zero at 99% confidence level.
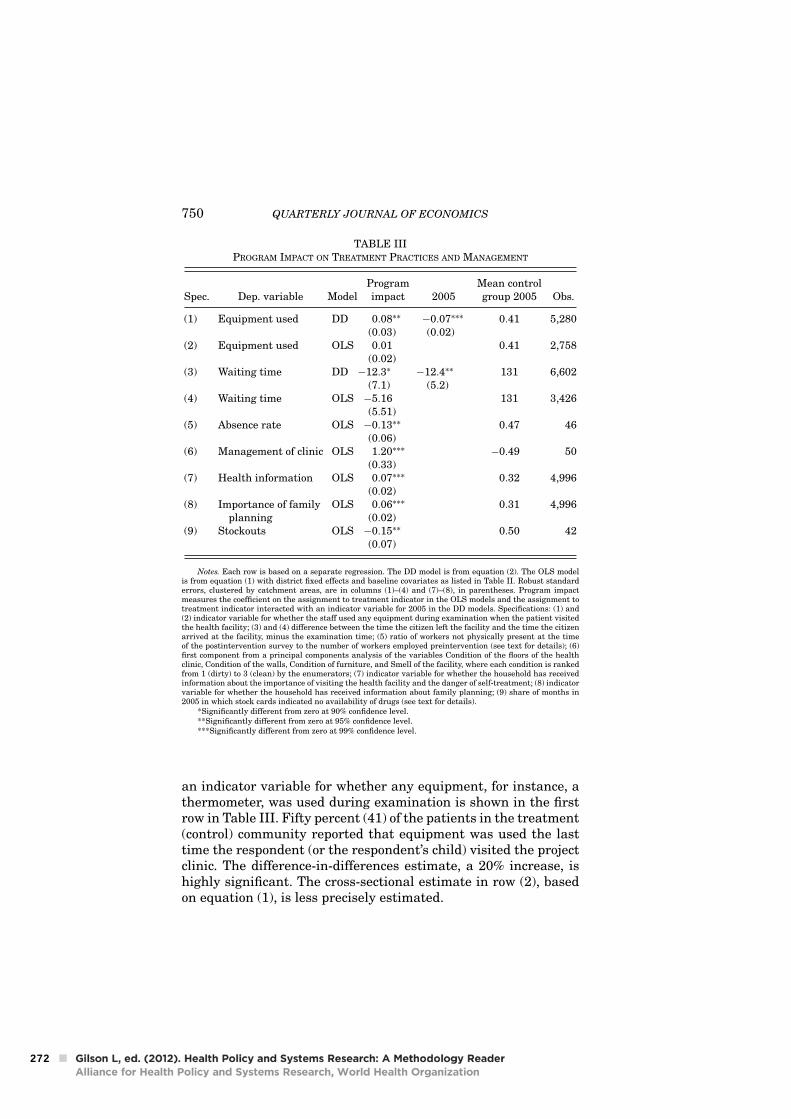
an indicator variable for whether any equipment, for instance, athermometer, was used during examination is shown in the firstrow in Table III. Fifty percent (41) of the patients in the treatment(control) community reported that equipment was used the lasttime the respondent (or the respondent’s child) visited the projectclinic. The difference-in-differences estimate, a 20% increase, ishighly significant. The cross-sectional estimate in row (2), basedon equation (1), is less precisely estimated.
272
COMMUNITY-BASED MONITORING IN UGANDA 751
In row (3) we report the result with an alternative measureof staff performance—the waiting time—defined as the differencebetween the time the user left the facility and the time the userarrived at the facility, subtracting the examination time. On aver-age, the waiting time was 131 minutes in the control facilities and119 in the treatment facilities. The estimate based on equation(1), shown in column (4), is less precisely estimated.
The results on absenteeism are shown in row (3).9 The pointestimate suggests a substantial treatment effect. On average, theabsence rate, defined as the ratio of workers not physically presentat the time of the postintervention survey to the number of work-ers on the list of employees as reported in the preinterventionsurvey, is 13 percentage points lower in the treatment facilities.Thus, in response to the intervention, health workers are morelikely to be at work.
Enumerators also visually checked the condition of the healthclinics, that is, whether floors and walls were clean, the conditionof the furniture, and the smell of the facility. We combine thesevariables through principal components analysis into a summaryscore. Treatment clinics appear to have put more effort into keep-ing the clinic in decent condition in response to the intervention.The point estimate, reported in row (6), implies a 0.56 standarddeviation improvement in the summary score in the treatmentcompared to the control facilities.
According to the government health sector strategic plan, pre-ventive care is one of the core tasks for health providers at theprimary level. A significantly larger share of households in thetreatment communities have received information about the dan-gers of self-treatment, reported in row (7), and the importance offamily planning, reported in row (8). The difference is 7 and 6percentage points, respectively.
There is no systematic difference in the supply of drugs be-tween the treatment and control groups (see Section V.F). How-ever, as shown in row (9), stockouts of drugs are occurring at ahigher frequency in the control facilities even though, as reported
9. The postintervention survey was not announced in advance. At the start ofthe survey, the enumerators physically verified the provider’s presence. A workerwas counted as absent if, at the time of the visit, he or she was not in the clinic.Staff reported to be on outreach were omitted from the absence calculation. Fourobservations were dropped because the total number of workers verified to bepresent or reported to be on outreach exceeded the total number of workers on thepreintervention staff list. Assuming instead no absenteeism in these four facilitiesyields a point estimate (standard error) of −0.20 (0.065).
273
752 QUARTERLY JOURNAL OF ECONOMICS
below, the control facilities treat significantly fewer patients.These findings suggest that more drugs leaked from health fa-cilities in the control group.10
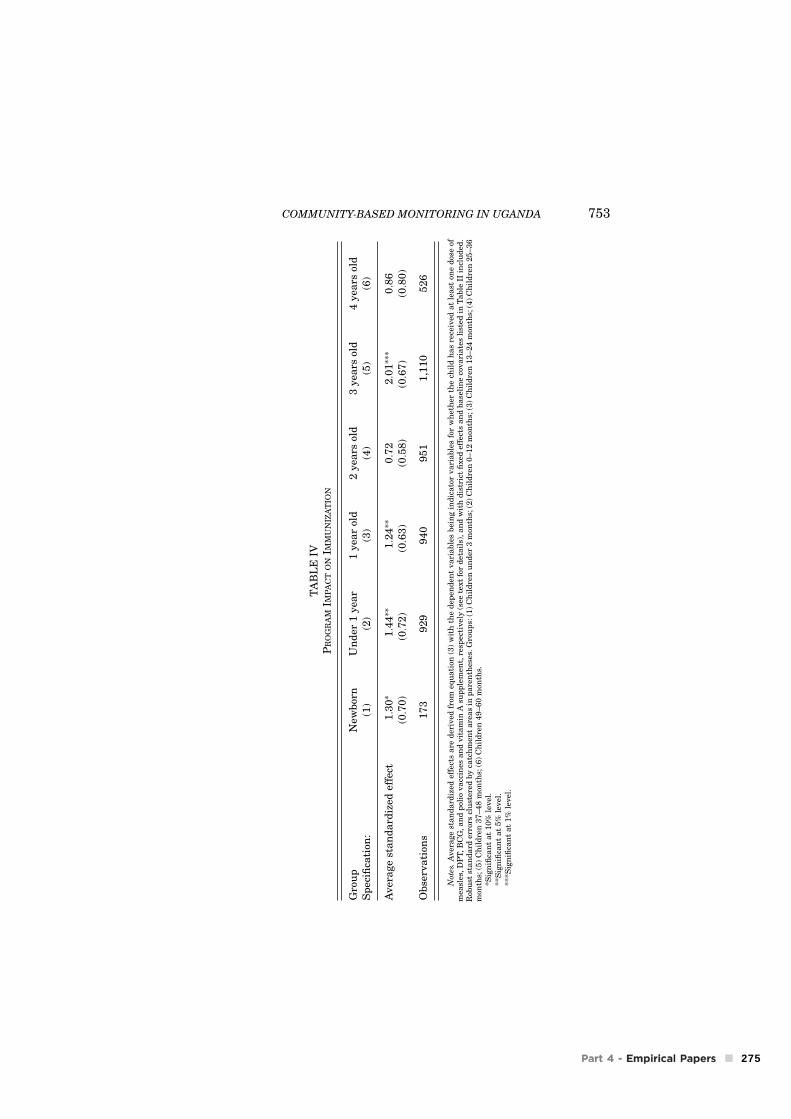
The findings on immunization of children under five are re-ported in Table IV. We have information on how many times(doses) in total each child has received polio, DPT, BCG, andmeasles vaccines and vitamin A supplements. On the basis ofthe recommended immunization plan, we create indicator vari-ables taking the value of 1 if child i of cohort (age) j had receivedthe required dose(s) of measles, DPT, BCG, and polio vaccines,respectively, and 0 otherwise.11 We then estimate (3), for each agegroup, and calculate average standardized effects.
The average standardized effects are significantly positivefor the younger cohorts. Looking at individual effects (OnlineSupplemental Appendix Table A.IV), there are significant posi-tive differences between households in the treatment and controlcommunity for all five vaccines, although not for all cohorts. Forexample, twice as many newborns in the treatment group have re-ceived vitamin A supplements, 46% more newborns have receivedthe first dose of BCG vaccine, and 42% more newborns have re-ceived the first dose of polio vaccine as compared to the controlgroup.
V.D. Utilization
To the extent we can measure it, the evidence presented so farsuggests that treatment communities began to monitor the healthunit more extensively in response to the intervention and that thehealth workers improved the provision of health services. We nowturn to the question of whether the intervention also resulted inimproved quantity and quality of care.
Cross-sectional estimates based on equation (3) are givenin Table V, Panel A. For outpatients and deliveries, we have
10. The dependent variable is the share of months in 2005 in which stock cardsindicated no availability of drugs, averaged over erythromycin, mebendazole, andseptrin. We find no significant difference between treatment and control clinicsfor chloroquine—the least expensive of the drugs on which we have data. Not allclinics had accurate stock cards and these clinics were therefore omitted.
11. According to the Uganda National Expanded Program on Immunization,each child in Uganda is supposed to be immunized against measles (one dose atnine months and two doses in case of an epidemic); DPT (three doses at six, ten,and fourteen weeks); BCG (one dose at birth or during the first contact with ahealth facility); and polio (three doses, or four if delivery takes place at the facility,at six, ten, and fourteen weeks). Because measles vaccination should not be givenat birth, we exclude immunization against measles in the plan for infants undertwelve months.
274
COMMUNITY-BASED MONITORING IN UGANDA 753
TA
BL
EIV
PR
OG
RA
MIM
PA
CT
ON
IMM
UN
IZA
TIO
N
Gro
up
New
bor
nU
nd
er1
yea
r1
yea
rol
d2
yea
rsol
d3
yea
rsol
d4
yea
rsol
dS
pec
ifica
tion
:(1
)(2
)(3
)(4
)(5
)(6
)
Aver
age
sta
nd
ard
ized
effe
ct1.3
0∗
1.4
4∗∗
1.2
4∗∗
0.7
22.0
1∗∗∗
0.8
6(0
.70
)(0
.72
)(0
.63
)(0
.58
)(0
.67
)(0
.80
)
Ob
serv
ati
ons
17
39
29
94
09
51
1,1
10
52
6
Note
s.A
ver
age
stan
dard
ized
effe
cts
are
der
ived
from
equ
ati
on(3
)w
ith
the
dep
end
ent
vari
able
sbei
ng
ind
icato
rvari
able
sfo
rw
het
her
the
chil
dh
as
rece
ived
at
least
one
dos
eof
mea
sles
,D
PT,B
CG
,an
dp
olio
vacc
ines
an
dvit
am
inA
sup
ple
men
t,re
spec
tivel
y(s
eete
xt
for
det
ail
s),an
dw
ith
dis
tric
tfi
xed
effe
cts
an
dbase
lin
eco
vari
ate
sli
sted
inT
able
IIin
clu
ded
.R
obu
stst
an
dard
erro
rscl
ust
ered
by
catc
hm
ent
are
as
inp
are
nth
eses
.G
rou
ps:
(1)
Ch
ild
ren
un
der
3m
onth
s;(2
)C
hil
dre
n0–12
mon
ths;
(3)
Ch
ild
ren
13–24
mon
ths;
(4)
Ch
ild
ren
25–36
mon
ths;
(5)
Ch
ild
ren
37–48
mon
ths;
(6)
Ch
ild
ren
49–60
mon
ths.
*Sig
nifi
can
tat
10%
level
.**
Sig
nifi
can
tat
5%
level
.**
*Sig
nifi
can
tat
1%
level
.
275

754 QUARTERLY JOURNAL OF ECONOMICS
TA
BL
EV
PR
OG
RA
MIM
PA
CT
ON
UT
ILIZ
AT
ION
/CO
VE
RA
GE
Use
ofse
lf-
Use
oftr
eatm
ent/
Fa
mil
yA
ver
age
pro
ject
tra
dit
ion
al
Aver
age
Dep
.va
ria
ble
Ou
tpa
tien
tsD
eliv
ery
An
ten
ata
lp
lan
nin
gst
def
fect
faci
lity
hea
lers
std
effe
ct
(1)
(2)
(3)
(4)
(5)
(6)
(7)
(8)
A:
Cro
ss-s
ecti
on
al
da
ta
Pro
gra
mim
pa
ct1
30.2
∗∗
5.3
∗∗
15.0
3.4
1.7
5∗∗∗
0.0
26
∗−
0.0
14
1.4
3∗
(60.8
)(2
.1)
(11. 2
)(3
.2)
(0.6
3)
(0.0
16
)(0
.01
1)
(0.8
7)
Ob
serv
ati
ons
50
50
50
50
50
50
50
50
(9)
(10
)(1
1)
(12
)(1
3)
(14
)
B:
Pa
nel
da
ta
Pro
gra
mim
pa
ct1
89.1
∗∗∗
3.4
8∗
2.3
0∗∗∗
0.0
31
∗−
0.0
46
∗∗
1.9
6∗∗
(67. 2
)(1
.96
)(0
.69
)(0
.01
7)
(0.0
21
)(0
.89
)O
bse
rva
tion
s1
00
10
01
00
10
01
00
10
0
Mea
nco
ntr
olgro
up
20
05
66
19.2
78.9
15.2
–0.2
40.3
6–
Note
s.P
an
elA
rep
orts
pro
gra
mim
pact
esti
mate
sfr
omcr
oss-
sect
ion
al
mod
els
wit
hd
istr
ict
fixed
effe
cts
an
dbase
lin
eco
vari
ate
sas
list
edin
Table
II,
wit
hro
bu
stst
an
dard
erro
rsin
pare
nth
eses
.P
an
elB
rep
orts
pro
gra
mim
pact
esti
mate
sfr
omd
iffe
ren
ce-i
n-d
iffe
ren
ces
mod
els
wit
hro
bu
stst
an
dard
erro
rscl
ust
ered
by
faci
lity
inp
are
nth
eses
.P
oin
tes
tim
ate
s,st
an
dard
erro
rs,
an
daver
age
stan
dard
ized
effe
cts
insp
ecifi
cati
ons
(1)–
(5),
(6)–
(8),
(9)–
(11),
an
d(1
2)–
(13)
are
der
ived
from
equ
ati
on(3
).P
rogra
mim
pact
mea
sure
sth
eco
effi
cien
ton
the
ass
ign
men
tto
trea
tmen
tin
dic
ato
rin
the
OL
Sm
odel
san
dth
eass
ign
men
tto
trea
tmen
tin
dic
ato
rin
tera
cted
wit
han
ind
icato
rvari
able
for
2005
inth
eD
Dm
odel
s.S
pec
ifica
tion
s:F
irst
colu
mn
isaver
age
nu
mber
ofp
ati
ents
vis
itin
gth
efa
cili
typ
erm
onth
for
outp
ati
ent
care
;se
con
dco
lum
nis
aver
age
nu
mber
ofd
eliv
erie
sat
the
faci
lity
per
mon
th;th
ird
colu
mn
isaver
age
nu
mber
ofan
ten
ata
lvis
its
at
the
faci
lity
per
mon
th;fo
urt
hco
lum
nis
aver
age
nu
mber
offa
mil
yp
lan
nin
gvis
its
at
the
faci
lity
per
mon
th;fi
fth
colu
mn
isaver
age
stan
dard
ized
effe
ctof
esti
mate
sin
spec
ifica
tion
s(1
)–(4
)an
d(9
)–(1
0),
resp
ecti
vel
y;si
xth
colu
mn
isth
esh
are
ofvis
its
toth
ep
roje
ctfa
cili
tyof
all
hea
lth
vis
its,
aver
aged
over
catc
hm
ent
are
a;se
ven
thco
lum
nis
the
share
ofvis
its
totr
ad
itio
nal
hea
lers
an
dse
lf-t
reatm
ent
ofall
hea
lth
vis
its,
aver
aged
over
catc
hm
ent
are
a;
eigh
thco
lum
nis
aver
age
stan
dard
ized
effe
ctof
esti
mate
sin
spec
ifica
tion
s(6
)–(7
)an
d(1
2)–
(14),
resp
ecti
vel
y,re
ver
sin
gth
esi
gn
ofu
seof
self
-tre
atm
ent/
trad
itio
nal
hea
lers
.*S
ign
ifica
nt
at
10%
level
.**
Sig
nifi
can
tat
5%
level
.**
*Sig
nifi
can
tat
1%
level
.
276
COMMUNITY-BASED MONITORING IN UGANDA 755
preintervention data and can also estimate difference-in-differ-ences models, shown in Panel B, and value-added models, shownin Table A.V in the Online Supplemental Appendix.12
One year into the program, utilization (for general outpatientservices) is 20% higher in the treatment facilities as shown in spec-ification (1). For the difference-in-differences and the value-addedmodels (reported in specification (9) in Table V and specification(ix) in Table A.V), the coefficients on the treatment indicator arelarger both in absolute magnitude and relative to their standarderrors. Thus, controlling for baseline outcomes, yjt−1, improvesthe precision of the treatment effect, which is to be expectedgiven the persistent nature of the outcome variable. The dif-ference in the number of deliveries, shown in specification (2),albeit starting from a low level, is 58% and is fairly preciselyestimated. There are also positive differences in the numberof patients seeking antenatal care (19% increase) and familyplanning (22% increase), although these estimates are not in-dividually significantly different from zero. The average stan-dardized effect, reported in specification (5), however, is highlysignificant.
The last three columns in Table V, Panels A and B, re-port changes in utilization patterns based on household data.We collected data on where each household member sought careduring 2005 in case of illness that required treatment and col-lapsed this information by community. There is an 11%–13%increase, specifications (6) and (12), in the use of the project fa-cility in treatment as compared to the control group—a resultconsistent with that reported in specification (1) using facilityrecords.
Households in the treatment community also reduced thenumber of visits to traditional healers and the extent of self-treatment, specifications (7) and (13), but there are no statisti-cally significant differences across the two groups in the use ofother providers (not reported). Thus, as summarized in the av-erage standardized treatment effects, specifications (8) and (9),households in the treatment communities switched from tradi-tional healers and self-treatment to the project facility in responseto the intervention.
12. The value-added specification is yjt = αVA + βVAT j + λyjt−1 + ε jt.
277
756 QUARTERLY JOURNAL OF ECONOMICS
V.E. Health Outcomes
We collected data on births, pregnancies, and deaths of chil-dren under five years in 2005. We also measured the weight of allinfants (i.e., under age 18 months) and children (between ages 18and 36 months) in the surveyed households.
Health outcomes could have improved for several reasons. Asnoted in the Introduction, access to a small set of proven, inexpen-sive services could, worldwide, have prevented more than half ofall deaths of children under age 5. For a country with an epidemi-ological profile as in Uganda, the estimate of preventable deathsis 73 percent (Jones et al. 2003).13 In the community monitor-ing project specifically, increased utilization and having patientsswitch from self-treatment and traditional healers to seek careat the treatment facility could have an effect. Holding utiliza-tion constant, better service quality, increased immunization, andmore extensive use of preventive care could also have resulted inimproved health status.
As a reference point we review the set of health interven-tions feasible for delivery at high coverage in low-income set-tings with sufficient evidence of effect on reducing mortality fromthe major causes of under-5 deaths (Jones et al. 2003). We fo-cus on community-based, randomized, controlled field trials thatbear some resemblance (because they are community-based) toour project. Several of these field trials document reductions inunder-5 mortality rates of 30%–50% one to two years into theproject.14 There is, however, a fundamental difference between the
13. This is likely to be a conservative number because only medical interven-tions for which cause-specific evidence of effect was available were included in theestimation. For example, increased birth spacing, which has been estimated toreduce under-5 mortality by 19 percent in India, was not considered. Several peri-natal and neonatal health interventions that could be implemented in low-incomecountries were not included either (Darmstadt et al. 2005).
14. For example, a project in Tigray, Ethiopia, in which coordinators,supported by a team of supervisors, were trained to teach mothers to recognizesymptoms of malaria in their children and provide antimalarials, reduced under-5mortality by 40% (Kidane and Morrow 2000). Bang et al. (1990) document a 30%reduction in under-5 mortality from an intervention that included mass educationabout childhood pneumonia and case management of pneumonia by trained villagehealth workers—a result similar to the meta-analysis estimate by Sazawal andBlack (2003). Bang et al. (1999) evaluate a project in which trained village healthworkers, assisted by birth attendants and supervisory visits, provided home-basedneonatal care, including treatment of sepsis. Two years into the project, they doc-ument a reduction in infant mortality by nearly 50 percent. Rahmathullah et al.(2003) assess the impact of a community-based project in two rural districts ofTamil Nadu, India, where newborn infants in the treatment group were allocatedoral vitamin A after delivery. The intervention resulted in a 22% reduction in totalmortality at age 6 months. Manandhar et al. (2004) evaluate a project in which a
278
COMMUNITY-BASED MONITORING IN UGANDA 757
interventions discussed in footnote 14 and our work. The medi-cal field trials study the impact of a biological agent or treatmentpractice in a community setting when the community health work-ers and medical personnel competently carry out their tasks. Inthe experiment we consider, on the contrary, no new health in-terventions were introduced and the supply of health inputs wasunchanged. Instead, we focused on incentivizing health workersto carry out their tasks through strengthened local accountability.
Estimates for births and pregnancies are given in Table VI,columns (1) and (2). To the extent that the intervention had aneffect on fertility, for example, through increased use of familyplanning services, it would primarily affect the incidence of preg-nancies in 2005, given the forty-week period between conceptionto birth. The incidence of births is not significantly different acrosstreatment and control groups. However, the treatment groups had10% fewer incidences of pregnancies in 2005.
Column (3) shows the treatment effect on under-5 mortality.15
The point estimate suggests a substantial treatment effect. Theaverage under-5 mortality rate in the control group is 144, close tothe official figure of 133 for 2005 (UNICEF 2006). In the treatmentgroup, the under-5 mortality rate is 97, which is a 33% reductionin under-5 mortality. The difference is significant (and somewhatlarger in absolute magnitude) when controlling for district fixedeffects as reported in column (3). Although the effect is large, it isworth emphasizing that the 90% confidence interval of our esti-mate also includes much lower effects (90% CI: 8%–64% reductionin under-5 mortality rate). With a total of approximately 55,000households residing in the treatment communities, the treatmenteffect corresponds to approximately 550 averted under-5 deathsin the treatment group in 2005.
facilitator convened nine women’s group meetings every month in the Makwanpurdistrict in Nepal in which perinatal problems were identified and strategies to ad-dress them formulated. Two years into the project they document a 30% reductionin neonatal mortality. Rahman et al. (1982) evaluate the impact of immunization ofwomen with tetanus injections during pregnancy in rural Bangladesh. The inter-vention reduced neonatal mortality by 45%. Mtango and Neuvians (1986) evaluatea project in rural Tanzania in which trained village health workers visited familiesat their homes every six to eight weeks, giving health education on recognition andprevention of acute respiratory infections, treating children with pneumonia withantibiotics or referring them to the next higher level of care. Within a two-yearperiod, they document a 27% reduction in under-5 mortality—a reduction slightlylower than that found in a similar study in rural Bangladesh (Fauveau et al. 1992).
15. The under-5 mortality rate is the sum of the death rates for each cohort(age groups 0–1, 1–2, 2–3, 3–4, and 4–5) per community in 2005, expressed perthousand live births.
279
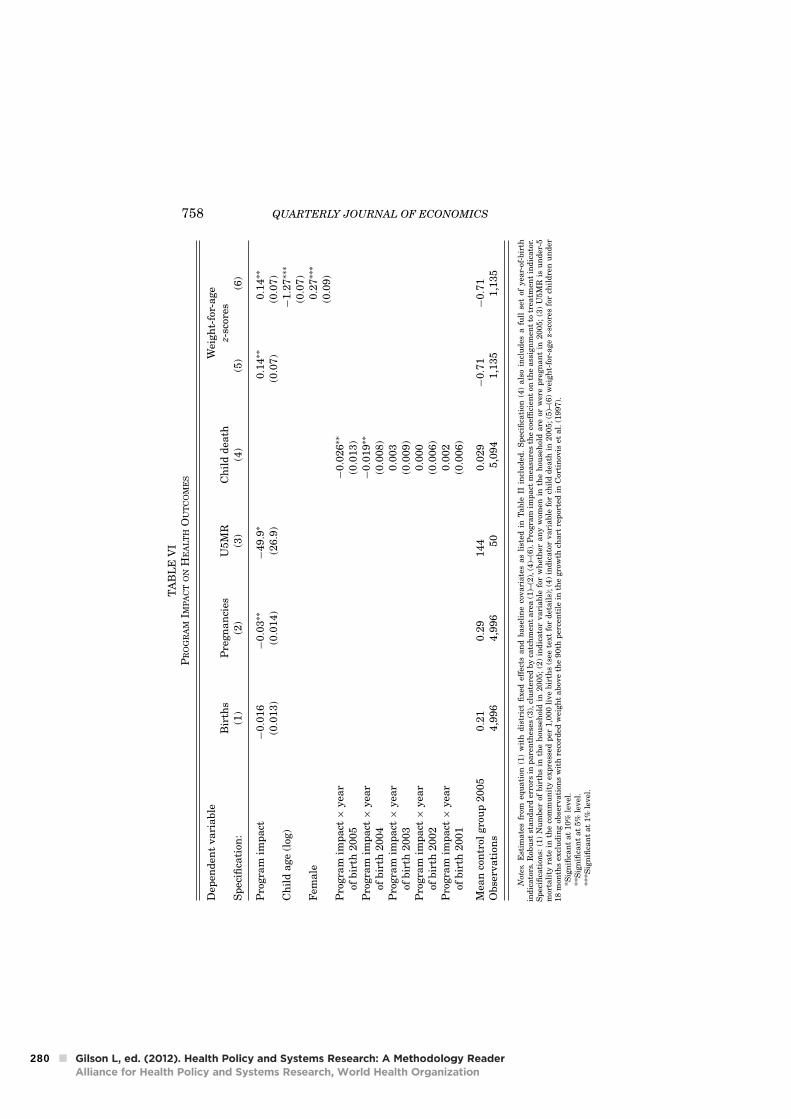
758 QUARTERLY JOURNAL OF ECONOMICS
TA
BL
EV
IP
RO
GR
AM
IMP
AC
TO
NH
EA
LT
HO
UT
CO
ME
S
Dep
end
ent
va
ria
ble
Wei
gh
t-fo
r-a
ge
Bir
ths
Pre
gn
an
cies
U5
MR
Ch
ild
dea
thz-
scor
esS
pec
ifica
tion
:(1
)(2
)(3
)(4
)(5
)(6
)
Pro
gra
mim
pa
ct−
0.0
16
−0.0
3∗∗
−4
9.9
∗0.1
4∗∗
0.1
4∗∗
(0.0
13
)(0
.01
4)
(26.9
)(0
.07
)(0
.07
)C
hil
da
ge
(log
)−
1.2
7∗∗∗
(0.0
7)
Fem
ale
0.2
7∗∗∗
(0.0
9)
Pro
gra
mim
pa
ct×
yea
r−
0.0
26
∗∗
ofb
irth
20
05
(0.0
13
)P
rogra
mim
pa
ct×
yea
r−
0.0
19
∗∗
ofb
irth
20
04
(0.0
08
)P
rogra
mim
pa
ct×
yea
r0.0
03
ofb
irth
20
03
(0.0
09
)P
rogra
mim
pa
ct×
yea
r0.0
00
ofb
irth
20
02
(0.0
06
)P
rogra
mim
pa
ct×
yea
r0.0
02
ofb
irth
20
01
(0.0
06
)
Mea
nco
ntr
olgro
up
20
05
0.2
10.2
91
44
0.0
29
−0.7
1−
0.7
1O
bse
rva
tion
s4
,99
64
,99
65
05
,09
41
,13
51
,13
5
Note
s.E
stim
ate
sfr
omeq
uati
on(1
)w
ith
dis
tric
tfi
xed
effe
cts
an
dbase
lin
eco
vari
ate
sas
list
edin
Table
IIin
clu
ded
.S
pec
ifica
tion
(4)
als
oin
clu
des
afu
llse
tof
yea
r-of
-bir
thin
dic
ato
rs.R
obu
stst
an
dard
erro
rsin
pare
nth
eses
(3),
clu
ster
edby
catc
hm
ent
are
a(1
)–(2
),(4
)–(6
).P
rogra
mim
pact
mea
sure
sth
eco
effi
cien
ton
the
ass
ign
men
tto
trea
tmen
tin
dic
ato
r.S
pec
ifica
tion
s:(1
)N
um
ber
ofbir
ths
inth
eh
ouse
hol
din
2005;
(2)
ind
icato
rvari
able
for
wh
eth
eran
yw
omen
inth
eh
ouse
hol
dare
orw
ere
pre
gn
an
tin
2005;
(3)
U5M
Ris
un
der
-5m
orta
lity
rate
inth
eco
mm
un
ity
exp
ress
edp
er1,0
00
live
bir
ths
(see
text
for
det
ail
s);
(4)
ind
icato
rvari
able
for
chil
dd
eath
in2005;
(5)–
(6)
wei
gh
t-fo
r-age
z-sc
ores
for
chil
dre
nu
nd
er18
mon
ths
excl
ud
ing
obse
rvati
ons
wit
hre
cord
edw
eigh
tabov
eth
e90th
per
cen
tile
inth
egro
wth
chart
rep
orte
din
Cor
tin
ovis
etal.
(1997).
*Sig
nifi
can
tat
10%
level
.**
Sig
nifi
can
tat
5%
level
.**
*Sig
nifi
can
tat
1%
level
.
280
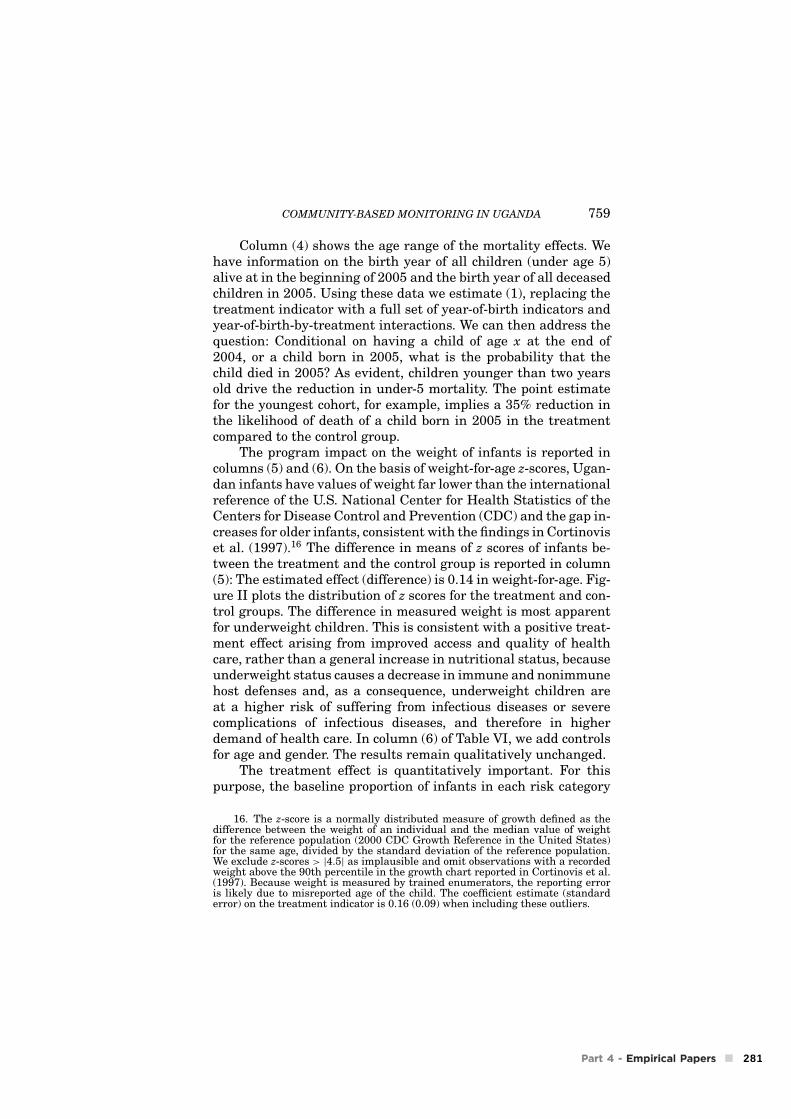
COMMUNITY-BASED MONITORING IN UGANDA 759
Column (4) shows the age range of the mortality effects. Wehave information on the birth year of all children (under age 5)alive at in the beginning of 2005 and the birth year of all deceasedchildren in 2005. Using these data we estimate (1), replacing thetreatment indicator with a full set of year-of-birth indicators andyear-of-birth-by-treatment interactions. We can then address thequestion: Conditional on having a child of age x at the end of2004, or a child born in 2005, what is the probability that thechild died in 2005? As evident, children younger than two yearsold drive the reduction in under-5 mortality. The point estimatefor the youngest cohort, for example, implies a 35% reduction inthe likelihood of death of a child born in 2005 in the treatmentcompared to the control group.
The program impact on the weight of infants is reported incolumns (5) and (6). On the basis of weight-for-age z-scores, Ugan-dan infants have values of weight far lower than the internationalreference of the U.S. National Center for Health Statistics of theCenters for Disease Control and Prevention (CDC) and the gap in-creases for older infants, consistent with the findings in Cortinoviset al. (1997).16 The difference in means of z scores of infants be-tween the treatment and the control group is reported in column(5): The estimated effect (difference) is 0.14 in weight-for-age. Fig-ure II plots the distribution of z scores for the treatment and con-trol groups. The difference in measured weight is most apparentfor underweight children. This is consistent with a positive treat-ment effect arising from improved access and quality of healthcare, rather than a general increase in nutritional status, becauseunderweight status causes a decrease in immune and nonimmunehost defenses and, as a consequence, underweight children areat a higher risk of suffering from infectious diseases or severecomplications of infectious diseases, and therefore in higherdemand of health care. In column (6) of Table VI, we add controlsfor age and gender. The results remain qualitatively unchanged.
The treatment effect is quantitatively important. For thispurpose, the baseline proportion of infants in each risk category
16. The z-score is a normally distributed measure of growth defined as thedifference between the weight of an individual and the median value of weightfor the reference population (2000 CDC Growth Reference in the United States)for the same age, divided by the standard deviation of the reference population.We exclude z-scores > |4.5| as implausible and omit observations with a recordedweight above the 90th percentile in the growth chart reported in Cortinovis et al.(1997). Because weight is measured by trained enumerators, the reporting erroris likely due to misreported age of the child. The coefficient estimate (standarderror) on the treatment indicator is 0.16 (0.09) when including these outliers.
281
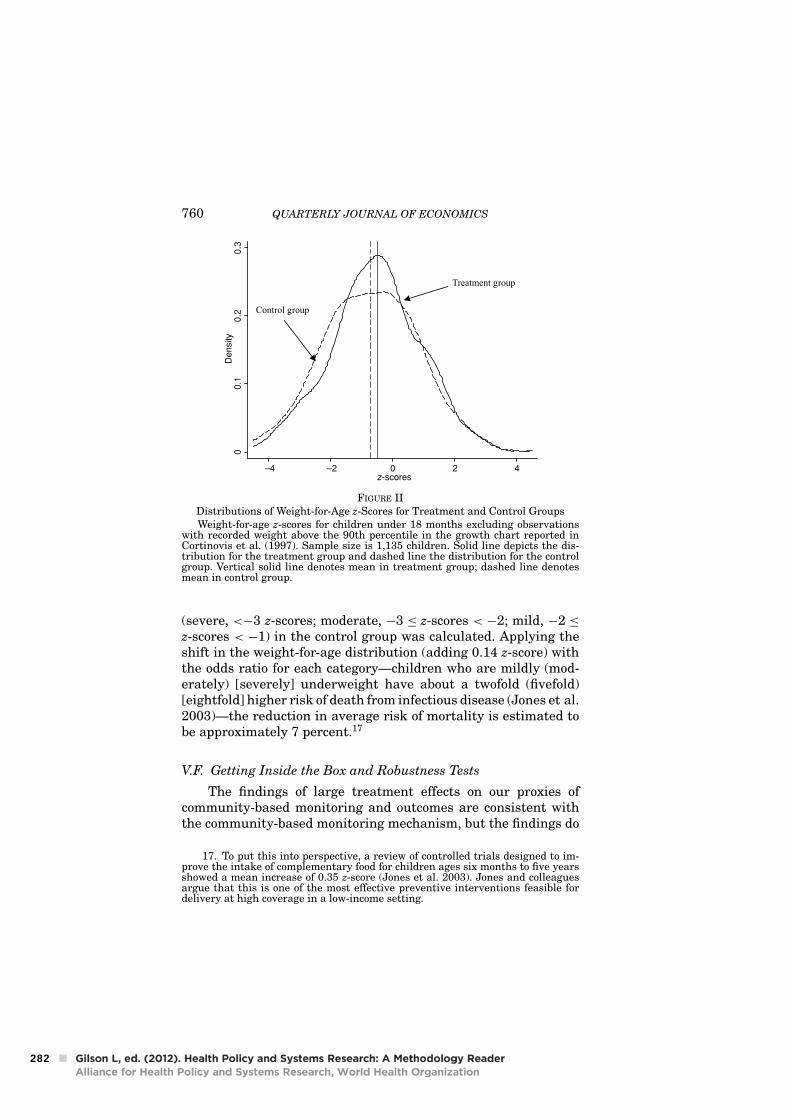
760 QUARTERLY JOURNAL OF ECONOMICS
00
.10
.20
.3D
en
sity
–4 –2 0 2 4z-scores
Treatment group
Control group
FIGURE IIDistributions of Weight-for-Age z-Scores for Treatment and Control GroupsWeight-for-age z-scores for children under 18 months excluding observations
with recorded weight above the 90th percentile in the growth chart reported inCortinovis et al. (1997). Sample size is 1,135 children. Solid line depicts the dis-tribution for the treatment group and dashed line the distribution for the controlgroup. Vertical solid line denotes mean in treatment group; dashed line denotesmean in control group.
(severe, <−3 z-scores; moderate, −3 ≤ z-scores < −2; mild, −2 ≤
z-scores < −1) in the control group was calculated. Applying theshift in the weight-for-age distribution (adding 0.14 z-score) withthe odds ratio for each category—children who are mildly (mod-erately) [severely] underweight have about a twofold (fivefold)[eightfold] higher risk of death from infectious disease (Jones et al.2003)—the reduction in average risk of mortality is estimated tobe approximately 7 percent.17
V.F. Getting Inside the Box and Robustness Tests
The findings of large treatment effects on our proxies ofcommunity-based monitoring and outcomes are consistent withthe community-based monitoring mechanism, but the findings do
17. To put this into perspective, a review of controlled trials designed to im-prove the intake of complementary food for children ages six months to five yearsshowed a mean increase of 0.35 z-score (Jones et al. 2003). Jones and colleaguesargue that this is one of the most effective preventive interventions feasible fordelivery at high coverage in a low-income setting.
282
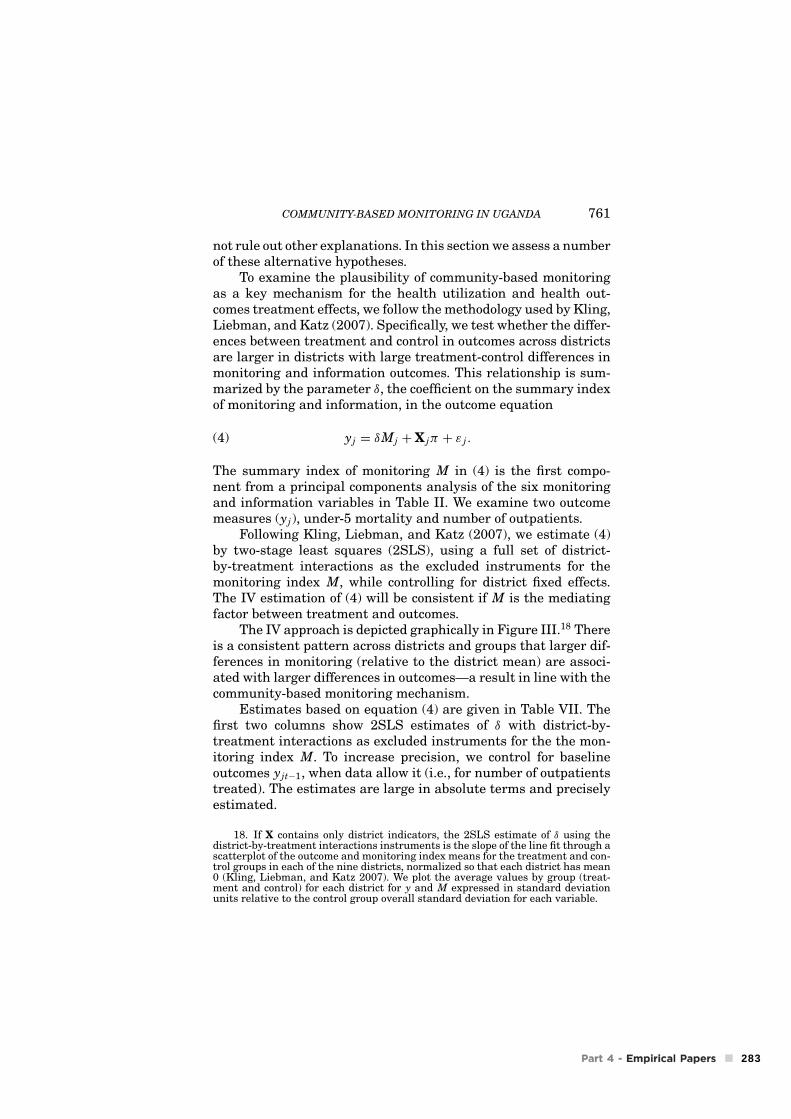
COMMUNITY-BASED MONITORING IN UGANDA 761
not rule out other explanations. In this section we assess a numberof these alternative hypotheses.
To examine the plausibility of community-based monitoringas a key mechanism for the health utilization and health out-comes treatment effects, we follow the methodology used by Kling,Liebman, and Katz (2007). Specifically, we test whether the differ-ences between treatment and control in outcomes across districtsare larger in districts with large treatment-control differences inmonitoring and information outcomes. This relationship is sum-marized by the parameter δ, the coefficient on the summary indexof monitoring and information, in the outcome equation
yj = δMj + X jπ + ε j .(4)
The summary index of monitoring M in (4) is the first compo-nent from a principal components analysis of the six monitoringand information variables in Table II. We examine two outcomemeasures (yj), under-5 mortality and number of outpatients.
Following Kling, Liebman, and Katz (2007), we estimate (4)by two-stage least squares (2SLS), using a full set of district-by-treatment interactions as the excluded instruments for themonitoring index M, while controlling for district fixed effects.The IV estimation of (4) will be consistent if M is the mediatingfactor between treatment and outcomes.
The IV approach is depicted graphically in Figure III.18 Thereis a consistent pattern across districts and groups that larger dif-ferences in monitoring (relative to the district mean) are associ-ated with larger differences in outcomes—a result in line with thecommunity-based monitoring mechanism.
Estimates based on equation (4) are given in Table VII. Thefirst two columns show 2SLS estimates of δ with district-by-treatment interactions as excluded instruments for the the mon-itoring index M. To increase precision, we control for baselineoutcomes yjt−1, when data allow it (i.e., for number of outpatientstreated). The estimates are large in absolute terms and preciselyestimated.
18. If X contains only district indicators, the 2SLS estimate of δ using thedistrict-by-treatment interactions instruments is the slope of the line fit through ascatterplot of the outcome and monitoring index means for the treatment and con-trol groups in each of the nine districts, normalized so that each district has mean0 (Kling, Liebman, and Katz 2007). We plot the average values by group (treat-ment and control) for each district for y and M expressed in standard deviationunits relative to the control group overall standard deviation for each variable.
283
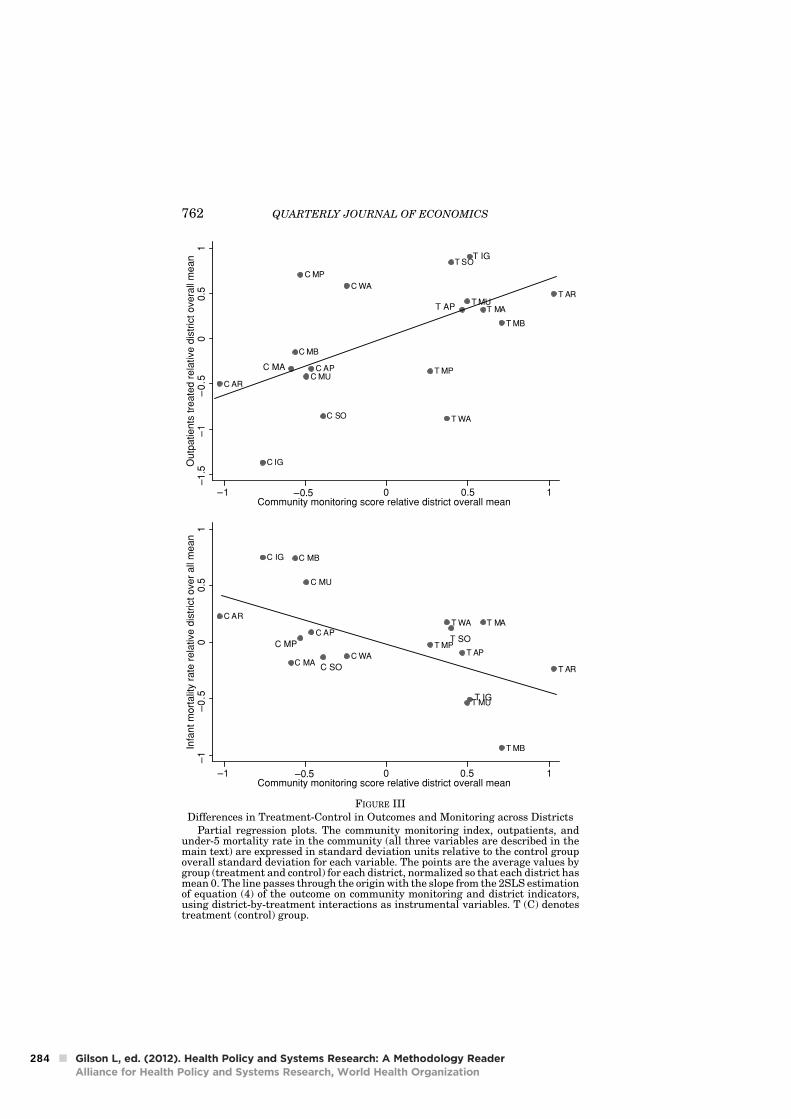
762 QUARTERLY JOURNAL OF ECONOMICS
T AP
T AR
T MA
T MB
T MP
T MU
T WA
C AP
C AR
C IG
C MA
C MB
C MU
C WA
–1
–0
.50
0.5
1In
fant m
ort
alit
y r
ate
rela
tive d
istr
ict over
all
mean
–1 –0.5 0 0.5 1Community monitoring score relative district overall mean
T IG
C SO
C MPT SO
T AR
T MA
T MB
T MP
T MU
T SO
T WA
C AP
C AR
C IG
C MB
C MP
C MU
C SO
C WA
–1
.5–
1–
0.5
00.5
1O
utp
atients
tre
ate
d r
ela
tive d
istr
ict overa
ll m
ean
–1 –0.5 0 0.5 1Community monitoring score relative district overall mean
C MA
T IG
T AP
FIGURE IIIDifferences in Treatment-Control in Outcomes and Monitoring across Districts
Partial regression plots. The community monitoring index, outpatients, andunder-5 mortality rate in the community (all three variables are described in themain text) are expressed in standard deviation units relative to the control groupoverall standard deviation for each variable. The points are the average values bygroup (treatment and control) for each district, normalized so that each district hasmean 0. The line passes through the origin with the slope from the 2SLS estimationof equation (4) of the outcome on community monitoring and district indicators,using district-by-treatment interactions as instrumental variables. T (C) denotestreatment (control) group.
284
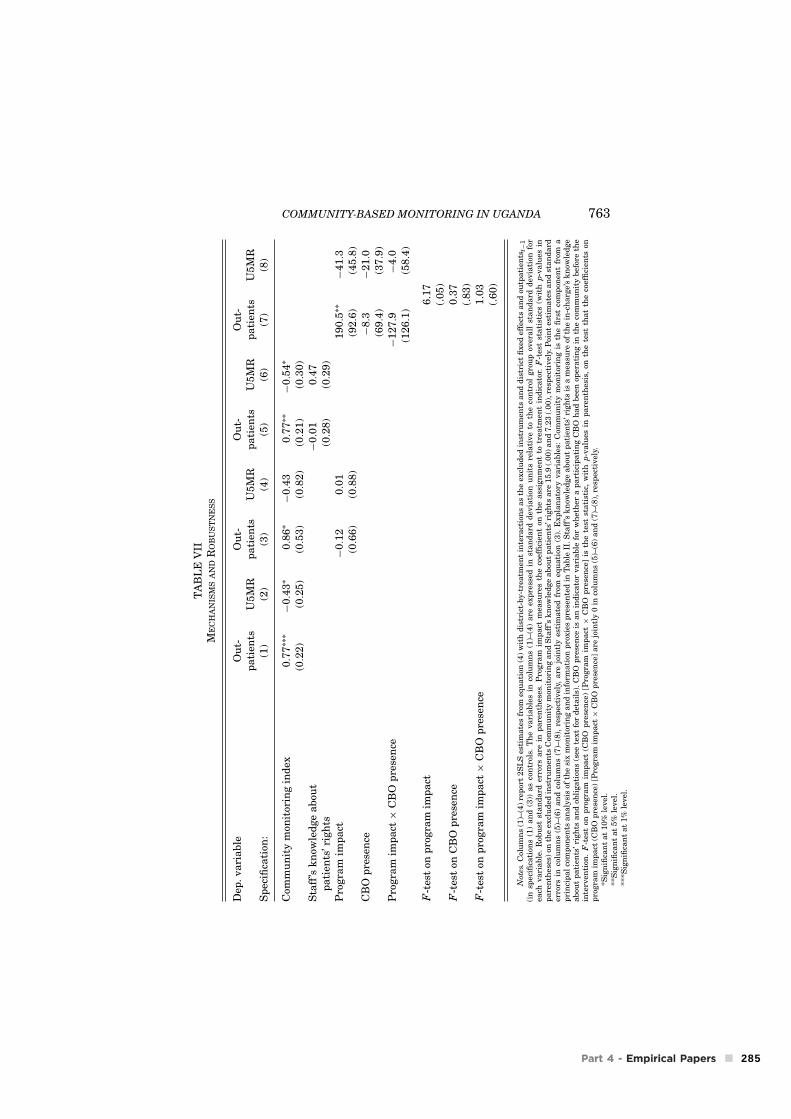
COMMUNITY-BASED MONITORING IN UGANDA 763
TA
BL
EV
IIM
EC
HA
NIS
MS
AN
DR
OB
US
TN
ES
S
Dep
.va
ria
ble
Ou
t-O
ut-
Ou
t-O
ut-
pa
tien
tsU
5M
Rp
ati
ents
U5
MR
pa
tien
tsU
5M
Rp
ati
ents
U5
MR
Sp
ecifi
cati
on:
(1)
(2)
(3)
(4)
(5)
(6)
(7)
(8)
Com
mu
nit
ym
onit
orin
gin
dex
0.7
7∗∗∗
−0.4
3∗
0.8
6∗
−0.4
30.7
7∗∗
−0.5
4∗
(0.2
2)
(0.2
5)
(0.5
3)
(0.8
2)
(0.2
1)
(0.3
0)
Sta
ff’s
kn
owle
dge
ab
out
−0.0
10.4
7p
ati
ents
’rig
hts
(0.2
8)
(0.2
9)
Pro
gra
mim
pa
ct−
0.1
20.0
11
90.5
∗∗
−4
1.3
(0.6
6)
(0.8
8)
(92.6
)(4
5.8
)C
BO
pre
sen
ce−
8.3
−2
1.0
(69.4
)(3
7.9
)P
rogra
mim
pa
ct×
CB
Op
rese
nce
−1
27.9
−4.0
(12
6.1
)(5
8.4
)
F-t
est
onp
rogra
mim
pa
ct6
.17
(.0
5)
F-t
est
onC
BO
pre
sen
ce0
.37
(.8
3)
F-t
est
onp
rogra
mim
pa
ct×
CB
Op
rese
nce
1.0
3(.
60
)
Note
s.C
olu
mn
s(1
)–(4
)re
por
t2S
LS
esti
mate
sfr
omeq
uati
on(4
)w
ith
dis
tric
t-by-t
reatm
ent
inte
ract
ion
sas
the
excl
ud
edin
stru
men
tsan
dd
istr
ict
fixed
effe
cts
an
dou
tpati
ents
t−1
(in
spec
ifica
tion
s(1
)an
d(3
))as
con
trol
s.T
he
vari
able
sin
colu
mn
s(1
)–(4
)are
exp
ress
edin
stan
dard
dev
iati
onu
nit
sre
lati
ve
toth
eco
ntr
olgro
up
over
all
stan
dard
dev
iati
onfo
rea
chvari
able
.R
obu
stst
an
dard
erro
rsare
inp
are
nth
eses
.P
rogra
mim
pact
mea
sure
sth
eco
effi
cien
ton
the
ass
ign
men
tto
trea
tmen
tin
dic
ato
r.F
-tes
tst
ati
stic
s(w
ith
p-v
alu
esin
pare
nth
eses
)on
the
excl
ud
edin
stru
men
tsC
omm
un
ity
mon
itor
ing
an
dS
taff
’sk
now
led
ge
abou
tp
ati
ents
’rig
hts
are
15.9
(.00)
an
d7.2
3(.
00),
resp
ecti
vel
y.P
oin
tes
tim
ate
san
dst
an
dard
erro
rsin
colu
mn
s(5
)–(6
)an
dco
lum
ns
(7)–
(8),
resp
ecti
vel
y,are
join
tly
esti
mate
dfr
omeq
uati
on(3
).E
xp
lan
ato
ryvari
able
s:C
omm
un
ity
mon
itor
ing
isth
efi
rst
com
pon
ent
from
ap
rin
cip
al
com
pon
ents
an
aly
sis
ofth
esi
xm
onit
orin
gan
din
form
ati
onp
roxie
sp
rese
nte
din
Table
II.S
taff
’sk
now
led
ge
abou
tp
ati
ents
’rig
hts
isa
mea
sure
ofth
ein
-ch
arg
e’s
kn
owle
dge
abou
tp
ati
ents
’ri
gh
tsan
dob
ligati
ons
(see
text
for
det
ail
s).
CB
Op
rese
nce
isan
ind
icato
rvari
able
for
wh
eth
era
part
icip
ati
ng
CB
Oh
ad
bee
nop
erati
ng
inth
eco
mm
un
ity
bef
ore
the
inte
rven
tion
.F
-tes
ton
pro
gra
mim
pact
(CB
Op
rese
nce
)[P
rogra
mim
pact
×C
BO
pre
sen
ce]
isth
ete
stst
ati
stic
,w
ith
p-v
alu
esin
pare
nth
esis
,on
the
test
that
the
coef
fici
ents
onp
rogra
mim
pact
(CB
Op
rese
nce
)[P
rogra
mim
pact
×C
BO
pre
sen
ce]
are
join
tly
0in
colu
mn
s(5
)–(6
)an
d(7
)–(8
),re
spec
tivel
y.*S
ign
ifica
nt
at
10%
level
.**
Sig
nifi
can
tat
5%
level
.**
*Sig
nifi
can
tat
1%
level
.
285
764 QUARTERLY JOURNAL OF ECONOMICS
A stricter test of whether the extent of the program impactvaries with the size of the community monitoring impact is to adda treatment dummy (an overall treatment effect regardless of thecommunity monitoring impact) to the IV regressions in equation(4). The community monitoring index is then identified by cross-district variation in changes in community monitoring by treat-ment from the district-by-treatment interactions as the excludedinstruments, with the main effect for treatment no longer ex-cluded; the results are reported in columns (3) and (4) of Table VII.Comparing the results without and with controls for treatment isquite similar for both outpatients and under-5 mortality, whilethe coefficients on the treatment indicator have the wrong signand are small relative to their standard errors, providing someevidence that community monitoring had the primary effects onoutcomes as opposed to other effects induced by the intervention.
To examine the hypothesis that differences in monitoring aredriving the results as opposed to the supply-driven hypothesisthat health workers, once being informed that their effort de-viates from what is expected (in the health facility staff meet-ing), decided to exert greater effort in serving the community, weaugment specification (4) with a measure of the staff ’s knowl-edge about patients’ rights and obligations.19 This model thus hastwo endogenous variables. If large treatment effects on outcomesacross districts are associated with differences in staff knowl-edge about patients’ rights rather than more intense communitymonitoring, this would be evidence against the community-basedmonitoring hypothesis. As reported in columns (5) and (6), thecoefficients on community monitoring remain largely unaffected,and the coefficients on staff knowledge are insignificant and withthe wrong signs, providing additional evidence, albeit not conclu-sive, that the demand-driven mechanism is more important thanthe supply-driven mechanism.
The CBOs played an integral role in the intervention as fa-cilitators of the meetings. However, it is possible that these CBOshad a role (as educators or activists, for example) beyond the de-scribed treatment itself. There is no definitive way to sort out the
19. The in-charge was asked to list patients’ rights and obligations accordingto the Ministry of Health’s plan for basic health service delivery. Patients’ rightswere discussed in the interface meeting. Each correct answer (out of five) wasgiven a score of 0.2, and so this test score ranges from 0 to 1. We also examinedother measures of staff engagement, including number of staff meetings in 2005and if the in-charge had initiated training of staff on proper conduct. The resultsusing these alternative proxies mirror those reported in Table VII.
286
COMMUNITY-BASED MONITORING IN UGANDA 765
role of community-based monitoring from the possible roles of theCBOs, but because around 60 percent of the CBOs that took partin the intervention had been operating in the communities beforethe intervention, and several of them also had activities in thecontrol areas, we can investigate whether the outcomes are corre-lated with preintervention CBO activity. This would be the case ifthe CBOs that participated in the experiment, and that had beenpresent in the communities prior to intervention, had a direct im-pact on health outcomes (through various preventive activities, forexample) or indirectly by being more involved in monitoring theprovider. The number of outpatients treated per month, shown incolumn (7), and the under-5 mortality rate, shown in column (8),are not significantly different in communities where the CBOshad been active prior to the intervention. We have also exam-ined whether the treatment effect varies conditional on observ-able CBO characteristics or actions. For example, CBOs that arelocated (have an office) in the community might, everything elseequal, be in a better position to monitor the health provider. More-over, at ten of the treatment sites, the CBOs reported that theyregularly visited the clinic. If the CBOs, rather than the commu-nity, were pushing the service providers into action, presumablythe effect would be more pronounced at sites where the CBO actu-ally visited the clinic regularly. However, the treatment effects areindependent of whether the office of the CBO is located within afive-kilometer radius of the health facility or if the CBO reportedthat it regularly visited the clinic.20
Given that within each district there are both treatment andcontrol units, one concern with the evaluation design is the possi-bility of spillovers from one catchment area to another. In practice,there are reasons to believe spillovers will not be a serious con-cern. The average (and median) distance between the treatmentand control facility is thirty kilometers, and in a rural setting,it is unclear to what extent information about improvements in
20. Given the small sample size, we test whether the distribution of outcomesin the subsample {T = 1 & CBO located in community = 1} is the same as in thesubsample {T = 1 & CBO located in community = 0}, and whether the distributionof outcomes in the subsample {T = 1 & CBO regularly carries out monitoringvisits to the facility = 1} is the same as in the subsample {T = 1 & CBO regularlycarries out monitoring visits to the facility = 0}, using the Wilcoxon rank-sum test.The test statistics (with p-values in parentheses) are 0.88 (.38) and −1.10 (.27) foroutpatients and 0.31 (.76) and −0.03 (.98) for under-5 mortality rate. We get similarresults if we enrich equation (1) with an interaction term T × CBO characteristic.The estimates of the interaction term are not statistically different from 0 in anyof the specifications.
287

766 QUARTERLY JOURNAL OF ECONOMICS
treatment facilities has spread to control communities. Still, thepossibility of spillovers is a concern. Following Miguel and Kremer(2004), and taking advantage of the variation in distance to thenearest treatment clinic induced by randomization, we estimatespillovers from treatment to control groups by enriching X in equa-tion (1) to include an indicator variable for whether the controlclinic is within ten kilometers of the nearest treatment clinic. Theresults are presented in the Online Supplemental Appendix (forutilization, delivery, and child death). We do not find evidence infavor of the spillover hypothesis.
Another concern is if the district or subdistrict managementchanged its behavior or support in response to the intervention.For example, the health subdistrict or local government may haveprovided additional funding or other support to the treatmentfacilities. The results in Table A.VIII in the Online SupplementalAppendix do not provide any evidence of this being the case. Thetreatment facilities did not receive more drugs or funding from thesubdistrict or district as compared to the control facilities during2005.
Upper-level authorities could also have increased their su-pervision of treatment facilities in response to the intervention.As shown in Online Supplemental Appendix Table A.IX, however,supervision of providers by upper-level government authoritiesremained low in both the treatment and the control group. As acomplement we also assessed sanctions. Only a handful of staffwere dismissed or transferred in 2005 and there is no system-atic pattern that distinguishes treatment from control facilities.There is also no difference between treatment and control facili-ties in the number of staff that voluntarily left the facility during2005 (Table A.IX).
VI. DISCUSSION
Based on a small but rigorous empirical literature on com-munity participation and oversight, and extensive piloting in thefield, our conjecture was that lack of relevant information and fail-ure to agree on, or coordinate expectations of, what is reasonableto demand from the provider were holding back individual andgroup action to pressure and monitor the provider. We designedan intervention aimed at relaxing these constraints. Through tworounds of community meetings, local NGOs initiated a process
288

COMMUNITY-BASED MONITORING IN UGANDA 767
aimed at energizing the community and agreeing on actions toimprove service provision.
We document large increases in utilization and improvedhealth outcomes that compare favorably to some of the more suc-cessful community-based intervention trials reported in the med-ical literature. However, whereas medical field trials address thequestion of impact of a biological agent or treatment practice whenthe health workers do what they are supposed to do, we focus ona mechanism to ensure that health workers exert effort to servethe community.
The project was implemented in nine districts in Ugandawith an estimated catchment population of approximately 55,000households. In this dimension, therefore, the project has alreadyshown that it can be brought to scale. However, the literature onhow to enhance local accountability and participation is still inits infancy. And although the results in the paper suggest thatcommunity monitoring can play an important role in improvingservice delivery when traditional top-down supervision is inef-fective, there are still a number of outstanding questions. Forexample, we know little about long-term effects and cross-sectorexternalities. It may also be the case that combining bottom-upmonitoring with a reformed top-down approach could yield evenbetter results. Before scaling up, it is also important to subjectthe project to a cost-benefit analysis. This would require puttinga value on the improvements we have documented. To providea flavor of such a cost-benefit analysis, consider the findings onaverting the death of a child under five. A back-of-the-envelopecalculation suggests that the intervention, including the cost forcollecting data for the report cards (the main cost item), at $3per household in the catchment areas or $160,000 in total, onlyjudged on the cost per death averted, must be considered to befairly cost-effective. The estimated cost of averting the death ofa child under five is around $300, which should be compared tothe estimate that the average cost per child life saved throughthe combined and integrated delivery of 23 interventions shownto reduce mortality from the major causes of death in childrenyounger than 5 years is $887 (Bryce et al. 2003).
As argued in a recent Lancet article, a systematic program ofresearch to answer questions about how best to deliver health(child survival) interventions is urgently needed (Bryce et al.2003). In this paper we have focused on a mechanism that has beenhighlighted, but not examined, in the literature—a mechanism of
289
768 QUARTERLY JOURNAL OF ECONOMICS
accountability enabling (poor) people to scrutinize whether thosein authority have fulfilled their health responsibilities. Futureresearch should address long-term effects, identify which mech-anisms or combination of mechanisms that are important, andstudy the extent to which the results generalize to other socialsectors.
IGIER, BOCCONI UNIVERSITY, AND CEPRINSTITUTE FOR INTERNATIONAL ECONOMIC STUDIES, STOCKHOLM UNIVERSITY, NHH,AND CEPR
REFERENCES
Akerlof, George A., and Rachel E. Kranton, “Identity and the Economics of Orga-nizations,” Journal of Economic Perspectives, 19 (2005), 9–32.
Banerjee, Abhijit, Angus Deaton, and Esther Duflo, “Wealth, Health, and HealthService Delivery in Rural Rajasthan,” American Economic Review, 94 (2004),326–330.
Bang, Abhay T., Rani A. Bang, Sanjay B. Baitule, M. Hanimi Reddy, and MaheshD. Deshmukh, “Effect of Home-Based Neonatal Care and Management ofSepsis on Neonatal Mortality: Field Trial in Rural India,” Lancet, 354 (1999),1955–1961.
Bang, Abhay T., Rani A. Bang, O. Tale, P. Sontakke, J. Solanki, R. Wargantiwar,and P. Kelzarkar, “Reduction in Pneumonia Mortality and Total ChildhoodMortality by Means of Community-Based Intervention Trial in Gadchiroli,India,” Lancet, 336 (1990), 201–206.
Besley, Timothy, and Robin Burgess, “The Political Economy of Government Re-sponsiveness: Theory and Evidence from India,” Quarterly Journal of Eco-nomics, 177 (2002), 1415–1451.
Black, Robert E., Saul S. Morris, and Jennifer Bryce, “Where and Why Are 10Million Children Dying Every Year?” Lancet, 361 (2003), 2226–2234.
Bryce, Jennifer, Shams el Arifeen, George Pariyo, Claudio F. Lanata, DavidsonGwatkin, and Jean-Pierre Habicht, the Multi-Country Evaluation of IMCIStudy Group, “Reducing Child Mortality: Can Public Health Deliver?” Lancet,362 (2003), 159–164.
Chaudhury, Nazmul, Jeffrey Hammer, Michael Kremer, Karthik Muralidharan,and F. Halsey Rogers, “Missing in Action: Teacher and Health Worker Absencein Developing Countries,” Journal of Economic Perspectives, 20 (2006), 91–116.
Cortinovis, I., V. Vella, N. Ndiku, and S. Milani, “Weight, Height and Arm Circum-ference of Children under 5 in the District of Mbarara, South-West Uganda,”Annals of Human Biology, 24 (1997), 557–568.
Darmstadt, Gary L., Zulfiqar A. Bhutta, Simon Cousens, Taghreed Adam,Neff Walker, and Luc de Bernis, Lancet Neonatal Survival Steering Team,“Evidence-Based, Cost-Effective Interventions: How Many Newborn BabiesCan We Save?” Lancet, 365 (2005), 977–988.
Duflo, Esther, Rachel Glennerster, and Michael Kremer, “Using Randomizationin Development Economics Research: A Tool Kit,” CEPR Working Paper No.6059, 2007.
Fauveau, Vincent, M. K. Stewart, J. Chakraborty, and S. A. Khan, “Impact onMortality of a Community-Based Programme to Control Acute Lower Respi-ratory Tract Infections,” Bulletin of the World Health Organization, 70 (1992),109–116.
Ferraz, Claudio, and Frederico Finan, “Exposing Corrupt Politicians: The Effects ofBrazil’s Publicly Released Audits on Electoral Outcomes,” Quarterly Journalof Economics, 123 (2008), 703–745.
290
COMMUNITY-BASED MONITORING IN UGANDA 769
Jones, Gareth, Richard W. Steketee, Robert E. Black, Zulfiqar A. Bhutta, and SaulS. Morris, Bellagio Child Survival Study Group, “How Many Child DeathsCan We Prevent This Year?” Lancet, 362 (2003), 65–71.
Khemani, Stuti, “Can Information Campaigns Overcome Political Obstacles toServing the Poor,” World Bank Working Paper, 2006.
Kidane, Gebreyesus, and Richard H. Morrow, “ Teaching Mothers to Provide HomeTreatment of Malaria in Tigray, Ethiopia: A Randomised Trial,” Lancet, 356(2000), 550–555.
Kling, Jeffrey R., Jeffrey B. Liebman, and Lawrence F. Katz, “Experimental Anal-ysis of Neighborhood Effects,” Econometrica, 75 (2007), 83–119.
Kling, Jeffrey R., Jeffrey B. Liebman, Lawrence F. Katz, and Lisa Sanbonmatsu,“Moving to Opportunity and Tranquility: Neighborhood Effects on Adult Eco-nomic Self-Sufficiency and Health from a Randomized Housing Voucher Ex-periment,” Princeton University Working Paper No. 5, 2004.
Manandhar, Dharma S., David Osrin, Bhim Prasad Shrestha, Natasha Mesko,Joanna Morrison, Kirti Man Tumbahangphe, Suresh Tamang, Sushma Thapa,Dej Shrestha, and Bidur Thapa, “Effect of a Participatory Intervention withWomen’s Groups on Birth Outcomes in Nepal: Cluster-Randomised ControlledTrial,” Lancet, 364 (2004), 970–979.
McPake, Barbara, Delius Asiimwe, Francis Mwesigye, Mathias Ofumbi, LisbethOrtenblad, Pieter Streefland, and Asaph Turinde, “The Economic Behaviorof Health Workers in Uganda: Implications for Quality and Accessibility ofPublic Health Services,” Social Science and Medicine, 49 (1999), 849–865.
Miguel, Edward, and Michael Kremer, “Worms: Identifying Impacts on Educationand Health in the Presence of Treatment Externalities,” Econometrica, 72(2004), 159–217.
Mtango, F. D., and D. Neuvians, “Acute Respiratory Infections in Children underFive Years. Control Project in Bagamoyo District, Tanzania,” Transactions ofthe Royal Society of Tropical Medicine and Hygiene, 80 (1986), 851–858.
Olken, Benjamin A., “Monitoring Corruption: Evidence from a Field Experimentin Indonesia,” Journal of Political Economy, 115 (2007), 200–249.
Rahman, Makhlisur, Lincoln C. Chen, J. Chakraborty, Md. Yunus, A. I. Chowdhury,A. M. Sarder, Shushum Bhatia, and George T. Curlin, “Use of Tetanus Toxoidfor the Prevention of Neonatal Tetanus. 1. Reduction of Neonatal Mortality byImmunization of Non-pregnant and Pregnant Women in Rural Bangladesh,”Bulletin of the World Health Organization, 60 (1982), 261–267.
Rahmathullah, Lakshmi, James M. Tielsch, R. D. Thulasiraj, Joanne Katz, Chris-tian Coles, Sheela Devi, Rajeesh John, Karthik Prakash, A. V. Sadanand, N.Edwin, and C. Kamaraj, “Impact of Supplementing Newborn Infants with Vi-tamin A on Early Infant Mortality: Community-Based Randomised Trial inSouthern India,” British Medical Journal, 327 (2003), 254.
Reinikka, Ritva, and Jakob Svensson, “Local Capture: Evidence from a CentralGovernment Transfer Program in Uganda,” Quarterly Journal of Economics,119 (2004), 679–705.
Republic of Uganda, National Health Policy and Health Sector Strategic Plan2000/01-2004/05 (Kampala: Ministry of Health, 2000).
Sazawal, Sunil, and Robert E. Black, Pneumonia Case Management Trials Group,“Effect of Pneumonia Case Management on Mortality in Neonates, Infants,and Preschool Children: A Meta-analysis of Community-Based Trials,” LancetInfectious Diseases, 3 (2003), 547–556.
Stromberg, David, “Radio’s Impact on Public Spending,” Quarterly Journal of Eco-nomics, 119 (2004), 189–221.
UNICEF (United Nations Children’s Fund), The State of the World’s Children2007: Women and Children—The Double Dividend of Gender Equality (NewYork: UNICEF, 2006).
World Bank, World Development Report 2004: Making Service Work for the PoorPeople (Washington, DC: World Bank and Oxford University Press, 2003).
291
Social Science & Medicine 65 (2007) 2070–2080
Going to scale with community-based primary care:
An analysis of the family health program and infant mortality
in Brazil, 1999–2004
James Macinkoa,�, Maria de Fatima Marinho de Souzab,Frederico C. Guanaisc, Celso Cardoso da Silva Simoesd
aUniversity of Pennsylvania, RWJF Health and Society Scholars program, 3641 Locust Walk, Philadelphia, PA 19104, USAbSecretariat of Health Surveillance, Ministry of Health, Brasılia, Brazil
cMinistry of Social Development and the Fight against Hunger, Brasılia, BrazildInstitute of Geography and Statistics (IBGE), Rio de Janeiro, Brazil
Available online 8 August 2007
Abstract
This article assesses the effects of an integrated community-based primary care program (Brazil’s Family Health
Program, known as the PSF) on microregional variations in infant mortality (IMR), neonatal mortality, and post-neonatal
mortality rates from 1999 to 2004. The study utilized a pooled cross-sectional ecological analysis using panel data from
Brazilian microregions, and controlled for measures of physicians and hospital beds per 1000 population, Hepatitis B
coverage, the proportion of women without prenatal care and with no formal education, low birth weight births,
population size, and poverty rates. The data covered all the 557 Brazilian microregions over a 6-year period (1999–2004).
Results show that IMR declined about 13 percent from 1999 to 2004, while Family Health Program coverage increased
from an average of about 14 to nearly 60 percent. Controlling for other health determinants, a 10 percent increase in
Family Health Program coverage was associated with a 0.45 percent decrease in IMR, a 0.6 percent decline in post-
neonatal mortality, and a 1 percent decline in diarrhea mortality (po0.05). PSF program coverage was not associated with
neonatal mortality rates. Lessons learned from the Brazilian experience may be helpful as other countries consider
adopting community-based primary care approaches.
r 2007 Elsevier Ltd. All rights reserved.
Keywords: Primary health care; Family health program; Brazil; Health services evaluation; Infant mortality
Introduction
There is renewed worldwide interest in primary
health care and its potential for improving human
health (Pan American Health Organization, 2007).
But there have been few peer-reviewed studies that
assess the effectiveness of national primary health
care strategies on improving population health in
the developing world. This study attempts to fill this
gap by analyzing the effects of the Brazilian Family
Health Program (Programa Saude da Famılia or
PSF in Portuguese) on child health. Child health
outcomes are particularly important to examine
because of the higher-than-expected rates of infant
ARTICLE IN PRESS
www.elsevier.com/locate/socscimed
0277-9536/$ - see front matter r 2007 Elsevier Ltd. All rights reserved.
doi:10.1016/j.socscimed.2007.06.028
�Corresponding author. Tel.: +1 2129985592.
E-mail addresses: [email protected] (J. Macinko),
[email protected] (M. de Fatima Marinho de Souza).
292
and child mortality in Brazil as compared to other
countries of similar gross national income, the
PSF’s emphasis on improving infant and child
health, and the possibility of observing rapid
changes in these outcomes over a relatively short
period of time.
The PSF is the main approach to provide primary
care services within Brazil’s national health system,
known as the Sistema Unica de Saude or SUS
(Almeida & Pego, 2002). The PSF has its roots in
the community health agents program begun in the
state of Ceara in the early 1990s (Cufino Svitone,
Garfield, Vasconcelos, & Araujo Craveiro, 2000).
Since it was adopted as a national strategy in 1994,
the program had grown by 2007 to encompass
26,730 community-based teams responsible for
providing care to about 85 million people, making
it one of the world’s largest systems of community-
based primary care (Brazilian Ministry of Health
Department of Primary Care, 2007).
The PSF is a decentralized approach to providing
core primary care functions, including first-contact
access for each new health need, comprehensive and
person-focused care over the lifecourse, coordina-
tion of care between different providers and types of
health services, and family and community-oriented
health promotion activities (Ministry of Health of
Brazil, 2003). These functions are achieved through
the program’s organization (municipalities manage
the program with national supervision and each
PSF team is assigned to a geographical area with
responsibility for enrolling and monitoring the
health status of about 3500 people), its financing
(services are delivered free of charge, are financed
on a capitation basis, and municipalities have
incentives for increasing the number of neighbor-
hoods with access to the program), and delivery
mechanisms (multidisciplinary teams are composed
of, at minimum, a physician and nurse who deliver
clinic-based care and most teams include commu-
nity health workers who make regular home visits
and perform community-based health promotion
activities) (Ministry of Health of Brazil, 2003).
Family Health Program teams in many areas also
include dental and social work professionals.
Despite the ambitious scope of this undertaking
there have been only a few evaluations of the
program (Conill, 2002; Escorel et al., 2002; Minis-
terio da Saude, 2004; Serra, 2005; Viana &
Pierantoni, 2002) although several more are under-
way. To date, only one peer-reviewed article has
assessed the relationship between PSF coverage and
changes in health outcomes at the national level
(Macinko, Guanais, & Marinho de Souza, 2006).
The present article expands and strengthens earlier
work by employing local-level analyses, examining
several different outcomes, and by assessing the
effects of the rapid expansions in PSF coverage over
the past few years.
Methods
This study follows a quasi-experimental design
since each municipality in Brazil adopted the PSF at
different times and coverage in each municipality
grew at different rates. To take advantage of this
heterogeneity, we use a pooled, cross-sectional, time
series approach to assess the relationships between
dependent and independent variables over a 6-year
period. This technique pools together 6 years
(1999–2004) of cross-sections (composed of all 557
Brazilian microregions for each year) for a max-
imum sample size of 3342 observations. The
approach provides an estimate of the health effects
of program expansion by testing the association
between differences in coverage in each microregion
with differences in infant mortality outcomes, while
controlling for potential confounders (Hsiao, 2003).
In order to strengthen the study design, we
analyze two types of outcomes. Based on previous
literature, we hypothesize that the PSF will have a
strong association with outcomes most sensitive to
primary care: post-neonatal mortality (deaths of
children from 30 days to 1 year per 1000 live births)
and deaths from diarrheal diseases (deaths of
children under 1 year from diarrhea per 1000 live
births) (Caldeira, Franc-a, & Goulart, 2001; Cal-
deira, Franc-a, Perpetuo, & Goulart, 2005). It
should have a modest impact on IMR (all deaths
of children under 1 year per 1000 live births in the
same year) that will depend on the proportion of
IMR that is composed of post-neonatal mortality
(Moore, Castillo, Richardson, & Reid, 2003). We
hypothesize that there should be little or no relation
between PSF coverage and neonatal mortality rates
(deaths of children within their first month of life
per 1000 live births), since these outcomes are most
sensitive to care provided primarily by specialist and
hospital services outside the scope of the PSF
(Lansky, Franc-a, & Leal Mdo, 2002).
The unit of analysis is the microregion. Each of
the 557 microregions contains several of Brazil’s
5564 municipalities that have been grouped together
to be geographically contiguous and homogeneous
ARTICLE IN PRESS
J. Macinko et al. / Social Science & Medicine 65 (2007) 2070–2080 2071
293
in terms of demography, agriculture, and transpor-
tation. Microregions represent smaller units of
analysis and thus capture greater variation than
would analysis of the 27 Brazilian states. Micro-
regions also have a larger population size than
individual municipalities, thus allowing for more
stable mortality estimates over time.
Data on PSF coverage, health resources, and
outcomes are from the Brazilian Ministry of Health
(Ministry of Health of Brazil, 2007). In this study,
we use official estimates of IMR that have been
adjusted for underreporting of child deaths (Rede
Interagencial de informac- oes para a saude (RIPSA),
2002; Szwarcwald, Leal Medo, de Andrade, &
Souza, 2002). All other outcomes (neonatal, post-
neonatal, and diarrhea mortality rates) are con-
structed directly from observed counts.
Independent variables known to influence infant
mortality include poverty (proportion of the popu-
lation in the lowest income quintile), women’s
health and development (proportion of women over
15 with no formal schooling, and proportion of
women with no prenatal care), child health (propor-
tion of children with Hepatitis B immunizations,
low birth weight defined as percent of births under
2500 g), and health services (physicians and hospital
beds per 1000) (Moore et al., 2003; Wang, 2003).
Data on these variables are based on population
surveys conducted by the Brazilian Institute of
Geography and Statistics (IGBE) and developed for
state-level representativity by the Institute of
Applied Economic Research (IPEA) (Brazilian
Institute of Geography and Statistics, 2005; Insti-
tuto de Pesquisa Economica Aplicada (IPEA), May
2005).
Some independent variable data were missing for
some years. Missing data were imputed using non-
linear interpolation methods that modeled within-
municipal changes as a function of prior values at the
municipal level and contemporaneous values at the
state level (Allison, 2002; Guanais, 2006). All values
were then summed up to the microregional level.
Statistical analyses
The study uses a fixed-effects specification in
order to correct for serial correlation of repeated
measures and to control for time-invariant unob-
served or unobservable microregional characteris-
tics. An alternative approach, the random effects
model, was rejected due to results of the Hausman
test (po.0001) that tested correlation between the
regressors and error terms. (Wooldridge, 2002) All
analyses were conducted using Stata 9 software and
use robust standard errors to correct for hetero-
skedasticity (Statacorp, 2005).
Advantages of the fixed-effects model over cross-
sectional analyses include the fact that it is able
establish temporal ordering between exposures and
outcomes and it can control for unmeasured time-
invariant characteristics of the microregion (such as
geography, historical disadvantages, urban/rural
location, and local cultural practices) that might
influence health outcomes (Hsiao, 2003). One
disadvantage of the fixed-effects approach is that
the results obtained are conditional on the data used
to estimate them; that is, results cannot be general-
ized to other years or microregions not included in
the study (Hsiao, 2003).
In order to compare how variables changed over
time, we calculate the mean values and standard
deviations for 1999 and 2004 and the percent change
during this time. Differences in mean values
between time periods were assessed using t-tests.
Regression analyses are presented as a series of
nested models. The F-test is used to assess whether
the inclusion of an additional set of independent
variables improved regression models. In order to
compare the magnitude of the effects of the main
explanatory variables on the outcomes, we calcu-
lated their marginal effects. This statistic represents
the percent change in the outcome given a one-
percent change in the independent variable, when all
other values are set at their mean (Greene, 2003).
We also assessed several pathways by which the
PSF might influence IMR. Primary care access is
associated with lower post-neonatal mortality and
fewer deaths from diarrhea (UNICEF, 2002). In
order to test potential mechanisms of the health
effects of PSF expansion we developed a set of
dummy variables representing microregions in the
highest 75th percentile of under-five deaths from
both of these conditions (called ‘‘high diarrhea
deaths’’ and ‘‘high postneonatal deaths,’’ respec-
tively). We then created interaction terms between
these binary variables and PSF coverage to test if
the PSF effect was higher in those microregions
where a greater share of infant and child mortality
was amenable to primary care. Other interactions of
the PSF term (with physicians per 1000 population
and Hepatitis B coverage) were not significant and
therefore not included in the final models.
Because there are great differences in health and
economic development between the poorer north
ARTICLE IN PRESS
J. Macinko et al. / Social Science & Medicine 65 (2007) 2070–20802072
294
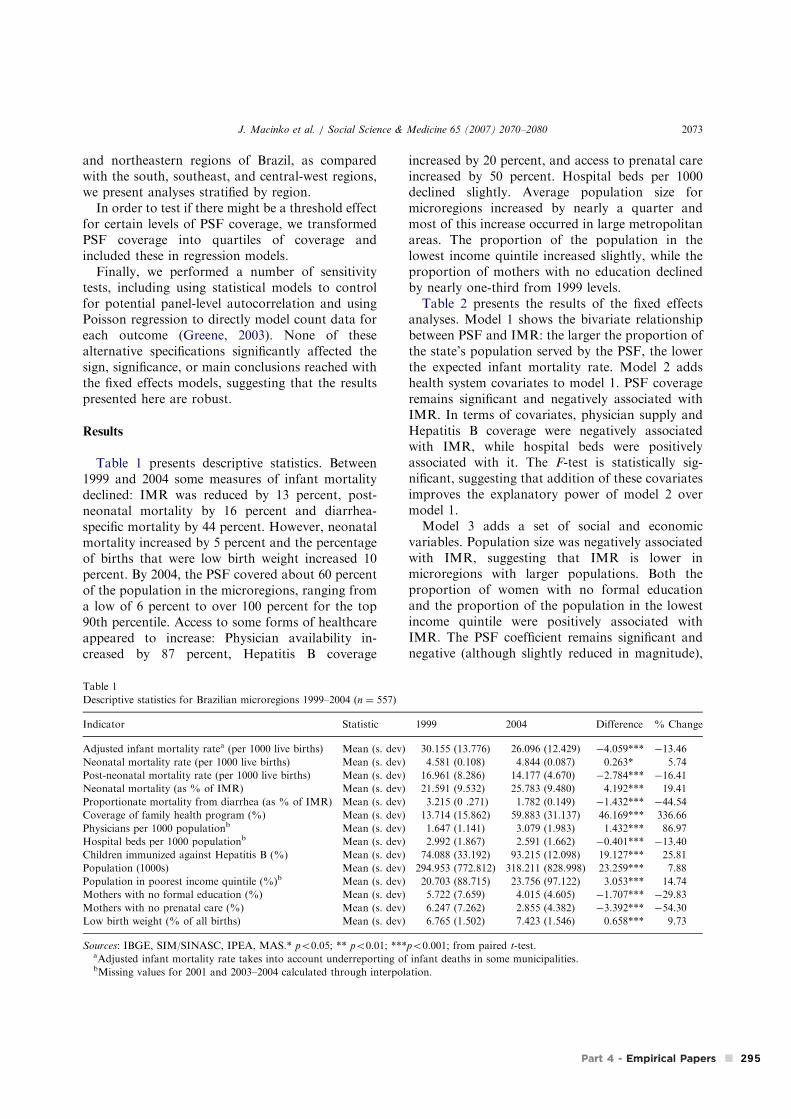
and northeastern regions of Brazil, as compared
with the south, southeast, and central-west regions,
we present analyses stratified by region.
In order to test if there might be a threshold effect
for certain levels of PSF coverage, we transformed
PSF coverage into quartiles of coverage and
included these in regression models.
Finally, we performed a number of sensitivity
tests, including using statistical models to control
for potential panel-level autocorrelation and using
Poisson regression to directly model count data for
each outcome (Greene, 2003). None of these
alternative specifications significantly affected the
sign, significance, or main conclusions reached with
the fixed effects models, suggesting that the results
presented here are robust.
Results
Table 1 presents descriptive statistics. Between
1999 and 2004 some measures of infant mortality
declined: IMR was reduced by 13 percent, post-
neonatal mortality by 16 percent and diarrhea-
specific mortality by 44 percent. However, neonatal
mortality increased by 5 percent and the percentage
of births that were low birth weight increased 10
percent. By 2004, the PSF covered about 60 percent
of the population in the microregions, ranging from
a low of 6 percent to over 100 percent for the top
90th percentile. Access to some forms of healthcare
appeared to increase: Physician availability in-
creased by 87 percent, Hepatitis B coverage
increased by 20 percent, and access to prenatal care
increased by 50 percent. Hospital beds per 1000
declined slightly. Average population size for
microregions increased by nearly a quarter and
most of this increase occurred in large metropolitan
areas. The proportion of the population in the
lowest income quintile increased slightly, while the
proportion of mothers with no education declined
by nearly one-third from 1999 levels.
Table 2 presents the results of the fixed effects
analyses. Model 1 shows the bivariate relationship
between PSF and IMR: the larger the proportion of
the state’s population served by the PSF, the lower
the expected infant mortality rate. Model 2 adds
health system covariates to model 1. PSF coverage
remains significant and negatively associated with
IMR. In terms of covariates, physician supply and
Hepatitis B coverage were negatively associated
with IMR, while hospital beds were positively
associated with it. The F-test is statistically sig-
nificant, suggesting that addition of these covariates
improves the explanatory power of model 2 over
model 1.
Model 3 adds a set of social and economic
variables. Population size was negatively associated
with IMR, suggesting that IMR is lower in
microregions with larger populations. Both the
proportion of women with no formal education
and the proportion of the population in the lowest
income quintile were positively associated with
IMR. The PSF coefficient remains significant and
negative (although slightly reduced in magnitude),
ARTICLE IN PRESS
Table 1
Descriptive statistics for Brazilian microregions 1999–2004 (n ¼ 557)
Indicator Statistic 1999 2004 Difference % Change
Adjusted infant mortality ratea (per 1000 live births) Mean (s. dev) 30.155 (13.776) 26.096 (12.429) ÿ4.059*** ÿ13.46
Neonatal mortality rate (per 1000 live births) Mean (s. dev) 4.581 (0.108) 4.844 (0.087) 0.263* 5.74
Post-neonatal mortality rate (per 1000 live births) Mean (s. dev) 16.961 (8.286) 14.177 (4.670) ÿ2.784*** ÿ16.41
Neonatal mortality (as % of IMR) Mean (s. dev) 21.591 (9.532) 25.783 (9.480) 4.192*** 19.41
Proportionate mortality from diarrhea (as % of IMR) Mean (s. dev) 3.215 (0 .271) 1.782 (0.149) ÿ1.432*** ÿ44.54
Coverage of family health program (%) Mean (s. dev) 13.714 (15.862) 59.883 (31.137) 46.169*** 336.66
Physicians per 1000 populationb Mean (s. dev) 1.647 (1.141) 3.079 (1.983) 1.432*** 86.97
Hospital beds per 1000 populationb Mean (s. dev) 2.992 (1.867) 2.591 (1.662) ÿ0.401*** ÿ13.40
Children immunized against Hepatitis B (%) Mean (s. dev) 74.088 (33.192) 93.215 (12.098) 19.127*** 25.81
Population (1000s) Mean (s. dev) 294.953 (772.812) 318.211 (828.998) 23.259*** 7.88
Population in poorest income quintile (%)b Mean (s. dev) 20.703 (88.715) 23.756 (97.122) 3.053*** 14.74
Mothers with no formal education (%) Mean (s. dev) 5.722 (7.659) 4.015 (4.605) ÿ1.707*** ÿ29.83
Mothers with no prenatal care (%) Mean (s. dev) 6.247 (7.262) 2.855 (4.382) ÿ3.392*** ÿ54.30
Low birth weight (% of all births) Mean (s. dev) 6.765 (1.502) 7.423 (1.546) 0.658*** 9.73
Sources: IBGE, SIM/SINASC, IPEA, MAS.* po0.05; ** po0.01; ***po0.001; from paired t-test.aAdjusted infant mortality rate takes into account underreporting of infant deaths in some municipalities.bMissing values for 2001 and 2003–2004 calculated through interpolation.
J. Macinko et al. / Social Science & Medicine 65 (2007) 2070–2080 2073
295
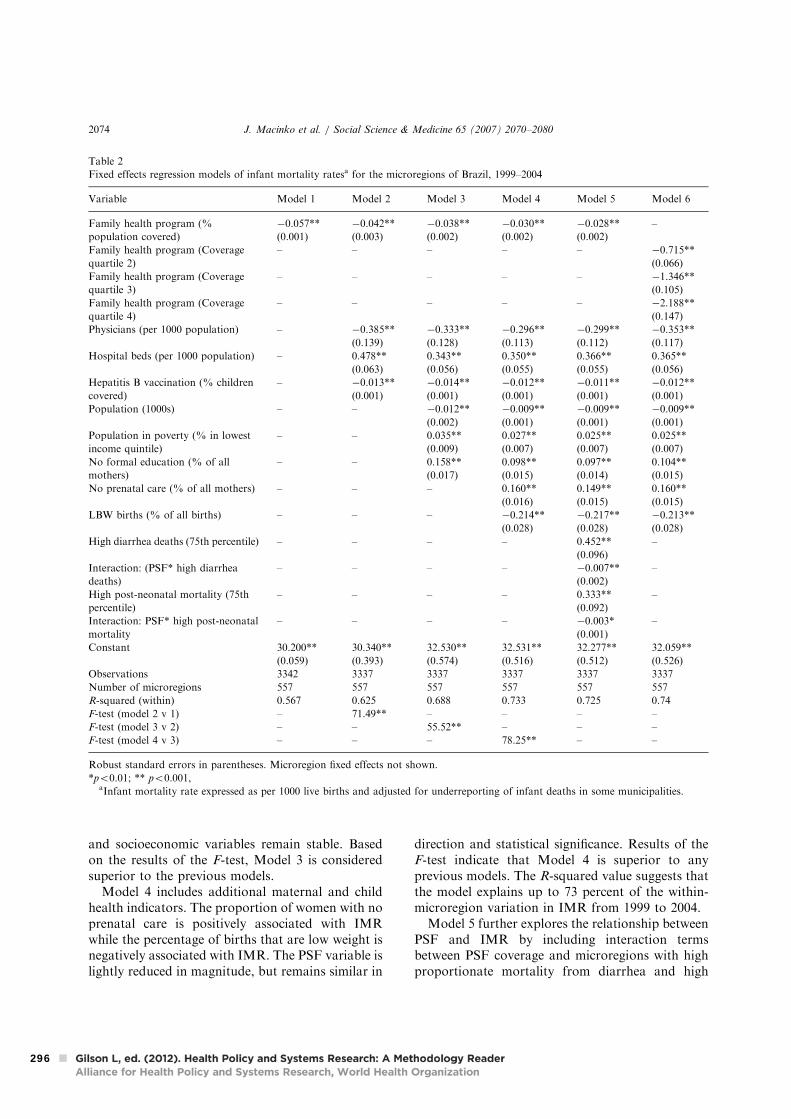
and socioeconomic variables remain stable. Based
on the results of the F-test, Model 3 is considered
superior to the previous models.
Model 4 includes additional maternal and child
health indicators. The proportion of women with no
prenatal care is positively associated with IMR
while the percentage of births that are low weight is
negatively associated with IMR. The PSF variable is
lightly reduced in magnitude, but remains similar in
direction and statistical significance. Results of the
F-test indicate that Model 4 is superior to any
previous models. The R-squared value suggests that
the model explains up to 73 percent of the within-
microregion variation in IMR from 1999 to 2004.
Model 5 further explores the relationship between
PSF and IMR by including interaction terms
between PSF coverage and microregions with high
proportionate mortality from diarrhea and high
ARTICLE IN PRESS
Table 2
Fixed effects regression models of infant mortality ratesa for the microregions of Brazil, 1999–2004
Variable Model 1 Model 2 Model 3 Model 4 Model 5 Model 6
Family health program (%
population covered)
ÿ0.057**
(0.001)
ÿ0.042**
(0.003)
ÿ0.038**
(0.002)
ÿ0.030**
(0.002)
ÿ0.028**
(0.002)
–
Family health program (Coverage
quartile 2)
– – – – – ÿ0.715**
(0.066)
Family health program (Coverage
quartile 3)
– – – – – ÿ1.346**
(0.105)
Family health program (Coverage
quartile 4)
– – – – – ÿ2.188**
(0.147)
Physicians (per 1000 population) – ÿ0.385**
(0.139)
ÿ0.333**
(0.128)
ÿ0.296**
(0.113)
ÿ0.299**
(0.112)
ÿ0.353**
(0.117)
Hospital beds (per 1000 population) – 0.478**
(0.063)
0.343**
(0.056)
0.350**
(0.055)
0.366**
(0.055)
0.365**
(0.056)
Hepatitis B vaccination (% children
covered)
– ÿ0.013**
(0.001)
ÿ0.014**
(0.001)
ÿ0.012**
(0.001)
ÿ0.011**
(0.001)
ÿ0.012**
(0.001)
Population (1000s) – – ÿ0.012**
(0.002)
ÿ0.009**
(0.001)
ÿ0.009**
(0.001)
ÿ0.009**
(0.001)
Population in poverty (% in lowest
income quintile)
– – 0.035**
(0.009)
0.027**
(0.007)
0.025**
(0.007)
0.025**
(0.007)
No formal education (% of all
mothers)
– – 0.158**
(0.017)
0.098**
(0.015)
0.097**
(0.014)
0.104**
(0.015)
No prenatal care (% of all mothers) – – – 0.160**
(0.016)
0.149**
(0.015)
0.160**
(0.015)
LBW births (% of all births) – – – ÿ0.214**
(0.028)
ÿ0.217**
(0.028)
ÿ0.213**
(0.028)
High diarrhea deaths (75th percentile) – – – – 0.452**
(0.096)
–
Interaction: (PSF* high diarrhea
deaths)
– – – – ÿ0.007**
(0.002)
–
High post-neonatal mortality (75th
percentile)
– – – – 0.333**
(0.092)
–
Interaction: PSF* high post-neonatal
mortality
– – – – ÿ0.003*
(0.001)
–
Constant 30.200**
(0.059)
30.340**
(0.393)
32.530**
(0.574)
32.531**
(0.516)
32.277**
(0.512)
32.059**
(0.526)
Observations 3342 3337 3337 3337 3337 3337
Number of microregions 557 557 557 557 557 557
R-squared (within) 0.567 0.625 0.688 0.733 0.725 0.74
F-test (model 2 v 1) – 71.49** – – – –
F-test (model 3 v 2) – – 55.52** – – –
F-test (model 4 v 3) – – – 78.25** – –
Robust standard errors in parentheses. Microregion fixed effects not shown.
*po0.01; ** po0.001,aInfant mortality rate expressed as per 1000 live births and adjusted for underreporting of infant deaths in some municipalities.
J. Macinko et al. / Social Science & Medicine 65 (2007) 2070–20802074
296
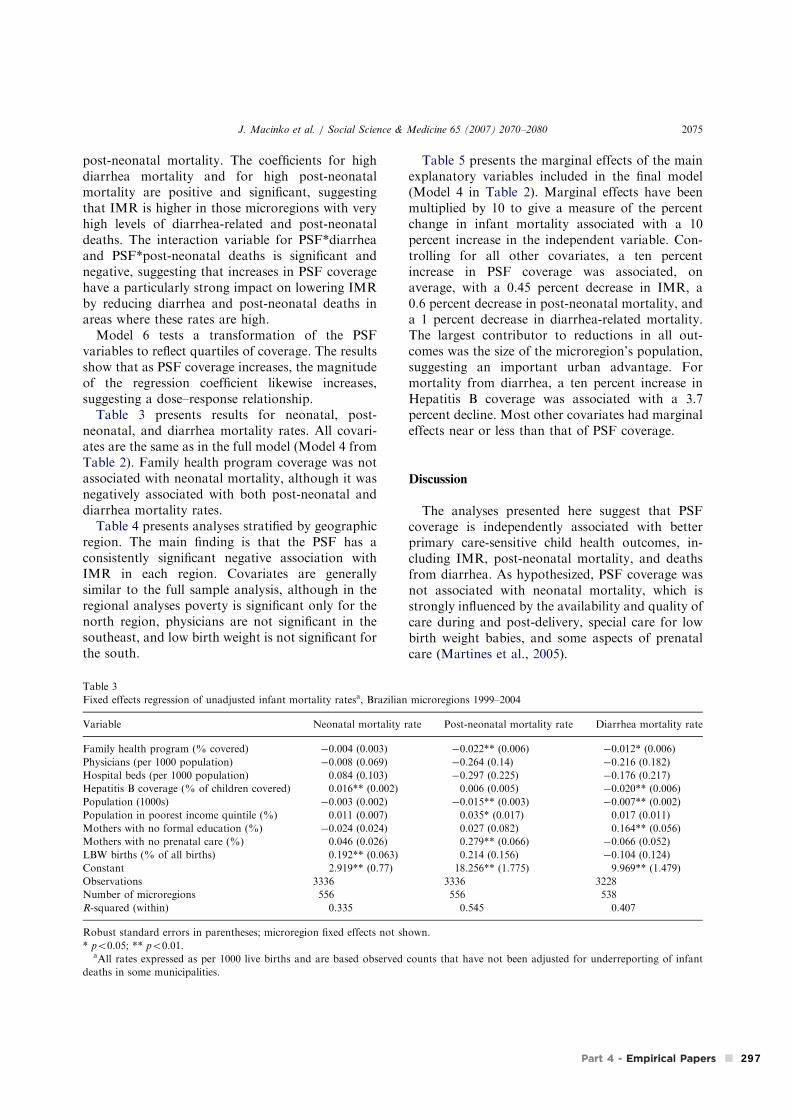
post-neonatal mortality. The coefficients for high
diarrhea mortality and for high post-neonatal
mortality are positive and significant, suggesting
that IMR is higher in those microregions with very
high levels of diarrhea-related and post-neonatal
deaths. The interaction variable for PSF*diarrhea
and PSF*post-neonatal deaths is significant and
negative, suggesting that increases in PSF coverage
have a particularly strong impact on lowering IMR
by reducing diarrhea and post-neonatal deaths in
areas where these rates are high.
Model 6 tests a transformation of the PSF
variables to reflect quartiles of coverage. The results
show that as PSF coverage increases, the magnitude
of the regression coefficient likewise increases,
suggesting a dose–response relationship.
Table 3 presents results for neonatal, post-
neonatal, and diarrhea mortality rates. All covari-
ates are the same as in the full model (Model 4 from
Table 2). Family health program coverage was not
associated with neonatal mortality, although it was
negatively associated with both post-neonatal and
diarrhea mortality rates.
Table 4 presents analyses stratified by geographic
region. The main finding is that the PSF has a
consistently significant negative association with
IMR in each region. Covariates are generally
similar to the full sample analysis, although in the
regional analyses poverty is significant only for the
north region, physicians are not significant in the
southeast, and low birth weight is not significant for
the south.
Table 5 presents the marginal effects of the main
explanatory variables included in the final model
(Model 4 in Table 2). Marginal effects have been
multiplied by 10 to give a measure of the percent
change in infant mortality associated with a 10
percent increase in the independent variable. Con-
trolling for all other covariates, a ten percent
increase in PSF coverage was associated, on
average, with a 0.45 percent decrease in IMR, a
0.6 percent decrease in post-neonatal mortality, and
a 1 percent decrease in diarrhea-related mortality.
The largest contributor to reductions in all out-
comes was the size of the microregion’s population,
suggesting an important urban advantage. For
mortality from diarrhea, a ten percent increase in
Hepatitis B coverage was associated with a 3.7
percent decline. Most other covariates had marginal
effects near or less than that of PSF coverage.
Discussion
The analyses presented here suggest that PSF
coverage is independently associated with better
primary care-sensitive child health outcomes, in-
cluding IMR, post-neonatal mortality, and deaths
from diarrhea. As hypothesized, PSF coverage was
not associated with neonatal mortality, which is
strongly influenced by the availability and quality of
care during and post-delivery, special care for low
birth weight babies, and some aspects of prenatal
care (Martines et al., 2005).
ARTICLE IN PRESS
Table 3
Fixed effects regression of unadjusted infant mortality ratesa, Brazilian microregions 1999–2004
Variable Neonatal mortality rate Post-neonatal mortality rate Diarrhea mortality rate
Family health program (% covered) ÿ0.004 (0.003) ÿ0.022** (0.006) ÿ0.012* (0.006)
Physicians (per 1000 population) ÿ0.008 (0.069) ÿ0.264 (0.14) ÿ0.216 (0.182)
Hospital beds (per 1000 population) 0.084 (0.103) ÿ0.297 (0.225) ÿ0.176 (0.217)
Hepatitis B coverage (% of children covered) 0.016** (0.002) 0.006 (0.005) ÿ0.020** (0.006)
Population (1000s) ÿ0.003 (0.002) ÿ0.015** (0.003) ÿ0.007** (0.002)
Population in poorest income quintile (%) 0.011 (0.007) 0.035* (0.017) 0.017 (0.011)
Mothers with no formal education (%) ÿ0.024 (0.024) 0.027 (0.082) 0.164** (0.056)
Mothers with no prenatal care (%) 0.046 (0.026) 0.279** (0.066) ÿ0.066 (0.052)
LBW births (% of all births) 0.192** (0.063) 0.214 (0.156) ÿ0.104 (0.124)
Constant 2.919** (0.77) 18.256** (1.775) 9.969** (1.479)
Observations 3336 3336 3228
Number of microregions 556 556 538
R-squared (within) 0.335 0.545 0.407
Robust standard errors in parentheses; microregion fixed effects not shown.
* po0.05; ** po0.01.aAll rates expressed as per 1000 live births and are based observed counts that have not been adjusted for underreporting of infant
deaths in some municipalities.
J. Macinko et al. / Social Science & Medicine 65 (2007) 2070–2080 2075
297

Our results are consistent with evidence of
potential mechanisms through which the PSF might
work to lower primary care-sensitive infant mortal-
ity. For example, higher PSF coverage has been
found to be associated with higher population rates
of breastfeeding, oral rehydration therapy, immu-
nizations, and treatment of respiratory and other
infections—interventions that address the leading
ARTICLE IN PRESS
Table 4
Determinants of infant mortality rate by region, 1999–2004
Variable North Northeast Southeast South Central-west
Coverage of family health program (%) ÿ0.037** (0.006) ÿ0.023** (0.003) ÿ0.038** (0.003) ÿ0.014** (0.002) ÿ0.013** (0.002)
Physicians (per 1000 population) ÿ1.401** (0.232) ÿ1.140** (0.111) ÿ0.048 (0.055) ÿ0.603** (0.065) ÿ0.853** (0.091)
Hospital beds (per 1000 population) 0.338** (0.113) 0.222* (0.09) 0.371** (0.07) 0.433** (0.124) 0.255** (0.059)
Hepatitis B immunization (% of children
covered)
ÿ0.016** (0.003) ÿ0.011** (0.002) ÿ0.006* (0.002) 0.003* (0.001) ÿ0.007* (0.003)
Population (1000s) ÿ0.006* (0.003) ÿ0.010** (0.003) ÿ0.005** (0.001) ÿ0.004 (0.004) ÿ0.011** (0.001)
Population in poorest income quintile (%) 0.046* (0.022) ÿ0.01 (0.036) 0.017 (0.009) ÿ0.01 (0.017) ÿ0.005 (0.005)
Mothers with no formal education (%) 0.060** (0.02) 0.147** (0.025) 0.062* (0.03) 0.071* (0.03) 0.088** (0.026)
Mothers with no prenatal care (%) 0.065** (0.023) 0.106** (0.021) 0.329** (0.04) 0.243** (0.048) 0.125** (0.043)
LBW births (% of all births) ÿ0.106* (0.052) ÿ0.194** (0.055) ÿ0.212** (0.033) ÿ0.066 (0.035) ÿ0.107** (0.029)
Constant 31.888** (0.670) 47.913** (0.845) 22.874** (0.614) 19.754** (1.098) 26.871** (0.544)
Observations 378 1122 957 564 312
Number of microregions 63 187 160 94 52
R-squared (within) 0.76 0.84 0.74 0.76 0.90
Mean values for selected variables
(1999– 2004)
Infant mortality rate (IMR) 27.12 42.37 19.18 17.81 21.47
PSF coverage (%) 30.82 53.73 32.30 34.44 47.44
Physicians 1.22 1.83 3.34 2.67 2.16
Hospital beds 2.00 2.15 3.29 3.17 3.56
Hepatitis B coverage 80.69 85.49 96.98 97.02 92.41
Mothers with no prenatal care 7.48 10.24 1.97 1.77 2.34
Robust standard errors in parentheses; microregion fixed effects not shown.
* po0.05; ** po0.01.
Infant mortality rate expressed as per 1000 live births and adjusted for underreporting of infant deaths in some municipalities.
Table 5
Marginal effectsa by outcome, Brazilian microregions 1999–2004
Variable Infant mortality rate Post-neonatal mortality rateb Diarrhea mortalityb
Coverage of family health program ÿ0.447** (ÿ0.506, ÿ0.387) ÿ0.591** (ÿ0.909, ÿ0.273) ÿ1.034* (ÿ2.030, ÿ0.037)
Physicians per 1000 population ÿ0.251** (ÿ0.439, ÿ0.064) ÿ0.401* (ÿ0.816, 0.015) ÿ1.088 (ÿ2.880, 0.704)
Hospital beds per 1000 population 0.348** (0.242, 0.455) ÿ0.526 (ÿ1.310, 0.257) ÿ1.038 (ÿ3.536, 1.459)
Hepatitis B coverage (%) ÿ0.376** (ÿ0.452, ÿ0.300) 0.359 (ÿ0.252, 0.971) ÿ3.770** (ÿ5.951, ÿ1.589)
Population (1000s) ÿ1.048** (ÿ1.340, ÿ0.755) ÿ2.873** (ÿ4.154, ÿ1.593) ÿ4.715** (ÿ7.439, ÿ1.991)
Population in poorest income quintile (%) 0.213** (0.102, 0.323) 0.497* (0.035, 0.958) 0.801 (ÿ0.229, 1.831)
Mothers with no formal education (%) 0.190** (0.134, 0.245) 0.093 (ÿ0.459, 0.644) 1.879** (ÿ0.628, 3.130)
Mothers with no prenatal care (%) 0.252** (0.204, 0.300) 0.784** (0.420, 1.147) ÿ0.619 (ÿ1.570, 0.332)
LBW births (% of all births) ÿ0.546** (ÿ0.686, ÿ0.406) 0.973 (ÿ0.414, 2.360) ÿ1.572 (ÿ5.245, 2.101)
Robust 95% confidence intervals in parentheses; microregion fixed effects not shown.
* po0.05; ** po0.01.aMarginal effects represent percent change in the outcome associated with a 10 percent change in the independent variable. All marginal
effects were calculated in terms of elasticities evaluated at the means of all other independent variables.bRates expressed as per 1000 live births and are based on observed counts that have not been adjusted for underreporting of infant
deaths in some municipalities.
J. Macinko et al. / Social Science & Medicine 65 (2007) 2070–20802076
298
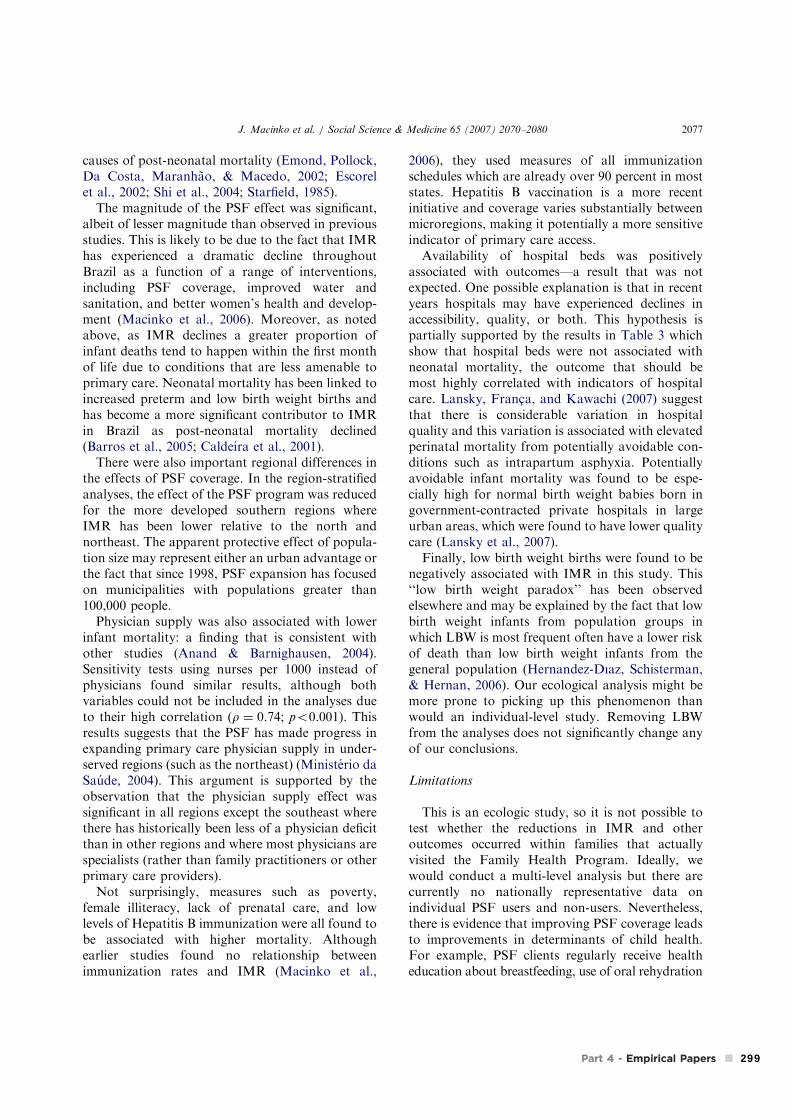
causes of post-neonatal mortality (Emond, Pollock,
Da Costa, Maranhao, & Macedo, 2002; Escorel
et al., 2002; Shi et al., 2004; Starfield, 1985).
The magnitude of the PSF effect was significant,
albeit of lesser magnitude than observed in previous
studies. This is likely to be due to the fact that IMR
has experienced a dramatic decline throughout
Brazil as a function of a range of interventions,
including PSF coverage, improved water and
sanitation, and better women’s health and develop-
ment (Macinko et al., 2006). Moreover, as noted
above, as IMR declines a greater proportion of
infant deaths tend to happen within the first month
of life due to conditions that are less amenable to
primary care. Neonatal mortality has been linked to
increased preterm and low birth weight births and
has become a more significant contributor to IMR
in Brazil as post-neonatal mortality declined
(Barros et al., 2005; Caldeira et al., 2001).
There were also important regional differences in
the effects of PSF coverage. In the region-stratified
analyses, the effect of the PSF program was reduced
for the more developed southern regions where
IMR has been lower relative to the north and
northeast. The apparent protective effect of popula-
tion size may represent either an urban advantage or
the fact that since 1998, PSF expansion has focused
on municipalities with populations greater than
100,000 people.
Physician supply was also associated with lower
infant mortality: a finding that is consistent with
other studies (Anand & Barnighausen, 2004).
Sensitivity tests using nurses per 1000 instead of
physicians found similar results, although both
variables could not be included in the analyses due
to their high correlation (r ¼ 0.74; po0.001). This
results suggests that the PSF has made progress in
expanding primary care physician supply in under-
served regions (such as the northeast) (Ministerio da
Saude, 2004). This argument is supported by the
observation that the physician supply effect was
significant in all regions except the southeast where
there has historically been less of a physician deficit
than in other regions and where most physicians are
specialists (rather than family practitioners or other
primary care providers).
Not surprisingly, measures such as poverty,
female illiteracy, lack of prenatal care, and low
levels of Hepatitis B immunization were all found to
be associated with higher mortality. Although
earlier studies found no relationship between
immunization rates and IMR (Macinko et al.,
2006), they used measures of all immunization
schedules which are already over 90 percent in most
states. Hepatitis B vaccination is a more recent
initiative and coverage varies substantially between
microregions, making it potentially a more sensitive
indicator of primary care access.
Availability of hospital beds was positively
associated with outcomes—a result that was not
expected. One possible explanation is that in recent
years hospitals may have experienced declines in
accessibility, quality, or both. This hypothesis is
partially supported by the results in Table 3 which
show that hospital beds were not associated with
neonatal mortality, the outcome that should be
most highly correlated with indicators of hospital
care. Lansky, Franc-a, and Kawachi (2007) suggest
that there is considerable variation in hospital
quality and this variation is associated with elevated
perinatal mortality from potentially avoidable con-
ditions such as intrapartum asphyxia. Potentially
avoidable infant mortality was found to be espe-
cially high for normal birth weight babies born in
government-contracted private hospitals in large
urban areas, which were found to have lower quality
care (Lansky et al., 2007).
Finally, low birth weight births were found to be
negatively associated with IMR in this study. This
‘‘low birth weight paradox’’ has been observed
elsewhere and may be explained by the fact that low
birth weight infants from population groups in
which LBW is most frequent often have a lower risk
of death than low birth weight infants from the
general population (Hernandez-Dıaz, Schisterman,
& Hernan, 2006). Our ecological analysis might be
more prone to picking up this phenomenon than
would an individual-level study. Removing LBW
from the analyses does not significantly change any
of our conclusions.
Limitations
This is an ecologic study, so it is not possible to
test whether the reductions in IMR and other
outcomes occurred within families that actually
visited the Family Health Program. Ideally, we
would conduct a multi-level analysis but there are
currently no nationally representative data on
individual PSF users and non-users. Nevertheless,
there is evidence that improving PSF coverage leads
to improvements in determinants of child health.
For example, PSF clients regularly receive health
education about breastfeeding, use of oral rehydration
ARTICLE IN PRESS
J. Macinko et al. / Social Science & Medicine 65 (2007) 2070–2080 2077
299
therapy, immunization, and infant growth monitor-
ing (Emond et al., 2002; Escorel et al., 2002). In a
study of several large urban centers, more than
three-quarters of PSF clients interviewed believed
that child health services were of good quality and
that the PSF was responsible for improvements in
the health of the neighborhood and their family
(Escorel et al., 2002). There is also evidence to
suggest that the PSF program decreases financial
barriers to access (Goldbaum, Gianini, Novaes, &
Cesar, 2005). Finally, other studies have confirmed
that in areas where the PSF or similar programs
have been implemented, infant mortality has
actually declined (Cufino Svitone et al., 2000;
Macinko et al., 2006; Serra, 2005).
Ecological analyses are vulnerable to omitted
variable problems. That is, there could be some
latent, unmeasured variable confounding the ap-
parent relationship between PSF and IMR. In this
case, the existence of such a variable is unlikely
given that we employed a comprehensive model of
health determinants, included fixed effects to con-
trol for time-invariant unobserved characteristics of
microregions, and tested several pathways and
alternative explanations. The high R-squared values
of the main regression models suggest that they
explain a large proportion of the variation in infant
mortality.
Finally, conclusions about outcomes based on
unadjusted rates (post-neonatal, neonatal, and
diarrhea deaths) need to be interpreted with caution
since there is evidence of undercounting of child
mortality in Brazil. Note that this undercounting
has improved in recent years, so each year’s data
should be closer to real values. In this study,
adjusted IMR values corresponded with observed
IMR rates 85 percent of the time with an average
difference of 4.7 deaths/1000 live births. Most of
this variation was in the Northeast region of the
country (60 percent agreement in the northeast, 84
percent agreement in the north, 90 percent agree-
ment in the central-west, 99 percent agreement in
the south and southeast). In sensitivity tests that
excluded the 982 (out of 3337) data points with
outcome data that was one or more standard
deviation above or below the adjusted IMR rates
for any year, there was no change in the main
conclusions of the relationship between PSF cover-
age and IMR, neonatal mortality, or post-neonatal
mortality. However, several covariates did become
non-significant as did the relationship between PSF
coverage and diarrhea mortality. This may be due to
that fact that the microregions excluded due to poor
quality data were also those with the highest rates of
diarrheal deaths and underscores the importance of
using adjusted rates when available.
Conclusions
The study has shown that expanding coverage of
a community-based primary care program, hand-in-
hand with other socioeconomic developments, was
consistently associated with reductions in primary
care-sensitive measures of infant mortality. Despite
the consistency of these findings, several issues need
to be addressed in order to assess the program’s
overall effectiveness and potential relevance to other
countries.
First, there is little data on the contribution of the
PSF to health inequalities within Brazil. This study
provides some evidence that due to its expansion in
the north and northeast regions of the country, the
PSF may have contributed to reducing inter-
regional inequalities in primary care-sensitive infant
mortality. But within regions, expanded PSF cover-
age has not always occurred in the most deprived
municipalities (Morsch, Chavannes, van den Akker,
Sa, & Dinant, 2001). In order to maximize the
equity-enhancing potential of the program, national
efforts should be directed at encouraging adoption
of the program in the poorest municipalities. Within
municipalities, program expansion should be en-
couraged within the most underserved neighbor-
hoods. Such a strategy is likely to improve equity in
outcomes since the greatest impact is likely to occur
where infant mortality is still the highest, especially
once outcomes have already improved for higher
income groups (Victora, Vaughan, Barros, Silva, &
Tomasi, 2000).
Second, financial incentives for municipalities to
adopt the program are currently linked to increasing
population coverage, but there are few systematic
monitoring and evaluation processes in place to
assess municipal or service-level performance. Sur-
veys show that clients are generally satisfied with the
quality of care delivered, but sustaining this level of
satisfaction will be a critical challenge in maintain-
ing popular and political support for the program
(Trad et al., 2002). New initiatives have been
proposed that would provide financial incentives
for municipalities that reach or exceed certain
health targets as a means to enhance access and
quality of care. For these reasons, a major challenge
will be to develop and use systems to monitor and
ARTICLE IN PRESS
J. Macinko et al. / Social Science & Medicine 65 (2007) 2070–20802078
300

improve the quality of care delivered in order to
maximize the potential health gains of this innova-
tive approach to integrated primary care delivery.
Third, there is little data available on the cost-
effectiveness of the PSF. In 2005, Federal govern-
ment transfers to municipalities totaled $5.7 billion
Brazilian Reais (approximately $US 2.6 billion),
which represents about $US 14 per person covered.
This figure does not include the municipal contribu-
tion (which varies from zero to nearly 100 percent).
Thus we estimate that the true costs of the program
may be as much as $US 30 per capita. While this is
still a modest amount, there is, as yet, no national
data to compare how well this program performs
vis-a-vis the status quo. Such information will
become increasingly important to mobilize the
additional political and financial capital needed to
reach the rest of the Brazilian population not
currently covered and then to maintain adequate
coverage in light of Brazil’s rapid epidemiologic and
demographic transition.
Fourth, Brazil has a large supply of health
workers, which might make it different from most
other developing countries. So far, the PSF strategy
has been successful in hiring more than 26,000
physicians and nurses and over 220,000 community
health workers. In principle, any trained health
professional may apply to the program and
competitive salaries have made it an increasingly
attractive option. On-going training in primary care
is an additional benefit of PSF affiliation, but there
is not yet enough known on how well this in-service
training prepares formerly specialty-trained physi-
cians to function as primary care providers. As the
program continues to expand, health authorities
will need to develop longer-term plans for main-
taining and expanding the health workforce, with
particular attention to improving the stability of
physician contracting mechanisms, and more con-
certed efforts to enhance provider skills in commu-
nity-based primary care.
Finally, because it serves as part of the Brazilian
national health system, the PSF is vulnerable to
health system level factors that could undermine its
potential impact, such as access to pharmaceuticals;
the quality and supply of needed specialty, diag-
nostic, or hospital care; or the availability, training,
and salaries of health workers (Chiesa & Batista,
2004; Franco, Bastos, & Alves, 2005). Key chal-
lenges as the program moves forward include
ensuring coordination between different types of
health services and vertically focused disease control
programs, improving quality of care, and maximiz-
ing community-based health promotion. Taken
together these actions may help to assure that the
PSF becomes more than just another program, but
fulfills its promise as a central organizing feature of
a more accessible, effective, and equitable national
health system.
Acknowledgments
This study was partially supported by the
Brazilian Ministry of Health. Frederico Guanais
was supported by the National Council for Re-
search and Development (CNPq). The conclusions
presented in this paper represent the opinion of the
authors alone.
References
Allison, P. (2002). Missing data. Thousand Oaks, CA: Sage
Publications.
Almeida, C., & Pego, R. A. (2002). Theory and practice in health
systems reform in Brazil and Mexico. Cad Saude Publica,
18(4), 971–989.
Anand, S., & Barnighausen, T. (2004). Human resources and
health outcomes: Cross-country econometric study. Lancet,
364(9445), 1603–1609.
Barros, F. C., Victora, C. G., Barros, A. J., Santos, I. S.,
Albernaz, E., Matijasevich, A., et al. (2005). The challenge of
reducing neonatal mortality in middle-income countries:
Findings from three Brazilian birth cohorts in 1982, 1993,
and 2004. Lancet, 365(9462), 847–854.
Brazilian Institute of Geography and Statistics. (2005). Banco
multidimensional de estatısticas. Available: /http://www.
ibge.gov.br/S.
Brazilian Ministry of Health Department of Primary Care (2007).
Atenc- ao Basica e a Saude da Famılia [Primary Care and
Family Health]. Available: /http://dtr2004.saude.gov.br/dab/
abnumeros.phpS; Accessed May 24, 2007.
Caldeira, A. P., Franc-a, E., & Goulart, E. M. (2001).
Postneonatal infant mortality and quality of medical care: A
case-control study. Journal of Pediatr (Rio de Janeiro), 77(6),
461–468.
Caldeira, A. P., Franc-a, E., Perpetuo, I. H., & Goulart, E. M.
(2005). Trends in avoidable causes of infant mortality in Belo
Horizonte, Brazil, 1984 to 1998. Rev Saude Publica, 39(1),
67–74.
Chiesa, A. M., & Batista, K. B. C. (2004). Desafios da implantac-
ao do Programa Saude da Famılia em uma grande cidade:
Reflexoes acerca da experiencia de Sao Paulo/challenges on
the implementation of the family health program in a great
city: Reflections on the experience Sao Paulo city. Mundo
saude (1995), 28(1), 42–48.
Conill, E. M. (2002). Primary care policies and health reforms:
An evaluative approach based on an analysis of the family
health program in Florianopolis, Santa Catarina, Brazil,
1994–2000. Cad Saude Publica, 18(Suppl), 191–202.
ARTICLE IN PRESS
J. Macinko et al. / Social Science & Medicine 65 (2007) 2070–2080 2079
301
Cufino Svitone, E., Garfield, R., Vasconcelos, M. I., & Araujo
Craveiro, V. (2000). Primary health care lessons from the
northeast of Brazil: The Agentes de Saude Program. Rev
Panam Salud Publica, 7(5), 293–302.
Emond, A., Pollock, J., Da Costa, N., Maranhao, T., & Macedo, A.
(2002). The effectiveness of community-based interventions to
improve maternal and infant health in the Northeast of
Brazil. Rev Panam Salud Publica, 12(2), 101–110.
Escorel, S., Giovanella, L., Mendonc-a, M. H., Magalhaes, R., de
Castro, M., & Senna, M. (2002). Avaliac- ao da Implementac- ao
do Programa Saude da Famılia em Dez Grande Centros
Urbanos. Sıntese dos Principais Resultados. Brasılia: Minister-
io da Saude, Secretaria de Polıticas de Saude.
Franco, A. L., Bastos, A. C., & Alves, V. S. (2005). The
physician–patient relationship under the family health pro-
gram in three municipalities in Bahia State, Brazil. Cad Saude
Publica, 21(2), 246–255.
Goldbaum, M., Gianini, R. J., Novaes, H. M., & Cesar, C. L.
(2005). Health services utilization in areas covered by the
family health program (Qualis) in Sao Paulo City, Brazil. Rev
Saude Publica, 39(1), 90–99.
Greene, W. H. (2003). Econometric analysis. Upper Saddle River,
NJ: Prentice-Hall.
Guanais, F. C. (2006). Evaluating the health impacts of primary
care decentralization in the context of a developing country.
Robert F. Wagner Graduate School of Public Service. New
York, NY: Robert F. Wagner Graduate School of Public
Service, New York University.
Hernandez-Dıaz, S., Schisterman, E., & Hernan, M. (2006). The
birth weight ‘‘paradox’’ uncovered? American Journal of
Epidemiology, 164(11), 1115–1120.
Hsiao, C. (2003). Analysis of panel data. Cambridge: Cambridge
University Press.
Instituto de Pesquisa Economica Aplicada (IPEA). (2005). Dados
macroeconomicos e regionais. Available: /www.ipeadata.
gov.brS; Accessed May 2005.
Lansky, S., Franc-a, E., & Kawachi, I. (2007). Social inequalities in
perinatal mortality in Belo Horizonte, Brazil: The role of
hospital care. American Journal of Public Health, 97(5), 867–873.
Lansky, S., Franc-a, E., & Leal Mdo, C. (2002). Perinatal
mortality and evitability: A review. Rev Saude Publica, 36(6),
759–772.
Macinko, J., Guanais, F. C., & Marinho de Souza, M. F. (2006).
Evaluation of the impact of the family health program on
infant mortality in Brazil, 1990–2002. Journal of Epidemiology
and Community Health, 60(1), 13–19.
Martines, J., Paul, V. K., Bhutta, Z. A., Koblinsky, M., Soucat, A.,
Walker, N., et al. (2005). Neonatal survival: A call for action.
Lancet, 365(9465), 1189–1197.
Ministerio da Saude. (2004). Avaliac- ao normativa do Programa
Saude da Famılia no Brasil. Brasılia: Sectaria de Assistencia a
Saude, Departamento de Atenc- ao Basica.
Ministry of Health of Brazil. (2003). The family health program:
Broadening coverage to consolidate the change in the primary
care model. Revista Brasileira de Saude Materno-Infantil, 3(1),
113–125.
Ministry of Health of Brazil. (2007). Informac- oes de Saude.
Available: /http://tabnet.datasus.gov.br/tabnet/tabnet.htmS.
Moore, D., Castillo, E., Richardson, C., & Reid, R. J. (2003).
Determinants of health status and the influence of primary
health care services in Latin America, 1990–98. International
Journal of Health Planning and Management, 18(4), 279–292.
Morsch, E., Chavannes, N., van den Akker, M., Sa, H., &
Dinant, G. J. (2001). The effects of the family health program
in Ceara state, northeastern Brazil. Archives of Public Health,
59, 151–165.
Pan American Health Organization. (2007). Renewing primary
health care in the Americas: Declaration of montevideo. Washing-
ton, DC: Pan American Health Organization Available http://
www.paho.org/English/AD/THS/primaryHealthCare.pdf.
Rede Interagencial de informac- oes para a saude (RIPSA). (2002).
Indicadores basicos para a saude no Brasil. Brasılia, Brasil:
Organizac- ao Panamericana da Saude/OMS.
Serra, R. (2005). Uma avaliac- ao empırica do impacto saude da
famılia sobre a saude infantil no estado de Sao Paulo.
Trabalho submetido ao Premio Economia da Saude, IPEA.
Brasılia, DF.
Shi, L., Macinko, J., Starfield, B., Xu, J., Regan, J., Politzer, R.,
et al. (2004). Primary care, infant mortality, and low birth
weight in the states of the USA. Journal of Epidemiology and
Community Health, 58(5), 374–380.
Starfield, B. (1985). Postneonatal mortality. Annual Review of
Public Health, 6, 21–40.
Statacorp. (2005). Stata statistical software: Release 9.0. College
Station, TX: Stata Corporation.
Szwarcwald, C. L., Leal Medo, C., de Andrade, C. L., &
Souza, P. R., Jr. (2002). Infant mortality estimation in Brazil:
What do Ministry of Health data on deaths and live births
say? Cad Saude Publica, 18(6), 1725–1736.
Trad, L. A. B., Bastos, A. C. S., Santana, E. M., et al. (2002).
Estudo etnografico da satisfac- ao do usuario do Programa de
Saude da Famılia (PSF) na Bahia. Cienc Saude Coletiva, 7(3),
581–589.
UNICEF. (2002). Facts for life. New York: United Nations
Children’s Fund.
Viana, A. L., & Pierantoni, C. R. (2002). Indicadores de
Monitoramento da Implementac- ao do PSF em Grandes Centros
Urbanos. Brasilia: Brazilian Ministry of Health, Department
of Primary Care.
Victora, C. G., Vaughan, J. P., Barros, F. C., Silva, A. C., &
Tomasi, E. (2000). Explaining trends in inequities: Evidence
from Brazilian child health studies. Lancet, 356(9235),
1093–1098.
Wang, L. (2003). Determinants of child mortality in LDCs.
Empirical findings from demographic and health surveys.
Health Policy, 65, 277–299.
Wooldridge, J. (2002). Econometric analysis of cross section and
panel data. Cambridge, Massachusetts: The MIT Press.
ARTICLE IN PRESS
J. Macinko et al. / Social Science & Medicine 65 (2007) 2070–20802080
302

RESEARCH ARTICLE Open Access
A realist evaluation of the management of a well-performing regional hospital in GhanaBruno Marchal1*, McDamien Dedzo2, Guy Kegels3
Abstract
Background: Realist evaluation offers an interesting approach to evaluation of interventions in complex settings,
but has been little applied in health care. We report on a realist case study of a well performing hospital in Ghana
and show how such a realist evaluation design can help to overcome the limited external validity of a traditional
case study.
Methods: We developed a realist evaluation framework for hypothesis formulation, data collection, data analysis
and synthesis of the findings. Focusing on the role of human resource management in hospital performance, we
formulated our hypothesis around the high commitment management concept. Mixed methods were used in data
collection, including individual and group interviews, observations and document reviews.
Results: We found that the human resource management approach (the actual intervention) included induction of
new staff, training and personal development, good communication and information sharing, and decentralised
decision-making. We identified 3 additional practices: ensuring optimal physical working conditions, access to top
managers and managers’ involvement on the work floor. Teamwork, recognition and trust emerged as key
elements of the organisational climate. Interviewees reported high levels of organisational commitment. The
analysis unearthed perceived organisational support and reciprocity as underlying mechanisms that link the
management practices with commitment.
Methodologically, we found that realist evaluation can be fruitfully used to develop detailed case studies that ana-
lyse how management interventions work and in which conditions. Analysing the links between intervention,
mechanism and outcome increases the explaining power, while identification of essential context elements
improves the usefulness of the findings for decision-makers in other settings (external validity). We also identified a
number of practical difficulties and priorities for further methodological development.
Conclusion: This case suggests that a well-balanced HRM bundle can stimulate organisational commitment of
health workers. Such practices can be implemented even with narrow decision spaces. Realist evaluation provides
an appropriate approach to increase the usefulness of case studies to managers and policymakers.
Background
In the wake of the numerous global health initiatives,
the health workforce of low and middle-income coun-
tries is once again receiving a lot of attention [1-3].
While the key role of health workers in improving
health care quality and implementing disease control
programmes is widely recognised [4,5] operational
aspects of health workforce management at service pro-
vision level remain poorly studied. Indeed, the focus has
been mostly on macro-level aspects, such as brain drain,
the impact of human resource deficits on global health
initiatives and planning and training capacity issues.
This relative neglect of studies of health workforce
management explains why the current evidence base on
the effectiveness of HRM policies and strategies is rather
weak. More specifically, there are a number of weak-
nesses that limit their potential to inform decisions of
policymakers or health service managers. First, the
determinants of health worker performance in poor
resource settings have not been studied well. Second,
the HRM policies and strategies, too, are under-
researched [6]. Third, systematic reviews indicate that
most of the studies are methodologically flawed. A
* Correspondence: [email protected] of Public Health, Institute of Tropical Medicine-Antwerp,
Nationalestraat 155, B-2000 Antwerp, Belgium
Marchal et al. BMC Health Services Research 2010, 10:24
http://www.biomedcentral.com/1472-6963/10/24
© 2010 Marchal et al; licensee BioMed Central Ltd. This is an Open Access article distributed under the terms of the Creative CommonsAttribution License (http://creativecommons.org/licenses/by/2.0), which permits unrestricted use, distribution, and reproduction inany medium, provided the original work is properly cited.
303
recent realist synthesis of the effect of human resource
management interventions on health worker perfor-
mance in LMIC found that very few studies provide
adequate information on the assumptions, the context
and the underlying mechanisms of these interventions
[7]. The same applies to a review of the effect of HRM
policies on supply, distribution, efficient use and perfor-
mance of health workers [8]. Rowe and collegues came
to similar conclusions [9]. Fourth, few of these studies
have been carried out in LMIC [8].
All this notwithstanding, policies and management
strategies are still imported from other settings into
health services of LMIC without a blink of the eye. The
surge of performance based financing (PBF) provides a
good example. PBF is being introduced at different
levels of the health system [10-13] and in a wide variety
of countries, including Nicaragua [13], Cambodia [14],
Rwanda [15,16], Zambia [17], Sri Lanka, Ghana, Zim-
babwe, Thailand and India [18]. The evidence base,
however, is very narrow [19]. Most PBF studies were
found to lack controls and to neglect the analysis of
confounding factors [6], which reduces the validity of
the attribution of the reported effects to the interven-
tion. Furthermore, very few studies offer indications of
the conditions in which these approaches are working
(see [20] for an example of a study that does).
In part, the methodological weakness of the health
workforce management research resides in insufficiently
rigorous studies. Some problems also stem from the
widespread use of the case study. Indeed, although orga-
nisational studies is a domain marked by a lack of con-
sensus on ontology and epistemology [21] and the
consequent lack of consensus on methodology, the case
study is a common research design for a number of rea-
sons. First, it allows exploring a “phenomenon within its
real-life context, especially when the boundaries between
phenomenon and context are not clearly evident” [22],
and thus suits well the open systems-nature of human
organisations. Second, it enables investigation of organi-
sational behaviour as it happens in its natural setting
[23]. Case studies are also useful in dynamic and com-
plex situations where multiple, interacting variables may
act upon intervention and outcome [24,25]. It is well
suited to research on HRM [26]. Finally, Hartley argues
that case studies can help in probing and developing
theory [27].
Since the publication of Experimental and quasi-
experimental designs for research by Campbell & Stanley
[28], the major limitation held against the case study
design is its limited external validity, or the weak poten-
tial to generalise findings from one case to another.
Other authors raise its limited attribution power: case
studies are good at analysing the intervening processes
or documenting evolution in time, but weak at
demonstrating the causal links between intervention and
outcome [29]. Much of this critique has its origins in
quantitative criteria of validity, according to which case
studies are based on too small numbers of cases and on
non-randomised case selection, thus leading to problems
of representation and inference [25]. It is exactly here
that its adherents claim that theory-based methodologies
can make a difference.
During the 1980s, Chen and Rossi developed the the-
ory-based evaluation approach as an answer to policy
and programme evaluation approaches that remained
limited to before-after and input-output designs or that
focused narrowly on methodological issues (method-dri-
ven evaluation) [30,31]. The theories of change approach
[32] and realist evaluation (RE) [33] are among the most
recent applications of theory-based evaluation. As we
will discuss in detail below, both approaches aim at
opening the black box between intervention and
outcome.
For organisational research, realist evaluation seems to
offer a number of advantages. It promises, first, to
increase the external validity of case studies. Building
upon existing knowledge, RE analyses why change
occurs, or why not, and in which conditions. It aims at
providing information that allows decision-makers to
judge whether the lessons learnt could be applied else-
where [34]. Repeated case studies lead to more refined
middle range theories that offer increasingly refined
information of context conditions, thereby increasing
generalisability of such case studies [21,27,29] and
improving our understanding of causal processes [35].
Second, based on its generative perspective on causality,
it seeks to explain change by referring to the actors who
change a situation under influence of particular external
events (such as an intervention) and under specific con-
ditions [33]. Accepting the role of actors in change
(agency), realist evaluation also considers structural and
institutional features to exist independently of the actors
and researchers. If human action is embedded within a
wider range of social processes and structures, then cau-
sal mechanisms reside in social relations and context as
much as in individuals. As a consequence of this ontolo-
gical perspective, evaluators need to unearth the social
layers in order to understand the root causes of the pro-
blem at hand [36] and to find the mechanism that
explains the outcomes of the intervention [33]. In short,
Pawson & Tilley argue that realist evaluation indicates
‘what works in which conditions for whom’, rather than
merely answering the question ‘does it work?’. Realist
evaluation is thus well suited to assessment of interven-
tions in complex situations, which most organisational
research is all about.
While the merits of theory-driven and realist evalua-
tion have been amply discussed in journals on
Marchal et al. BMC Health Services Research 2010, 10:24
http://www.biomedcentral.com/1472-6963/10/24
Page 2 of 14
304
evaluation (see for instance [36-41] and [42-44], there is
little documented experience in the domain of health
service organisation and public health, notable excep-
tions being [45] and [46]. This scarcity of realist studies
could be interpreted as a sign of the limited academic
credibility of theory-driven evaluation in general: ‘objec-
tivist’ arguments overrule ‘subjectivist’ research [47].
Other reasons may be practical in nature: carrying out a
full-blown theory-driven evaluation is resource- and
time intensive [48]. The need of assessing the underlying
theory in addition to the efficacy/outcome evaluation
adds to the burden [41].
In this paper, we examine whether and how a realist
evaluation design can be applied in research of well per-
forming hospitals. We present the case of Central Regio-
nal Hospital (CRH) in Cape Coast, Ghana and discuss
how we applied this method, from the stage of hypoth-
esis formulation to the synthesis of the results. This case
study is part of a longitudinal study on the links
between management and performance in well-perform-
ing hospitals. We describe the latter as hospitals that
ensure equitable access to high quality care and that
provide such services in an efficient manner. We choose
CRH both because it won the award for the best hospi-
tal of the Ghana Health Service in 2004 and on the
basis of previous research.
The objective of the study was to analyse the manage-
ment approach at CRH. We formulated the following
research questions: (1) What is the management team’s
vision on its role?; (2) Which management practices are
being carried out?; (3) What is the organisational cli-
mate? (defined by Takeuchi et al. as the perceptions of
employees regarding how the management approach is
practiced and implemented in their organisation [49];
(4) What are the results?; (5) What are the underlying
mechanisms explaining the effect of the management
practices?
Methods
Principles of realist evaluation
Drawing inspiration from [34,50,51], we structured our
study in 4 steps: the formulation of the Middle Range
Theory, the design of the study, the data analysis and
synthesis, and presentation of the results. We briefly
introduce these steps from a theoretical point of view,
and then describe how we developed each step in
practice.
A realist evaluation research starts from a middle
range theory (MRT), which is understood as “theor [y]
that lie [s] between the minor but necessary working
hypotheses (...) and the all-inclusive systematic efforts to
develop a unified theory that will explain all the
observed uniformities of social behavior, social organiza-
tion and social change” [52] p. 39). In essence, this
MRT states how the intervention leads to which effect
in which conditions. Lipsey & Pollard identify different
mechanisms to develop this MRT [53]. It can be formu-
lated on the basis of existing theory and past experience.
If the latter is not available, exploratory on-site research
can be done to unearth the models used implicitly by
the actors to make sense of the intervention - what
Pawson & Tilley call ‘folk theories’ [33]. Through indivi-
dual interviews or group discussions, the key elements
of the problem or intervention, the expected outcomes
and potential moderating factors are to be identified
[50], p. 196). Additional information may be derived
from programme or policy documents. Cause mapping
or concept mapping can be used in this process [54].
Ideally, the resulting MRT is then compared with exist-
ing knowledge. A literature review identifies studies
reporting other causal chains, moderating factors or
unintended outcomes, allowing a plausibility check of
the preliminary MRT. The result is then again discussed
with the stakeholders and results in the middle range
theory that will be tested. Byng constructed the middle
range theory on the basis of a literature review, a
description of the intervention and discussions with
facilitators involved in the programmes in question [40].
Regarding designs and research methods, realist evalua-
tion is neutral [33]: the hypothesis as expressed by the
MRT is guiding the choice of data that should be collected
and the methods and tools to do so. Most theory-driven
evaluations in healthcare used the case study design and
combine both quantitative and qualitative methods.
Pawson & Tilley call the working hypotheses that
emerge during the analysis phase ‘Context-Mechanism-
Outcome configurations’ (CMOC) [33]. Realist evalua-
tors describe not only the intervention and its outcome,
but also the context and the underlying mechanism.
They seek to establish patterns or regularities that
explain outcomes of interventions. In practice, the data
from interview transcripts, document analysis and obser-
vation are coded with codes drawn from the initial MRT
(See [40] for a practical example). Similar to other ana-
lysis methods, subsequent rounds of analysis lead to a
refined set of themes, categories and codes. The emer-
ging findings are compiled as conjectural CMOCs,
which indicate how the intervention led to particular
outcomes in which context and by which mechanism.
Their fit with the data is checked to ensure internal
validity. The retained CMOCs are then compared with
the MRT, which in turn is modified if necessary [55]. In
some studies, the resulting ‘new’ MRT was discussed
with key actors in order to validate it. A new study then
further refines the MRT and this cyclical process leads
to accumulation of better insights in how particular
interventions work, in which conditions and how
[33,34].
Marchal et al. BMC Health Services Research 2010, 10:24
http://www.biomedcentral.com/1472-6963/10/24
Page 3 of 14
305
In order to be useful in decision-making, the synthesis
should present the combinations of attributes required
for an intervention to be effective, a presentation of the
various alternative explanations, an indication of the
potential of transferability by showing the links with
existing knowledge, and an indication of the preliminary
nature of the findings [56].
Formulation of our MRT
We formulated our preliminary MRT on the basis of an
explorative study at CRH. During that study, intervie-
wees indicated the importance of trust between health
workers and their management, and the high levels of
commitment of staff to the hospital. We also found
arguments that pointed to the importance of a contin-
gency approach to management of health workers: effec-
tive managers implement management practices that
have a good fit with the nature of their workforce, the
tasks of the organisation and its environment.
A second source of inspiration was our literature
review of human resource management and hospital
performance, which led us to high commitment man-
agement (HICOM). We retained this concept because
its comprehensive approach to management fitted well
with our initial analysis. The central attribute of
HICOM is the combination of several complementary
practices (e.g. good selection of staff, providing training
on a needs basis and individual mentoring) in what is
called ‘bundles’. Through their research in the indus-
trial, commercial and service sectors, Pfeffer & Veiga
identified a bundle of 7 elements, which they claim is
universally valid [57]: providing employment security,
ensuring comparatively high compensation contingent
on organisational performance, instituting training and
development, putting in place selective hiring, institut-
ing self-managed teams and decentralisation, reduction
of status differences and information sharing. Organi-
sational commitment was identified as an outcome of
such HRM practices [58] and has been shown to con-
tribute to higher organisational performance. Such
balanced bundles of management practices lead to bet-
ter organisational performance [59-61]. We described
elsewhere the key elements of high commitment man-
agement in health care organisations [62]. Some of the
mechanisms that link HICOM to better performance
include positive psychological links between managers
and staff, organizational commitment and trust.
We drew another element from the work of Cameron
& Quinn on organisational culture [63], which points to
the importance of the coherence between the vision of
the managers on their role, the practices they choose to
implement, and the perception of their employees of
these practices. Good fit between these would contribute
to better organisational performance.
A final element is the notion of ‘decision space’. This
concept was developed by Bossert [64] to describe the
margins of freedom of health service managers at the
operational level. His framework analyses how decentra-
lisation policies affect the management practice at
operational level. We retained adequate decision spaces
as a potentially important context factor and a potential
condition for HICOM to be possible.”
It should be noted that there is considerable debate
about the outcomes of HRM, and even more about the
methods to demonstrate these. In general, we would
describe the proximal outcomes of human resource
management in terms of three categories: improved staff
availability, improved staff attitudes and affects (commit-
ment, job satisfaction) and better staff behaviour (in
terms of higher task performance and organisational
citizenship behaviour, and lower absenteeism). We
selected organisational commitment and trust as proxi-
mal outcomes of human resource management, because
our literature review pointed out that these outputs are
often found to explain the effect of HICOM.
Combining all these elements with the findings of our
first exploration visit, we formulated the MRT as follows:
“Hospital managers of well-performing hospitals
deploy organisational structures that allow decentra-
lisation and self-managed teams and stimulate dele-
gation of decision-making, good flows of information
and transparency. Their HRM bundles combine
employment security, adequate compensation and
training. This results in strong organisational com-
mitment and trust. Conditions include competent
leaders with an explicit vision, relatively large deci-
sion-making spaces and adequate resources.”
Study design and data collection tools
As will be clear at this point, we used the case study
design as the basis. We collected both qualitative and
quantitative data through document review of GHS and
hospital records and reports, focusing on hospital HRM
policies, and staffing levels and skill mix data.
In-depth interviews with all 6 members of the hospital
management team (HMT) explored their management
vision and practices. We based the HRM part of the
interview guide on the 7 elements set of Pfeffer & Veiga
[57](see some questions in Additional file 1). It must be
noted that the interview guides only served as a guide to
structure the interview when necessary, not as a ques-
tionnaire list that must be applied similarly in all inter-
views. In line with the concern that most studies focus
on managers and ignore the perceptions of employees
[65], we also explored the perceptions of staff regarding
the management approach (the organisational climate).
Marchal et al. BMC Health Services Research 2010, 10:24
http://www.biomedcentral.com/1472-6963/10/24
Page 4 of 14
306
In order to cover a wide range of views of different
cadres, we made a purposive selection of staff. We iden-
tified the main cadres and within these, we randomly
selected candidates for the interviews. This resulted in
individual in-depth interviews of 3 nurses, 1 midwife, 1
doctor, 1 radiographer, 1 physiotherapist, 2 laboratory
technologists, 1 clerical officer and 1 ward assistant. We
also carried out 3 group discussions with heads of units,
nurses, and paramedical staff (orderlies, clerical officers
and account staff). Opportunistic non-participant obser-
vations were made of management meetings, ward pro-
cedures and OPD clinics.
We also developed a data collection form that focused
on numbers of different cadres of staff (stocks) and on
movement of personnel in or out of the hospital (flows
in terms of transfer in/out, deceased staff, dismissed
staff, absconded staff, retired staff).
During the preparation phase, a self-assessment of
ethical issues, based on the working paper “Notes
regarding ethical guidelines for health services research”,
of the Department of Public Health, Institute of Tropical
Medicine was done. This covered the following issues:
Minimal risk to participants; Invitation, information and
informed consent; Feedback to interviewees and staff.
We sought and obtained a written informed consent
from all interviewees. Measures were taken to safeguard
confidentiality and anonymity. All interviews were
recorded and transcribed verbatim.
Data analysis
We used NVivo 2.0 software for data management and
analysis. The initial coding was based on a preliminary
list of codes inspired by the MRT and on additional
ideas that emerged during the fieldwork.
In a second round of analysis, some themes and pat-
terns emerged (see below). In order to structure these
as CMO configurations, we found it useful to borrow
categories from theory-driven evaluation [66]. We
described the intervention (in this case the HRM prac-
tices) in terms of content and application, and the
intended and actual outcomes. We drew on our inter-
views and observations to differentiate (proclaimed)
vision (what the team wants), the discourse (what they
say) and the actual practices (what they do). We
described the organisational climate, defined as “the
atmosphere that employees perceive is created in their
organisation by practices, procedures and rewards” [67].
In order to indicate how the intervention works, we
analysed both the context and the intervening mechan-
isms, and attempted to identify the essential conditions.
To assess the intensity of the implementation of the
practices, we developed an analytical framework based
on the paper by Richardson & Thompson [59]. These
authors questioned the research tools used in HRM
surveys, which in their opinion often lack assessment of
the intensity of application and coverage of the HRM
practices. We selected coverage, intensity, internal fit
and external fit as dimensions. ‘Coverage’ is understood
as the degree to which the elements of the HRM bundle
are applied to all cadres. ‘Intensity’ looks at the intensity
of application. ‘Internal fit’ examines the synergistic and/
or counterbalancing effect of the different elements.
‘External fit’ examines the appropriateness of the bundle
for the cadre and organisation in question.
Reporting of findings
The preliminary results were discussed with the man-
agement team of the hospital, and the final analysis sub-
sequently refined. A research report was sent to the
commissioner of the study, a policy brief posted on the
web and the findings were presented at the 2008 Geneva
Health Forum.
Results
In this section, we present both primary findings and
results from the analysis of the qualitative data in terms
of the management vision, the actual management prac-
tices and the organisational climate. These sections cor-
respond with the research questions presented above
and are drawn from a ‘thick’ description of the case, or
a detailed account of what the interviewees said, what
we observed and what we learned from our document
review.
The management vision
A first element we analysed was the views of the man-
agement team members of their own role in the hospital
and on how they should manage the personnel. During
the interviews, the management team members did not
use words like ‘bundle’ or ‘high commitment manage-
ment’, but they nonetheless expressed a clear view of
the hospital’s roles and of how the health workers
should be managed accordingly. Key terms include striv-
ing for excellence, offering services to all, attention for
their personnel and sound financial management. This
vision is transmitted through what they say during staff
meetings or write in the mission statement and the
annual reports.
This vision is well shared: not only do the director, the
financial manager, the nursing manager and the non-
medical administrator maintain the same discourse, also
interviewees from the operational staff expressed this
vision clearly, from nurses to cleaners.
“Their vision is that, they want this place to be a first
class hospital. Their aim is to save life, so that is
their main focus. And whatever they want to do so
that life is saved, to me is their agenda.” (Non-medi-
cal worker, group discussion Non-medical staff)
Marchal et al. BMC Health Services Research 2010, 10:24
http://www.biomedcentral.com/1472-6963/10/24
Page 5 of 14
307
The actual human resource management - what the
management does
Based on the analysis of our interviews, observations
and collected documents, we found that the actual set
of practices at CRH includes more and different ele-
ments than Pfeffer and Veiga [57] listed. These authors
list of seven elements includes:
- putting in place selective hiring
- providing employment security
- ensuring comparatively high compensation contin-
gent on organisational performance
- instituting training and development
- deploying self-managed teams and decentralisation
- reduction of status differences
- information sharing
We found that selective hiring took place at the start-
up of the new hospital in 1998, when the medical and
para-medical staffs were almost handpicked from the
pool of health workers in the region. At the time of the
study (2005), however, the Ghana Health Service (GHS)
regulations allowed only local recruitment of labourers
and administrative staff.
The employment security offered by the GHS to its
appointed staff was an often-mentioned reason why
interviewees prefer employment in the GHS rather the
private sector.
At the time of the study, setting compensation levels
was not within the decision space of the HMT. Only
financial incentives for night duties and expatriate doc-
tors could be given. Remuneration was not linked to
actual performance. Just prior to the study, health sector
strikes led to the Additional Duty Hours Allowance
(ADHA) policy, which significantly improved the pur-
chasing power of the health workers - the ADHA initi-
ally constituted a mark-up of 100-250% to the salary of
a doctor and of lesser proportions for other health
workers.
Training and personal development was found to be
an important part of the HRM package. A full-time in-
service training coordinator was appointed and a budget
allocated to organise continued medical education activ-
ities, including clinical meetings, mortality meetings,
seminars and conferences. Staffs were actively stimu-
lated to follow external courses, even during working
hours and personnel from all cadres actually did.
We found decentralised decision-making to be a cen-
tral feature. The different units enjoyed a moderate level
of autonomy in terms of decision-making and objective
setting. Considerable decision-making authority over a
number of domains, including the highly sensitive distri-
bution of ADHA funds, was delegated to committees
composed of different cadres of staff. The management
team members argued that such decision-making
structure would foster active participation of staff in
decisions that affect the hospital.
In this decentralised decision-making structure, we
found that teamwork is understood as ’working all
together, all engaged, all involved’. In the daily practice
of curing and caring, teamwork was most visible at
operational unit level. Deliberate efforts were made to
include cleaners, sweepers and auxiliary staff in deci-
sion-making.
The nursing cadre decided to introduce an all-white
uniform instead of the colour-coded uniforms. Inter-
viewed nurses indicated this reduction of status differ-
ences as an important policy and perceived it as a sign
of respect by management. In contrast, reduction of sta-
tus differences between the management team and the
operational staff seemed not a concern, neither for man-
agement, nor for the staff.
Information sharing was one of the most striking fea-
tures. Formal communication channels were in place at
all levels, including regular unit and ward meetings,
heads of unit meetings and top management meetings.
These were complemented by the committees men-
tioned above. General quarterly meetings (staff “dur-
bars”), open to all staff, offered a voice even to the
hierarchically lowest cadre. Observation showed that
durbars effectively contributed to low-threshold, two-
way communication.
Additional practices
We also found that the HMT developed HRM practices
not included in Pfeffer & Veiga’s set: they made substan-
tial efforts to ensure good physical working conditions,
ensured good accessibility of the top managers and
stressed hands-on involvement of managers and staff
socialisation.
Major attention was given to creating optimal working
conditions. The interviewees pointed to the good com-
munication system in the hospital, the promptness of
repairs, the general cleanliness of building and com-
pound, the availability of air conditioning in virtually all
rooms and the good amenities for patients. Other ele-
ments of the physical environment that were appre-
ciated include the subsidised staff canteen, the internet
café, the staff bus and the staff library. This points to
the leverage of improving the working conditions. In
Ghana, this may be a management intervention that
increases not only the effectiveness of health workers,
but also their job satisfaction.
Top managers are accessible for all staff. As in most
Ghanaian hospitals, we found a clear hierarchy, whereby
superiors should never be bypassed. Hierarchy was
strong in the nursing and administrative cadres. How-
ever, interviewees mentioned the possibility to see the
director or nursing manager in person when problems
Marchal et al. BMC Health Services Research 2010, 10:24
http://www.biomedcentral.com/1472-6963/10/24
Page 6 of 14
308
could not be solved with their direct supervisor. Our
observations showed that staff members of any cadre
effectively made use of this open door policy.
Management stays involved at the operational level.
Interviewees reported that the nursing managers were
regularly helping out staff in the wards during their
twice-daily supervision rounds, while the director was
still involved in clinical work. The interviews show that
this was a deliberate management strategy: the top man-
agement aimed at boosting staff morale by actually
working with them and by leading by example. We also
found that the heads of unit steered this process by
inviting senior managers and heads of other depart-
ments to their unit meetings in case of cross-border
problems.
At the time of the study,socialisation of staff was a
central element at CRH. Newcomers were given a for-
mal induction course and rotated for a few weeks
through different units before being posted to their first
station. Both close supervision and peer pressure con-
tributed to maintenance of the standards of work. Inter-
views show that unit heads would identify staff not
following the procedures and correct such behaviour
through tutoring.
Intensity of implementation
We analysed the actual implementation of the HRM
practices with the framework we presented under Sec-
tion ‘Study design and data collection tools’ and which
was based on the paper by Richardson & Thompson
[60]. First, our observations and interviews show that
the elements of the HRM bundle are applied to all
cadres (good coverage). The intensity of application was
variable. The management team, indeed, adapts its prac-
tices in response to emerging priorities. For example,
when confronted with problems of permanence of doc-
tors at the emergency department, a custom-made
incentive package was put in place. This unequal
approach was not contested because all staff recognised
the role of doctors in the performance of the hospital.
Second, it seems the management team reached a
good internal fit of the bundle (good degree of synergy
between elements of the bundle). There were no prac-
tices that cancelled each other out, except perhaps for
the emphasis on training. This had the unintended effect
of enabling staff to leave CRH for better posts. Most
other elements have mutually reinforcing effects: (1)
information sharing, recognition and participative deci-
sion-making; and (2) bottom-up access to management
and managers getting involved in the wards.
Finally, the external fit of a HRM bundle is the fit of
the management practices with the core activities of the
hospital (caring and curing) and with the mission of the
organisation (providing accessible quality care). The
HRM practices stimulate good professional practice by
nurses, midwives and doctors by providing adequate
autonomy to the operational units regarding their daily
activities, while ensuring coordination between these
units. The management is also perceived to provide
effective support, information and resources (see below).
As such, the bundle fits well to the task and mission of
the hospital and to the professional values.
The organisational climate: the management practices as
perceived by the staff
Four themes emerged in the analysis of the perceptions
of the operational staff of the HMT’s actions: team
work, strong perceptions of support by the management
team, recognition and trust. As we will discuss below,
these themes point to mechanisms that help explain
how the management strategies worked.
Teamwork stimulates staff from all cadres to be involved in
care
The interviews indicated a strongly shared feeling
among staff members that team work matters: they
maintain that quality of care can only improve if all
types of staff are involved.
“In some places, nobody gets close to the Nurse Man-
ager and it is like she only decides what she wants at
the place. (...) But here, everybody is important. We
see everybody’s job as important aspect of the health
care delivery system, so we include everybody in the
care.” (IO 1, Unit head, Ind. interview)
Junior staff members pointed out the ‘free’ relations
with their superiors.
“We are all free in our units. My head always comes
round to see what is going on over here. If something
is not in the right place, he will show you to do this
or that. So, always the heads are helping us, so we
also feel free to work with them.” (Non-medical staff,
GD Non-medical staff)
’Free relations’ strengthen the collaboration between
operational staff and their heads of units, but also with
the top managers. Interviewees similarly mentioned the
easy communication between the middle line staff and
the HMT.
“I would say there is good relationship both formally
and informally. We communicate by memos, but as
soon as I came, I can just walk straight to Director
and tell him: ‘This is the problem’, and we just
brainstorm to see how the problem can be solved.”
(IM5, HMT member, Ind. interview)
Perceptions of support by the management team
Interviewed staff members often mentioned that they
feel supported by the HMT. First, interviewees
Marchal et al. BMC Health Services Research 2010, 10:24
http://www.biomedcentral.com/1472-6963/10/24
Page 7 of 14
309
expressed the feeling that the HMT is effectively solving
problems. Unit meetings or ward conferences are a
good example of how formal meetings can prevent or
solve coordination problems.
“The ward conference is very good. The accountant is
there, the pharmacist is there, the lab man is there,
everybody is there. The meetings or presentations are
not for fault finding. We pick issues from there and
we make our corrections or cover loopholes.” (Head of
unit 1, GD Unit heads)
Informal and non-structured opportunities exist, too,
and are used to good effect. Interviewees pointed out
how open relationships and good access to top man-
agers allows them to take a problem to the ‘next level’.
“As a unit head, if I think that something is not going
on well, my demands are not being met, l can
approach the director and we sit down and talk
about it. (...) You are free to enter his office anytime
to discuss your problem, especially when you think
things are not going on well” (Head of unit 4, GD
Unit heads)
Staff members appreciated not only the possibility to
discuss work-related problems with their superiors, but
also the attention given by the latter to their profes-
sional development. This also applies to members of the
hospital management team.
“He [the director] made every opportunity for my
career advancement. He is always looking out, listen-
ing and trying to help where he can, to see how he
can help people to progress. So, when you have some-
one doing that for you, at least you also have to
return the same to him.” (IM5, hospital management
team member, Ind. interview)
Strong perception of recognition
The interviewees expressed strong feelings of recogni-
tion by the management team. They explained how a
range of practices, from a word of appreciation to tangi-
ble rewards expresses the appreciation of the HMT for
their work.
“At the end of the year, every staff here is given a
token. Sometimes, something in the form of food,
money, a get-together, occasionally words of motiva-
tion, a tap on your shoulder, meeting you and finding
out how is it, how is the work going on. This serves as
motivation.” (IO7, Head of unit, Ind. interview)
Interestingly, several interviewees mentioned the initial
staff selection, when the hospital was started up, as a
key event, not only because it helped set standards, but
also because of its strong undertone of recognition.
“To start with, I can surely say that, the standard
that was set right from the inception of the hospital
has made such a mark. Because immediately when
this hospital was instituted, we were to come for an
interview. So, a high standard was set (...) and they
see if you have the call to work. On that note, in
coming out to publish the names of those to come
here, it is like Government releasing a white paper.
By that time, you feel as if you are in heaven. (...)
With that alone, that standard was set and every-
body was expected to give of his best.” (Nurse, GD
Nurses)
Perceptions of trust
We explored the issue of trust, which we found to be an
important element in the explorative study, by asking
staff how they would rate the levels of trust at CRH and
how they believe trust is generated. The interviewees
indicated fair levels of trust both amongst staff and
between management and staff.
In the whole hospital, there is some trust, but I don’t
think it is 100%. May be it is between 80% - 95%.”
(Unit head 3, GD Unit heads)
Asked how management practices influence the levels
of trust, they pointed out the importance of meetings
during which information is exchanged, the willingness
of managers to discuss decisions and the resulting per-
ception of transparency.
“At least, we have management meetings and after
that, management meets the unit heads and tells
them what the institution wants to do, the pro-
grammes they have embarked on. They discuss with
the unit heads and if somebody does not understand
something, management explains it. The unit heads
are supposed to go down and explain to their subor-
dinates. And when we have staff durbars, these things
are also brought up. So, transparency is there, we can
understand things. Anything they want to do is
explained to workers. (Unit head 3, GD Unit heads)
These consultations and opportunities to discuss
important issues contribute to perceived fairness of the
decisions. Interviewees said that less rumour mongering
and suspicion arise when people are informed why cer-
tain measures are implemented and others not.
“At the end of the day, like we had our last year’s
meeting after we presented our reports, management
too presented their report, their financial report,
Marchal et al. BMC Health Services Research 2010, 10:24
http://www.biomedcentral.com/1472-6963/10/24
Page 8 of 14
310
what they got and how they spent their expenditure
and those things. So, there will be no room to think
that somebody is cheating on you, or management is
hiding certain things from us. So, we know what is
happening, you don’t need to or there is no room for
suspicion. (...) I think it is a fair deal between man-
agement and staff.” (IO2, Midwife, Ind. interview)
Another source of trust is the effective support staffs
receive from their superiors in case of problems.
“Even the Director himself came here three days ago.
So, what he said, he has done it. That is why I say I
trust him.” (Non-medical worker, GD Non-medical
staff)
“The trust comes from the urgent action taken when
there is a problem. If there is any problem on disci-
pline for example, an ad-hoc committee is set up and
within days, the matter is settled.” (IM4, HMT mem-
ber, Ind. interview)
AnalysisAfter categorising, and thus making sense, of the primary
data in the form of CMO Configurations, a realist evalua-
tion seeks to examine the link between these findings and
the middle range theory it set out to examine. In practice,
we searched for potential causal pathways between the
management practices and the apparent outcomes of com-
mitment and trust. To do so, we summarised the above
findings and then searched for CMO configurations.
A summary of the intervention and its outcomes
Our interviews and document review show that the
Hospital Management Team identified good hospital
performance as the intended distant outcome of its man-
agement practices and a motivated and well-performing
workforce as the proximal outcome. As mentioned
above, the scope of this study did not allow examining
the association between management practice and hos-
pital performance, and we focus on the effect of these
practices on organisational commitment and trust, the
proximal outcomes we retained on the basis of our pre-
liminary theory-building.
The actual intervention can be summarised as a com-
bination of HRM practices: socialisation of (new) staff,
training and personal development, good communica-
tion and information sharing between different levels of
the organisation, and decentralised decision making to
the level of ward and department teams. We also found
important additional management practices: the creation
of good working conditions, the good accessibility of top
managers, and the active involvement of the manager on
the work floor.
Regarding the process of implementation, we noted a
good coherence between the HRM practices and the
management team’s vision. Indeed, in line with their
vision, the management team motivates the staff
through different interventions: remuneration, effective
support and recognition. The HRM practices are rein-
forcing each other (good internal fit). The bundle is well
adapted to the different cadres of a healthcare organisa-
tion and its mission (good external fit). It is applied
similarly to all cadres (good coverage). The intensity is
variable, but this poses no problems for the staff.
Realist evaluation improves external validity of a case
study by describing the implementation context. During
the study, we found several potentially important ele-
ments in the context of Central Regional Hospital. First,
as testified by the brain drain, Ghana has a well-trained
health workforce from which the GHS (and thus CRH)
can draw personnel. Its medical and paramedical cadres
display a high degree of professionalism, and there is a
general culture of professionalism in the GHS. Second,
reasonably good resource availability in terms of hospital
funding and management capacity allows investing in
the workforce. Indeed, commitment eliciting manage-
ment practices are costly, especially in management
time and in terms of training costs.
We found that the outcomes of the HR management
bundle at CRH included trust, commitment and strong
perceptions of recognition and of support by manage-
ment, which result in a positive organisational climate.
CMO configurations
During the later phases of the analysis, we found that
the management practices can be grouped according to
their key mechanism and this led to the description of
two parallel CMO configurations, each with their own
outcome.
The first CMO can be summarised as ‘keeping up
standards of excellence through organisational culture’.
The hospital had a head start: staff members were
selected on professional and motivational grounds by
the management team. This lengthy selection procedure
gave the staff a feeling of belonging to an elite corps of
health professionals and reinforced their professional
identity. The management team used this opportunity
to initiate a culture of high standards of professional
excellence. They set up an induction programme for
new staff, and much attention was paid to teamwork
and supervision. This reflects findings of Schein [68]:
such practices serve as strong embedding mechanisms
of the organisational culture. There was equally much
attention for a clear role distribution and for task moni-
toring. In summary, both ‘hard’ and ‘soft’ management
practices are balanced in the bundle. The former include
general rules and procedures, task distribution for clini-
cal and administrative staff and monitoring of task per-
formance; the latter include induction courses, peer
pressure mechanisms and training/personal development
Marchal et al. BMC Health Services Research 2010, 10:24
http://www.biomedcentral.com/1472-6963/10/24
Page 9 of 14
311
opportunities. All this reinforced the initial capital of
professional excellence. Availability of a pool of profes-
sional health workers is an important context element,
and may be essential for such a bundle to work.
The second CMO configuration can be summarised as
follows: a hospital management team can attain higher
organisational commitment if it strengthens positive
reciprocity relationships that are based on social
exchange, even in hospitals with limited HRM decision
spaces. Key practices in this set include creating open
access to managers for all staff and grass-root involve-
ment of managers at operational level. This reinforces
open relationships and contributes to solving opera-
tional problems and conflict resolution. In turn, it sti-
mulates the feeling of perceived organisational support.
Eisenberger and colleagues describe this as the beliefs
and perceptions of employees regarding the support
provided and the commitment demonstrated by the
organisation in their staff [69]. Employees interpret deci-
sions and actions of their managers and their trust-
worthiness in terms of the commitment of managers to
their staff. At CRH, the leadership and management
style is indeed perceived to be effective (in meeting its
promises and in ensuring adequate physical working
conditions) and supportive, even on the personal level.
Ultimately, such practices stimulate reciprocity and as a
result, organisational commitment. This in turn contri-
butes to organisational performance [70].
Availability of well-trained health workers and ade-
quate funding seem intuitively to be essential context
elements in both CMO configurations.
The new MRT
Our analysis identified two CMOCs that indicate causal
pathways between sets of HRM practices and HRM out-
comes, and we modified the MRT accordingly:
“The management of a well-performing hospital
deploys organisational structures that allow decen-
tralisation and self-managed teams and stimulates
delegation of decision-making, good flows of infor-
mation and transparency.
In the management of health workers, they imple-
ment a balanced bundle of management practices
that includes both clear goal setting, role distribution
and task monitoring (hard HRM) and training, sup-
port and recognition (soft HRM).
Based on the mechanism of perceived organisational
support and reciprocity, such combinations lead to a
positive organisational climate that includes recogni-
tion, respect, commitment and trust. If these are
taken up into the organisational culture and newco-
mers are inducted into the OC, enduring effects of
such practices can be expected.
Conditions for such management practices to work
include competent leaders with an explicit vision, a
minimum of resources and conducive institutional
arrangements, including effective decentralisation
and appropriate decision spaces (although the latter
can be narrow for HRM).”
Discussion
On the basis of this one study, we cannot yet draw firm
policy recommendations. Nevertheless, it offers interest-
ing insights in health workforce management and in the
use of realist evaluation.
Lessons for policy and practice
First, we found a proof of concept for HICOM in
resource-poor health services. Second, our study found
variant practices compared with the bundle described by
Pfeffer and Veiga, which supports the findings of
Richardson & Thompson [60] and Marchington & Gru-
gulis [71]. Third, this case reinforces the point that in
management of health workers, we need to apply coher-
ent bundles of practices, and not focus on singular
interventions. In HRM, the quality of management prac-
tices counts more than the quantity. It is not the actual
number of practices, but rather the process by which
these practices are put in place that is related with posi-
tive staff attitudes like commitment, job satisfaction and
procedural justice [65]. This is in line with conclusions
of other studies in other sectors [26,72].
Regarding the mechanisms, our findings relate to the
analysis of Evans & Davis [73], who situate the underly-
ing mechanisms of high commitment management at
the level of the internal social structure of the organisa-
tion. Such practices improve knowledge, skills and abil-
ities, but they exert also major effects at the level of
relationships. Weak ties are strengthened [74], recipro-
city is established and maintained [75] and shared men-
tal models contribute to a strong organisational culture.
This in turn affects behaviour of staff and improves
organisational efficiency and flexibility, and ultimately,
organisational performance. The evidence of the impact
of such reciprocity relations or of organisational com-
mitment on organisational performance is not strong,
and further research should investigate whether and
how high commitment leads to better performance in
healthcare organisations.
We found that the decision spaces managers require
to develop a responsive HRM approach may be smaller
than is often thought. At the time of study, the decision
spaces of regional hospital managers in Ghana were
quite limited concerning HRM. As important as the for-
mal decision space is its actual utilisation. At CRH, the
team exploited its decision spaces well to create its own
Marchal et al. BMC Health Services Research 2010, 10:24
http://www.biomedcentral.com/1472-6963/10/24
Page 10 of 14
312
way of management within the defined institutional
arrangements of a ‘regional hospital’ (e.g. by using com-
mittees and delegation of decision-making power).
Finally, a balanced management approach is costly,
especially in management time. It requires reasonable
financial resources and a management capability to deal
not only with administration but also with the less tan-
gible issues of relationships, organisational culture and
motivation of staff.
Future research should establish what other HRM
approaches lead to high commitment, under which con-
ditions HICOM works, and how it can be stimulated.
This last question deserves attention. Health services in
many LMIC are both ill equipped and not sufficiently
supported to implement a HRM approach that differs
from a mere administrative approach. In the first place,
the managers of health services are mostly medical doc-
tors. Human resource management is not an element of
the medical education curriculum. Even if they received
additional public health or management training, the
curriculum mostly equates HRM to personnel adminis-
tration and this hardly prepares future health service
managers for responsive management.
Methodological lessons
In this case study, we used a realist evaluation approach
because we consider health care organisations to be
essentially social entities. Pawson argues that realist eva-
luation is well suited to investigate change in such social
systems [34]. Its focus on the generative causality that
underlies interventions, stimulates the analysis of how
the intervention works and in which context conditions.
This results in more detailed conclusions that indicate
how the intervention was carried out, which effect it
had and how it worked. It also offers insights in the
context elements. Such theory building helps to over-
come the limits of traditional case studies, and specifi-
cally their low external validity and low power to
explain change [42]. However, appealing as it is, realist
evaluation poses a number of challenges for the
researcher.
The attribution paradox
Perhaps the most critical issue is the attribution para-
dox. Because of its ontological and epistemological
basis, realist evaluation is quite fit to assess complexity
[76,77] and may contribute most in research of exactly
such topics. However, research of complex problems
needs to confront multi-causality. In complex systems,
the behaviour of people and organisations alike is deter-
mined by many interlinked factors. Health professionals
act under influence of their professional norms, social
pressure, management interventions, and not least, their
intrinsic motivation. Assessing the exact contribution of
a set of management practices to overall organisational
performance may therefore be virtually impossible.
What realist evaluation can do is to stimulate the
researcher to describe a detailed picture of the causal
web that includes the multiple determinants and to
categorise these as intervention, underlying mechanism
or essential context factor. In our case, we have argu-
ments to say that both commitment-eliciting manage-
ment and personnel administration are required, but we
cannot (yet) indicate which among these two sets is the
most important in which setting.
The conclusion may be that one needs to accept that
the kind of evidence provided by realist evaluation can
never be put in the same categories of evidence pro-
duced by controlled experimental methods, not only
because of its perspective on causality, but also because
of the complexity of the subjects on which it will be
applied.
The MRT fallacy
While any researcher adopts specific reference frame-
works during her research, realist evaluation asks
researchers to make these frameworks explicit in the
form of a MRT. This implies a risk of developing a tun-
nel vision: the researcher may remain blind for the
unexpected factors and alternative explanations. This
risk can be reduced by the plausibility check during the
development of the initial MRT, triangulation of find-
ings, analysis by multiple researchers and discussion
with stakeholders and peers.
The MRT fallacy also operates at the stage of analysis
and of dissemination. During analysis, we did several
rounds of plausibility checks, because we kept finding
alternative explanations in disciplines such as organisa-
tional psychology, organisational theory and sociology.
The CMOCs and resulting MRTs are indeed most often
just one way of explaining the findings. A middle-range
theory can indeed never cover all possible explanations
of change [34]. In Pawson and Tilley’s view, a realist
evaluator does not strive at nor pretend to provide the
ultimate evidence that the intervention works. Rather,
she aims at enlightening the decision-maker, a process
of utilisation of research that may be the most frequent
in case of social science [78]. In such cases, a pragmatic
position should be taken, whereby one tries to refine the
middle range theory as much as practically possible,
with the explicit aim of providing options for improve-
ment rather than reaching a perfect understanding of
the intervention as such [56,79].
The CMO dilemma
As we mentioned, the CMO configuration is a powerful
model to go beyond the classic case study, as it forces
the researcher to go beyond description. However, a
true application of realist evaluation requires not only a
systematic description of the intervention in terms of
intervention, outcome, context and mechanisms. Also
the generative causal relationships between these
Marchal et al. BMC Health Services Research 2010, 10:24
http://www.biomedcentral.com/1472-6963/10/24
Page 11 of 14
313
elements need to be assessed. In our analysis, this
proved difficult at several levels.
The first important hurdle is the differentiation of the
effect of the context from that of the intervention. This
feeds the attribution paradox: is the outcome the result
of the intervention - and to which degree - or are there
context elements that explain the change in outcome -
and to which degree? Furthermore, some context ele-
ments can be expected to moderate the relation between
intervention and outcome, and in some cases, the out-
come of an intervention will influence its context (initi-
ating feedback). Regarding our case, probably more
attention needs to be given to the role of professional-
ism. Professional values can steer providers’ behaviour
to an important degree and could partially explain the
behaviour of certain staff, irrespectively of the manage-
ment strategies. Most likely, we may find that the
observed management strategies are in a close fit with
professional behaviour traditions.
Secondly, the realist researcher seeks to describe the
mechanism that is triggered by the intervention and that
leads to the outcome. Confusion may result from the
finding that some context elements are essential for the
outcome: is this context element then part of the
mechanism? We clarified this issue by considering con-
text elements as actors or factors that are external to
the intervention - that are present or occurring even if
the intervention does not lead to an outcome -, but
which nevertheless may have an influence on the out-
come. The mechanism is the causal pathway that
explains how the intervention leads to an observed out-
come in a particular context. In other words, the inter-
vention leads to an outcome in specific contexts if it
triggers certain mechanisms. If the mechanism is found
to be context-dependent, which in health services may
often be the case, essential context elements can be
identified. In our case, the professionalism of the staff
selected to work at CRH is a context element, the deci-
sion to introduce an induction training was a manage-
ment decision, and the effect of building an
organisational culture was a mechanism.
The efficiency question
By its very nature, RE may yield information that is par-
ticularly useful for policymakers. However, by its same
nature, a RE needs considerable expertise and ample
time and resources, because of its comprehensive scope.
Indeed, besides the efficacy/outcome evaluation, also the
underlying theory and the context must be accounted
for [41,80]. In our case, work at CRH started in 2004
with an exploratory visit, and much analysis went on
after the second visit in 2005 and the third visit in 2007.
Such timelines may still be acceptable in case of non-
urgent issues, but far less in case of high-interest policy
issues.
Conclusions
Realistic evaluation offers a comprehensive approach to
assessment of interventions in complex situations that
can go beyond the simple efficacy question. We devel-
oped a realist case study that unravelled the manage-
ment practices put in place by a hospital management
team in Ghana. This study shows that it is possible to
implement high commitment management practices in
LMIC and that these are perceived to be relevant by the
health workers. We found that through a well-balanced
bundle of HRM practices, management teams can sti-
mulate organisational commitment and an organisa-
tional culture of excellence. At CRH, the HRM bundle
included sound administrative management. Reciprocity
and perceived organisational support emerged as an
important underlying mechanism. In applying the realist
methodology, we also encountered a number of pitfalls
and paradoxes. Only through further practical applica-
tions will we find out how these can be overcome.
Additional file 1: Examples of interview questions from the interview
guide
Click here for file
[ http://www.biomedcentral.com/content/supplementary/1472-6963-10-
24-S1.DOC ]
Acknowledgements
We would like to thank all the staff of Central Regional Hospital (Ghana) for
their warm welcome and collaboration during this study.
This work was funded through the framework agreement (Raamakkoord)
between the Belgian Directorate-General for Development Cooperation and
the Institute of Tropical Medicine, Antwerp. The sponsors had no role in the
study or in the writing of the paper.
Author details1Department of Public Health, Institute of Tropical Medicine-Antwerp,
Nationalestraat 155, B-2000 Antwerp, Belgium. 2Volta Regional Health
Directorate, PO Box HP 72, Ho, Volta Region, Ghana. 3Department of Public
Health, Institute of Tropical Medicine-Antwerp, Nationalestraat 155, B-2000
Antwerp, Belgium.
Authors’ contributions
All three authors contributed to the original design and analysis. BM and
MD carried out the data collection. BM and MD analysed the data. BM, MD
and GK contributed to the discussion section and to writing the manuscript.
BM edited the final draft. All authors read and approved the final
manuscript.
Competing interests
The authors declare that they have no competing interests.
Received: 15 July 2009
Accepted: 25 January 2010 Published: 25 January 2010
References
1. WHO: World Health Report 2006. Working together for health Geneva: World
Health Organisation 2006.
2. Dal Poz MR, Quain EE, O’Neil M, McCaffery J, Elzinga G, Martineau T:
Addressing the health workforce crisis: towards a common approach.
Hum Resour Health 2006, 4:21.
3. The Lancet: The crisis in human resources for health. Lancet 2006,
367(9517):1117.
Marchal et al. BMC Health Services Research 2010, 10:24
http://www.biomedcentral.com/1472-6963/10/24
Page 12 of 14
314

4. Hongoro C, McPake B: How to bridge the gap in human resources for
health. Lancet 2004, 364(9443):1451-1456.
5. JLI: Human Resources for Health. Overcoming the crisis. Joint Learning
Initiative 2004, 1-207.
6. Oxman A, Fretheim A: An overview of research on the effects of results-
based financing. Report from Norwegian Knowledge Centre for the Health
Services Oslo: Norwegian Knowledge Centre for the Health Services 2008,
16.
7. Dieleman M, Gerretsen B, Wilt van der GJ: Human resource management
interventions to improve health workers’ performance in low and
middle income countries: a realist review. Health Res Policy Syst 2009, 7:7.
8. Chopra M, Munro S, Lavis JN, Vist G, Bennett S: Effects of policy options
for human resources for health: an analysis of systematic reviews. Lancet
2008, 371(9613):668-674.
9. Rowe AK, de Savigny D, Lanata CF, Victora CG: How can we achieve and
maintain high-quality performance of health workers in low-resource
settings?. Lancet 2005, 366(9490):1026-1035.
10. Wyss K, Prytherch H, Merkle R, Weiss S, Vogel T: Contributions to solving
the human resource crisis in developing countries - with special
reference to German development cooperation. Swiss Centre for
International Health. Basel: Swiss Tropical Institute 2006.
11. Hammer J, Jack W: Designing incentives for rural health care providers in
developing countries. Washington: World Bank 2001.
12. Gilson L, Erasmus E: Supporting the retention of HRH: SADC policy
context. Johannesburg: Equinet 2005.
13. Jack W: Contracting for health services: an evaluation of recent reforms
in Nicaragua. Health Policy and Planning 2003, 18(2):195-204.
14. Soeters R, Griffiths F: Improving government health services through
contract management: a case from Cambodia. Health Policy Plan 2003,
18(1):74-83.
15. Meessen B, Kashala J, Musango L: Output-based payment to boost
productivity in public health centres: contracting in Kabutare district,
Rwanda. Bulletin of the World Health Organisation 2006, 85(2):108-115.
16. Soeters R, Habineza C, Peerenboom PB: Performance-based financing and
changing the district health system: experience from Rwanda. Bull World
Health Organ 2006, 84(11):884-889.
17. Furth R: Zambia Pilot study of performance-based incentives. Quality
Assurance Project 2006.
18. Mills A, Bennett S, Russell S: The challenge of health sector reform. What
must governments do? New York: Palgrave 2001.
19. Eldridge C, Palmer N: Performance-based payment: some reflections on
the discourse, evidence and unanswered questions. Health Policy Plan
2009, 24(3):160-166.
20. Meessen B, Musango L, Kashala JP, Lemlin J: Reviewing institutions of rural
health centres: the Performance Initiative in Butare, Rwanda. Trop Med
Int Health 2006, 11(8):1303-1317.
21. Murphy E: Micro-level qualitative research. Studying the Organisation and
Delivery of Health Services: Research Methods London: RoutledgeFulop N,
Allen P, Clarke A, Black N 2001, 40-55.
22. Yin R: Case study research. Design and methods London: Sage Publications,
Third 2003.
23. Denscombe M: The good research guide for small-scale social research
projects Maidenhead: Open University Press, 2 2003.
24. Fitzgerald L: Case studies as a research tool. Qual Health Care 1999,
8(2):75.
25. Ragin CC: The distinctiveness of case-oriented research. Health Serv Res
1999, 34(5 Pt 2):1137-1151.
26. Truss C, Gratton L, Hope-Hailey V, McGovern P, Stiles P: Soft and hard
models of human resource management: a reappraisal. Journal of
Management Studies 1997, 34(1):53-73.
27. Hartley J: Case studies in organisational research. Qualitative methods in
organizational research London: Sage PublicationsCassell C, Symon G 1994.
28. Campbell D, Stanley J: Experimental And Quasi-experimental Designs For
Research Skokie Illinois: Rand-McNally 1963.
29. Ferlie E: Organisational studies. Studying the Organisation and Delivery of
Health Services: Research Methods London: RoutledgeFulop N, Allen P, Clarke
A, Black N 2001, 25-39.
30. Chen H-T, Rossi P: The theory-driven approach to validity. Evaluation and
Program Planning 1987, 10:95-103.
31. Anonymous: The origins of theory-based evaluation. Evaluation Practice
1996, 17(2):169-171.
32. Weiss C: What kind of evidence in Evidence-Based policy?. Third
International, Inter-disciplinary Evidence-Based Policies and Indicator Systems
Conference, July 2001 Durham. CEM Centre, University of Durham 2001.
33. Pawson R, Tilley N: Realistic Evaluation London: Sage 1997.
34. Pawson R: Evidence-based policy. A realist perspective London: Sage 2006.
35. Harrison S: Policy analysis. Studying the Organisation and Delivery of Health
Services: Research Methods London: RoutledgeFulop N, Allen P, Clarke A,
Black N 2001, 90-106.
36. Julnes G, Mark M, Henry G: Promoting realism in evaluation. Evaluation
1998, 4(4):483-504.
37. Leone L: Realistic evaluation of an illicit drug deterrence programme.
Evaluation 2008, 14(1):19-28.
38. Koenig G: Realistic evaluation and case studies: stretching the potential.
Evaluation 2009, 15(1):9-30.
39. Davis P: The limits of realistic evaluation. Evaluation 2005, 11(3):275-295.
40. Byng R: Using realistic evaluation to evaluate a practice-level
intervention to improve primary healthcare for patients with long-term
mental illness. Evaluation 2005, 11(1):69-93.
41. Blamey A, Mackenzie M: Theories of change and realistic evaluation. Peas
in a pod or apples and oranges?. Evaluation 2007, 13:439-455.
42. Costner H: The validity of conclusions in evaluation research: a further
development of Chen and Rossi’s theory-driven approach. Evaluation and
Program Planning 1989, 12:345-353.
43. Chen H-T: The theory-driven perspective. Evaluation and Program Planning
1989, 12:297.
44. Hallett M, Rogers R: The push for ‘Truth in sentencing’: evaluating
competing stakeholder constructions: the case for contextualism in
evaluation research. Evaluation and Program Planning 1994, 17:187-196.
45. Byng R: Using the ‘Realistic evaluation’ framework to make a
retrospective qualitative evaluation of a practice level intervention to
improve primary care for patients with long-term mental illness. The
2002 EES Conference Three movements in Contemporary Evaluation: Learning,
Theory and Evidence October 10-12: 2002 European Evaluation Society 2002.
46. Blaise P, Kegels G: A realistic approach to the evaluation of the quality
management movement in health care systems: a comparison between
European and African contexts based on Mintzberg’s organizational
models. Int J Health Plann Manage 2004, 19(4):337-364.
47. Cole G: Advancing the development and application of theory-based
evaluation in the practice of public health. American Journal of Evaluation
1999, 20:453-470.
48. Chen H-T, Rossi P: Issues in the theory-driven perspective. Evaluation and
Program Planning 1989, 12(4):299-306.
49. Takeuchi R, Chen G, Lepak D: Through the looking glass of a social
system: cross-level effects of high-performance work systems on
employees’ attitudes. Personnel Psychology 2009, 62:1-29.
50. Donaldson S: Program theory-driven evaluation science. Strategies and
applications New York: Lawrence Erlbaum Associates 2007.
51. Chen H-T: Practical program evaluation Thousand Oaks: SAGE Publications
2005.
52. Merton RK: Social theory and social structure New York: The Free Press 1968.
53. Lipsey M, Pollard J: Driving toward theory in program evaluation: more
models to choose from. Evaluation and Program Planning 1989,
12:317-328.
54. Rosas S: Concept Mapping as a Technique for Program Theory
Development: An Illustration Using Family Support Programs. American
Journal of Evaluation 2005, 26:389-401.
55. Barnes M, Matka E, Sullivan H: Evidence, understanding and complexity.
Evaluation in non-linear systems. Evaluation 2003, 9(3):265-284.
56. Pawson R, Tilley N: Realist Evaluation. DPRN Thematic Meeting 2006 Report
on Evaluation Development Policy Review Network 2006.
57. Pfeffer J, Veiga J: Putting people first for organisational success. The
Academy of Management Executive 1999, 13(2):37-48.
58. Whitener E: Do “high commitment” human resource practices affect
employee commitment? A cross-level analysis using hierarchical linear
modeling. Journal of Management 2001, 27(5):515.
59. Richardson R, Thompson M: The impact of people management practices
on business performance: a literature review. London: Institute of
Personnel and Development 1999.
60. Porter L, Steers R, Mowday R, Boulina P: Organizational commitment, job
satisfaction, and turn-over among psychiatric technicians. Journal of
Applied Psychology 1974, 59:603-609.
Marchal et al. BMC Health Services Research 2010, 10:24
http://www.biomedcentral.com/1472-6963/10/24
Page 13 of 14
315
61. Steers RM: Antecedents and outcomes of organisational commitment.
Administrative Science Quarterly 1977, 22:46-56.
62. Marchal B, Kegels G: Focusing on the software of managing health
workers: What can we learn from high commitment management
practices?. International Journal of Health Planning and Management 2008,
23(4):299-311.
63. Cameron KS, Quinn R: Diagnosing and changing organizational culture San
Francisco: Jossey-Bass 2006.
64. Bossert T: Methodological guidelines for applied research on
decentralisation of health systems in Latin America. LAC HSR Health
sector reform initiative 2000.
65. Edgar F, Geare A: HRM practice and employee attitudes: different
measures - different results. Personnel Review 2005, 34(5):534-549.
66. Chen H-T: Theory-driven evaluations Newbury Park, California: Sage
Publications, 1 1990.
67. Schneider B, Gunnarson S, Niles-Jolly K: Creating the climate and culture
of success. Organisational Dynamics 2004, 23(1):17-29.
68. Schein E: Organizational culture. American Psychologist 1990, 45(2):109-119.
69. Eisenberger R, Fasolo P, Davis-laMastro V: Perceived organisational support
and employee diligence, commitment and innovation. Journal of Applied
Psychology 1990, 75:51-59.
70. Podsakoff P, MacKenzie S, Beth Paine J, Bachrach D: Organisational
citizenship behaviors: a critical review of the theoretical and empirical
literature and suggestions for future research. Journal of Management
2000, 26(3):513-563.
71. Marchington M, Grugulis I: “Best practice” human resource management:
perfect opportunity of dangerous illusion?. International Journal of Human
Resource Management 2000, 11(6):1104-1124.
72. Walton R: From control to commitment in the workplace. Harv Bus Rev
1985, (March-April), DOI: 10.1225/85219.
73. Evans W, Davis W: High-performance work systems and organisational
performance: the mediating role of internal social structure. Journal of
Management 2005, 31(5):758-775.
74. Granovettter M: The strength of weak ties: a network theory revisited.
Sociological Theory 1983, 1:201-233.
75. Eisenberger R, Huntington R, Hutchison S, Sowa D: Perceived
organisational support. Journal of Applied Psychology 1986, 71(3):500-507.
76. Sanderson I: Is it ‘What works’ that matters? Evaluation and evidence-
based policy making. Scott Policy Seminar - Economic Research Institute
of Northern Ireland, Undated.
77. Stame N: Theory-based evaluation and types of complexity. Evaluation
2004, 10(1):58-76.
78. Weiss C: The many meanings of research utilization. Public Administration
Review 1979, 39(5):426-431.
79. Knaap Van Der P: Theory-based evaluation and learning: possibilities and
challenges. Evaluation 2004, 10(1):16-34.
80. Pedersen L, Rieper O: Is realist evaluation a realistic approach for
complex reforms?. Evaluation 2008, 14(3):271-293.
Pre-publication history
The pre-publication history for this paper can be accessed here:http://www.
biomedcentral.com/1472-6963/10/24/prepub
doi:10.1186/1472-6963-10-24Cite this article as: Marchal et al.: A realist evaluation of themanagement of a well- performing regional hospital in Ghana. BMCHealth Services Research 2010 10:24.
Submit your next manuscript to BioMed Centraland take full advantage of:
• Convenient online submission
• Thorough peer review
• No space constraints or color figure charges
• Immediate publication on acceptance
• Inclusion in PubMed, CAS, Scopus and Google Scholar
• Research which is freely available for redistribution
Submit your manuscript at www.biomedcentral.com/submit
Marchal et al. BMC Health Services Research 2010, 10:24
http://www.biomedcentral.com/1472-6963/10/24
Page 14 of 14
316