4 points of growth executing our strategy
TRANSCRIPT

Click to edit Master title style
Wajax Corporation Annual Meeting (May 3, 2016) Page 1
4 POINTS OF GROWTH
EXECUTING OUR STRATEGY Wajax Corporation – Annual Meeting (May 3, 2016)

Click to edit Master title style
Wajax Corporation Annual Meeting (May 3, 2016) Page 2
Forward-Looking Statements
This presentation contains certain forward-looking statements and forward-looking information, as defined in applicable securities laws (collectively, “forward-
looking statements”). These forward-looking statements relate to future events or the Corporation’s future performance. All statements other than statements of
historical fact are forward-looking statements. Often, but not always, forward-looking statements can be identified by the use of words such as “plans”, “anticipates”,
“intends”, “predicts”, “expects”, “is expected”, “scheduled”, “believes”, “estimates”, “projects” or “forecasts”, or variations of, or the negatives of, such words and
phrases or state that certain actions, events or results “may”, “could”, “would”, “should”, “might” or “will” be taken, occur or be achieved. Forward-looking statements
involve known and unknown risks, uncertainties and other factors beyond the Corporation’s ability to predict or control which may cause actual results,
performance and achievements to differ materially from those anticipated or implied in such forward-looking statements. There can be no assurance that any
forward-looking statement will materialize. Accordingly, readers should not place undue reliance on forward-looking statements. The forward-looking statements in
this presentation are made as of the date of this presentation, reflect management’s current beliefs and are based on information currently available to
management. Although management believes that the expectations represented in such forward-looking statements are reasonable, there is no assurance that
such expectations will prove to be correct. Specifically, this presentation includes forward-looking statements regarding, among other things, maintaining our
leverage within reasonable tolerance of our target leverage ratio range of 1.5 – 2.0 times; our ongoing conservatism with respect to capital budgets and
discretionary investments; our outlook for 2016, including the expected effect of difficult market conditions in western Canada and reduced resource customer
capital and operating expenditures, our expectation for year-over-year earnings in the first and the second halves of 2016; our confidence in the enhanced earnings
potential presented by the execution of our 4 Points of Growth strategy by the reorganized Wajax; our expectation that we will deliver four large mining shovels to
customers in 2016; our 4 Points of Growth strategy and the goals for such strategy, including our goal of becoming Canada’s leading industrial products and
services provider; our “4 Points of Growth” framework to grow the corporation, including the use of engineered repair services (ERS) acquisitions to accelerate
such growth, and our intention to allocate up to $100 million in capital to the acquisition of ERS companies between 2015 and 2019; our planned strategic
reorganization and the benefits we expect to achieve therefrom, including, without limitation, improved operational leverage, estimated cost savings, and the
enhanced ability to execute our growth strategy; and the current amount of our dividend being sustainable throughout our expectations of a negative cycle. These
statements are based on a number of assumptions which may prove to be incorrect, including, but not limited to, assumptions regarding general business and
economic conditions; the supply and demand for, and the level and volatility of prices for, oil and other commodities; financial market conditions, including interest
rates; our ability to execute our 4 Points of Growth strategy, including our ability to develop our core capabilities, execute on our organic growth priorities, complete
and effectively integrate acquisitions and to successfully implement new information technology platforms, systems and software; our ability to execute our
strategic reorganization and realize the benefits therefrom, including cost savings and productivity gains; the future financial performance of the Corporation; our
costs; market competition; our ability to attract and retain skilled staff; our ability to procure quality products and inventory; and our ongoing relations with suppliers,
employees and customers. The foregoing list of assumptions is not exhaustive. Factors that may cause actual results to vary materially include, but are not limited
to, a deterioration in general business and economic conditions; volatility in the supply and demand for, and the level of prices for, oil and other commodities; a
continued or prolonged decrease in the price of oil; fluctuations in financial market conditions, including interest rates; the level of demand for, and prices of, the
products and services we offer; levels of customer confidence and spending; market acceptance of the products we offer; termination of distribution or original
equipment manufacturer agreements; unanticipated operational difficulties (including failure of plant, equipment or processes to operate in accordance with
specifications or expectations, cost escalation, our inability to reduce costs in response to slow-downs in market activity, unavailability of quality products or
inventory, supply disruptions, job action and unanticipated events related to health, safety and environmental matters), our ability to attract and retain skilled staff
and our ability to maintain our relationships with suppliers, employees and customers. The foregoing list of factors is not exhaustive. The forward-looking
statements contained in this presentation are expressly qualified in their entirety by this cautionary statement. The Corporation does not undertake any obligation to
publicly update such forward-looking statements to reflect new information, subsequent events or otherwise unless so required by applicable securities laws.
Further information concerning the risks and uncertainties associated with these forward-looking statements and the Corporation’s business may be found in our
Annual Information Form for the year ended December 31, 2015, filed on SEDAR.
Click to edit Master title style
Wajax Corporation Annual Meeting (May 3, 2016) Page 3
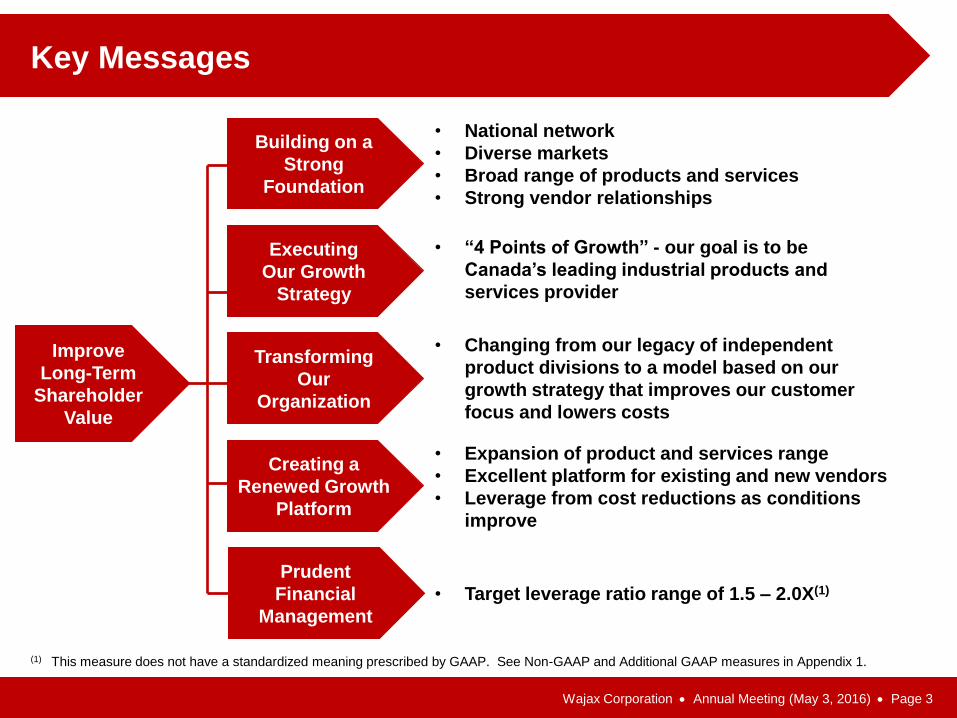
Key Messages
Transforming
Our
Organization
Executing
Our Growth
Strategy
Improve
Long-Term
Shareholder
Value
Building on a
Strong
Foundation
Creating a
Renewed Growth
Platform
• Target leverage ratio range of 1.5 – 2.0X(1)
Prudent
Financial
Management
(1) This measure does not have a standardized meaning prescribed by GAAP. See Non-GAAP and Additional GAAP measures in Appendix 1.
• Expansion of product and services range
• Excellent platform for existing and new vendors
• Leverage from cost reductions as conditions
improve
• “4 Points of Growth” - our goal is to be
Canada’s leading industrial products and
services provider
• Changing from our legacy of independent
product divisions to a model based on our
growth strategy that improves our customer
focus and lowers costs
• National network
• Diverse markets
• Broad range of products and services
• Strong vendor relationships
Click to edit Master title style
Wajax Corporation Annual Meeting (May 3, 2016) Page 4
Financial Performance

Click to edit Master title style
Wajax Corporation Annual Meeting (May 3, 2016) Page 5
Financial Performance
4-Year Revenue CAGR: -1.9%
1,377.1
1,466.0
1,428.5 1,451.3
1,273.3
1,000
1,100
1,200
1,300
1,400
1,500
2011 2012 2013 2014 2015
($M
illi
on
s)
Revenue
63.8 65.9
47.7 41.2
-11.0
27.8
7.7% 7.6%
6.7% 6.3%
2.5%
0%
1%
2%
3%
4%
5%
6%
7%
8%
-20
-10
0
10
20
30
40
50
60
70
80
2011 2012 2013 2014 2015 2015Adjusted
Pe
rce
nt
($M
illi
on
s)
Net Earnings EBITDA Margin(1)
4-Year Adjusted Net Earnings(1) CAGR: -18.7%
(1) This measure does not have a standardized meaning prescribed by GAAP. See Non-GAAP and Additional GAAP measures in Appendix 1.
(1)
Major YoY Performance Drivers:
• Commodity market weakness since peak earnings year of 2012
• 2015: significant decline in western Canada.
5.9%

Click to edit Master title style
Wajax Corporation Annual Meeting (May 3, 2016) Page 6
2016 Outlook
Our outlook for 2016 is that market conditions will remain very challenging.
‒ We continue to expect that earnings will be under significant pressure due
to difficult market conditions in western Canada and resource customer
capital and operating expenditure reductions.
We expect lower year-over-year earnings in the first half of 2016.(1)
During the second half of this year, earnings are expected to improve, driven
by customer equipment deliveries and cost reductions(2).
The current quarterly dividend amount of $0.25 per share was established in
March 2015 at a level that is believed sustainable through expectations of a
negative cycle.(3)
While conditions remain challenging, we are very confident in the enhanced
earnings potential from the execution of our 4 Points of Growth strategy in a
reorganized Corporation.
(1) Excluding the impact of the Q1 2016 $12.5 million restructuring provision.
(2) Excluding the impact of the $41.2 million 2015 goodwill and intangible asset impairment.
(3) We will continue to consider the amount of our dividend quarterly, taking into account the Corporation’s forecasted earnings, leverage and
other investment opportunities.

Click to edit Master title style
Wajax Corporation Annual Meeting (May 3, 2016) Page 7
2016 Q1 Consolidated Results
Revenue
($M)
317.2 285.0
0
100
200
300
400
2015 2016
YOY 2016 Change: -10.2%
Decline driven by lower volumes in
Western Canada:
Rest of
West Canada Total
WE 21% 1% 12%
WPS 48% 14% 16%
WIC 16% 5% 3%
Total % of
Revenue 27% 5% 10%

Click to edit Master title style
Wajax Corporation Annual Meeting (May 3, 2016) Page 8
2016 Q1 Segment Earnings(1)
6.8 6.7
0
5
10
2015 2016
3.4
-2.6 -3
-2
-1
0
1
2
3
4
2015 2016
3.4
1.3
0
1
2
3
4
2015 2016
YOY 2016 Change:
Revenue: -12.1% YOY 2016 Change:
Revenue: -15.7%
YOY 2016 Change:
Revenue: -2.9%
(1) Earnings before finance costs and income taxes.
Equipment
Industrial
Components Power Systems
($M)
On expectations, with
improving trend.
Tougher quarter due to
Western Canada, Power
Generation and Central.
Excellent
performance!
Click to edit Master title style
Wajax Corporation Annual Meeting (May 3, 2016) Page 9
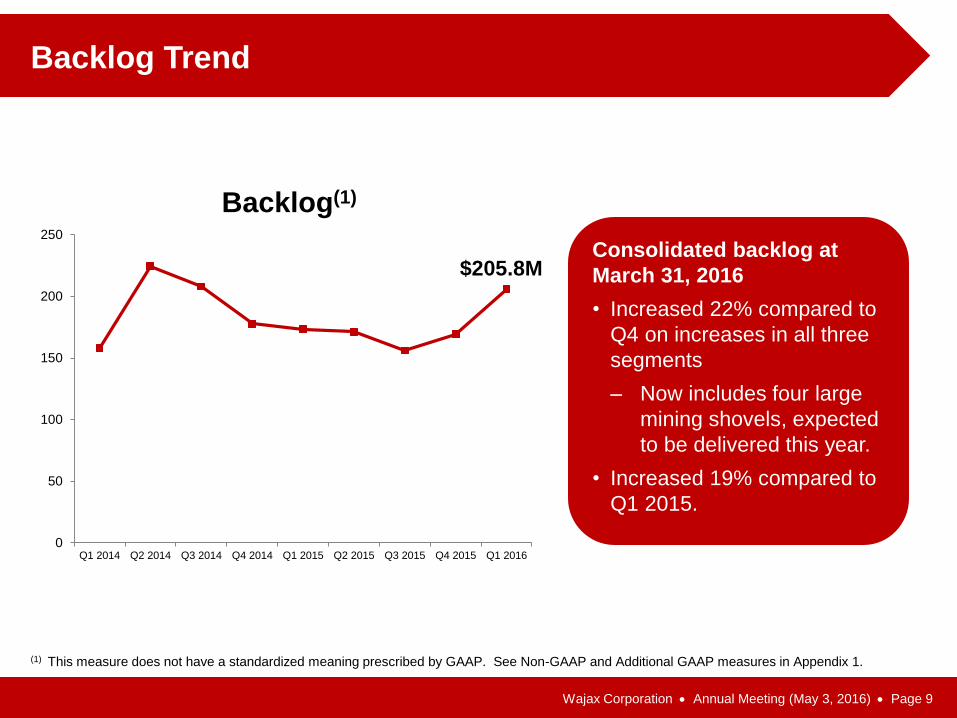
Backlog Trend
Consolidated backlog at
March 31, 2016
• Increased 22% compared to
Q4 on increases in all three
segments
‒ Now includes four large
mining shovels, expected
to be delivered this year.
• Increased 19% compared to
Q1 2015.
$205.8M
0
50
100
150
200
250
Q1 2014 Q2 2014 Q3 2014 Q4 2014 Q1 2015 Q2 2015 Q3 2015 Q4 2015 Q1 2016
Backlog(1)
(1) This measure does not have a standardized meaning prescribed by GAAP. See Non-GAAP and Additional GAAP measures in Appendix 1.

Click to edit Master title style
Wajax Corporation Annual Meeting (May 3, 2016) Page 10
Building on a Strong Foundation

Click to edit Master title style
Wajax Corporation Annual Meeting (May 3, 2016) Page 11
National Network and Diverse Markets
123 branches located to serve major
resource and commercial/industrial markets.
15%
15%
14%
14%
10%
9%
6% 5%
5% 7%
Other Construction
Industrial/
Commercial
Government
and Utilities
Metal
Processing
Oil
Sands
Oil and Gas
Forestry
Mining
Transportation
2015 Revenue by Market
52% 44%
21% 26%
27% 30%
East
Central
West
Revenue by Region
2014 2015

Click to edit Master title style
Wajax Corporation Annual Meeting (May 3, 2016) Page 12
Executing our Growth Strategy
Click to edit Master title style
Wajax Corporation Annual Meeting (May 3, 2016) Page 13
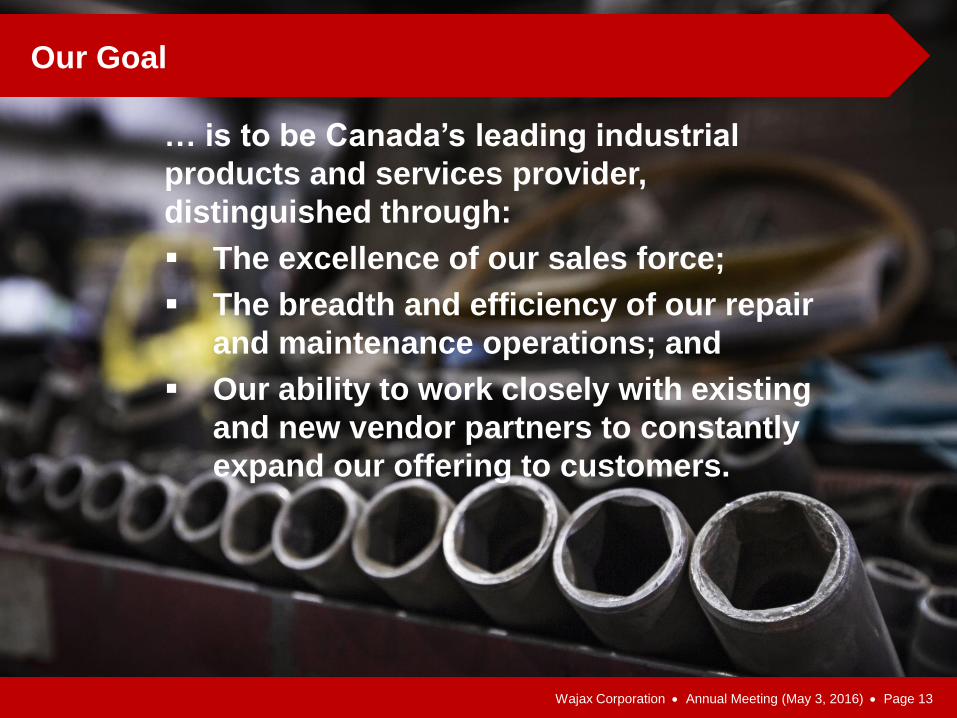
… is to be Canada’s leading industrial
products and services provider,
distinguished through:
The excellence of our sales force;
The breadth and efficiency of our repair
and maintenance operations; and
Our ability to work closely with existing
and new vendor partners to constantly
expand our offering to customers.
Our Goal

Click to edit Master title style
Wajax Corporation Annual Meeting (May 3, 2016) Page 14
Execute Strategy - 4 Points of Growth
(1) Engineered Repair Services.
• Programs covering ~50% of current
revenue base and accounting for
majority of expected growth
• Tuck-under acquisitions to
accelerate growth of ERS(1)
Core Capabilities
Organic Growth
Acquisitions
• Common systems to increase
customer insight and improve
future cost productivity
Systems
• Organizational skills that drive
growth and create value for
customers and vendor partners
Click to edit Master title style
Wajax Corporation Annual Meeting (May 3, 2016) Page 15
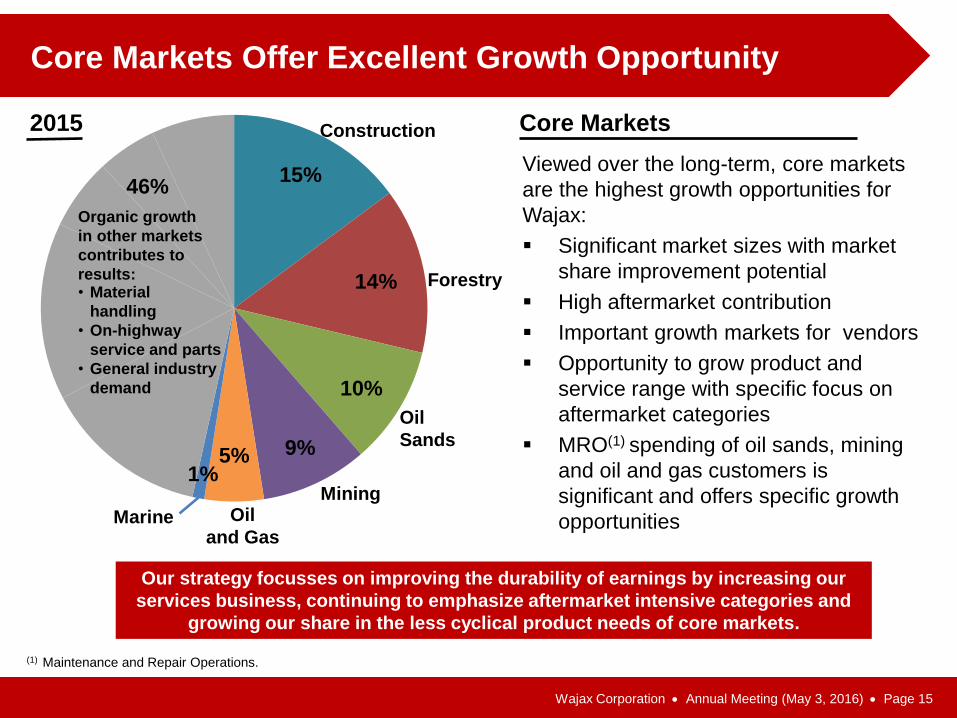
Core Markets Offer Excellent Growth Opportunity
Viewed over the long-term, core markets
are the highest growth opportunities for
Wajax:
Significant market sizes with market
share improvement potential
High aftermarket contribution
Important growth markets for vendors
Opportunity to grow product and
service range with specific focus on
aftermarket categories
MRO(1) spending of oil sands, mining
and oil and gas customers is
significant and offers specific growth
opportunities
Core Markets
(1) Maintenance and Repair Operations.
15%
14%
10%
9% 5% 1%
Construction
Oil
Sands
Oil
and Gas
Forestry
Mining
Organic growth
in other markets
contributes to
results: • Material
handling
• On-highway
service and parts
• General industry
demand
Marine
Our strategy focusses on improving the durability of earnings by increasing our
services business, continuing to emphasize aftermarket intensive categories and
growing our share in the less cyclical product needs of core markets.
2015
46%

Click to edit Master title style
Wajax Corporation Annual Meeting (May 3, 2016) Page 16
Core Capabilities – Organizational Skills to Drive Growth
Objective:
To work closely with existing
and new vendor partners to
constantly expand our
offering to our customers.
Objective:
To achieve significant
improvement and ultimately
leadership in repair operations
in terms of safety, customer
service, breadth of repair
services and profitability.
Objective:
To distinguish Wajax to our
customers and vendors
through the excellence of
our sales force.
• Technical and selling
skills
• CRM technology
• Major customer teams
Sales Force
Repair and
Maintenance
Operations
Product and
Vendor
Development

Click to edit Master title style
Wajax Corporation Annual Meeting (May 3, 2016) Page 17
Balanced Organic Growth(1)
(1) See the Corporation’s 2015 Annual Report for further information on many of these programs.
Mining (Including Oil Sands) Construction Forestry
Marine Power Generation
We estimate that the majority of our revenue growth will come
from gains in our core business product and service categories.
Engineered Repair Services
Click to edit Master title style
Wajax Corporation Annual Meeting (May 3, 2016) Page 18
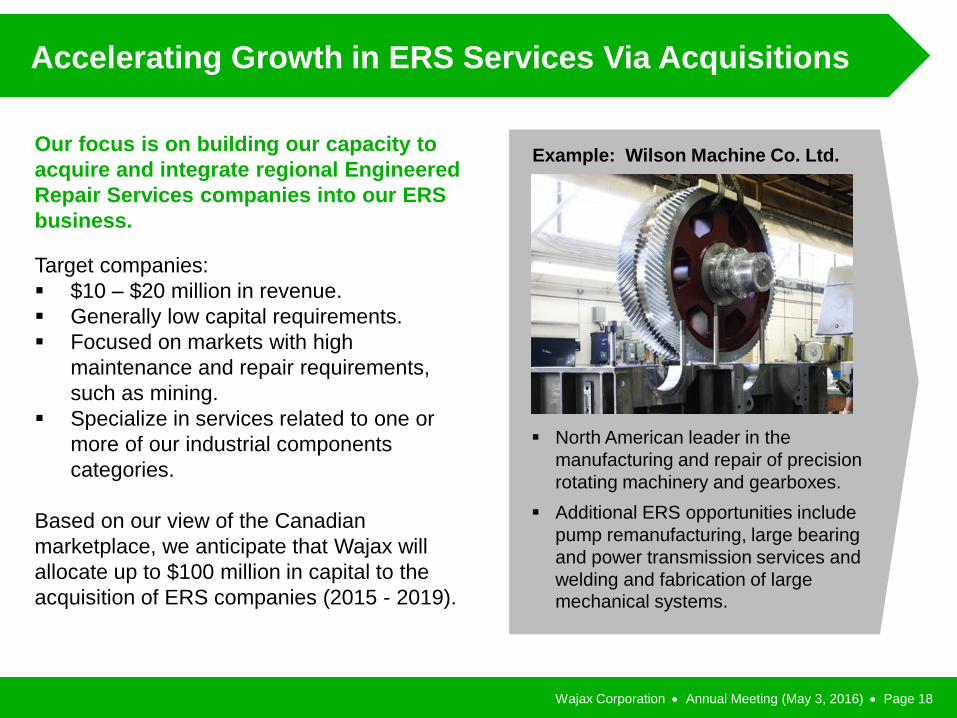
Accelerating Growth in ERS Services Via Acquisitions
Our focus is on building our capacity to
acquire and integrate regional Engineered
Repair Services companies into our ERS
business.
Target companies:
$10 – $20 million in revenue.
Generally low capital requirements.
Focused on markets with high
maintenance and repair requirements,
such as mining.
Specialize in services related to one or
more of our industrial components
categories.
Based on our view of the Canadian
marketplace, we anticipate that Wajax will
allocate up to $100 million in capital to the
acquisition of ERS companies (2015 - 2019).
North American leader in the
manufacturing and repair of precision
rotating machinery and gearboxes.
Additional ERS opportunities include
pump remanufacturing, large bearing
and power transmission services and
welding and fabrication of large mechanical systems.
Example: Wilson Machine Co. Ltd.

Click to edit Master title style
Wajax Corporation Annual Meeting (May 3, 2016) Page 19
Transforming Our Organization
Click to edit Master title style
Wajax Corporation Annual Meeting (May 3, 2016) Page 20
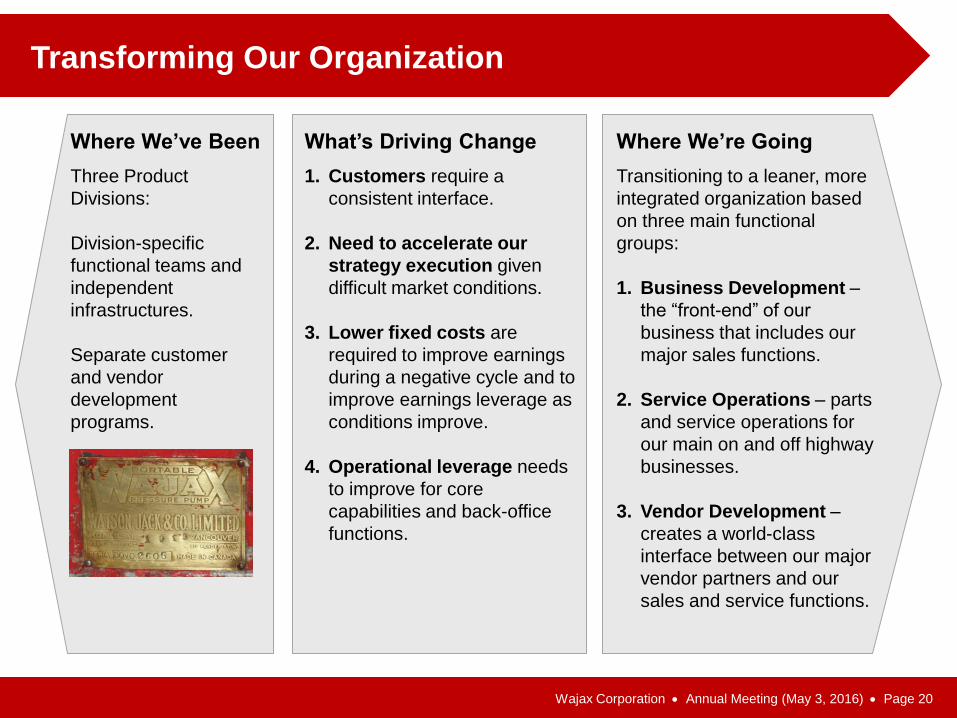
Transforming Our Organization
What’s Driving Change Where We’re Going
1. Customers require a
consistent interface.
2. Need to accelerate our
strategy execution given
difficult market conditions.
3. Lower fixed costs are
required to improve earnings
during a negative cycle and to
improve earnings leverage as
conditions improve.
4. Operational leverage needs
to improve for core
capabilities and back-office
functions.
Transitioning to a leaner, more
integrated organization based
on three main functional
groups:
1. Business Development –
the “front-end” of our
business that includes our
major sales functions.
2. Service Operations – parts
and service operations for
our main on and off highway
businesses.
3. Vendor Development –
creates a world-class
interface between our major
vendor partners and our
sales and service functions.
Where We’ve Been
Three Product
Divisions:
Division-specific
functional teams and
independent
infrastructures.
Separate customer
and vendor
development
programs.

Click to edit Master title style
Wajax Corporation Annual Meeting (May 3, 2016) Page 21
Transforming Our Organization
1. Customers – consistent
support and access to full
range of products, services
and technical resources.
2. Vendors – improved
planning and execution and
access to complete customer
list and full range of Wajax
sales, service and technical
resources.
3. Investors – improved
strategy execution and lower
costs.
Benefits of Change
1.2% improvement in Adjusted EBITDA
margin based on 2015 revenue
7.6%
6.7% 6.5% 5.9%
7.1%
1,466
1,428
1,451
1,273
1150
1200
1250
1300
1350
1400
1450
1500
0%
2%
4%
6%
8%
10%
2012 2013 2014 2015Adjusted
2015Pro formaAdjusted
EBITDA(1)
%
Revenue
($M)
Pro forma Impact of Estimated Cost
Reductions of $15M Applied to 2015
Adjusted EBITDA(1)
(1)
(1) This measure does not have a standardized meaning prescribed by GAAP. See Non-GAAP and Additional GAAP measures in Appendix 1.
(1)
Click to edit Master title style
Wajax Corporation Annual Meeting (May 3, 2016) Page 22
Why Invest?
Click to edit Master title style
Wajax Corporation Annual Meeting (May 3, 2016) Page 23
Why Invest ?
Solid foundation
Renewed growth strategy
– 4 Points of Growth
– New Organizational Model
Strongly differentiated within the industry
Positioned to benefit from improvements in market conditions
Dividend(1)
(1) Quarterly dividend of $0.25 per share considered sustainable during the Corporation’s expectations of a negative cycle but will be reviewed quarterly
considering earnings, leverage and other investment opportunities.

Click to edit Master title style
Wajax Corporation Annual Meeting (May 3, 2016) Page 24
Appendices
Click to edit Master title style
Wajax Corporation Annual Meeting (May 3, 2016) Page 25
Appendix 1 – Non-GAAP and Additional GAAP Measures
This Investor Presentation contains certain non-GAAP and additional GAAP measures that do not have a standardized meaning prescribed by GAAP. Therefore, these
financial measures may not be comparable to similar measures presented by other issuers. The Corporation’s calculation of Pro forma Adjusted EBITDA includes an
adjustment based on assumptions and estimates that may prove to have been inaccurate. Investors are cautioned that these measures should not be construed as an
alternative to net earnings or to cash flow from operating, investing, and financing activities determined in accordance with GAAP as indicators of the Corporation’s
performance. The Corporation’s management believes that:
i. these measures are commonly reported and widely used by investors and management,
ii. the non-GAAP measures are commonly used as an indicator of a company’s cash operating performance, profitability and ability to raise and service debt, and
iii.the additional GAAP measures are commonly used to assess a company’s earnings performance excluding its capital, tax structures, goodwill and intangible assets
impairment and restructuring costs.
iv.“Adjusted net earnings” provide indications of the results by the Corporation’s principal business activities prior to recognizing goodwill and intangible assets
impairment and restructuring costs that are outside the Corporation’s normal course of business. “Adjusted EBITDA” excludes goodwill and intangible assets
impairment and restructuring costs.
v. “Pro forma Adjusted EBITDA” differs from the term “Adjusted EBITDA” in that it also includes the pro forma effect of the anticipated annual cost savings of
approximately $15 million related to the Corporation’s new structure assuming the transition to the new structure was successfully completed and effective at the
beginning of 2015. “Pro forma Adjusted EBITDA” provides an indication of the Corporation’s principal business activities assuming the transition to the new structure
was successfully completed and effective at the beginning of 2015 and prior to recognizing goodwill and intangible assets impairment and restructuring costs that are
outside the Corporation’s normal course of business. On March 1, 2016, Wajax announced that it will be transitioning from its current three independent product
divisions to a leaner and more integrated organization based on three main functional groups: business development, service operations and vendor development.
The new structure is intended to improve Wajax’s cross-company customer focus, closely align resources to the 4 Points of Growth strategy, improve operational
leverage, and lower costs through productivity gains and the elimination of redundancy inherent in the current structure.

Click to edit Master title style
Wajax Corporation Annual Meeting (May 3, 2016) Page 26
Appendix 1 – Non-GAAP and Additional GAAP Measures
Reconciliation of the Corporation’s net (loss) earnings to adjusted net earnings and basic and diluted adjusted earnings per share is as follows:
(1) Goodwill and intangible assets impairment of $41.2 million ($37.3 million after-tax) was recorded in 2015, comprised of $13.7 million related to the Power Systems segment and $27.5 million
related to the Industrial Components segment. As a result, the carrying value of goodwill and intangible assets of each segment approximates their recoverable amounts as at December
31, 2015 of $nil in the Power Systems segment and $18.3 million in the Industrial Components segment. The recoverable amounts assumed that weakness in oil and gas activity in western
Canada continues. (2) Restructuring costs of $2.1 million ($1.5 million after-tax), consisting of severance costs, were recorded in the second quarter of 2015 in the Power Systems segment. The Power Systems’
restructuring plan is anticipated to be completed by the first quarter of 2016 and is expected to result in annualized savings of approximately $7.4 million. In 2014, the Industrial
Components segment recorded restructuring costs of $2.8 million ($2.1 million after-tax) as part of its plan to simplify and improve the effectiveness of the sales force and branch
management organization.
Twelve months ended
December 31
2015 2014
Net (loss) earnings $ (11.0) $ 41.2
Goodwill and intangible assets impairment, after tax (1) 37.3 -
Restructuring costs, after-tax (2) 1.5 2.1
Adjusted net earnings $ 27.8 $ 43.3
Non-GAAP financial measures are identified and defined below: EBITDA Net earnings before finance costs, income tax expense, depreciation and amortization.
Adjusted net earnings Net earnings before after tax goodwill and intangible assets impairment and restructuring costs.
Adjusted EBITDA EBITDA before goodwill and intangible assets impairment and restructuring costs.
Pro forma Adjusted EBITDA Adjusted EBITDA including the pro forma effect of the anticipated annual restructuring cost savings of approximately $15
million as if the transition to the new structure was successfully completed and effective at the beginning 2015.
EBITDA Margin EBITDA divided by Revenue
Adjusted EBITDA Margin Adjusted EBITDA divided by Revenue
Pro forma Adjusted EBITDA Margin Pro forma Adjusted EBITDA divided by Revenue
Leverage ratio The leverage ratio is defined as debt at the end of a particular quarter divided by trailing 12-month Adjusted EBITDA. The
Corporation’s objective is to maintain this ratio between 1.5 times and 2.0 times.
Debt Debt includes bank indebtedness, long-term debt, obligations under finance leases and letters of credit, net of cash. Debt is
a component relevant in calculating the Corporation’s Leverage Ratio, which is a non-GAAP measure commonly used as a
an indicator of a company’s ability to raise and service debt.
Backlog
Backlog includes the total sales value of customer purchase commitments for future delivery or commissioning or equipment,
parts and related services.
Additional GAAP measures are identified and defined below: Earnings before finance costs and income taxes
(EBIT)
Earnings before finance costs and income taxes, as presented on the Consolidated Statements of Earnings.
Earnings before income taxes (EBT) Earnings before income taxes, as presented on the Consolidated Statements of Earnings.
Click to edit Master title style
Wajax Corporation Annual Meeting (May 3, 2016) Page 27
Appendix 1 – Non-GAAP and Additional GAAP Measures
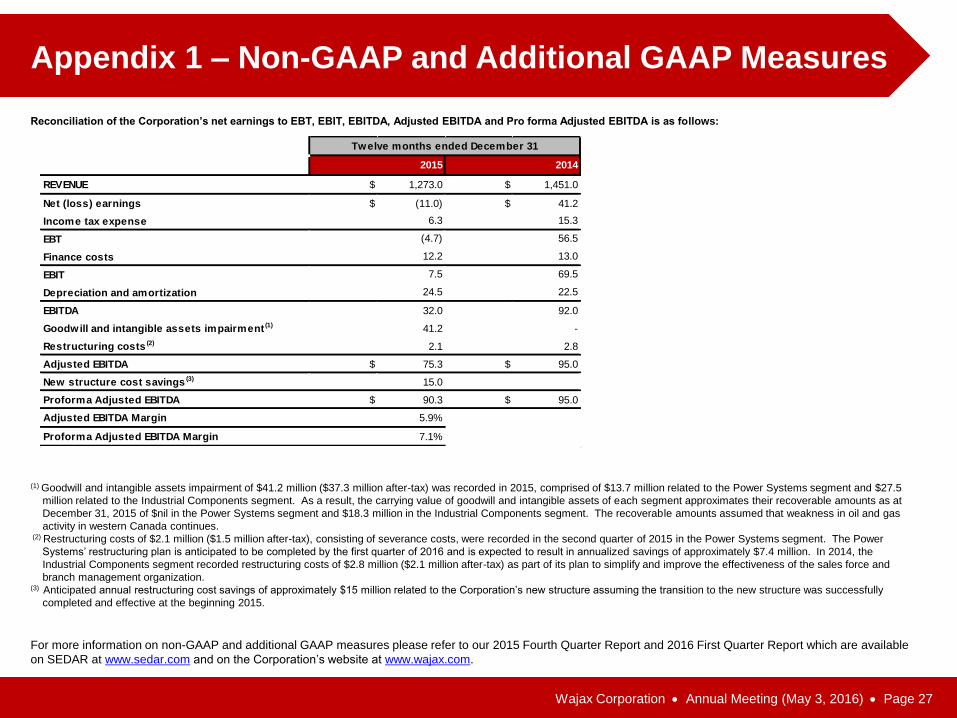
For more information on non-GAAP and additional GAAP measures please refer to our 2015 Fourth Quarter Report and 2016 First Quarter Report which are available
on SEDAR at www.sedar.com and on the Corporation’s website at www.wajax.com.
Reconciliation of the Corporation’s net earnings to EBT, EBIT, EBITDA, Adjusted EBITDA and Pro forma Adjusted EBITDA is as follows:
(1) Goodwill and intangible assets impairment of $41.2 million ($37.3 million after-tax) was recorded in 2015, comprised of $13.7 million related to the Power Systems segment and $27.5
million related to the Industrial Components segment. As a result, the carrying value of goodwill and intangible assets of each segment approximates their recoverable amounts as at
December 31, 2015 of $nil in the Power Systems segment and $18.3 million in the Industrial Components segment. The recoverable amounts assumed that weakness in oil and gas
activity in western Canada continues. (2) Restructuring costs of $2.1 million ($1.5 million after-tax), consisting of severance costs, were recorded in the second quarter of 2015 in the Power Systems segment. The Power
Systems’ restructuring plan is anticipated to be completed by the first quarter of 2016 and is expected to result in annualized savings of approximately $7.4 million. In 2014, the
Industrial Components segment recorded restructuring costs of $2.8 million ($2.1 million after-tax) as part of its plan to simplify and improve the effectiveness of the sales force and
branch management organization. (3) Anticipated annual restructuring cost savings of approximately $15 million related to the Corporation’s new structure assuming the transition to the new structure was successfully
completed and effective at the beginning 2015.
REVENUE $ 1,273.0 $ 1,451.0
Net (loss) earnings $ (11.0) $ 41.2
Income tax expense
EBT
Finance costs
EBIT
Depreciation and amortization
EBITDA 32.0 92.0
Goodwill and intangible assets impairment (1) 41.2 -
Restructuring costs (2) 2.1 2.8
Adjusted EBITDA $ 75.3 $ 95.0
New structure cost savings (3) 15.0
Proforma Adjusted EBITDA $ 90.3 $ 95.0
Adjusted EBITDA Margin 5.9%
Proforma Adjusted EBITDA Margin 7.1%
12.2 13.0
7.5 69.5
24.5 22.5
Twelve months ended December 31
2015 2014
6.3 15.3
(4.7) 56.5