4 sample project - mr. gilmartin's classroom · 4 sample project this maths studies project...
TRANSCRIPT

Sample project 4© Oxford University Press 2012: this may be reproduced for class use solely for the purchaser’s institute 1
Sample project4This Maths Studies project has been graded by a moderator. As you
read through it, you will see comments from the moderator in boxes like this:
Moderator’s comment:
At the end of the sample project is a summary of the moderator’s grades, showing
how the project has been graded against all the criteria A to G. These criteria are
explained in detail in chapter 13 of the Mathematical Studies textbook.
Reading projects and the moderator’s comments will help you to see where marks
are gained and lost, and will give you helpful tips in writing your own project.
Are the heights of daisies in my back garden normally distributed?
IntroductionIt is stated that many events follow a normal distribution and that it is the most important continuous distribution. While gazing out at the back garden looking at all the daisies growing in the grass, I wondered if the heights of the daisies would follow a normal distribution. So, for my project I am going to collect as many daisies from my back garden as I can and test if their heights follow a normal distribution. I will cut the daisies off at the bottom, lay them fl at on a piece of paper and measure them with a ruler to the nearest millimetre. I will measure them from the bottom of the stem to the top of the yellow part of the fl ower.
I will group my data in intervals of equal height and complete a grouped frequency table. With this information I will draw a histogram to fi nd out

Sample project 4© Oxford University Press 2012: this may be reproduced for class use solely for the purchaser’s institute 2
if my data resembles a normal distribution. That means that it will have a sort of bell shape and be symmetrical.
If so, I will fi nd the mean height and the standard deviations of the heights. I will need these values to fi nd the percentage of daisies within one, two and three standard deviations of the mean and compare these values with the percentages within one, two and three standard deviations of the mean in a normal distribution.
I will then use the groups in my frequency table to work out how many daisies I should have expected in each group if the data was normally distributed. Then I will use both values (my frequencies and the calculated ones) to perform a chi-squared goodness of fi t test at the 5% signifi cance level to fi nd out if my data satisfi es a normal distribution.
Data collectionI collected 120 daisies from my garden. I cut the stems as far down as I could and then laid the daisies fl at on a sheet of paper. I marked the bottom of the stem and the top of the fl ower. Then I measured the distance between the two marks correct to the nearest millimetre. Here is a photo of three of the daisies. I just held them fl at to mark the ends but had to put Sellotape on these three so that I could take the photo. In the photo the largest daisy is 11.7 cm, the middle one is 7.1 cm and the smallest one in the photo is 3.2 cm.
My data is as follows, all the measurements are in cm:
3.8 5.6 9.4 11.7 7.7 4.8 4.2 5.6 10.1 7.3
8.1 8.5 9.2 6.3 6.7 7.2 7.1 3.2 2.1 5.0
5.3 8.1 9.2 11.1 8.7 9.3 5.6 6.4 3.4 4.6
4.8 6.9 6.0 6.4 10.6 9.9 9.5 8.8 8.0 8.2
6.9 7.3 7.5 8.2 8.1 8.3 4.8 5.2 5.9 6.0
6.8 6.9 7.1 7.6 8.2 8.2 9.3 9.1 5.5 6.7
6.3 6.6 9.2 6.7 5.7 5.2 5.1 5.9 6.3 6.8
9.1 8.8 9.3 7.0 7.8 7.3 8.0 8.1 8.1 8.1
4.6 4.3 5.5 5.6 10.2 6.9 6.9 8.6 8.9 8.4
6.9 7.2 6.5 6.4 6.5 5.1 5.3 8.4 9.1 8.3
7.7 7.6 7.9 5.4 5.8 5.8 6.9 7.0 7.1 7.8
6.4 7.9 5.6 5.8 7.1 8.4 5.7 5.6 7.3 7.4
Moderator’s comment:
The project has a title,
statement of the task
and a clear and detailed
description of the plan.
Moderator’s comment:
Relevant data has been
collected. The data is
suffi cient in quantity. It
has been set up for use.
The data collected is fairly
simple and there is only
one type of data.

Sample project 4© Oxford University Press 2012: this may be reproduced for class use solely for the purchaser’s institute 3
Next I grouped my data into a grouped frequency table given below and, using Autograph, drew a histogram to represent the heights of the daisies and fi nd out if they followed a normal distribution or not.
Height, h cm Frequency
2 ≤ h < 3 1
3 ≤ h < 4 3
4 ≤ h < 5 7
5 ≤ h < 6 23
6 ≤ h < 7 24
7 ≤ h < 8 22
8 ≤ h < 9 23
9 ≤ h < 10 12
10 ≤ h < 11 3
11 ≤ h < 12 2
The graph looks like this:
height
frequency
3 4 5 6 7 1514131211109821
4
8
10
12
14
16
18
20
22
24
2
6
0
It is not quite bell-shaped but I think that it is close enough to see if my data follows a normal distribution.
Now I need to fi nd the mean and the standard deviation of the heights of the daisies.
The total height is 849.2 cm
So the mean height is 849.2120 =7.08 cm
And the standard deviation is 1.69 cm.
There should be about 68.3% of the heights between one standard deviation above and below the mean, about 95.4% between two standard deviations of the mean and 99.7% between three standard deviations of the mean.
I will check if my data is close to these percentages.
1 standard deviation from the mean is 7.08 – 1.69 = 5.39 cm and 7.08 + 1.69 = 8.77 cm
Moderator’s comment:
Simple process
Moderator’s comment:
Simple process

Sample project 4© Oxford University Press 2012: this may be reproduced for class use solely for the purchaser’s institute 4
Between 5.39 cm and 8.77 cm there are 82 daisies. This is 82120 × 100
= 68.3%. This is exactly the percentage that it should be.
2 standard deviations from the mean is 7.08 – 2 × 1.69 = 3.7 cm and
7.08 + 2 × 1.69 = 10.46 cm
Between 3.7 cm and 10.46 cm there are 113 daisies. This is 113120 × 100 = 94.2%.
This is slightly less than 95.4% but not too far off .
3 standard deviations from the mean is 7.08 – 3 × 1.69 = 2.01 cm and
7.08 + 3 × 1.69 = 12.15 cm
Between 2.01 cm and 12.15 cm are 120 daisies. This is 100% of the daisies which is not too far away from the 99.7% that would be expected.
Now I will perform a chi-squared goodness of fi t test at the 5% signifi cance level to see if my data follows a normal distribution. I will use my GDC to fi nd the expected values for my grouped frequency table. To do this I will fi nd the percentage and multiply the answer by 120. I will give my answers to 1 decimal place. Eg the GDC gives a value of 0.0263 for the percentage between 3 and 4 – when I multiply this by 120 I get 3.1566 and so I will use 3.2 in my table. Because the normal distribution graph has the y-axis as an asymptote I will have to change the end values and use h < 3 and h ≥ 11.
To fi nd the expected values I use the normalcdf function on my GDC and multiply the answer by 120. So, for the fi rst value 120 normalcdf
(0, 3, 7.08, 1.69) = 0.944. I rounded all my answers to 1 decimal place.
Height, h cm Frequency Expected value
0 ≤ h < 3 1 0.9
3 ≤ h < 4 3 3.2
4 ≤ h < 5 7 9.0
5 ≤ h < 6 23 18.3
6 ≤ h < 7 24 26.4
7 ≤ h < 8 22 27.1
8 ≤ h < 9 23 19.8
9 ≤ h < 10 12 10.3
10 ≤ h < 11 3 3.8
h ≥ 11 2 1.2
Since some of my expected values are less than 5, I will have to combine groups.
Height, h cm Frequency Expected value
0 ≤ h < 5 11 13.1
5 ≤ h < 6 23 18.3
6 ≤ h < 7 24 26.4
7 ≤ h < 8 22 27.1
8 ≤ h < 9 23 19.8
9 ≤ h < 10 12 10.3
h ≥ 10 5 5
Moderator’s comment:
Further process, outside
the syllabus but clearly
explained.
Sample project 4© Oxford University Press 2012: this may be reproduced for class use solely for the purchaser’s institute 5
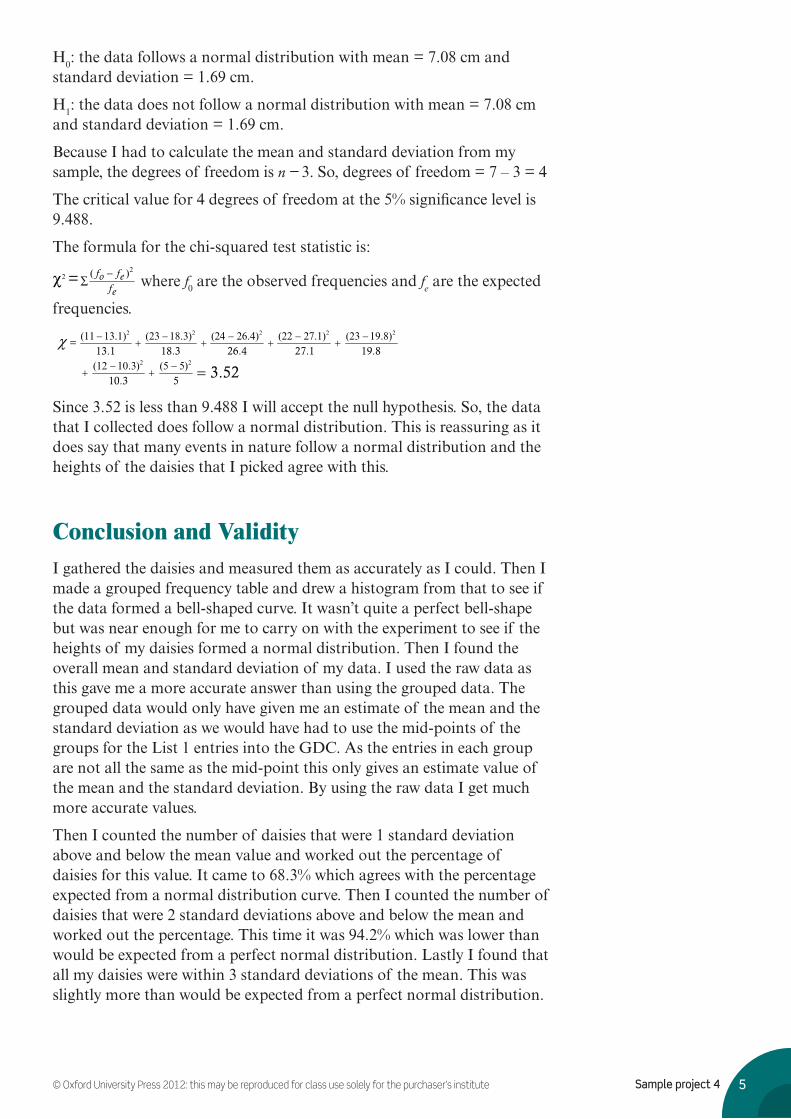
H0: the data follows a normal distribution with mean = 7.08 cm and standard deviation = 1.69 cm.
H1: the data does not follow a normal distribution with mean = 7.08 cm and standard deviation = 1.69 cm.
Because I had to calculate the mean and standard deviation from my sample, the degrees of freedom is n − 3. So, degrees of freedom = 7 – 3 = 4
The critical value for 4 degrees of freedom at the 5% signifi cance level is 9.488.
The formula for the chi-squared test statistic is:
χ −22
= ( )fo fefe
∑ where f0 are the observed frequencies and fe are the expected
frequencies.
13.1 18.3 26.4 27.1 19.8
10.3 53.52
2 2 2 2 2
2 2
(11 13.1) (23 18.3) (24 26.4) (22 27.1) (23 19.8)=
(12 10.3) (5 5)
Since 3.52 is less than 9.488 I will accept the null hypothesis. So, the data that I collected does follow a normal distribution. This is reassuring as it does say that many events in nature follow a normal distribution and the heights of the daisies that I picked agree with this.
Conclusion and ValidityI gathered the daisies and measured them as accurately as I could. Then I made a grouped frequency table and drew a histogram from that to see if the data formed a bell-shaped curve. It wasn’t quite a perfect bell-shape but was near enough for me to carry on with the experiment to see if the heights of my daisies formed a normal distribution. Then I found the overall mean and standard deviation of my data. I used the raw data as this gave me a more accurate answer than using the grouped data. The grouped data would only have given me an estimate of the mean and the standard deviation as we would have had to use the mid-points of the groups for the List 1 entries into the GDC. As the entries in each group are not all the same as the mid-point this only gives an estimate value of the mean and the standard deviation. By using the raw data I get much more accurate values.
Then I counted the number of daisies that were 1 standard deviation above and below the mean value and worked out the percentage of daisies for this value. It came to 68.3% which agrees with the percentage expected from a normal distribution curve. Then I counted the number of daisies that were 2 standard deviations above and below the mean and worked out the percentage. This time it was 94.2% which was lower than would be expected from a perfect normal distribution. Lastly I found that all my daisies were within 3 standard deviations of the mean. This was slightly more than would be expected from a perfect normal distribution.

Sample project 4© Oxford University Press 2012: this may be reproduced for class use solely for the purchaser’s institute 6
After this I decided to test if my grouped data did indeed follow a normal distribution. I used my GDC to work out the expected values. I noticed that some of my expected values were less than 5, and so I had to group my data in a way that did not give me expected values less than 5. This meant grouping the top three groups and the last two groups. Then I used the formula for the chi-squared goodness of fi t test to work out the chi-squared test statistic. This was found to be 3.52 which was less than the critical value of 9.488 and so I could accept my null hypothesis that my data followed a normal distribution. Because I had to calculate the mean and standard deviation from my sample the degrees of freedom were not (n – 1) as is usually the case but (n – 3) instead.
My raw data was collected in my back garden and I did my best to make sure that all the daisies were cut off at the same place – but there could have been some small diff erences in the exact place on the stem that they were cut. Then I laid them fl at and measured with a ruler. I did my best to be as accurate as I could – but again there could have been slight errors in my measurements. However, I do not think that these errors would have made any diff erence to my fi nal result.
My back garden is in the sun most of the day. I could have also picked a sample of daisies that were growing in the shade and compared the heights of these daisies to the heights of the ones that grew in the sun. It would have been interesting to see if their mean height was smaller and if their heights also followed a normal distribution.
Bibliography:Mathematical Studies Course Companion: Bedding, Coad, Forrest, Fussey,
Tokman: OUP, 2007
Su mmary of moderator’s comments
Criterion Grade Comment
A 3 The project does have a title, a statement of the task and a description of the plan
which is completely clear. (3 out of 3 marks awarded.)
B 2 Relevant data has been collected. The data is suffi cient in quantity but not in quality.
However, it has been set up for use. The data collected is fairly simple. There is only
one type of data. (2 marks awarded, out of a possible 3.)
C 5 All the mathematical processes used are accurate and relevant. The further process is
outside the syllabus but, as long as it is clear and relevant to the stated task and the
student understands this process, then it is acceptable. (5 out of 5 marks awarded.)
D 3 The interpretations are consistent with the processes used and there is a thorough
discussion of the results. (3 out of 3 marks awarded.)
E 1 There is an attempt made to discuss the validity of the processes used and the data
collection process. (1 out of 1 mark awarded.)
F 2 The project is structured but explanations could have been more thorough in places.
(2 marks awarded, out of a possible 3.)
G 2 Notation and terminology are correct throughout the project. (2 out of 2 marks awarded)
Total grade 18