4. traffic and transportation4-3 mermaid avenue which is a collector street runs parallel to (and...
TRANSCRIPT

4-1
4. TRAFFIC AND TRANSPORTATION
4.1 Introduction
The study area is bounded by Kings Highway on the north, Riegelmann Boardwalk on the south,
Bay Parkway and West 37th Street on the west, and Coney Island Avenue and West End Avenue
on the east. It has grid-like arterial network structure with two distinct grid systems coming
together at Stillwell Avenue at a 45° angle. Surf Avenue, Mermaid Avenue, Neptune Avenue,
the Shore (Belt) Parkway, and Kings Highway are the main east/west corridors traversing the
Study area, with Coney Island Avenue, Ocean Parkway, McDonald Avenue/Shell Road, and
Stillwell Avenue running north/south. Cropsey Avenue and 86th Street which form the other grid
system run in a north west/south east direction with Bay Parkway at right angle in the north
east/south west direction. Figure 4-1 illustrates the access routes to the study area and its main
corridors.
The street network provides very good vehicular access to and from the study area. The Belt
Parkway is the only regional facility that passes through the area. It provides access to Staten
Island, Long Island, Queens and Brooklyn. It is a major east-west six-lane uninterrupted flow
facility located in the southern portion of the study area with four entrance and exit ramps at Bay
Parkway, Cropsey Avenue, Ocean Parkway and Coney Island Avenue. The Shore (Belt)
Parkway is the main highway (non-commercial traffic only) serving southern Brooklyn from
Gowanus Expressway to the west and the Southern State Parkway in Nassau County to the east,
and it also provides access to John F. Kennedy International Airport. The characteristics of the
major local arterials are as follows:
Surf Avenue is an east-west arterial street extending from West 37th Street to Ocean Parkway,
and it is the southernmost arterial in the study area running near to the shore line. Typically, Surf
Avenue comprises of two moving lanes and one parking lane in each direction, with a painted
median (10 feet wide) for emergency vehicle use. There are residential and commercial as well
as major recreational/entertainment centers located along this corridor.

4-2
CO
NEY
ISLA
ND
AV
E.
KINGS HIGHWAY
AVE. X
AVE. U
OCEA
N PA
RKW
AY
MC
DO
NA
LD A
VE.BAY PA
RKWAY
STILLWELL A
VE.
WEST 6TH
ST.
SHORE PARKWAY
NEPTUNE AVE.
BRIGHTON BEACH AVE.
86TH ST.
BELT PARKWAY
CROPSEY AVE.
N
Figure 4-1: Main Access Routes to Study Area
BRIG
HTON
11T
H ST
.SHEL
L RO
AD
SURF AVE.
WEST EN
D A
VE.
Study AreaMajor Corridor
Legend

4-3
Mermaid Avenue which is a collector street runs parallel to (and between) Surf and Neptune
Avenues from West 37th Street to Stillwell Avenue. It has one moving lane with a parking lane
in each direction. There is a mixture of residential and commercial/retail land uses along this
corridor.
Neptune Avenue is another east-west collector that extends from West 37th Street to West End
Avenue. It has two moving lanes and a parking lane in each direction, and exclusive left-turn
lanes at key intersections. Land use along this corridor includes residential, commercial,
industrial and institutional (school) uses.
Kings Highway is an east-west collector street that extends from Bay Parkway in Bensonhurst to
Eastern Parkway in Weeksville. It has one moving lane and a parking lane in each direction in
the study area. There is a mixture of commercial/retail and residential uses along this corridor in
the study area.
Coney Island Avenue is a north-south collector street running from Fort Hamilton Parkway (near
Prospect Park) to Riegelman Boardwalk. In the study area, it has two moving lanes and one
parking lane in each direction. There is a mixture of commercial/retail and residential uses along
this corridor in the study area.
Ocean Parkway is a major two-way arterial for non-commercial traffic that runs from the
Prospect Expressway to Surf Avenue in Coney Island. It has a main line and service roads with
three moving lanes in each direction and left-turn lanes on the main line and one moving lane
and parking lane on the service roads. The service roads are separated from the main line by a
landscaped median with pedestrian and bicycle paths. There are only residential and
institutional (schools, religious gathering places, and a hospital) along this corridor.
Stillwell Avenue is another north/south collector that traverses the study area from Avenue P to
Surf Avenue. It has one moving lane in each direction under the train viaduct; but, outside the

4-4
viaduct, there is an additional moving lane in each direction. Along Stillwell Avenue there is a
mixture of residential, commercial/retail and industrial uses.
Cropsey Avenue runs diagonally through the study area from Bay Parkway to Neptune Avenue.
Between Bay 50th Street and Neptune Avenue, Cropsey Avenue has three moving lanes in each
direction, serving a high volume of vehicles entering and exiting the Shore Parkway. South of
Neptune Avenue, Cropsey Avenue becomes West 17th Street and it terminates after two blocks at
Surf Avenue. West 17th Street is a two-way collector street and has one moving lane and one
parking lane in each direction. North of the Belt Parkway there are primarily residential uses
while south of the Belt Parkway there is a mixture of industrial and commercial uses.
Bay Parkway runs diagonally from Kings Highway to Shore (Belt) Parkway in the study area. It
has two moving lanes with one parking lane in each direction. It collects traffic from the
parkway and distributes it through out the study area. There is a mixture of residential,
commercial/retail, and institutional uses along Bay Parkway.
McDonald Avenue is a north/south collector that extends from Avenue P/Quentin Road and
Avenue X in Gravesend. It becomes Shell Road between Avenue X and the Belt Parkway.
McDonald Avenue has one moving lane in each direction and runs under the viaduct of the F
train. Outside the viaduct, there is an additional moving lane and a parking lane in each
direction. There is a mixture of residential, commercial, and industrial uses along McDonald
Avenue and Shell Road.
Eighty-sixth (86th) Street is a collector that extends from Shore Parkway to McDonald Avenue.
It runs under the subway viaduct of the M and D lines within the study area. It has one moving
lane in each direction under of viaduct and outside of the viaduct columns; there is an additional
moving lane and a parking lane in each direction. Along 86th Street there is a mixture of
residential and commercial uses.

4-5
4.2 Activity Centers and the Transportation Network
Peak hour vehicular trips in the study area are distributed between work and personal activities.
The origin of trips leaving the area during the AM peak hour (home based trips or origins) are
distributed through out the study area. The destinations, however, tend to be in a few activity
centers where employment, commercial/retail activities, and services are concentrated. In the
summer months, there is an evening peak associated with the amusement park/recreational
activity. The study area street network does not process high volumes of through traffic, except
along the Belt Parkway. Almost all the traffic in the area has an origin or destination within
Coney Island, Gravesend and Brighton Beach.
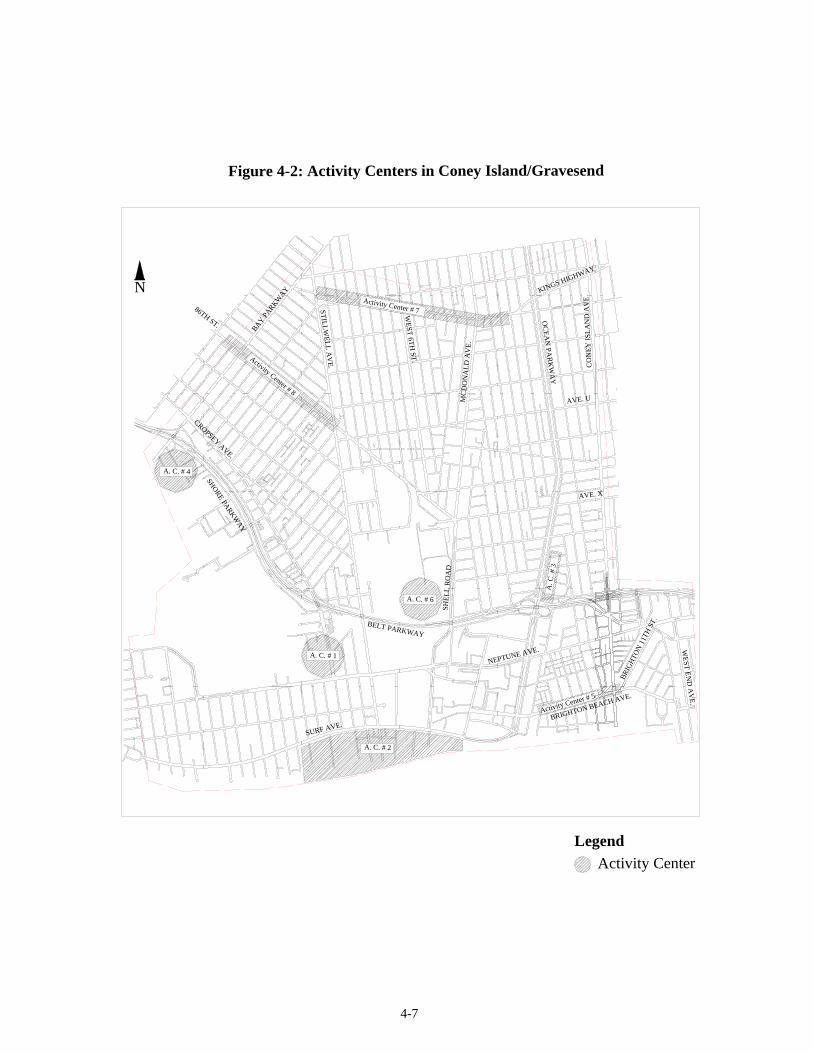
There are basically eight activity centers in the study area. The four major ones are concentrated
in the southwest section of the study area and the four smaller centers on the north and eastern
periphery. Figure 4-2 shows the activity centers which are described below:
• Activity Center #1 is located along Cropsey Avenue between the Belt Parkway and Neptune
Avenue. Its main attractions are a big-box retail store (Home Depot) and a Pathmark
supermarket. It also includes a site which is currently occupied by Linens N Things. This
location is very accessible by private auto and is also served by the B82 and X28 buses.
• Activity Center #2 is located along Surf Avenue between West 17th Street and West 8th Street.
It is comprised primarily of amusement and recreational activity centers as well as the beach.
It includes the New York Aquarium, Coney Island Amusement Park, Keyspan Park (a minor
league baseball stadium), and Nathan’s. This area is well served by public transportation with
train stops at Stillwell Avenue and West 8th Street as well as the X28, X29, B36, B68, and
B74 buses.
• Activity Center #3 is the Coney Island Hospital. It is located on Ocean Parkway and Avenue Z
just north of the Shore Parkway. Coney Island Hospital is the largest medical facility in
southern Brooklyn. The hospital has 440 in-patient beds and an extensive ambulatory care
program, which includes a hospital-based primary care center and an outreach site at the
Community Health Center in Coney Island. The hospital provides a full range of general and

4-6
specialty ambulatory care services, as well as full emergency and in-patient services. It is
adequately served by transit with three public bus lines (B1, B4, and B36) that stops adjacent
to the hospital, and it is easily accessible by automobile.
• Activity Center #4 is the Ceasar’s Bay Mall that is located south of the Shore Parkway
Service Road and east of Bay Parkway. It consists of approximately 49,000 square feet of
commercial/retail space with approximately 812 parking spaces. It includes major retailers
such as Kohl’s, Radio Shack, Toys R Us, Best Buy, and Modell’s. There are two public bus
lines (B6 and B82) that stop at or near the Mall.
• Activity Center #5 is located along Brighton Beach Avenue in the south-eastern tip of the
study area. It includes retail stores (shoes, clothing, and pharmacy), grocery stores and
supermarkets, entertainment (restaurants and clubs), and banking.
• Activity Center #6 is the only major industrial activity center in the study area. It is located
north of the Belt Parkway between Shell Road and Stillwell Avenue. It includes the New
York City Transit rail yard as well as a number of automobile repair shops.
• Activity Center #7 includes a strip of local retail stores along Kings Highway from Ocean
Parkway to Stillwell Avenue.
• Activity Center #8 is similar to Activity Center #7; it includes local retail stores along 86th
Street between Bay Parkway and Stillwell Avenue.
4-7
SURF AVE.
WEST EN
D A
VE.
LegendActivity Center
CO
NEY
ISLA
ND
AV
E.
KINGS HIGHWAY
AVE. X
AVE. U
OC
EAN
PARK
WA
Y
MC
DO
NA
LD A
VE.
BAY PARKW
AY
STILLWELL A
VE.
WEST 6TH
ST.
SHORE PARKWAY
NEPTUNE AVE.
BRIGHTON BEACH AVE.
86TH ST.
BELT PARKWAY
CROPSEY AVE.
N
Figure 4-2: Activity Centers in Coney Island/Gravesend
BRIG
HTON
11T
H ST
.
SHEL
L R
OA
D
Activity Center # 5
A. C. # 6
A. C
. # 3
Activity Center # 7
Activity Center # 8
A. C. # 1
A. C. # 2
A. C. # 4

4-8
4.3 Data Collection & Traffic Operations
Traffic Network
Existing traffic conditions were defined through field surveys conducted from April to June
2002, and supplemented with information from recent environmental impact statements (EIS)
projects within the study area, as well as from other previous studies such as Cropsey Avenue
Home Depot FEIS, The Baseball Stadium at Park (Keyspan Park), and Bayside Theaters EA.
Traffic volume counts included vehicle classification, turning movements and pedestrian counts
for three midweek days (Tuesday, Wednesday, and Thursday) during the AM, midday, and PM
peak hours; as well as the Saturday peak hour. New Automatic Traffic Recording (ATR)
machines were installed at six locations to collect daily volumes for the duration of seven days.
Additional ATR data was obtained from NYSDOT and NYCDOT archives.
The ATR locations are as follows:
1. Shell Road @ Avenue X
2. Neptune Avenue @ West 6th Street
3. 86th Street @ Avenue U
4. Ocean Parkway @ Avenue Z
5. Bay Parkway between Cropsey Avenue and Bath Avenue
6. Belt Parkway Ramps at Bay Parkway
Figure 4-3 shows the traffic count locations and Figure 4-4 shows the traffic controls in the study
area.

4-9
CO
NEY
ISLA
ND
AV
E.
KINGS HIGHWAY
AVE. X
AVE. U
OCEA
N PA
RK
WA
Y
MCD
ON
ALD
AV
E.
BAY PARKW
AY
STILLWELL A
VE.
SHORE PARKWAY
NEPTUNE AVE.
BRIGHTON BEACH AVE.
86TH ST.
BELT PARKWAY
CROPSEY AVE.
N
Figure 4-3: ATR, Manual, and Pedestrian Count Locations
Automatic Traffic Recorder (ATR)
MERMAID AVE.
SURF AVE.
W 37TH
ST.
W 31ST ST.
W 21ST ST.
W 17TH
ST.
STILLWELL A
VE.
W 1
2TH
ST.
W 8
TH S
T.
SHEL
L RO
AD
AVE. Y
AVE. Z
BATH AVE.
BENSON AVE.
HARWAY AVE.
BAY 48TH ST
.
BAY 49TH ST
.
23RD A
VE.
BAY 35TH ST
.
BAY 32ND ST
.
81TH ST.
84TH ST.
W. 5TH
ST.
W. 7TH
ST.
W 9TH
ST.
W. 11TH
ST.
AVE. W
AVE. T
AVE. S
W. 3RD
ST.
E 3RD
ST.E. 2N
D ST.
Pedestrian Counts
Turning Movement Counts
BRIG
HTON
11t
h ST.
WEST EN
D A
VE.
Legend

4-10
CO
NEY
ISLA
ND
AV
E.
KINGS HIGHWAY
AVE. X
AVE. U
OC
EAN
PAR
KW
AY
MC
DO
NA
LD A
VE.
BAY PARKW
AY
STILLWELL A
VE.
SHORE PARKWAY
NEPTUNE AVE.
BRIGHTON BEACH AVE.
86TH ST.
BELT PARKWAY
CROPSEY AVE.
N
Figure 4-4: Type of Traffic Control System
Unsignalized Intersection
MERMAID AVE.
SURF AVE.
W 37TH
ST.
W 31ST ST.
W 21ST ST.
W 17TH
ST.
STILLWELL A
VE.
W 1
2TH
ST.
W 8
TH S
T.
SHEL
L R
OA
D
AVE. Y
AVE. Z
BATH AVE.
BENSON AVE.
HARWAY AVE.
BAY 48TH ST
.
BAY 49TH ST
.
23RD A
VE.
BAY 35TH ST
.
BAY 32ND ST
.
81TH ST.
84TH ST.
W. 5TH
ST.
W. 7TH
ST.
W 9TH
ST.
W. 11TH
ST.
AVE. W
AVE. T
AVE. S
W. 3R
D ST.
E 3RD
ST.E. 2N
D ST.
Signalized IntersectionU
BRIG
HTON
11t
h ST
.
WEST EN
D A
VE
UU
U
U
U
UUU
U
U
UU
U
U
U
Legend

4-11
Vehicle classification and turning movement counts were conducted for the various peak
periods at the following locations:
1. Kings Highway @ Ocean Parkway, signalized
2. Kings Highway @ McDonald Avenue, signalized
3. Kings Highway @ Coney Island Avenue, signalized
4. Kings Highway @ Stillwell Avenue, signalized
5. Bay Parkway @ 86th Street, signalized
6. 81st Street @ 23rd Avenue, unsignalized
7. 84th Street @ 23rd Avenue, signalized
8. Bay 32nd Street @ Benson Avenue, signalized
9. Bay 35th Street @ Benson Avenue, unsignalized
10. Bay 35th Street @ Bath Avenue, signalized
11. 86th Street @ Stillwell Avenue, signalized
12. Harway Avenue @ Cropsey Avenue, unsignalized
13. Bay 48th Street @ Cropsey Avenue, signalized
14. Bay 49th Street @ Stillwell Avenue, signalized
15. Harway Avenue @ Stillwell Avenue, signalized
16. Avenue Z @ West 15th Street, unsignalized
17. Bay 54th Street @ Cropsey Avenue, signalized
18. West 11th Street @ Avenue S, unsignalized
19. West 7th Street @ Avenue S, unsignalized
20. West 9th Street @ Avenue T, signalized
21. West 5th Street @ Avenue T, signalized
22. West 11th Street @ Avenue U, signalized
23. West 7th Street @ Avenue U, signalized
24. Ocean Parkway @ Avenue W, signalized
25. McDonald Avenue @ 86th Street & Avenue X, signalized
26. Avenue X @ West 3rd Street, signalized
27. Avenue Y @ West 3rd Street, unsignalized
28. Avenue Y @ East 2nd Street, unsignalized

4-12
29. Avenue Y @ East 3rd Street, unsignalized
30. Ocean Parkway @ Avenue X , signalized
31. Ocean Parkway @ Avenue Z, signalized
32. Shell Road @ Avenue Z, signalized
33. Shell Road @ Neptune Avenue, signalized
34. Coney Island Avenue @ Neptune Avenue, signalized
35. West 12th Street @ Neptune Avenue, signalized
36. Cropsey Avenue @ Neptune Avenue &West 17th Street, signalized
37. Memaid Avenue @ Stillwell Avenue, signalized
38. Surf Avenue @ Stillwell Avenue, signalized
39. West 8th Street @ Surf Avenue, signalized
40. West 17th Street @ Mermaid Avenue, signalized
41. West 21st Street @ Mermaid Avenue, unsignalized
42. West 31st Street @ Bay View Avenue, unsignalized
43. West 37th Street @ Neptune Avenue, unsignalized
44. West 37th Street @ Surf Avenue, unsignalized
45. Coney Island Avenue @ Belt Parkway Entrance/Guider Avenue, signalized
46. Ocean Parkway @ Brighton Beach , signalized
47. Brighton Beach @ Coney Island Avenue, signalized
48. Ocean Parkway @ Neptune Avenue, signalized
49. Bay Parkway @ Cropsey Avenue, signalized
50. Brighton Beach @ Brighton 11th Street, signalized
51. Neptune Avenue @ Brighton 10th Street, signalized
52. Neptune /Emmons Avenue @ East 14th Street/Shore Parkway, signalized
53. Brighton Beach @ Brighton 4th Street, signalized
Pedestrian Data
During the summer months there is heavy pedestrian traffic in certain parts of the study area due
to the presence of the amusement park, recreational facilities, and the beach. Two sets of
pedestrian counts were conducted. Pedestrian counts were conducted at the locations listed

4-13
below during the summer recreation period, as well as when regular manual turning movement
counts were being collected.
Summer Pedestrian Count Locations:
1. West 21st Street @ Surf Avenue
2. West 5th Street @ West Brighton Avenue
3. West 17th Street @ Surf Avenue
4. West 8th Street @ Surf Avenue
5. West 5th Street @ Surf Avenue
6. Mermaid Avenue @ Stillwell Avenue
7. Mermaid Avenue @ West 17th Street
8. Brighton Beach Avenue @ Ocean Avenue
9. Ocean Parkway @ Brighton Beach Avenue
10. Stillwell Avenue @ Surf Avenue
Pedestrian Count Locations used in LOS analysis:
1. Kings Highway @ Ocean Parkway
2. Kings Highway @ McDonald Avenue
3. Bay Parkway @ 86th Street
4. Bay 35th Street @ Bath Avenue
5. Harway Avenue @ Stillwell Avenue
6. West 7th Street @ Avenue U
7. Ocean Parkway @ Avenue W
8. McDonald Avenue @ 86th Street & Avenue X
9. Avenue X @ West 3rd Street
10. Ocean Parkway @ Avenue X
11. Ocean Parkway @ Avenue Z
12. Coney Island Avenue @ Neptune Avenue
13. Cropsey Avenue @ Neptune Avenue &West 17th Street
14. Memaid Avenue @ Stillwell Avenue

4-14
15. Surf Avenue @ Stillwell Avenue
16. West 8th Street @ Surf Avenue
17. West 17th Street @ Mermaid Avenue
18. Coney Island Avenue @ Belt Parkway Entrance/Guider Avenue
Traffic Control Devices
An inventory of traffic control devices including signal timing, phasing, and control type (such
as stop and yield signs) was conducted.
Parking Data
Data was collected for off-street parking facilities as well as on-street meter parking and non-
meter parking.
Accident Data
Accident data for 27 intersections for the years 1996-2000 from NYSDOT and DMV records
was analyzed to identify patterns in the study area.
4.4 Network Traffic Volumes
A balanced traffic network for the various peak periods was prepared using the ATRs and the
manual turning movement counts. This information has been plotted on traffic flow maps for the
AM peak hour (8:00 - 9:00), midday peak hour (1:00 - 2:00), and PM peak hour (5:00 - 6:00).
Figures 4-5, 4-6, and 4-7 show the network volumes for the AM, midday, and PM peak hours,
respectively.
Data collected from the Automatic Traffic Recording (ATR) machines showed that Ocean
Parkway processed the highest number of vehicles for all peak periods in the study area. The
ATR machines showed the following:
1. Shell Road @ Avenue X - southbound traffic volume was approximately 828, 661, and 809
vehicles per hour (vph) in the AM, midday, and PM peak hour, respectively. Northbound

4-15
49 2121
26630
24037
0493
17117
4 570
21199
8 12 46
19931
4311
171
49
13
20219
35174
214210
19451
26223
221823
20022
3920 50
88238261
59489043
9529
3976853
5668
328 14528
35127
302852
15181
312418
10523359
34 34330
9
4729212
19
32141
177664
874151552
2155248
6168
17282
36 163
242876
457115
52 797
1
32095918254
5
27157
584216
1813917330
58
4178544
2720090
6171
055
271711113
27188416
3433 865
9751143
641387 43
14055
24 441337
1074422
3 032
503559
15
5026837
1709
1
441252 22
31991160207667
20269
26175
76
33235 22
36 50031
6429434
1122523
15191 56
38208
3 31
16015
18127
7389
136141
10754
14 25121
323834
121
25385
59
84 5287
283820192039
41136
871085
481032
23693190
745187194
8 20300
11344591
4 5 104
1757026
22531333
112925
2115 3
13945
112
512
11547
97662
16 90 39
361276 93
243363
6070
65903816
1443560
391176
16
281
14 31
11153
50
2520
247 26
92538
38220
533223820
6 52 75
16029159
24
42182
19651
16218
16319
292926
29320
85
27
266
13 3 344615466
4066244
6022660
6248646
20
641387 43
10194134
1412
203
327203
152262
1 1619
28210
37068
5
93251120
742414466377
26
31204
99
65688
56
35521
34
272973646124
48
20407295
48211104
3491118
901360
14 3078
4513
60128
199
30127910
21 35330 34
19896
55134
113
11716311
9 51 12
35201164
190149136
8
4 192
150186
23224
12190
2642 24
679109
50
340
81454500305
130235
10720571
49
418
377
6 12
339
11380
304
58139
4340
31 3
84 543
7433
101
168997
37233
13 61 50
1195
3
9751143
9711866232066
76
Mermaid Ave.
86th St.
Brighton Beach Ave.
Stillwell A
ve.
McD
onal
d A
ve.
Shore Parkway
Bay Pa
rkway
Ocean Parkw
ay
Coney Island A
ve.
Kings Highway
Benson Ave.
Bath Ave.
Harway Ave.
23rd
Ave.
Bay 32
nd St
.
Bay 35
th St
.
84th St.
81st St.
Ave. U
W. 11th St.
W. 7th St.
W. 5th St.
W. 9th St.
Ave. T
Ave. S
Ave. X
Ave. Y
Ave. Z
Bay 49
th St.
Bay 48
th St.
Surf Ave.
Neptune Ave.
W. 17th St.
W. 21st St.
W. 3rd St.
W 12th St.
W 8th St.
W 31st St.
W 37th St.
Shell Road
E. 3rd St.E 2nd St.
Oce
an P
arkw
ay
Coney Island A
ve .
Neptune Ave.
Cropsey Ave.
N
10132
33674
Cass Pl.
East
14t
h St
.
Bri g
hton
10t
h St
.Br
ight
on 1
1th
St.
Brig
hton
4th
St.
843123
231
239075
7710013192
1529
286
38 38 27
28166213228
16
7222516
3925157
Exhibit 4-5: AM Peak Hour Volume

4-16
94
609
79 6030
743
24414
36
1023
27 231212
43
21 6 5 37
5409492 0 1060
112818654
3
345119
8814795339275 26
47 31235
10425441
1917833
127
21 2421719945
24681
261
5466
823
15280256
221
36
1830
284 5
7134
92529
21152
17123
5
3829015
64358
31
41 333 43
63
21
4521947
441250
45
6917053
4614339
56677114
4864375
52882523 147
23765
432
263
90 666
2
764
7
379
219
41
5413
40
18615
16926
10 33 31
10 53 2917160
27155
12172
12177
21018
50561921212
13249 23 23 42
18205
12233 6 48 47
31218
21259 16 22 22
31233
21
16233
28205
2034
3330
21312
14329
11
0413
5840
000
19144
Figure 4-6: Midday Peak Hour Volume
Mermaid Ave.
86th St.
Brighton Beach Ave.
Stillwell A
ve.
McD
onal
d A
ve.
Shore Parkway
Bay Pa
rkway
Ocean Parkw
ay
Coney Island A
ve.
Kings Highway
Benson Ave.
Bath Ave.
Harway Ave.
23rd
Ave.
Bay 32
nd St
.
Bay 35
th St.
84th St.
81st St.
Ave. U
W. 11th St.
W. 7th St.
W. 5th St.
W. 9th St.
Ave. T
Ave. S
Ave. X
Ave. Y
Ave. Z
Bay 49
th St.
Bay 48
th St.
Surf Ave.
Neptune Ave.
W. 17th St.
W. 21st St.
W. 3rd St.
W 12th St.
W 8th St.
W 31st St.
W 37th St.
Shell Road
E. 3rd St.E 2nd St.
Oce
an P
arkw
ay
Coney Island A
ve .
Neptune Ave.
Cropsey Ave.
N
Brig
hton
4th
St.
Brig
hton
11t
h St
.
Brig
h ton
10 t
h St
.
East
14t
h St
.
Cass Pl.
Mermaid Ave.
86th St.
Brighton Beach Ave.
Stillwell A
ve.
McD
onal
d A
ve.
Shore Parkway
Bay Pa
rkway
Ocean Parkw
ay
Coney Island A
ve.
Kings Highway
Benson Ave.
Bath Ave.
Harway Ave.
23rd
Ave.
Bay 32
nd St
.
Bay 35
th St.
84th St.
81st St.
Ave. U
W. 11th St.
W. 7th St.
W. 5th St.
W. 9th St.
Ave. T
Ave. S
Ave. X
Ave. Y
Ave. Z
Bay 49
th St.
Bay 48
th St.
Surf Ave.
Neptune Ave.
W. 17th St.
W. 21st St.
W. 3rd St.
W 12th St.
W 8th St.
W 31st St.
W 37th St.
Shell Road
E. 3rd St.E 2nd St.
Oce
an P
arkw
ay
Coney Island A
ve .
Neptune Ave.
Cropsey Ave.
N
7047
30
7411812
933
1763
0
25
1250
17 4246
7418
63
350
136308
4 54
370
443
56413
357
111
192
7224597
36552242
86 48293
39013
42 32 30
28262
16218
640
194727064
92 20023121
1623
20318119324
11771
199
192218
4
1399
176214
387
101229314241
18
284215
22
230523
31035
15326745
80 495 35
46248107
1122137
119
1516
176
167
13
14494
368 9
482834451016
1271 2
47722
4535
44230
13382
7314167
211
2255 71
26613
55
8 20 27
152311
17
97330
10343 65
4365
3835965
147
5021 29
26548
20
16231
16915
24 3125
32185
57137
146252
4115
3 33
3160
9
4884
114565
99437
101
125
17
5510
71 2 7 20 40 6894672
54
38459
41
323427
89911
88260
4922
251817
832163
2381027
51327 39
104105
114151
75 58
1473139
1021041
10 233
16
514332
2622482
279 189
464366224
5
230210
72
4423266
30642350181367
38168
18620
18314
232625
11157
50132
51712015146
45223
513847
41208
58116856
14 39 14
22106404
123925
461415715 64 1054
19
7764
272292
35 112 74 29
421701345
5825 4242
238
17 8
191543370
3
10643
72111 74314507
58232

4-17
38490
362
2874
730
20248390
225
752
310
8672254
6720043
54
66 728
76
736
45 751438
44
27 74 38
55 92 4412713
0 0
112818658
1
551038
2075
55
381468
42
474830
7611
89 70
207769
5819041
3428929
24 318 31
2524546
2328443
6213 37
41268
3 54
3026
039
127
60 255
9832410
129550
22223
23812
621 57
8923635
48
8323833
19961
6576
78470
773
35 30732
17282
19
4462
17212
5727
33
20262
3226 320
79
16
7134026
23
5885
56 626 67
4678126
25759
53
6198
21448
2722
8
1521
165
4686011
89 819
9
828395279
482
32313
123726
52249
40 954
32020
30615
16570
165
9
022
0 749
14241 10 24
21
25417
4322
296
53
38
31014
28304
383230
33617
12288
382421
24819
Figure 4-7: PM Peak Hour Volume
Brig
hton
4th
St.
Brig
hton
11t
h St
.
Brig
hton
10t
h St
.
East
14t
h St
.
Cass Pl.
Mermaid Ave.
86th St.
Brighton Beach Ave.
Stillwell A
ve.M
cDon
ald
Ave
.
Shore Parkway
Bay Pa
rkway
Ocean Parkw
ay
Coney Island A
ve. Kings Highway
Benson Ave.
Bath Ave.
Harway Ave.
23rd
Ave.
Bay 32
nd St
.
Bay 35
th St.
84th St.
81st St.
Ave. U
W. 11th St.
W. 7th St.
W. 5th St.
W. 9th St.
Ave. T
Ave. S
Ave. X
Ave. Y
Ave. Z
Bay 49
th St.
Bay 48
th St.
Surf Ave.
Neptune Ave.
W. 17th St.
W. 21st St.
W. 3rd St.
W 12th St.
W 8th St.
W 31st St.
W 37th St.
Shell Road
E. 3rd St.E 2nd St.
Oce
an P
arkw
ay
Con ey Isla nd A
ve.
Neptune Ave.
Cropsey Ave.
N
643 6
0
91135
815820
18523
761477
104
13655
11 5131
15 32
30124
108
33
10
10
10
7
368
269
3122
65396
42270
102
57
79 26 76
213
493
39
61
319
174394
500
450 44475037
375150163
9130268
802207264640
92
7023070
5276614
15726730
4013840
9157122 120
21557
1902472514
15169
262227
1103033232457
53
24249428
293
17757
121297
95
2704852
41 9336 31
32450
65
61548
22
69246
11534957
10550845
9631553
14244214
26
1223145
496
10131398136
186163
91
193
135
29 08
1372
17 27345 259
579
127
59215
506
110
3143 33
18216
18519
21197 234
25
21160
41206
446215
29267
41 40 43
26221
737
16181
21
375240
4952 313
1122834938 97
1072
2 1 2 97812
29653
6
48530
94913445
27529121395
1218
340238518370
29816
102911
107510
5221
5868 260302
99132234
226015
7912
76
2 2 27 24
1181241106
78
51140346
6 45 9 38161493
164011
551845516
5913
0 4 41
8733233
17 2 0 6 0
1636263
70579
7183 5
6814115
1341110 0
105
2014727
1114091
19 27930 9
16355
171135
26946
19219 2692
6888364
16
6 36 21 16323120

4-18
traffic volume was approximately 686, 645, and 720 vph in the AM, midday, and PM peak
hour, respectively.
2. Neptune Avenue @ West 6th Street - eastbound traffic volume was approximately 491,
682, and 616 vehicles per hour in the AM, midday, and PM peak hour, respectively.
Westbound traffic volume was approximately 587, 573, and 507 vph in the AM, midday,
and PM peak hour, respectively.
3. 86th Street @ Avenue U - eastbound traffic volume was approximately 277, 316, and 378
vehicles per hour in the AM, midday, and PM peak hour, respectively. Westbound traffic
volume was approximately 374, 452, and 572 vph in the AM, midday, and PM peak hour,
respectively.
4. Ocean Parkway @ Avenue Z - northbound traffic volume was approximately 1665, 1226,
and 1458 vehicles per hour in the AM, midday, and PM peak hour, respectively.
Southbound traffic volume was approximately 1233, 1151, and 1513 vph in the AM,
midday, and PM peak hour, respectively.
5. Bay Parkway (between Cropsey Avenue and Bath Avenue) – southbound traffic volume
was approximately 938, 770, and 890 vehicles per hour in the AM, midday, and PM peak
hour, respectively. Northbound traffic volume was approximately 852, 838, and 938 vph
in the AM, midday, and PM peak hour, respectively.
6. Shore (Belt) Parkway exit and entry ramps at Bay Parkway - each ramp processed
approximately 830, 730, and 790 vehicles per hour in the weekday AM, midday, PM,
peak hour, respectively.

4-19
4.5 Street Capacity & Level of Service (LOS)
The capacity of the roadways is the maximum rate of flow which may pass through a section of
roadway under prevailing traffic, roadway and signalization conditions. The capacity of a
roadway is determined by several factors including turning movements, signal timing, pedestrian
movements, type of vehicle, illegal and/or double parking, grade, roadway conditions, and
weather. In determining street capacity within the study area the 2000 Highway Capacity
Manual (HCM) methodology was used. The methodology requires the use of official signal
timings, street geometry, and other relevant information for performing capacity and LOS
analyses.
The traffic flow characteristics are measured in terms of the volume-to-capacity (v/c) ratios and
delays. The quality of the flow is expressed in terms of LOS, which is based on an average delay
experienced by a vehicle; Table 4-1 traffic conditions for each LOS assignment. When the v/c
ratio exceeds 1.0, a facility or intersection operates at or over capacity. In this situation severe
congestion occurs in traffic with stop-and-start conditions, and extensive vehicle queuing and
delays. Volume-to-capacity ratios of less than 0.85 are considered to be reflective of acceptable
traffic conditions, with average delays of 30 seconds or less. The following table shows the level
of service criteria as specified in the 2000 HCM Methodology.
The intersections studied were analyzed for roadway capacity, volume-to-capacity (v/c) ratios,
vehicular delay, and level-of-service (LOS) for the weekday AM, midday, and PM peak hour; as
well as the Saturday peak hour (12:00 – 1:00 PM).

4-20
Table 4-1: Signalized Intersection Level of Service (LOS)
Level of
Service
Control Delay
Per Vehicle Description of Traffic Condition
A <10.0 LOS A describes operations with low control delay, up to 10 s/veh. This LOS
occurs when progression is extremely favorable and most vehicles arrive during the green phase. Many vehicles do not stop at all.
B >10 to 20 LOS B describes operations with control delay greater than 10 and up to 20
s/veh. This level generally occurs with good progression, short cycle lengths, or both. More vehicles stop than with LOS A, causing higher levels of delay.
C > 20 to 35 LOS C describes operations with control delay greater than 20 and up to 35
s/veh. These higher delays may result from only fair progression, longer cycle lengths or both. Individual cycle failures may begin to appear in this level. The number of vehicles stopping is significant at this level, although many still pass through the intersection without stopping.
D > 35 to 55 LOS D describes operations with control delay greater than 35 and up to 55
s/veh. The influence of congestion becomes more noticeable at this level. Longer delays may result from a combination of unfavorable progression, long cycle lengths, and/or high v/c ratios. Many vehicles stop, and the proportion of vehicles not stopping declines. Individual cycle failures are noticeable.
E > 55 to 80 LOS E describes operations with control delay greater than 55 and up to 80
s/veh. These higher delay values generally indicate poor progression, long cycle lengths, and high v/c ratios. Individual cycle failures are frequent occurrences.
F > 80 LOS F describes operations with delay in excess of 80 seconds per vehicle.
This is considered to be unacceptable to most drivers. This condition often occurs with oversaturation, that is, when arrival flow rates exceed the capacity of lane groups. It may also occur at high v/c ratios with many individual cycle failures. Poor progression and long cycle lengths may also be major contributing causes to such delay levels.
Sources: Highway Capacity Manual, Transportation Research Board;
National Research Council, Washington D.C., 2000; New York City Department of Transportation; New York State Department of Transportation.
Note: Control delay is measured in terms of seconds per vehicle.

4-21
4.6 Existing Traffic Conditions
Table 4-2 shows the 2002 Existing Conditions including v/c ratios, delays, and level of service
(LOS) for the AM, midday, and PM peak hour for the intersections analyzed in the study area.
The analysis showed that most intersections operated at an acceptable level-of-service with LOS
B or better during the AM, midday, and PM peak periods. However, some intersections
experienced LOS D, E, and F for some or all lane groups during some peak hours.
The intersections with overall LOS D (equal to or greater than 45 sec./veh.) or worse are listed
below and shown in Figures 4-8, 4-9, and 4-10.
• Kings Highway @ Ocean Parkway (AM)
• Kings Highway @ McDonald Avenue (AM, midday, PM)
• Ocean Parkway @ Avenue W (AM)
• McDonald Avenue @ 86th Street & Avenue X (AM, midday, PM)
• Ocean Parkway @ Avenue X (AM)
• Coney Island Avenue @ Neptune Avenue (PM)
• Coney Island Avenue @ Belt Parkway Entrance/Guider Avenue (AM, midday, PM)
• Brighton Beach @ Coney Island Avenue (AM, midday, PM)
• Ocean Parkway @ Neptune Avenue (AM, midday, PM)
• Bay Parkway @ Cropsey Avenue (PM)

4-22
Table 4-2: Traffic Capacity Analysis for Signalized Intersections (2002 Existing Conditions)
Page 1 of 5
Lane AM MID PM
INTERSECTION Group V/C DELAY LOS V/C DELAY LOS V/C DELAY LOS EB LTR 0.97 78.00 E 0.78 49.60 D 0.81 51.40 D WB LTR 1.05 96.00 F 0.85 56.50 E 0.50 37.50 D NB L 0.24 28.80 C 0.39 39.90 D 0.31 39.70 D
TR 1.03 60.10 E 0.82 31.70 C 0.64 26.30 C SB L 0.11 44.00 D 0.32 41.70 D 0.16 25.60 C
Kings Hwy @ Ocean Pkwy
TR 0.63 26.10 C 0.69 27.50 C 0.76 29.40 C EB LTR 0.33 12.10 B 0.35 10.40 B 0.47 14.30 B WB LTR 0.54 15.60 B 0.64 15.70 B 0.50 14.90 B NB LTR 1.05 90.10 F 1.05 89.10 F 1.05 98.00 F Kings Hwy @ McDonald Avenue
SB LTR 1.05 103.10 F 1.04 88.70 F 1.02 91.80 F EB LTR 0.93 63.60 E 0.66 27.70 C 0.81 46.30 D WB LTR 0.60 35.40 D 0.54 24.10 C 0.63 37.90 D NB L 1.05 77.70 E 0.69 34.70 C 0.36 21.00 C NB TR 0.59 20.70 C 0.59 18.90 B 0.49 18.80 B
Kings Hwy @ Coney Island Avenue
SB LTR 0.63 22.20 C 0.78 24.90 C 0.71 24.40 C EB LTR 0.24 11.00 B 0.18 8.50 A 0.29 11.50 B WB LTR 0.62 17.90 B 0.49 12.10 B 0.46 14.10 B NB LTR 0.69 42.40 D 0.89 48.00 D 0.67 41.90 D Kings Hwy @ Stillwell Avenue
SB LTR 0.73 44.60 D 0.92 51.80 D 0.93 63.20 E EB LTR 0.34 29.10 C 0.41 24.00 C 0.43 30.60 C WB LTR 0.32 28.70 C 0.40 23.80 C 0.42 30.40 C NB LTR 0.60 19.30 B 0.49 13.80 B 0.62 19.80 B Bay Pkwy @ 86th Street
SB LTR 0.70 21.90 C 0.53 14.40 B 0.68 21.20 C WB LTR 0.31 16.70 B 0.40 18.10 B 0.47 19.20 B NB LT 1.05 82.20 F 1.05 79.30 E 1.05 80.80 F 84th Street @ 23rd Avenue SB TR 0.26 8.50 A 0.22 8.10 A 0.33 9.10 A EB TR 0.28 8.70 A 0.33 9.10 A 0.39 9.80 A WB LT 0.73 26.70 C 0.65 19.30 B 1.05 72.80 E Bay 32nd Street @ Benson Avenue SB LTR 0.39 18.20 B 0.36 17.80 B 0.44 19.10 B EB LTR 1.05 78.20 E 0.67 21.50 C 0.83 28.30 C WB LTR 0.41 10.00 A 0.31 8.90 A 0.47 10.60 B Bay 35th Street @ Bath Avenue NB LTR 0.32 16.90 B 0.26 16.10 B 0.29 16.50 B EB LTR 0.16 12.80 B 0.23 9.90 A 0.22 13.30 B WB LTR 0.27 13.80 B 0.27 10.20 B 0.54 17.40 B NB LTR 0.39 22.50 C 0.49 19.80 B 0.51 24.50 C 86th Street @ Stillwell Avenue
SB LTR 0.47 24.10 C 0.44 19.30 B 0.53 25.40 C EB LTR 0.40 10.60 B 0.44 11.10 B 0.42 10.80 B WB LTR 0.45 11.20 B 0.43 11.00 B 0.44 11.10 B Bay 48th Street @ Cropsey Avenue NB LTR 0.33 27.10 C 0.46 29.60 C 0.25 25.90 C EB LR 0.48 17.90 B 0.46 17.50 B 0.42 16.70 B NB T 0.21 7.10 A 0.21 7.10 A 0.20 7.10 A Bay 49th Street @ Stillwell Avenue SB T 0.24 7.30 A 0.23 7.20 A 0.23 7.30 A EB LR 0.29 16.40 B 0.21 15.60 B 0.25 15.90 B NB LT 0.37 9.00 A 0.29 8.40 A 0.24 8.00 A Harway Avenue @ Stillwell Avenue SB TR 0.22 7.80 A 0.33 8.60 A 0.20 7.70 A EB L 0.25 22.40 C 0.09 19.70 B 0.09 20.60 C
LR 0.12 20.90 C 0.06 19.50 B 0.06 20.30 C NB L 0.37 18.80 B 0.06 9.70 A 0.07 10.70 B
T 0.41 12.70 B 0.35 11.40 B 0.41 12.70 B Bay 54th Street @ Cropsey Avenue
NB TR 0.50 13.70 B 0.39 11.80 B 0.45 13.20 B

4-23
Table 4-2: Traffic Capacity Analysis for Signalized Intersections (2002 Existing Conditions)
Page 2 of 5
Lane AM MID PM
INTERSECTION Group V/C DELAY LOS V/C DELAY LOS V/C DELAY LOS
EB LT 0.65 18.40 B 0.57 14.60 B 0.92 42.10 D
WB TR 0.30 8.80 A 0.32 9.00 A 0.43 10.20 B West 9th Street @ Avenue T
NB LTR 0.38 17.80 B 0.38 18.00 B 0.34 17.20 B
EB LT 1.05 77.70 E 0.87 34.20 C 1.02 64.60 E
WB TR 0.31 8.90 A 0.31 9.00 A 0.46 10.60 B West 5th Street @ Avenue T
NB LTR 0.28 16.50 B 0.28 16.50 B 0.31 16.90 B
EB LT 0.42 10.20 B 0.43 10.30 B 0.47 10.80 B
WB TR 0.39 9.80 A 0.43 10.20 B 0.48 10.90 B West 7th Street @ Avenue U
NB LTR 0.19 15.30 B 0.22 15.60 B 0.24 15.90 B
EB LT 0.57 15.20 B 0.71 25.30 C 0.47 12.00 B
WB TR 0.43 10.40 B 0.48 14.60 B 0.54 12.00 B West 11th Street @ Avenue U
NB LTR 0.30 16.70 B 0.26 11.90 B 0.35 17.50 B
EB LTR 0.75 60.60 E 0.90 63.60 E 0.74 45.90 D
WB LTR 1.05 104.90 F 0.54 40.20 D 0.55 38.50 D NB L 0.16 18.20 B 0.10 22.80 C 0.16 32.20 C NB TR 1.04 55.40 E 0.61 25.70 C 0.66 26.70 C SB L 0.36 48.70 D 0.16 24.70 C 0.37 37.10 D
Ocean Pkwy @ Avenue W
SB TR 0.56 19.00 B 0.61 25.60 C 0.76 29.60 C
EB LTR 0.57 53.70 D 0.30 30.70 C 0.23 43.40 D
WB LTR 1.05 116.30 F 1.05 95.00 F 1.05 107.60 F NB LTR 0.65 34.10 C 0.74 33.40 C 0.61 33.30 C SB LTR 0.96 74.40 E 1.05 87.60 F 1.05 94.10 F
McDonald Avenue @ 86th Street & Avenue X
NWB LTR 0.81 47.40 D 0.76 36.90 D 0.84 49.30 D
EB LTR 0.91 43.10 D 1.05 80.70 F 1.05 75.70 E
WB LTR 0.40 10.00 A 0.42 10.20 B 0.44 10.40 B Avenue X @ West 3rd Street
NB LTR 0.30 16.70 B 0.39 17.90 B 0.36 17.40 B EB LTR 1.05 102.40 F 0.99 85.60 F 1.02 92.50 F
WB LTR 1.05 100.90 F 0.89 63.40 E 0.80 52.70 D
NB L 0.34 37.90 D 0.27 34.10 C 0.28 36.40 D
NB TR 1.05 67.20 E 0.69 27.60 C 0.70 27.70 C SB L 0.16 44.10 D 0.19 29.50 C 0.22 31.30 C
Ocean Pkwy @ Avenue X
SB TR 0.71 28.00 C 0.70 27.90 C 0.72 28.50 C

4-24
Table 4-2: Traffic Capacity Analysis for Signalized Intersections (2002 Existing Conditions)
Page 3 of 5
Lane AM MID PM
INTERSECTION Group V/C DELAY LOS V/C DELAY LOS V/C DELAY LOS
EB LTR 0.90 74.20 E 0.74 51.10 D 0.84 63.30 E
WB LTR 1.05 106.50 F 0.91 74.10 E 1.05 100.70 F
NB L 0.18 19.30 B 0.25 21.90 C 0.38 30.50 C
NB TR 0.94 33.60 C 0.49 20.60 C 0.55 18.80 B SB L 0.50 54.00 D 0.26 20.50 C 0.39 28.60 C
Ocean Pkwy @ Avenue Z
SB TR 0.52 18.30 B 0.53 21.20 C 0.58 19.40 B
WB LR 0.45 19.20 B 0.56 21.10 C 0.65 23.80 C NB TR 0.42 10.30 B 0.41 10.20 B 0.43 10.40 B Shell Road @ Avenue Z
SB LT 0.64 13.50 B 0.68 14.70 B 0.74 16.50 B
EB LTR 0.88 31.20 C 0.54 15.10 B 0.89 32.00 C
WB LTR 0.38 14.80 B 0.43 13.30 B 0.46 15.90 B NB LTR 0.23 18.90 B 0.11 15.60 B 0.17 18.20 B
Shell Road/West 8th Street @ Neptune Avenue
SB LTR 0.34 20.00 C 0.38 18.20 B 0.48 21.90 C
EB L 0.91 102.00 F 0.65 32.70 C 1.05 142.60 F
EB TR 0.76 53.40 D 0.65 27.30 C 1.05 98.90 F
WB L 0.32 38.20 D 0.38 22.40 C 1.05 144.20 F
WB TR 1.05 104.80 F 0.67 28.20 C 1.05 101.20 F NB LTR 0.31 10.50 B 0.60 19.50 B 0.55 14.00 B
Coney Island Avenue @ Neptune Avenue
SB LTR 0.44 12.30 B 0.23 14.20 B 0.59 15.00 B
EB TR 0.53 14.60 B 0.31 12.00 B 0.55 14.90 B
WB LT 0.47 14.00 B 0.40 13.00 B 0.66 17.50 B West 12th Street @ Neptune Avenue
NB LR 0.31 23.70 C 0.26 23.20 C 0.26 23.00 C
EB L 0.37 34.90 C 0.71 42.40 D 0.71 42.70 D
TR 0.47 13.20 B 0.15 10.10 B 0.21 10.60 B
WB L 0.08 22.40 C 0.01 20.90 C 0.07 21.80 C
TR 0.97 51.00 D 0.64 29.70 C 0.71 31.60 C NB LTR 0.60 29.70 C 0.57 28.70 C 0.79 37.50 D SB L 0.90 65.80 E 1.00 87.50 F 1.05 92.20 F T 0.33 24.10 C 0.37 24.70 C 0.42 25.50 C
Cropsey Avenue @ Neptune Avenue & West 17th Street
R 0.56 14.20 B 0.35 11.50 B 0.39 11.90 B
EB LR 0.46 14.40 B 0.55 16.20 B 0.33 12.70 B
NB LT 0.27 12.00 B 0.35 13.10 B 0.43 14.00 B Mermaid Avenue @ Stillwell Avenue
SB TR 0.16 10.70 B 0.19 10.90 B 0.15 10.70 B

4-25
Table 4-2: Traffic Capacity Analysis for Signalized Intersections (2002 Existing Conditions)
Page 4 of 5
Lane AM MID PM
INTERSECTION Group V/C DELAY LOS V/C DELAY LOS V/C DELAY LOS
EB LTR 0.43 8.10 A 0.32 7.10 A 0.36 7.50 A
WB LTR 0.32 7.10 A 0.24 6.50 A 0.31 7.00 A NB LTR 0.06 28.20 C 0.72 56.70 E 0.25 30.90 C
Surf Avenue @ Stillwell Avenue
SB LTR 0.50 34.00 C 0.76 45.30 D 0.51 35.00 C EB L 0.13 6.10 A 0.17 6.40 A 0.19 6.70 A EB TR 0.26 6.60 A 0.20 6.20 A 0.21 6.30 A
WB L 0.01 5.30 A 0.00 5.20 A 0.07 5.70 A
WB TR 0.23 6.40 A 0.15 5.90 A 0.26 6.60 A NB LTR 0.01 27.50 C 0.26 30.70 C 0.44 34.10 C SB L 0.77 54.60 D 0.37 34.90 C 0.49 41.00 D
West 8th Street @ Surf Avenue
SB TR 0.09 28.30 C 0.42 32.30 C 0.20 29.50 C
EB LTR 0.57 16.30 B 0.45 14.00 B 0.49 15.10 B
WB LTR 0.30 12.20 B 0.29 12.10 B 0.39 13.20 B NB LTR 0.45 14.10 B 0.43 13.90 B 0.58 16.50 B
West 17th Street @ Mermaid Avenue
SB LTR 0.22 11.20 B 0.22 11.20 B 0.25 11.40 B
EB LTR 1.05 86.70 F 1.05 93.60 F 1.05 91.70 F
WB LTR 1.05 88.90 F 1.05 85.70 F 1.05 83.20 F NB LTR 0.44 14.00 B 0.55 15.80 B 0.55 15.80 B
Coney Island Avenue @ Guider Avenue
SB LTR 0.41 13.90 B 0.34 13.10 B 0.48 15.00 B EB LTR 0.28 41.20 D 0.29 41.90 D 0.36 42.50 D WB LTR 0.43 32.80 C 0.44 27.40 C 0.51 34.20 C NB L 0.01 10.10 B 0.01 14.60 B 0.01 10.10 B NB TR 0.12 21.20 C 0.16 29.80 C 0.19 25.10 C SB L 0.26 13.10 B 0.34 19.70 B 0.39 15.70 B
Brighton Beach Avenue @ Ocean Parkway
SB TR 0.13 21.30 C 0.19 30.10 C 0.17 24.80 C
EB L 0.83 76.50 E 1.05 106.40 F 0.99 111.20 F
TR 0.62 44.70 D 0.72 41.10 D 0.49 39.90 D
WB LTR 0.77 48.50 D 0.75 36.50 D 0.65 42.00 D NB LTR 0.17 25.00 C 0.43 30.20 C 0.60 35.40 D
Brighton Beach Avenue @ Coney Island Avenue
SB LTR 1.05 96.70 F 1.05 89.90 F 1.05 92.00 F EB LTR 1.05 80.90 F 1.05 82.90 F 1.05 79.70 E WB LTR 1.05 98.70 F 1.05 95.90 F 1.05 93.70 F NB L 0.06 19.20 B 0.12 20.30 C 0.16 23.80 C NB TR 0.28 28.50 C 0.33 30.50 C 0.37 31.10 C SB L 0.43 24.70 C 0.53 30.90 C 0.68 38.20 D
Neptune Avenue @ Ocean Parkway
SB TR 0.39 30.10 C 0.35 30.8 C 0.5 33.1 C

4-26
Table 4-2: Traffic Capacity Analysis for Signalized Intersections (2002 Existing Conditions)
Page 4 of 5
Lane AM MID PM
INTERSECTION Group V/C DELAY LOS V/C DELAY LOS V/C DELAY LOS
EB L 0.19 35.30 D 0.19 29.60 C 0.27 44.60 D
T 0.43 38.70 D 0.43 32.00 C 0.51 40.70 D
R 0.56 36.40 D 0.69 35.70 D 0.74 44.60 D
WB L 0.21 23.30 C 0.19 19.10 B 0.34 25.40 C
TR 0.41 25.70 C 0.61 25.00 C 1.05 74.40 F
NB L 0.11 24.20 C 0.7 38.90 D 1.05 115.60 F
TR 0.19 16.90 B 0.44 15.30 B 0.53 21.60 C
SB L 0.1 24.30 C 0.23 22.40 C 0.30 30.60 C
Bay Parkway @ Cropsey Avenue
TR 0.61 32.30 C 0.74 29.60 C 0.96 54.50 D
EB T 0.45 12.20 B 0.46 14.80 B 0.40 13.80 B
WB TR 0.28 9.60 A 0.30 11.90 B 0.23 11.20 B Brighton Beach Avenue @ Brighton
11th Street SB LR 0.39 21.80 C 0.27 22.60 C 0.46 26.50 C
EB T 0.55 16.00 B 0.53 15.8 B 0.53 15.6 B
WB T 0.43 13.90 B 0.45 14.2 B 0.58 16.5 B NB LR 0.07 20.40 C 0.15 21.4 C 0.06 20.3 C SB L 0.47 24.70 C 0.39 23.5 C 0.45 24.4 C
Neptune Avenue @ Brighton 10th Street
SB R 0.13 21.20 C 0.17 21.7 C 0.11 20.9 C
EB L 0.33 21.00 C 0.35 23.70 C 0.41 27.20 C
TR 0.32 18.60 B 0.31 20.90 C 0.36 21.60 C
WB L 0.79 24.90 C 0.57 17.90 B 0.72 25.10 C
TR 0.39 8.80 A 0.33 10.40 B 0.46 11.70 B
NB L 0.71 39.00 D 0.54 35.60 D 0.48 34.30 C
T 0.46 30.80 C 0.30 30.50 C 0.39 32.00 C
Neptune/Emmons Avenue @ E 14th St./Shore Blvd
R 0.60 25.00 C 0.71 32.40 C 0.74 33.40 C
EB TR 0.12 6.40 A 0.14 6.60 A 0.18 6.80 A
WB LT 0.18 6.80 A 0.21 7.00 A 0.37 8.30 A Brighton Beach Avenue @ Brighton
4th Street SB LTR 0.24 28.80 C 0.27 29.20 C 0.69 41.70 D
EB LTR 0.65 44.10 D 0.51 27.1 C 0.56 35.8 D
WB LTR 0.64 45.00 D 0.55 27.9 C 0.67 39.3 D
NB L 0.18 14.30 B 0.37 20.5 C 0.36 24.3 C
NB TR 0.3 14.30 B 0.41 17.6 B 0.38 21.3 C
SB L 0.14 10.90 B 0.09 11.8 B 0.16 16.8 B
Coney Island Avenue @ Avenue Z
SB TR 0.29 9.30 A 0.32 10.6 B 0.28 12.3 B
: approach with LOS F

4-27
CO
NEY
ISLA
ND
AV
E.
KINGS HIGHWAY
AVE. X
AVE. U
OCEA
N PA
RKW
AY
MC
DO
NA
LD A
VE.
BAY PARKW
AY
STILLWELL A
VE.
SHORE PARKWAY
NEPTUNE AVE.
BRIGHTON BEACH AVE.
86TH ST.
BELT PARKWAY
CROPSEY AVE.
N
Figure 4-8: Intersections with LOS D, E, and F (AM Peak Hour)
MERMAID AVE.
SURF AVE.
W 37TH
ST.
W 31ST ST.
W 21ST ST.
W 17TH
ST.
STILLWELL A
VE.
W 1
2TH
ST.
W 8
TH S
T.
SHEL
L R
OA
D
AVE. Y
AVE. Z
BATH AVE.
BENSON AVE.
HARWAY AVE.
BAY 48TH
ST.
BAY 49TH ST
.
23RD A
VE.
BAY 35TH ST
.
BAY 32ND ST
.
81TH ST.
84TH ST.
W. 5TH
ST.
W. 7TH
ST.
W 9TH
ST.
W. 11TH
ST.
AVE. W
AVE. T
AVE. S
W. 3R
D ST.
E 3RD
ST.E. 2N
D ST.
LegendLOS D (Intersection Delay > 45 sec./veh.)LOS ELOS F
BRIG
HTON
11th
ST.
CO
RBIN
Pl.W
EST END
AV
E.

4-28
CO
NEY
ISLA
ND
AV
E.
KINGS HIGHWAY
AVE. X
AVE. U
OCEA
N PA
RKW
AY
MCD
ON
ALD
AV
E.
BAY PARKW
AY
STILLWELL A
VE.
SHORE PARKWAY
NEPTUNE AVE.
BRIGHTON BEACH AVE.
86TH ST.
BELT PARKWAY
CROPSEY AVE.
N
Figure 4-9: Intersections with LOS D, E, and F (Midday Peak Hour)
MERMAID AVE.
SURF AVE.
W 37TH
ST.
W 31ST ST.
W 21ST ST.
W 17TH
ST.
STILLWELL A
VE.
W 1
2TH
ST.
W 8
TH S
T.
SHEL
L R
OA
D
AVE. Y
AVE. Z
BATH AVE.
BENSON AVE.
HARWAY AVE.
BAY 48TH ST
.
BAY 49TH ST
.
23RD A
VE.
BAY 35TH ST
.
BAY 32ND ST
.
81TH ST.
84TH ST.
W. 5TH
ST.
W. 7TH
ST.
W 9TH
ST.
W. 11TH
ST.
AVE. W
AVE. T
AVE. S
W. 3RD
ST.
E 3RD ST.
E. 2ND
ST.
LegendLOS D (Intersection Delay >45 sec./veh.)LOS ELOS F
BRIG
HTON
11th
ST.
CO
RBIN
Pl.W
EST END
AV
E.

4-29
CO
NEY
ISLA
ND
AV
E.
KINGS HIGHWAY
AVE. X
AVE. U
OC
EAN
PAR
KW
AY
MC
DO
NA
LD A
VE.
BAY PARKW
AY
STILLWELL A
VE.
SHORE PARKWAY
NEPTUNE AVE.
BRIGHTON BEACH AVE.
86TH ST.
BELT PARKWAY
CROPSEY AVE.
N
Figure 4-10: Intersections with LOS D, E, and F (PM Peak Hour)
MERMAID AVE.
SURF AVE.
W 37TH
ST.
W 31ST ST.
W 21ST ST.
W 17TH
ST.
STILLWELL A
VE.
W 1
2TH
ST.
W 8
TH S
T.
SHEL
L R
OA
D
AVE. Y
AVE. Z
BATH AVE.
BENSON AVE.
HARWAY AVE.
BAY 48TH ST
.
BAY 49TH ST
.
23RD A
VE.
BAY 35TH ST
.
BAY 32ND ST
.
81TH ST.
84TH ST.
W. 5TH
ST.
W. 7TH
ST.
W 9TH
ST.
W. 11TH
ST.
AVE. W
AVE. T
AVE. S
W. 3R
D ST.
E 3RD
ST.E. 2N
D ST.
LegendLOS D (Intersection Delay >45 sec./veh.)LOS ELOS F
BRIG
HTON
11t
h ST
.
CO
RB
IN Pl.
WEST EN
D A
VE.

4-30
4.7 Vehicular Speeds
To measure peak hour travel time and vehicular speeds in the study area and to identify locations
where traffic delay exists, speed and travel time runs were conducted.
The travel time runs were conducted for each peak period for three consecutive weekdays
concurrently with traffic volume data collection. Three travel runs were performed for each link
during each peak travel period.
The “floating car” method (a technique whereby a field vehicle travels at speeds under prevailing
traffic conditions) was used to measure travel time and speed. Travel time and speed runs were
conducted at the following corridors:
1. McDonald Avenue/Shell Road from Kings Highway to Neptune Avenue
2. Ocean Parkway from Kings Highway to Surf Avenue
3. King Highway from Coney Island Avenue to Bay Parkway
4. Cropsey Avenue from Bay Parkway to Neptune Avenue
5. Coney Island Avenue from Kings Highway to Brighton Beach Avenue
6. 86th Street from Bay Parkway to Stillwell Avenue
7. Avenue U from 86th Street to Coney Island Avenue
8. Brighton Beach Avenue from Coney Island Avenue to Ocean Parkway
9. Neptune Avenue from Cropsey Avenue to Coney Island Avenue
10. Bay Parkway from Kings Highway to Shore (Belt) Parkway
11. Surf Avenue from Ocean Parkway to West 37th Street
12. Stillwell Avenue from Surf Avenue to Kings Highway
Congestion occurs on several corridors and intersections particularly during the peak hours. The
conditions are attributed to several factors including bus, car, truck, and pedestrian conflicts, as
well as illegal curbside and double parking and standing which reduce roadway capacity and
result in delays and reduced travel speeds. This is evident along same corridors such as Kings
Highway, 86th Street, McDonald Avenue, and Brighton Beach Avenue.

4-31
Figure 4-11 shows the corridors where travel time runs were conducted and Table 4-3
summarizes the average travel speeds for each corridor by direction for the various peak hours.
Travel speeds throughout the study area for the various peak periods range from 8 mph to 31
mph. The corridors with low speeds, i.e. less than 10 mph during one or more peak hours, are:
• Kings Highway;
• 86th Street;
• Brighton Beach Avenue, and
• Avenue U.

4-32
CO
NEY
ISLA
ND
AV
E.
KINGS HIGHWAY
AVE. X
AVE. U
OC
EAN
PAR
KW
AY
MC
DO
NA
LD A
VE.
BAY PARKW
AY
STILLWELL A
VE.
SHORE PARKWAY
NEPTUNE AVE.
BRIGHTON BEACH AVE.
86TH ST.
BELT PARKWAY
CROPSEY AVE.
N
Figure 4-11: Speed Run Corridors
MERMAID AVE.
SURF AVE.
W 37TH
ST.
W 31ST ST.
W 21ST ST.
W 17TH
ST.
STILLWELL A
VE.
W 1
2TH
ST.
W 8
TH S
T.
SHEL
L R
OA
D
AVE. Y
AVE. Z
BATH AVE.
BENSON AVE.
HARWAY AVE.
BAY 48TH ST
.
BAY 49TH ST
.
23RD A
VE.
BAY 35TH ST
.
BAY 32ND ST
.
81TH ST.
84TH ST.
W. 5TH
ST.
W. 7TH
ST.
W 9TH
ST.
W. 11TH
ST.
AVE. W
AVE. T
AVE. S
W. 3R
D ST.
E 3RD ST.
E. 2ND
ST.
Study Area
Speed Run Corridor
BRIG
HTON
11T
H ST
.
CO
RB
IN PL.
WEST EN
D A
VE.
Legend

4-33
Table 4-3: Corridor Travel Speeds (Page 1 of 2)
Existing Conditions
No.
Corridors Peak Hour
Direction Average Speed NB 13
AM SB 14 NB 14
MD SB 14 NB 15
1 McDonald Avenue/Shall
Road/West 8th Street from Kings Highway to Surf Avenue
PM SB 16 NB 22
AM SB 14 NB 15
MD SB 14 NB 13
2
Ocean Parkway from Kings Highway to Surf Avenue
PM SB 31 EB 11
AM WB 13 EB 11
MD WB 9 EB 9
3
King Highway from Coney Island Avenue to Bay Parkway
PM WB 10 EB 12
AM WB 20 EB 13
MD WB 18 EB 13
4
Cropsey Avenue from Bay Parkway to Neptune Avenue
PM WB 20 NB 18
AM SB 15 NB 13 MD SB 14 NB 14
5
Coney Island Avenue from Kings Highway to Brighton Beach Avenue
PM SB 20 EB 11
AM WB 15 EB 12
MD WB 9 EB 14
6
86th Street from Bay Parkway to Stillwell Avenue
PM WB 10

4-34
Table 4-3: Corridor Travel Speeds (Page 2 of 2)
Existing Conditions
No.
Corridors Peak Hour
Direction Average Speed NB 12
AM SB 16 NB 13
MD SB 17 NB 14
7 Stillwell Avenue from Surf
Avenue to Kings Highway
PM SB 16 EB 16
AM WB 17 EB 18
MD WB 18 EB 16
8
Surf Avenue from Ocean Parkway to West 37th Street
PM WB 23 NB 15
AM SB 12 NB 15
MD SB 16 NB 14
9
Bay Parkway from Kings to Shore (Belt) Parkway
PM SB 10 EB 12
AM WB 11 EB 14
MD WB 13 EB 12
10
Neptune Avenue from Cropsey Avenue to Coney Island Avenue
PM WB 13 EB 9
AM WB 9 EB 9 MD WB 8 EB 11
11
Brighton Beach from Coney Island Avenue to Ocean Parkway
PM WB 9 EB 12
AM WB 10 EB 9
MD WB 10 EB 10
12
Avenue U from 86th Street to Coney Island Avenue
PM WB 9
4-35
4.8 Goods Movement
There are a lot of goods movements along some corridors where commercial activities are
concentrated. In general, goods movement occurs along designated truck routes. The designated
truck routes in the study area are shown in Figure 4-12. The truck route network comprises two
categories of routes:
(a) Through truck routes - routes for use by all trucks and;
(b) Local truck routes - routes for use by trucks with local origins and/or destinations. There are no through truck routes in the Study area. The local truck routes in the study area are:
• Bay Parkway from Kings Highway to Shore Parkway Service Road
• King Highway from Coney Island Avenue to Bay Parkway
• McDonald Avenue/Shell Road from Kings Highway to Neptune Avenue
• Coney Island Avenue from Kings Highway to Neptune Avenue
• Neptune Avenue from Coney Island Avenue to Cropsey Avenue
• Cropsey Avenue from Bay Parkway to Neptune Avenue
• Avenue U from West 12th Street to Coney Island Avenue
• 25th Avenue from Cropsey Avenue to 86th Street
• 86th Street from 25th Avenue to West 12th Street
Truck traffic on the local truck routes in the study area shows morning and midday peaks, with a
sharp drop in volume after 4PM. In general, inbound volumes are highest during the morning peak.
Due to a deficiency in designated loading and unloading areas for commercial vehicles along the
major corridors where commercial activities are concentrated, delivery trucks sometimes
illegally or double park. This is particularly evident at the following locations:
• Kings Highway between McDonald Avenue and Stillwell Avenue;
• Brighton Beach between Ocean Parkway and Brighton 12th Street;
• 86th Street from Bay Parkway to Stillwell Avenue;
• McDonald Avenue between Avenue X and Kings Highway.

4-36
CO
NEY
ISLA
ND
AV
E.
KINGS HIGHWAY
AVE. X
AVE. U
OC
EAN
PAR
KW
AY
MC
DO
NA
LD A
VE.
BAY PARKW
AY
STILLWELL A
VE.
SHORE PARKWAY
NEPTUNE AVE.
BRIGHTON BEACH AVE.
86TH ST.
BELT PARKWAY
CROPSEY AVE.
N
Figure 4-12: Truck Routes
MERMAID AVE.
SURF AVE.
W 37TH
ST.
W 31ST ST.
W 21ST ST.
W 17TH
ST.
STILLWELL A
VE.
W 1
2TH
ST.
W 8
TH S
T.
SHE L
L R
OA
D
AVE. Y
AVE. Z
BATH AVE.
BENSON AVE.
HARWAY AVE.
BAY 48TH ST
.
BAY 49TH ST
.
23RD A
VE.
BAY 35TH ST
.
BAY 32ND ST
.
81TH ST.
84TH ST.
W. 5TH
ST.
W. 7TH
ST.
W 9TH
ST.
W. 11TH
ST.
AVE. W
AVE. T
AVE. S
W. 3R
D ST.
E 3RD
ST.E. 2N
D ST.
Study Area
Local Truck Routes
25TH A
VE.
BRIG
HTON
11T
H ST
.
CO
RB
IN PL.
WEST EN
D A
VE.
Legend