4.0 instream flow studies - pacificorp instream flow studies ... model input variables, and analysis...
TRANSCRIPT
February 2004 PacifiCorp Fish Resources FTR Page 4-1Fish Resources FTR.DOC
4.0 INSTREAM FLOW STUDIES
This study has received much attention from PacifiCorp and the relicensing stakeholders. Manymeetings have been conducted by the Aquatic Working Group and the Working Group’sInstream Flow Subgroup. The Subgroup was formed to work through technical issues andtowards agreed upon instream flow input, analysis, and recommendations. PacifiCorprecognizes, and requests that FERC also recognize that additional collaboration, refinement ofmodel input variables, and analysis is needed with stakeholders to meet the company’scommitment to complete the instream flow study needed to provide a good technical basis forinstream flow recommendations. This includes such items as working collaboratively to developand produce agreed upon modeling input, and consequently modeling results andrecommendations.
PacifiCorp constructed its own rainbow trout envelope curves that were used for the instreamflow analysis. However, these curves have not been reviewed or approved by the Instream Flowsubgroup. As such, stakeholders have technical uncertainty surrounding the instream flowanalysis presented in this application. PacifiCorp and the stakeholders will continue to developKlamath River HSC curves.
In order to address the instream flow study tasks, PacifiCorp and relicensing stakeholders willcontinue to meet to work on the following:
• Approve rainbow trout and sucker HSC curve.
• Develop a habitat time series.
• Complete bioenergetics modeling efforts.
• Conduct peaking analysis.
• Discuss modeling results as they relate to fisheries and other interrelated studies (e.g.,recreation, geomorphology, etc.).
• Develop river flow regime recommendations for aquatic resources.
It is anticipated that the above tasks will be completed by the end of May 2004. At theconclusion of these tasks, a final instream flow report will be distributed to FERC and interestedstakeholders by the end of June 2004. At that time PacifiCorp will review this additionalinformation, and revise as appropriate the Project Operations and PM&E measures included inthis License Application.
4.1 DESCRIPTION AND PURPOSE
In addition to providing hydroelectric benefits, flows released below hydroelectric projectsshould protect or enhance the aquatic ecosystem, and, more specifically, those resources that areconsidered important from a commercial fishery, sport fishery, or threatened/endangered speciesperspective. Instream flows are almost universally specified in a FERC license and should bebased on relevant site-specific information from the project area. Stakeholders participating inFERC relicensing processes commonly rely on information generated from instream flow studies
PacifiCorpKlamath Hydroelectric ProjectFERC No. 2082
Fish Resources FTR Page 4-2 February 2004 PacifiCorpFish Resources FTR.DOC
to develop recommended instream flow regimes. The FERC uses these types of studies during itsresource balancing deliberations before issuing long-term licenses.
Instream flow requirements, especially in the powerhouse bypass reaches, have significantconsequences for power production as well as fish resources and, therefore, must be based onsound evaluation. Analysis of site-specific information, coupled with the results of the fisheriesassessment, was used in discussions with the stakeholders to determine further courses of actionregarding instream flow requirements in each bypass reach. The results of these discussionsdetermined (1) whether minimum flows needed to be maintained or modified to offer adequatefisheries (and other resources) protection, and (2) additional field studies that were required.Alternatives for minimum flow modifications have been made with consideration for biologicalneeds of the fishery, wildlife, recreation activities, and the economic consequences of powergeneration.
Instream Flow Incremental Methodology (IFIM) was agreed upon as the approach to instreamflow analysis in the Project area. The IFIM is a structured habitat evaluation process initiallydeveloped by the Instream Flow Group of the USFWS in the late 1970s to allow evaluation ofalternative flow regimes for water development projects (Bovee and Milhous, 1978; Bovee et al.1998). Techniques used in the IFIM process have continued to evolve since its introduction(Bovee and Zuboy, 1988; Bremm, 1988; Payne, 1987, 1988a, 1988b, 1992). Improvements havebeen made in the process of scoping and results interpretation (Bovee, 1982), in the approachesto defining study reaches (Morhardt et al. 1984), in transect selection (Payne, 1992), and in thetechniques of data collection, computer modeling, and analysis (Milhous et al. 1984, 1989;Milhous and Schneider, 1985). The IFIM involves multiple scientific disciplines andstakeholders, in the context of which physical habitat simulation studies usually are designed andimplemented.
Critical stakeholder concurrence on study scope, design elements, and overall adequacy fordecisionmaking is one of the principal objectives of IFIM scoping, one of the first identifiedsteps of the methodology (Bovee et al. 1998). Depending on the desires of the participants, theIFIM can be completely comprehensive for all aquatic aspects of flow regulation or tightlyfocused on topics of specific concern. The study and evaluation of instream flow needs as itrelates to aquatic habitat is based primarily on the PHABSIM option within the IFIM. The IFIM,for example, also can be designed to address channel stability, patterns of hydrologic alteration,species interaction, and water quality. This study is based on extended discussions andagreements forged during multiple stakeholder/resource agency meetings, instream flowworkshops, and Project area site visits. Documentation of the this process is detailed in the1.8 Instream Flow Scoping Plan and 1.12 Instream Flow Analysis Study Plan reports, which areincluded as part of the FERC license application.
The purpose of this instream flow study is to provide biologists, resource managers, and others inthe instream flow decisionmaking process with a technical basis for systematically evaluatingflow alternatives on the basis of the effects that those flows have on important fish habitats andother flow-related resources. The study results and rationale have provided the framework forincluding biological considerations in the process of deciding future flows for Project operation.If consensus on instream flows cannot be reached, this study fully documents and supports therationale for instream flow recommendations so that the FERC and other agency staffs can fairlyevaluate and balance the benefits and costs associated with the recommendations.
PacifiCorpKlamath Hydroelectric Project
FERC No. 2082
February 2004 PacifiCorp Fish Resources FTR Page 4-3Fish Resources FTR.DOC
4.2 OBJECTIVES
The PHABSIM study was used to determine the incremental relationship between stream flowand WUA for various life stages of selected fish in the Project area. PHABSIM relies onhydraulic data collection for calibration of computer simulation models, plus fish species/lifestage suitability criteria (also called habitat suitability criteria [HSC]) for the major habitatcomponent variables of velocity, depth, and substrate/cover. The WUA index can be interpretedin the context of stream hydrology and species life history to evaluate project impacts, and servesas a partial basis for determining project alternatives and mitigation, along with the results ofother studies. The PHABSIM study has the following objectives:
• Verify and/or develop habitat index-flow relationships (WUA) for the fry, juvenile, and adultlife stages of target fish (or other) species.
• Provide calibrated hydraulic data file for potential application to habitat suitability indices forsubsequently identified fish species, habitat guilds, or fish passage needs.
• Provide additional physical habitat information for application to other study plans (e.g.,riparian vegetation, water quality, or substrate particle incipient motion analyses).
4.3 RELICENSING RELEVANCE AND USE IN DECISIONMAKING
The results of the PHABSIM study are intended to provide baseline information that, togetherwith environmental data and results of other past and ongoing studies, can be used to assesseffects of Project operations on fish habitat and to help formulate recommendations for PM&Emeasures consistent with agency and tribal management goals. Ultimately the WUA values fromthe PHABSIM study will be used in conjunction with the results of other studies (such as waterquality, recreation, terrestrial, cultural, and power generation) to prescribe instream flows thatbest meet the multiple objectives determined during the stakeholder scoping process.
4.4 METHODS AND GEOGRAPHIC SCOPE
4.4.1 Geographic Scope
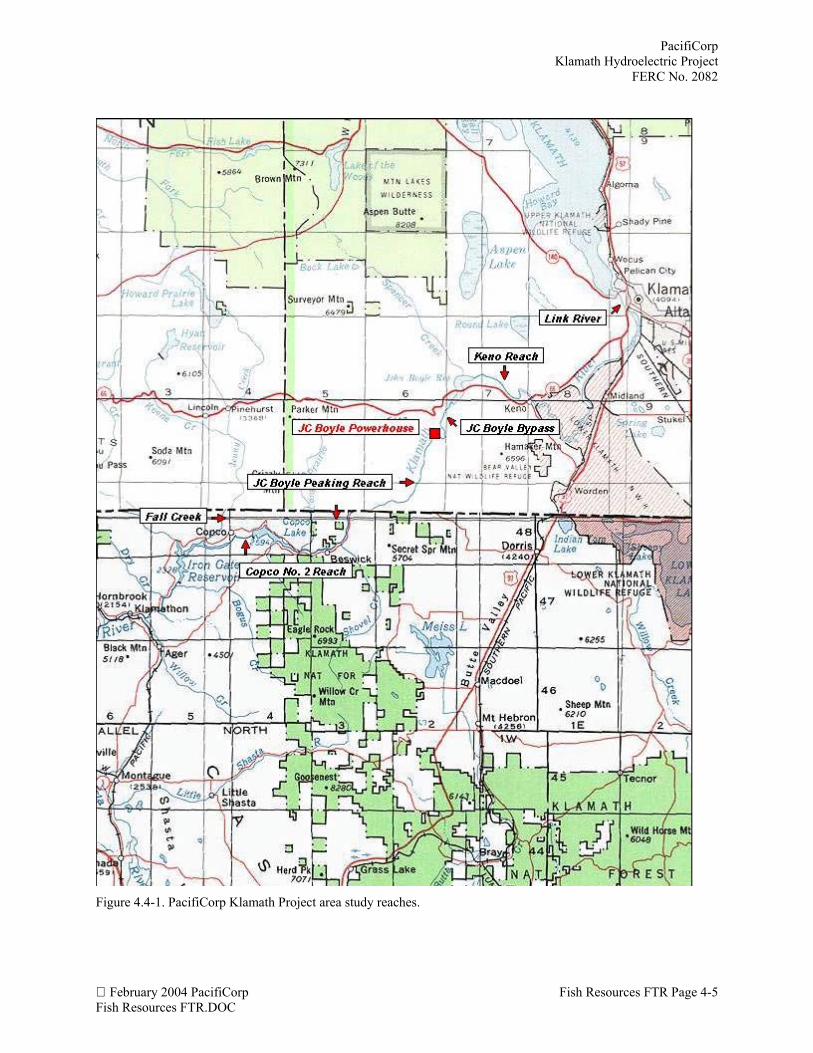
The geographic scope of the Upper Klamath River instream flow studies begins at Link Riverdam (the lake level control dam on Upper Klamath Lake and extends downstream to Iron Gatedam (Figure 4.4-1) Even though PacifiCorp recognizes the importance of maintaining minimumflows to meet certain fisheries needs in all river reaches, it now has little or no control of flow inmany segments of the river. Recent federal listings of Klamath Lake suckers and coho salmon inthe Klamath River under the ESA has constrained overall system operation by the USBR to thedictates of formal BOs written by the USFWS and NOAA Fisheries (USFWS, 2002; NOAAFisheries, 2002).
• Instream flow evaluations were conducted in the following reaches of the Klamath River orits tributaries where PacifiCorp has some significant measure of flow control: J.C. Boylebypass reach
• J.C. Boyle peaking reach
PacifiCorpKlamath Hydroelectric ProjectFERC No. 2082
Fish Resources FTR Page 4-4 February 2004 PacifiCorpFish Resources FTR.DOC
• Copco No. 2 bypass reach
• Fall Creek bypass reach
Instream flow evaluations were not conducted in the following river reaches for the indicatedreasons:
• Downstream of the Link River dam (although fieldwork was completed, an evaluation wasnot done as PacifiCorp is proposing to decommission the East Side and West Sidedevelopments).
• Downstream of Copco No. 1 dam (discharges directly to reservoir)
• Fall Creek downstream from the powerhouse (run-of-river below powerhouse)
• Downstream of Iron Gate dam (under current operations, meeting minimum flows beyondIron Gate dam is a USBR obligation; also, a detailed instream flow study already has beenconducted)
4.4.2 Methods
4.4.2.1 Habitat Mapping
Habitat mapping provides an overall instream mesohabitat (e.g., pools, riffles, runs, etc.)representation of each stream reach in the Project area. In addition, results of habitat mappingaids transect selection and habitat weighting in reaches where fish habitat modeling wasproposed. The U.S. Forest Service (USFS) (McCain et al. 1990, Overton et al. 1997) and CDFG(Flosi et al. 1998) have developed widely accepted stream habitat classification systems. TheCDFG habitat classification and typing definitions are derived wholly from the USFS systems.These classification schemes are based on hierarchical gradation ranging from two to three basichabitat types (riffle-pool, riffle-flatwater-pool) up to 24 types. The most diverse grouping is poolhabitat, with up to 15 different types, falling into three basic categories: main channel, lateralscour, and backwater. ODFW also has developed a habitat mapping procedure for streaminventory investigations (Moore et al. 1998), which had been applied previously to the J.C.Boyle bypass and peaking reaches.
The above habitat type classification regimes were evaluated for the Klamath Project studies.The standard USFS habitat unit types and descriptions were selected with the exception that allmain channel and scour pool types were lumped into a single type. Keeping the number ofhabitat types to a manageable level allows for more accurate and consistent visual classification(Roper and Scarnecchia, 1995; Poole et al. 1997) and, if the need arises, allows for repeatability.
PacifiCorpKlamath Hydroelectric Project
FERC No. 2082
February 2004 PacifiCorp Fish Resources FTR Page 4-5Fish Resources FTR.DOC
Figure 4.4-1. PacifiCorp Klamath Project area study reaches.
PacifiCorpKlamath Hydroelectric ProjectFERC No. 2082
Fish Resources FTR Page 4-6 February 2004 PacifiCorpFish Resources FTR.DOC
The following habitat types and definitions were used for mapping in the Project area:
• Pool—Areas of scour in the stream channel with column velocities usually less than 1 footper second (fps) (0.3 m/s). Pools also generally lack surface agitation and commonly containeddies or other slow water areas along one or both banks. This macrohabitat categoryincludes main channel pools and scour pools. Other pool types that are generally notedinclude corner, plunge, and trench. Backwater pools are noted during mapping, but are notconsidered as individual habitat units.
• Run—Areas of swift flow with little surface agitation and no major flow obstructions. Mayoccur at heads or tails of pools. Between hydraulic controls, may appear as flooded rifflesand might contain some waves. Mean column velocities are generally in excess of 1 fps(0.3 m/s).
• Glide—Generally wide uniform channels with no flow obstructions, no surface agitation andlow velocities. May occur at tails of pools. Substrate usually consists of cobble, gravel, andsand.
• Pocket Water—A section of swift flowing stream containing numerous boulders or otherlarge obstructions, which create eddies or scour pockets. Velocities and depths are similar torun habitats. Pocket water habitat may contain small hydraulic breaks, counter currents, andvelocity shear zones.
• Low Gradient Riffle—Shallow areas with swiftly flowing, turbulent water often with somepartially exposed substrate. Gradient less than 4 percent, usually dominated by cobblesubstrate.
• High Gradient Riffle—Areas of steep, moderately swift and turbulent water. Exposedsubstrate is relatively great and dominated by boulders. Gradient generally more than 4percent. Usually contains steps and multiple water surface elevations.
• Cascade—The steepest riffle habitat, consisting of alternating small waterfalls and shallowpools. Substrate generally boulder or bedrock. Usually contains white water at higher flows.Generally contains steps and multiple water surface elevations.
Habitat mapping was conducted by walking along the stream bank or by raft (J.C. Boyle peakingreach). Individual macrohabitat types were identified along the stream course with referencepoints, using the global positioning system (GPS) position and/or flagging, and were establishedat regular intervals to assist in relocating habitat units. Mapping within a given reach wasconducted under various flow conditions dependent on Project operation at the time.
Lengths were measured with a hip-chain calibrated in feet. Width measurements were obtainedwith a laser rangefinder. On long or irregularly shaped units, multiple width measurements wereaveraged. Maximum depth was estimated on most units with a stadia rod. In the J.C. Boylebypass and Keno reaches, it was not always possible to determine the maximum depth becausewading was difficult and hazardous. In such cases, the best estimate was recorded. Gradient wasdetermined using a hand-held level and stadia rod. Because of distance limitations of a hand-heldlevel (maximum 50 to 60 feet (15.2 to 18.3 m) gradient in long units was estimated in a ‘typical’section of the unit.
PacifiCorpKlamath Hydroelectric Project
FERC No. 2082
February 2004 PacifiCorp Fish Resources FTR Page 4-7Fish Resources FTR.DOC
Initial habitat mapping was conducted in Fall Creek, Copco No. 2 bypass, J.C. Boyle bypass,Keno reach, and Link River between March 19 and March 24, 2002. Mapping in the J.C. Boylepeaking reach was delayed until May 14, 2002, to allow time to determine the appropriatemethod and flow level for mapping. After initial mapping, a request was made by thestakeholders to provide additional information regarding width, depth, gradient, and substrate inFall Creek, J.C. Boyle bypass, and the Keno reach. Initial mapping in the Link River and CopcoNo. 2 bypass reaches was deemed adequate.
Habitat type boundaries were identified by breaks in stream channel slope or hydraulic controls.The minimum size of a habitat unit was not limited to the width of the wetted stream channel asoften is prescribed. This was done because: (1) a small unit, such as a cascade or riffle, is ahydraulic control and often is used as an identifier when relocating habitat units; and (2) a unitthat spans the width of the channel, such as a plunge pool between cascades, is considered aseparate habitat unit even though it may not be as long as the channel is wide. Some longer pooltails were identified as run and glide habitat with unit breaks identified by changes in depth andvelocity patterns. Habitat units with characteristics of more than one habitat type were identifiedwith a sub-type, although ordinarily only the primary type was used in calculating habitat typetotals and percentages.
Split channels (SPC) were indicated where a large island or bar existed (usually vegetated) andgenerally 10 percent or more of the total flow was in the secondary channel. Side channels (S/C)generally carried a small proportion of the total flow and sometimes were separated from themain channel by an island or boulder/cobble bar.
Substrate information was collected at regular intervals and/or when a change in overallcomposition was noted. Dominant and subdominant size classes were noted for all units.Because of visibility problems in the J.C. Boyle bypass and the Keno reaches, overallcomposition was often difficult to determine.
The following categories were used for substrate characterization during habitat mapping:
• Organic debris• Silt/mud• Fines less than 0.08 inch (0.2 cm)• Sand 0.08 to 0.25 inch(0.2 to 0.64 cm)• Gravel 0.25 to 3 inches (0.64 to 7.62 cm)• Small cobble 3 to 6 inches (7.62 cm to 15.2 cm)• Large cobble 6 to 12 inches (15.2 cm to 30.5 cm)• Small boulder 12 to 24 inches (30.5 cm to 61.0 cm)• Large boulder 24+ inches (61.0 cm)• Bedrock
General riparian composition was noted for habitat units or sections of a reach by recordingdominant/subdominant types and distance from waters edge. Large woody debris (LWD)accumulations also were noted and the number of pieces per unit recorded. LWD was defined asbeing at least 6 inches (15.2 cm) in diameter, and 6 feet (1.8 m) long, and within the activechannel.
PacifiCorpKlamath Hydroelectric ProjectFERC No. 2082
Fish Resources FTR Page 4-8 February 2004 PacifiCorpFish Resources FTR.DOC
The J.C. Boyle peaking reach was mapped by raft. Consequently, some of the previouslydescribed procedures were modified. The survey was conducted from the J.C. Boyle powerhouseto the top of Copco reservoir. A portion of the Hell’s Corner area containing numerous class IVrapids (Caldera Rapid to Snag Island, 19,464 feet (5,932.6 m) or approximately 20 percent of thetotal reach) was only partially mapped because of a lack of pull out areas for the rafts and theneed to keep electronic equipment dry. For this section of the reach, a combination of two datasources was used to complete the mapping: (1) data as collected for this study, and (2) datapreviously collected by the ODFW (1998). This involved comparing measured data at knownlocations in addition to the use of aerial photos to reconcile habitat unit locations and unitlengths. Because this section of river is composed primarily of rapids (most identified as steepriffles) and pools, it is felt that these data provide a satisfactory picture of the instream habitat inthis section of the reach.
Lengths were measured on the basis of GPS route coordinate lengths cross-checked with field-measured lengths. Widths were measured with a laser rangefinder while moving through units orwhen stopped. Maximum depths were estimated using either a hand-held depth finder or stadiarod. Depths were not measured on all riffle and run units because of a combination of highvelocities (in rapids) and turbulence that did not allow for reliable estimates. Short units(primarily steps, rapids, and runs) were measured only sporadically for depth.
Because it was impractical to stop rafts and measure slope in every habitat unit, it was necessaryto apply some sort of slope rating based on visual observations (see section below, AdditionalHabitat Mapping Considerations). Because the initial habitat categories for riffle included lowgradient (less than 4 percent) and high gradient (more than 4 percent), it was decided to dividethe riffles into low slope (zero to 2 percent), moderate slope (2 to 4 percent) and steep slope(more than 4 percent) categories. Run and pocket water, typically not steep slope habitat, wereseparated into low slope (zero to 1 percent), moderate slope (1 to 2 percent) and steep slope(more than 2 percent). Cascade habitat was not included in steep slope riffles because it isgenerally much steeper, contains vertical drops, and usually is not considered for modeling.Before habitat mapping the J.C. Boyle peaking reach, several riffles and runs were measured forslope to provide a basis for visual estimates in the field based on the slope categories describedpreviously. During habitat mapping, additional slope measurements were obtained on a varietyof runs (18) and riffles (45) to assist in visual determination during mapping and provide a goodsample of actual slopes.
Some aspects of habitat mapping and habitat types changed during the scoping process. Splittingof non-pool habitat types—riffles, runs and pocket waters—into slope categories was done toaccommodate agency requests to (1) attempt to duplicate habitat typing efforts in the LowerKlamath River below Iron Gate dam, and (2) provide estimates of habitat variability for samplesize selection. It was determined that slope categories used below Iron Gate dam were notapplicable to the Upper Klamath River. The categories were too narrow in breadth and did notapply to the generally steeper gradient character of the Upper Klamath River. The sample sizeselection process based on habitat variability was not pursued as a viable procedure.
During initial habitat mapping the tail-outs of many pools (and to a small extent runs at the headsof pools) were separated from the main pool body and identified as runs and/or glides. A requestby stakeholders to lump these units back into pools was completed before transect selection.However, during the July 24, 2002, field trip to view selected transects in the J.C. Boyle bypass
PacifiCorpKlamath Hydroelectric Project
FERC No. 2082
February 2004 PacifiCorp Fish Resources FTR Page 4-9Fish Resources FTR.DOC
reach with stakeholders it was noted that this process had flaws. As a result, before subsequenttransect selection in other reaches, combined habitat units were reexamined and adjustmentsmade where appropriate.
4.4.2.2 Study Site and Transect Selection
Habitat mapping formed the basis for study site and mesohabitat type selection. The percentcontribution of individual habitat types to total habitat is derived from the total length of a givenreach. The PHABSIM habitat analysis relies on hydraulic conditions measured along streamcross sections, or transects, placed in a variety of different mesohabitats.
High gradient riffle (steep slope more than 4 percent gradient) and cascade habitats were notused in study site or mesohabitat type selection. Generally, these habitats are too dangerous tonegotiate by wading or boat and usually are not suitable for adequate simulations using existinghydraulic models. Other units that could not be modeled during habitat mapping (examplesinclude transverse flow, multiple water surfaces across the channel, units immediately upstreamof cascades or rapids) also were excluded from the selection procedure. In addition, majormesohabitat types or subcategories, which account for less than 5 percent of the total reach, werenot included in the study site and habitat unit selection procedure.
Actual habitat unit selection was accomplished with a combination of random selection andprofessional judgment through the following procedure:
1. To encourage spatial separation of study sites, the study reach may have been separated intomultiple segments (two or more) by either gradient breaks, tributary location, length, or othercriteria.
2. Within the predetermined study reaches, the mesohabitat type (e.g., riffle, pool, pocketwater,run) with the lowest percentage of abundance (but more than 5 percent of the total by length)was used as the basis for selection of a random starting habitat unit. All habitat units in thiscategory sequentially were numbered and the first randomly selected unit was chosen.
3. In the field, the first randomly selected unit was relocated and, if it was able to be modeled,was reasonably typical (not atypical or unique), and safe to collect hydraulic data, the unitwas selected and flagged. If the unit was rejected for any reason, then the next randomlyselected unit was chosen.
4. At least one example of each remaining more-abundant mesohabitat type then was located inthe immediate vicinity of the random unit (the closest unit upstream or downstream). Thiscreates a “cluster” of habitat units to reduce data collection and travel time.
5. The same procedure was followed for the next randomly selected least-available unit untilthe total target number of mesohabitats was achieved in multiple clusters.
6. Additional habitat units may have been selected non-randomly by professional judgment torepresent unique, rare, or otherwise important habitat units (e.g., spawning, passage).
The process has the advantage of using randomization for selection without precluding the use ofprofessional judgment for sites that are unrepresentative or unworkable. It also establishes a
PacifiCorpKlamath Hydroelectric ProjectFERC No. 2082
Fish Resources FTR Page 4-10 February 2004 PacifiCorpFish Resources FTR.DOC
systematic approach and minimizes the time required for travel between study sites in the field.With the exception of low and high gradient riffles (habitat types used in the initial habitatmapping effort), slope subcategories for runs and pocket waters never were intended to representor be sampled as separate habitat types. However, these subcategories were used to assist intransect selection, and transects were placed in these habitat units in proportion to the basicmesohabitat type under which they occur. Before study site and transect selection, it was agreedthat at least three examples of each major mesohabitat type would be selected in each river reach(referred to as the “guideline of three”). In addition, three transects would be placed in eachmesohabitat type. Exceptions to the “guideline of three” number of transects is discussed underthe basic approach to transect selection and described in individual reach summaries.
In most cases, transects were placed near the top, middle, and bottom of each mesohabitat typeselected. Actual transect placement was to be agreed upon in the field with stakeholderrepresentatives.
The “guideline of three” was followed for transect placement in mesohabitat types selected, withfew exceptions. These exceptions are explained under individual reach descriptions that follow,and included agreement with stakeholders during transect selection that fewer than threetransects would be adequate.
4.4.2.3 Data Collection
The flows targeted for calibrating the PHABSIM hydraulic models have been identifiedconsidering water availability, project flow control capacity, physical safety, and desired flowrange for habitat analysis, incorporating unimpaired hydrology ranges where possible(Table 4.1-1). Velocity data acquisition target flows (bold) are primarily limited by physicalsafety for wading. Velocity data acquisition in the J.C. Boyle peaking reach and some sections ofthe bypass reach were by Acoustic Doppler Current Profiler (ADCP), operated from a boat,which is not as limited by concern for wading safety, which would be on the river margins only.
Table 4.4-1. Target measurement flows and proposed simulation flow range by reach, Klamath Riverinstream flow studies (bold italic is velocity data acquisition flow).
ReachTarget Measurement Flow
(cfs)Simulation Flow Range
(cfs)
J.C. Boyle Bypass1 100 to 325 475 to 700 1,5002 100 to 3,750J.C. Boyle Peaking 325 700 1,500 30003 250 to 7,500Copco 2 Bypass 200 600 1,500 100 to 3,750Fall Creek 2 5 10 1 to 251 Because of approximately 225 cfs of spring flow accretion in this reach, the lower end of range is
target flow at upstream end of the bypass reach and upper end of range is target flow at downstreamend of the bypass reach.
2 Where possible in this reach velocities will be obtained at 1,500 cfs. However, because of safetyconcerns, only acquisition of velocities along one or both side margins of the transects is expected inthis reach.
3 Where possible in this reach, velocities will be obtained along one or both side margins of thetransects at 3,000 cfs.
PacifiCorpKlamath Hydroelectric Project
FERC No. 2082
February 2004 PacifiCorp Fish Resources FTR Page 4-11Fish Resources FTR.DOC
PacifiCorp provided flow levels in the respective study reaches through stable controlled releasesfrom various Project facilities for the duration of time required. All the calibration flow releasedwere made so that they occur at the transect sites and were stable during daylight hours.
Complete sets of depths and velocities were collected approximately at the target velocity flowsat those areas that could be safely negotiated, or at the next lowest flow that could be safelyaccessed. Some additional velocity measurements were collected at other target flows in the J.C.Boyle bypass and peaking reaches. Additional measurements of water surface elevation for eachtransect and a single discharge measurement (per transect cluster) were made at the remainingflow levels. Pool transects, which cannot be safely waded, will be measured with the ADCPwhere feasible (depending mostly on access). See Section 4.7, Results and Discussion, for actualflows measured.
4.4.2.4 Field Techniques
Field data collection and the form of data recording follow the guidelines established in theInstream Flow Group (IFG) field techniques manuals (Trihey and Wegner, 1981; Milhous et al.1984; Bovee, 1997). Additional quality control checks that have been found valuable withprevious applications of the simulation models were included. The techniques for measuringdischarge generally followed the guidelines outlined by Rantz (1982). A minimum of 20 wettedstations per stream transect was established, with a goal of no less than 15 wetted stations at thelowest measured flow. Generally, 2- to 3-foot (0.6 to 0.9 m) stations are used for large channels(more than 75 feet (22.9 m) wetted width) and 1- to 2-foot (0.6 to 0.9) stations for mediumchannels and 0.5 to 1 foot (0.2 to 0.3 m) stations in small channels (less than 20 feet (6.1 m)wetted width). The boundaries of each station along each transect normally were at evenincrements, but significant changes in velocity, substrate, depth, or other important streamhabitat features may dictate additional stationing.
Quality Control
Considerable effort was applied to maintaining strict quality control throughout all aspects offield data collection. To ensure quality control in the collection of field data for the KlamathRiver instream flow studies, the following procedures and protocols were used:
• Staff gauges were established and continually monitored throughout the course of collectingdata on each transect. If significant changes occurred, water surface elevations were re-measured following collection of transect water velocity measurements.
• Only high-quality current velocity meters were used in the collection of velocity data. PriceAA meters were used in fast, deep waters; Pygmy-meters were used in shallow, slowerwaters as recommended in the USGS techniques manual (Rantz, 1982), and Marsh-McBirney electromagnetic meters, as needed, in deep, slow waters.
• Each day, before water velocity measurements, all mechanical meters were inspected. Pivotpins were replaced if significant wear was noted, pin clearances adjusted, and the meters spintested. Magnetic meters were calibrated on a regular basis, either by following themanufacturers procedures or comparing velocity output to mechanical measurements. Meterswere monitored continually during the daily course of data collection to ensure that they werefunctioning properly.
PacifiCorpKlamath Hydroelectric ProjectFERC No. 2082
Fish Resources FTR Page 4-12 February 2004 PacifiCorpFish Resources FTR.DOC
• An independent benchmark was established for each set of transects. The benchmark was animmovable tree, boulder, or other naturally occurring object that would not be subject totampering, vandalism, or movement. Upon establishment of headpin and tailpin elevations, alevel loop was shot to check the auto-level for measurement accuracy. Allowable errortolerances on level loops were set at 0.02 feet (0.6 cm). This tolerance also is applicable toboth headpin and tailpin measurements, except where extenuating circumstances (pins undersloped banks, shots through dense foliage, etc.) explained discrepancies and theaccompanying headpin or tailpin was free of excessive error.
• Water surface elevations were measured on both banks on each transect except underextenuating circumstances, such as impractical or unsafe access to the far bank at a givenflow level. If possible, on more complex and uneven transects, such as riffles or pocketwaters, water surface elevations were measured at a number of locations across a transect. Anattempt was made to measure water surface elevations at each calibration flow at the samelocation (station on tape) across each transect.
• Pin elevations and water surface elevations were calculated during field measurement andcompared to previous measurements. Changes in stage since the previous flow measurementwere calculated. Patterns of stage change were compared between transects and determined,if reasonable. If any discrepancies were discovered, potential sources of error were exploredand noted.
• All calculations were completed in the field (given adequate time and daylight). Calculateddischarges were compared between transects at the same flow. If an excessive amount ofdischarge (more than 10 percent of the streamflow) was noted for an individual transect cell,additional adjacent stations were established to more precisely define the velocitydistribution patterns at that portion of the transect.
• The ADCP output was examined in real-time as the unit was deployed. Multiple passes weremade to ensure discharge calculations were reasonable and good bottom profile and velocitypatterns were obtained.
• Photographs were taken of all transects from downstream, across, and upstream of thecalibration flows. An attempt was made to shoot each photograph from the same location ateach of the three levels of flow. These photographs provided a valuable record of thestreamflow conditions (including velocity and depth), water surface levels, and channelconfigurations that could be used for confirmation during the hydraulic model calibration.
Velocity Measurements
For those transects that could be waded, either a mechanical or magnetic meters attached to top-set rods were used. Mechanical velocity meters were vertical-axis, rotating-cup ScientificInstruments Price AA and pygmy-type meters. These meters are accurate where flow is turbulentor shifts direction and where air is entrained in the water column. Magnetic Marsh-McBirneyModel 2000 meters were used in more laminar flow areas and along stream margins wherevegetation prohibited the use of mechanical meters. Mean column velocity was determined by asingle measurement at six-tenths of the water depth in depths less than 2.5 feet (0.8 m), and atwo-tenths and eight-tenths measurement for depths between 2.5 and 4.0 feet (0.8 and 1.2 m). Allthree points were measured where depths exceeded 4.0 feet (1.2 m), or the velocity distribution
PacifiCorpKlamath Hydroelectric Project
FERC No. 2082
February 2004 PacifiCorp Fish Resources FTR Page 4-13Fish Resources FTR.DOC
in the water column was abnormal and one or two points were not adequate to derive an accuratemean column water velocity.
For those areas that could not be safely waded, velocity acquisition was made with a ADCP. TheADCP gathers depth and velocity information at small steps, laterally and vertically, across atransect. The ADCP unit was operated either from shore with the unit encased in an OceanSciences trimaran riverboat, or towed by a Zodiac inflatable with a jet outboard. When operatedfrom shore, the trimaran was secured to an overhead line and hauled back and forth across thechannel with a rope and pulley system. The operator viewed data in real-time through a radiomodem connection between the ADCP and a laptop computer. Because the ADCP can accuratelymeasure only to a depth of approximately 1 foot (0.3 m), edge cell measurements were obtainedby wading to complete the velocity patterns in shallow areas for each transect.
Complete sets of depths and velocity measurements were collected at most transects at the targetvelocity acquisition flows indicated in Table 4.1-1. For those areas that could not be sampledsafely at the target flow, velocities were measured at the next lowest flow. In some cases, it wasnot feasible to obtain reliable velocities across an entire transect, by any means, because ofexcessive turbulence or unsafe conditions at certain flow levels. This occurred primarily in rifflesin the J.C. Boyle peaking reach and the heads of pools in the J.C. Boyle bypass reach. In suchinstances, all available velocity information collected will be supplemented with modeledvelocities as described in the hydraulic modeling section.
4.4.2.5 Sub-Mesohabitat and Transect Substrate and Cover Coding
Each sample point on the one-dimensional transects (and nodes of the two-dimensional sites)were described using the CDFG Klamath River Sub-Mesohabitat Components (see Appendix4A). In addition, standard Bovee substrate codes (see Appendix 4B) were described for eachsample point because there are currently no habitat suitability criteria available that incorporatethe CDFG coding. All substrate and cover coding was completed at the lowest target flow whenvisibility was optimum.
Hydraulic Simulation Software
Originally, PHABSIM was developed and maintained by the USFWS Instream Flow Group(IFG, now USGS, Aquatic Systems and Technology Application Group, Fort Collins ScienceCenter). PHABSIM calculates a habitat index (WUA) in part based on simulation of river depthsand velocities from one-dimensional (1-D) hydraulic models that represent the river by cross-sections.
For 1-D applications in this study, the hydraulic and habitat index simulations were derived fromthe computer program RHABSIM (Riverine Habitat Simulation). RHABSIM is softwaredeveloped by TRPA that implements the equivalent algorithms of PHABSIM and is in usethroughout the world as the new generation of instream flow analysis software. RHABSIM is anenhancement of many of the original PHABSIM model’s component programs with greatlyexpanded input, output, graphic, error-checking, calibration, and interpretation capabilities.
For two-dimensional (2-D) application in this study, the River2D model was used (Steffler andBlackburn, 2001). River2D is a 2-D, depth-averaged hydrodynamic and fish habitat modeldeveloped for use in natural streams and rivers. The fish habitat module is based on the

PacifiCorpKlamath Hydroelectric ProjectFERC No. 2082
Fish Resources FTR Page 4-14 February 2004 PacifiCorpFish Resources FTR.DOC
PHABSIM WUA approach, adapted for a triangular irregular spatial grid network. Habitatanalysis uses habitat suitability inputs like those used by PHABSIM or RHABSIM.
The ADCP uses its own proprietary software (WinRiver, RD Instruments) for data acquisitionand playback. Because the ADCP collects water velocities throughout the water column atrelatively short intervals it was necessary to synthesize and condense the output into a formusable by RHABSIM or PHABSIM software. For this task, TRPA developed an ADCPconversion program that allows a user to interactively view bottom profiles and velocity patternsand establish stationing that can be directly entered into the hydraulic programs.
Stage-Discharge Calibration
Stage-discharge relationships for 1-D transects were developed from measured discharge andwater surface elevations using either an empirical log/log formula (IFG-4) or a channelconveyance method (MANSQ). Under these methods each transect was treated independently.The IFG-4 method required a minimum of three sets of stage-discharge measurements and anestimate of stage-at-zero-flow (SZF) for each transect. The quality of the stage-dischargerelationships was evaluated by examination of mean error and slope output from the model.
MANSQ only requires a single stage-discharge pair and uses Manning’s equation to determine astage-discharge relationship (Bovee and Milhous, 1978). However, it is generally validated byadditional stage-discharge measurements. In situations where irregular channel features occur ona cross section, for instance bars or terraces, MANSQ is often better at predicting higher stagesthan log/log. MANSQ is most often used on riffle or run transects and is not suitable for transectsthat have backwater effects from downstream controls, such as pools. It also can be used as a testand verification of log/log relationships.
Velocity Calibration
A 1-D model represents a stream by means of vertical slices (transects) across the channel.Depths are simulated with the rise and fall of a single, level (in most cases) water surface. Forsimulating water velocities, the “one-flow” option was used. This technique used a single set ofmeasured velocities to predict individual cell velocities for a range of flows. Simulated velocitieswere based on measured data and a relationship between a fixed roughness coefficient(Manning’s n) and depth. In some cases, roughness was modified for individual cells ifsubstantial velocity errors are noted at simulation flows. Velocity adjustment factors (VAFs)were examined to detect any significant deviations and determine if velocities remainedconsistent with stage and total discharge. For those transects that velocities could not be safely oraccurately measured by any reasonable means, a combination of depth-calibration and roughnesscoefficient adjustment was used to fill in missing data.
Calibration of 2-D hydraulic models required only detailed channel geometry data and adownstream rating curve. Two-dimensional models start at a downstream transect with a knownstage-discharge relationship, and depths and velocities are propagated upstream through adefined grid of x, y, and z coordinate points. Fluid dynamic equations are solved sequentially tobalance depth and velocity patterns in the cells of the grid, and can be modified by variableroughness at each grid point. Multiple iterations of the model are required before an equilibriumstate is reached for any given discharge, and the process is repeated for other simulateddischarges. No other measured depth or velocity calibration data are entered into the model,
PacifiCorpKlamath Hydroelectric Project
FERC No. 2082
February 2004 PacifiCorp Fish Resources FTR Page 4-15Fish Resources FTR.DOC
although results can be modified by changing grid roughness values to roughly match knowndata.
Habitat Suitability Criteria
An important component of an instream flow study is the HSC that typically describes therelative suitability of water depth, water velocity, stream substrate, and cover types to the fishspecies and life stages of interest in the Project area. Scoping determined that all existing speciesand those potentially to be reintroduced through fish passage alternatives were of interest. Thepreferred method of developing HSC was by site-specific observations of a sufficient number ofeach species and life stage within a rigorous study plan designed to minimize observer or habitatavailability bias. This option, however, was limited in most reaches the Klamath River becauseof high streamflows (more than 1,000 cfs (28.3 cms), large flow fluctuations, relatively highgradient, and typically poor water visibility.
Target species and life-stages for HSC data collection included fry, juvenile, and adult rainbowtrout (Oncorhynchus mykiss), Klamath smallscale suckers (Catostomus rimiculus), Klamathlargescale suckers (C. snyderi), speckled dace (Rhinichthys osculus), tui and blue chubs (Gilabicolor and G. coerulea, respectively), and marbled sculpins (Cottus klamathensis). Although thefederally listed shortnose sucker (Chasmistes brevirostris) and Lost River sucker (Catostomusluxatus) are known to occur in the Project area, they are primarily lacustrine species and werenot expected to be encountered during the surveys. Other species of interest that potentially maybe reintroduced into the Project area include Chinook salmon (O. tshawytscha), coho salmon (O.kisutch), and steelhead (O. mykiss).
Initial HSC data for rainbow trout were collected in the J.C. Boyle bypass reach in 2002. Thisreach is unique among the Upper Klamath River study reaches because of relatively low, stableflow (300to 400 cfs (8.5 to 11.3 cms) at its bottom end) and greater water visibility. Althoughonly 100 cfs (2.8 cms) typically is released from J.C. Boyle dam, large spring inflows occur nearthe midpoint of the 4.5-mile (7.2 km) reach. Between 200 and 300 cfs (5.7 and 8.5 cms) of cold(8 to 10ºC), crystal-clear water seasonally enters the bypass reach and significantly reducessummer water temperatures and increases water visibility.
Existing HSC curves were used for most target species and life stages. This section includesfigures for site-specific HSC curves along with developed in other locations, that are proposedfor use in instream flow modeling of the Upper Klamath River. The characteristics of the sourcestreams, sampling designs, and other pertinent factors for these proposed curves will be listed intables in this section.
Suitability Simulation (WUA)
After the hydraulic data were calibrated through standard methods, the probable suitability index(WUA) by discharge was generated using the approved species criteria curves. The range offlows included in the simulations was determined by the calibration flows actually obtained inthe field and by the suitability of the hydraulic data for extrapolation. All the satisfactorilycalibrated hydraulic transects were weighted according to the percentage of each of the majorhabitat types present in the study reach. The hydraulic and HSC data were used to generateWUA relationships for each of the species/life stages in the various reaches of the Klamath River

PacifiCorpKlamath Hydroelectric ProjectFERC No. 2082
Fish Resources FTR Page 4-16 February 2004 PacifiCorpFish Resources FTR.DOC
and it tributaries. The standard option of multiplying the individual variable suitability’s (depth,velocity, and substrate/cover) for cell centroids was selected.
4.5 RELATIONSHIP TO REGULATORY REQUIREMENTS AND PLANS
These investigations are intended to provide baseline information that, together withenvironmental data and results of other past and ongoing studies, can be used to assess effects ofProject operations on fish resources and to help formulate recommendations for protection,mitigation, and enhancement measures consistent with agency and tribal management goals. Thefollowing contain references to objectives for fisheries in the study area:
• CDFG Upper Klamath Wild Trout Management Plan• ODFW Klamath River Basin Fish Management Plan• USFWS and NMFS Endangered Species Act requirements• Klamath River Wild and Scenic River Plan• Tribal natural resource goals and objectives and cultural values• Klamath River Basin Task Force (KRBFTF) Long Range Plan
The results will be used to help determine whether and where current Project operations areallowing healthy fish populations to be maintained at levels consistent with managementobjectives, and, if not, what changes to Project operations or facilities might be needed toachieve these objectives.
4.6 TECHNICAL WORK GROUP COLLABORATION
PacifiCorp worked with stakeholders to establish a collaborative process for planning andconducting studies needed to support Project relicensing documentation. Beginning in early 2001the stakeholders and PacifiCorp developed a Process Protocol to guide the collaborative effort.The structure is comprised of a Plenary group (all interested stakeholders) and a number oftechnical working groups. As part of this structure, an Aquatics Work Group (AWG) wasestablished to address most of the fisheries studies, except those related to fish passage, whichhad its own working group. The AWG has met approximately monthly. Additional meetings(often via phone conference) of AWG participants have been held to address specific studytopics. In late 2003 several of the monthly AWG meetings were combined with the Fish PassageWork Group meetings to address some of the study topics that cross over both work groups.
Because of the technical nature of this specific instream flow study, a subgroup of the AWG,called the Instream Flow Subgroup, was formed in the spring of 2003 to focus on study issues.The group continues to meet to complete the instream flow study tasks.
4.7 RESULTS AND DISCUSSION
A summary of the total numbers of transects by study reach/segment is presented in Table 4.7-1.The number of transects was determined on the basis of habitat mapping results, discussions withthe stakeholders, and sampling requirements established during scoping. Because habitat map-ping, study site selection, and transect selection are linked, results are presented by individualreach to facilitate discussion. Specific details concerning habitat mapping and transect selectiontimelines can be found in report 1.12 Instream Flow Analysis Study Plan, which is included as
PacifiCorpKlamath Hydroelectric Project
FERC No. 2082
February 2004 PacifiCorp Fish Resources FTR Page 4-17Fish Resources FTR.DOC
part of the FERC license. Complete habitat mapping data for all reaches is presented inAppendix 4C.
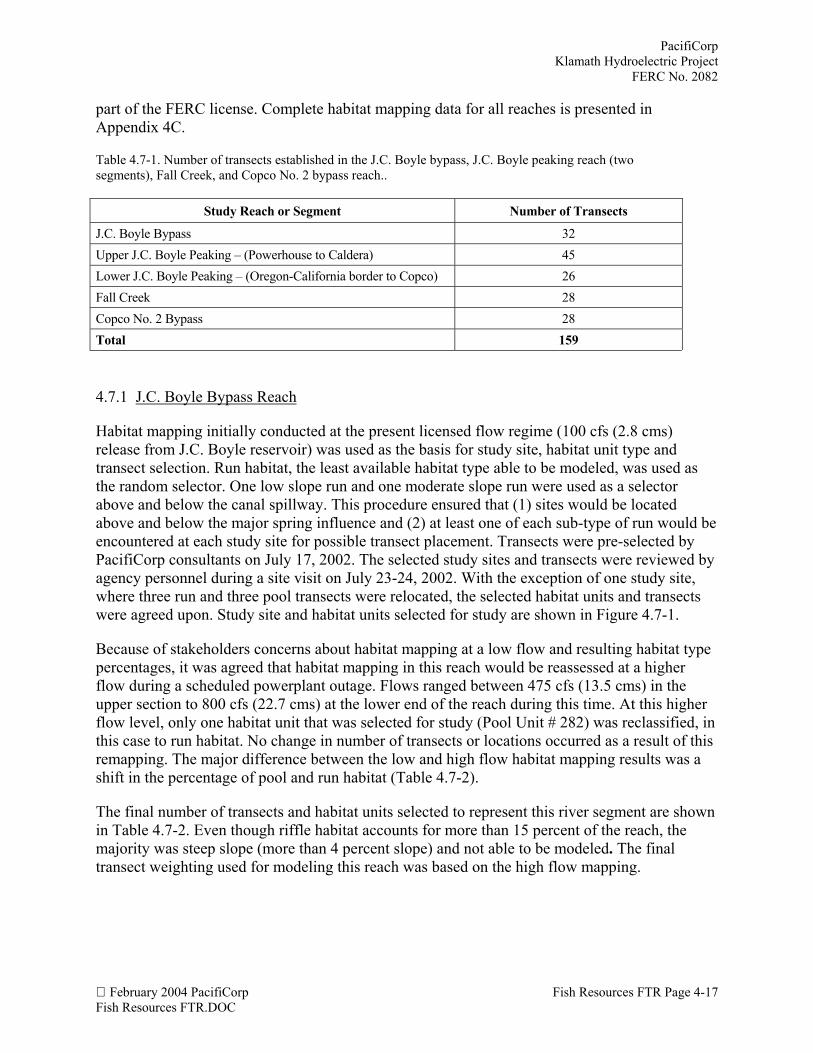
Table 4.7-1. Number of transects established in the J.C. Boyle bypass, J.C. Boyle peaking reach (twosegments), Fall Creek, and Copco No. 2 bypass reach..
Study Reach or Segment Number of Transects
J.C. Boyle Bypass 32Upper J.C. Boyle Peaking – (Powerhouse to Caldera) 45Lower J.C. Boyle Peaking – (Oregon-California border to Copco) 26Fall Creek 28Copco No. 2 Bypass 28Total 159
4.7.1 J.C. Boyle Bypass Reach
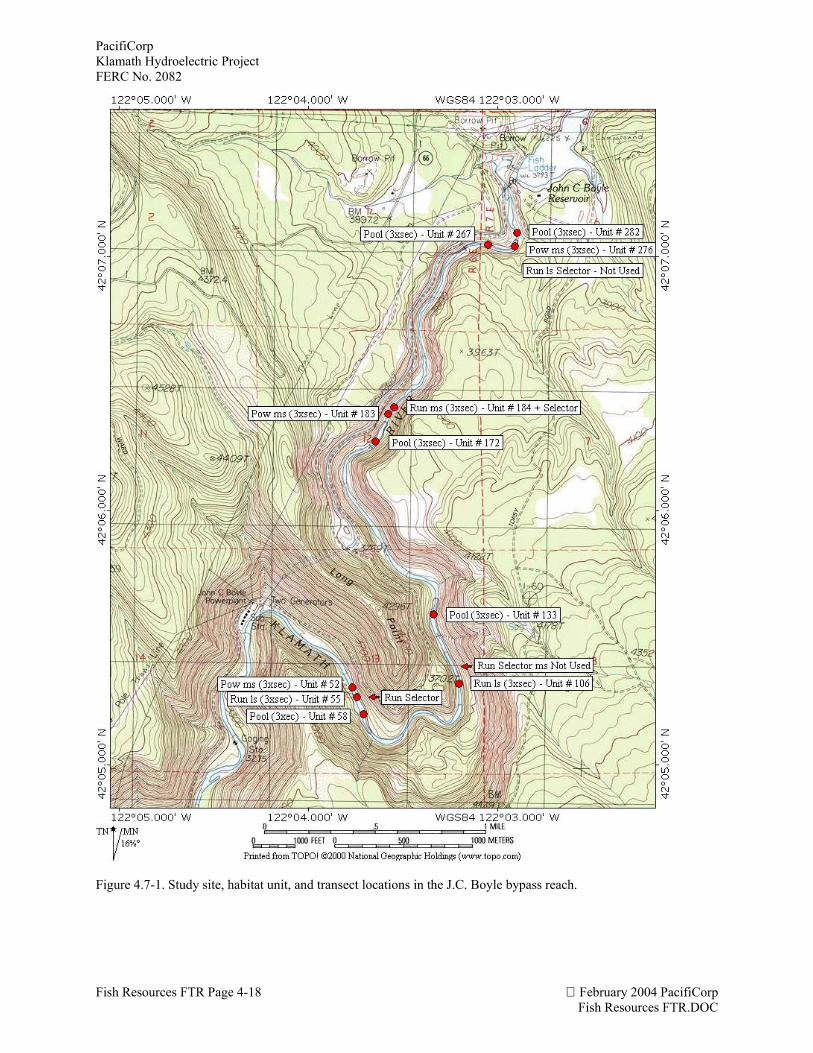
Habitat mapping initially conducted at the present licensed flow regime (100 cfs (2.8 cms)release from J.C. Boyle reservoir) was used as the basis for study site, habitat unit type andtransect selection. Run habitat, the least available habitat type able to be modeled, was used asthe random selector. One low slope run and one moderate slope run were used as a selectorabove and below the canal spillway. This procedure ensured that (1) sites would be locatedabove and below the major spring influence and (2) at least one of each sub-type of run would beencountered at each study site for possible transect placement. Transects were pre-selected byPacifiCorp consultants on July 17, 2002. The selected study sites and transects were reviewed byagency personnel during a site visit on July 23-24, 2002. With the exception of one study site,where three run and three pool transects were relocated, the selected habitat units and transectswere agreed upon. Study site and habitat units selected for study are shown in Figure 4.7-1.
Because of stakeholders concerns about habitat mapping at a low flow and resulting habitat typepercentages, it was agreed that habitat mapping in this reach would be reassessed at a higherflow during a scheduled powerplant outage. Flows ranged between 475 cfs (13.5 cms) in theupper section to 800 cfs (22.7 cms) at the lower end of the reach during this time. At this higherflow level, only one habitat unit that was selected for study (Pool Unit # 282) was reclassified, inthis case to run habitat. No change in number of transects or locations occurred as a result of thisremapping. The major difference between the low and high flow habitat mapping results was ashift in the percentage of pool and run habitat (Table 4.7-2).
The final number of transects and habitat units selected to represent this river segment are shownin Table 4.7-2. Even though riffle habitat accounts for more than 15 percent of the reach, themajority was steep slope (more than 4 percent slope) and not able to be modeled. The finaltransect weighting used for modeling this reach was based on the high flow mapping.
PacifiCorpKlamath Hydroelectric ProjectFERC No. 2082
Fish Resources FTR Page 4-18 February 2004 PacifiCorpFish Resources FTR.DOC
Figure 4.7-1. Study site, habitat unit, and transect locations in the J.C. Boyle bypass reach.
PacifiCorpKlamath Hydroelectric Project
FERC No. 2082
February 2004 PacifiCorp Fish Resources FTR Page 4-19Fish Resources FTR.DOC
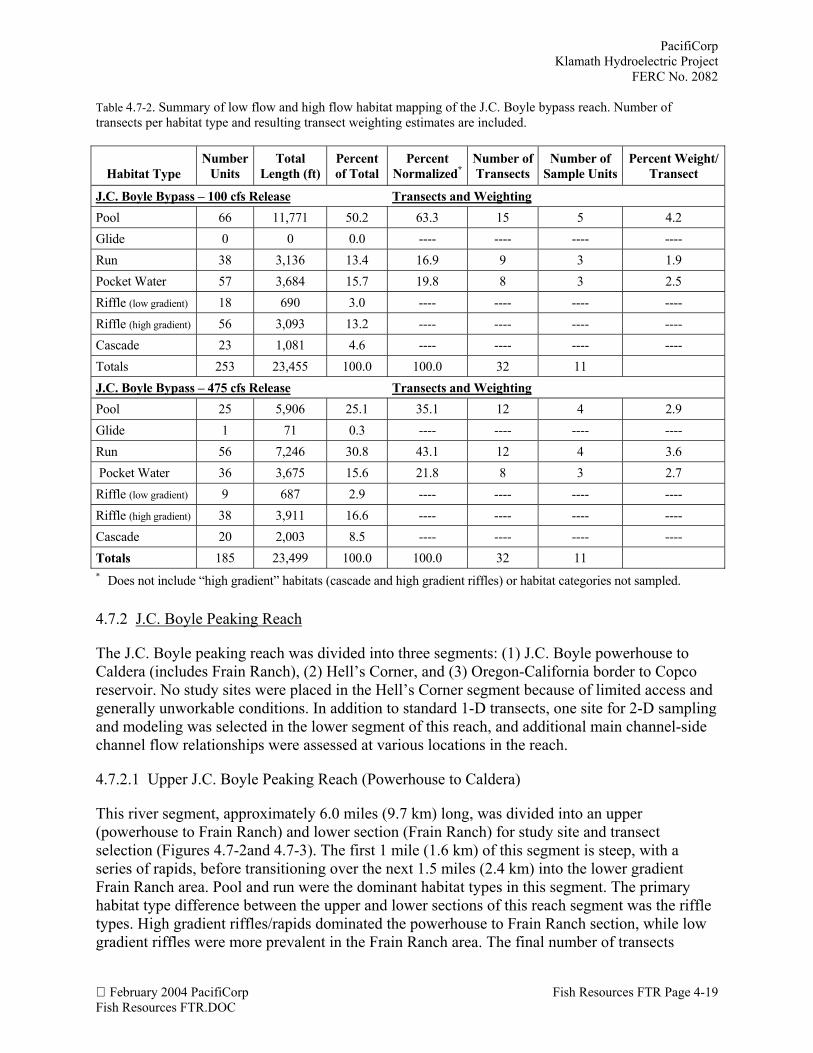
Table 4.7-2. Summary of low flow and high flow habitat mapping of the J.C. Boyle bypass reach. Number oftransects per habitat type and resulting transect weighting estimates are included.
Habitat TypeNumber
UnitsTotal
Length (ft)Percentof Total
PercentNormalized*
Number ofTransects
Number ofSample Units
Percent Weight/Transect
J.C. Boyle Bypass – 100 cfs Release Transects and WeightingPool 66 11,771 50.2 63.3 15 5 4.2Glide 0 0 0.0 ---- ---- ---- ----Run 38 3,136 13.4 16.9 9 3 1.9Pocket Water 57 3,684 15.7 19.8 8 3 2.5Riffle (low gradient) 18 690 3.0 ---- ---- ---- ----Riffle (high gradient) 56 3,093 13.2 ---- ---- ---- ----Cascade 23 1,081 4.6 ---- ---- ---- ----Totals 253 23,455 100.0 100.0 32 11J.C. Boyle Bypass – 475 cfs Release Transects and WeightingPool 25 5,906 25.1 35.1 12 4 2.9Glide 1 71 0.3 ---- ---- ---- ----Run 56 7,246 30.8 43.1 12 4 3.6 Pocket Water 36 3,675 15.6 21.8 8 3 2.7Riffle (low gradient) 9 687 2.9 ---- ---- ---- ----Riffle (high gradient) 38 3,911 16.6 ---- ---- ---- ----Cascade 20 2,003 8.5 ---- ---- ---- ----Totals 185 23,499 100.0 100.0 32 11* Does not include “high gradient” habitats (cascade and high gradient riffles) or habitat categories not sampled.
4.7.2 J.C. Boyle Peaking Reach
The J.C. Boyle peaking reach was divided into three segments: (1) J.C. Boyle powerhouse toCaldera (includes Frain Ranch), (2) Hell’s Corner, and (3) Oregon-California border to Copcoreservoir. No study sites were placed in the Hell’s Corner segment because of limited access andgenerally unworkable conditions. In addition to standard 1-D transects, one site for 2-D samplingand modeling was selected in the lower segment of this reach, and additional main channel-sidechannel flow relationships were assessed at various locations in the reach.
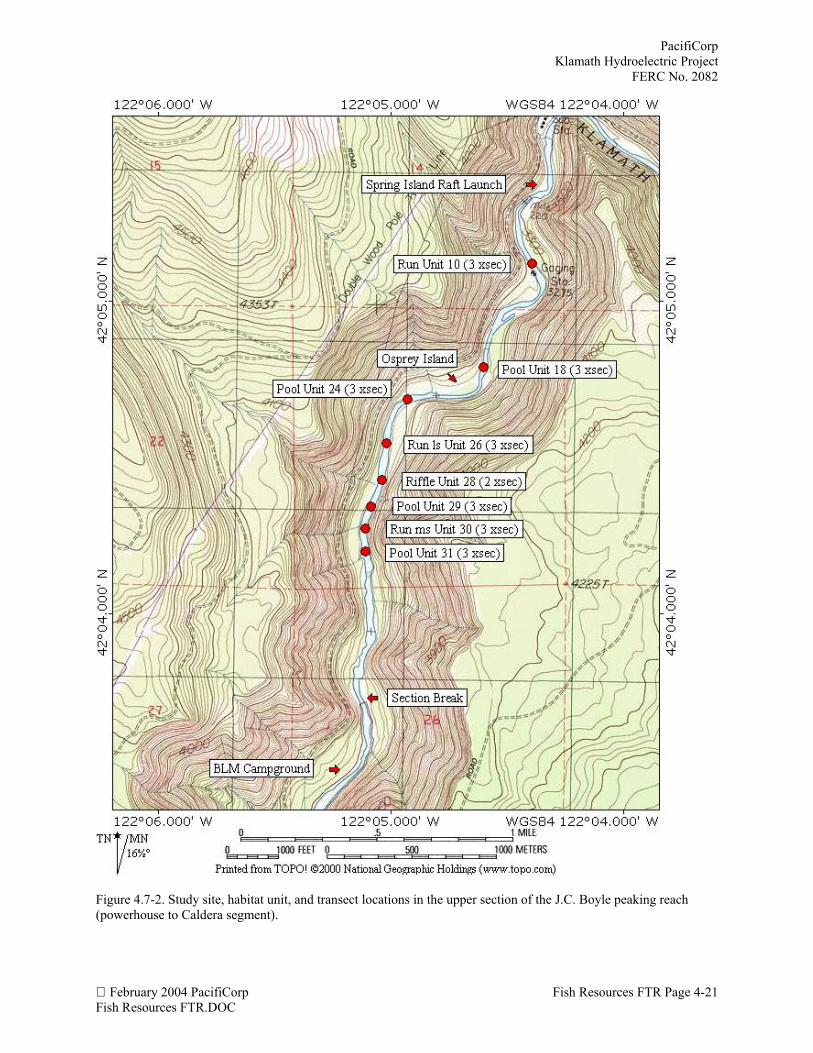
4.7.2.1 Upper J.C. Boyle Peaking Reach (Powerhouse to Caldera)
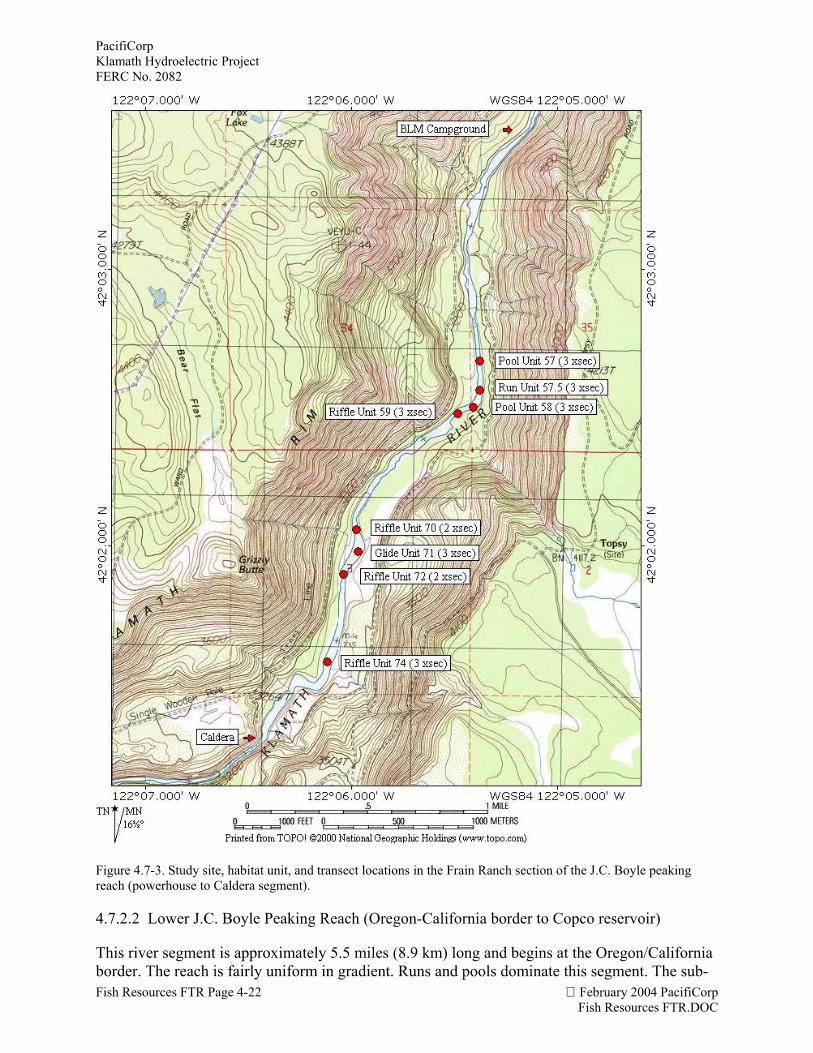
This river segment, approximately 6.0 miles (9.7 km) long, was divided into an upper(powerhouse to Frain Ranch) and lower section (Frain Ranch) for study site and transectselection (Figures 4.7-2and 4.7-3). The first 1 mile (1.6 km) of this segment is steep, with aseries of rapids, before transitioning over the next 1.5 miles (2.4 km) into the lower gradientFrain Ranch area. Pool and run were the dominant habitat types in this segment. The primaryhabitat type difference between the upper and lower sections of this reach segment was the riffletypes. High gradient riffles/rapids dominated the powerhouse to Frain Ranch section, while lowgradient riffles were more prevalent in the Frain Ranch area. The final number of transects
PacifiCorpKlamath Hydroelectric ProjectFERC No. 2082
Fish Resources FTR Page 4-20 February 2004 PacifiCorpFish Resources FTR.DOC
sampled in the Powerhouse to Caldera segment of the J.C. Boyle peaking reach is shown inTable 4.7-3.
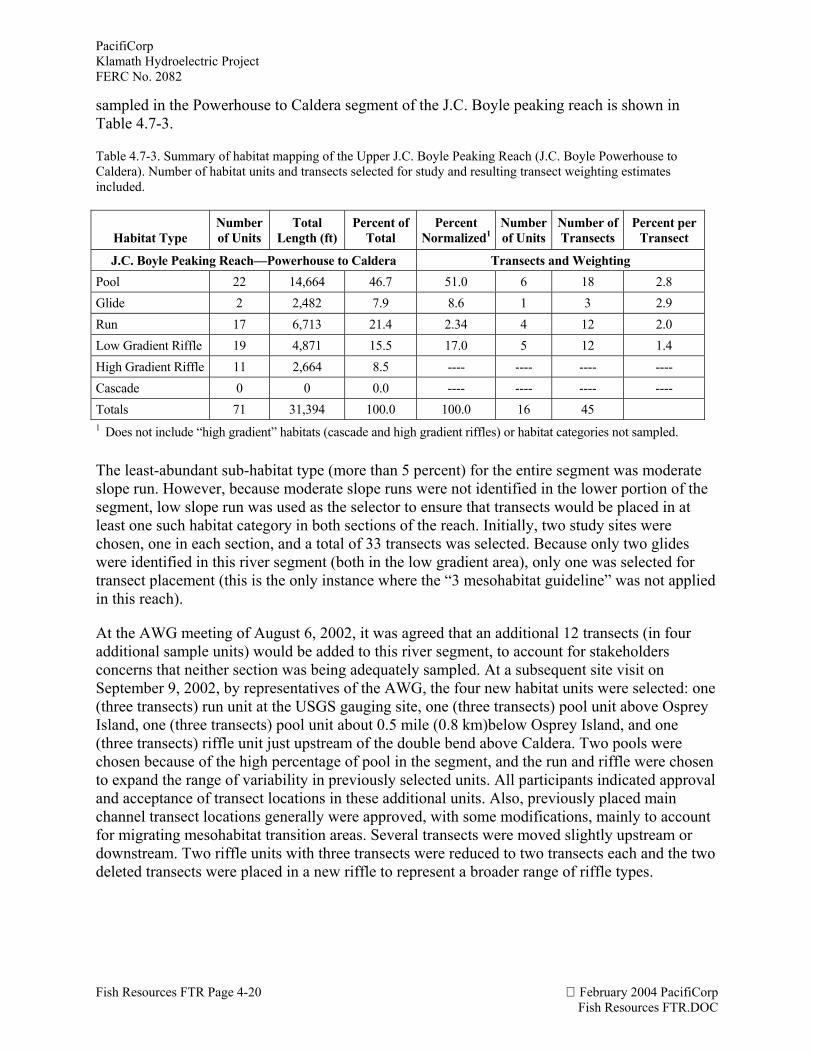
Table 4.7-3. Summary of habitat mapping of the Upper J.C. Boyle Peaking Reach (J.C. Boyle Powerhouse toCaldera). Number of habitat units and transects selected for study and resulting transect weighting estimatesincluded.
Habitat TypeNumberof Units
TotalLength (ft)
Percent ofTotal
PercentNormalized1
Numberof Units
Number ofTransects
Percent perTransect
J.C. Boyle Peaking Reach—Powerhouse to Caldera Transects and WeightingPool 22 14,664 46.7 51.0 6 18 2.8Glide 2 2,482 7.9 8.6 1 3 2.9Run 17 6,713 21.4 2.34 4 12 2.0Low Gradient Riffle 19 4,871 15.5 17.0 5 12 1.4High Gradient Riffle 11 2,664 8.5 ---- ---- ---- ----Cascade 0 0 0.0 ---- ---- ---- ----Totals 71 31,394 100.0 100.0 16 451 Does not include “high gradient” habitats (cascade and high gradient riffles) or habitat categories not sampled.
The least-abundant sub-habitat type (more than 5 percent) for the entire segment was moderateslope run. However, because moderate slope runs were not identified in the lower portion of thesegment, low slope run was used as the selector to ensure that transects would be placed in atleast one such habitat category in both sections of the reach. Initially, two study sites werechosen, one in each section, and a total of 33 transects was selected. Because only two glideswere identified in this river segment (both in the low gradient area), only one was selected fortransect placement (this is the only instance where the “3 mesohabitat guideline” was not appliedin this reach).
At the AWG meeting of August 6, 2002, it was agreed that an additional 12 transects (in fouradditional sample units) would be added to this river segment, to account for stakeholdersconcerns that neither section was being adequately sampled. At a subsequent site visit onSeptember 9, 2002, by representatives of the AWG, the four new habitat units were selected: one(three transects) run unit at the USGS gauging site, one (three transects) pool unit above OspreyIsland, one (three transects) pool unit about 0.5 mile (0.8 km)below Osprey Island, and one(three transects) riffle unit just upstream of the double bend above Caldera. Two pools werechosen because of the high percentage of pool in the segment, and the run and riffle were chosento expand the range of variability in previously selected units. All participants indicated approvaland acceptance of transect locations in these additional units. Also, previously placed mainchannel transect locations generally were approved, with some modifications, mainly to accountfor migrating mesohabitat transition areas. Several transects were moved slightly upstream ordownstream. Two riffle units with three transects were reduced to two transects each and the twodeleted transects were placed in a new riffle to represent a broader range of riffle types.
PacifiCorpKlamath Hydroelectric Project
FERC No. 2082
February 2004 PacifiCorp Fish Resources FTR Page 4-21Fish Resources FTR.DOC
Figure 4.7-2. Study site, habitat unit, and transect locations in the upper section of the J.C. Boyle peaking reach(powerhouse to Caldera segment).
PacifiCorpKlamath Hydroelectric ProjectFERC No. 2082
Fish Resources FTR Page 4-22 February 2004 PacifiCorpFish Resources FTR.DOC
Figure 4.7-3. Study site, habitat unit, and transect locations in the Frain Ranch section of the J.C. Boyle peakingreach (powerhouse to Caldera segment).
4.7.2.2 Lower J.C. Boyle Peaking Reach (Oregon-California border to Copco reservoir)
This river segment is approximately 5.5 miles (8.9 km) long and begins at the Oregon/Californiaborder. The reach is fairly uniform in gradient. Runs and pools dominate this segment. The sub-
PacifiCorpKlamath Hydroelectric Project
FERC No. 2082
February 2004 PacifiCorp Fish Resources FTR Page 4-23Fish Resources FTR.DOC
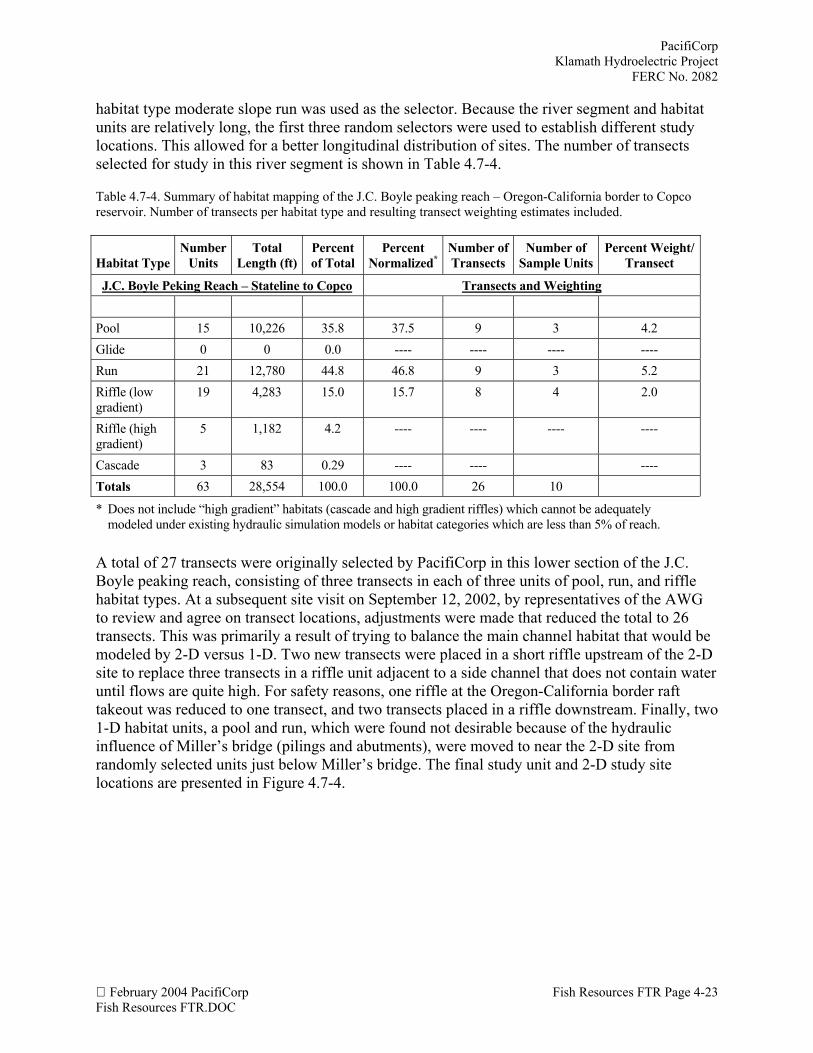
habitat type moderate slope run was used as the selector. Because the river segment and habitatunits are relatively long, the first three random selectors were used to establish different studylocations. This allowed for a better longitudinal distribution of sites. The number of transectsselected for study in this river segment is shown in Table 4.7-4.
Table 4.7-4. Summary of habitat mapping of the J.C. Boyle peaking reach – Oregon-California border to Copcoreservoir. Number of transects per habitat type and resulting transect weighting estimates included.
Habitat TypeNumber
UnitsTotal
Length (ft)Percentof Total
PercentNormalized*
Number ofTransects
Number ofSample Units
Percent Weight/Transect
J.C. Boyle Peking Reach – Stateline to Copco Transects and Weighting
Pool 15 10,226 35.8 37.5 9 3 4.2Glide 0 0 0.0 ---- ---- ---- ----Run 21 12,780 44.8 46.8 9 3 5.2Riffle (lowgradient)
19 4,283 15.0 15.7 8 4 2.0
Riffle (highgradient)
5 1,182 4.2 ---- ---- ---- ----
Cascade 3 83 0.29 ---- ---- ----Totals 63 28,554 100.0 100.0 26 10
* Does not include “high gradient” habitats (cascade and high gradient riffles) which cannot be adequatelymodeled under existing hydraulic simulation models or habitat categories which are less than 5% of reach.
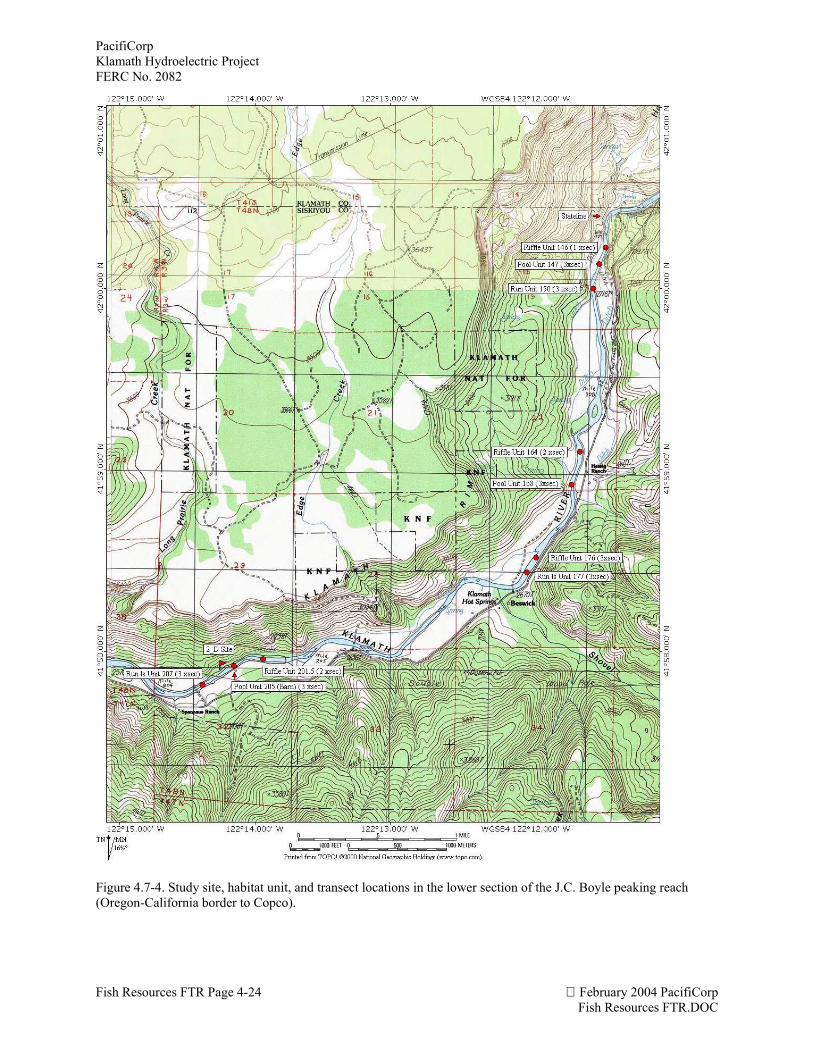
A total of 27 transects were originally selected by PacifiCorp in this lower section of the J.C.Boyle peaking reach, consisting of three transects in each of three units of pool, run, and rifflehabitat types. At a subsequent site visit on September 12, 2002, by representatives of the AWGto review and agree on transect locations, adjustments were made that reduced the total to 26transects. This was primarily a result of trying to balance the main channel habitat that would bemodeled by 2-D versus 1-D. Two new transects were placed in a short riffle upstream of the 2-Dsite to replace three transects in a riffle unit adjacent to a side channel that does not contain wateruntil flows are quite high. For safety reasons, one riffle at the Oregon-California border rafttakeout was reduced to one transect, and two transects placed in a riffle downstream. Finally, two1-D habitat units, a pool and run, which were found not desirable because of the hydraulicinfluence of Miller’s bridge (pilings and abutments), were moved to near the 2-D site fromrandomly selected units just below Miller’s bridge. The final study unit and 2-D study sitelocations are presented in Figure 4.7-4.
PacifiCorpKlamath Hydroelectric ProjectFERC No. 2082
Fish Resources FTR Page 4-24 February 2004 PacifiCorpFish Resources FTR.DOC
Figure 4.7-4. Study site, habitat unit, and transect locations in the lower section of the J.C. Boyle peaking reach(Oregon-California border to Copco).
PacifiCorpKlamath Hydroelectric Project
FERC No. 2082
February 2004 PacifiCorp Fish Resources FTR Page 4-25Fish Resources FTR.DOC
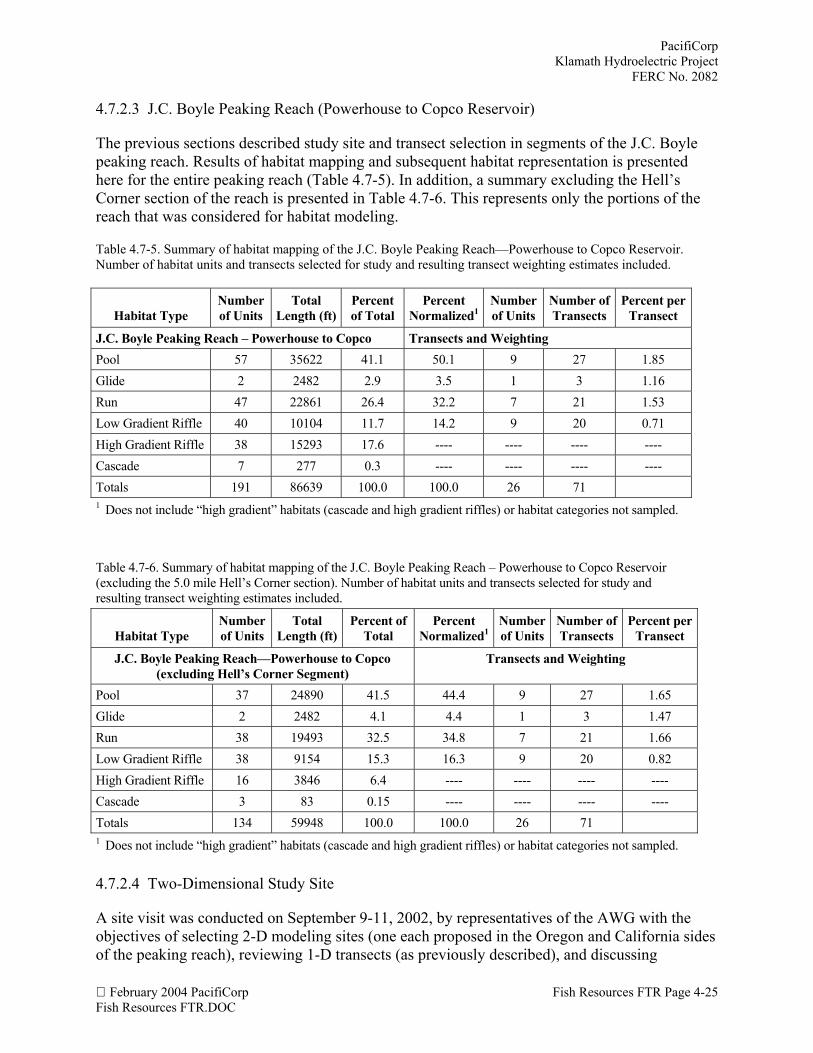
4.7.2.3 J.C. Boyle Peaking Reach (Powerhouse to Copco Reservoir)
The previous sections described study site and transect selection in segments of the J.C. Boylepeaking reach. Results of habitat mapping and subsequent habitat representation is presentedhere for the entire peaking reach (Table 4.7-5). In addition, a summary excluding the Hell’sCorner section of the reach is presented in Table 4.7-6. This represents only the portions of thereach that was considered for habitat modeling.
Table 4.7-5. Summary of habitat mapping of the J.C. Boyle Peaking Reach—Powerhouse to Copco Reservoir.Number of habitat units and transects selected for study and resulting transect weighting estimates included.
Habitat TypeNumberof Units
TotalLength (ft)
Percentof Total
PercentNormalized1
Numberof Units
Number ofTransects
Percent perTransect
J.C. Boyle Peaking Reach – Powerhouse to Copco Transects and WeightingPool 57 35622 41.1 50.1 9 27 1.85Glide 2 2482 2.9 3.5 1 3 1.16Run 47 22861 26.4 32.2 7 21 1.53Low Gradient Riffle 40 10104 11.7 14.2 9 20 0.71High Gradient Riffle 38 15293 17.6 ---- ---- ---- ----Cascade 7 277 0.3 ---- ---- ---- ----Totals 191 86639 100.0 100.0 26 711 Does not include “high gradient” habitats (cascade and high gradient riffles) or habitat categories not sampled.
Table 4.7-6. Summary of habitat mapping of the J.C. Boyle Peaking Reach – Powerhouse to Copco Reservoir(excluding the 5.0 mile Hell’s Corner section). Number of habitat units and transects selected for study andresulting transect weighting estimates included.
Habitat TypeNumberof Units
TotalLength (ft)
Percent ofTotal
PercentNormalized1
Numberof Units
Number ofTransects
Percent perTransect
J.C. Boyle Peaking Reach—Powerhouse to Copco(excluding Hell’s Corner Segment)
Transects and Weighting
Pool 37 24890 41.5 44.4 9 27 1.65Glide 2 2482 4.1 4.4 1 3 1.47Run 38 19493 32.5 34.8 7 21 1.66Low Gradient Riffle 38 9154 15.3 16.3 9 20 0.82High Gradient Riffle 16 3846 6.4 ---- ---- ---- ----Cascade 3 83 0.15 ---- ---- ---- ----Totals 134 59948 100.0 100.0 26 711 Does not include “high gradient” habitats (cascade and high gradient riffles) or habitat categories not sampled.
4.7.2.4 Two-Dimensional Study Site
A site visit was conducted on September 9-11, 2002, by representatives of the AWG with theobjectives of selecting 2-D modeling sites (one each proposed in the Oregon and California sidesof the peaking reach), reviewing 1-D transects (as previously described), and discussing
PacifiCorpKlamath Hydroelectric ProjectFERC No. 2082
Fish Resources FTR Page 4-26 February 2004 PacifiCorpFish Resources FTR.DOC
approaches to evaluating side channels in the peaking reach (described below). A key objectivein selecting 2-D modeling sites was to capture a main channel-side channel complex. The majorside/split channel in the upper portion of the J.C. Boyle peaking reach (known as Osprey Rapid/ Island) originally was proposed as one of the 2-D study sites (see Figure 4.4-1; site does notshow on topographic map as an island). Based on reconnoiter of the Oregon portion of thepeaking reach during the site visit, starting with Osprey Island and ending at the dual bend justabove Caldera, it was determined that none of the available complexes appeared suitable for 2-Dmodeling. This was because the complexes contained dangerous rapids in the main channel side,complex boulder/cobble split controls, short channel length, or habitat value not dissimilar frommain channel areas. The consensus of those present was to not use 2-D, but to collect data on theside channels to determine their habitat quality/quantity and flow relationship to the mainchannel (as described below).
There are numerous side/split channels in the California portion of the peaking reach, mostoccurring downstream of Shovel Creek. Based on reconnoiter of such possible complexes in theCalifornia portion of the peaking reach, a main channel-side channel complex not far aboveCopco reservoir was selected for 2-D modeling (see Figure 4.7-5--). The site includes a riffle-run-riffle complex in the main channel, and a long, meandering side channel that can bemodeled.
4.7.2.5 Additional Analysis of Main Channel - Side Channel Flow Relationships
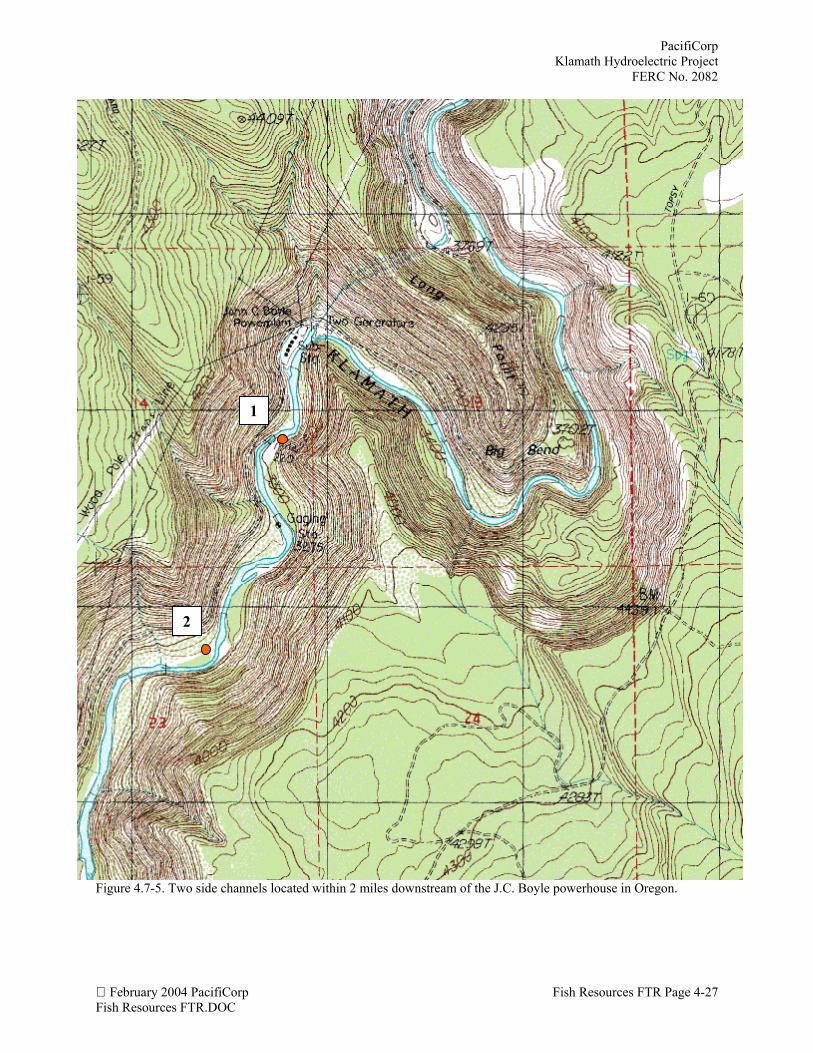
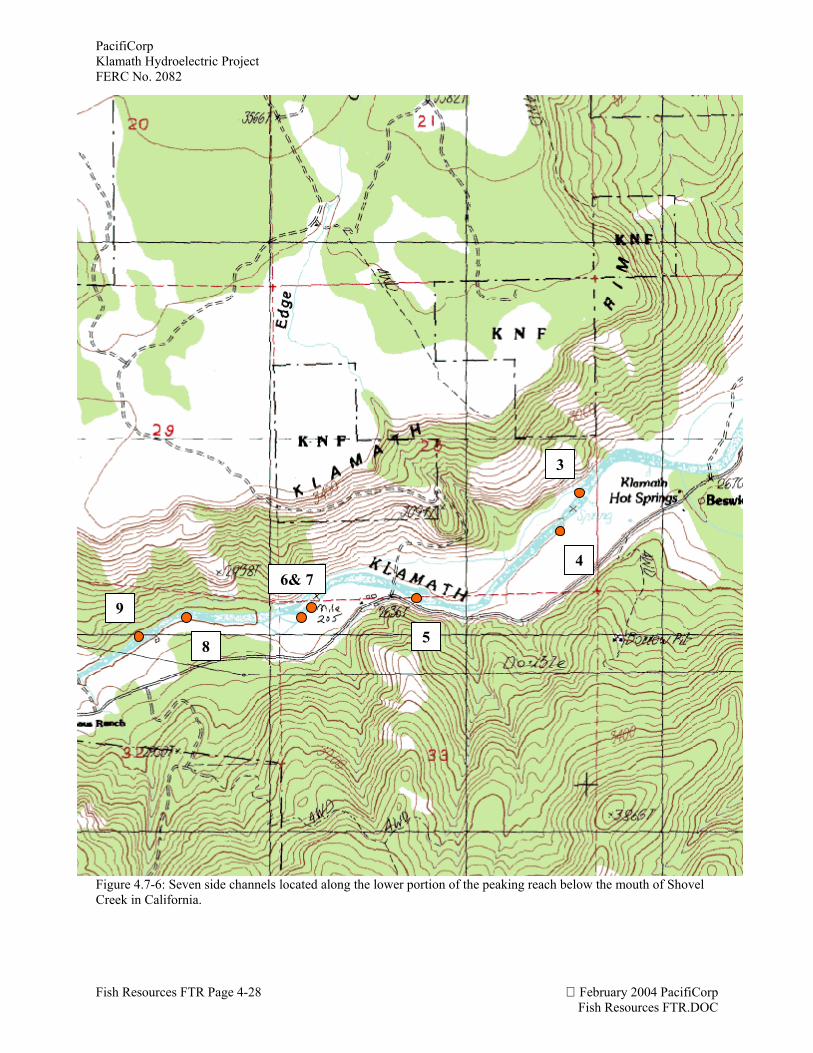
A number of side channels in the 16-mile J.C. Boyle peaking reach of the Klamath River are ofinterest for their potential fish habitat value. Some of these have no water flow at the commonbase flow of 350 cfs in the main river. Therefore, an effort was made to determine the flowrelationship between the main Klamath River and the corresponding flows in nine side channels.These side channels were selected for evaluation following a review of aerial photographs and asite reconnaissance to confirm that they could support fish habitat. Cumulatively, they representa total length of 5,400 feet. Two side channels were located within 2 miles downstream of theJ.C. Boyle powerhouse in Oregon (Figure 4.7-5). Seven additional side channels were locatedalong the lower portion of the peaking reach below the mouth of Shovel Creek in California(Figure 4.7-6). This lower section of river is more alluvial in nature and thus contains more sidechannels than the Oregon section, which is mostly confined in a canyon.
To estimate the main river streamflow at which each side channel begins to flow, we firstsurveyed (with differential leveling) the bottom elevation at the hydraulic control “lip” at theupper entrance to the side channel. Using the same bench mark, we then surveyed the watersurface elevation of the main channel near the side channel entrance at a known river flow. Theelevation difference was then used in conjunction with a stage-discharge rating curve appropriatefor the main channel to estimate the change in total river flow needed to initiate side channelflow.
PacifiCorpKlamath Hydroelectric Project
FERC No. 2082
February 2004 PacifiCorp Fish Resources FTR Page 4-27Fish Resources FTR.DOC
Figure 4.7-5. Two side channels located within 2 miles downstream of the J.C. Boyle powerhouse in Oregon.
2
1
PacifiCorpKlamath Hydroelectric ProjectFERC No. 2082
Fish Resources FTR Page 4-28 February 2004 PacifiCorpFish Resources FTR.DOC
Figure 4.7-6: Seven side channels located along the lower portion of the peaking reach below the mouth of ShovelCreek in California.
3
4
5
6& 7
8
9
PacifiCorpKlamath Hydroelectric Project
FERC No. 2082
February 2004 PacifiCorp Fish Resources FTR Page 4-29Fish Resources FTR.DOC
Each side channel was gaged at least once when flowing. The corresponding total river flow wasobtained from the USGS gage below the J.C. Boyle powerhouse. Flow travel time between thegage site an each side channel site was taken into consideration.
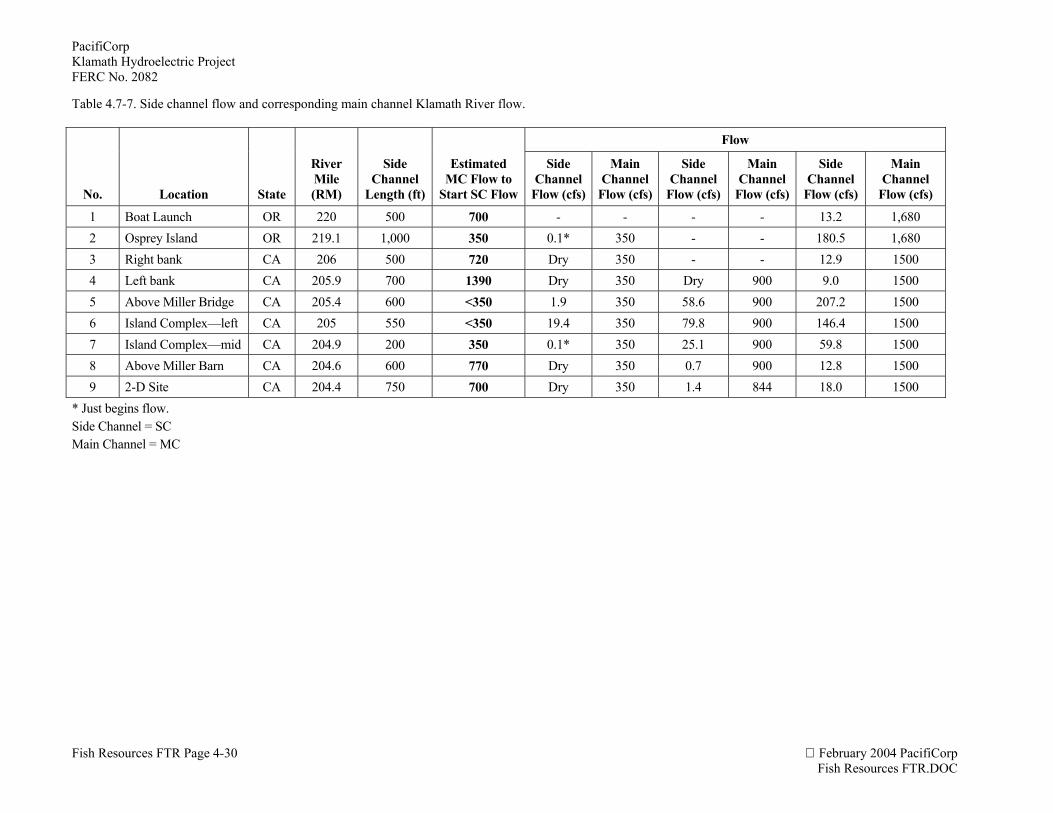
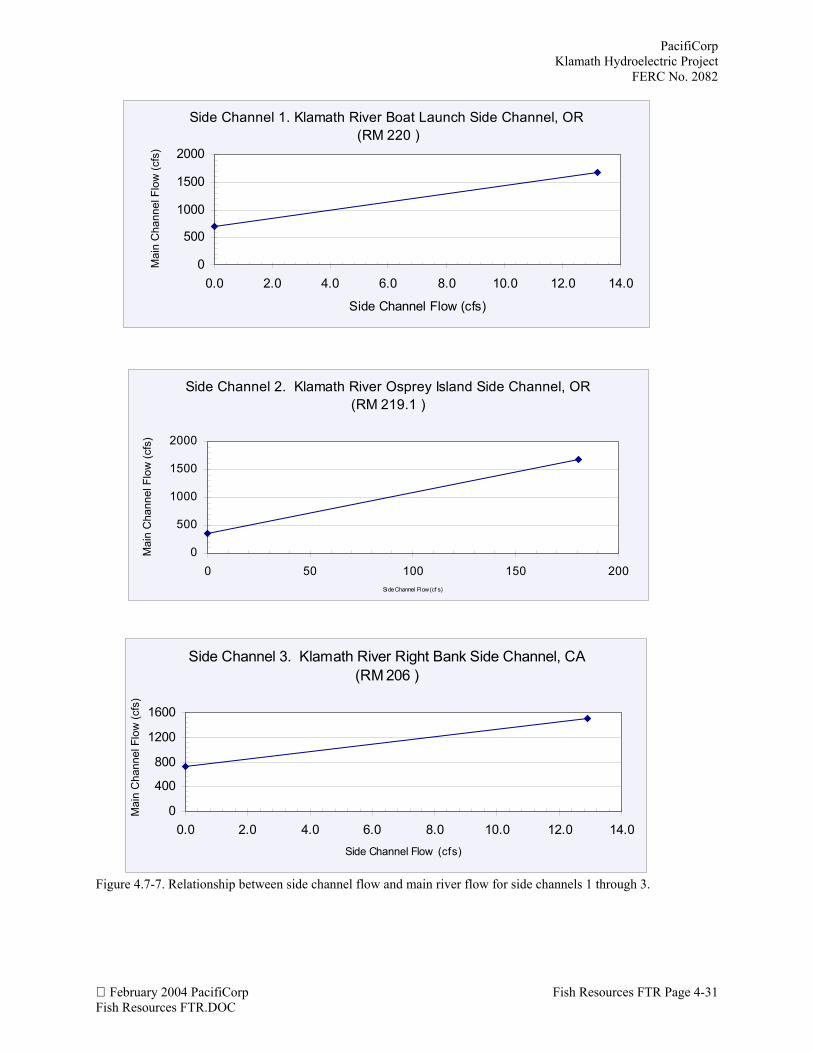
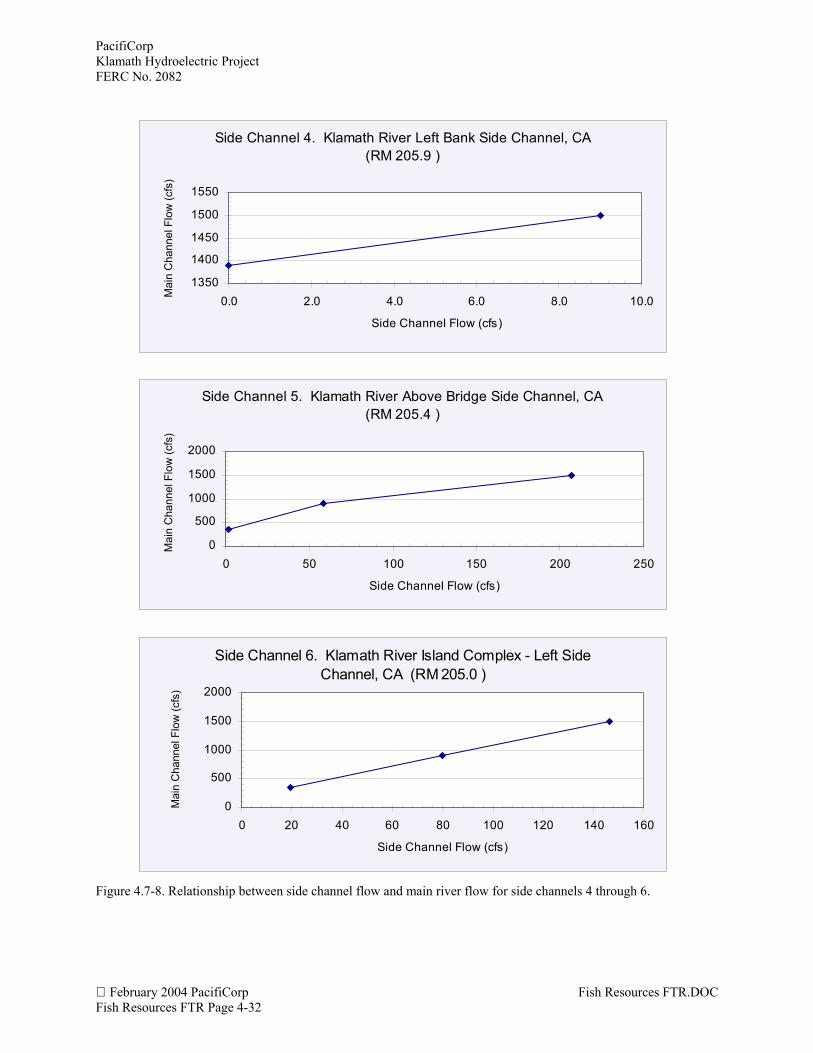
The measured side channel flows and corresponding main Klamath River flows are presented inTable 4.7-7. Of the nine side channels, only two flow when the main river is at its base flow of350 cfs, although two more side channels begin to flow when the river just begins to exceed350 cfs. Although flow into side channel 4 does not begin until river flow exceeds 1,390 cfs,interstitial flow starts emerging about 200 feet down the side channel even when the main riverflow is 350 cfs. All nine side channels experience flow when the main river is flowing at1,500 cfs.
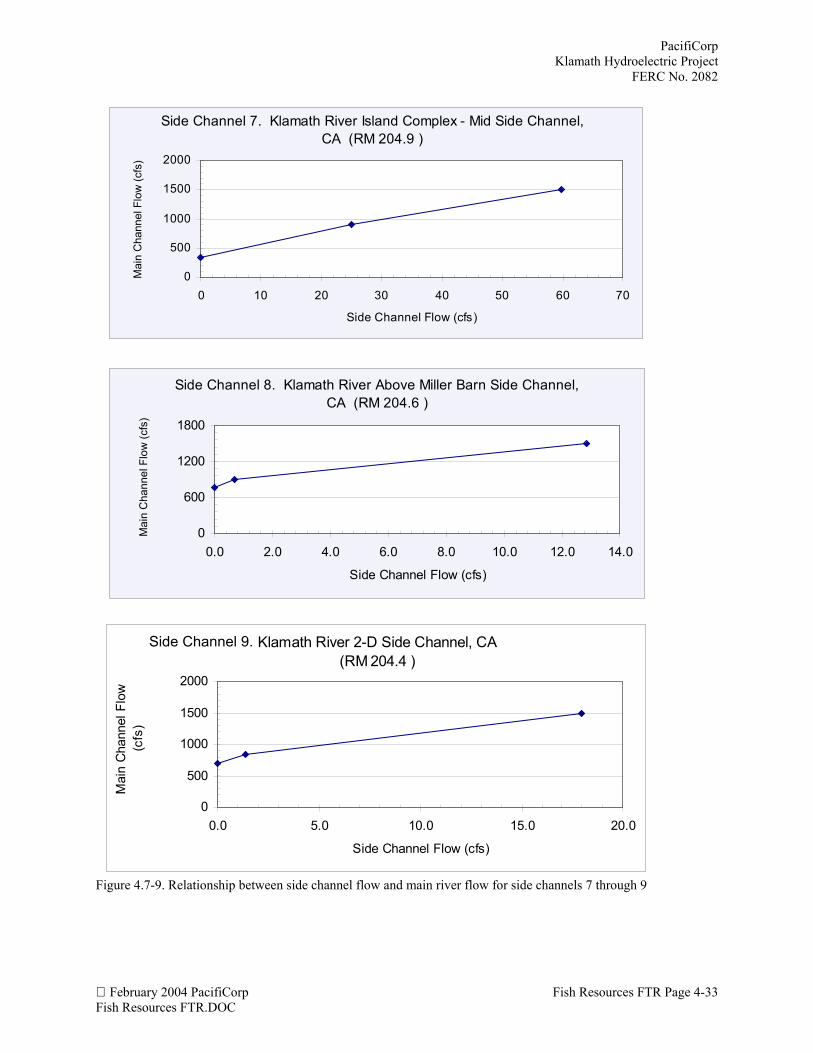
Relationships between side channel flow and main river flow for each side channel are showngraphically in Figures 4.7-7-8 – 4.7-9.
4.7.3 Fall Creek Reach
At the AWG meeting on July 10, 2002, it was agreed that PacifiCorp consultants would pre-select study sites and transects in Fall Creek. The AWG decided that a visit to Fall Creek toreview the transects was not necessary. A verbal agreement was reached that data collectioncould proceed on this reach without agency review of the transects.
During the week of July 15-19, 2002, PacifiCorp consultants selected study sites and transects inthe reach. The Fall Creek reach is 4,605 feet (1.4 km) long from the upper falls to the diversion.A slight gradient break occurs approximately half way up the reach. To ensure dispersal oftransects, random selectors (sub-habitat type moderate slope riffle was used as the selector) werepicked both above and below this gradient break. Fall Creek is the only reach where highgradient riffles were modeled. This was a result of a combination of the relatively highpercentage of this habitat type in the reach and the fact that this habitat could be modeledadequately in the small stream channel. A total of 28 transects was selected to represent thehabitat types found in Fall Creek (Table 4.7-8). The number of transects established resulted inone transect per 164 feet (50.0 m) of stream.
PacifiCorpKlamath Hydroelectric ProjectFERC No. 2082
Fish Resources FTR Page 4-30 February 2004 PacifiCorpFish Resources FTR.DOC
Table 4.7-7. Side channel flow and corresponding main channel Klamath River flow.
Flow
No. Location State
RiverMile(RM)
SideChannel
Length (ft)
EstimatedMC Flow to
Start SC Flow
SideChannel
Flow (cfs)
MainChannel
Flow (cfs)
SideChannel
Flow (cfs)
MainChannel
Flow (cfs)
SideChannel
Flow (cfs)
MainChannel
Flow (cfs)
1 Boat Launch OR 220 500 700 - - - - 13.2 1,6802 Osprey Island OR 219.1 1,000 350 0.1* 350 - - 180.5 1,6803 Right bank CA 206 500 720 Dry 350 - - 12.9 15004 Left bank CA 205.9 700 1390 Dry 350 Dry 900 9.0 15005 Above Miller Bridge CA 205.4 600 <350 1.9 350 58.6 900 207.2 15006 Island Complex—left CA 205 550 <350 19.4 350 79.8 900 146.4 15007 Island Complex—mid CA 204.9 200 350 0.1* 350 25.1 900 59.8 15008 Above Miller Barn CA 204.6 600 770 Dry 350 0.7 900 12.8 15009 2-D Site CA 204.4 750 700 Dry 350 1.4 844 18.0 1500
* Just begins flow.Side Channel = SCMain Channel = MC
PacifiCorpKlamath Hydroelectric Project
FERC No. 2082
February 2004 PacifiCorp Fish Resources FTR Page 4-31Fish Resources FTR.DOC
Figure 4.7-7. Relationship between side channel flow and main river flow for side channels 1 through 3.
Side Channel 1. Klamath River Boat Launch Side Channel, OR (RM 220 )
0
500
1000
1500
2000
0.0 2.0 4.0 6.0 8.0 10.0 12.0 14.0
Side Channel Flow (cfs)
Mai
n C
hann
el F
low
(cfs
)
Side Channel 2. Klamath River Osprey Island Side Channel, OR (RM 219.1 )
0
500
1000
1500
2000
0 50 100 150 200Side Channel Flow (cf s)
Mai
n C
hann
el F
low
(cfs
)
Side Channel 3. Klamath River Right Bank Side Channel, CA (RM 206 )
0
400
800
1200
1600
0.0 2.0 4.0 6.0 8.0 10.0 12.0 14.0Side Channel Flow (cfs)
Mai
n C
hann
el F
low
(cfs
)
PacifiCorpKlamath Hydroelectric ProjectFERC No. 2082
February 2004 PacifiCorp Fish Resources FTR.DOCFish Resources FTR Page 4-32
Figure 4.7-8. Relationship between side channel flow and main river flow for side channels 4 through 6.
Side Channel 4. Klamath River Left Bank Side Channel, CA (RM 205.9 )
1350
1400
1450
1500
1550
0.0 2.0 4.0 6.0 8.0 10.0
Side Channel Flow (cfs)
Mai
n C
hann
el F
low
(cfs
)
Side Channel 5. Klamath River Above Bridge Side Channel, CA (RM 205.4 )
0
500
1000
1500
2000
0 50 100 150 200 250
Side Channel Flow (cfs)
Mai
n C
hann
el F
low
(cfs
)
Side Channel 6. Klamath River Island Complex - Left Side Channel, CA (RM 205.0 )
0
500
1000
1500
2000
0 20 40 60 80 100 120 140 160
Side Channel Flow (cfs)
Mai
n C
hann
el F
low
(cfs
)
PacifiCorpKlamath Hydroelectric Project
FERC No. 2082
February 2004 PacifiCorp Fish Resources FTR Page 4-33Fish Resources FTR.DOC
Figure 4.7-9. Relationship between side channel flow and main river flow for side channels 7 through 9
Side Channel 7. Klamath River Island Complex - Mid Side Channel, CA (RM 204.9 )
0
500
1000
1500
2000
0 10 20 30 40 50 60 70
Side Channel Flow (cfs)
Mai
n C
hann
el F
low
(cfs
)
Side Channel 8. Klamath River Above Miller Barn Side Channel, CA (RM 204.6 )
0
600
1200
1800
0.0 2.0 4.0 6.0 8.0 10.0 12.0 14.0
Side Channel Flow (cfs)
Mai
n C
hann
el F
low
(cfs
)
Klamath River 2-D Side Channel, CA (RM 204.4 )
0
500
1000
1500
2000
0.0 5.0 10.0 15.0 20.0
Side Channel Flow (cfs)
Mai
n C
hann
el F
low
(c
fs)
Side Channel 9.
PacifiCorpKlamath Hydroelectric ProjectFERC No. 2082
February 2004 PacifiCorp Fish Resources FTR.DOCFish Resources FTR Page 4-34
Table 4.7-8. Summary of habitat mapping of Fall Creek. Then umber of transects per habitat type and resultingtransect weighting estimates included.
Habitat TypeNumber
Units
TotalLength
(ft)Percentof Total
PercentNormalized*
Number ofTransects
Number ofSample Units
Percent Weight/Transect
Fall Creek Transects and WeightingPool 59 2,463 53.5 55.0 12 4 4.6Glide 0 0 0.0 ---- ---- ---- ----Run 38 851 18.5 19.0 7 3 2.7 Pocket Water 7 117 2.5 ---- ---- ---- ----Riffle (low gradient) 45 632 13.7 14.1 5 2 2.8Riffle (high gradient) 45 532 11.5 11.9 4 2 3.0Cascade 2 10 0.2 ---- ---- ---- ----Totals 196 4,605 100.0 100.0 28 11
* Does not include “cascade” or habitat categories not sampled.
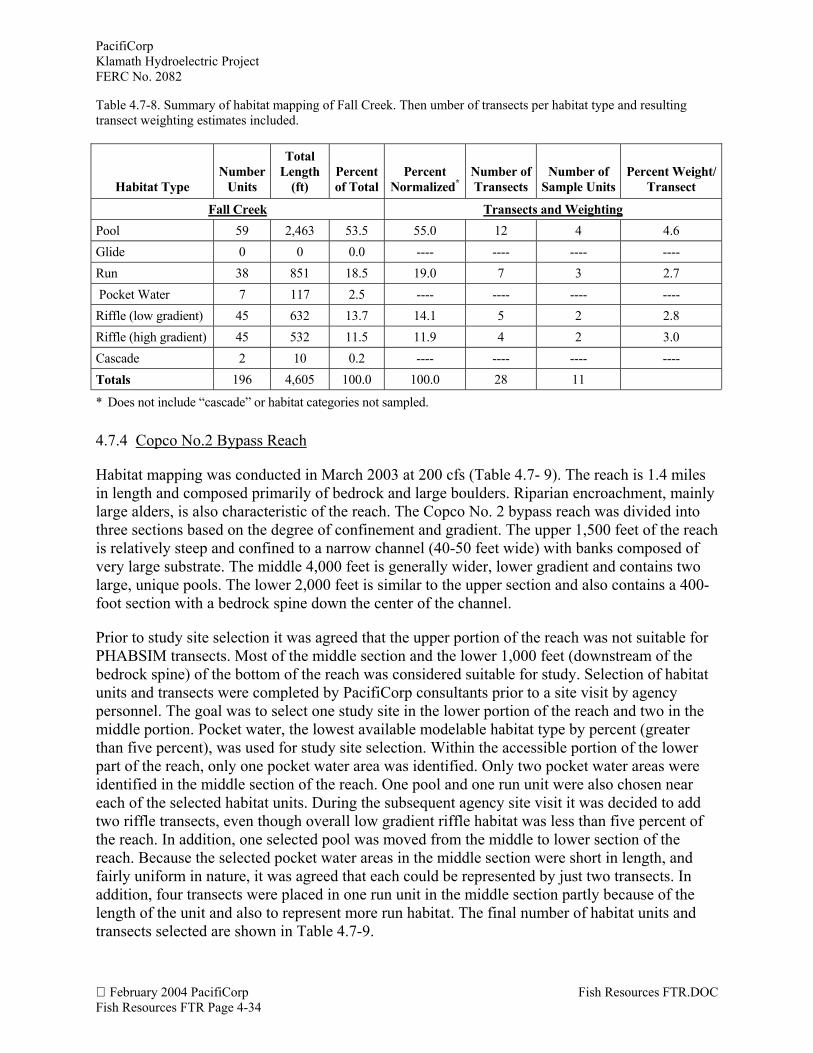
4.7.4 Copco No.2 Bypass Reach
Habitat mapping was conducted in March 2003 at 200 cfs (Table 4.7- 9). The reach is 1.4 milesin length and composed primarily of bedrock and large boulders. Riparian encroachment, mainlylarge alders, is also characteristic of the reach. The Copco No. 2 bypass reach was divided intothree sections based on the degree of confinement and gradient. The upper 1,500 feet of the reachis relatively steep and confined to a narrow channel (40-50 feet wide) with banks composed ofvery large substrate. The middle 4,000 feet is generally wider, lower gradient and contains twolarge, unique pools. The lower 2,000 feet is similar to the upper section and also contains a 400-foot section with a bedrock spine down the center of the channel.
Prior to study site selection it was agreed that the upper portion of the reach was not suitable forPHABSIM transects. Most of the middle section and the lower 1,000 feet (downstream of thebedrock spine) of the bottom of the reach was considered suitable for study. Selection of habitatunits and transects were completed by PacifiCorp consultants prior to a site visit by agencypersonnel. The goal was to select one study site in the lower portion of the reach and two in themiddle portion. Pocket water, the lowest available modelable habitat type by percent (greaterthan five percent), was used for study site selection. Within the accessible portion of the lowerpart of the reach, only one pocket water area was identified. Only two pocket water areas wereidentified in the middle section of the reach. One pool and one run unit were also chosen neareach of the selected habitat units. During the subsequent agency site visit it was decided to addtwo riffle transects, even though overall low gradient riffle habitat was less than five percent ofthe reach. In addition, one selected pool was moved from the middle to lower section of thereach. Because the selected pocket water areas in the middle section were short in length, andfairly uniform in nature, it was agreed that each could be represented by just two transects. Inaddition, four transects were placed in one run unit in the middle section partly because of thelength of the unit and also to represent more run habitat. The final number of habitat units andtransects selected are shown in Table 4.7-9.
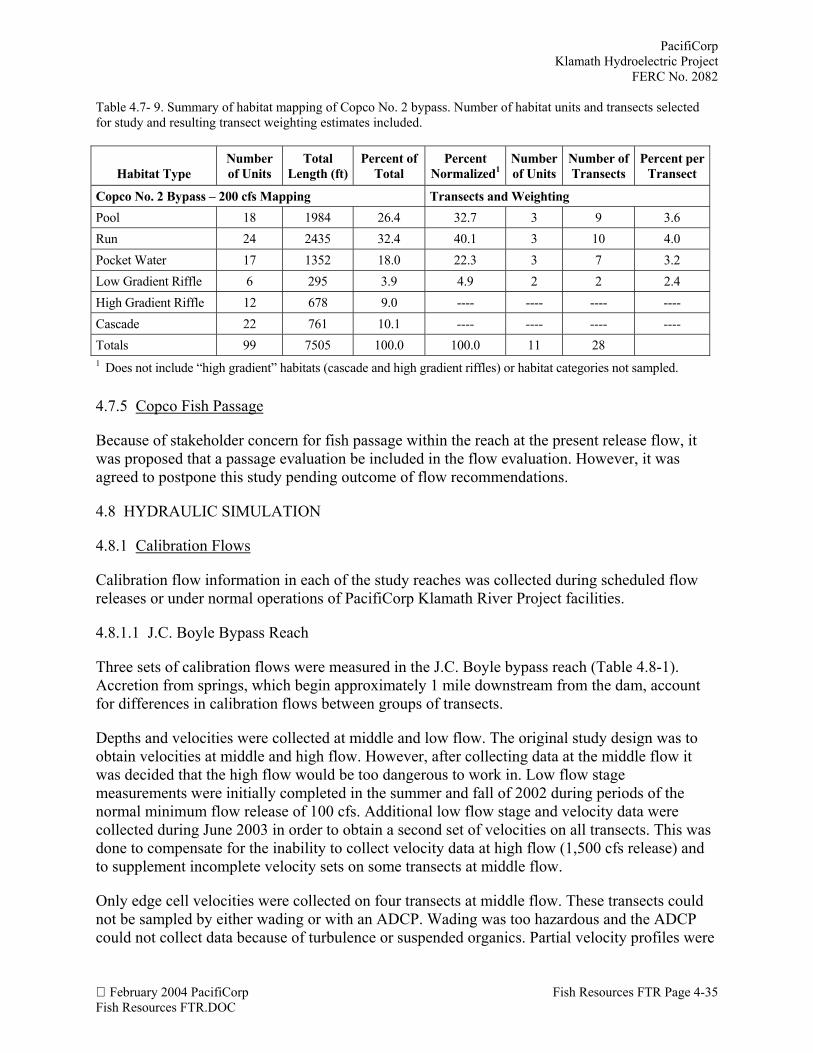
PacifiCorpKlamath Hydroelectric Project
FERC No. 2082
February 2004 PacifiCorp Fish Resources FTR Page 4-35Fish Resources FTR.DOC
Table 4.7- 9. Summary of habitat mapping of Copco No. 2 bypass. Number of habitat units and transects selectedfor study and resulting transect weighting estimates included.
Habitat TypeNumberof Units
TotalLength (ft)
Percent ofTotal
PercentNormalized1
Numberof Units
Number ofTransects
Percent perTransect
Copco No. 2 Bypass – 200 cfs Mapping Transects and WeightingPool 18 1984 26.4 32.7 3 9 3.6Run 24 2435 32.4 40.1 3 10 4.0Pocket Water 17 1352 18.0 22.3 3 7 3.2Low Gradient Riffle 6 295 3.9 4.9 2 2 2.4High Gradient Riffle 12 678 9.0 ---- ---- ---- ----Cascade 22 761 10.1 ---- ---- ---- ----Totals 99 7505 100.0 100.0 11 281 Does not include “high gradient” habitats (cascade and high gradient riffles) or habitat categories not sampled.
4.7.5 Copco Fish Passage
Because of stakeholder concern for fish passage within the reach at the present release flow, itwas proposed that a passage evaluation be included in the flow evaluation. However, it wasagreed to postpone this study pending outcome of flow recommendations.
4.8 HYDRAULIC SIMULATION
4.8.1 Calibration Flows
Calibration flow information in each of the study reaches was collected during scheduled flowreleases or under normal operations of PacifiCorp Klamath River Project facilities.
4.8.1.1 J.C. Boyle Bypass Reach
Three sets of calibration flows were measured in the J.C. Boyle bypass reach (Table 4.8-1).Accretion from springs, which begin approximately 1 mile downstream from the dam, accountfor differences in calibration flows between groups of transects.
Depths and velocities were collected at middle and low flow. The original study design was toobtain velocities at middle and high flow. However, after collecting data at the middle flow itwas decided that the high flow would be too dangerous to work in. Low flow stagemeasurements were initially completed in the summer and fall of 2002 during periods of thenormal minimum flow release of 100 cfs. Additional low flow stage and velocity data werecollected during June 2003 in order to obtain a second set of velocities on all transects. This wasdone to compensate for the inability to collect velocity data at high flow (1,500 cfs release) andto supplement incomplete velocity sets on some transects at middle flow.
Only edge cell velocities were collected on four transects at middle flow. These transects couldnot be sampled by either wading or with an ADCP. Wading was too hazardous and the ADCPcould not collect data because of turbulence or suspended organics. Partial velocity profiles were
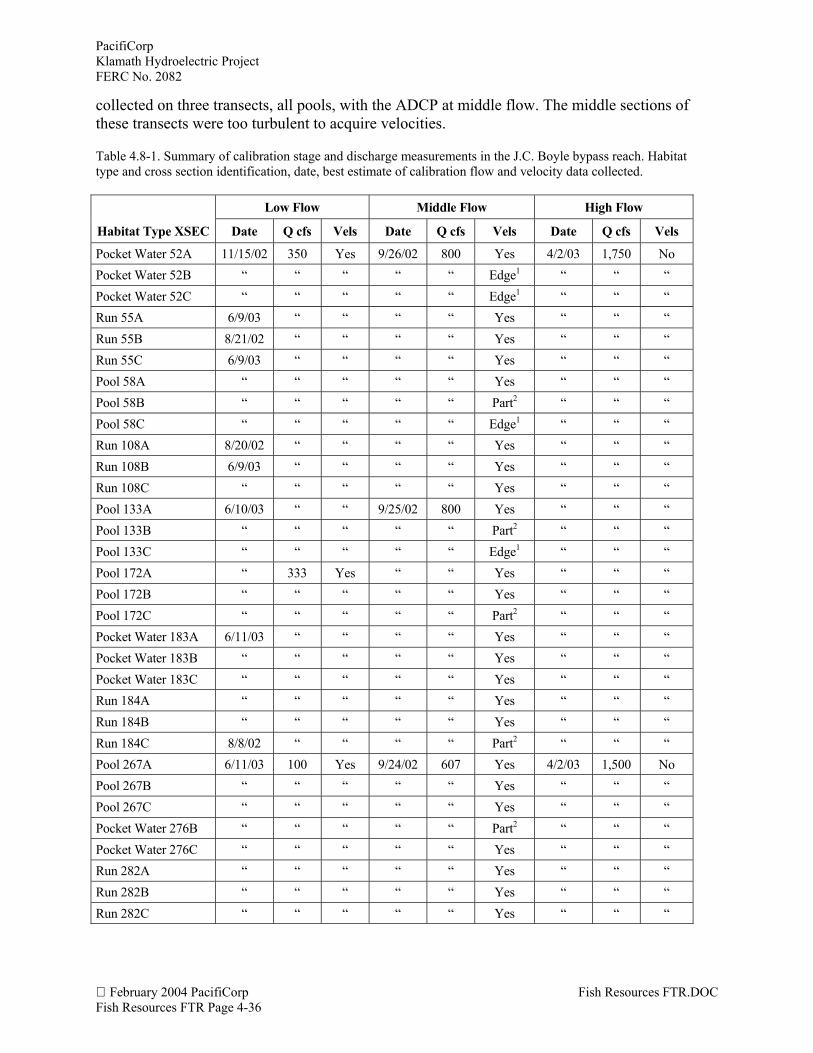
PacifiCorpKlamath Hydroelectric ProjectFERC No. 2082
February 2004 PacifiCorp Fish Resources FTR.DOCFish Resources FTR Page 4-36
collected on three transects, all pools, with the ADCP at middle flow. The middle sections ofthese transects were too turbulent to acquire velocities.
Table 4.8-1. Summary of calibration stage and discharge measurements in the J.C. Boyle bypass reach. Habitattype and cross section identification, date, best estimate of calibration flow and velocity data collected.
Low Flow Middle Flow High Flow
Habitat Type XSEC Date Q cfs Vels Date Q cfs Vels Date Q cfs Vels
Pocket Water 52A 11/15/02 350 Yes 9/26/02 800 Yes 4/2/03 1,750 NoPocket Water 52B “ “ “ “ “ Edge1 “ “ “Pocket Water 52C “ “ “ “ “ Edge1 “ “ “Run 55A 6/9/03 “ “ “ “ Yes “ “ “Run 55B 8/21/02 “ “ “ “ Yes “ “ “Run 55C 6/9/03 “ “ “ “ Yes “ “ “Pool 58A “ “ “ “ “ Yes “ “ “Pool 58B “ “ “ “ “ Part2 “ “ “Pool 58C “ “ “ “ “ Edge1 “ “ “Run 108A 8/20/02 “ “ “ “ Yes “ “ “Run 108B 6/9/03 “ “ “ “ Yes “ “ “Run 108C “ “ “ “ “ Yes “ “ “Pool 133A 6/10/03 “ “ 9/25/02 800 Yes “ “ “Pool 133B “ “ “ “ “ Part2 “ “ “Pool 133C “ “ “ “ “ Edge1 “ “ “Pool 172A “ 333 Yes “ “ Yes “ “ “Pool 172B “ “ “ “ “ Yes “ “ “Pool 172C “ “ “ “ “ Part2 “ “ “Pocket Water 183A 6/11/03 “ “ “ “ Yes “ “ “Pocket Water 183B “ “ “ “ “ Yes “ “ “Pocket Water 183C “ “ “ “ “ Yes “ “ “Run 184A “ “ “ “ “ Yes “ “ “Run 184B “ “ “ “ “ Yes “ “ “Run 184C 8/8/02 “ “ “ “ Part2 “ “ “Pool 267A 6/11/03 100 Yes 9/24/02 607 Yes 4/2/03 1,500 NoPool 267B “ “ “ “ “ Yes “ “ “Pool 267C “ “ “ “ “ Yes “ “ “Pocket Water 276B “ “ “ “ “ Part2 “ “ “Pocket Water 276C “ “ “ “ “ Yes “ “ “Run 282A “ “ “ “ “ Yes “ “ “Run 282B “ “ “ “ “ Yes “ “ “Run 282C “ “ “ “ “ Yes “ “ “
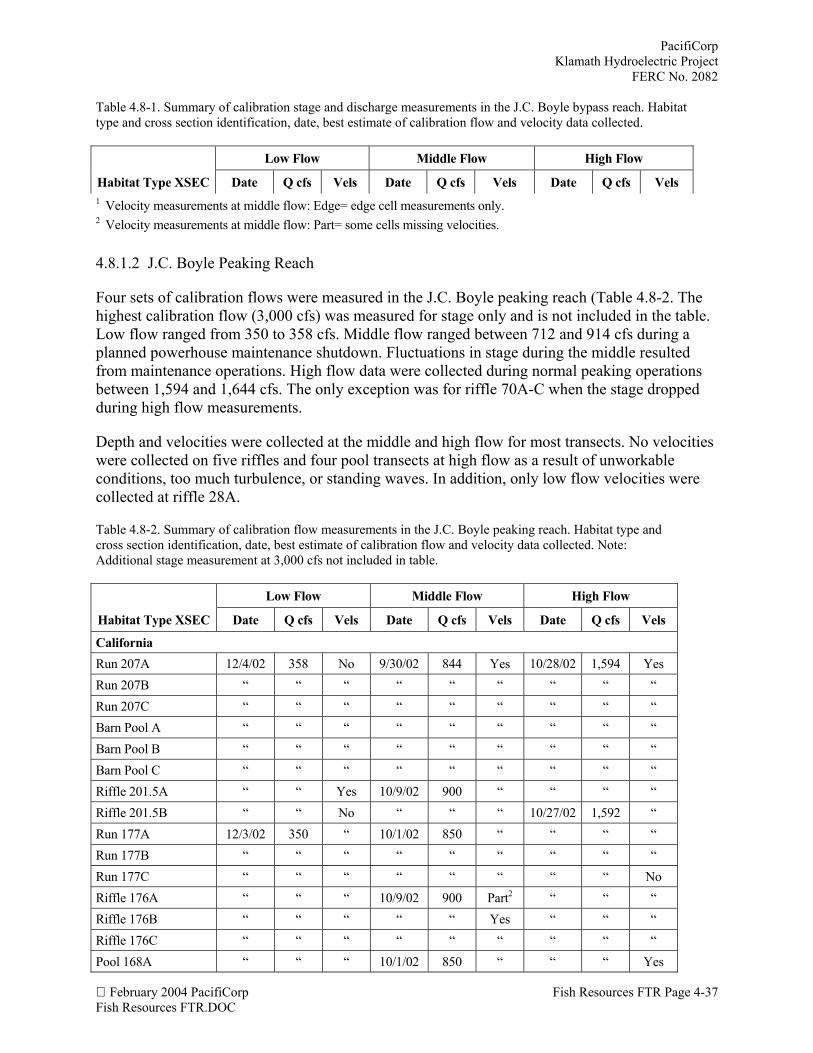
PacifiCorpKlamath Hydroelectric Project
FERC No. 2082
February 2004 PacifiCorp Fish Resources FTR Page 4-37Fish Resources FTR.DOC
Table 4.8-1. Summary of calibration stage and discharge measurements in the J.C. Boyle bypass reach. Habitattype and cross section identification, date, best estimate of calibration flow and velocity data collected.
Low Flow Middle Flow High Flow
Habitat Type XSEC Date Q cfs Vels Date Q cfs Vels Date Q cfs Vels1 Velocity measurements at middle flow: Edge= edge cell measurements only.2 Velocity measurements at middle flow: Part= some cells missing velocities.
4.8.1.2 J.C. Boyle Peaking Reach
Four sets of calibration flows were measured in the J.C. Boyle peaking reach (Table 4.8-2. Thehighest calibration flow (3,000 cfs) was measured for stage only and is not included in the table.Low flow ranged from 350 to 358 cfs. Middle flow ranged between 712 and 914 cfs during aplanned powerhouse maintenance shutdown. Fluctuations in stage during the middle resultedfrom maintenance operations. High flow data were collected during normal peaking operationsbetween 1,594 and 1,644 cfs. The only exception was for riffle 70A-C when the stage droppedduring high flow measurements.
Depth and velocities were collected at the middle and high flow for most transects. No velocitieswere collected on five riffles and four pool transects at high flow as a result of unworkableconditions, too much turbulence, or standing waves. In addition, only low flow velocities werecollected at riffle 28A.
Table 4.8-2. Summary of calibration flow measurements in the J.C. Boyle peaking reach. Habitat type andcross section identification, date, best estimate of calibration flow and velocity data collected. Note:Additional stage measurement at 3,000 cfs not included in table.
Low Flow Middle Flow High Flow
Habitat Type XSEC Date Q cfs Vels Date Q cfs Vels Date Q cfs Vels
CaliforniaRun 207A 12/4/02 358 No 9/30/02 844 Yes 10/28/02 1,594 YesRun 207B “ “ “ “ “ “ “ “ “Run 207C “ “ “ “ “ “ “ “ “Barn Pool A “ “ “ “ “ “ “ “ “Barn Pool B “ “ “ “ “ “ “ “ “Barn Pool C “ “ “ “ “ “ “ “ “Riffle 201.5A “ “ Yes 10/9/02 900 “ “ “ “Riffle 201.5B “ “ No “ “ “ 10/27/02 1,592 “Run 177A 12/3/02 350 “ 10/1/02 850 “ “ “ “Run 177B “ “ “ “ “ “ “ “ “Run 177C “ “ “ “ “ “ “ “ NoRiffle 176A “ “ “ 10/9/02 900 Part2 “ “ “Riffle 176B “ “ “ “ “ Yes “ “ “Riffle 176C “ “ “ “ “ “ “ “ “Pool 168A “ “ “ 10/1/02 850 “ “ “ Yes
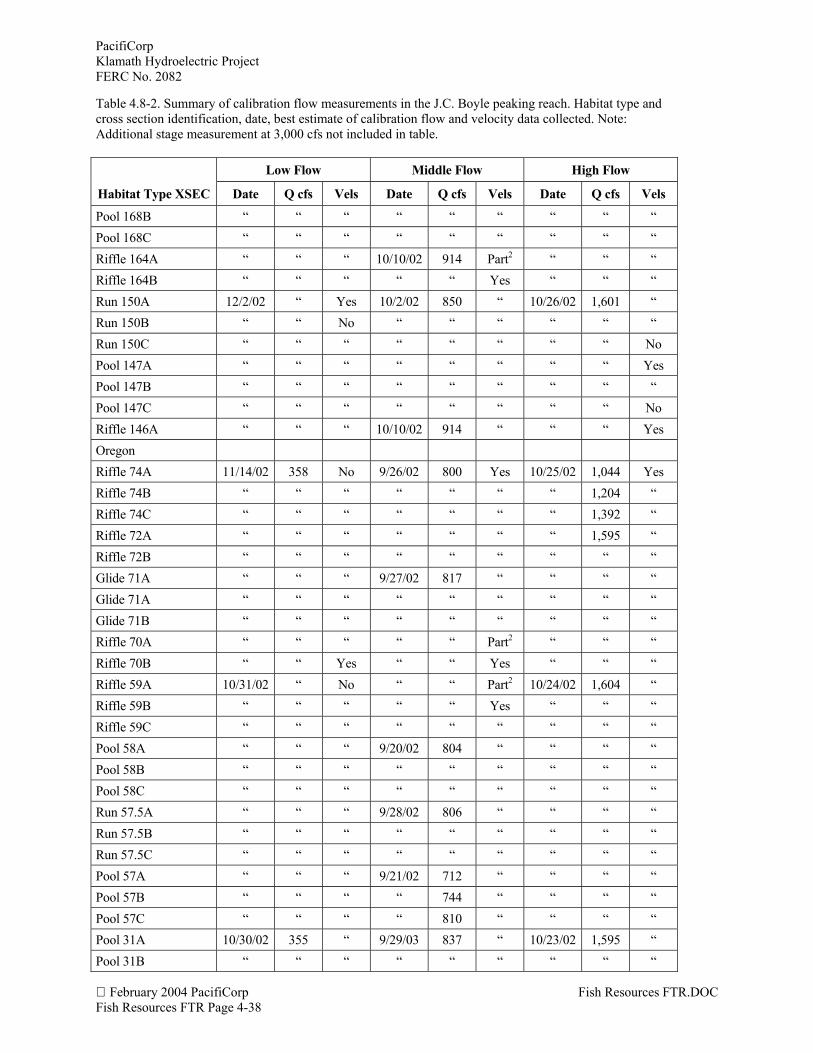
PacifiCorpKlamath Hydroelectric ProjectFERC No. 2082
February 2004 PacifiCorp Fish Resources FTR.DOCFish Resources FTR Page 4-38
Table 4.8-2. Summary of calibration flow measurements in the J.C. Boyle peaking reach. Habitat type andcross section identification, date, best estimate of calibration flow and velocity data collected. Note:Additional stage measurement at 3,000 cfs not included in table.
Low Flow Middle Flow High Flow
Habitat Type XSEC Date Q cfs Vels Date Q cfs Vels Date Q cfs Vels
Pool 168B “ “ “ “ “ “ “ “ “Pool 168C “ “ “ “ “ “ “ “ “Riffle 164A “ “ “ 10/10/02 914 Part2 “ “ “Riffle 164B “ “ “ “ “ Yes “ “ “Run 150A 12/2/02 “ Yes 10/2/02 850 “ 10/26/02 1,601 “Run 150B “ “ No “ “ “ “ “ “Run 150C “ “ “ “ “ “ “ “ NoPool 147A “ “ “ “ “ “ “ “ YesPool 147B “ “ “ “ “ “ “ “ “Pool 147C “ “ “ “ “ “ “ “ NoRiffle 146A “ “ “ 10/10/02 914 “ “ “ YesOregonRiffle 74A 11/14/02 358 No 9/26/02 800 Yes 10/25/02 1,044 YesRiffle 74B “ “ “ “ “ “ “ 1,204 “Riffle 74C “ “ “ “ “ “ “ 1,392 “Riffle 72A “ “ “ “ “ “ “ 1,595 “Riffle 72B “ “ “ “ “ “ “ “ “Glide 71A “ “ “ 9/27/02 817 “ “ “ “Glide 71A “ “ “ “ “ “ “ “ “Glide 71B “ “ “ “ “ “ “ “ “Riffle 70A “ “ “ “ “ Part2 “ “ “Riffle 70B “ “ Yes “ “ Yes “ “ “Riffle 59A 10/31/02 “ No “ “ Part2 10/24/02 1,604 “Riffle 59B “ “ “ “ “ Yes “ “ “Riffle 59C “ “ “ “ “ “ “ “ “Pool 58A “ “ “ 9/20/02 804 “ “ “ “Pool 58B “ “ “ “ “ “ “ “ “Pool 58C “ “ “ “ “ “ “ “ “Run 57.5A “ “ “ 9/28/02 806 “ “ “ “Run 57.5B “ “ “ “ “ “ “ “ “Run 57.5C “ “ “ “ “ “ “ “ “Pool 57A “ “ “ 9/21/02 712 “ “ “ “Pool 57B “ “ “ “ 744 “ “ “ “Pool 57C “ “ “ “ 810 “ “ “ “Pool 31A 10/30/02 355 “ 9/29/03 837 “ 10/23/02 1,595 “Pool 31B “ “ “ “ “ “ “ “ “
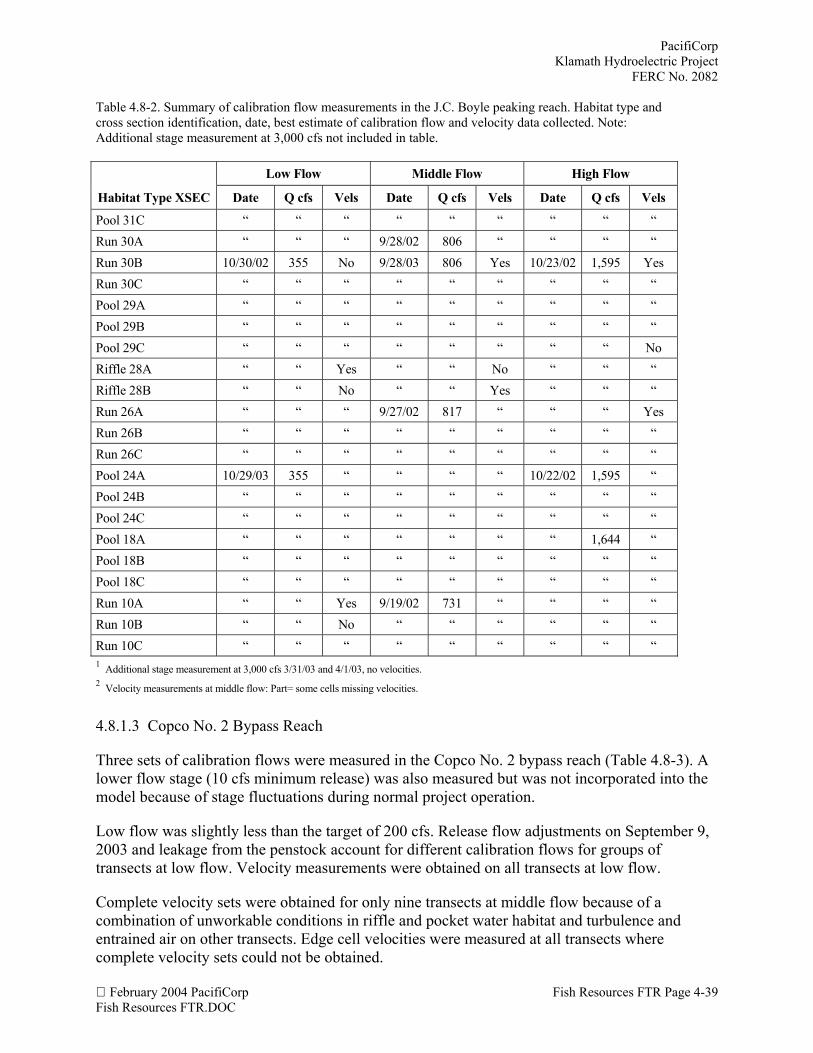
PacifiCorpKlamath Hydroelectric Project
FERC No. 2082
February 2004 PacifiCorp Fish Resources FTR Page 4-39Fish Resources FTR.DOC
Table 4.8-2. Summary of calibration flow measurements in the J.C. Boyle peaking reach. Habitat type andcross section identification, date, best estimate of calibration flow and velocity data collected. Note:Additional stage measurement at 3,000 cfs not included in table.
Low Flow Middle Flow High Flow
Habitat Type XSEC Date Q cfs Vels Date Q cfs Vels Date Q cfs Vels
Pool 31C “ “ “ “ “ “ “ “ “Run 30A “ “ “ 9/28/02 806 “ “ “ “Run 30B 10/30/02 355 No 9/28/03 806 Yes 10/23/02 1,595 YesRun 30C “ “ “ “ “ “ “ “ “Pool 29A “ “ “ “ “ “ “ “ “Pool 29B “ “ “ “ “ “ “ “ “Pool 29C “ “ “ “ “ “ “ “ NoRiffle 28A “ “ Yes “ “ No “ “ “Riffle 28B “ “ No “ “ Yes “ “ “Run 26A “ “ “ 9/27/02 817 “ “ “ YesRun 26B “ “ “ “ “ “ “ “ “Run 26C “ “ “ “ “ “ “ “ “Pool 24A 10/29/03 355 “ “ “ “ 10/22/02 1,595 “Pool 24B “ “ “ “ “ “ “ “ “Pool 24C “ “ “ “ “ “ “ “ “Pool 18A “ “ “ “ “ “ “ 1,644 “Pool 18B “ “ “ “ “ “ “ “ “Pool 18C “ “ “ “ “ “ “ “ “Run 10A “ “ Yes 9/19/02 731 “ “ “ “Run 10B “ “ No “ “ “ “ “ “Run 10C “ “ “ “ “ “ “ “ “1 Additional stage measurement at 3,000 cfs 3/31/03 and 4/1/03, no velocities.2 Velocity measurements at middle flow: Part= some cells missing velocities.
4.8.1.3 Copco No. 2 Bypass Reach
Three sets of calibration flows were measured in the Copco No. 2 bypass reach (Table 4.8-3). Alower flow stage (10 cfs minimum release) was also measured but was not incorporated into themodel because of stage fluctuations during normal project operation.
Low flow was slightly less than the target of 200 cfs. Release flow adjustments on September 9,2003 and leakage from the penstock account for different calibration flows for groups oftransects at low flow. Velocity measurements were obtained on all transects at low flow.
Complete velocity sets were obtained for only nine transects at middle flow because of acombination of unworkable conditions in riffle and pocket water habitat and turbulence andentrained air on other transects. Edge cell velocities were measured at all transects wherecomplete velocity sets could not be obtained.
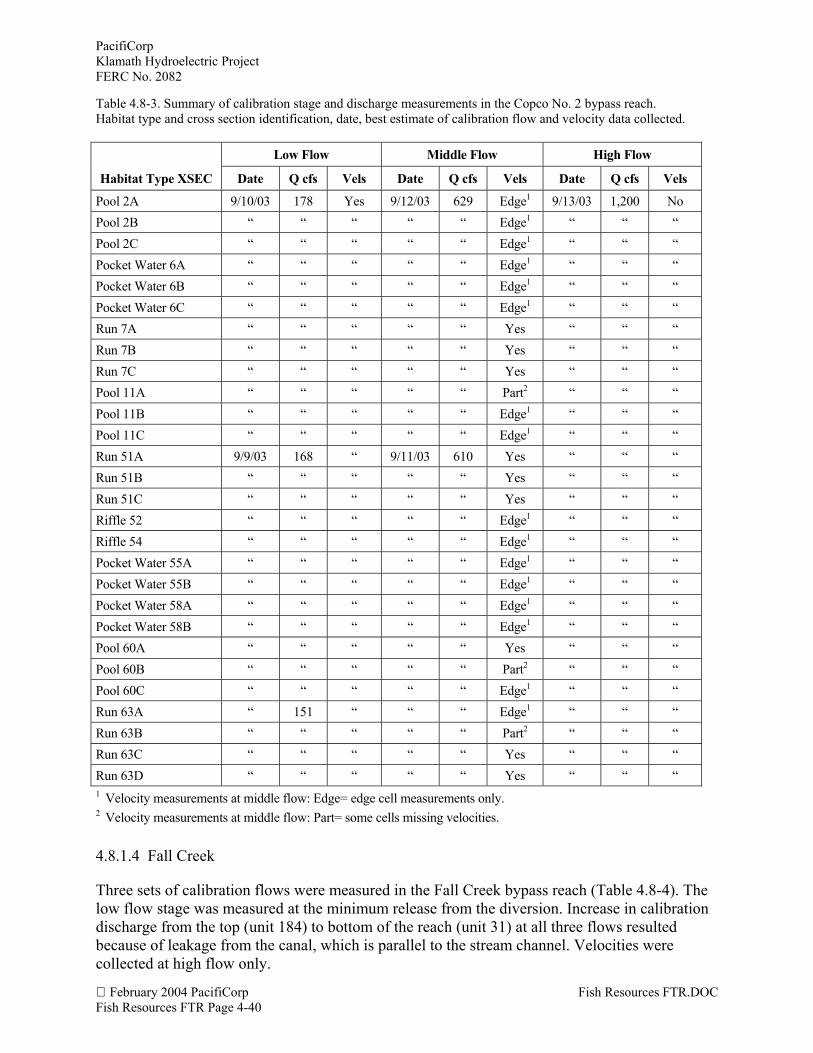
PacifiCorpKlamath Hydroelectric ProjectFERC No. 2082
February 2004 PacifiCorp Fish Resources FTR.DOCFish Resources FTR Page 4-40
Table 4.8-3. Summary of calibration stage and discharge measurements in the Copco No. 2 bypass reach.Habitat type and cross section identification, date, best estimate of calibration flow and velocity data collected.
Low Flow Middle Flow High Flow
Habitat Type XSEC Date Q cfs Vels Date Q cfs Vels Date Q cfs Vels
Pool 2A 9/10/03 178 Yes 9/12/03 629 Edge1 9/13/03 1,200 NoPool 2B “ “ “ “ “ Edge1 “ “ “Pool 2C “ “ “ “ “ Edge1 “ “ “Pocket Water 6A “ “ “ “ “ Edge1 “ “ “Pocket Water 6B “ “ “ “ “ Edge1 “ “ “Pocket Water 6C “ “ “ “ “ Edge1 “ “ “Run 7A “ “ “ “ “ Yes “ “ “Run 7B “ “ “ “ “ Yes “ “ “Run 7C “ “ “ “ “ Yes “ “ “Pool 11A “ “ “ “ “ Part2 “ “ “Pool 11B “ “ “ “ “ Edge1 “ “ “Pool 11C “ “ “ “ “ Edge1 “ “ “Run 51A 9/9/03 168 “ 9/11/03 610 Yes “ “ “Run 51B “ “ “ “ “ Yes “ “ “Run 51C “ “ “ “ “ Yes “ “ “Riffle 52 “ “ “ “ “ Edge1 “ “ “Riffle 54 “ “ “ “ “ Edge1 “ “ “Pocket Water 55A “ “ “ “ “ Edge1 “ “ “Pocket Water 55B “ “ “ “ “ Edge1 “ “ “Pocket Water 58A “ “ “ “ “ Edge1 “ “ “Pocket Water 58B “ “ “ “ “ Edge1 “ “ “Pool 60A “ “ “ “ “ Yes “ “ “Pool 60B “ “ “ “ “ Part2 “ “ “Pool 60C “ “ “ “ “ Edge1 “ “ “Run 63A “ 151 “ “ “ Edge1 “ “ “Run 63B “ “ “ “ “ Part2 “ “ “Run 63C “ “ “ “ “ Yes “ “ “Run 63D “ “ “ “ “ Yes “ “ “1 Velocity measurements at middle flow: Edge= edge cell measurements only.2 Velocity measurements at middle flow: Part= some cells missing velocities.
4.8.1.4 Fall Creek
Three sets of calibration flows were measured in the Fall Creek bypass reach (Table 4.8-4). Thelow flow stage was measured at the minimum release from the diversion. Increase in calibrationdischarge from the top (unit 184) to bottom of the reach (unit 31) at all three flows resultedbecause of leakage from the canal, which is parallel to the stream channel. Velocities werecollected at high flow only.
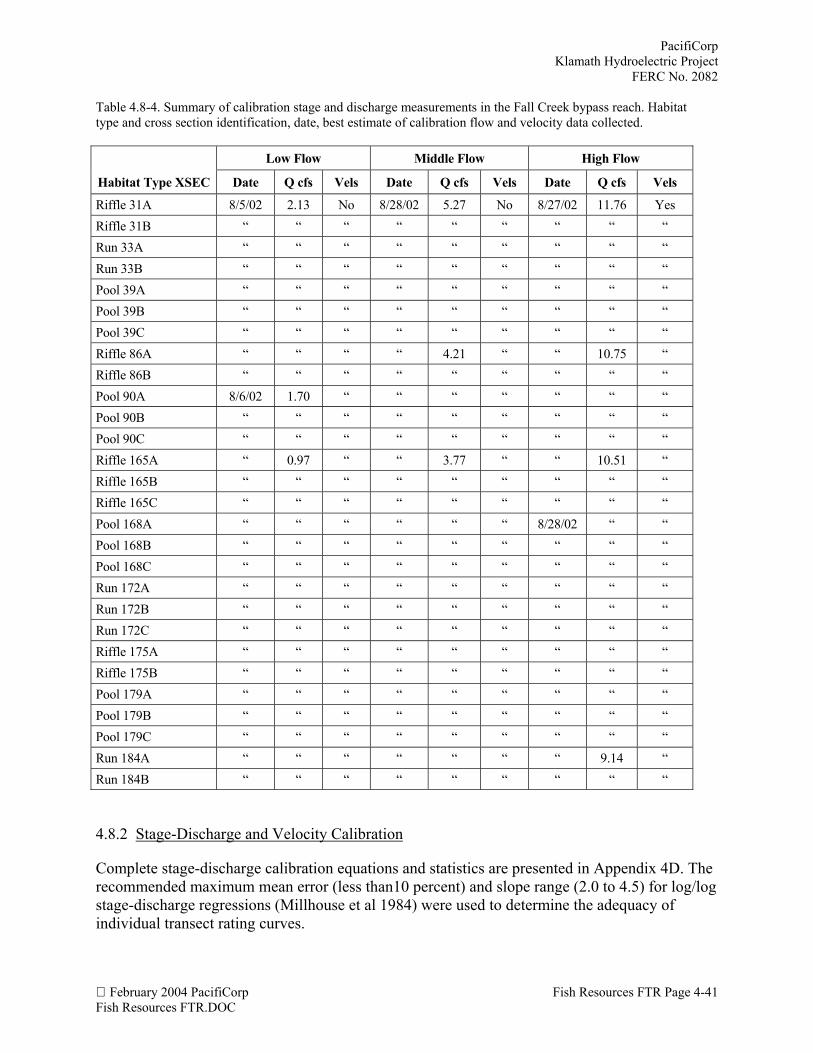
PacifiCorpKlamath Hydroelectric Project
FERC No. 2082
February 2004 PacifiCorp Fish Resources FTR Page 4-41Fish Resources FTR.DOC
Table 4.8-4. Summary of calibration stage and discharge measurements in the Fall Creek bypass reach. Habitattype and cross section identification, date, best estimate of calibration flow and velocity data collected.
Low Flow Middle Flow High Flow
Habitat Type XSEC Date Q cfs Vels Date Q cfs Vels Date Q cfs Vels
Riffle 31A 8/5/02 2.13 No 8/28/02 5.27 No 8/27/02 11.76 YesRiffle 31B “ “ “ “ “ “ “ “ “Run 33A “ “ “ “ “ “ “ “ “Run 33B “ “ “ “ “ “ “ “ “Pool 39A “ “ “ “ “ “ “ “ “Pool 39B “ “ “ “ “ “ “ “ “Pool 39C “ “ “ “ “ “ “ “ “Riffle 86A “ “ “ “ 4.21 “ “ 10.75 “Riffle 86B “ “ “ “ “ “ “ “ “Pool 90A 8/6/02 1.70 “ “ “ “ “ “ “Pool 90B “ “ “ “ “ “ “ “ “Pool 90C “ “ “ “ “ “ “ “ “Riffle 165A “ 0.97 “ “ 3.77 “ “ 10.51 “Riffle 165B “ “ “ “ “ “ “ “ “Riffle 165C “ “ “ “ “ “ “ “ “Pool 168A “ “ “ “ “ “ 8/28/02 “ “Pool 168B “ “ “ “ “ “ “ “ “Pool 168C “ “ “ “ “ “ “ “ “Run 172A “ “ “ “ “ “ “ “ “Run 172B “ “ “ “ “ “ “ “ “Run 172C “ “ “ “ “ “ “ “ “Riffle 175A “ “ “ “ “ “ “ “ “Riffle 175B “ “ “ “ “ “ “ “ “Pool 179A “ “ “ “ “ “ “ “ “Pool 179B “ “ “ “ “ “ “ “ “Pool 179C “ “ “ “ “ “ “ “ “Run 184A “ “ “ “ “ “ “ 9.14 “Run 184B “ “ “ “ “ “ “ “ “
4.8.2 Stage-Discharge and Velocity Calibration
Complete stage-discharge calibration equations and statistics are presented in Appendix 4D. Therecommended maximum mean error (less than10 percent) and slope range (2.0 to 4.5) for log/ logstage-discharge regressions (Millhouse et al 1984) were used to determine the adequacy ofindividual transect rating curves.
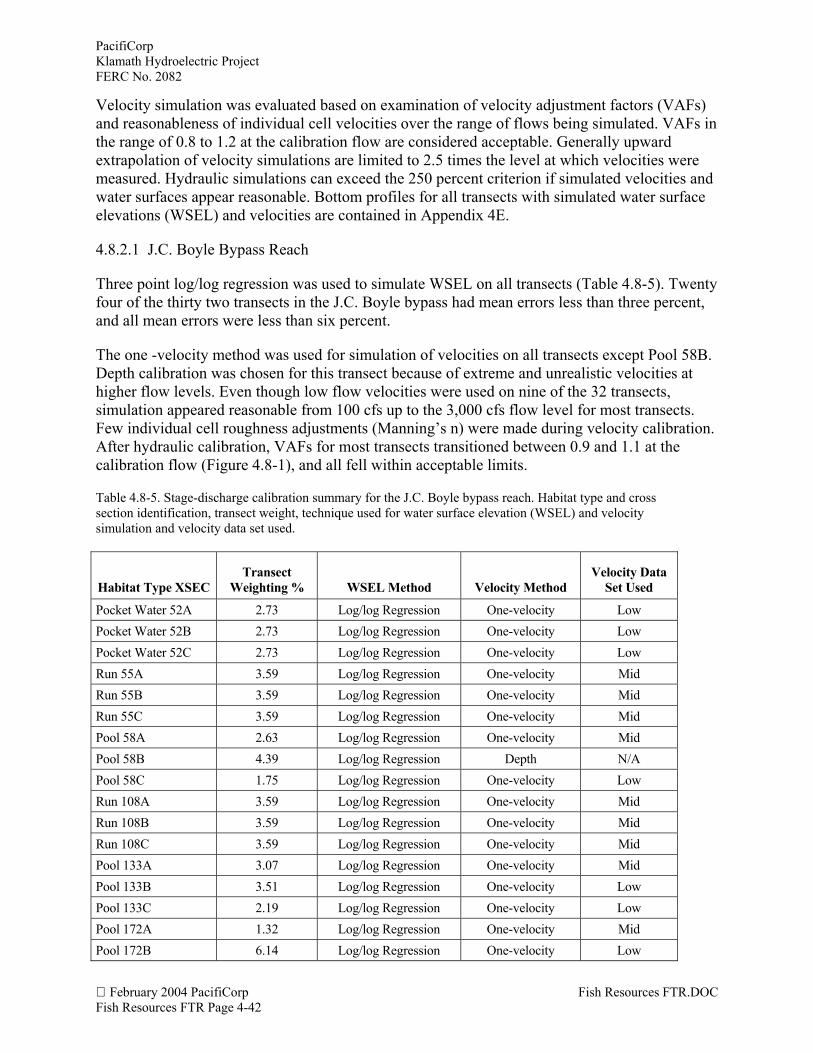
PacifiCorpKlamath Hydroelectric ProjectFERC No. 2082
February 2004 PacifiCorp Fish Resources FTR.DOCFish Resources FTR Page 4-42
Velocity simulation was evaluated based on examination of velocity adjustment factors (VAFs)and reasonableness of individual cell velocities over the range of flows being simulated. VAFs inthe range of 0.8 to 1.2 at the calibration flow are considered acceptable. Generally upwardextrapolation of velocity simulations are limited to 2.5 times the level at which velocities weremeasured. Hydraulic simulations can exceed the 250 percent criterion if simulated velocities andwater surfaces appear reasonable. Bottom profiles for all transects with simulated water surfaceelevations (WSEL) and velocities are contained in Appendix 4E.
4.8.2.1 J.C. Boyle Bypass Reach
Three point log/log regression was used to simulate WSEL on all transects (Table 4.8-5). Twentyfour of the thirty two transects in the J.C. Boyle bypass had mean errors less than three percent,and all mean errors were less than six percent.
The one -velocity method was used for simulation of velocities on all transects except Pool 58B.Depth calibration was chosen for this transect because of extreme and unrealistic velocities athigher flow levels. Even though low flow velocities were used on nine of the 32 transects,simulation appeared reasonable from 100 cfs up to the 3,000 cfs flow level for most transects.Few individual cell roughness adjustments (Manning’s n) were made during velocity calibration.After hydraulic calibration, VAFs for most transects transitioned between 0.9 and 1.1 at thecalibration flow (Figure 4.8-1), and all fell within acceptable limits.
Table 4.8-5. Stage-discharge calibration summary for the J.C. Boyle bypass reach. Habitat type and crosssection identification, transect weight, technique used for water surface elevation (WSEL) and velocitysimulation and velocity data set used.
Habitat Type XSECTransect
Weighting % WSEL Method Velocity MethodVelocity Data
Set Used
Pocket Water 52A 2.73 Log/log Regression One-velocity LowPocket Water 52B 2.73 Log/log Regression One-velocity LowPocket Water 52C 2.73 Log/log Regression One-velocity LowRun 55A 3.59 Log/log Regression One-velocity MidRun 55B 3.59 Log/log Regression One-velocity MidRun 55C 3.59 Log/log Regression One-velocity MidPool 58A 2.63 Log/log Regression One-velocity MidPool 58B 4.39 Log/log Regression Depth N/APool 58C 1.75 Log/log Regression One-velocity LowRun 108A 3.59 Log/log Regression One-velocity MidRun 108B 3.59 Log/log Regression One-velocity MidRun 108C 3.59 Log/log Regression One-velocity MidPool 133A 3.07 Log/log Regression One-velocity MidPool 133B 3.51 Log/log Regression One-velocity LowPool 133C 2.19 Log/log Regression One-velocity LowPool 172A 1.32 Log/log Regression One-velocity MidPool 172B 6.14 Log/log Regression One-velocity Low
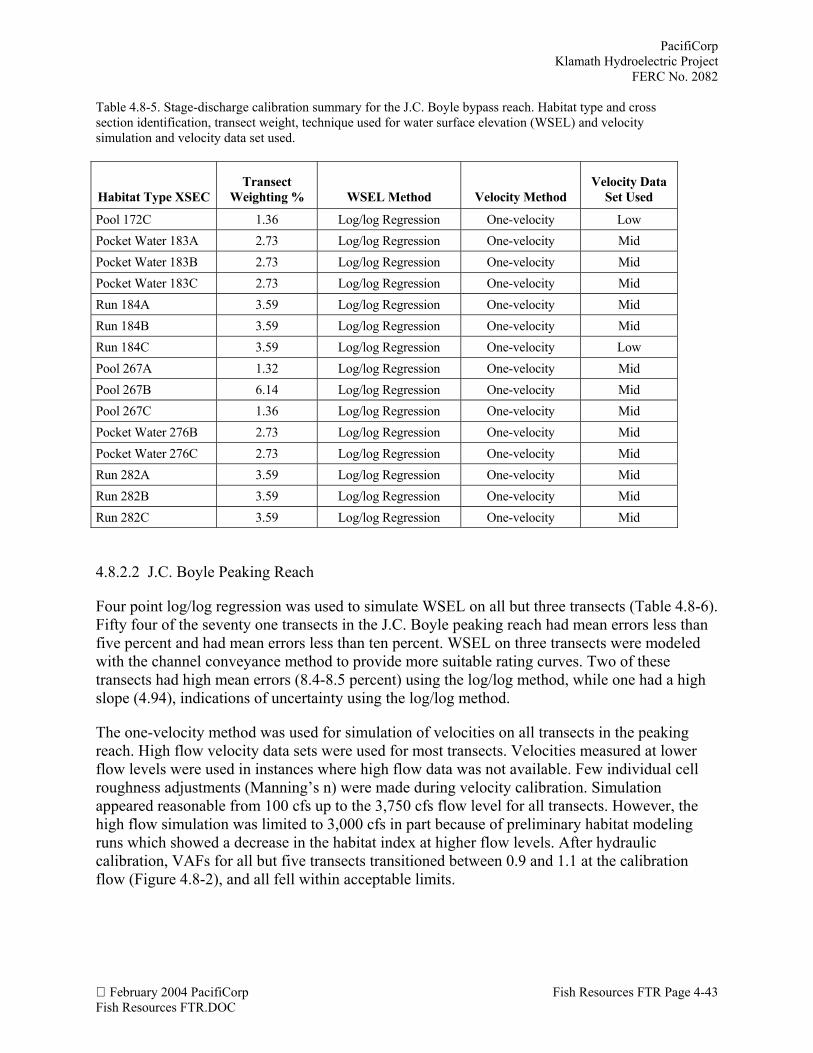
PacifiCorpKlamath Hydroelectric Project
FERC No. 2082
February 2004 PacifiCorp Fish Resources FTR Page 4-43Fish Resources FTR.DOC
Table 4.8-5. Stage-discharge calibration summary for the J.C. Boyle bypass reach. Habitat type and crosssection identification, transect weight, technique used for water surface elevation (WSEL) and velocitysimulation and velocity data set used.
Habitat Type XSECTransect
Weighting % WSEL Method Velocity MethodVelocity Data
Set Used
Pool 172C 1.36 Log/log Regression One-velocity LowPocket Water 183A 2.73 Log/log Regression One-velocity MidPocket Water 183B 2.73 Log/log Regression One-velocity MidPocket Water 183C 2.73 Log/log Regression One-velocity MidRun 184A 3.59 Log/log Regression One-velocity MidRun 184B 3.59 Log/log Regression One-velocity MidRun 184C 3.59 Log/log Regression One-velocity LowPool 267A 1.32 Log/log Regression One-velocity MidPool 267B 6.14 Log/log Regression One-velocity MidPool 267C 1.36 Log/log Regression One-velocity MidPocket Water 276B 2.73 Log/log Regression One-velocity MidPocket Water 276C 2.73 Log/log Regression One-velocity MidRun 282A 3.59 Log/log Regression One-velocity MidRun 282B 3.59 Log/log Regression One-velocity MidRun 282C 3.59 Log/log Regression One-velocity Mid
4.8.2.2 J.C. Boyle Peaking Reach
Four point log/log regression was used to simulate WSEL on all but three transects (Table 4.8-6).Fifty four of the seventy one transects in the J.C. Boyle peaking reach had mean errors less thanfive percent and had mean errors less than ten percent. WSEL on three transects were modeledwith the channel conveyance method to provide more suitable rating curves. Two of thesetransects had high mean errors (8.4-8.5 percent) using the log/log method, while one had a highslope (4.94), indications of uncertainty using the log/log method.
The one-velocity method was used for simulation of velocities on all transects in the peakingreach. High flow velocity data sets were used for most transects. Velocities measured at lowerflow levels were used in instances where high flow data was not available. Few individual cellroughness adjustments (Manning’s n) were made during velocity calibration. Simulationappeared reasonable from 100 cfs up to the 3,750 cfs flow level for all transects. However, thehigh flow simulation was limited to 3,000 cfs in part because of preliminary habitat modelingruns which showed a decrease in the habitat index at higher flow levels. After hydrauliccalibration, VAFs for all but five transects transitioned between 0.9 and 1.1 at the calibrationflow (Figure 4.8-2), and all fell within acceptable limits.
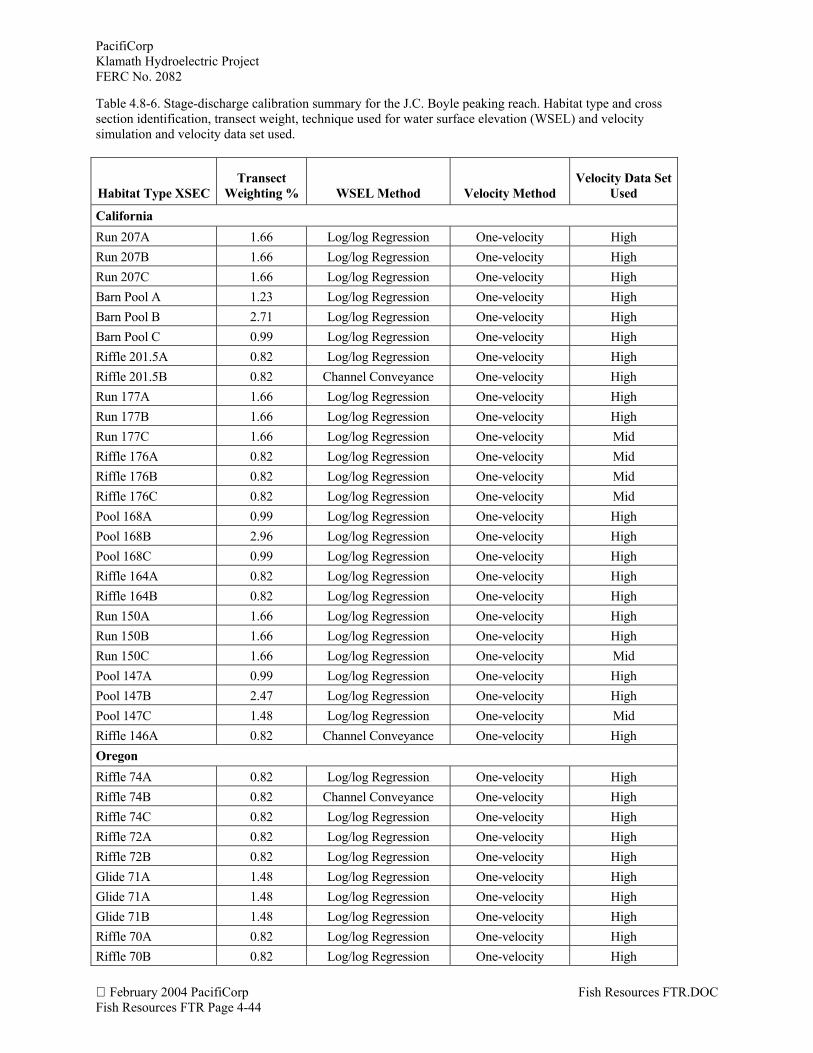
PacifiCorpKlamath Hydroelectric ProjectFERC No. 2082
February 2004 PacifiCorp Fish Resources FTR.DOCFish Resources FTR Page 4-44
Table 4.8-6. Stage-discharge calibration summary for the J.C. Boyle peaking reach. Habitat type and crosssection identification, transect weight, technique used for water surface elevation (WSEL) and velocitysimulation and velocity data set used.
Habitat Type XSECTransect
Weighting % WSEL Method Velocity MethodVelocity Data Set
Used
CaliforniaRun 207A 1.66 Log/log Regression One-velocity HighRun 207B 1.66 Log/log Regression One-velocity HighRun 207C 1.66 Log/log Regression One-velocity HighBarn Pool A 1.23 Log/log Regression One-velocity HighBarn Pool B 2.71 Log/log Regression One-velocity HighBarn Pool C 0.99 Log/log Regression One-velocity HighRiffle 201.5A 0.82 Log/log Regression One-velocity HighRiffle 201.5B 0.82 Channel Conveyance One-velocity HighRun 177A 1.66 Log/log Regression One-velocity HighRun 177B 1.66 Log/log Regression One-velocity HighRun 177C 1.66 Log/log Regression One-velocity MidRiffle 176A 0.82 Log/log Regression One-velocity MidRiffle 176B 0.82 Log/log Regression One-velocity MidRiffle 176C 0.82 Log/log Regression One-velocity MidPool 168A 0.99 Log/log Regression One-velocity HighPool 168B 2.96 Log/log Regression One-velocity HighPool 168C 0.99 Log/log Regression One-velocity HighRiffle 164A 0.82 Log/log Regression One-velocity HighRiffle 164B 0.82 Log/log Regression One-velocity HighRun 150A 1.66 Log/log Regression One-velocity HighRun 150B 1.66 Log/log Regression One-velocity HighRun 150C 1.66 Log/log Regression One-velocity MidPool 147A 0.99 Log/log Regression One-velocity HighPool 147B 2.47 Log/log Regression One-velocity HighPool 147C 1.48 Log/log Regression One-velocity MidRiffle 146A 0.82 Channel Conveyance One-velocity HighOregonRiffle 74A 0.82 Log/log Regression One-velocity HighRiffle 74B 0.82 Channel Conveyance One-velocity HighRiffle 74C 0.82 Log/log Regression One-velocity HighRiffle 72A 0.82 Log/log Regression One-velocity HighRiffle 72B 0.82 Log/log Regression One-velocity HighGlide 71A 1.48 Log/log Regression One-velocity HighGlide 71A 1.48 Log/log Regression One-velocity HighGlide 71B 1.48 Log/log Regression One-velocity HighRiffle 70A 0.82 Log/log Regression One-velocity HighRiffle 70B 0.82 Log/log Regression One-velocity High
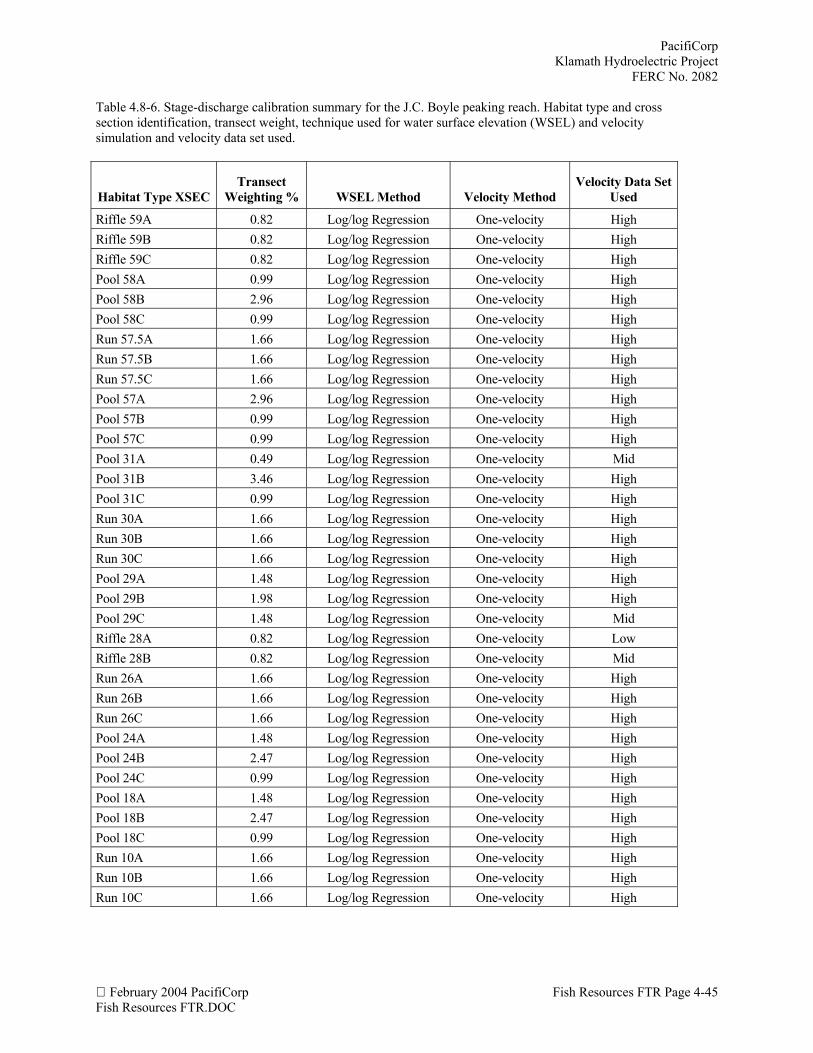
PacifiCorpKlamath Hydroelectric Project
FERC No. 2082
February 2004 PacifiCorp Fish Resources FTR Page 4-45Fish Resources FTR.DOC
Table 4.8-6. Stage-discharge calibration summary for the J.C. Boyle peaking reach. Habitat type and crosssection identification, transect weight, technique used for water surface elevation (WSEL) and velocitysimulation and velocity data set used.
Habitat Type XSECTransect
Weighting % WSEL Method Velocity MethodVelocity Data Set
Used
Riffle 59A 0.82 Log/log Regression One-velocity HighRiffle 59B 0.82 Log/log Regression One-velocity HighRiffle 59C 0.82 Log/log Regression One-velocity HighPool 58A 0.99 Log/log Regression One-velocity HighPool 58B 2.96 Log/log Regression One-velocity HighPool 58C 0.99 Log/log Regression One-velocity HighRun 57.5A 1.66 Log/log Regression One-velocity HighRun 57.5B 1.66 Log/log Regression One-velocity HighRun 57.5C 1.66 Log/log Regression One-velocity HighPool 57A 2.96 Log/log Regression One-velocity HighPool 57B 0.99 Log/log Regression One-velocity HighPool 57C 0.99 Log/log Regression One-velocity HighPool 31A 0.49 Log/log Regression One-velocity MidPool 31B 3.46 Log/log Regression One-velocity HighPool 31C 0.99 Log/log Regression One-velocity HighRun 30A 1.66 Log/log Regression One-velocity HighRun 30B 1.66 Log/log Regression One-velocity HighRun 30C 1.66 Log/log Regression One-velocity HighPool 29A 1.48 Log/log Regression One-velocity HighPool 29B 1.98 Log/log Regression One-velocity HighPool 29C 1.48 Log/log Regression One-velocity MidRiffle 28A 0.82 Log/log Regression One-velocity LowRiffle 28B 0.82 Log/log Regression One-velocity MidRun 26A 1.66 Log/log Regression One-velocity HighRun 26B 1.66 Log/log Regression One-velocity HighRun 26C 1.66 Log/log Regression One-velocity HighPool 24A 1.48 Log/log Regression One-velocity HighPool 24B 2.47 Log/log Regression One-velocity HighPool 24C 0.99 Log/log Regression One-velocity HighPool 18A 1.48 Log/log Regression One-velocity HighPool 18B 2.47 Log/log Regression One-velocity HighPool 18C 0.99 Log/log Regression One-velocity HighRun 10A 1.66 Log/log Regression One-velocity HighRun 10B 1.66 Log/log Regression One-velocity HighRun 10C 1.66 Log/log Regression One-velocity High
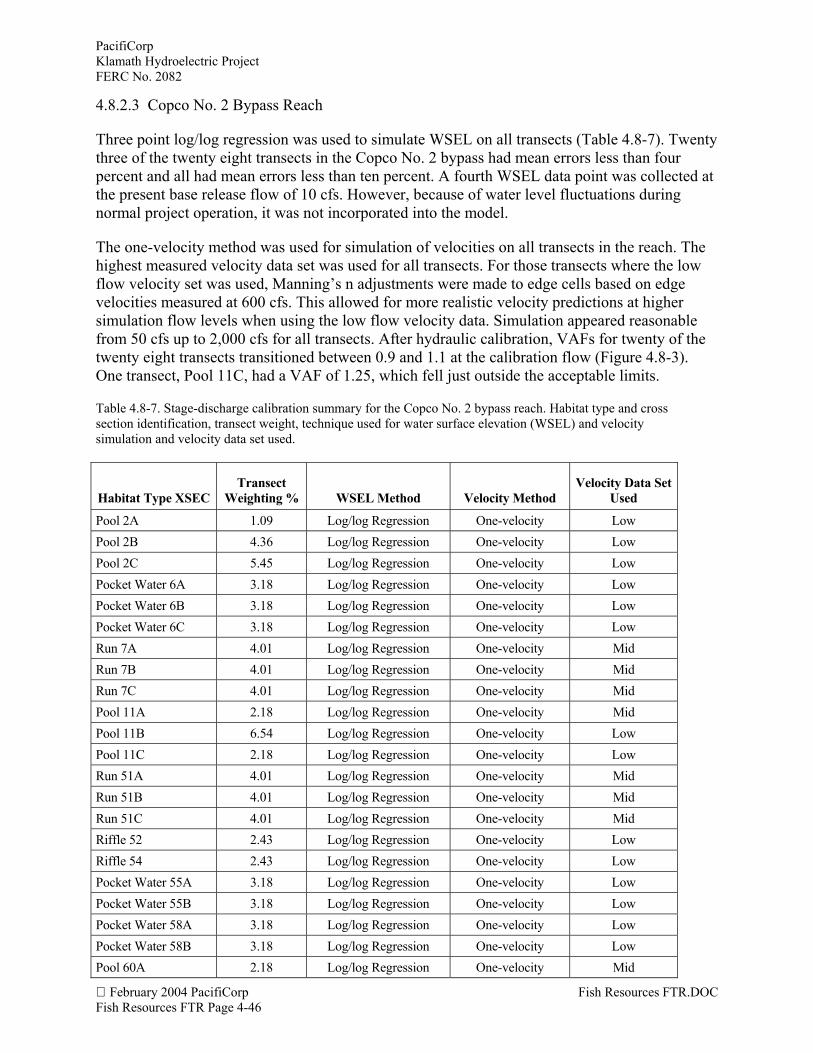
PacifiCorpKlamath Hydroelectric ProjectFERC No. 2082
February 2004 PacifiCorp Fish Resources FTR.DOCFish Resources FTR Page 4-46
4.8.2.3 Copco No. 2 Bypass Reach
Three point log/log regression was used to simulate WSEL on all transects (Table 4.8-7). Twentythree of the twenty eight transects in the Copco No. 2 bypass had mean errors less than fourpercent and all had mean errors less than ten percent. A fourth WSEL data point was collected atthe present base release flow of 10 cfs. However, because of water level fluctuations duringnormal project operation, it was not incorporated into the model.
The one-velocity method was used for simulation of velocities on all transects in the reach. Thehighest measured velocity data set was used for all transects. For those transects where the lowflow velocity set was used, Manning’s n adjustments were made to edge cells based on edgevelocities measured at 600 cfs. This allowed for more realistic velocity predictions at highersimulation flow levels when using the low flow velocity data. Simulation appeared reasonablefrom 50 cfs up to 2,000 cfs for all transects. After hydraulic calibration, VAFs for twenty of thetwenty eight transects transitioned between 0.9 and 1.1 at the calibration flow (Figure 4.8-3).One transect, Pool 11C, had a VAF of 1.25, which fell just outside the acceptable limits.
Table 4.8-7. Stage-discharge calibration summary for the Copco No. 2 bypass reach. Habitat type and crosssection identification, transect weight, technique used for water surface elevation (WSEL) and velocitysimulation and velocity data set used.
Habitat Type XSECTransect
Weighting % WSEL Method Velocity MethodVelocity Data Set
Used
Pool 2A 1.09 Log/log Regression One-velocity LowPool 2B 4.36 Log/log Regression One-velocity LowPool 2C 5.45 Log/log Regression One-velocity LowPocket Water 6A 3.18 Log/log Regression One-velocity LowPocket Water 6B 3.18 Log/log Regression One-velocity LowPocket Water 6C 3.18 Log/log Regression One-velocity LowRun 7A 4.01 Log/log Regression One-velocity MidRun 7B 4.01 Log/log Regression One-velocity MidRun 7C 4.01 Log/log Regression One-velocity MidPool 11A 2.18 Log/log Regression One-velocity MidPool 11B 6.54 Log/log Regression One-velocity LowPool 11C 2.18 Log/log Regression One-velocity LowRun 51A 4.01 Log/log Regression One-velocity MidRun 51B 4.01 Log/log Regression One-velocity MidRun 51C 4.01 Log/log Regression One-velocity MidRiffle 52 2.43 Log/log Regression One-velocity LowRiffle 54 2.43 Log/log Regression One-velocity LowPocket Water 55A 3.18 Log/log Regression One-velocity LowPocket Water 55B 3.18 Log/log Regression One-velocity LowPocket Water 58A 3.18 Log/log Regression One-velocity LowPocket Water 58B 3.18 Log/log Regression One-velocity LowPool 60A 2.18 Log/log Regression One-velocity Mid
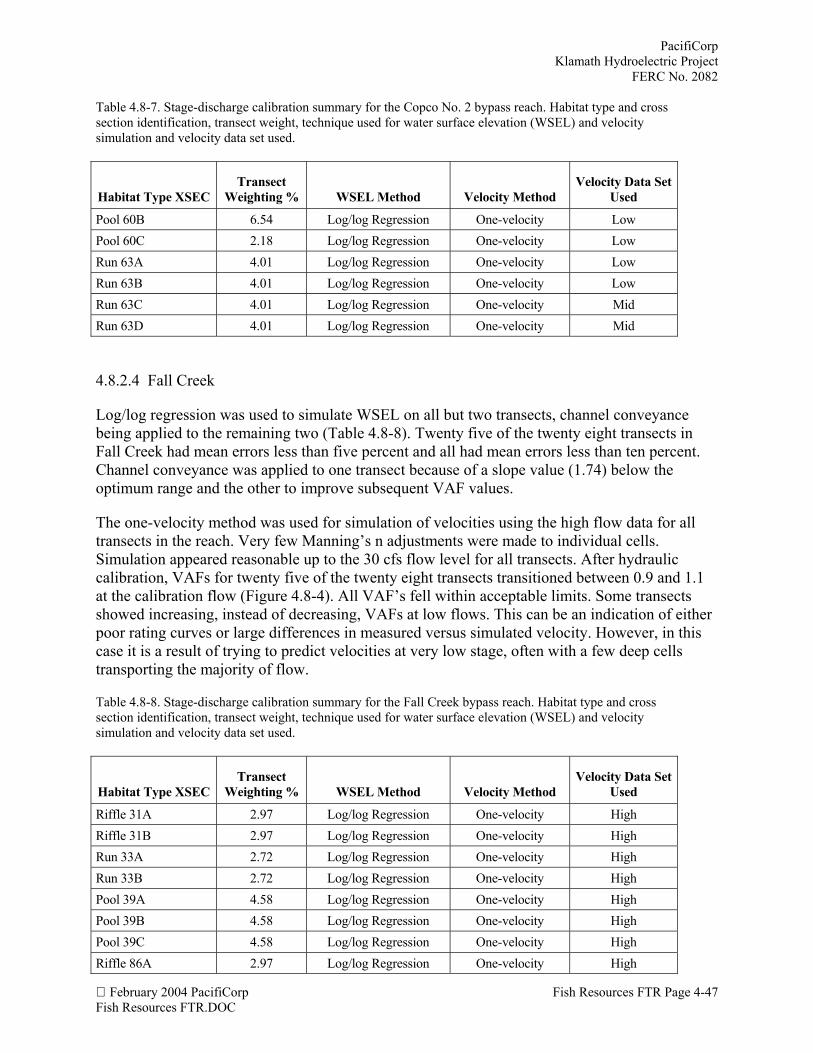
PacifiCorpKlamath Hydroelectric Project
FERC No. 2082
February 2004 PacifiCorp Fish Resources FTR Page 4-47Fish Resources FTR.DOC
Table 4.8-7. Stage-discharge calibration summary for the Copco No. 2 bypass reach. Habitat type and crosssection identification, transect weight, technique used for water surface elevation (WSEL) and velocitysimulation and velocity data set used.
Habitat Type XSECTransect
Weighting % WSEL Method Velocity MethodVelocity Data Set
Used
Pool 60B 6.54 Log/log Regression One-velocity LowPool 60C 2.18 Log/log Regression One-velocity LowRun 63A 4.01 Log/log Regression One-velocity LowRun 63B 4.01 Log/log Regression One-velocity LowRun 63C 4.01 Log/log Regression One-velocity MidRun 63D 4.01 Log/log Regression One-velocity Mid
4.8.2.4 Fall Creek
Log/log regression was used to simulate WSEL on all but two transects, channel conveyancebeing applied to the remaining two (Table 4.8-8). Twenty five of the twenty eight transects inFall Creek had mean errors less than five percent and all had mean errors less than ten percent.Channel conveyance was applied to one transect because of a slope value (1.74) below theoptimum range and the other to improve subsequent VAF values.
The one-velocity method was used for simulation of velocities using the high flow data for alltransects in the reach. Very few Manning’s n adjustments were made to individual cells.Simulation appeared reasonable up to the 30 cfs flow level for all transects. After hydrauliccalibration, VAFs for twenty five of the twenty eight transects transitioned between 0.9 and 1.1at the calibration flow (Figure 4.8-4). All VAF’s fell within acceptable limits. Some transectsshowed increasing, instead of decreasing, VAFs at low flows. This can be an indication of eitherpoor rating curves or large differences in measured versus simulated velocity. However, in thiscase it is a result of trying to predict velocities at very low stage, often with a few deep cellstransporting the majority of flow.
Table 4.8-8. Stage-discharge calibration summary for the Fall Creek bypass reach. Habitat type and crosssection identification, transect weight, technique used for water surface elevation (WSEL) and velocitysimulation and velocity data set used.
Habitat Type XSECTransect
Weighting % WSEL Method Velocity MethodVelocity Data Set
Used
Riffle 31A 2.97 Log/log Regression One-velocity HighRiffle 31B 2.97 Log/log Regression One-velocity HighRun 33A 2.72 Log/log Regression One-velocity HighRun 33B 2.72 Log/log Regression One-velocity HighPool 39A 4.58 Log/log Regression One-velocity HighPool 39B 4.58 Log/log Regression One-velocity HighPool 39C 4.58 Log/log Regression One-velocity HighRiffle 86A 2.97 Log/log Regression One-velocity High
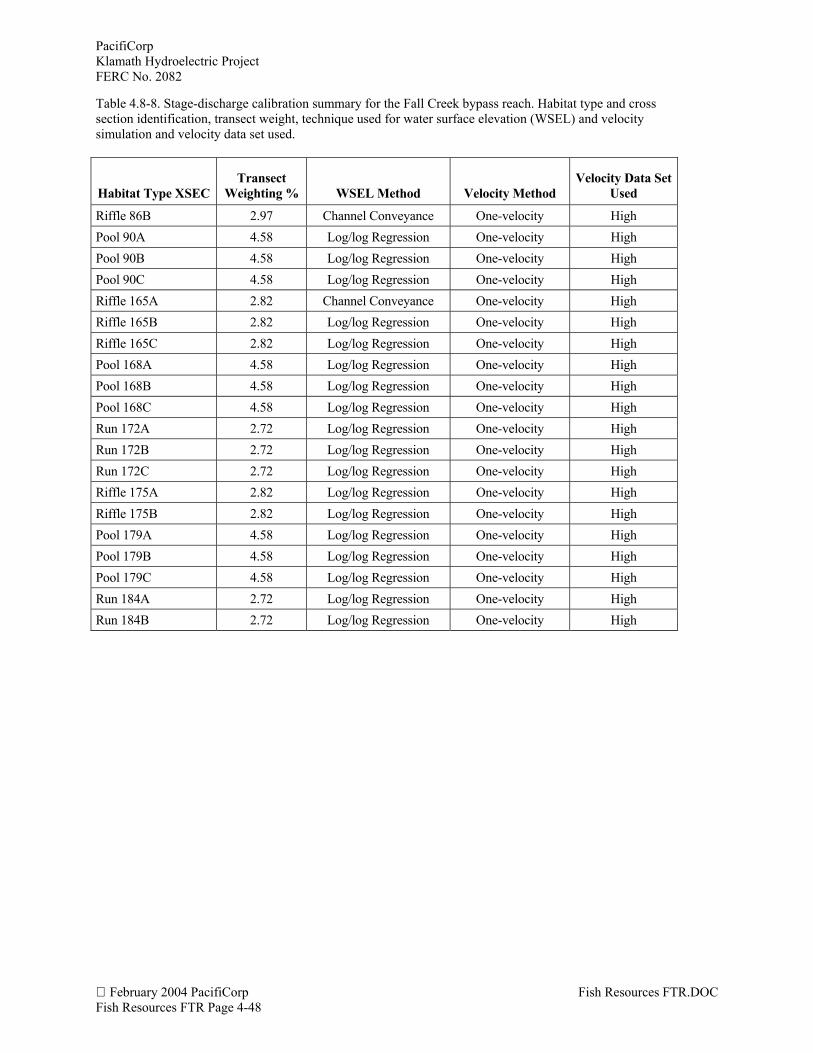
PacifiCorpKlamath Hydroelectric ProjectFERC No. 2082
February 2004 PacifiCorp Fish Resources FTR.DOCFish Resources FTR Page 4-48
Table 4.8-8. Stage-discharge calibration summary for the Fall Creek bypass reach. Habitat type and crosssection identification, transect weight, technique used for water surface elevation (WSEL) and velocitysimulation and velocity data set used.
Habitat Type XSECTransect
Weighting % WSEL Method Velocity MethodVelocity Data Set
Used
Riffle 86B 2.97 Channel Conveyance One-velocity HighPool 90A 4.58 Log/log Regression One-velocity HighPool 90B 4.58 Log/log Regression One-velocity HighPool 90C 4.58 Log/log Regression One-velocity HighRiffle 165A 2.82 Channel Conveyance One-velocity HighRiffle 165B 2.82 Log/log Regression One-velocity HighRiffle 165C 2.82 Log/log Regression One-velocity HighPool 168A 4.58 Log/log Regression One-velocity HighPool 168B 4.58 Log/log Regression One-velocity HighPool 168C 4.58 Log/log Regression One-velocity HighRun 172A 2.72 Log/log Regression One-velocity HighRun 172B 2.72 Log/log Regression One-velocity HighRun 172C 2.72 Log/log Regression One-velocity HighRiffle 175A 2.82 Log/log Regression One-velocity HighRiffle 175B 2.82 Log/log Regression One-velocity HighPool 179A 4.58 Log/log Regression One-velocity HighPool 179B 4.58 Log/log Regression One-velocity HighPool 179C 4.58 Log/log Regression One-velocity HighRun 184A 2.72 Log/log Regression One-velocity HighRun 184B 2.72 Log/log Regression One-velocity High
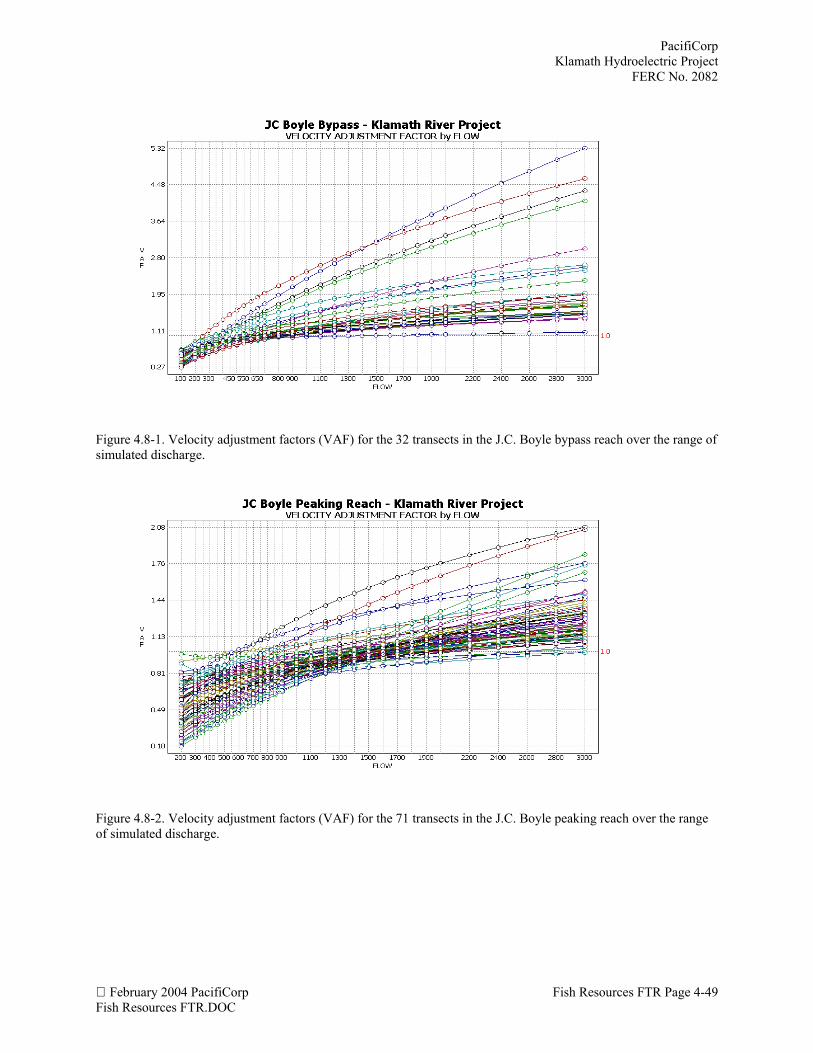
PacifiCorpKlamath Hydroelectric Project
FERC No. 2082
February 2004 PacifiCorp Fish Resources FTR Page 4-49Fish Resources FTR.DOC
Figure 4.8-1. Velocity adjustment factors (VAF) for the 32 transects in the J.C. Boyle bypass reach over the range ofsimulated discharge.
Figure 4.8-2. Velocity adjustment factors (VAF) for the 71 transects in the J.C. Boyle peaking reach over the rangeof simulated discharge.
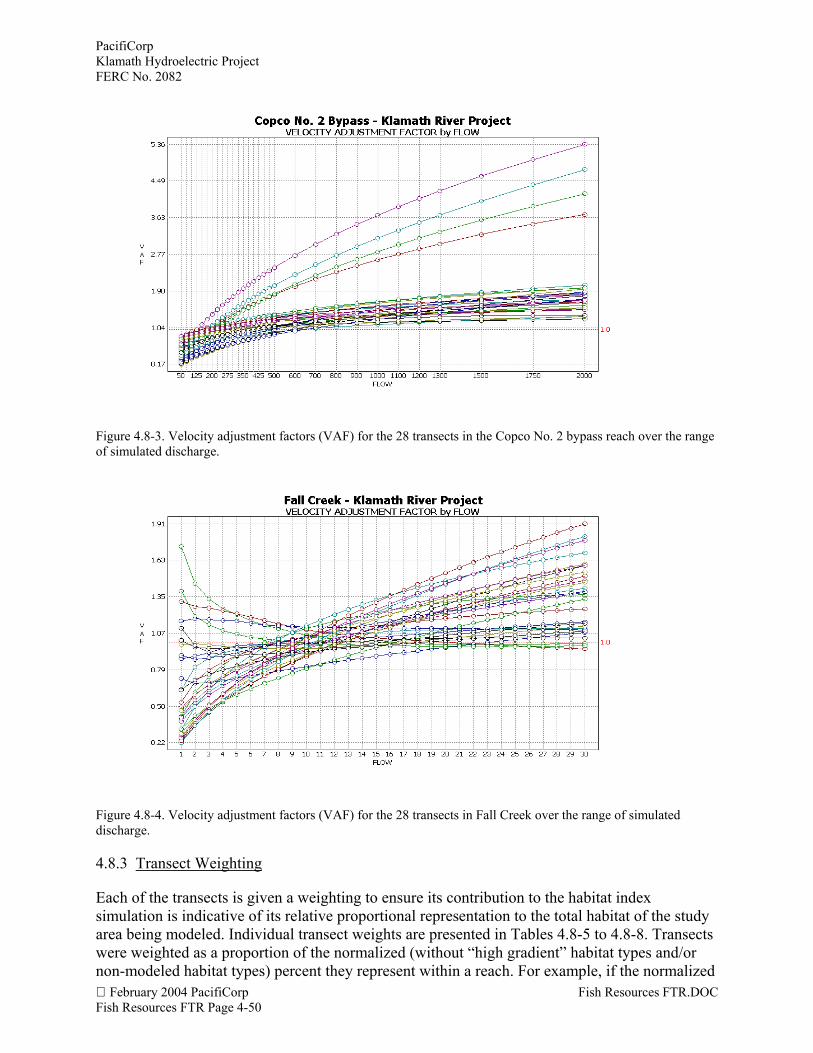
PacifiCorpKlamath Hydroelectric ProjectFERC No. 2082
February 2004 PacifiCorp Fish Resources FTR.DOCFish Resources FTR Page 4-50
Figure 4.8-3. Velocity adjustment factors (VAF) for the 28 transects in the Copco No. 2 bypass reach over the rangeof simulated discharge.
Figure 4.8-4. Velocity adjustment factors (VAF) for the 28 transects in Fall Creek over the range of simulateddischarge.
4.8.3 Transect Weighting
Each of the transects is given a weighting to ensure its contribution to the habitat indexsimulation is indicative of its relative proportional representation to the total habitat of the studyarea being modeled. Individual transect weights are presented in Tables 4.8-5 to 4.8-8. Transectswere weighted as a proportion of the normalized (without “high gradient” habitat types and/ornon-modeled habitat types) percent they represent within a reach. For example, if the normalized
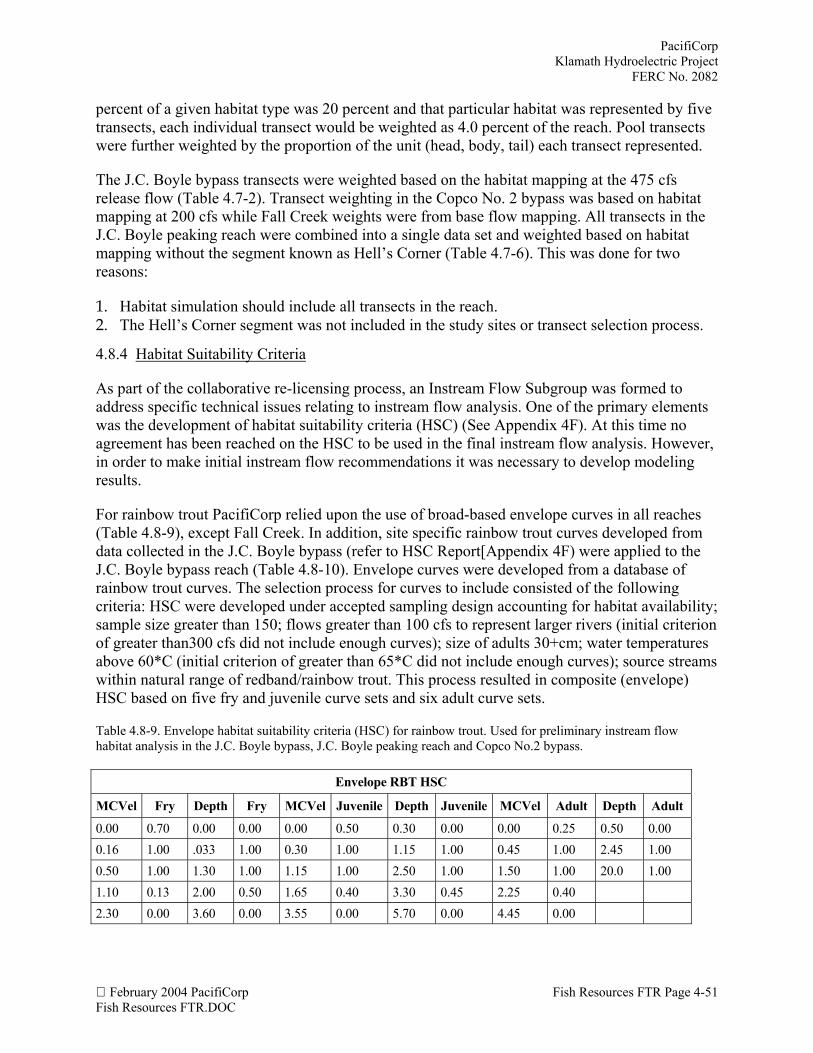
PacifiCorpKlamath Hydroelectric Project
FERC No. 2082
February 2004 PacifiCorp Fish Resources FTR Page 4-51Fish Resources FTR.DOC
percent of a given habitat type was 20 percent and that particular habitat was represented by fivetransects, each individual transect would be weighted as 4.0 percent of the reach. Pool transectswere further weighted by the proportion of the unit (head, body, tail) each transect represented.
The J.C. Boyle bypass transects were weighted based on the habitat mapping at the 475 cfsrelease flow (Table 4.7-2). Transect weighting in the Copco No. 2 bypass was based on habitatmapping at 200 cfs while Fall Creek weights were from base flow mapping. All transects in theJ.C. Boyle peaking reach were combined into a single data set and weighted based on habitatmapping without the segment known as Hell’s Corner (Table 4.7-6). This was done for tworeasons:
1. Habitat simulation should include all transects in the reach.2. The Hell’s Corner segment was not included in the study sites or transect selection process.
4.8.4 Habitat Suitability Criteria
As part of the collaborative re-licensing process, an Instream Flow Subgroup was formed toaddress specific technical issues relating to instream flow analysis. One of the primary elementswas the development of habitat suitability criteria (HSC) (See Appendix 4F). At this time noagreement has been reached on the HSC to be used in the final instream flow analysis. However,in order to make initial instream flow recommendations it was necessary to develop modelingresults.
For rainbow trout PacifiCorp relied upon the use of broad-based envelope curves in all reaches(Table 4.8-9), except Fall Creek. In addition, site specific rainbow trout curves developed fromdata collected in the J.C. Boyle bypass (refer to HSC Report[Appendix 4F) were applied to theJ.C. Boyle bypass reach (Table 4.8-10). Envelope curves were developed from a database ofrainbow trout curves. The selection process for curves to include consisted of the followingcriteria: HSC were developed under accepted sampling design accounting for habitat availability;sample size greater than 150; flows greater than 100 cfs to represent larger rivers (initial criterionof greater than300 cfs did not include enough curves); size of adults 30+cm; water temperaturesabove 60*C (initial criterion of greater than 65*C did not include enough curves); source streamswithin natural range of redband/rainbow trout. This process resulted in composite (envelope)HSC based on five fry and juvenile curve sets and six adult curve sets.
Table 4.8-9. Envelope habitat suitability criteria (HSC) for rainbow trout. Used for preliminary instream flowhabitat analysis in the J.C. Boyle bypass, J.C. Boyle peaking reach and Copco No.2 bypass.
Envelope RBT HSC
MCVel Fry Depth Fry MCVel Juvenile Depth Juvenile MCVel Adult Depth Adult
0.00 0.70 0.00 0.00 0.00 0.50 0.30 0.00 0.00 0.25 0.50 0.000.16 1.00 .033 1.00 0.30 1.00 1.15 1.00 0.45 1.00 2.45 1.000.50 1.00 1.30 1.00 1.15 1.00 2.50 1.00 1.50 1.00 20.0 1.001.10 0.13 2.00 0.50 1.65 0.40 3.30 0.45 2.25 0.402.30 0.00 3.60 0.00 3.55 0.00 5.70 0.00 4.45 0.00
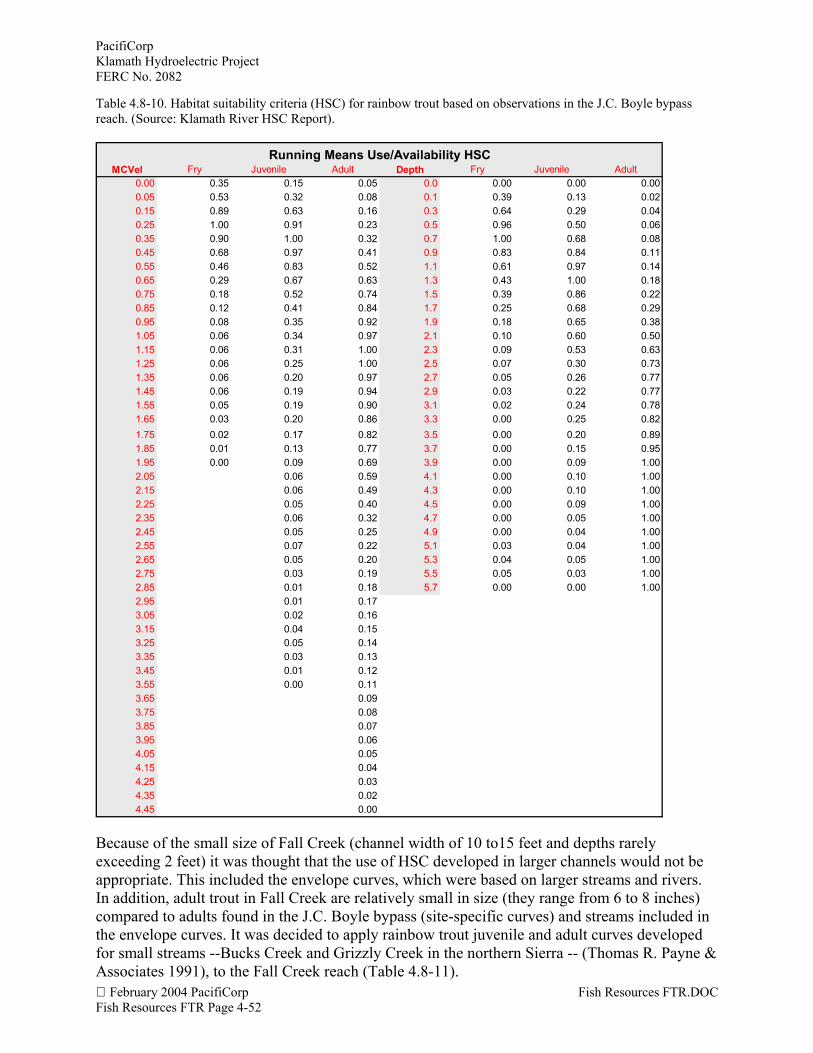
PacifiCorpKlamath Hydroelectric ProjectFERC No. 2082
February 2004 PacifiCorp Fish Resources FTR.DOCFish Resources FTR Page 4-52
Table 4.8-10. Habitat suitability criteria (HSC) for rainbow trout based on observations in the J.C. Boyle bypassreach. (Source: Klamath River HSC Report).
Running Means Use/Availability HSCMCVel Fry Juvenile Adult Depth Fry Juvenile Adult
0.00 0.35 0.15 0.05 0.0 0.00 0.00 0.000.05 0.53 0.32 0.08 0.1 0.39 0.13 0.020.15 0.89 0.63 0.16 0.3 0.64 0.29 0.040.25 1.00 0.91 0.23 0.5 0.96 0.50 0.060.35 0.90 1.00 0.32 0.7 1.00 0.68 0.080.45 0.68 0.97 0.41 0.9 0.83 0.84 0.110.55 0.46 0.83 0.52 1.1 0.61 0.97 0.140.65 0.29 0.67 0.63 1.3 0.43 1.00 0.180.75 0.18 0.52 0.74 1.5 0.39 0.86 0.220.85 0.12 0.41 0.84 1.7 0.25 0.68 0.290.95 0.08 0.35 0.92 1.9 0.18 0.65 0.381.05 0.06 0.34 0.97 2.1 0.10 0.60 0.501.15 0.06 0.31 1.00 2.3 0.09 0.53 0.631.25 0.06 0.25 1.00 2.5 0.07 0.30 0.731.35 0.06 0.20 0.97 2.7 0.05 0.26 0.771.45 0.06 0.19 0.94 2.9 0.03 0.22 0.771.55 0.05 0.19 0.90 3.1 0.02 0.24 0.781.65 0.03 0.20 0.86 3.3 0.00 0.25 0.821.75 0.02 0.17 0.82 3.5 0.00 0.20 0.891.85 0.01 0.13 0.77 3.7 0.00 0.15 0.951.95 0.00 0.09 0.69 3.9 0.00 0.09 1.002.05 0.06 0.59 4.1 0.00 0.10 1.002.15 0.06 0.49 4.3 0.00 0.10 1.002.25 0.05 0.40 4.5 0.00 0.09 1.002.35 0.06 0.32 4.7 0.00 0.05 1.002.45 0.05 0.25 4.9 0.00 0.04 1.002.55 0.07 0.22 5.1 0.03 0.04 1.002.65 0.05 0.20 5.3 0.04 0.05 1.002.75 0.03 0.19 5.5 0.05 0.03 1.002.85 0.01 0.18 5.7 0.00 0.00 1.002.95 0.01 0.173.05 0.02 0.163.15 0.04 0.153.25 0.05 0.143.35 0.03 0.133.45 0.01 0.123.55 0.00 0.113.65 0.093.75 0.083.85 0.073.95 0.064.05 0.054.15 0.044.25 0.034.35 0.024.45 0.00
Because of the small size of Fall Creek (channel width of 10 to15 feet and depths rarelyexceeding 2 feet) it was thought that the use of HSC developed in larger channels would not beappropriate. This included the envelope curves, which were based on larger streams and rivers.In addition, adult trout in Fall Creek are relatively small in size (they range from 6 to 8 inches)compared to adults found in the J.C. Boyle bypass (site-specific curves) and streams included inthe envelope curves. It was decided to apply rainbow trout juvenile and adult curves developedfor small streams --Bucks Creek and Grizzly Creek in the northern Sierra -- (Thomas R. Payne &Associates 1991), to the Fall Creek reach (Table 4.8-11).
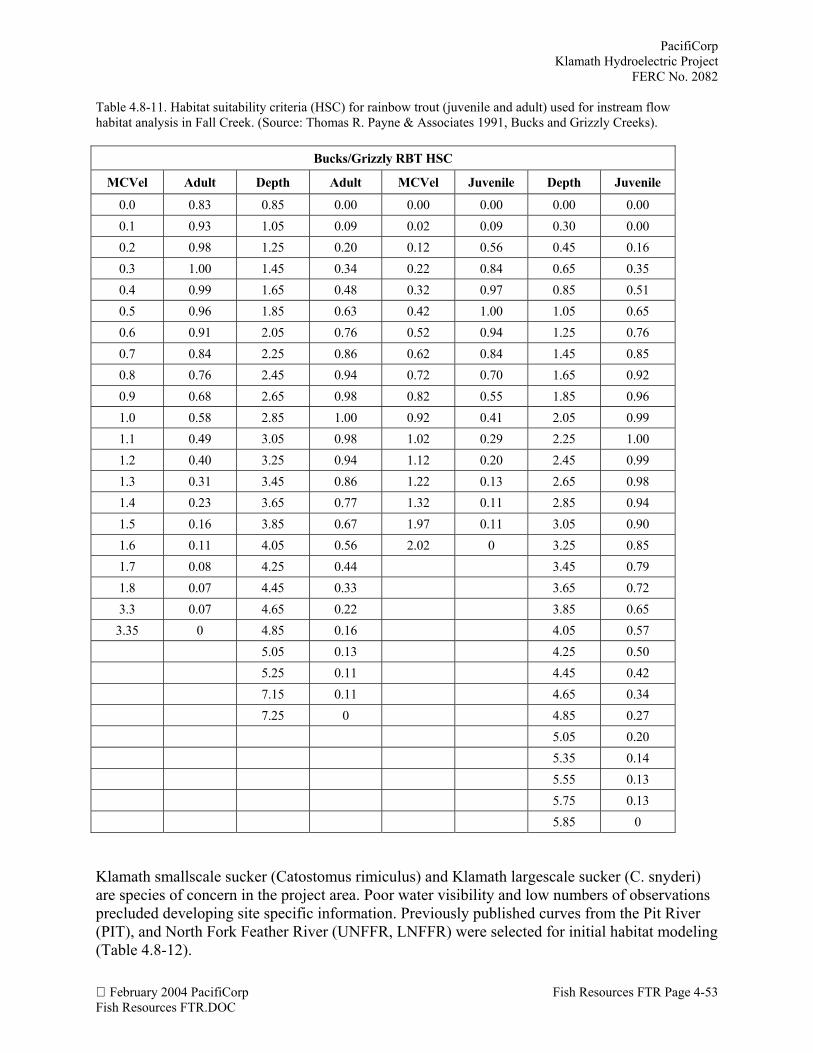
PacifiCorpKlamath Hydroelectric Project
FERC No. 2082
February 2004 PacifiCorp Fish Resources FTR Page 4-53Fish Resources FTR.DOC
Table 4.8-11. Habitat suitability criteria (HSC) for rainbow trout (juvenile and adult) used for instream flowhabitat analysis in Fall Creek. (Source: Thomas R. Payne & Associates 1991, Bucks and Grizzly Creeks).
Bucks/Grizzly RBT HSC
MCVel Adult Depth Adult MCVel Juvenile Depth Juvenile
0.0 0.83 0.85 0.00 0.00 0.00 0.00 0.000.1 0.93 1.05 0.09 0.02 0.09 0.30 0.000.2 0.98 1.25 0.20 0.12 0.56 0.45 0.160.3 1.00 1.45 0.34 0.22 0.84 0.65 0.350.4 0.99 1.65 0.48 0.32 0.97 0.85 0.510.5 0.96 1.85 0.63 0.42 1.00 1.05 0.650.6 0.91 2.05 0.76 0.52 0.94 1.25 0.760.7 0.84 2.25 0.86 0.62 0.84 1.45 0.850.8 0.76 2.45 0.94 0.72 0.70 1.65 0.920.9 0.68 2.65 0.98 0.82 0.55 1.85 0.961.0 0.58 2.85 1.00 0.92 0.41 2.05 0.991.1 0.49 3.05 0.98 1.02 0.29 2.25 1.001.2 0.40 3.25 0.94 1.12 0.20 2.45 0.991.3 0.31 3.45 0.86 1.22 0.13 2.65 0.981.4 0.23 3.65 0.77 1.32 0.11 2.85 0.941.5 0.16 3.85 0.67 1.97 0.11 3.05 0.901.6 0.11 4.05 0.56 2.02 0 3.25 0.851.7 0.08 4.25 0.44 3.45 0.791.8 0.07 4.45 0.33 3.65 0.723.3 0.07 4.65 0.22 3.85 0.653.35 0 4.85 0.16 4.05 0.57
5.05 0.13 4.25 0.505.25 0.11 4.45 0.427.15 0.11 4.65 0.347.25 0 4.85 0.27
5.05 0.205.35 0.145.55 0.135.75 0.135.85 0
Klamath smallscale sucker (Catostomus rimiculus) and Klamath largescale sucker (C. snyderi)are species of concern in the project area. Poor water visibility and low numbers of observationsprecluded developing site specific information. Previously published curves from the Pit River(PIT), and North Fork Feather River (UNFFR, LNFFR) were selected for initial habitat modeling(Table 4.8-12).
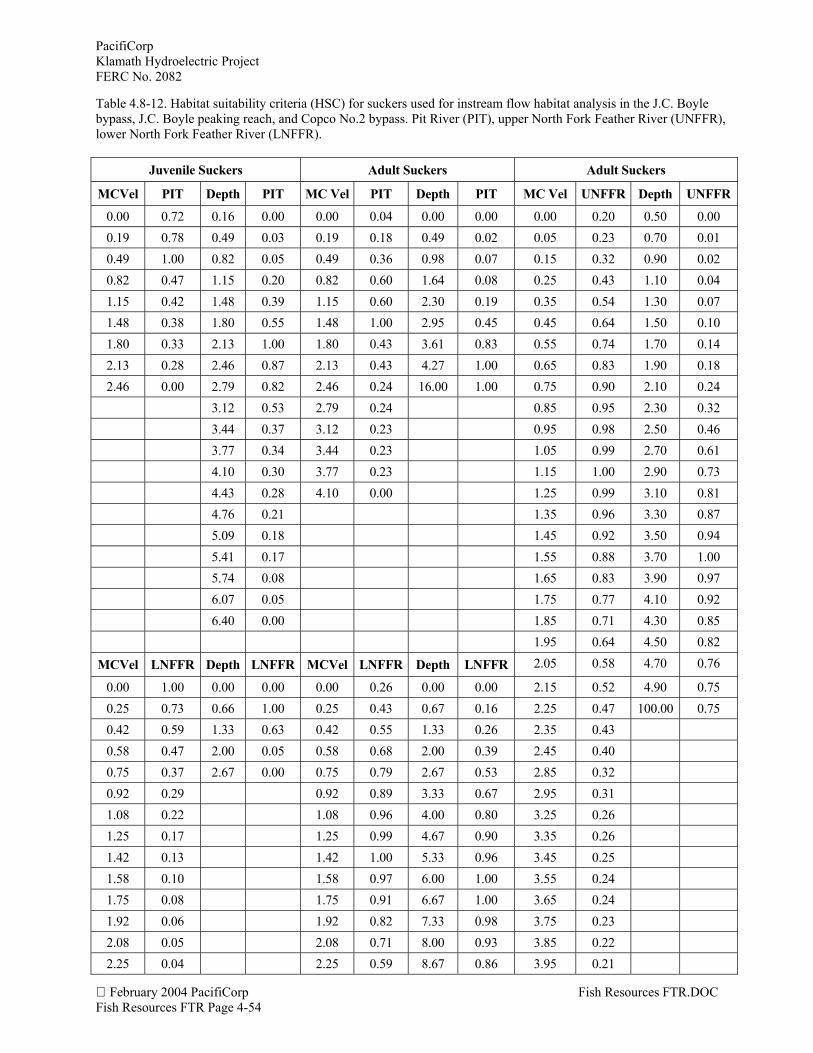
PacifiCorpKlamath Hydroelectric ProjectFERC No. 2082
February 2004 PacifiCorp Fish Resources FTR.DOCFish Resources FTR Page 4-54
Table 4.8-12. Habitat suitability criteria (HSC) for suckers used for instream flow habitat analysis in the J.C. Boylebypass, J.C. Boyle peaking reach, and Copco No.2 bypass. Pit River (PIT), upper North Fork Feather River (UNFFR),lower North Fork Feather River (LNFFR).
Juvenile Suckers Adult Suckers Adult Suckers
MCVel PIT Depth PIT MC Vel PIT Depth PIT MC Vel UNFFR Depth UNFFR
0.00 0.72 0.16 0.00 0.00 0.04 0.00 0.00 0.00 0.20 0.50 0.000.19 0.78 0.49 0.03 0.19 0.18 0.49 0.02 0.05 0.23 0.70 0.010.49 1.00 0.82 0.05 0.49 0.36 0.98 0.07 0.15 0.32 0.90 0.020.82 0.47 1.15 0.20 0.82 0.60 1.64 0.08 0.25 0.43 1.10 0.041.15 0.42 1.48 0.39 1.15 0.60 2.30 0.19 0.35 0.54 1.30 0.071.48 0.38 1.80 0.55 1.48 1.00 2.95 0.45 0.45 0.64 1.50 0.101.80 0.33 2.13 1.00 1.80 0.43 3.61 0.83 0.55 0.74 1.70 0.142.13 0.28 2.46 0.87 2.13 0.43 4.27 1.00 0.65 0.83 1.90 0.182.46 0.00 2.79 0.82 2.46 0.24 16.00 1.00 0.75 0.90 2.10 0.24
3.12 0.53 2.79 0.24 0.85 0.95 2.30 0.323.44 0.37 3.12 0.23 0.95 0.98 2.50 0.463.77 0.34 3.44 0.23 1.05 0.99 2.70 0.614.10 0.30 3.77 0.23 1.15 1.00 2.90 0.734.43 0.28 4.10 0.00 1.25 0.99 3.10 0.814.76 0.21 1.35 0.96 3.30 0.875.09 0.18 1.45 0.92 3.50 0.945.41 0.17 1.55 0.88 3.70 1.005.74 0.08 1.65 0.83 3.90 0.976.07 0.05 1.75 0.77 4.10 0.926.40 0.00 1.85 0.71 4.30 0.85
1.95 0.64 4.50 0.82
MCVel LNFFR Depth LNFFR MCVel LNFFR Depth LNFFR 2.05 0.58 4.70 0.76
0.00 1.00 0.00 0.00 0.00 0.26 0.00 0.00 2.15 0.52 4.90 0.750.25 0.73 0.66 1.00 0.25 0.43 0.67 0.16 2.25 0.47 100.00 0.750.42 0.59 1.33 0.63 0.42 0.55 1.33 0.26 2.35 0.430.58 0.47 2.00 0.05 0.58 0.68 2.00 0.39 2.45 0.400.75 0.37 2.67 0.00 0.75 0.79 2.67 0.53 2.85 0.320.92 0.29 0.92 0.89 3.33 0.67 2.95 0.311.08 0.22 1.08 0.96 4.00 0.80 3.25 0.261.25 0.17 1.25 0.99 4.67 0.90 3.35 0.261.42 0.13 1.42 1.00 5.33 0.96 3.45 0.251.58 0.10 1.58 0.97 6.00 1.00 3.55 0.241.75 0.08 1.75 0.91 6.67 1.00 3.65 0.241.92 0.06 1.92 0.82 7.33 0.98 3.75 0.232.08 0.05 2.08 0.71 8.00 0.93 3.85 0.222.25 0.04 2.25 0.59 8.67 0.86 3.95 0.21
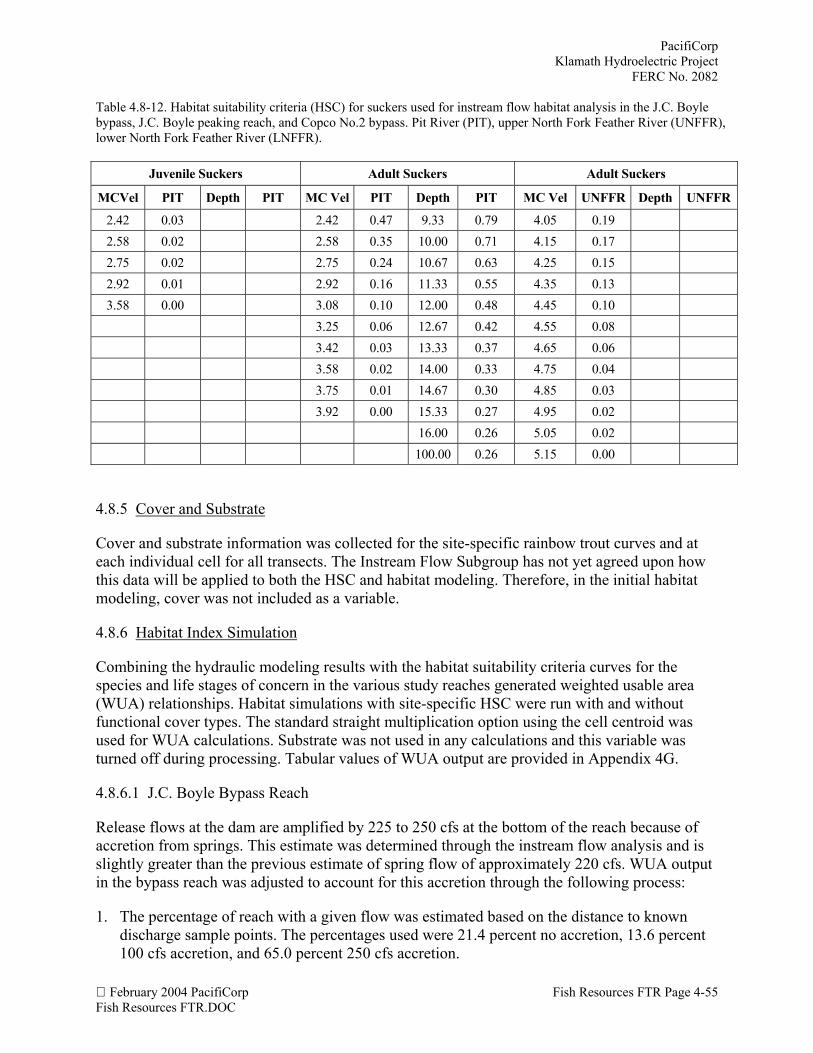
PacifiCorpKlamath Hydroelectric Project
FERC No. 2082
February 2004 PacifiCorp Fish Resources FTR Page 4-55Fish Resources FTR.DOC
Table 4.8-12. Habitat suitability criteria (HSC) for suckers used for instream flow habitat analysis in the J.C. Boylebypass, J.C. Boyle peaking reach, and Copco No.2 bypass. Pit River (PIT), upper North Fork Feather River (UNFFR),lower North Fork Feather River (LNFFR).
Juvenile Suckers Adult Suckers Adult Suckers
MCVel PIT Depth PIT MC Vel PIT Depth PIT MC Vel UNFFR Depth UNFFR
2.42 0.03 2.42 0.47 9.33 0.79 4.05 0.192.58 0.02 2.58 0.35 10.00 0.71 4.15 0.172.75 0.02 2.75 0.24 10.67 0.63 4.25 0.152.92 0.01 2.92 0.16 11.33 0.55 4.35 0.133.58 0.00 3.08 0.10 12.00 0.48 4.45 0.10
3.25 0.06 12.67 0.42 4.55 0.083.42 0.03 13.33 0.37 4.65 0.063.58 0.02 14.00 0.33 4.75 0.043.75 0.01 14.67 0.30 4.85 0.033.92 0.00 15.33 0.27 4.95 0.02
16.00 0.26 5.05 0.02100.00 0.26 5.15 0.00
4.8.5 Cover and Substrate
Cover and substrate information was collected for the site-specific rainbow trout curves and ateach individual cell for all transects. The Instream Flow Subgroup has not yet agreed upon howthis data will be applied to both the HSC and habitat modeling. Therefore, in the initial habitatmodeling, cover was not included as a variable.
4.8.6 Habitat Index Simulation
Combining the hydraulic modeling results with the habitat suitability criteria curves for thespecies and life stages of concern in the various study reaches generated weighted usable area(WUA) relationships. Habitat simulations with site-specific HSC were run with and withoutfunctional cover types. The standard straight multiplication option using the cell centroid wasused for WUA calculations. Substrate was not used in any calculations and this variable wasturned off during processing. Tabular values of WUA output are provided in Appendix 4G.
4.8.6.1 J.C. Boyle Bypass Reach
Release flows at the dam are amplified by 225 to 250 cfs at the bottom of the reach because ofaccretion from springs. This estimate was determined through the instream flow analysis and isslightly greater than the previous estimate of spring flow of approximately 220 cfs. WUA outputin the bypass reach was adjusted to account for this accretion through the following process:
1. The percentage of reach with a given flow was estimated based on the distance to knowndischarge sample points. The percentages used were 21.4 percent no accretion, 13.6 percent100 cfs accretion, and 65.0 percent 250 cfs accretion.
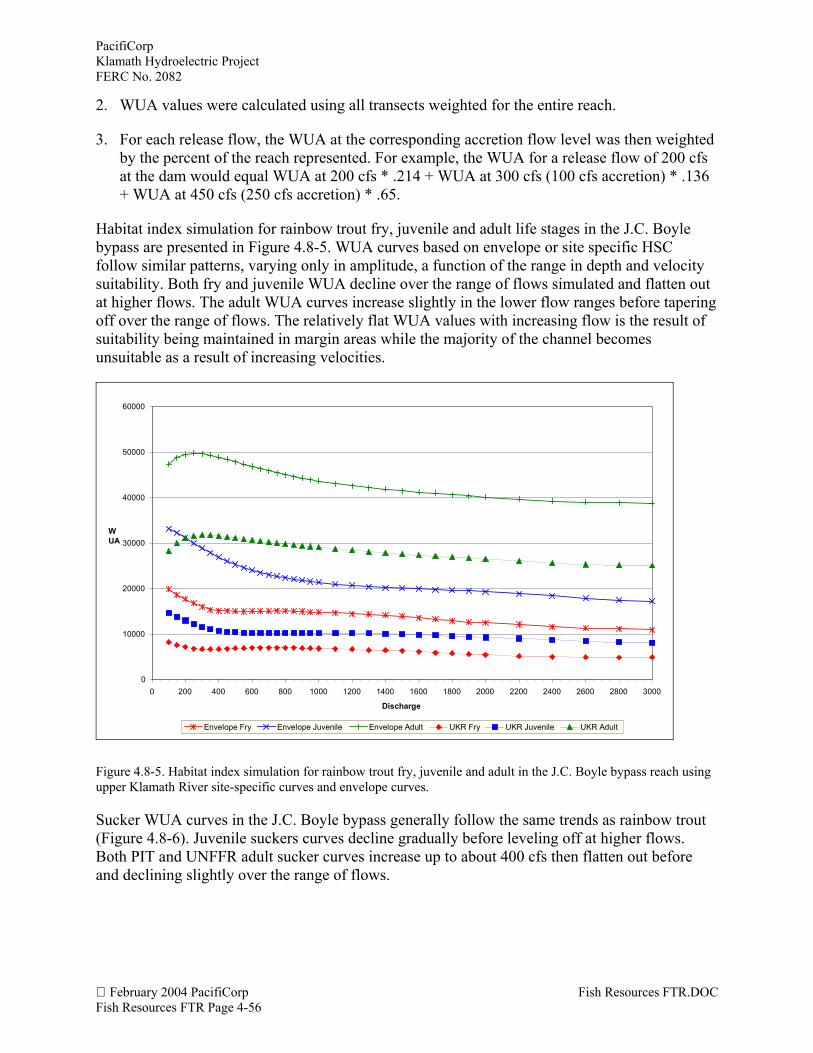
PacifiCorpKlamath Hydroelectric ProjectFERC No. 2082
February 2004 PacifiCorp Fish Resources FTR.DOCFish Resources FTR Page 4-56
2. WUA values were calculated using all transects weighted for the entire reach.
3. For each release flow, the WUA at the corresponding accretion flow level was then weightedby the percent of the reach represented. For example, the WUA for a release flow of 200 cfsat the dam would equal WUA at 200 cfs * .214 + WUA at 300 cfs (100 cfs accretion) * .136+ WUA at 450 cfs (250 cfs accretion) * .65.
Habitat index simulation for rainbow trout fry, juvenile and adult life stages in the J.C. Boylebypass are presented in Figure 4.8-5. WUA curves based on envelope or site specific HSCfollow similar patterns, varying only in amplitude, a function of the range in depth and velocitysuitability. Both fry and juvenile WUA decline over the range of flows simulated and flatten outat higher flows. The adult WUA curves increase slightly in the lower flow ranges before taperingoff over the range of flows. The relatively flat WUA values with increasing flow is the result ofsuitability being maintained in margin areas while the majority of the channel becomesunsuitable as a result of increasing velocities.
0
10000
20000
30000
40000
50000
60000
0 200 400 600 800 1000 1200 1400 1600 1800 2000 2200 2400 2600 2800 3000
Discharge
WUA
Envelope Fry Envelope Juvenile Envelope Adult UKR Fry UKR Juvenile UKR Adult
Figure 4.8-5. Habitat index simulation for rainbow trout fry, juvenile and adult in the J.C. Boyle bypass reach usingupper Klamath River site-specific curves and envelope curves.
Sucker WUA curves in the J.C. Boyle bypass generally follow the same trends as rainbow trout(Figure 4.8-6). Juvenile suckers curves decline gradually before leveling off at higher flows.Both PIT and UNFFR adult sucker curves increase up to about 400 cfs then flatten out beforeand declining slightly over the range of flows.
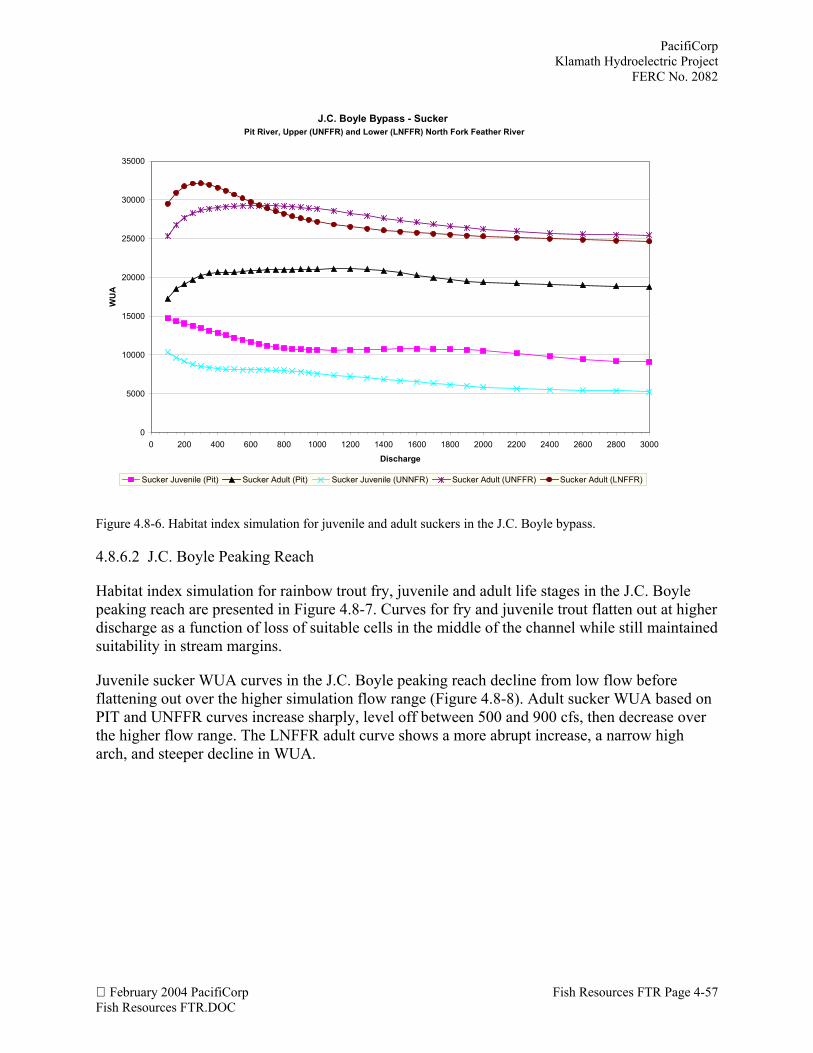
PacifiCorpKlamath Hydroelectric Project
FERC No. 2082
February 2004 PacifiCorp Fish Resources FTR Page 4-57Fish Resources FTR.DOC
J.C. Boyle Bypass - Sucker Pit River, Upper (UNFFR) and Lower (LNFFR) North Fork Feather River
0
5000
10000
15000
20000
25000
30000
35000
0 200 400 600 800 1000 1200 1400 1600 1800 2000 2200 2400 2600 2800 3000
Discharge
WU
A
Sucker Juvenile (Pit) Sucker Adult (Pit) Sucker Juvenile (UNNFR) Sucker Adult (UNFFR) Sucker Adult (LNFFR)
Figure 4.8-6. Habitat index simulation for juvenile and adult suckers in the J.C. Boyle bypass.
4.8.6.2 J.C. Boyle Peaking Reach
Habitat index simulation for rainbow trout fry, juvenile and adult life stages in the J.C. Boylepeaking reach are presented in Figure 4.8-7. Curves for fry and juvenile trout flatten out at higherdischarge as a function of loss of suitable cells in the middle of the channel while still maintainedsuitability in stream margins.
Juvenile sucker WUA curves in the J.C. Boyle peaking reach decline from low flow beforeflattening out over the higher simulation flow range (Figure 4.8-8). Adult sucker WUA based onPIT and UNFFR curves increase sharply, level off between 500 and 900 cfs, then decrease overthe higher flow range. The LNFFR adult curve shows a more abrupt increase, a narrow higharch, and steeper decline in WUA.
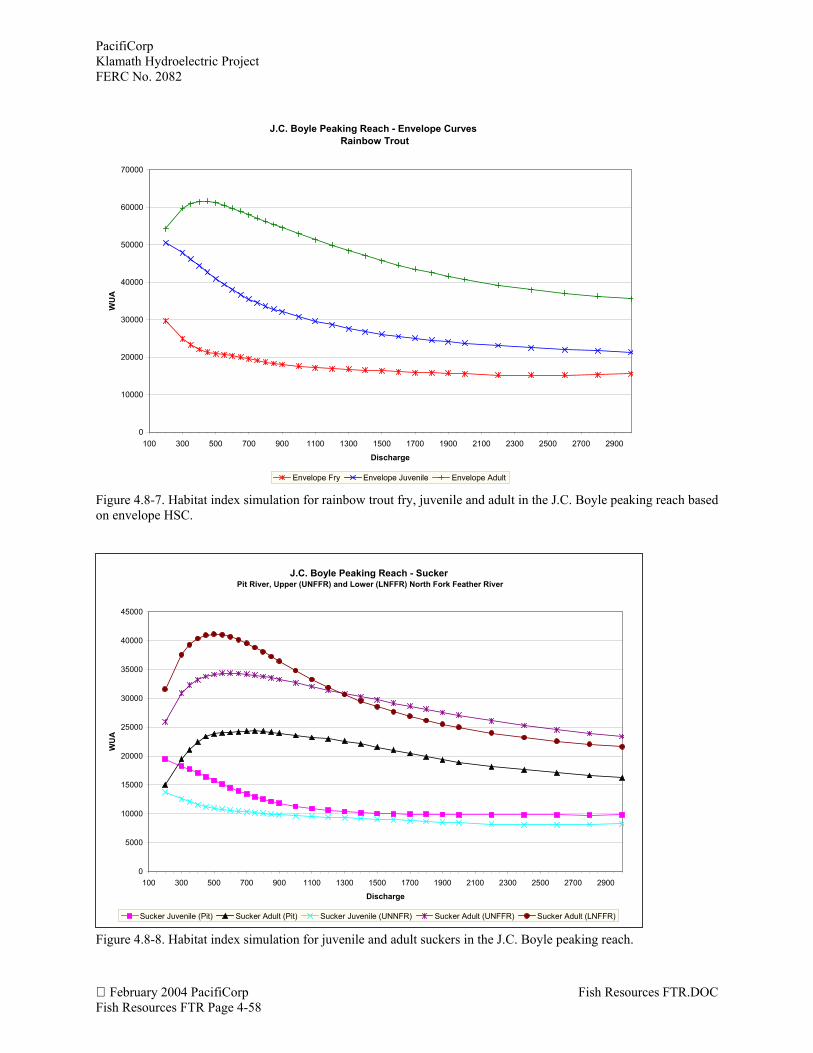
PacifiCorpKlamath Hydroelectric ProjectFERC No. 2082
February 2004 PacifiCorp Fish Resources FTR.DOCFish Resources FTR Page 4-58
J.C. Boyle Peaking Reach - Envelope Curves Rainbow Trout
0
10000
20000
30000
40000
50000
60000
70000
100 300 500 700 900 1100 1300 1500 1700 1900 2100 2300 2500 2700 2900
Discharge
WU
A
Envelope Fry Envelope Juvenile Envelope Adult
Figure 4.8-7. Habitat index simulation for rainbow trout fry, juvenile and adult in the J.C. Boyle peaking reach basedon envelope HSC.
Figure 4.8-8. Habitat index simulation for juvenile and adult suckers in the J.C. Boyle peaking reach.
J.C. Boyle Peaking Reach - Sucker Pit River, Upper (UNFFR) and Lower (LNFFR) North Fork Feather River
0
5000
10000
15000
20000
25000
30000
35000
40000
45000
100 300 500 700 900 1100 1300 1500 1700 1900 2100 2300 2500 2700 2900
Discharge
WU
A
Sucker Juvenile (Pit) Sucker Adult (Pit) Sucker Juvenile (UNNFR) Sucker Adult (UNFFR) Sucker Adult (LNFFR)
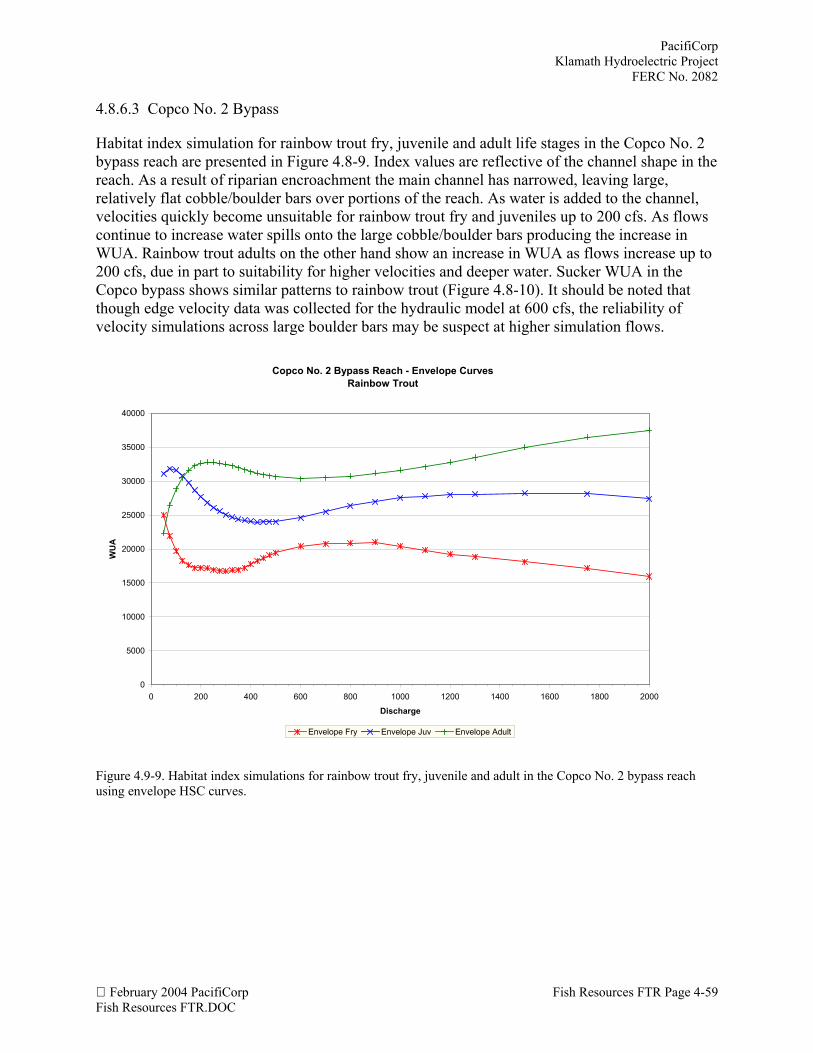
PacifiCorpKlamath Hydroelectric Project
FERC No. 2082
February 2004 PacifiCorp Fish Resources FTR Page 4-59Fish Resources FTR.DOC
4.8.6.3 Copco No. 2 Bypass
Habitat index simulation for rainbow trout fry, juvenile and adult life stages in the Copco No. 2bypass reach are presented in Figure 4.8-9. Index values are reflective of the channel shape in thereach. As a result of riparian encroachment the main channel has narrowed, leaving large,relatively flat cobble/boulder bars over portions of the reach. As water is added to the channel,velocities quickly become unsuitable for rainbow trout fry and juveniles up to 200 cfs. As flowscontinue to increase water spills onto the large cobble/boulder bars producing the increase inWUA. Rainbow trout adults on the other hand show an increase in WUA as flows increase up to200 cfs, due in part to suitability for higher velocities and deeper water. Sucker WUA in theCopco bypass shows similar patterns to rainbow trout (Figure 4.8-10). It should be noted thatthough edge velocity data was collected for the hydraulic model at 600 cfs, the reliability ofvelocity simulations across large boulder bars may be suspect at higher simulation flows.
Copco No. 2 Bypass Reach - Envelope CurvesRainbow Trout
0
5000
10000
15000
20000
25000
30000
35000
40000
0 200 400 600 800 1000 1200 1400 1600 1800 2000
Discharge
WU
A
Envelope Fry Envelope Juv Envelope Adult
Figure 4.9-9. Habitat index simulations for rainbow trout fry, juvenile and adult in the Copco No. 2 bypass reachusing envelope HSC curves.
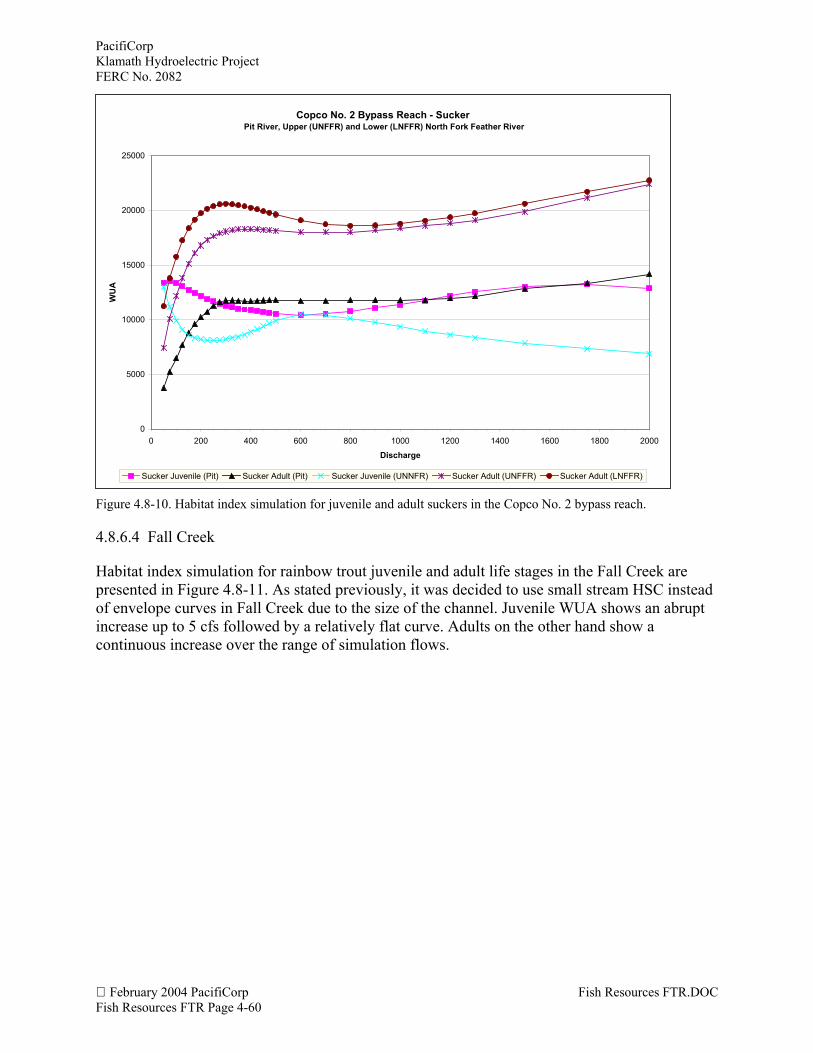
PacifiCorpKlamath Hydroelectric ProjectFERC No. 2082
February 2004 PacifiCorp Fish Resources FTR.DOCFish Resources FTR Page 4-60
Figure 4.8-10. Habitat index simulation for juvenile and adult suckers in the Copco No. 2 bypass reach.
4.8.6.4 Fall Creek
Habitat index simulation for rainbow trout juvenile and adult life stages in the Fall Creek arepresented in Figure 4.8-11. As stated previously, it was decided to use small stream HSC insteadof envelope curves in Fall Creek due to the size of the channel. Juvenile WUA shows an abruptincrease up to 5 cfs followed by a relatively flat curve. Adults on the other hand show acontinuous increase over the range of simulation flows.
Copco No. 2 Bypass Reach - Sucker Pit River, Upper (UNFFR) and Lower (LNFFR) North Fork Feather River
0
5000
10000
15000
20000
25000
0 200 400 600 800 1000 1200 1400 1600 1800 2000
Discharge
WU
A
Sucker Juvenile (Pit) Sucker Adult (Pit) Sucker Juvenile (UNNFR) Sucker Adult (UNFFR) Sucker Adult (LNFFR)
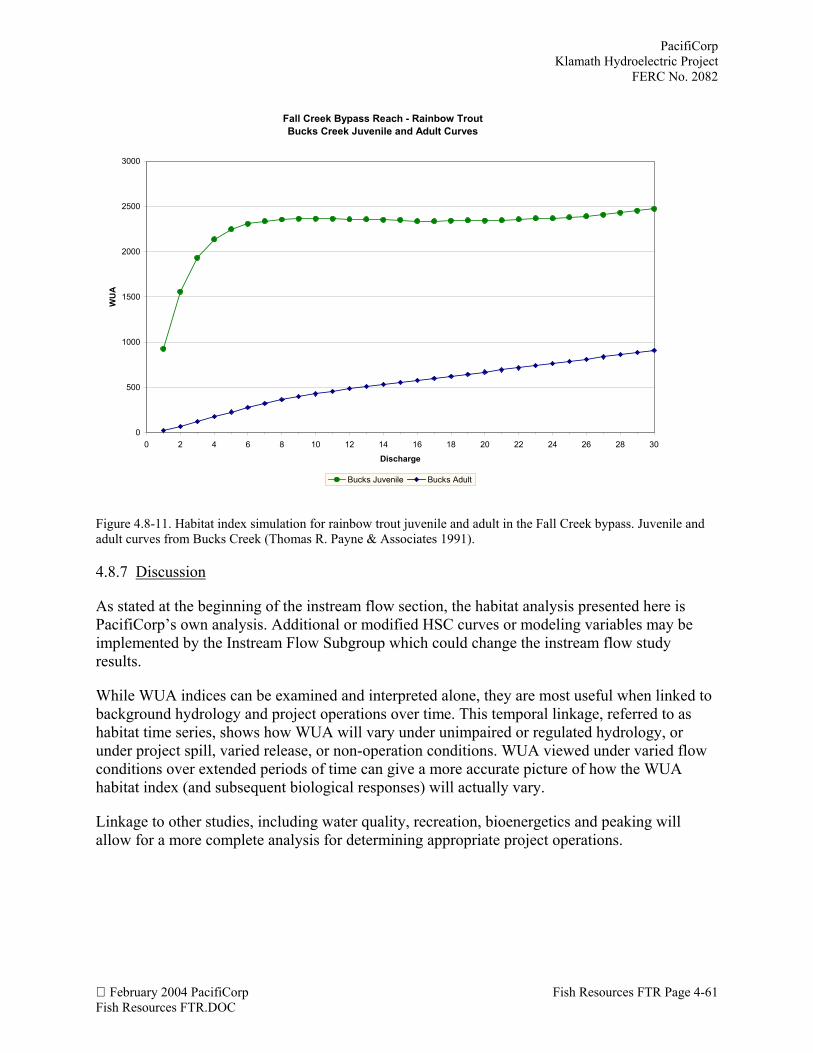
PacifiCorpKlamath Hydroelectric Project
FERC No. 2082
February 2004 PacifiCorp Fish Resources FTR Page 4-61Fish Resources FTR.DOC
Fall Creek Bypass Reach - Rainbow TroutBucks Creek Juvenile and Adult Curves
0
500
1000
1500
2000
2500
3000
0 2 4 6 8 10 12 14 16 18 20 22 24 26 28 30
Discharge
WU
A
Bucks Juvenile Bucks Adult
Figure 4.8-11. Habitat index simulation for rainbow trout juvenile and adult in the Fall Creek bypass. Juvenile andadult curves from Bucks Creek (Thomas R. Payne & Associates 1991).
4.8.7 Discussion
As stated at the beginning of the instream flow section, the habitat analysis presented here isPacifiCorp’s own analysis. Additional or modified HSC curves or modeling variables may beimplemented by the Instream Flow Subgroup which could change the instream flow studyresults.
While WUA indices can be examined and interpreted alone, they are most useful when linked tobackground hydrology and project operations over time. This temporal linkage, referred to ashabitat time series, shows how WUA will vary under unimpaired or regulated hydrology, orunder project spill, varied release, or non-operation conditions. WUA viewed under varied flowconditions over extended periods of time can give a more accurate picture of how the WUAhabitat index (and subsequent biological responses) will actually vary.
Linkage to other studies, including water quality, recreation, bioenergetics and peaking willallow for a more complete analysis for determining appropriate project operations.