4')+10#. .'#&'45 57//+6 - fapesp · zilmar josé de souza (unica), marcelo...
TRANSCRIPT

INTERNATIONAL SEMINAR ON BIOMASS, BIOGASAND ENERGY EFFICIENCY
São Paulo, Brazil, April 3-5 2013th
REGIONAL LEADERS SUMMIT

Content
- Program 01
- Introduction 05
Papers
- Evaluation of Bioethanol Co-production with Electricity Co-generation from Sugarcane Bagasse through Energy efficiency for Bioenergy Policy in South Africa 07
- Sugarcane bioelectricity in São Paulo: market potential and technological stage 13
- Vehicles for Urban Transportation – Past and Future 22
- Brazilian Bio –Fuels Production Scenario (Biogas, Biomethane and Biosyngas 38
- Energy Efficiency in Brazil and in the State of São Paulo – Electricity 54
- Thermodynamic, Thermoeconomic and Economic Analysis of Integration of Straw Gasification and/or Stillage Biodigestion in the Cogeneration System of a Sugar-Alcohol Factory 69
- The Application of the Energy Saving Technology of Refrigerating System in a Food Processing and Refrigerating Factory 85
- Vehicle Technology Development – Focus on Energy
Efficiency 94
- Vermicelli Production Enterprises Discussions of Comprehensive
Utilization for Wastewater Production Biogas 104
- The Energy Consumption Future in Vehicular Technology 108
- Substitute Natural Gas From Biomass – Decentralised Gasification And Methanation 115
- Energy Research In Bavaria: Why International Cooperation Matters 124
- The Biogas Industry Development In China 131
- Upper Austria – The Renewable Energy Region Vision – Strategy – Implementation 135
- Integration of HQP training in second and third generation biofuels’ R&D work 148
1
1. PROGRAM
3 april
09.00-09.30
OPENING SESSION
— Governor Geraldo Alckmin
— José Aníbal, Secretary of Energy
— Milton Flávio Lautenschläger, Undersecretary of Renewable Energies
— Rodrigo Tavares, Head of Office of Foreign Affairs
10.00-13h00
ROUNDTABLE ON BIOMASS
PAPER 1
BAVARIA — Energy Research in Bavaria: Why International Cooperation Matters
Florence Gauzy Krieger, Bayerische Forschungsallianz (BayFOR)
PAPER 2
SÃO PAULO – Sugarcane Bioelectricity in São Paulo: Market Potential and Technological
Stage
Zilmar José de Souza (UNICA), Marcelo Arantes Severi (TGM)
PAPER 3
QUÉBEC – Integration of HQP Training in Second and Third Generation Biofuels’ R&D
Work
Jean Michel Lavoie, Université de Sherbrooke
PAPER 4
WESTERN CAPE – Evaluation of Bioethanol Cogeneration vs Electricity-only Production
from Sugarcane Bagasse through Energy efficiency for Bioenergy Policy in South Africa
Abdul Petersen , University of Stellenbosch
DISCUSSANT and MODERATOR
– Gláucia Souza (USP/BIOEN)
2
13.00-14.30
LUNCH
(Bandeirantes Palace, Salão dos Conselhos)
14h30-16h30
ROUNDTABLE ON BIOGAS
PAPER 1
SÃO PAULO – Brazilian Bio-Fuels Production Scenario (Biogas, Biomethane and
Biosyngas)
Gerhard Ett a,d, Fernando Landgraf a, b, Silas Derenzo a, Abraham Sin Yu a, b, Lineu
Belico dos Reis b, Alexandre Mazzonetto c,d, Heloisa Burkhardt Antonoff a, Ligia
Antunes A. Alves de Souza a Institute for Technological Research – IPT, b University of
São Paulo, c Centro Paula Souza Piracicaba - FATEC, d Fundação Armando Álvares
Penteado – FAAP
PAPER 2
BAVARIA — Substitute Natural Gas From Biomass – Decentralised Gasification and
Methanation
Marius Dillig, Jürgen Karl , Universität Erlangen-Nürnberg
PAPER 3
SÃO PAULO – Thermodynamic, Thermoeconomic and Economic Analysis of
Integration of Straw Gasification and/or Stillage Biodigestion in the Cogeneration
System of a Sugar-Alcohol Factory
Ricardo Alan Verdú Ramos, Cassio Roberto Macedo Maia, Emanuel Rocha Woiski,
Newton Luiz Dias Filho, Rodnei Passolongo, NUPLEN - Núcleo de Planejamento
Energético, Geração e Cogeração de Energia, UNESP
PAPER 4
SHANDONG – The Biogas Industry Development in China
Li Aimin, Energy-saving Office of Shandong Provincial Economic & Information
Industry Commission
PAPER 5
SHANDONG – Vermicelli Production Enterprises Discussions of Comprehensive
Utilization For Wastewater Production Biogas
Zhang Yuhong, Yantai Municipal Energy-saving Office
DISCUSSANT and MODERATOR
– Luis Augusto Barbosa Cortez (FAPESP)
3
4 april
10h00-13h00
ROUNDTABLE 1 ON ENERGY EFFICIENCY AND CONSERVATION
PAPER 1
SÃO PAULO – Vehicle Technology Development – Focus on Energy Efficiency.
José Goldemberg and Oswaldo Lucon, University of São Paulo and Secretariat of
Environment
PAPER 2
SÃO PAULO – The Energy Consumption Future in Vehicular Technology
Márcio Schettino, Secretaria Municipal de Transportes de São Paulo
PAPER 3
SHANDONG – The Application of the Energy Saving Technology of Refrigerating System
in a Food Processing and Refrigerating Factory
Jiao Yuxue, Yantai Moon Group Co., Ltd
DISCUSSANT and MODERATOR
– Ubirajara Sampaio de Campos (SEE)
13.00-14.30
LUNCH
(Bandeirantes Palace, Salão dos Conselhos)
14h30-16h30
ROUNDTABLE 2 ON ENERGY EFFICIENCY AND CONSERVATION
PAPER 1
SÃO PAULO – Energy Efficiency in Brazil and in the State of São Paulo - Electricity
Sergio Valdir Bajay (UNICAMP/NIPE) and Sidnei Amano (WEG Motors)
PAPER 2
SÃO PAULO – Electrical Vehicles for Urban Transportation – Past and Future
Guilherme A. Melo, Moacyr A. G. de Brito, Prof. Carlos A. Canesin UNESP –
Universidade Estadual Paulista and LEP – Power Electronics Laboratory
4
PAPER 3
UPPER AUSTRIA – Upper Austria – The Renewable Energy Region: Vision – Strategy -
Implementation
Friedrich Roithmayr, Johannes Kepler University
DISCUSSANT and MODERATOR
– Sidnei Martini (POLI/USP)
5 april
10h00-18h00
Each participant was invited to take a sight visit of his/her choice:
1. ENERGY EFFICIENCY IN ELECTRICITY. Visit to the Metro/Underground of São
Paulo. Full day meetings and visits on the efficiency program adopted by the Metro
(www.metro.sp.gov.br/en/your-trip/index.aspx).
2. BIOGAS. Visit to Usina Ester, a large industrial complex that produces biogas from
sugarcane bagasse (130 km from São Paulo)
3. BIONANOMANUFACTURING. Visit to the Bionanomanufacturing facilities of the
Institute for Technological Research (IPT) of São Paulo. It includes visit to its industrial
biotechnology lab (www.ipt.br/bionanomanufatura).
5
2. INTRODUCTION
The Government of São Paulo organized, on April 3-5th 2013, an International
Seminar on Biomass, Biogas and Energy Efficiency. With the participation of
representatives of the 6 of the 7 members of the Regional Leaders Summit (Upper
Austria, Bavaria, Western Cape, Georgia, Québec, São Paulo and Shandong), the seminar
had the purpose to identify and disseminate the leading scholarly work on Biomass,
Biogas and Energy Efficiency originated in the 7 states/provinces. Participants were
attached to universities, research institutes or industrial clusters and were selected by
the partner states.
Context
On April 12th, 2012 in São Paulo, on the occasion of the Sixth Regional Leaders Summit,
Member States, adopted a Final Declaration which included the following commitment
(item 12):
In order to increase the proportion of renewable energy in the total energy
consumption, as well as contribute to the security of energy supply and to
promote renewable energy on a global scale, we invite our universities, research
institutes, and industrial clusters to join forces in the formation of a network,
centered on renewable energy and energy efficiency, so that innovations and new
products will be developed to achieve these goals. This initiative will be led by the
Government of the State of São Paulo until 2014. The intensification of the
cooperation in research is necessary to implement these technologies in
renewable energy sources and energy efficiency broadly and at a reduced cost.
The international seminar is, therefore, part of a more comprehensive mission to
establish a Global Network on renewable energy, energy efficiency and energy
conservation. The Network aims to identify the cutting-edge research, produced by the
7 Regional Leaders members, in the fields of biomass, biogas and energy efficiency. In
addition, it aspires to ensure the exchange of knowledge and the training of experts of
the 7 member-states.
The seminar
The event counted on the participation of approximately 80 scholars and practitioners
and included 15 paper presentations. It was opened by the Governor of São Paulo,
Geraldo Alckmin and the Secretary of Energy, José Aníbal. In the occasion, Governor
Alckmin signed a decree establishing the São Paulo biofuels program and presented the
new Solar Atlas of São Paulo. At the end, participants took part in various sight visits to
the Metro/Underground of São Paulo, Metropolitan Company of Urban Transport
(EMTU), the Environmental Company of São Paulo (CETESB), Eletra Bus (Metra) and

6
the Bionanomanufacturing facilities of the Institute for Technological Research (IPT) of
São Paulo.
The event was organized by the Secretariat of Energy and the Office of Foreign Affairs.
Guest participants
Governor Geraldo Alckmin, José Aníbal, Secretary of
Energy and Milton Flávio Lautenschläger,
Undersecretary of Renewable Energies
7
Evaluation of Bioethanol Co-production with Electricity Co-
generation from Sugarcane Bagasse through Energy efficiency
for Bioenergy Policy in South Africa
Abdul Petersen, JF Görgens, Dept Process Engineering, University of Stellenbosch,
Stellenbosch, South Africa
INTRODUCTION
The commercial production of second generation bioethanol in South Africa remains
undeveloped, partly due to allocation of available lignocellulose biomass residues to
electricity generation, and partly due to the economic constraints related to weak
legislative/policy support for implementation. Reasons that account for this economic
status is the costs of feedstock and the pioneer status of the technology associated with
second generation technology that result in high capital costs1. This economic status
of second generation biofuels and the perceived threat of first generation bio-ethanol
to food security2 have contributed to the non-realisation of the South African National
Biofuel target, which was that it should represent 2% of transportation fuels. A further
pitfall in the general South African energy sector is severe limitations in electricity
power supply, due to demand outgrowing long-term planning for production, despite
the large reserves of coal and uranium. Co-generation of electricity in existing biomass
processing industries is perceived to be an attractive opportunity to produce bio-
energy and increase local electricity availability.
The sugar industry produces bagasse, a fibrous material that is conventionally
converted to heat and electricity for the sugar mill. Most sugar mills in Southern Africa
use energy inefficient boilers for bagasse combustion, which were designed at a time
when bagasse disposal was deemed to be more important than energy recovery. Given
that the excess of bagasse generation would be about 52% if the mills employ efficiency
in processing and energy conversion, then the production of ethanol from a fraction of
bagasse would be possible, while still producing the industry's energy needs3. This
would occur if the hemicellulose fraction of the bagasse is extracted for ethanol. The
remaining cellu-lignin residues would thus serve as the fuel for power and electricity.
A Renewable Energy Policy geared towards such a cogenerating scenario would
however, only be possible if its energy efficiency is greater than a scenario where only
electricity is efficiently generated.
Process scenarios applicable would thus include the bioethanol generation from
hemicelluloses, with subsequent heat and power generation from the cellu-lignin
residue (either in Combustion with Steam Cycle Systems (CSCS) or Biomass Integrated
8
Gasification and Combined Cycle systems (BIGCC)); and the generation of heat and
power form the entire quantity of bagasse in either CSCS or BIGCC. Bioethanol from
hemicelluloses has shown experimental feasibility in literature4–6 and shown to be an
industrial practice, such as the case with its production from spent sulphite liquor from
pulping mills7. Additionally, there exist flow-sheets proposed in literature with pre-
hemicellulose extraction for biorefinery concepts8. On the other hand, heat and power
generation in CSCS has shown to improve with heat integration and high pressure
systems, which has been shown up to 85bar9 , while BIGCC systems have shown
electrical efficiencies >25%10. The limited implementation of BIGCC has been due to
the high capital costs since its technology was relatively new when initial comparative
between itself and CSCS was conducted11. Given the time frame from then, it is
expected that technological maturity would have caused that the costs associated with
BIGCC reduced.
The aim of this technical evaluation is thus to compare the energy efficiency of two
cogeneration scenarios against two electricity-only generation scenarios to assist in
formation of a Renewable Energy Policy for agricultural wastes in South Africa. The
process configurations of the two cogeneration scenarios were selected from a process
optimization exercise, which was conducted in the PhD study upon which this report is
based. The electricity-only process flows were also assessed as part of the PhD study.
The investigated co-generation scenarios would also apply to the lignocellulosic plant
biomass in the Western Cape that could be available for bioenergy purposes. Besides
the green waste fraction found in Municipal Solid Waste, the available lignocellulose
includes wheat and grain residues, estimated at 152 000 tons per annum (t/a); and
invasive alien plants that totals at 459 000 t/a. While sugarcane bagasse is not
produced in the Western Cape, it forms the basis of this study because the problem is
more immediate and of a national perspective in South Africa. Additionally, the
amount of bagasse produced amounts to 8million tons per annum, which implies that
its potential for economy of scale is much greater than that of the feed stocks present in
the Western Cape. Furthermore, the behavior of sugarcane bagasse in second
generation fuel and advanced electricity production technologies, is much better
understood and benched-marked in scientific literature. Thus, the establishment of the
efficient technology for sugarcane bagasse would naturally be first, which would then
facilitate maturation of capital equipment. The technology could then precipitate to the
biomass varieties of the Western Cape through further research and development.
METHODOLOGY
Process developments of the ethanol co-generating systems and the power only
systems would be developed as a process optimization exercise. For the power only
system, the design iterations involve a high pressure boiler system with efficient heat
recovery strategies and Condensing Extraction Steam Turbine (CEST), and an advanced
scenario of a Biomass Integrated Gasification and Combined Cycle system (BIGCC).
With regards to the cogenerating scenarios, the options under consideration for design
9
iterations include various lignocellulose fractionating steps such as dilute acid
hydrolysis and steam explosion, and ethanol purification systems that are either
vacuum or atmospheric. Additionally, the ethanol scenarios can also be implemented
with either the BIGCC or combustion systems. Thus, from the 10 scenarios developed
for assessments, the two best cogeneration scenarios and two electricity-only scenarios
were selected, based on energy efficiency for maximum product recovery from
available biomass.
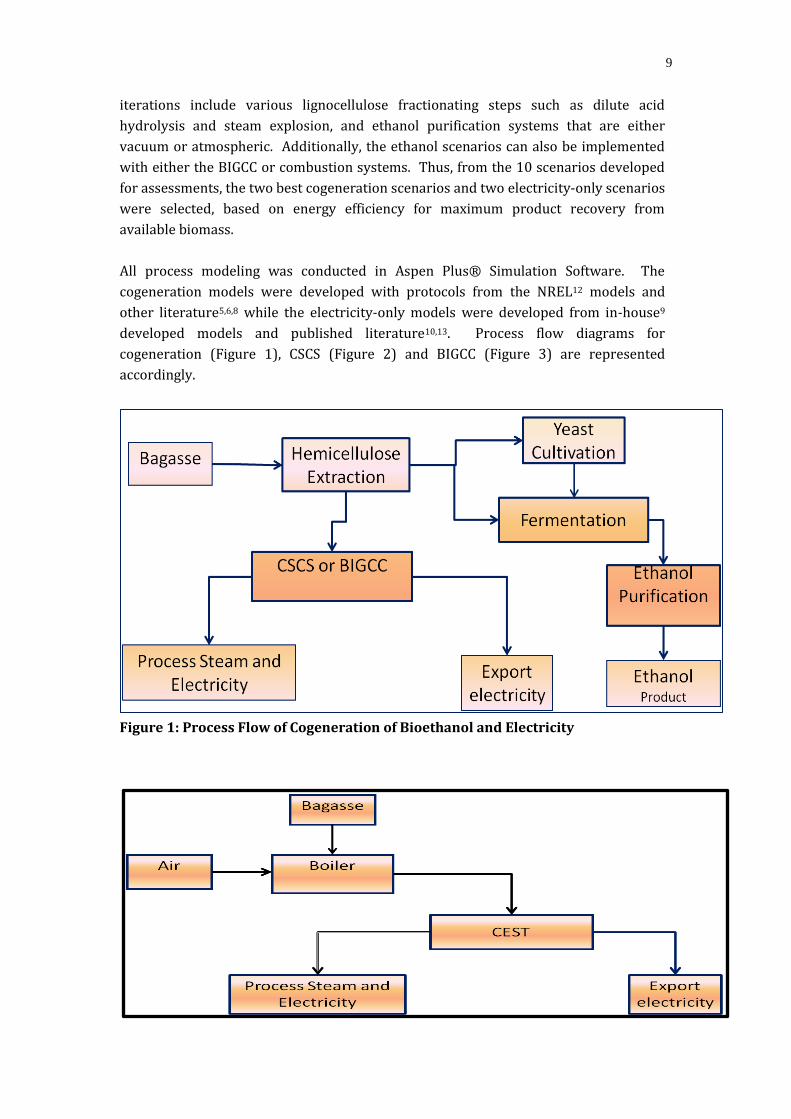
All process modeling was conducted in Aspen Plus® Simulation Software. The
cogeneration models were developed with protocols from the NREL12 models and
other literature5,6,8 while the electricity-only models were developed from in-house9
developed models and published literature10,13. Process flow diagrams for
cogeneration (Figure 1), CSCS (Figure 2) and BIGCC (Figure 3) are represented
accordingly.
Figure 1: Process Flow of Cogeneration of Bioethanol and Electricity
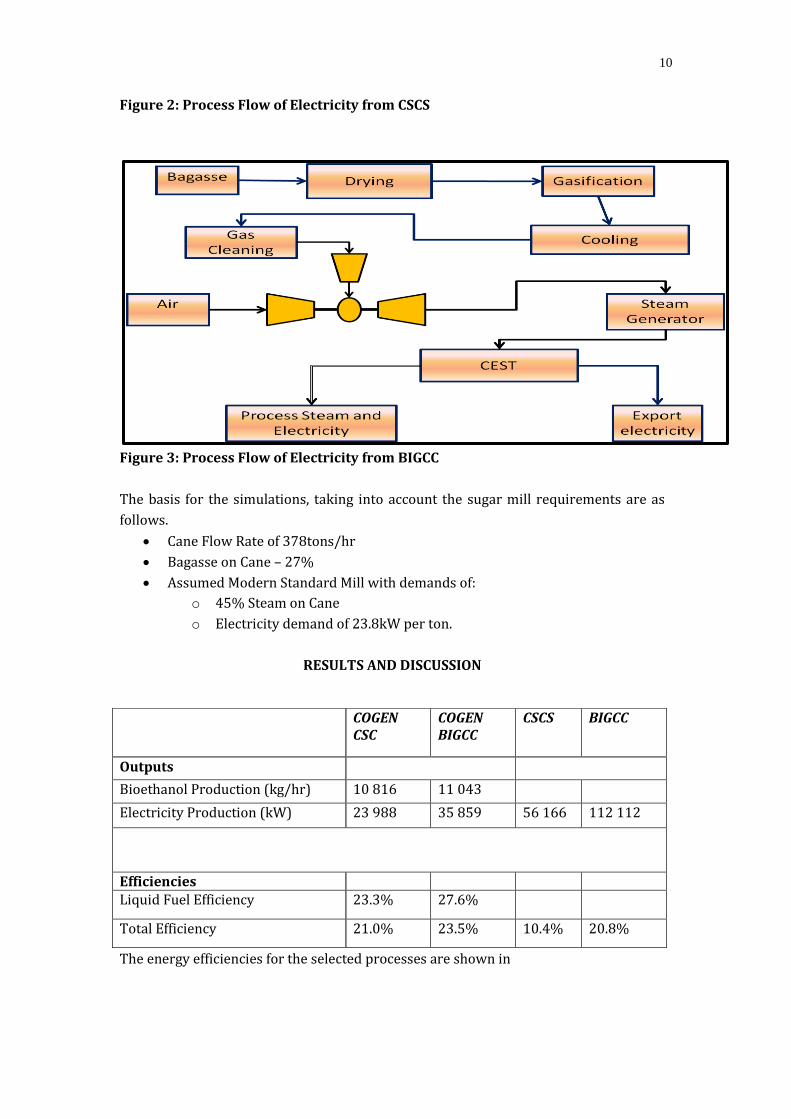
10
Figure 2: Process Flow of Electricity from CSCS
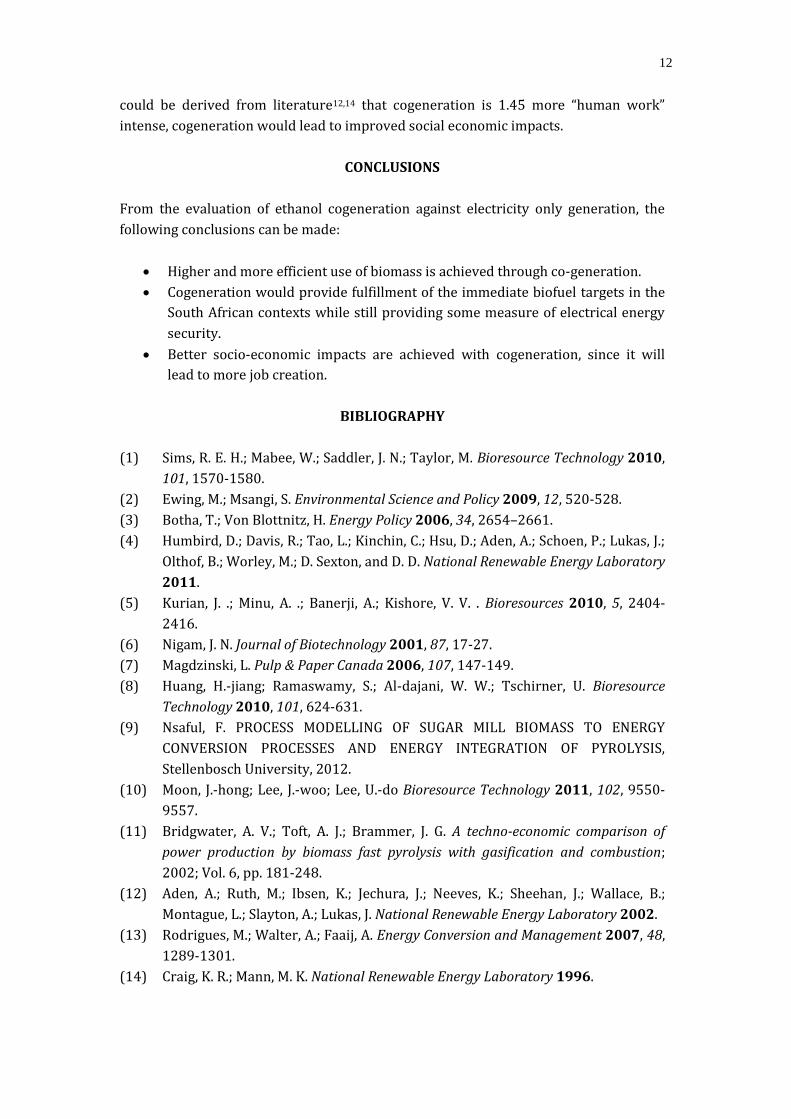
Figure 3: Process Flow of Electricity from BIGCC
The basis for the simulations, taking into account the sugar mill requirements are as
follows.
Cane Flow Rate of 378tons/hr
Bagasse on Cane – 27%
Assumed Modern Standard Mill with demands of:
o 45% Steam on Cane
o Electricity demand of 23.8kW per ton.
RESULTS AND DISCUSSION
The energy efficiencies for the selected processes are shown in
COGEN CSC
COGEN BIGCC
CSCS BIGCC
Outputs
Bioethanol Production (kg/hr) 10 816 11 043
Electricity Production (kW) 23 988 35 859 56 166 112 112
Efficiencies Liquid Fuel Efficiency 23.3% 27.6%
Total Efficiency 21.0% 23.5% 10.4% 20.8%

11
Table 1. It is seen that the energy efficiencies are seemingly low. For example, the
BIGCC had a reported efficiency of 20.8% while an energy efficiency of at least 25%
was expected. The reason for this apparent discrepancy is due to the amount of steam
and electricity that is extracted from the Condensing Extraction Steam Turbine for the
sugar mills.
Table 1: Process Simulation Outputs and Energy Efficiency
As was observed that the efficiency of BIGCC electricity-only scenario was higher than
the corresponding CSCS scenario, so was it more efficient to employ a BIGCC for the
conversion of the cellu-lignin residue in the cogeneration scenarios. It is generally
seen that the co-production of ethanol and electricity was more efficient than the
electricity-only scenarios. This efficiency was achieved by employing steam explosion
for the hemicellulose extraction and vacuum distillation for ethanol purification.
While the most efficient scenario is the COGEN-BIGCC, its usage will be limited to cases
where the sugar mill itself is standardized, which entails a steam demand of <47%
steam on cane. This is because the BIGCC component of the cogeneration system
would have maximized electricity production with a compromise on the steam
production. In setups where the mill is not as efficient, the COGEN CSCS is more
applicable.
If Renewable Energy Policy in South Africa hears towards co-production of biofuels and
electricity, as directed through the energy efficiency comparisons above, then there are
numerous benefits that can be realized if all 8 million tons of bagasse in South Africa is
processed in that manner. Firstly, the National Biofuel target will be reached and
exceeded, since the amount of fuel produced would amount to 865 million liters per
annum, accounting for 4.2% of gasoline and diesel. Secondly, there will be an electricity
output of 350MW, which is 0.8% of the South African output. Furthermore, since it
COGEN CSC
COGEN BIGCC
CSCS BIGCC
Outputs
Bioethanol Production (kg/hr) 10 816 11 043
Electricity Production (kW) 23 988 35 859 56 166 112 112
Efficiencies Liquid Fuel Efficiency 23.3% 27.6%
Total Efficiency 21.0% 23.5% 10.4% 20.8%
12
could be derived from literature12,14 that cogeneration is 1.45 more “human work”
intense, cogeneration would lead to improved social economic impacts.
CONCLUSIONS
From the evaluation of ethanol cogeneration against electricity only generation, the
following conclusions can be made:
Higher and more efficient use of biomass is achieved through co-generation.
Cogeneration would provide fulfillment of the immediate biofuel targets in the
South African contexts while still providing some measure of electrical energy
security.
Better socio-economic impacts are achieved with cogeneration, since it will
lead to more job creation.
BIBLIOGRAPHY
(1) Sims, R. E. H.; Mabee, W.; Saddler, J. N.; Taylor, M. Bioresource Technology 2010,
101, 1570-1580.
(2) Ewing, M.; Msangi, S. Environmental Science and Policy 2009, 12, 520-528.
(3) Botha, T.; Von Blottnitz, H. Energy Policy 2006, 34, 2654–2661.
(4) Humbird, D.; Davis, R.; Tao, L.; Kinchin, C.; Hsu, D.; Aden, A.; Schoen, P.; Lukas, J.;
Olthof, B.; Worley, M.; D. Sexton, and D. D. National Renewable Energy Laboratory
2011.
(5) Kurian, J. .; Minu, A. .; Banerji, A.; Kishore, V. V. . Bioresources 2010, 5, 2404-
2416.
(6) Nigam, J. N. Journal of Biotechnology 2001, 87, 17-27.
(7) Magdzinski, L. Pulp & Paper Canada 2006, 107, 147-149.
(8) Huang, H.-jiang; Ramaswamy, S.; Al-dajani, W. W.; Tschirner, U. Bioresource
Technology 2010, 101, 624-631.
(9) Nsaful, F. PROCESS MODELLING OF SUGAR MILL BIOMASS TO ENERGY
CONVERSION PROCESSES AND ENERGY INTEGRATION OF PYROLYSIS,
Stellenbosch University, 2012.
(10) Moon, J.-hong; Lee, J.-woo; Lee, U.-do Bioresource Technology 2011, 102, 9550-
9557.
(11) Bridgwater, A. V.; Toft, A. J.; Brammer, J. G. A techno-economic comparison of
power production by biomass fast pyrolysis with gasification and combustion;
2002; Vol. 6, pp. 181-248.
(12) Aden, A.; Ruth, M.; Ibsen, K.; Jechura, J.; Neeves, K.; Sheehan, J.; Wallace, B.;
Montague, L.; Slayton, A.; Lukas, J. National Renewable Energy Laboratory 2002.
(13) Rodrigues, M.; Walter, A.; Faaij, A. Energy Conversion and Management 2007, 48,
1289-1301.
(14) Craig, K. R.; Mann, M. K. National Renewable Energy Laboratory 1996.
13
Sugarcane bioelectricity in São Paulo: market potential and
technological stage
Zilmar José de Souza (UNICA)1
Marcelo Arantes Severi (TGM) 2
ABSTRACT
Bioelectricity produced from sugar cane bagasse is the main biomass in Brazil's electric
matrix and, in 2012, currently accounted for 3% of Brazil's electricity demand. The
theoretical potential of bioelectricity is expected to reach 15,300 average MW in
2020/21 and meet 18% of the country’s electricity demand. However, this paper aims to
estimate the market potential of bioelectricity from sugarcane, in the State of São Paulo,
and present the current state of technology of this important source of Brazilian energy
matrix. This paper observes that the market potential of the State of São Paulo, with the
event of the exchange of boilers from low to high pressure, could reach 1,236 average
MW. If we add the export of bioelectricity occurred in 2011/12 (756 average MW), we
will reach 1,992 average MW, only in the State of São Paulo. In terms of technological
stage, this paper has shown that the technology to produce bioelectricity used in
Brazilian sugar cane plants can be developed using boilers with high pressure and high
temperature combined whit back pressure and condensing steam turbines. This paper
observed that is possible to increase the export of bioelectricity using regenerative cycle.
INTRODUCTION
Bioelectricity may be defined as electricity generated by biomass. Bagasse and straw
from sugar cane are the main sources of biomass for bioelectricity, with sugarcane
wastes accounting for almost 80% of installed power in Brazil in 2012 coming from
biomass sources.
Bioelectricity produced from sugar cane bagasse is the main biomass in Brazil's electric
matrix and currently accounts for 3% of Brazil's electricity demand, and it is frequently
produced during the dry sugarcane harvest season from April to November, which is
also when hydroelectricity production usually drops. The theoretical potential of
bioelectricity is expected to reach 15,300 average MW in 2020/21 and meet 18% of the
country’s electricity demand. That is the equivalent consumption of entire countries like
Sweden, Netherlands or three hydroelectric powers like Belo Monte.
1 Zilmar José de Souza is bioelectricity manager of União da Indústria de Cana-de-Açúcar (UNICA).
2 Marcelo Arantes Severi is commercial manager of TGM Indústria e Comércio Ltda (TGM).
14
In fact, considering the period until 2021, Brazil will have to add to the system
approximately seven Belo Monte sized plants to meet the growing demand for electric
energy (EPE, 2012). The bioelectricity potential alone equals to three Belo Monte sized
plants. Sugarcane bioelectricity would be a natural hedge for the system and for
hydroelectric power plants with guaranteed generation, since bioelectricity depends on
national fuel and is available at regular as well as critical periods of reservoirs levels at
hydroelectric plants, rendering operational security to the system.
However, between the theoretical potential and market potential, the lack of a long-term
policy to sources as bioelectricity has increased the gap between these potentials. This
article aims to estimate the market potential of bioelectricity from sugarcane, in the
State of São Paulo, and present the current state of technology of this important source
of Brazilian energy matrix.
CURRENT SITUATION OF SUGARCANE BIOELECTRICITY
Estimates indicate that sugarcane bioelectricity represented about 1,400 MW of power
sent to the National Interconnected System (SIN) in 2012, accounting for 3% of Brazilian
electricity consumption and provided savings of 5% of the water in the reservoirs of the
Southeast / Midwest Submarket.
In 2011/12 harvest, UNICA consolidated data of electric power production, both for self-
consume and for sale to the SIN, only for the State of São Paulo (accounting on average
for 60% of the cane crushing in Brazil) . From a sample of 154 plants in São Paulo,
representing 98% of the mill in São Paulo, we find the following results for the 2011/12
crop:
• A total generation of 13,089 GWh or 1,494 average MW, from which 6,684 GWh or 763
average MW for self-consume (including the purchase of third parties) and 6,625 GWh
and 756 average MW offered to the SIN.
• From the 154 plants in State of São Paulo, 85 plants (55%) only produce energy for
self-consume and 69 plants (45%) sell energy to the SIN.
• If we stratify the sample in intervals representing sugarcane crushing, we will have the
following results:

15
Table 1: Total of exporting and non-exporting plants of bioelectricity, 2011/12 crop,
State of São Paulo
Intervals
A B
B/A (%)
C
C/A (%) Total of plants Exporting plants
Non-exporting plants
Over 3 million tc 22 18 82% 4 18% Between 1.5 million and 2.99 million tc 64 39 61% 25 39% Less than 1.5 million tc 68 12 18% 56 82% Total 154 69 45% 85 55%
Source: UNICA (2013).
• It is observed that most of the mills with over three million tons of cane crushed (tc)
per harvest already executed projects aimed at export of bioelectricity to SIN. There are
18 plants with a total of 22 units, or 82% of the total, accounting for 34% of everything
that is sold to SIN by the State of São Paulo.
• However, below this level of cane crushed per harvest, specifically in the range below
1.5 million tc/harvest, only 18% export bioelectricity, compared to 56 units (82% of
range) that does not generate excess electricity to the grid.
• There is an intermediate range between 1.5 million tc/harvest and 2.99 million
tc/harvest, in which 61% of the 64 units produce bioelectricity for the SIN, meaning
56% of total sales by sugarcane sector in the State of São Paulo, as shown below.
Table 2: Total of exporting and non-exporting plants of bioelectricity and volume of
exported bioelectricity, 2011/12 crop, State of São Paulo
Intervals Exporting plants
Exported bioelectricity (average MW)
% exported bioelectricity
Over 3 million tc 18 257 34% Between 1.5 million and 2.99 million tc 39 443 59% Less than 1.5 million tc 12 57 7% Total 69 756 100%
Source: UNICA (2013).
Observing the table above, we see that even in the main producer State of sugarcane,
which has 193 producer plants, only 69 mills produce bioelectricity for the grid. In
Brazil, there are between 150 and 160 units producing surpluses in a universe of 413
units. This shows that there is significant potential for bioelectricity, topic that will be
discussed in the next section.
BIOELECTRICITY SUGARCANE IN THE STATE OF SÃO PAULO: MARKET
POTENTIAL
The theoretical potential of bioelectricity is expected to reach 15,300 average MW in
2020/21 and meet 18% of the country’s electricity demand. That is the equivalent

16
consumption of entire countries like Sweden, Netherlands or three hydroelectric power
plants like Belo Monte.
In fact, considering the period until 2021, Brazil will have to add to the system
approximately seven Belo Monte sized plants to meet the growing demand for electric
energy (EPE, 2012).
The bioelectricity potential alone equals to three Belo Monte sized plants. However, this
potential assumes the expansion of sugar cane, doubling the capacity of the milling
industry until the beginning of the next decade, adding the participation of over 100 new
plants to the sugarcane industry.
This theoretical potential of the sugarcane bioelectricity will be very different if we
observe only the market potential of existing generating facilities, with the expansion of
generation expected occurring primarily through:3
(i) Energy efficiency (e.g. reducing consumption of steam for industrial process);
(ii) Increase fuel for generation (leveraging other biomass such as straw and bagasse
increased with the growth of milling) and
(iii) Reform of existing plants (effective retrofit, with the necessary changes in the
existing plant layout).
The potential of bioelectricity is closely related to the expansion of sugar cane and new
mills (greenfield plant). However, based on the data presented in the previous section,
we can work with the market potential of the existing industrial park in the State of São
Paulo, even without a significant increase in milling capacity or increase of greenfield
plant.
To estimate the market potential of bioelectricity, which would occur in the retrofit of
existing plants on a consolidated basis, we assessed the situation in which the plants
that still have their old boilers4 would promote exchange for high-pressure boilers, with
the reform their generation park.
Taking the State of São Paulo as a reference, according to a research from UNICA, in the
2011/12 harvest there were 324 boilers installed before 2007, and 299 boilers with
pressure below 60 bar, distributed as shown below:
3 Potential Theoretical was considered as the one corresponding to the full use of available sources for
producing electricity. The concept of Market Potential includes technical-economic, political, social
and environmental limitations.
4 For purposes of this paper, we consider those old boilers installed prior to January 2007.
17
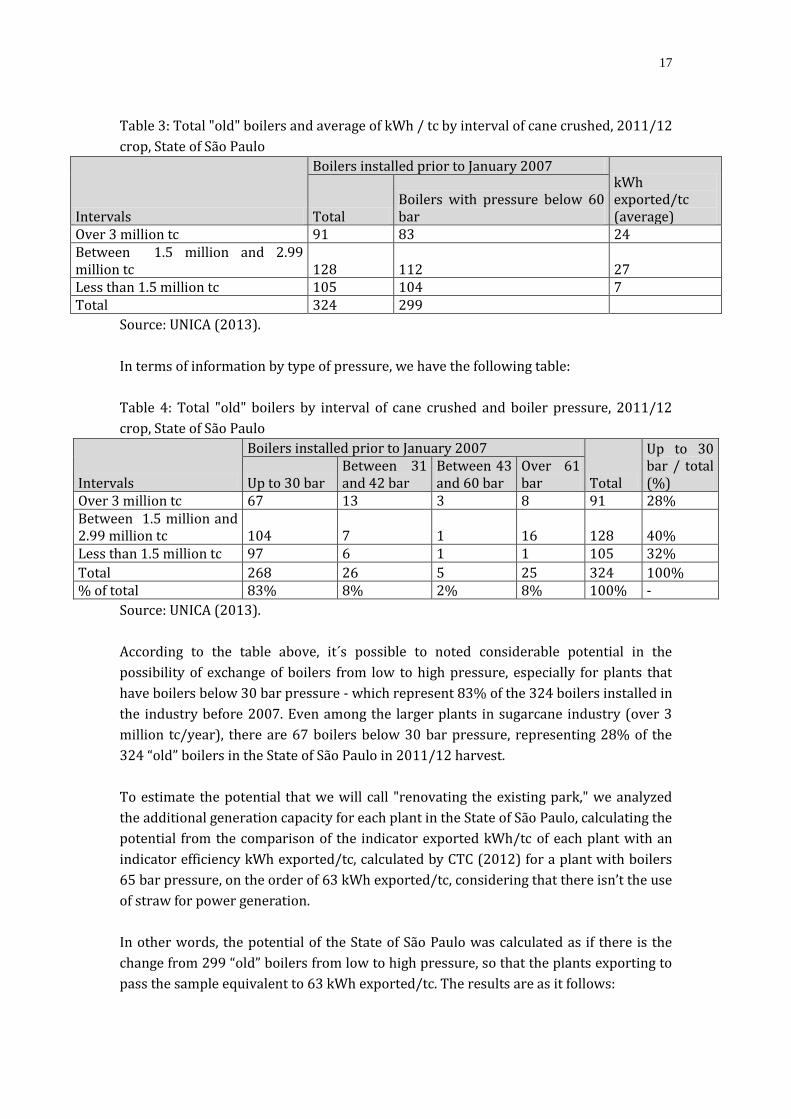
Table 3: Total "old" boilers and average of kWh / tc by interval of cane crushed, 2011/12
crop, State of São Paulo
Intervals
Boilers installed prior to January 2007 kWh exported/tc (average) Total
Boilers with pressure below 60 bar
Over 3 million tc 91 83 24 Between 1.5 million and 2.99 million tc 128 112 27 Less than 1.5 million tc 105 104 7 Total 324 299
Source: UNICA (2013).
In terms of information by type of pressure, we have the following table:
Table 4: Total "old" boilers by interval of cane crushed and boiler pressure, 2011/12
crop, State of São Paulo
Intervals
Boilers installed prior to January 2007
Total
Up to 30 bar / total (%) Up to 30 bar
Between 31 and 42 bar
Between 43 and 60 bar
Over 61 bar
Over 3 million tc 67 13 3 8 91 28% Between 1.5 million and 2.99 million tc 104 7 1 16 128 40% Less than 1.5 million tc 97 6 1 1 105 32%
Total 268 26 5 25 324 100% % of total 83% 8% 2% 8% 100% -
Source: UNICA (2013).
According to the table above, it´s possible to noted considerable potential in the
possibility of exchange of boilers from low to high pressure, especially for plants that
have boilers below 30 bar pressure - which represent 83% of the 324 boilers installed in
the industry before 2007. Even among the larger plants in sugarcane industry (over 3
million tc/year), there are 67 boilers below 30 bar pressure, representing 28% of the
324 “old” boilers in the State of São Paulo in 2011/12 harvest.
To estimate the potential that we will call "renovating the existing park," we analyzed
the additional generation capacity for each plant in the State of São Paulo, calculating the
potential from the comparison of the indicator exported kWh/tc of each plant with an
indicator efficiency kWh exported/tc, calculated by CTC (2012) for a plant with boilers
65 bar pressure, on the order of 63 kWh exported/tc, considering that there isn’t the use
of straw for power generation.
In other words, the potential of the State of São Paulo was calculated as if there is the
change from 299 “old” boilers from low to high pressure, so that the plants exporting to
pass the sample equivalent to 63 kWh exported/tc. The results are as it follows:
18
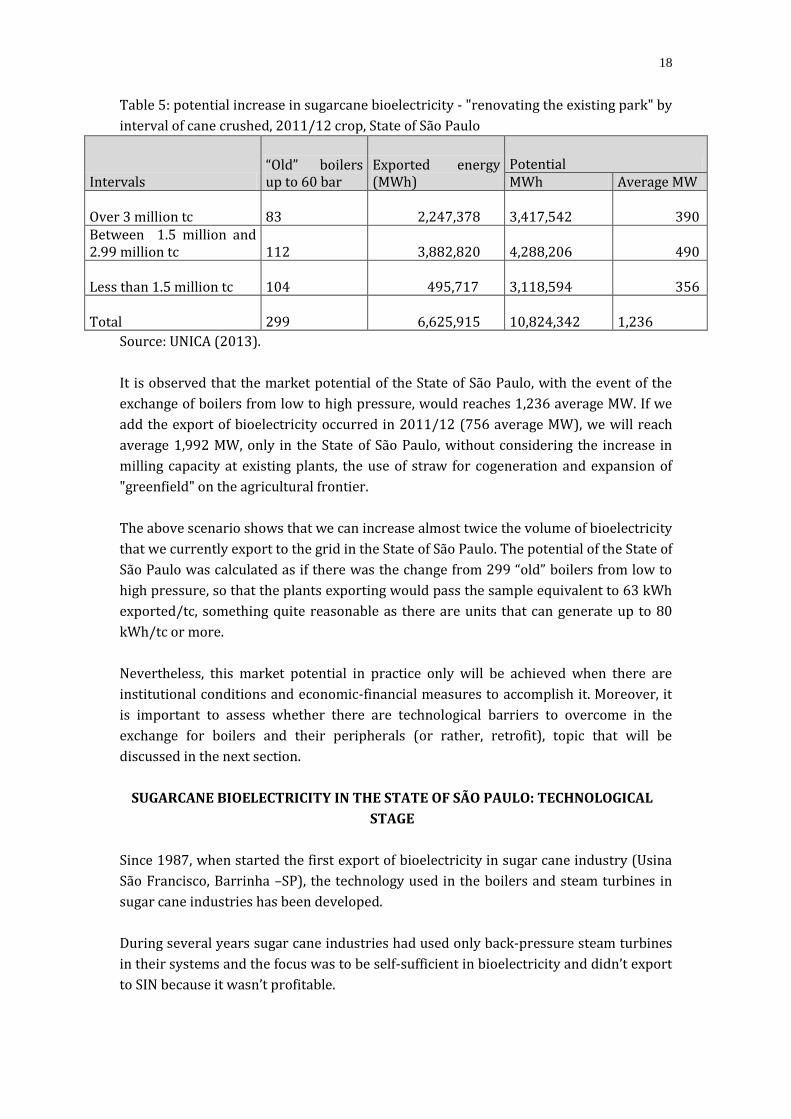
Table 5: potential increase in sugarcane bioelectricity - "renovating the existing park" by
interval of cane crushed, 2011/12 crop, State of São Paulo
Intervals “Old” boilers up to 60 bar
Exported energy (MWh)
Potential MWh Average MW
Over 3 million tc 83 2,247,378 3,417,542 390
Between 1.5 million and 2.99 million tc 112 3,882,820
4,288,206 490
Less than 1.5 million tc 104 495,717 3,118,594 356
Total 299 6,625,915 10,824,342
1,236
Source: UNICA (2013).
It is observed that the market potential of the State of São Paulo, with the event of the
exchange of boilers from low to high pressure, would reaches 1,236 average MW. If we
add the export of bioelectricity occurred in 2011/12 (756 average MW), we will reach
average 1,992 MW, only in the State of São Paulo, without considering the increase in
milling capacity at existing plants, the use of straw for cogeneration and expansion of
"greenfield" on the agricultural frontier.
The above scenario shows that we can increase almost twice the volume of bioelectricity
that we currently export to the grid in the State of São Paulo. The potential of the State of
São Paulo was calculated as if there was the change from 299 “old” boilers from low to
high pressure, so that the plants exporting would pass the sample equivalent to 63 kWh
exported/tc, something quite reasonable as there are units that can generate up to 80
kWh/tc or more.
Nevertheless, this market potential in practice only will be achieved when there are
institutional conditions and economic-financial measures to accomplish it. Moreover, it
is important to assess whether there are technological barriers to overcome in the
exchange for boilers and their peripherals (or rather, retrofit), topic that will be
discussed in the next section.
SUGARCANE BIOELECTRICITY IN THE STATE OF SÃO PAULO: TECHNOLOGICAL
STAGE
Since 1987, when started the first export of bioelectricity in sugar cane industry (Usina
São Francisco, Barrinha –SP), the technology used in the boilers and steam turbines in
sugar cane industries has been developed.
During several years sugar cane industries had used only back-pressure steam turbines
in their systems and the focus was to be self-sufficient in bioelectricity and didn’t export
to SIN because it wasn’t profitable.
19
But in 2002, after a dry period in Brazil, the Brazilian Electrical System had needed to
increase the offer of electrical energy by other sources, like biomass, because the level
of the reservoirs of hydroelectric plants was very low.
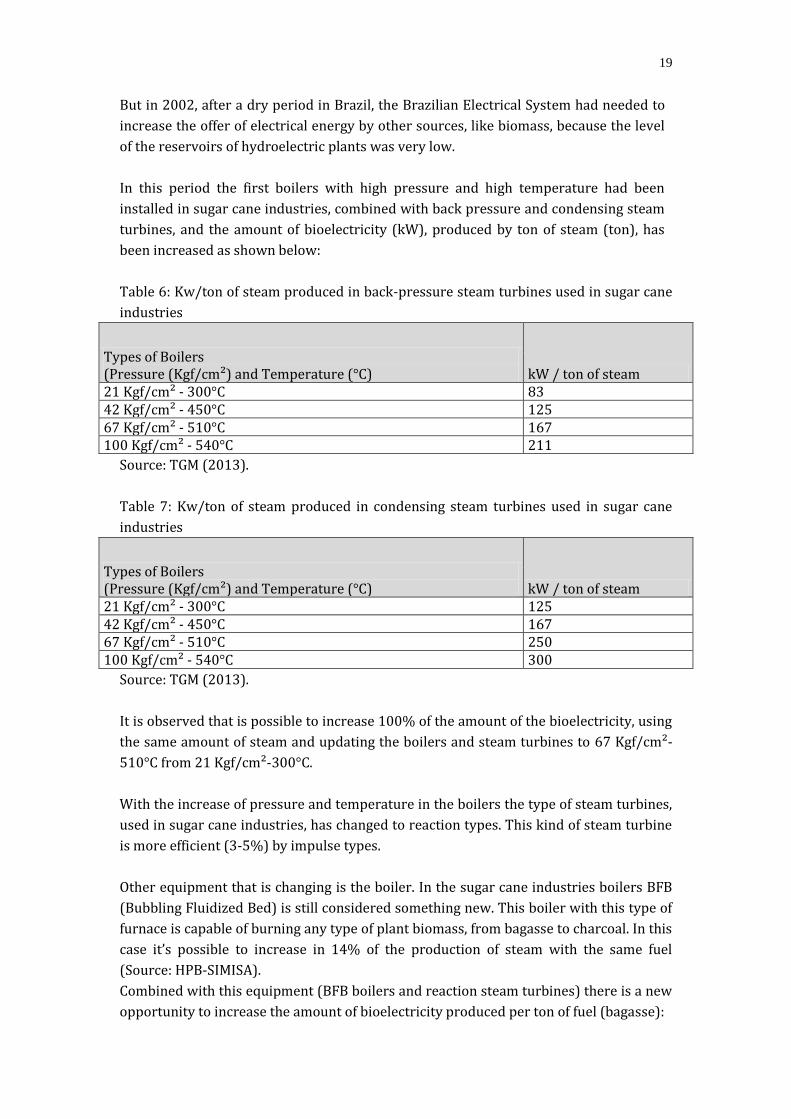
In this period the first boilers with high pressure and high temperature had been
installed in sugar cane industries, combined with back pressure and condensing steam
turbines, and the amount of bioelectricity (kW), produced by ton of steam (ton), has
been increased as shown below:
Table 6: Kw/ton of steam produced in back-pressure steam turbines used in sugar cane
industries
Types of Boilers (Pressure (Kgf/cm²) and Temperature (°C) kW / ton of steam 21 Kgf/cm² - 300°C 83 42 Kgf/cm² - 450°C 125 67 Kgf/cm² - 510°C 167 100 Kgf/cm² - 540°C 211
Source: TGM (2013).
Table 7: Kw/ton of steam produced in condensing steam turbines used in sugar cane
industries
Types of Boilers (Pressure (Kgf/cm²) and Temperature (°C) kW / ton of steam 21 Kgf/cm² - 300°C 125 42 Kgf/cm² - 450°C 167 67 Kgf/cm² - 510°C 250 100 Kgf/cm² - 540°C 300
Source: TGM (2013).
It is observed that is possible to increase 100% of the amount of the bioelectricity, using
the same amount of steam and updating the boilers and steam turbines to 67 Kgf/cm²-
510°C from 21 Kgf/cm²-300°C.
With the increase of pressure and temperature in the boilers the type of steam turbines,
used in sugar cane industries, has changed to reaction types. This kind of steam turbine
is more efficient (3-5%) by impulse types.
Other equipment that is changing is the boiler. In the sugar cane industries boilers BFB
(Bubbling Fluidized Bed) is still considered something new. This boiler with this type of
furnace is capable of burning any type of plant biomass, from bagasse to charcoal. In this
case it’s possible to increase in 14% of the production of steam with the same fuel
(Source: HPB-SIMISA).
Combined with this equipment (BFB boilers and reaction steam turbines) there is a new
opportunity to increase the amount of bioelectricity produced per ton of fuel (bagasse):
20
The Regenerative Cycle.
The regenerative cycle process uses steam from several turbine phases to heat the
condensed returning to the boiler. The main effect may be explained due both to the
steam flow reduction arriving to the condenser a subsequent could source losses, as by
the thermo-dynamic average heat supply temperature increase to the cycle.
The boiler feed water temperature is among the factors impacting the steam cycle yield.
From this principle, pre-heated water requires less fuel, boiler’s thermal efficiency is
virtually unchanged, so fuel consumption is lesser because external energy, that is pre-
heated water and air, are being injected into the boiler.
The steam turbines need to be design for the regenerative cycle, putting intermediary
steam extractions to heat the water and air to the ideal temperature for the boiler.
With this processes and the same amount of fuel is possible to increase up to 7% the
amount of bioelectricity produced (Source: TGM).
CONCLUSIONS
Considering the period until 2021, Brazil will have to add to the system approximately
seven Belo Monte sized plants to meet the growing demand for electric energy (EPE,
2012). The theoretical potential of bioelectricity is expected to reach 15,300 average
MW in 2020/21 and meet 18% of the country’s electricity demand.
However, the concept of theoretical potential is different from the concept of market
potential. Theoretical potential corresponds to the full use of the available sources for
producing electricity. The concept of Market Potential includes technical-economic,
political, social and environmental limitations.
This paper observed that the market potential of the State of São Paulo, with the event of
the exchange of boilers from low to high pressure, could reach 1,236 average MW. If we
add the export of bioelectricity occurred in 2011/12 (756 average MW), we will reach
1,992 average MW, only in the State of São Paulo, without considering the increase in
milling capacity at existing plants, the use of straw for cogeneration and expansion of
"greenfield" on the agricultural frontier.
Nevertheless, this market potential in practice only will be achieved when there are
institutional conditions and economic-financial measures to accomplish it. Moreover, it
is essential to assess whether there are technological barriers to overcome in exchange
for boilers and their peripherals.
Thus, in terms of technological stage, this paper has shown that the technology has been
developed together with the sugar cane industries and nowadays is possible to increase
the amount of bioelectricity’s exported updating the equipment and using boilers with
21
high pressure and high temperature and reaction type of steam turbines combined with
regenerative cycle.
REFERENCES
EPE, Empresa de Pesquisa Energética, 2012. Plano Decenal de Expansão de Energia
2021. Rio de Janeiro.
Souza, Z.J. “Renewable energies in the auctions: lessons from Brazil”. 9th International
Conference on the European Energy Market (EEM12). Florence School of Regulation
(European University Institute in Florence), 10-12 May, 2012.
UNICA - Brazilian Sugarcane Industry Association. Several documents. 2013.
TGM – Brazilian’s Steam Turbines Industry. Several Documents. 2013.
HPB-SIMISA – Brazilian’s Boilers Industry. Several Documents. 2013.
22
Electrical Vehicles for Urban Transportation – Past and Future
Guilherme A Melo, Moacyr A. G. de Brito, Prof. Carlos A. Canesin
UNESP – Universidade Estadual Paulista
Ilha Solteira (SP)
LEP – Power Electronics Laboratory
ABSTRACT
This paper deals with a research that is being developed in Brazil in order to stimulate
companies' interest for urban publictransportation using electrical vehicle. This
research is concerned to trolleybus power supply system and its possible technical
evolution. The preliminary idea is that the vehicle could be powered by two wires
(single phase) alternate current (AC) network and, aiming some flexibility, feeding it
also with the conventional direct current (DC) networks. In this context, when trolleybus
is fed with AC network, a special converter accomplished active power factor correction
(PFC), providing a relatively sinusoidal current waveform, with low total harmonic
distortions (THD) into the AC system and fully complying with IEC 61000-3-4 standards.
For the changes between DC and AC power supply networks, a management control
system promoted the required automatic operation changes, where the original
electrical DC bus system characteristics for the trolleybus are sustained. A 150kW
converter prototype was designed and adapted in a trolleybus provided by Himalaia
Transportation SA and was tested into an experimental AC power supply network built
by AES Eletropaulo Metropolitan Electricity of São Paulo SA, demonstrating the
proposed converter benefits and the feasibility for AC feeding the trolleybus system. In
the current state of this research, the conventional overhead wires for feeding the
trolleybus will be suppressed, and the vehicle is about to become one no connection
dependent electric vehicle powered by secondary batteries and ultra-capacitors. In this
proposal, the battery pack will provide electrical power for the propulsion system,
considering acceleration proposes. For charging back the battery pack, breaking
regeneration and feeding stations in Alternate Current will be employed. In this context,
when passengers are boarding and/or landing, the battery pack is being recharged from
the grid in AC, where a Scott transformer and a PFC converter is required to provide
power quality indexes for the electrical system, complying with IEC61000-3-4
standards. In this context, the conventional DC substations and the overhead wires will
be eliminated and the trolleybus will be replaced by a true desired electrical vehicle for
urban public transportation.

23
INTRODUCTION
Although the trolleybus history presents successful and unsuccessful moments, this kind
of vehicle has been in attendance since its first public transport exploitation in 1880
decade. However, in spite of the several advantages for this urban transportation
system, due to automakers commercial interests, and dubious political resolutions, the
trolleybus systems goes down near to 1960, in the world and consequently in Brazil, as
shown in Figure 1.
One important scenario relating to world concern about strategic energetic resources is
related with the “petroleum crisis” at 1973 and 1979, considered for some the first alert
related to finite conventional energy sources impact, mainly from the fossils basis. In
this context, from 1980 near to 1995, the up-to-date technologies for trolleybus
propulsion systems resulted in increased use for these novel systems in the world,
obtaining the most efficient technologies for urban public transportation. However, in
Brazil, due interests of privatized companies, the system again suffered a strong
reduction.
Therefore, with a vision of better traffic service and more efficient energy utilization,
transport departments of several cities search for the latest technological innovations
for trolleybus, hybrid vehicles and electric vehicles, saving energy and improving the
performance of the public transportation systems.
Nowadays, several countries are replacing their traditional mass transportation systems
for electrical vehicles technologies, demonstrating the effectiveness of this method and
also providing an important decrease of greenhouse gas emission.

24
For traffic efficiency, there is no kind of perfect vehicle to solve every locomotion issue.
Therefore, a composed configuration type of vehicle gives equilibrium to the traffic and
electric vehicles, including trolleybus have their place.
Regarding the fossil fuel consumption in the country (Brazil), especially for automotive
vehicles, the increase of biomass potential exploitation becomes as primordial as the
substitution of fossil or hydrocarbon fuel vehicles, mainly for human mass
transportation systems in metropolitan regions. In this context, the replacement of
diesel bus used in public transportation by hybrid vehicles (diesel-driven and/or
electricity-driven), or by pure electric vehicles (moved only by electricity) has revealed
some potential to dramatically reduce emission pollutants, such as carbon dioxide,
nitrogen, nitrogen oxide and virtually eliminate emission of carbon monoxide.
Considering the possible environmental impacts, electrical vehicle systems present
more benefits in relation to the hybrid ones. In the case of trolleybus for example,
despite the operation costs technologies are higher than the similar ones based on
diesels, emission of pollutants is reduced by 90%, operation is quieter, lifetime is
approximately 4 times higher and maintenance costs are 35% smaller, demonstrating
the potential of this application.
Mainly due to environmental issues and improvements of human and cargo
transportation technology by electric traction systems, specially by system for collective
transport, the electrical vehicle technology has attracted a strong worldwide interest.
Therefore, the mass transportation systems that present low impact on pollution
deserve more attention, mainly in large metropolitan regions, where the greenhouse
emission by fossil fuel transportation system is extremely unsuitable and unacceptable.
THE TROLLEYBUS WITH AC FEEDING
Basically, the trolleybus is a bus fed by electric power having a similar conventional bus
structure, unlikely the most electric mass transportation vehicles (trams and trains).
The electric power supply is normally in DC and it requires two poles, both placed on the
vehicle roof and connected to overhead wires through suitable collectors.
Since the early days of trolleybus utilization, DC machines have been employed on
trolleybus systems in order to promote speed and torque control. However, with the
evolution of AC machine control systems by means of power electronics and because of
DC machines disadvantages (high weights, volume, costs, and high costs of
maintenance), the use of AC machines has increased, leading to the replacement of DC-
DC conversion systems (Choppers) by DC-AC conversion systems (threephase AC
Inverters). However, the conventional power network system was sustained in DC,
requiring a centralized rectifier substation whichnormally presents power quality
problems (voltage drops, high harmonic current distortions, low power factor (PF), and
others). Thus, one important unbeaten aspect related to trolleybus system development

25
is the difficulties of DC systems expansion due to their elevated costs and relatively large
areas required for rectifier substations.
However, considering a new platform of AC feeding trolleybus network, where the
existing three-phase electrical distribution network system can feed these additional
loads, the trolleybus lines propagation becomes somewhat easy.
TROLLEYBUS PROPOSED SYSTEM
The trolleybus proposed system associates the traditional existent DC system with the
AC single-phase feeding system using a Scott transformer with low level of harmonics in
the input current, which can be provided with a pre-regulator rectifier converter
capable of identifying the network type (DC or AC), operating with high power density
(low weight and volume), and without compromising the network system efficiency and
reliability. Thus, these kinds of preregulator converters represent a challenge from
electrical power supply point of view.
In this research stage, this paper presents the main results of a Research, Development
and Innovation (R&D&I) Project in cooperation with AES Eletropaulo Metropolitan
Electricity of São Paulo SA, where a front-end structure for a trolleybus system was
designed to provide power factor correction when supplied by AC lines. Operating as a
preregulator rectifier, rated at 150kW of nominal power, in order to provide an
intermediate DC link for the adjustable speed driver system, and maintaining the same
performance in both types of feeding (AC or conventional DC networks), the converter is
in compliance with IEC61000-3-4 standards.
The overhead power lines in Trolleybus evaluated routes can be supplied by two types
of power substations, as shown in Figure (a) The AC power substation provides a single-
phase sinusoidal voltage waveform with a nominal 380Vrms from a three-phase
distribution network, only through a transformer and a circuit-breaker protection.
The conventional DC power substation provides DC voltage with an average value of
600V. Moreover, both types of power substations may possibly present ±10% of
fluctuation in nominal voltage waveforms in a two-wire system.

26
Therefore, the proposed input stage should be flexible in relation to the feed voltage
characteristics, AC or DC, providing proper DC output voltage range (400V up to 720V)
required by the intermediate DC bus for connecting DC or AC adjustable speed drivers,
as shown in Figure (b).
When the input voltage of the trolleybus power system is AC, the PFCR (Power Factor
Correction Rectifier) must operate in order to provide the DC voltage range required by
the system, and the input current waveform shaping with sinusoidal pattern. In addition,
when power system is DC, the PFCR can operate as DC-DC converter, providing DC
output voltage allowed by the system, or simply remains deactivated when the input
voltage is already in safe operation range.
THE POWER FACTOR CORRECTION BOOST RECTIFIER
The proposed structure includes a conventional non-controlled full bridge rectifier
associated with a 5 cells interleaved configuration boost rectifier operating as a PFCR. In
order to guarantee the power flux dynamics, the interleaved converters were designed
to operate in DCM (Discontinuous Conduction Mode), promoting control simplicity,
robustness and reliability for the structure. Although the DCM operation, the input
current is smoth with low harmonic distortion in consequence of interleaving technique
and the use of a special input current compensation, in order to allow fairly sinusoidal
current waveform. The whole control logic, circuit protection, including system type
detection, has been implemented in a FPGA (field-programmable gate array) device
using hardware description logic.

27
An electronic tridimensional prototype shown in Figure 33(a) was first developed in
order to adapt the mechanical requirements and the specific dimensions for the
converter accommodation room, avoiding major mechanical problems during its
implementation of the converter installation in a lateral room of a trolleybus, as shown
in Figure 3(b).
Figure 3(c) shows details of the DCM five cells interleaving boost rectifier implemented
prototype, rated at 150 kW.
The input and output data, including the designed parameters and components for a
nominal scale prototype are summarized in Table I.
CONTROL APPROACH
Figure 4 shows the simplified block diagram of the digital control algorithm developed,
where protections (over temperature, over output voltage, and over currents), soft-start
and remote control/monitoring algorithms were neglected. One can observe that the
main control task is performed by three stages running simultaneously, namely output
voltage regulation, input current correction and operation mode tracking.
The digital controller has been implemented using a low cost FPGA XILINX device
XC3S200, two Hall-effect voltage sensors (LEM LV25-P), and two SAR analog-digital
converters of 8 bits (AD7810). The control algorithm has been developed totally using a

28
hardware description language VHDL and fixed point arithmetic. The FPGA utilization
after implementation was of 72% of its total resources.
TRACKING OF OPERATION MODES DUE TO AC OR DC POWER NETWORKS
The proposed novel distribution power system modal for trolleybus, considering DC
and/or AC networks, will promote changes in the type of power station supplying the
overhead power lines along the operation trolleybus routes, and consequently changing
the characteristic of trolleybus supply voltage waveform from AC to DC, or vice-versa.
Additionally, in the process of switching between power station overhead lines, there is
a time interval in which the trolleybus supply power system keeps unconnected (open)
reflecting in null amplitude of input voltage waveform for the PFCR.
Usually, the gap between interconnection points of overhead power lines may be from
40cm and up to 80cm length, where vehicle performs the trajectory with speeds in the
range of 5km/h to 80km/h. Thus, the tracking algorithm for detection of AC or DC input
voltage modes should have a consistent answer for the control system in a time interval
lower than the time wasted by the vehicle in the worst case.
Despite the characteristics of each operation mode (AC or DC), they are distant with
regard to nominal rectified input voltage average values, where AC is around 342V and
DC is about 600V. Because of that, the algorithm cannot use only the average value or a
simple zero crossing to accomplish the determination of operation modes. This is
important because oscillations in input voltage (±20%) and severe input voltage sags
(trolleybus collectors disconnect the contact of overhead power line) could lead to
determination of incorrect operation mode.
29
In this way, the methodology used for tracking and determining the operation modes is
based on the use of not only the average value of the input voltage waveform, but also on
the use of the average value of the difference between the average value of the rectified
input voltage and instantaneous value of rectified input voltage waveform, resulting in a
consistent determination of the operation mode.
EXPERIMENTAL RESULTS
Once the converter was able to operate, initial tests have been performed using the DC
network system of Himalaia Transportation parking site in order to make final assemble
adjustments and the validation of the FPGA algorithms.
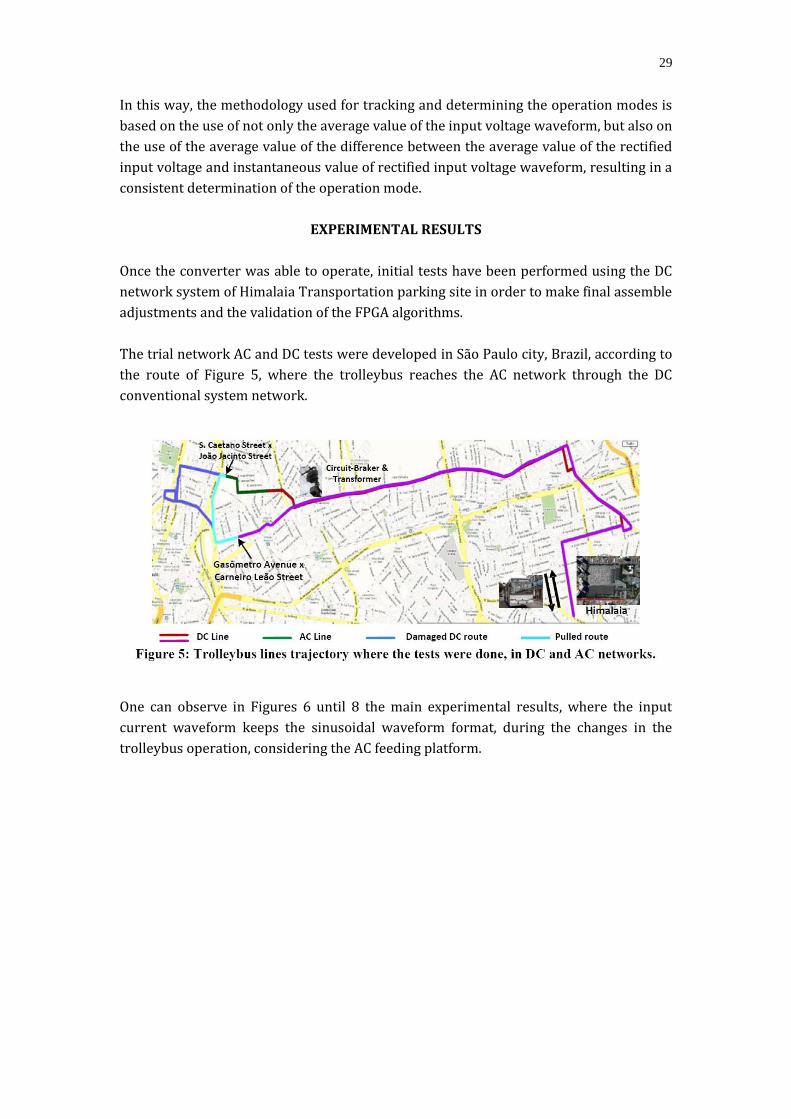
The trial network AC and DC tests were developed in São Paulo city, Brazil, according to
the route of Figure 5, where the trolleybus reaches the AC network through the DC
conventional system network.
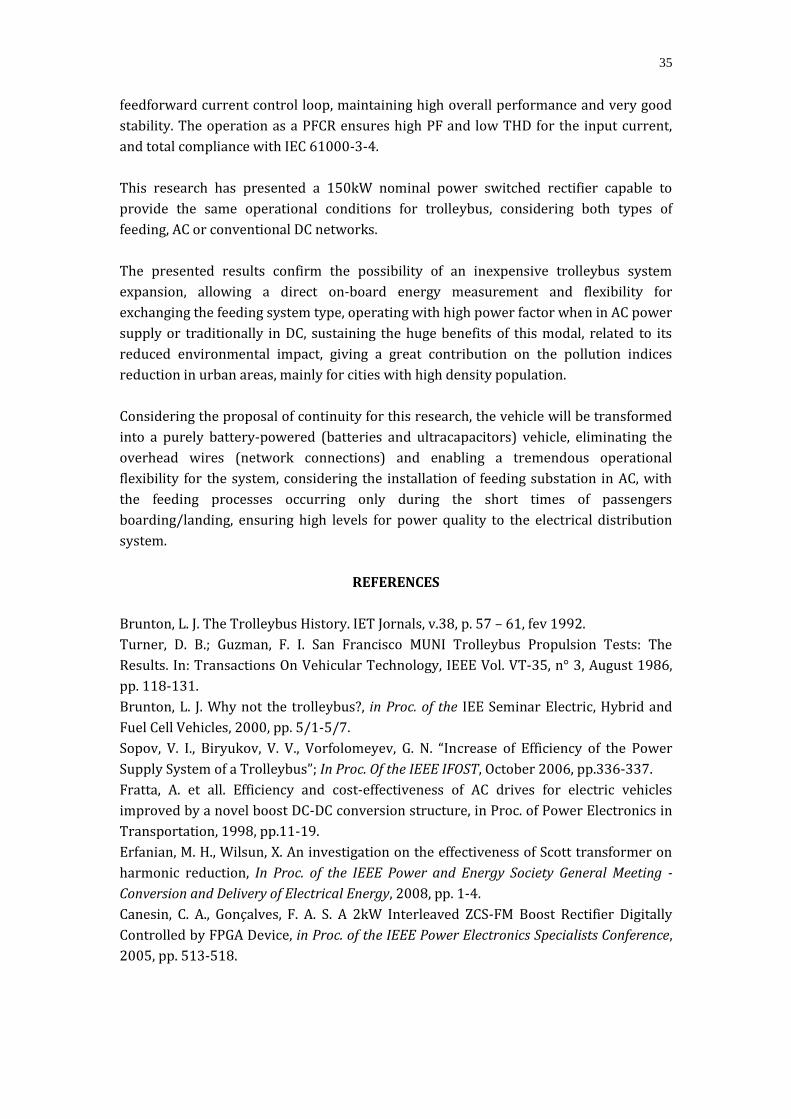
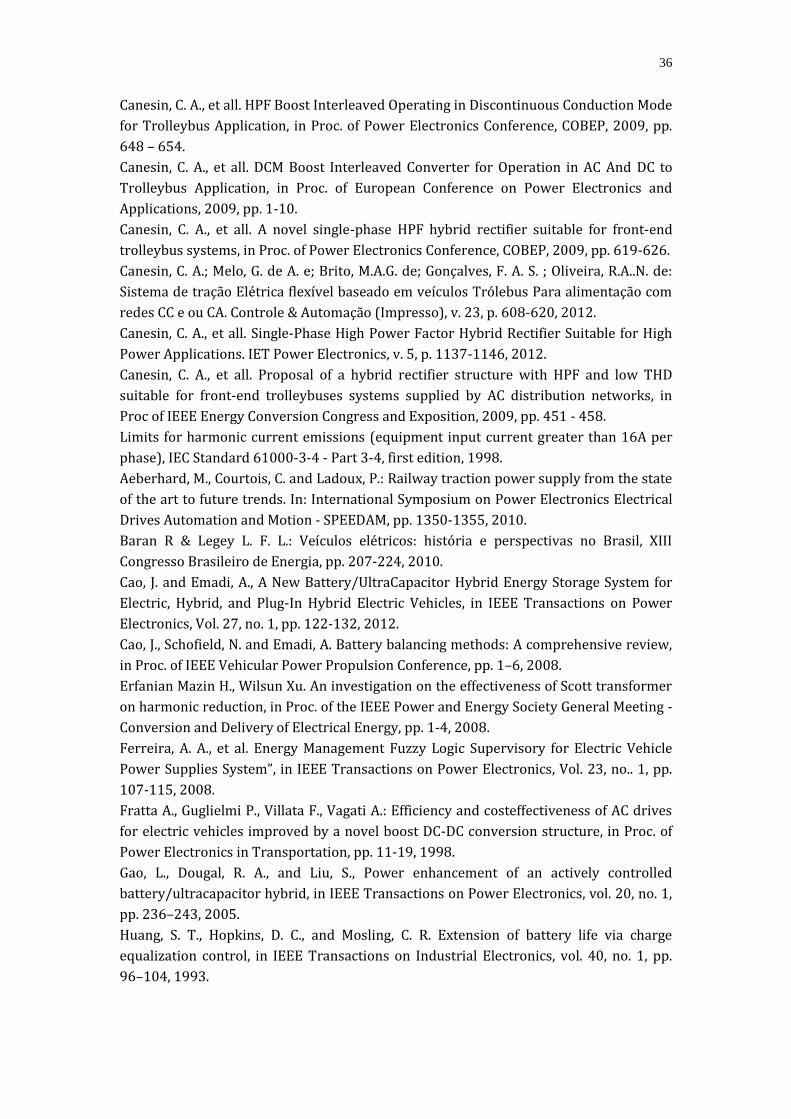
One can observe in Figures 6 until 8 the main experimental results, where the input
current waveform keeps the sinusoidal waveform format, during the changes in the
trolleybus operation, considering the AC feeding platform.
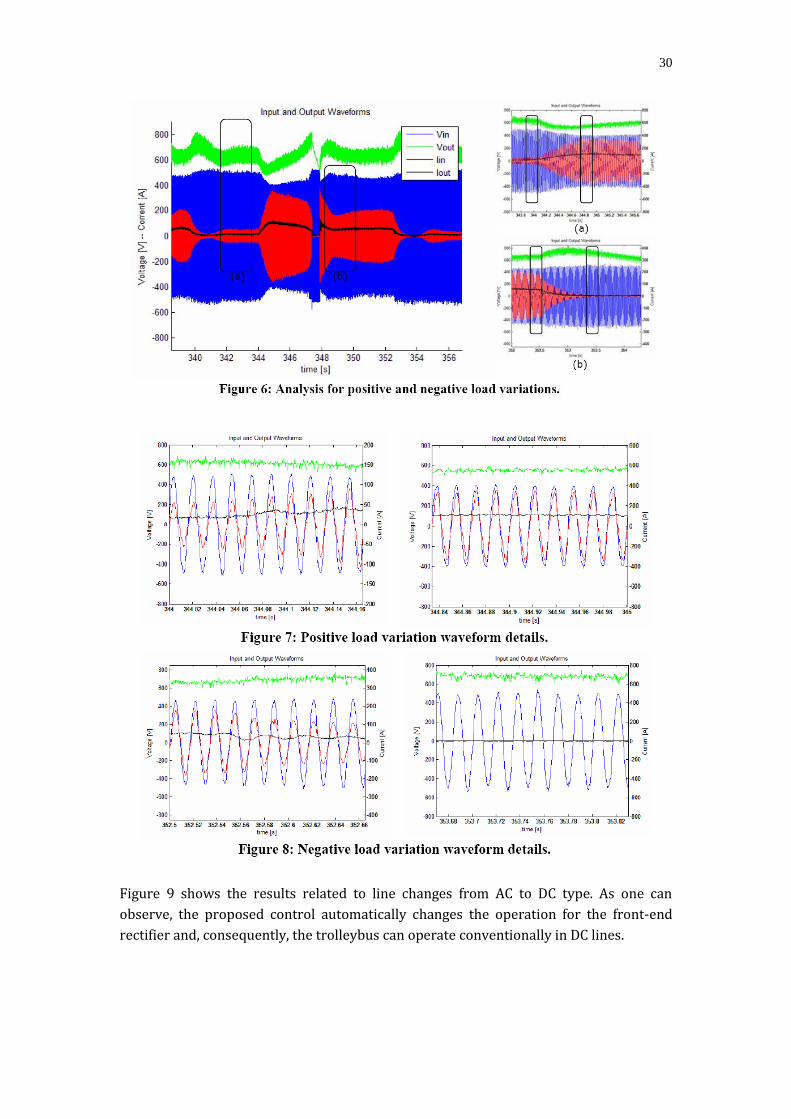
30
Figure 9 shows the results related to line changes from AC to DC type. As one can
observe, the proposed control automatically changes the operation for the front-end
rectifier and, consequently, the trolleybus can operate conventionally in DC lines.

31
A relatively high power load (84kVA) is shown in Figure 2(a), where the current
waveform presents some third harmonic content and Figure 2(b) shows the current
harmonic spectrum, confirming the compliance with IEC 61000-3-4. At this level of
power, the current waveform presents THD=13.2%, PF=0.975, 10.52° of displacement
factor and 95.4% of electrical efficiency.
ELECTRICAL VEHICLE – THE TROLLEYBUS EVOLUTION
A no connected pure electric vehicle (without overhead wires), differently from the
trolleybus, is dependent from the secondary sources (battery pack), resulting in
autonomy limitation. However, the greatest advantage is the independence from
overhead lines. With no overhead lines dependence, the freedom for new routes or rotes
modifications becomes possible and the necessary infra-structure for this action will be
the existence of feeding stations. Otherwise, the routes have to obey some rules about
stop bus stations distances, for boarding and landing passengers, and these rules are
sufficient for attending the real demand for one electrical bus satisfactory operation. In
this context, the stop bus platform has to be integrated with the feeding station for the
electric vehicle and the battery pack is charged at boarding and landing times, as shown
in Figure 3.

32
The feeding station will provide an AC single-phase connection for the trolleybus feeding
process, considering the use of a Scott transformer to adapt the three-phase grid
voltages.
Electrical vehicle is one up-to-date issue and some developments are needed for
maximum energy utilization and high battery lifetime, by improving efficiency and
energy control strategies. In order to improve battery lifetime, it is primordial for the
energy system to count with one ultra-capacitor bank, managing the rapid energy flux
and alleviating the battery efforts.
Another fundamental system for an electric vehicle is the break energy regeneration
system, storing back the kinetic energy stored on the vehicle when it is in movement.
Additionally, in the research scope, different alternative and renewable power sources
can be exploited for battery pack charging, like photovoltaic cells, once this country
(Brazil) has one of the best solar irradiance.
For feeding station alternatives, there are two different configurations possibilities: AC
or DC. However, considering the specific rules for the electric energy distribution in
Brazil, and the standards for electric energy metering, this research proposes that the
feeding substation must be in AC.
ALTERNATE CURRENT FEEDING SUBSTATION
When the feeding station is prepared to AC power supply, making the protection system
and disconnect load more viable, the PFCR must be installed into the electric vehicle,
allowing an integrated control for the rectifier and the battery charge control through
the DC to DC bidirectional converter, as shown in the schematic diagram of Figure 4.

33
Improvements in the input power system allows onboard direct AC energy
measurement, considering the electric vehicle as a consumer unity connected to the
distribution grid, with operational reliability, operating with high power factor. It is also
observed that as the measurement is made in the low voltage network side, there is no
need for special fare for traction system.
PROJECT EXPECTATION RESULTS
From a technological point of view, we have the intention to generate and transfer
knowledge to the national manufactures of electric vehicles powered by batteries,
providing knowledge for alternate current special system feeding station as well as from
alternative energy sources usage, keeping the existent overhead lines feeding technique
for operating over the network already existing for trolleybus system, allowing a soft
migration from the actual trolleybus platform to this new one technological scenario.
The main features expected for the proposed electrical vehicles operating for urban and
public transportation are:
- Vehicle autonomy for at least one full day of operation, considering several variables
concerning to the distance between feed stations, traffic, hills and charge time during
boarding and landing;
- System management power conditioning optimized for the appropriate care of the
dynamic characteristics of the vehicle, ensuring long lifetime to the battery bank and
efficient use of energy;
- Automatic connection to the feed substation, efficient platform connection, low cost
and free from negative impacts to the distribution system of electricity.

34
SPECIFIC EXISTING RESOURCES AT UNESP-ILHA SOLTEIRA
The Power Electronics Laboratory researchers group LEP - FE/ISUNESP, located at Ilha
Solteira Campus, already has an electric vehicle laboratory, structured with the
minimum requirements necessaries for such magnitude project development, as shown
in Figure 13. Our structure is prepared with trench inspection room for any necessary
maintenance and adaptation in the vehicle electrical system, as one can observe in
Figure 14, robust electrical energy feeding dedicated for the electric vehicles laboratory,
available room for Scott transformer installation with protected cabin site and large area
availability for feeding station construction.
CONCLUSIONS
This paper presents a synthesis and the main results for a singlephase switched rectifier
with high power factor (PF) and low total harmonic distortion (THD) suitable for
electrical non polluted mass transport applications like trolleybus, which can be
powered by urban DC or AC distribution networks. Therefore, a front-end pre-regulator
allows reduced cost for trolleybus system expansion, considering that the high cost DC
conventional substations are no longer necessary. The proposed structure includes a
conventional single-phase non-controlled full-bridge rectifier associated with a five cells
interleaved boost converter, controlled with a non-linear PI compensator and a
35
feedforward current control loop, maintaining high overall performance and very good
stability. The operation as a PFCR ensures high PF and low THD for the input current,
and total compliance with IEC 61000-3-4.
This research has presented a 150kW nominal power switched rectifier capable to
provide the same operational conditions for trolleybus, considering both types of
feeding, AC or conventional DC networks.
The presented results confirm the possibility of an inexpensive trolleybus system
expansion, allowing a direct on-board energy measurement and flexibility for
exchanging the feeding system type, operating with high power factor when in AC power
supply or traditionally in DC, sustaining the huge benefits of this modal, related to its
reduced environmental impact, giving a great contribution on the pollution indices
reduction in urban areas, mainly for cities with high density population.
Considering the proposal of continuity for this research, the vehicle will be transformed
into a purely battery-powered (batteries and ultracapacitors) vehicle, eliminating the
overhead wires (network connections) and enabling a tremendous operational
flexibility for the system, considering the installation of feeding substation in AC, with
the feeding processes occurring only during the short times of passengers
boarding/landing, ensuring high levels for power quality to the electrical distribution
system.
REFERENCES
Brunton, L. J. The Trolleybus History. IET Jornals, v.38, p. 57 – 61, fev 1992.
Turner, D. B.; Guzman, F. I. San Francisco MUNI Trolleybus Propulsion Tests: The
Results. In: Transactions On Vehicular Technology, IEEE Vol. VT-35, n° 3, August 1986,
pp. 118-131.
Brunton, L. J. Why not the trolleybus?, in Proc. of the IEE Seminar Electric, Hybrid and
Fuel Cell Vehicles, 2000, pp. 5/1-5/7.
Sopov, V. I., Biryukov, V. V., Vorfolomeyev, G. N. “Increase of Efficiency of the Power
Supply System of a Trolleybus”; In Proc. Of the IEEE IFOST, October 2006, pp.336-337.
Fratta, A. et all. Efficiency and cost-effectiveness of AC drives for electric vehicles
improved by a novel boost DC-DC conversion structure, in Proc. of Power Electronics in
Transportation, 1998, pp.11-19.
Erfanian, M. H., Wilsun, X. An investigation on the effectiveness of Scott transformer on
harmonic reduction, In Proc. of the IEEE Power and Energy Society General Meeting -
Conversion and Delivery of Electrical Energy, 2008, pp. 1-4.
Canesin, C. A., Gonçalves, F. A. S. A 2kW Interleaved ZCS-FM Boost Rectifier Digitally
Controlled by FPGA Device, in Proc. of the IEEE Power Electronics Specialists Conference,
2005, pp. 513-518.
36
Canesin, C. A., et all. HPF Boost Interleaved Operating in Discontinuous Conduction Mode
for Trolleybus Application, in Proc. of Power Electronics Conference, COBEP, 2009, pp.
648 – 654.
Canesin, C. A., et all. DCM Boost Interleaved Converter for Operation in AC And DC to
Trolleybus Application, in Proc. of European Conference on Power Electronics and
Applications, 2009, pp. 1-10.
Canesin, C. A., et all. A novel single-phase HPF hybrid rectifier suitable for front-end
trolleybus systems, in Proc. of Power Electronics Conference, COBEP, 2009, pp. 619-626.
Canesin, C. A.; Melo, G. de A. e; Brito, M.A.G. de; Gonçalves, F. A. S. ; Oliveira, R.A..N. de:
Sistema de tração Elétrica flexível baseado em veículos Trólebus Para alimentação com
redes CC e ou CA. Controle & Automação (Impresso), v. 23, p. 608-620, 2012.
Canesin, C. A., et all. Single-Phase High Power Factor Hybrid Rectifier Suitable for High
Power Applications. IET Power Electronics, v. 5, p. 1137-1146, 2012.
Canesin, C. A., et all. Proposal of a hybrid rectifier structure with HPF and low THD
suitable for front-end trolleybuses systems supplied by AC distribution networks, in
Proc of IEEE Energy Conversion Congress and Exposition, 2009, pp. 451 - 458.
Limits for harmonic current emissions (equipment input current greater than 16A per
phase), IEC Standard 61000-3-4 - Part 3-4, first edition, 1998.
Aeberhard, M., Courtois, C. and Ladoux, P.: Railway traction power supply from the state
of the art to future trends. In: International Symposium on Power Electronics Electrical
Drives Automation and Motion - SPEEDAM, pp. 1350-1355, 2010.
Baran R & Legey L. F. L.: Veículos elétricos: história e perspectivas no Brasil, XIII
Congresso Brasileiro de Energia, pp. 207-224, 2010.
Cao, J. and Emadi, A., A New Battery/UltraCapacitor Hybrid Energy Storage System for
Electric, Hybrid, and Plug-In Hybrid Electric Vehicles, in IEEE Transactions on Power
Electronics, Vol. 27, no. 1, pp. 122-132, 2012.
Cao, J., Schofield, N. and Emadi, A. Battery balancing methods: A comprehensive review,
in Proc. of IEEE Vehicular Power Propulsion Conference, pp. 1–6, 2008.
Erfanian Mazin H., Wilsun Xu. An investigation on the effectiveness of Scott transformer
on harmonic reduction, in Proc. of the IEEE Power and Energy Society General Meeting -
Conversion and Delivery of Electrical Energy, pp. 1-4, 2008.
Ferreira, A. A., et al. Energy Management Fuzzy Logic Supervisory for Electric Vehicle
Power Supplies System”, in IEEE Transactions on Power Electronics, Vol. 23, no.. 1, pp.
107-115, 2008.
Fratta A., Guglielmi P., Villata F., Vagati A.: Efficiency and costeffectiveness of AC drives
for electric vehicles improved by a novel boost DC-DC conversion structure, in Proc. of
Power Electronics in Transportation, pp. 11-19, 1998.
Gao, L., Dougal, R. A., and Liu, S., Power enhancement of an actively controlled
battery/ultracapacitor hybrid, in IEEE Transactions on Power Electronics, vol. 20, no. 1,
pp. 236–243, 2005.
Huang, S. T., Hopkins, D. C., and Mosling, C. R. Extension of battery life via charge
equalization control, in IEEE Transactions on Industrial Electronics, vol. 40, no. 1, pp.
96–104, 1993.

37
Lukic, S. M., Cao, J., Bansal, R. C., Rodriguez, F., and Emadi, A. Energy storage systems for
automotive applications, in IEEE Transactions on Industrial Electronics, vol. 55, no. 6,
pp. 2258–2267, 2008.
MacFarlane, D. R.; Huang J. & Forsyth M. Lithium-doped plastic crystal electrolytes
exhibiting fast ion conduction for secondary batteries, NATURE, Vol 402, pp. 792-794,
Dec 16, 1999.
Miller, J, Prummer, M, Schneuwly, A. Power Electronic Interface for an Ultracapacitor as
the Power Buffer in a Hybrid Electric Energy Storage System, Maxwell Technologies,
Disponível em: <http://www.maxwell.com>.
MUDGAL, S.; et al.: Comparative Life-Cycle Assessment of nickelcadmium (NiCd)
batteries used in Cordless Power Tools (CPTs) vs. their alternatives nickel-metal hydride
(NiMH) and lithium-ion (Liion) batteries. European Commission – DG ENV, December
15, 2011, 300p.
Napoli, A. Di, et all. Dynamic Modeling and Regulators Design for Multiple Input Power
Converters for the Propulsion System of Electric Vehicles, in Proc. COBEP’03, Fortaleza,
Brazil, Sep. 2003, pp. 362-367.
Omar, N. ; Van Den Bossche, P. ; Van Mierlo, J. Passive and Active Battery Balancing
comparison based on MATLAB-Simulink, in Proc. Of the IEEE Vehicle Power and
Propulsion Conference (VPPC), pp. 1-7,2011.
“Plano Estadual de Energia do Estado de São Paulo - Cenário 2020”, Secretaria de
Energia do Estado de São Paulo, Disponível em: <http://www.energia.sp.gov.br/>.
Prumer, M, Auer, J, Schneuwly, A. Ultracapacitors Drive New Efficiencies for Hybrid
Systems Architectures, Maxwell Technologies, Disponível em:
<http://www.maxwell.com>.
Schneuwly, A. Energy Storage for Hybrid Power in Heavy Transportation, Maxwell
Technologies, Disponível em : <http://www.maxwell.com>.

38
Brazilian Bio–Fuels Production Scenario
(Biogas, Biomethane and Biosyngas)
Gerhard Ett a,d, Fernando Landgraf a, b, Silas Derenzo a, Abraham Sin Yu a, b, Lineu Belico
dos Reisb, Alexandre Mazzonetto c,d, Heloisa Burkhardt Antonoff a, Ligia Antunes A. Alves
de Souzaa.
a Institute for Technological Research – IPT, b São Paulo University – USP, c Centro Paula Souza Piracicaba - FATEC, d Fundação Armando Alvares Penteado - FAAP
INTRODUCTION
Energy is an important component of humankind challenge to construct a sustainable
process of living. Within this scenario energy sustainability is strongly associated to at
least three main priorities:
• The preservation of essential natural systems threatened by anthropogenic
actions that result in environmental problems such as climate changes, flooding,
health stresses, deforestation and so on;
• The necessity to provide the basic and modern energy services to each world
inhabitant, in accordance to the sustainability equity concept: around one third of
the world population has no access to these services;
• The reduction of security risks and potential for geopolitical conflicts associated to
an uneven distribution of energy resources.
Energy sustainability is a global and very complex subject requiring an integrated
technical, economic, political, ecological and environmental approach, being here the
social included in the environmental. An open minded and cooperative effort involving
the world nations is also necessary to pave the way to sustainability in general.
As a consequence, the sustainability theme has been, from some decades to now, focused
in many debates, works, seminars and publications around the world, most of them with
a multidisciplinary approach and many within the context of United Nations
Organization, with participation of several countries representatives. Therefore, there is
a huge amount of material available to be read and analyzed, that can lead to many
different reflections and discussions and provide a better knowledge of sustainability
concepts and its complexity. This, of course, will not be done in this work, for which is
enough only to highlight important aspects related to its focus on renewable energy
resources, and, more than this, to bio-fuels. But, focusing on energy, some basic
strategies and policies can be recognized as recommended almost consensually in this
scenario: energy sustainability must be worldly and locally addressed through effective
demand-and- supply – side actions, comprising basically energy efficiency and
conservation from demand side view, and the increasing use of renewable energy from
39
supply side view. Looking at the supply side, our focus here, it can be stated that the use
of renewable resources to produce heat, liquid fuels or electricity fulfill the three
priorities presented above.
But to do this, without compromising the way of living of future generations, the
increase in the renewable energy utilization must consider consciously and in a
balanced way the associated environmental and ecological impacts, costs and benefits.
Within this context, bio – fuels present significant advantages when compared to other
renewable energy natural sources, due to some facilities to implement and manage the
storage capacity needed to guarantee continuous energy and to the high potential of jobs
creation. As a counterpart however, bio – fuels production requires strong attention to
problems associated to lands use and impacts in the nourishment.
In this bio – fuels scenario, Brazil, due to its continental dimensions, different regional
aspects and agricultural characteristics, already plays a very important role. This can
easily be recognized looking at the several experiences and projects implemented in the
country since the seventies: the pioneer use of ethanol (in the PROALCOOL project, in
which IPT participated, during the seventies) and of biodiesel in transports; utilization
of sugar cane pulp and other industrial residues for relatively large heat and electricity
cogeneration; the use of local agricultural, industrial, solid urban and animal farm
residues for medium or small heat and electricity cogeneration or simply electricity
production. Now Brazil proceeds working in improvements of already existing bio-fuels
technologies and in developing the new technological bio- fuels generation. Within the
context presented above, the main objective of this work is to present an overview of the
Brazilian bio – fuels scenario other than bioethanol, in order to divide and discuss the
gains, advances, difficulties and learned lessons, for a positive and cooperative exchange
of views addressed to sustainability.
BIOGAS
Biogas was discovered in the XVII century, being known as swamp gas. Methane
presence was recognized a century later. In the 19th century, Ulysse Gayon, pupil of
Louis Pasteur, made the first known anaerobic fermentation of a mixture of manure
and water producing biogas. Several countries (China, India, and Pakistan) utilize
biogas intensively as an energy source, because it is associated with health and
environmental treatment of organic waste.
Biogas is composed mainly by methane, carbonic gas and water. It is composed also by
sulfide gas (H2S) and nitrogen, depending of its origin. Sulfide gas is a result of the
presence of sulfur compounds in the anaerobic digestion. Nitrogen and, sometimes,
oxygen contamination are related to the presence of the air in landfills and also due

40
their solubility in the water, if a preliminary aeration was used. Table 1 presents
normal composition of the gas.
Table 2: Biogas composition from several fonts. (biogas renewable energy)
Components Wastewater treatment plants sludge
House-hold waste
Agricultural wastes
Waste of agrifood industry
CH4 %vol 60-75 50-60 60-75 68 CO2 %vol 33-19 38-34 33-19 26 N2 %vol 1-0 5-0 1-0 - O2 %vol < 0,5 1-0 < 0,5 - H2O %vol(at 40°C) 6 6 6 6 Total % vol 100 100 100 100 H2S mg/m3 1000 - 4000 100-900 3000–10 000 400 NH3 mg/m3 - - 50-100 - Aromatic mg/m3 - 0-200 - - Organochlorinated / organofluorated mg/m3
100-800 -
Source (biogas renewable energy)
Methane, the main biogas component has the major impact in greenhouse effects.
Fortunately, it has a high heat value that is liberated when it is burned, resulting in
water and CO2 that is liberated to the atmosphere or can be sent to CO2 capture. The
associated energy (35.800kJ.m3) can be used to the human necessities.
However, the other gases components in the biogas, had not energy to be got by
burning, and the result is that they reduces the net energy got from the biogas
oxidation to 22,500-25,000 KJ.m3 (JORDÃO et al., 1995). That is why they have
normally to be removed before biogas use. Also, biogas is a water saturated gas that
contains acid gases that can cause corrosion, and removal of CO2 also removes H2S,
becoming in a less corrosive gas.
Biogas results from the anaerobic digestion of agricultural, agro-industrial and urban
effluents and landfill of MSW (municipal solid waste) and vinasse generated in the
production of alcohol as a result of the degradation of organic matter. The products of
biodigestion are: biogas and bio-fertilizers-stabilized organic matter and pH between
6.9-7.1, suitable for use in agriculture.
BIOGAS PRODUCTION FROM ANIMAL WASTE
A confined animal can produce daily up to 40 kg of manure (liquid and solid). While
producing the same amount of waste, dairy animals spend part of the day grazing, and
its production in confined area (milking room and stable) do not allow the commercial
exploitation of biogas.

41
For the anaerobic biodigestion process animal waste must be diluted with water, to
around 10% weight. Both, excess and lack of water are harmful. Table 2 presents the
average waste productions of some commercial creations.
Table 3. Quantities of waste produced per day and recommended dilutions.
Animals Daily production of animal manure
Dilution(liter of water/kg waste)
confined Cattle 40 kg 4 Dairy cattle manure 15 kg 4 Chicken (2.5 kg) 0,18 kg / chiken 3 Swine-Breeding Shed 10.9 kg of manure (with 4.9 kg /
sow and 6.0 kg / neck) 2
Swine-Shed Pregnancy 11 kg of manure / slurry nut 2 Swine-Parenting Shed 18 kg of manure (with 8 piglets
per sow) 2
Swine-Shed Nursery pig manure 0.95 kg / piglet manure 2 Swine-Shed Termination 4.9 kg / pig manure 2
Source: adapted from Lucas Junior, 2009 and Barrera, 1993.
All pig manure may be collected, since the growth is led in pigsties. Broilers and laying
hens are in the same situation.
From May to November the Brazilian Southeast region is marked by drought and
animals are confined in enclosed areas (paddocks) to gain weight. This practice is
widespread in the country with more than 1,200 confinements and about 2.7 million
animals confined only in the states of São Paulo, Mato Grosso do Sul, Goiás, Minas
Gerais and Paraná. Table 3 shows the potential power production (kW.h) from cattle
manure in the states that concentrate highest energy potentials.
Table 4. Potential energy from biogas manure feedlot cattle.
State Constraints Animals kW/day Potential
MW /month Potential
Goiás 486 1,059,480 847,584 25,430 São Paulo 121 263,780 211,024 6,331 Mato Grosso 160 348,800 279,040 8,370 Minas Gerais 424 924,320 739,456 22,183 Mato Grosso do Sul 73 159,140 127,312 3,820 TOTAL 1,264 2,756.201 2,204,960 66,150
Source: Informa Economics FNP and Assocon.
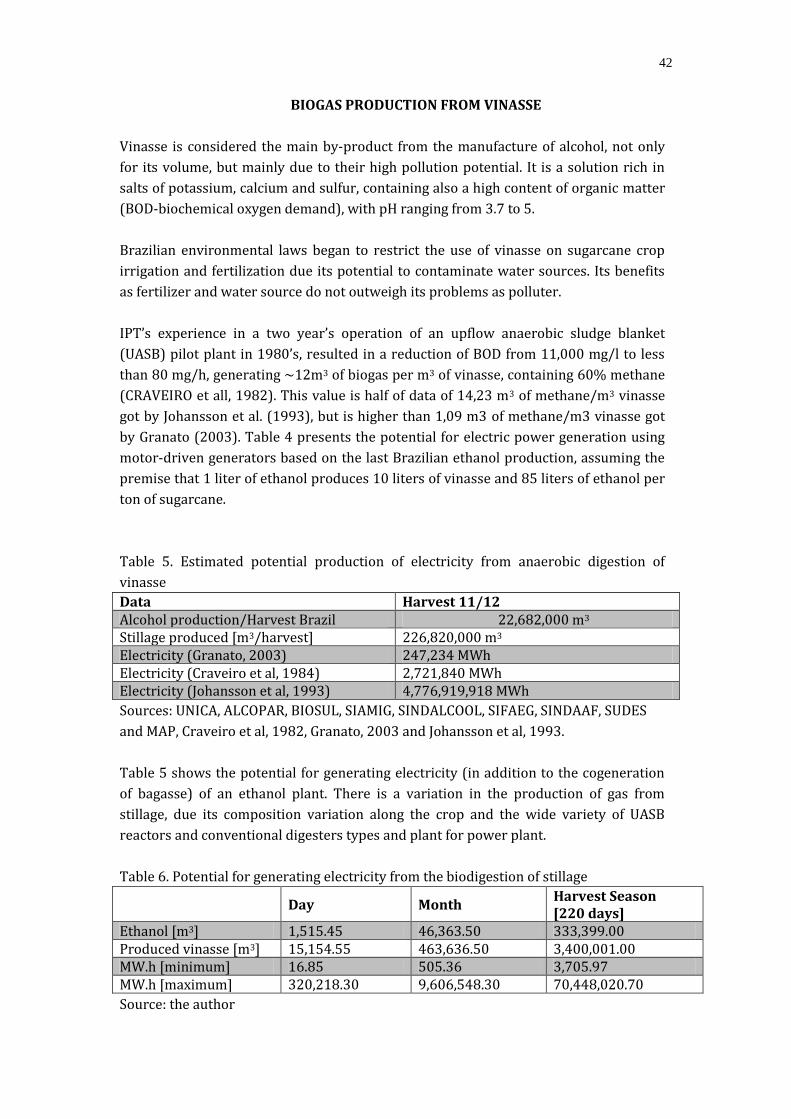
42
BIOGAS PRODUCTION FROM VINASSE
Vinasse is considered the main by-product from the manufacture of alcohol, not only
for its volume, but mainly due to their high pollution potential. It is a solution rich in
salts of potassium, calcium and sulfur, containing also a high content of organic matter
(BOD-biochemical oxygen demand), with pH ranging from 3.7 to 5.
Brazilian environmental laws began to restrict the use of vinasse on sugarcane crop
irrigation and fertilization due its potential to contaminate water sources. Its benefits
as fertilizer and water source do not outweigh its problems as polluter.
IPT’s experience in a two year’s operation of an upflow anaerobic sludge blanket
(UASB) pilot plant in 1980’s, resulted in a reduction of BOD from 11,000 mg/l to less
than 80 mg/h, generating ~12m3 of biogas per m3 of vinasse, containing 60% methane
(CRAVEIRO et all, 1982). This value is half of data of 14,23 m3 of methane/m3 vinasse
got by Johansson et al. (1993), but is higher than 1,09 m3 of methane/m3 vinasse got
by Granato (2003). Table 4 presents the potential for electric power generation using
motor-driven generators based on the last Brazilian ethanol production, assuming the
premise that 1 liter of ethanol produces 10 liters of vinasse and 85 liters of ethanol per
ton of sugarcane.
Table 5. Estimated potential production of electricity from anaerobic digestion of
vinasse
Data Harvest 11/12 Alcohol production/Harvest Brazil 22,682,000 m3 Stillage produced [m3/harvest] 226,820,000 m3 Electricity (Granato, 2003) 247,234 MWh Electricity (Craveiro et al, 1984) 2,721,840 MWh Electricity (Johansson et al, 1993) 4,776,919,918 MWh
Sources: UNICA, ALCOPAR, BIOSUL, SIAMIG, SINDALCOOL, SIFAEG, SINDAAF, SUDES
and MAP, Craveiro et al, 1982, Granato, 2003 and Johansson et al, 1993.
Table 5 shows the potential for generating electricity (in addition to the cogeneration
of bagasse) of an ethanol plant. There is a variation in the production of gas from
stillage, due its composition variation along the crop and the wide variety of UASB
reactors and conventional digesters types and plant for power plant.
Table 6. Potential for generating electricity from the biodigestion of stillage
Day Month Harvest Season [220 days]
Ethanol [m3] 1,515.45 46,363.50 333,399.00 Produced vinasse [m3] 15,154.55 463,636.50 3,400,001.00 MW.h [minimum] 16.85 505.36 3,705.97 MW.h [maximum] 320,218.30 9,606,548.30 70,448,020.70
Source: the author
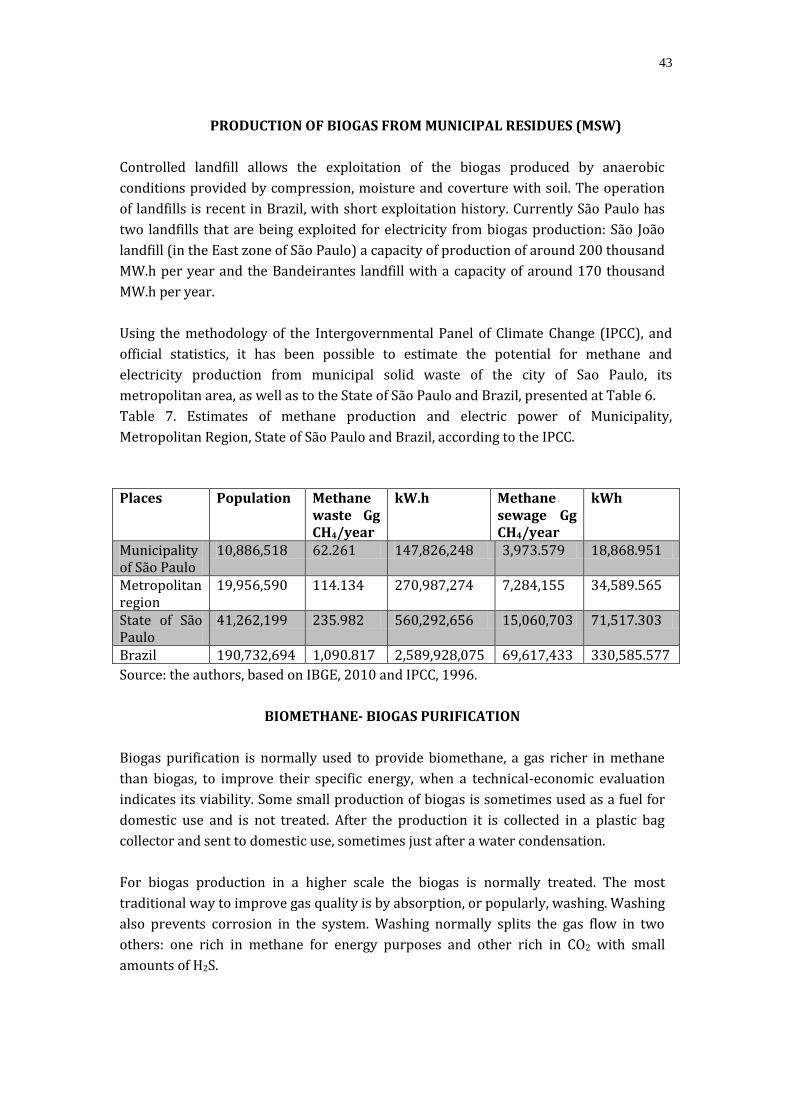
43
PRODUCTION OF BIOGAS FROM MUNICIPAL RESIDUES (MSW)
Controlled landfill allows the exploitation of the biogas produced by anaerobic
conditions provided by compression, moisture and coverture with soil. The operation
of landfills is recent in Brazil, with short exploitation history. Currently São Paulo has
two landfills that are being exploited for electricity from biogas production: São João
landfill (in the East zone of São Paulo) a capacity of production of around 200 thousand
MW.h per year and the Bandeirantes landfill with a capacity of around 170 thousand
MW.h per year.
Using the methodology of the Intergovernmental Panel of Climate Change (IPCC), and
official statistics, it has been possible to estimate the potential for methane and
electricity production from municipal solid waste of the city of Sao Paulo, its
metropolitan area, as well as to the State of São Paulo and Brazil, presented at Table 6.
Table 7. Estimates of methane production and electric power of Municipality,
Metropolitan Region, State of São Paulo and Brazil, according to the IPCC.
Places Population Methane waste Gg CH4/year
kW.h Methane sewage Gg CH4/year
kWh
Municipality of São Paulo
10,886,518 62.261 147,826,248 3,973.579 18,868.951
Metropolitan region
19,956,590 114.134 270,987,274 7,284,155 34,589.565
State of São Paulo
41,262,199 235.982 560,292,656 15,060,703 71,517.303
Brazil 190,732,694 1,090.817 2,589,928,075 69,617,433 330,585.577
Source: the authors, based on IBGE, 2010 and IPCC, 1996.
BIOMETHANE- BIOGAS PURIFICATION
Biogas purification is normally used to provide biomethane, a gas richer in methane
than biogas, to improve their specific energy, when a technical-economic evaluation
indicates its viability. Some small production of biogas is sometimes used as a fuel for
domestic use and is not treated. After the production it is collected in a plastic bag
collector and sent to domestic use, sometimes just after a water condensation.
For biogas production in a higher scale the biogas is normally treated. The most
traditional way to improve gas quality is by absorption, or popularly, washing. Washing
also prevents corrosion in the system. Washing normally splits the gas flow in two
others: one rich in methane for energy purposes and other rich in CO2 with small
amounts of H2S.

44
The most traditional way to purify biogas is by solvent washing. Normal solvents
include amines, hot potassium carbonate/bicarbonate and less commonly water,
ammonia and methanol. Since H2S has a higher solubility than CO2, it is also eliminated
from biomethane during washing. Solvent selection depends on flow rate and
operating pressure. As a general rule, CO2 solubility increases with pressure increase
and temperature decrease.
Process conditions depend also on the final use of the gas: if methane will be used in
cylinders to move vehicles, a final pressurization of at least 200 atm is required. At this
condition methane hydrate crystallizes and can clog valves. This way, after the CO2
removal, the biomethane has to be dried. Zeolites adsorption column are normally used
for this. In this case it is viable to clean the biogas at a higher pressure, 20 to 40 atm, for
instance. For this application, a large biogas production is normally found and the
normal solvent utilized are amines (MEA, MDEA, etc.), cold ammonia, methanol, and
hot potash carbonate.
For use in gas lines and in boilers and other combustion equipment to generate heat, a
low pressure, normally at c.a 7 atm is used for cleaning process. At that pressure, the
solvents usually used are water, amines and, sometimes hot potash carbonate. Figure 1,
can help in process selection.
Basically, the washing process is realized in two columns, where the first one absorbs
CO2 and the second regenerates the solvent by a stripping process. Figure 2 is a typical
biogas cleaning system.
Column 1 is a pressurized absorber for CO2 where a liquid, pure or a solution collects
this gas from CO2. The CO2 rich solvent is then sent to a stripping column where a flow
of steam (or air) removes the gas form the solvent that returns to the first column.
Water can be used in systems that treat low fluxes, but there are others solvents where
CO2 has a higher solubility or suffer a reversible reaction. Methanol is a physical solvent
that is normally used at cold conditions and high pressure to improve CO2 solubility.

45
Figure 4. selection base for optimum process (Souza,2008)
Figure 5. A schematic typical process for CO2 removal (Font: this paper)
There are several amines that can be used to CO2 removal, being monoethanolamine
(MEA), diethanolamine (DEA) and methyl-diethanolamine (MDEA) the most common.
Table 7 presents a comparison of the processes. Amine reaction with CO2 is exothermic
and there is an increase on temperature. Table 8 present the heat of reaction of some
solvents. Heat of reaction is an important parameter since the reaction has to be
reversed in the stripping column, therefore consuming heat. As high is the heat of
reaction more energy must be introduced in the stripping column.
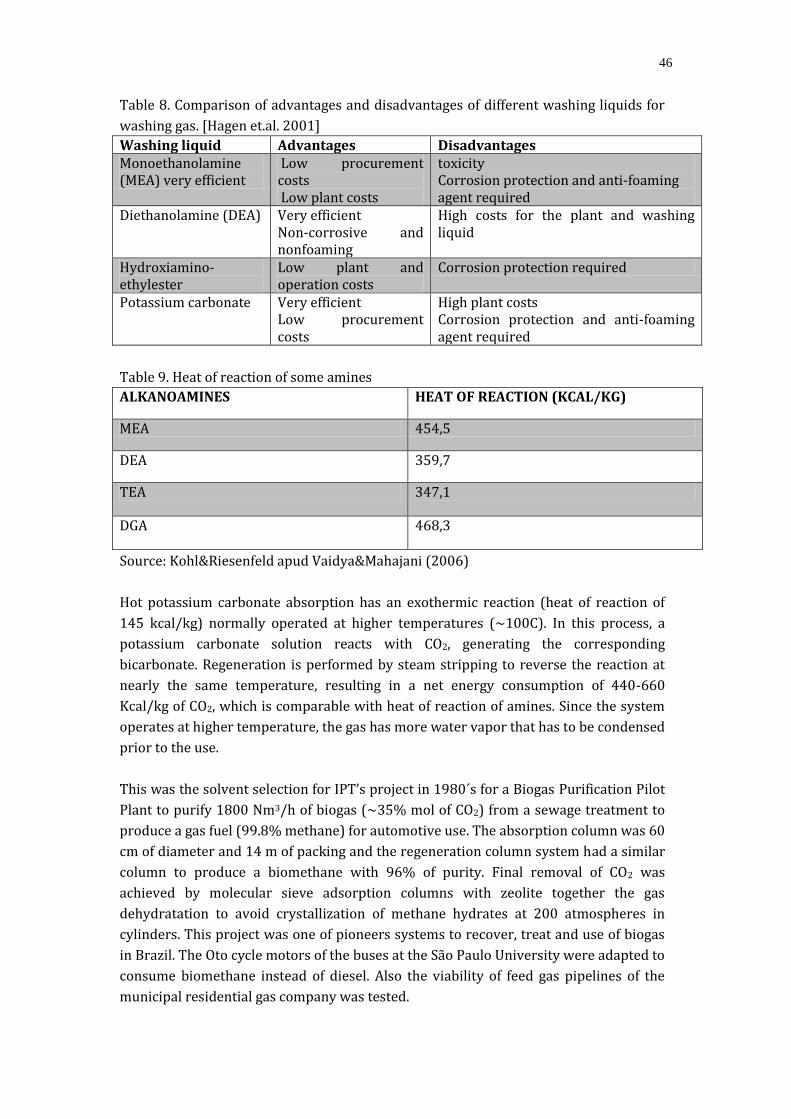
46
Table 8. Comparison of advantages and disadvantages of different washing liquids for
washing gas. [Hagen et.al. 2001]
Washing liquid Advantages Disadvantages Monoethanolamine (MEA) very efficient
Low procurement costs Low plant costs
toxicity Corrosion protection and anti-foaming agent required
Diethanolamine (DEA) Very efficient Non-corrosive and nonfoaming
High costs for the plant and washing liquid
Hydroxiamino-ethylester
Low plant and operation costs
Corrosion protection required
Potassium carbonate Very efficient Low procurement costs
High plant costs Corrosion protection and anti-foaming agent required
Table 9. Heat of reaction of some amines
ALKANOAMINES HEAT OF REACTION (KCAL/KG)
MEA 454,5
DEA 359,7
TEA 347,1
DGA 468,3
Source: Kohl&Riesenfeld apud Vaidya&Mahajani (2006)
Hot potassium carbonate absorption has an exothermic reaction (heat of reaction of
145 kcal/kg) normally operated at higher temperatures (~100C). In this process, a
potassium carbonate solution reacts with CO2, generating the corresponding
bicarbonate. Regeneration is performed by steam stripping to reverse the reaction at
nearly the same temperature, resulting in a net energy consumption of 440-660
Kcal/kg of CO2, which is comparable with heat of reaction of amines. Since the system
operates at higher temperature, the gas has more water vapor that has to be condensed
prior to the use.
This was the solvent selection for IPT’s project in 1980´s for a Biogas Purification Pilot
Plant to purify 1800 Nm3/h of biogas (~35% mol of CO2) from a sewage treatment to
produce a gas fuel (99.8% methane) for automotive use. The absorption column was 60
cm of diameter and 14 m of packing and the regeneration column system had a similar
column to produce a biomethane with 96% of purity. Final removal of CO2 was
achieved by molecular sieve adsorption columns with zeolite together the gas
dehydratation to avoid crystallization of methane hydrates at 200 atmospheres in
cylinders. This project was one of pioneers systems to recover, treat and use of biogas
in Brazil. The Oto cycle motors of the buses at the São Paulo University were adapted to
consume biomethane instead of diesel. Also the viability of feed gas pipelines of the
municipal residential gas company was tested.

47
In recent years other system were proposed to purify biogas. First of these systems
was the pressure swing adsorption (PSA). Since zeolites and activated carbon are good
adsorbers for CO2 and less efficient for methane these systems work with a good
separation.
Pressure swing process is an intermittent process with several steps (feed,
intermediate depressurization, blow down, purge, and pressurization), where two or
more adsorbing column operate intermittently. Since this process works by
pressurization/ depressurization there is a loss of biomethane from the system, which
has to be conducted to a flare. In this process biogas normally has to be previously
treated to remove H2S and to remove the most part of the water. One example of this
system commercially avaiable produces a gas according to Figure 3.
Membrane is the other new technology that can be used in biogas purification.
Membrane separation is based in sieving gases by molecular diameter. As in the other
sieving process they operate based in a high pressure drop for separation. Poly ether
sulfones (PES) is one the regular membrane materials for that. As all other membrane
process, some fugitive particle and mist can clog the surface, reducing the separation
efficiency, and has to be avoided. Selectivity is of major importance. Table 9 presents
selectivity of some membranes, presented by KUSWORO et al, 2010.
Figure 6. Pressure swing biogas purification
Table 10.Biogas permeability and selectivity in the PES-Carbon nanotubes mixed
matrix membranes
MEMBRANE Single gas permeance (GPU) (1) Selectivity CO2 CH4 CO2/CH4
PES neat membrane 33.45±0.78 1.45±0.78 23.07 PES-unmodified CNTS (2) membrane
37.79±0.78 1.94±0.14 19.48
PES-modified CNTS membrane 54.03±0.78 1.60±0.04 33.76
(1)GPU=1x10⁻⁶ cm3 STP)/cm2s cmHg (2) Carbon nanotubes
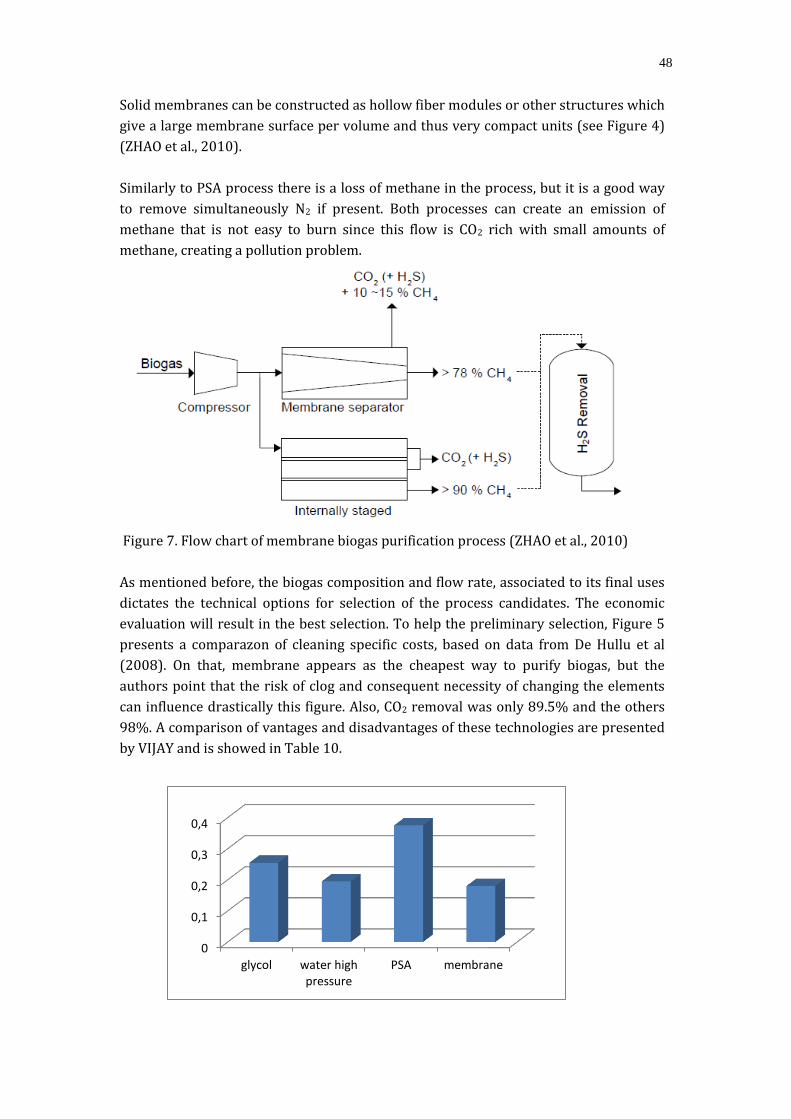
48
Solid membranes can be constructed as hollow fiber modules or other structures which
give a large membrane surface per volume and thus very compact units (see Figure 4)
(ZHAO et al., 2010).
Similarly to PSA process there is a loss of methane in the process, but it is a good way
to remove simultaneously N2 if present. Both processes can create an emission of
methane that is not easy to burn since this flow is CO2 rich with small amounts of
methane, creating a pollution problem.
Figure 7. Flow chart of membrane biogas purification process (ZHAO et al., 2010)
As mentioned before, the biogas composition and flow rate, associated to its final uses
dictates the technical options for selection of the process candidates. The economic
evaluation will result in the best selection. To help the preliminary selection, Figure 5
presents a comparazon of cleaning specific costs, based on data from De Hullu et al
(2008). On that, membrane appears as the cheapest way to purify biogas, but the
authors point that the risk of clog and consequent necessity of changing the elements
can influence drastically this figure. Also, CO2 removal was only 89.5% and the others
98%. A comparison of vantages and disadvantages of these technologies are presented
by VIJAY and is showed in Table 10.
0
0,1
0,2
0,3
0,4
glycol water high pressure
PSA membrane

49
Figure 8. Cost (US$ per Nm3/h of biogas)
Table 11. Vantages and disadvantages of the cleaning gas processes (VIJAY)
BIOSYNGAS - BIOMASS GASIFICATION OVERVIEW
Since the 1973 oil crisis, IPT has been working on R&D&I projects aiming at evaluating
the viability of use of alternative energy sources, especially the conversion of solid fuels
into gas. In the case of biomass, one of the Institute main focuses, gasification is seen as
a mitigation tool for greenhouse gas emissions, mainly CO2.
An average-sized (4Mt sugarcane) sugar/ethanol producer generates 800,000 tons of
dry biomass per year. There are some well-established uses for it, but new more
profitable and environmentally friendly alternatives deserve to be explored. Assuming
that only half of the bagasse is available for gasification, 400,000 tons per year still
means a 200MW plant, making industrial scale gasification possible. Gasification
produces syngas which can then be turned into biofuels (hydrogen, ethanol, jet fuel,
diesel – Fischer Tropsch process), energy (electricity), Fertilizer (ammonia, urea,
ammonium nitrate), fine chemicals, biopolymers (PP, PE). It has higher energy
efficiency when compared to other uses of bagasse and can produce important base
chemicals.
Gasification is very sensible to raw materials, allowing for local development. The
greatest challenge is to overcome the initial investment barrier, initially evaluated at
US$ 3.0/W whereas it is required to be US$ 1.2/W, in order to make gasification a
commercially competitive technology.

50
BIOSYNGAS DESCRIPTION PILOT PLANT
Given this great potential, but a lack of immediate economical feasibility, IPT (São
Paulo State Research Institute) is coordinating a project to build a 2.5MWth biomass
gasification pilot plant with three large Brazilian companies ESALQ (Luiz de Queiroz
College of Agriculture), at University of São Paulo, provided an area in its campus for
the Pilot Plant construction in the city of Piracicaba (SP), where the largest Brazilian
sugarcane producers are located. ESALQ will also participate in joint scientific research
related to the Project.
The project will be supported by São Paulo State Government, BNDES (Brazilian
Development Bank), FINEP (Research and Projects Financing), IPT and the industrial
partners. During its operation, satellite projects shall be financed by FAPESP (São Paulo
Research Foundation). The whole project current budget is estimated in R$ 80 million
(about US$40 million).
INDUSTRIAL PLANT
The ultimate goal of the gasification pilot plant is the acquisition of sufficient know-
how to allow for the construction of an economically viable industrial plant. Given this
fact, different tests and research programs should be carried in the pilot plant, where
technical viability and optional solutions is the main concern.
Considering the processing of 800.000 t/year of moist bagasse and using the afore-
mentioned assumptions, the data on Table 11 were calculated:
Table 12. Main energy generation/consumption
industrial plant: 800 000 t bagasse/year Bio-coal Bio-oil
Bagasse input (50% moisture) [kg/h] 91.324,2 91.324,2
Plant power MWth 206 202
Syngas output [kg/h] 22.570 22.420
Electrical energy requirement [kW] 16.602 21.763
NG mass flow [kg/h] 1432,7 636,8
Source:the authors
The main reduction in energy consumption is placed in the drying and shift stages,
bringing the total efficiency to 55 and 56% for bio-coal and bio-oil respectively.
TECHNICAL AND ECONOMIC FEASIBILITY STUDY
A Technical and Economic Feasibility study was conducted by IPT researcher Abraham
Yu for the implementation of a 648 MWth gasification plant producing green diesel
using Fischer-Tropsch process. This study is based on the projections of the cost of
bagasse and the price of diesel oil in Brazil between 2020 and 2030. This diesel price is
estimated based on a study by the California Energy Commission (CEC) (CEC, 2009).

51
As a pessimistic scenario, we considered a high price of bagasse (70 US$/ton) and a
lower price of diesel (1.5 US$/liter) were considered, therefore, reducing the
competitiveness of the gasification plant. For the optimistic scenario, it was considered
a lower price of bagasse (30 US$/ton) and a higher diesel prices (2.1 US$/liter), and
consequently increasing the competitiveness of the gasification plant.
The diesel produced by the Fischer-Tropsch process as green diesel in order to
distinguish it from well-known biodiesel. The green diesel produced is considered a
drop-in fuel by having exactly the same characteristics as petroleum-based diesel.
Other scenario parameters in this feasibility study are: energy efficiency (bagasse to
green diesel) of the gasification plant - 55% (optimistic), 45% and 35% (pessimistic) -
and the number of operational months in a year. This parameter determines the size
the gasification plant, since the total amount of bagasse is assumed to be fixed.
For a gasification plant with a capacity of 647 MWth, processing 1.6 million tons of
bagasse per year and operating at an energy efficiency of 55%, it was found that the
return on investment (ROI) is 114% in the expected scenario, and in an optimistic
scenario the ROI is 286% (see Table 12).
Table 13. Comparison of different scenarios - investment total NPV. Source: IPT (2012)
Scenario Total capital investment (M US$ 2010)
Net present value (NPV) (M US$)
Return on investment (ROI)
Optimistic 549 786 286%
Expected 689 334 114% Pessimistic 917 -2 -1%
A series of sensitivity analyses has been carried out in order to estimate the minimum
price of petroleum that would make the gasification plant infeasible. These analyses
started with the Expected Scenario. For oil prices above $ 66/barrel, the Net Present
Value (NPV) is positive, i.e., the plant would have a positive profit margin. For a ROI
requirement of 25% (industrial standard ROI for investments in petrochemical plant),
the price of oil will has to be $ 81/barrel. The values of Pessimistic Scenario were then
introduced gradually. Reducing the energy efficiency of the gasification plant from 45%
to 35% and keep fixed the rest of the parameters of the expected scenario, the price of
oil has to be U.S. $ 97/barrel in order to have ROI=0. If in addition we demand an ROI of
25% is demanded, the price of oil should be at least $ 117/barrel.
PHYSICAL AND CHEMICAL CHARACTERIZATION OF BIOMASS
For the use of biomass in the various processes of transformation into energy is
important to know its composition.
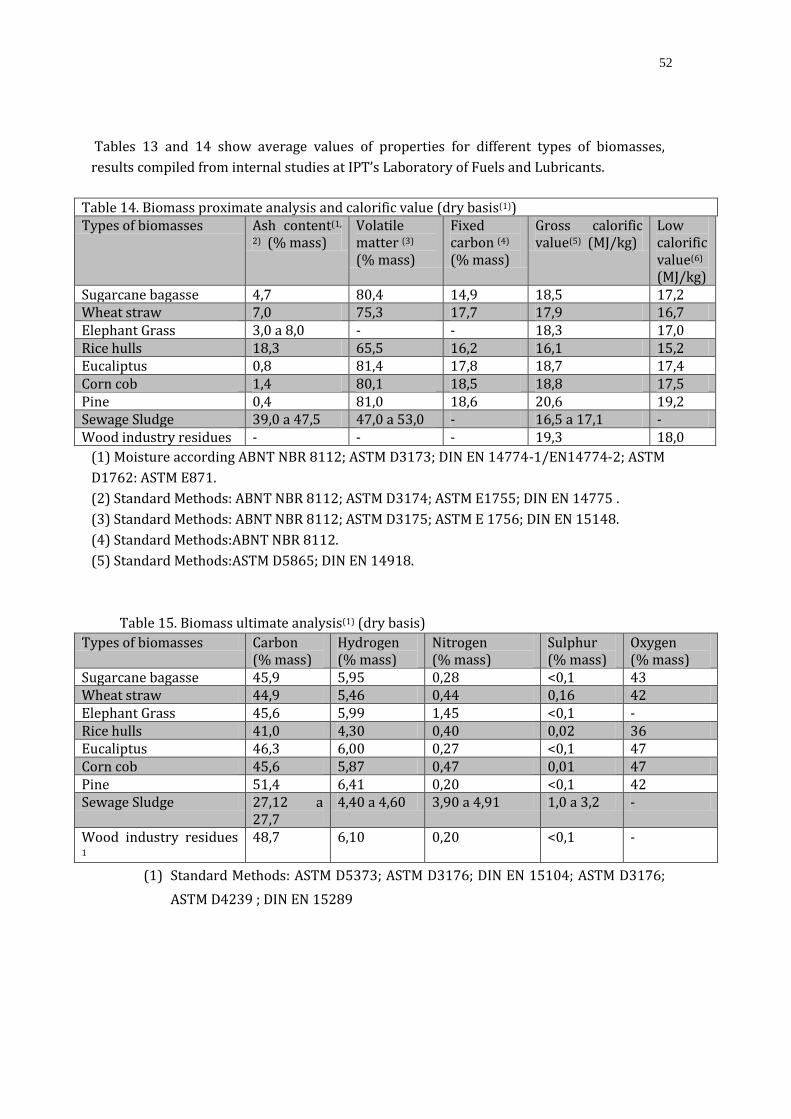
52
Tables 13 and 14 show average values of properties for different types of biomasses,
results compiled from internal studies at IPT’s Laboratory of Fuels and Lubricants.
Table 14. Biomass proximate analysis and calorific value (dry basis(1)) Types of biomasses Ash content(1,
2) (% mass) Volatile matter (3) (% mass)
Fixed carbon (4) (% mass)
Gross calorific value(5) (MJ/kg)
Low calorific value(6) (MJ/kg)
Sugarcane bagasse 4,7 80,4 14,9 18,5 17,2 Wheat straw 7,0 75,3 17,7 17,9 16,7 Elephant Grass 3,0 a 8,0 - - 18,3 17,0 Rice hulls 18,3 65,5 16,2 16,1 15,2 Eucaliptus 0,8 81,4 17,8 18,7 17,4 Corn cob 1,4 80,1 18,5 18,8 17,5 Pine 0,4 81,0 18,6 20,6 19,2 Sewage Sludge 39,0 a 47,5 47,0 a 53,0 - 16,5 a 17,1 - Wood industry residues - - - 19,3 18,0
(1) Moisture according ABNT NBR 8112; ASTM D3173; DIN EN 14774-1/EN14774-2; ASTM
D1762: ASTM E871.
(2) Standard Methods: ABNT NBR 8112; ASTM D3174; ASTM E1755; DIN EN 14775 .
(3) Standard Methods: ABNT NBR 8112; ASTM D3175; ASTM E 1756; DIN EN 15148.
(4) Standard Methods:ABNT NBR 8112.
(5) Standard Methods:ASTM D5865; DIN EN 14918.
Table 15. Biomass ultimate analysis(1) (dry basis)
Types of biomasses Carbon (% mass)
Hydrogen (% mass)
Nitrogen (% mass)
Sulphur (% mass)
Oxygen (% mass)
Sugarcane bagasse 45,9 5,95 0,28 <0,1 43 Wheat straw 44,9 5,46 0,44 0,16 42 Elephant Grass 45,6 5,99 1,45 <0,1 - Rice hulls 41,0 4,30 0,40 0,02 36 Eucaliptus 46,3 6,00 0,27 <0,1 47 Corn cob 45,6 5,87 0,47 0,01 47 Pine 51,4 6,41 0,20 <0,1 42 Sewage Sludge 27,12 a
27,7 4,40 a 4,60 3,90 a 4,91 1,0 a 3,2 -
Wood industry residues 1
48,7 6,10 0,20 <0,1 -
(1) Standard Methods: ASTM D5373; ASTM D3176; DIN EN 15104; ASTM D3176;
ASTM D4239 ; DIN EN 15289
53
REFERENCE
CORTEZ, L. A. B.; LORA, E. E. S.; GÓMEZ, E. G. (Org). Biomassa para energia. Campinas:
Editora da UNICAMP, 2008. 732p.
CRAVEIRO, A. M.; SOARES, H. M.; SCHMIDELL NETTO, W. Technical aspects and cost
estimations for anaerobic systems treating vinasse and Breweri/Soft drinks
wastewaters. In: INTERNATIONAL SEMINAR ON ANAEROBIC TREATMENT IN
TROPICAL COUNTRIES, 1986, São Paulo. Proceedings São Paulo: Iawprc/Cetesb, 1986.
14p.
DE HULLU, J et al. Comparing different biogas upgrading techniques. Eindhoven:
Eindhoven University of Technology, 2008.
DEUBLEIN, D.; STEINHAUSER, A. Biogas from waste and renewable resources. 2nd ed.
Weinheim: Wiley_VCH, 2012. 550p
HAGEN, M.; POLMAN, E. Adding gas from biomass to the gas grid. Copenhagen: Danish
Gas Agency, 2001. p. 26-47. (Final report)
INSTITUTO DE PESQUISAS TECNOLOGICAS. Projeto conceitual desenvolvimento de
planta piloto para gaseificação de biomassas. São Paulo: IPT, 2012. (Relatório 129433-
205).
JENKINS, B. M. et.al. Combustion properties of biomass. Fuel Processing Technology,
v.54, n.1, p.17-46, 1998.
JOHANSSON, T. B. et al. Renewable energy sources for fuels and electricity. Washington:
Island Press, 1993. 1160p.
JORDÃO, E. P.; PESSOA, C. A. Tratamento de esgotos domésticos. 3. ed. São Paulo: ABES,
1995. 720p.
LUCAS JUNIOR, J.; SOUZA, C. F.; LOPES, J. D. S. Manual de construção e operação de
biodigestores. Viçosa: CPT, 2003. v. 1. 40 p.
PEDROSA, M. M. Bio-óleo e biogás da degradação termoquímica de lodo de esgoto
doméstico em cilindro rotativo. 2011. 210f. Tese (Doutorado em Engenharia Química)
– Departamento de Engenharia Química, Universidade Federal do Rio Grande do Norte,
Rio Grande do Norte, 2011.
SALOMON, K. R.; LORA, E. S. Estimate of the electric energy generating potential for
different sources of biogas in Brazil. Biomass and Bioenergy, v.33, n.9, p.1101-1107,
Sept. 2009.
ZHAO, Q. E. et al. Purification technologies for biogas generated by anaerobic digestion.
Puyallup: CSANR, 2010. (Research Report)
54
Energy Efficiency in Brazil and in the State of São Paulo
- Electricity –
Sergio Valdir Bajay
Interdisciplinary Centre for Energy Planning, State University of Campinas
Campinas, SP, Brazil
Sidnei Amano
WEG Motors
São Paulo, SP, Brazil
INTRODUCTION
In order to provide an adequate background for the other sections of this paper, the
next section presents a brief overview of energy efficiency legislation in Brazil and the
federal government programs concerning electricity conservation.
The government of the State of São Paulo launched this year the Energy Plan for the
State of São Paulo – PPE 2020 (SEE, 2012), which presents electricity saving potentials
for 2020. This paper shows these estimated potentials by electricity end uses and
through optimized energy management schemes. The largest share of these potential
savings is found with electrical motors.
The State University of Campinas, located in Campinas, State of São Paulo, leads five
other universities, from various regions of Brazil, in the Eficind project, a prospective
study of potential energy efficiency gains in the country. The objectives, methodology
and expected outcomes of this study are summarized here.
WEG, a Brazilian company with factories in 12 countries and sales to over 110
countries, is the largest manufacturer of electric motors in the world. It is a leading
company in the production of efficient electric motors, speed controls for such motors
and automation systems. This paper reports some of the technical advances achieved
by WEG in recent years, as well as examples of electricity savings obtained in several
industrial branches using efficient motors manufactured by WEG.
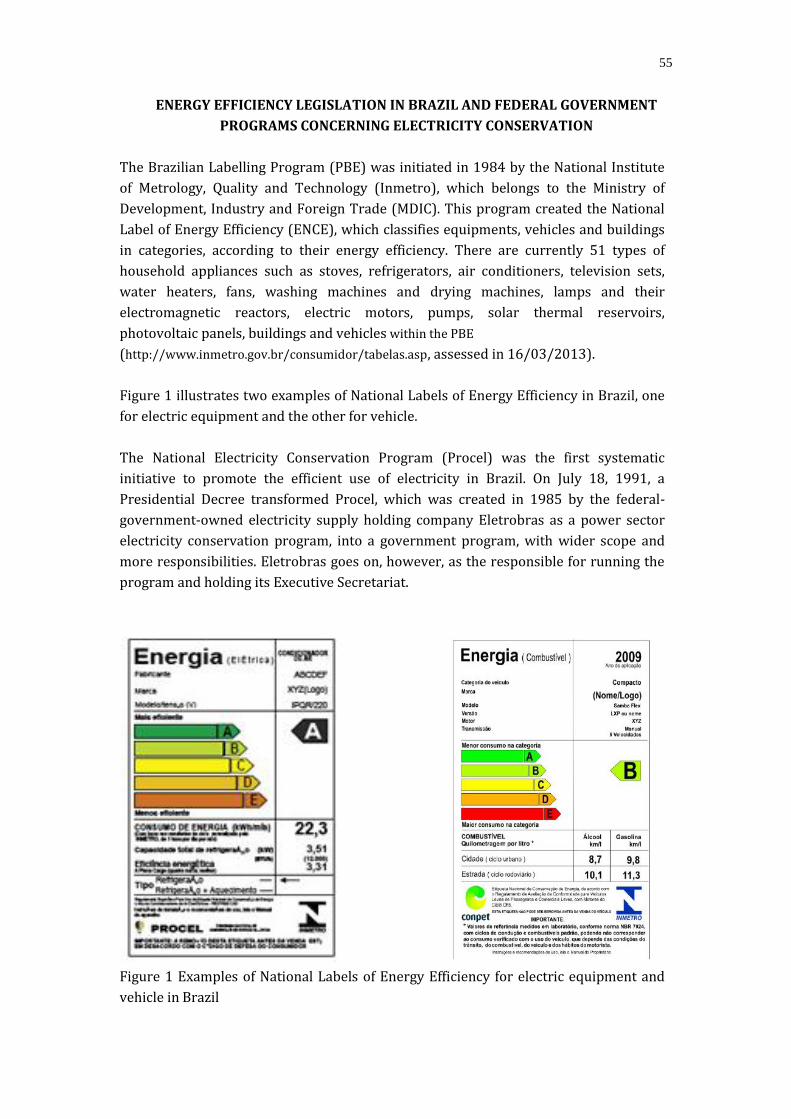
55
ENERGY EFFICIENCY LEGISLATION IN BRAZIL AND FEDERAL GOVERNMENT
PROGRAMS CONCERNING ELECTRICITY CONSERVATION
The Brazilian Labelling Program (PBE) was initiated in 1984 by the National Institute
of Metrology, Quality and Technology (Inmetro), which belongs to the Ministry of
Development, Industry and Foreign Trade (MDIC). This program created the National
Label of Energy Efficiency (ENCE), which classifies equipments, vehicles and buildings
in categories, according to their energy efficiency. There are currently 51 types of
household appliances such as stoves, refrigerators, air conditioners, television sets,
water heaters, fans, washing machines and drying machines, lamps and their
electromagnetic reactors, electric motors, pumps, solar thermal reservoirs,
photovoltaic panels, buildings and vehicles within the PBE
(http://www.inmetro.gov.br/consumidor/tabelas.asp, assessed in 16/03/2013).
Figure 1 illustrates two examples of National Labels of Energy Efficiency in Brazil, one
for electric equipment and the other for vehicle.
The National Electricity Conservation Program (Procel) was the first systematic
initiative to promote the efficient use of electricity in Brazil. On July 18, 1991, a
Presidential Decree transformed Procel, which was created in 1985 by the federal-
government-owned electricity supply holding company Eletrobras as a power sector
electricity conservation program, into a government program, with wider scope and
more responsibilities. Eletrobras goes on, however, as the responsible for running the
program and holding its Executive Secretariat.
Figure 1 Examples of National Labels of Energy Efficiency for electric equipment and
vehicle in Brazil
56
There is a “Procel Eletrobras seal”, granted to all equipments belonging to the highest
efficiency group of the ENCE label classification (category A)5. An estimate of total
electricity savings of 6,696 GWh is accredited to Procel in 2011, mostly due to the
Procel Eletrobras seal subprogram, which induces the consumer to buy the most
efficient equipments. These savings corresponded to 1.56% of the electricity
consumption in the country during that year (Procel, 2012).
The savings accruing from the other subprograms of Procel – Procel Information,
Procel Education, Procel in Buildings, Procel in Public Buildings (Procel EPP), Energy
Management for Municipalities (Procel GEM), Procel in Industry, Public illumination
(Procel RELUZ) and Procel in Sanitation – are more difficult and less precise to
estimate; their main contribution has been in the building up of an energy
conservations culture in the several layers of Brazilian society and the spreading of
information and data about technologies, measures and available incentives to achieve
electricity savings.
According to Act no. 9991, of July 24th, 2000, the electricity distribution utilities in
Brazil should apply, every year, 0.5% of their net operating revenue on Energy
Efficiency Programs (PEE’s), which are regulated by the National Agency of Electric
Energy (ANEEL).
The Handbook of Energy Efficiency Programs, approved by Resolution ANEEL no. 300,
of February 12th, 2008, and revised in 2012, accepts projects yielding electricity
savings in the following categories: trade and services; government; public services;
municipal energy management; residential sector; low income households; rural
activities; educational projects; industry; cogeneration projects; projects on the supply
side; pilot projects; priority projects; and cooperative projects (ANEEL, 2008).
Act no. 12212, of January 20th, 2010, mandates that 60% of the PEE’s resources should
be invested with low income families.
In 2011, 63 utilities and 38 rural electrification cooperatives invested R$ 385 millions
in their Energy Efficiency Programs (PEE’s). From 1998, when the first PEE’s started, to
2012, R$ 4.6 billion were invested in these programs, producing electricity savings of
8.5 TWh/year and withdrawing 2.5 GW from the peak demand (ANEEL, 2012).
ANEEL (2012) divides the development of the PEE’s in two phases, the first one from
1998 to 2007 and the second one from 2008 onwards. The average unit cost of the
energy efficiency measures in the first phase was R$ 69.18/MWh. The effects of the
5 In 2011, the Procel Eletrobras Seal was granted to 3,784 different models of equipment. At that
year, 20 National Energy Conservation Labels were granted to residential, commercial, public, and
service related buildings.
57
application of Law 12212 increased this average unit cost in the second phase to R$
199.85/MWh.
Act no. 10295, from October 17th, 2001, delegates to the federal government the
prerogative to establish maximum levels of specific energy consumption, or minimum
efficiencies of equipment manufactured or sold in Brazil. Decree number 4059, of
December 19th, 2001, regulated this act and created the Managing Board of Indicators
and Levels of Energy Efficiency (CGIEE). The maximum levels of specific energy
consumption, or minimum energy efficiency of machines and appliances produced or
sold in the country should be established based on technical and economic feasibility
analyses, considering the useful lifespan of the machines and appliances.
The first equipment selected by CGIEE to be the object of specific regulation was the tri
phase electric motor, because of the large share it has in the demand for electricity in
the country - about 30% of the total consumption and 50% of industry’s consumption.
The equipments following suit have been the compact fluorescent lamps, refrigerators,
freezers, gas-fuelled water heaters, gas-fuelled stoves, air conditioners,
electromagnetic reactors for high-pressure sodium vapour and metallic vapour lamps,
and incandescent lamps.
POTENTIAL FOR ELECTRICITY SAVINGS IN THE STATE OF SÃO PAULO
The Energy Plan for the State of São Paulo – PPE 2020 (SEE, 2012) was prepared by the
State’s Secretary of Energy and approved by the State Energy Policy Council (CEPE)6 in
2012. The governor of the State launched the plan in early 2013.
In 2011 the Secretary of Energy produced a long-term energy plan for 2035 (SEE,
2011a), which was used as a background for this medium-term energy plan.
PPE 2020 presents energy demand and supply forecasts for 2020, contemplating the
main energy sources consumed as fuels, or employed to produce electricity in the State
of São Paulo. The plan also contemplates potential energy efficiency gains in end uses
of these fuels and electricity.
Several chapters of the plan put forward proposals for the strengthening of existing
energy policies, or the setting up of new energy policies for the State, with
corresponding targets, and the required actions to achieve them. One very positive
feature of this plan lies in the fact that the energy policies focused in the plan take into
account the most relevant public policies of other government secretaries in the State 6 The State of São Paulo Act no. 11248/2000, which created the Council, set, as one of its tasks, the
elaboration of such a plan. Another local piece of law, Decree no. 55947, which regulated Act no.
13798, responsible for setting up the State Policy for Climate Change, defines, in one of its
articles, the minimum content required for this plan.

58
that affect, or are affected by these policies. One of them, which influenced a lot the fuel
mix forecast and the energy efficiency measures proposed for the State in 2020, is the
State Policy for Climate Change and the corresponding target of CO2 emissions
reduction for that year.
A study carried out by the Secretary of Energy of the State of São Paulo in 2011 (SEE,
2011b) and reported in PPE 2020 estimated an electricity saving potential of 13.5 TWh
in 2020, corresponding to 7.9% of the total electricity demand forecast for the State in
that year. The cost to implement the measures required to achieve this saving was
estimated as US$ 456 million.
Table 1 shows the potential electricity savings pointed out by this study, by electricity
end uses and through optimized energy management schemes. The shares of each end
use are illustrated in Figure 2.
Table 1 Potential reduction in electricity consumption until 2020 in the State of São
Paulo, by electricity end uses and through optimized energy management
MWh
Electricity end uses
Power 3,872,192 Process heating with steam 204 Process heating – direct heating 17,450 Air conditioning 140,174 Water heating 535,559 Refrigeration 3,456,144 Electrochemical processes 1,227 Lighting 3,497,445 Other end uses 48
Subtotal 11,520,443 Optimized energy management 2,027,079 Total 13,547,522
Source: SEE (2012)
Figure 2 pinpoints that the largest share belongs to the end use “power”, produced by
electric motors.
The Secretary of Energy (2012) proposes 22 strategic actions to achieve the electricity
saving potential estimated in PPE 2020; 15 of them rely just upon the State
government, while 6 require articulations with the federal government and 1 with the
municipal governments within the State.
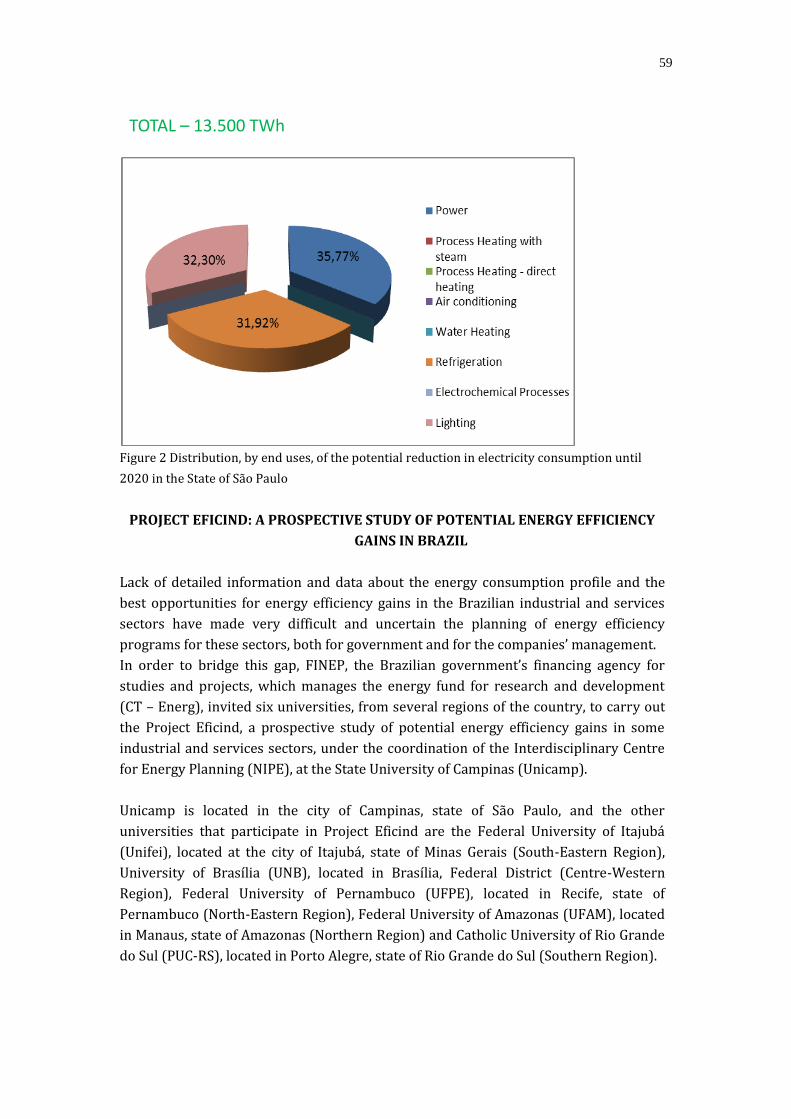
59
Figure 2 Distribution, by end uses, of the potential reduction in electricity consumption until
2020 in the State of São Paulo
PROJECT EFICIND: A PROSPECTIVE STUDY OF POTENTIAL ENERGY EFFICIENCY
GAINS IN BRAZIL
Lack of detailed information and data about the energy consumption profile and the
best opportunities for energy efficiency gains in the Brazilian industrial and services
sectors have made very difficult and uncertain the planning of energy efficiency
programs for these sectors, both for government and for the companies’ management.
In order to bridge this gap, FINEP, the Brazilian government’s financing agency for
studies and projects, which manages the energy fund for research and development
(CT – Energ), invited six universities, from several regions of the country, to carry out
the Project Eficind, a prospective study of potential energy efficiency gains in some
industrial and services sectors, under the coordination of the Interdisciplinary Centre
for Energy Planning (NIPE), at the State University of Campinas (Unicamp).
Unicamp is located in the city of Campinas, state of São Paulo, and the other
universities that participate in Project Eficind are the Federal University of Itajubá
(Unifei), located at the city of Itajubá, state of Minas Gerais (South-Eastern Region),
University of Brasília (UNB), located in Brasília, Federal District (Centre-Western
Region), Federal University of Pernambuco (UFPE), located in Recife, state of
Pernambuco (North-Eastern Region), Federal University of Amazonas (UFAM), located
in Manaus, state of Amazonas (Northern Region) and Catholic University of Rio Grande
do Sul (PUC-RS), located in Porto Alegre, state of Rio Grande do Sul (Southern Region).
TOTAL – 13.500 TWh
60
The objective of Project Eficind is the setting-up of a methodology, including the
mapping of technologies, processes and actions, to estimate energy efficiency technical,
economic and market potentials in pre-defined industrial and service branches, in
long-term energy planning studies carried out by the federal government.
The pre-defined industrial branches are food and beverages, chemistry, paper and
pulp, iron and steel, cement, ceramics, foundries, tyres, shoes and wood structures.
Shopping centres, supermarkets, hotels, hospitals and sanitation services are the
service branches dealt with in the project.
NIPE/Unicamp is finalizing detailed studies of technical, economic and energy profile
characterization of each of these branches, at a national level. The other universities
are complementing this work, for the regions were they are located.
Surveys of efficient technologies are being done by NIPE/Unicamp to complement the
technical characterization referred to above.
The energy efficiency technical, economic and market potentials will be estimated
based on an extensive technical literature survey and on broad field surveys.
To help the elaboration of these estimates, worksheets and computer models are being
employed to carry out technical and economic simulations. Databases are employed to
store the main information of the project.
The worksheets, the selection of computer models and the databases are developed by
NIPE/Unicamp, while most of the field surveys are responsibility of the other
universities.
A questionnaire available online in the world web was elaborated and tested by
NIPE/Unicamp to provide information for the project at a pre-energy-audit level.
Another, more detailed, questionnaire was also created and tested by NIPE/Unicamp,
now in the form of a worksheet, to receive data from energy audits and feed the
computer models employed in the project.
Besides the pre-energy-audit survey and the energy audits, the project also
contemplates some detailed energy optimization studies in parts of some industrial
and services premises, to be carried out by all the universities participating in the
project.
A detailed energy forecasting model was developed at Unicamp and starts to be applied
to each of the industrial and service branches studied in the project, in order to obtain
national demand forecasts with and without new energy conservation policies, using
the scenarios approach.
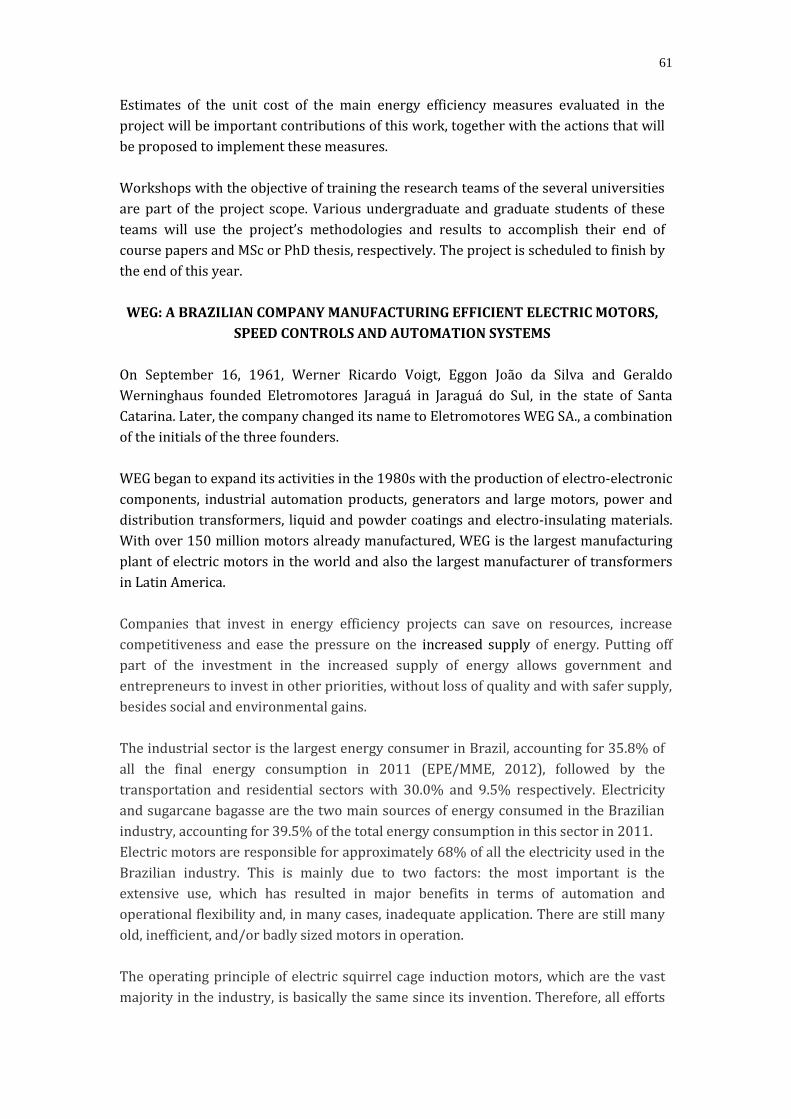
61
Estimates of the unit cost of the main energy efficiency measures evaluated in the
project will be important contributions of this work, together with the actions that will
be proposed to implement these measures.
Workshops with the objective of training the research teams of the several universities
are part of the project scope. Various undergraduate and graduate students of these
teams will use the project’s methodologies and results to accomplish their end of
course papers and MSc or PhD thesis, respectively. The project is scheduled to finish by
the end of this year.
WEG: A BRAZILIAN COMPANY MANUFACTURING EFFICIENT ELECTRIC MOTORS,
SPEED CONTROLS AND AUTOMATION SYSTEMS
On September 16, 1961, Werner Ricardo Voigt, Eggon João da Silva and Geraldo
Werninghaus founded Eletromotores Jaraguá in Jaraguá do Sul, in the state of Santa
Catarina. Later, the company changed its name to Eletromotores WEG SA., a combination
of the initials of the three founders.
WEG began to expand its activities in the 1980s with the production of electro-electronic
components, industrial automation products, generators and large motors, power and
distribution transformers, liquid and powder coatings and electro-insulating materials.
With over 150 million motors already manufactured, WEG is the largest manufacturing
plant of electric motors in the world and also the largest manufacturer of transformers
in Latin America.
Companies that invest in energy efficiency projects can save on resources, increase
competitiveness and ease the pressure on the increased supply of energy. Putting off
part of the investment in the increased supply of energy allows government and
entrepreneurs to invest in other priorities, without loss of quality and with safer supply,
besides social and environmental gains.
The industrial sector is the largest energy consumer in Brazil, accounting for 35.8% of
all the final energy consumption in 2011 (EPE/MME, 2012), followed by the
transportation and residential sectors with 30.0% and 9.5% respectively. Electricity
and sugarcane bagasse are the two main sources of energy consumed in the Brazilian
industry, accounting for 39.5% of the total energy consumption in this sector in 2011.
Electric motors are responsible for approximately 68% of all the electricity used in the
Brazilian industry. This is mainly due to two factors: the most important is the
extensive use, which has resulted in major benefits in terms of automation and
operational flexibility and, in many cases, inadequate application. There are still many
old, inefficient, and/or badly sized motors in operation.
The operating principle of electric squirrel cage induction motors, which are the vast
majority in the industry, is basically the same since its invention. Therefore, all efforts

62
were directed towards the development and improvement of the materials used, such
as the insulating materials or magnetic plates, and also the designing techniques and
manufacturing processes, which have made a big impact on efficiency, noise level,
weight and volume (see Figure 3).
Figure 3 Evolution of the size and weight of electric motors per kW of installed capacity
As shown in Figure 4, since Act no. 10295 passed in the Brazilian Congress, in 2001,
delegating to the federal government the prerogative to establish maximum levels of
specific energy consumption, or minimum efficiencies of equipment manufactured or
sold in Brazil, WEG has manufactured standard electric motors, meeting the mandated
minimum efficiency levels, and high efficiency motors. The requirements for these
minimum efficiency levels increased in 2009, compared to what was mandated in
2001. From time to time, these figures will be revised and new minimum limits will
require further development and investment in new technology and product
manufacturing processes.

63
Figure 4 Evolution of the regulation of electric motors in Brazil and WEG’s new
products
As the largest manufacturer of electric motors and drives in Brazil and one of the most
innovative companies in the country, WEG always seeks to develop solutions that add
value for its customers through innovative products and greater reliability and
efficiency (see Figure 5). WEG’s product portfolio includes motors with the highest
efficiency levels of the market, in accordance with IE3 and IE4 standards, and, with the
evolution of rare-earth magnets (NdFeB), the company made a technological leap
forward developing motors with permanent magnets for industrial applications.
Electrical Motor Efficiency(60HP 4 poles)
1980Efficiency: 90%
2010Efficiency: 95.1%
1990Efficiency: 90.2%
2000Efficiency: 93.9%
2010Efficiency: 96.5%
1960Efficiency: 88%
Evolution
ELECTRIC MOTOR TRENDS
Industrial Applications
Figure 5 Evolution of WEG’s electric motors efficiencies
Not Allowed
Premium
Meet Regulation
Super Premium
Market Differential
?
20XX
Not Allowed
W21 Standard
Meet Regulation
High Efficiency
Market differential
Not Allowed
W22 Plus
Meet Regulation
W22 Premium
Market Differential
Super Premium
Market Exclusivity
No regulation
exists
2001 2009
Law nº10.295 Directive nº 553
-In
cre
ase
in E
ffic
iency
-L
ess
Ene
rgy
Co
nsum
ptio
n
Think Green
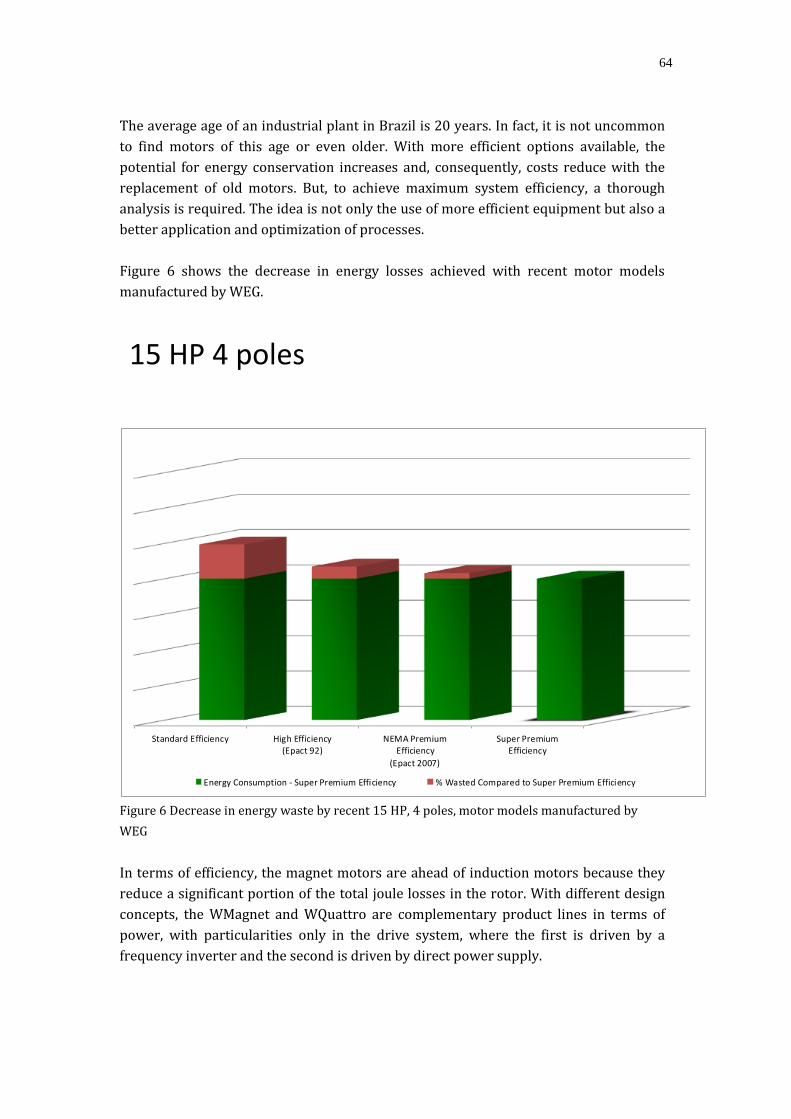
64
The average age of an industrial plant in Brazil is 20 years. In fact, it is not uncommon
to find motors of this age or even older. With more efficient options available, the
potential for energy conservation increases and, consequently, costs reduce with the
replacement of old motors. But, to achieve maximum system efficiency, a thorough
analysis is required. The idea is not only the use of more efficient equipment but also a
better application and optimization of processes.
Figure 6 shows the decrease in energy losses achieved with recent motor models
manufactured by WEG.
Figure 6 Decrease in energy waste by recent 15 HP, 4 poles, motor models manufactured by
WEG
In terms of efficiency, the magnet motors are ahead of induction motors because they
reduce a significant portion of the total joule losses in the rotor. With different design
concepts, the WMagnet and WQuattro are complementary product lines in terms of
power, with particularities only in the drive system, where the first is driven by a
frequency inverter and the second is driven by direct power supply.
Standard Efficiency High Efficiency(Epact 92)
NEMA PremiumEfficiency
(Epact 2007)
Super PremiumEfficiency
Energy Consumption - Super Premium Efficiency % Wasted Compared to Super Premium Efficiency
15 HP 4 poles
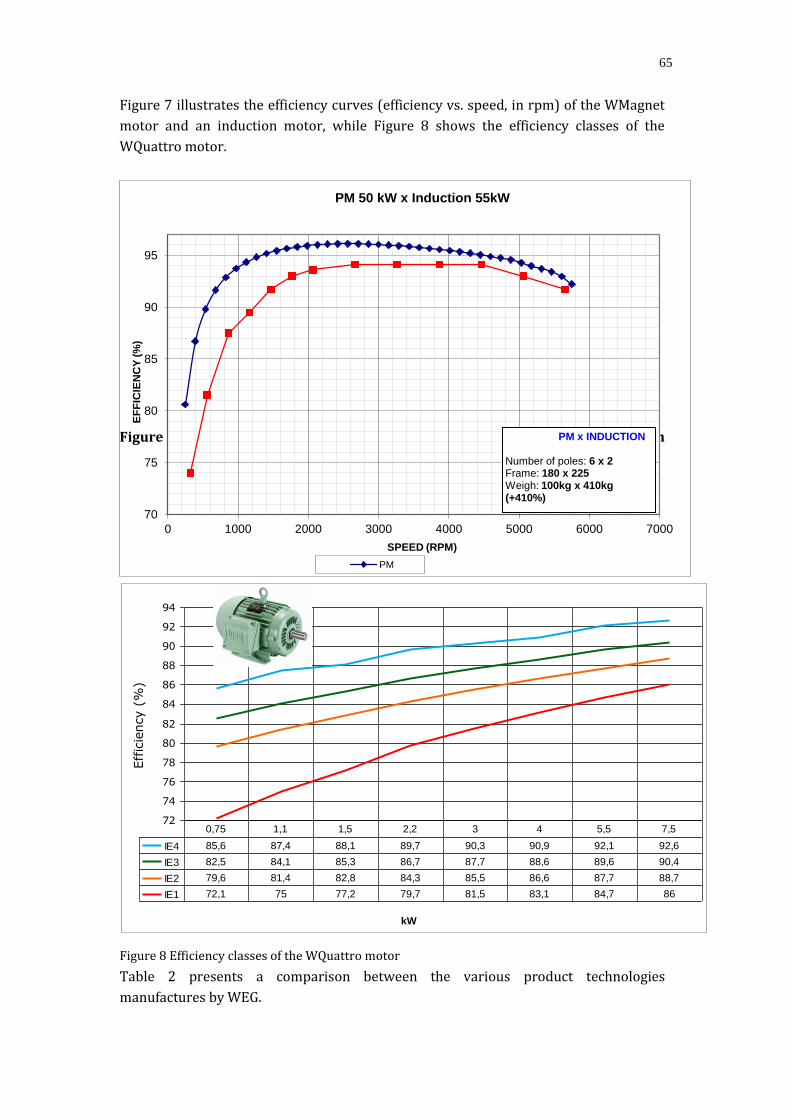
65
Figure 7 illustrates the efficiency curves (efficiency vs. speed, in rpm) of the WMagnet
motor and an induction motor, while Figure 8 shows the efficiency classes of the
WQuattro motor.
Figure 7 Efficiency curves of a 50 kW WMagnet motor and a 55 kW induction
model
Figure 8 Efficiency classes of the WQuattro motor
Table 2 presents a comparison between the various product technologies
manufactures by WEG.
72
74
76
78
80
82
84
86
88
90
92
94
kW
Eff
icie
ncy (
%)
IE4 85,6 87,4 88,1 89,7 90,3 90,9 92,1 92,6
IE3 82,5 84,1 85,3 86,7 87,7 88,6 89,6 90,4
IE2 79,6 81,4 82,8 84,3 85,5 86,6 87,7 88,7
IE1 72,1 75 77,2 79,7 81,5 83,1 84,7 86
0,75 1,1 1,5 2,2 3 4 5,5 7,5
70
75
80
85
90
95
0 1000 2000 3000 4000 5000 6000 7000
EF
FIC
IEN
CY
(%
)
SPEED (RPM)
PM 50 kW x Induction 55kW
PM
PM x INDUCTION Number of poles: 6 x 2 Frame: 180 x 225 Weigh: 100kg x 410kg (+410%)
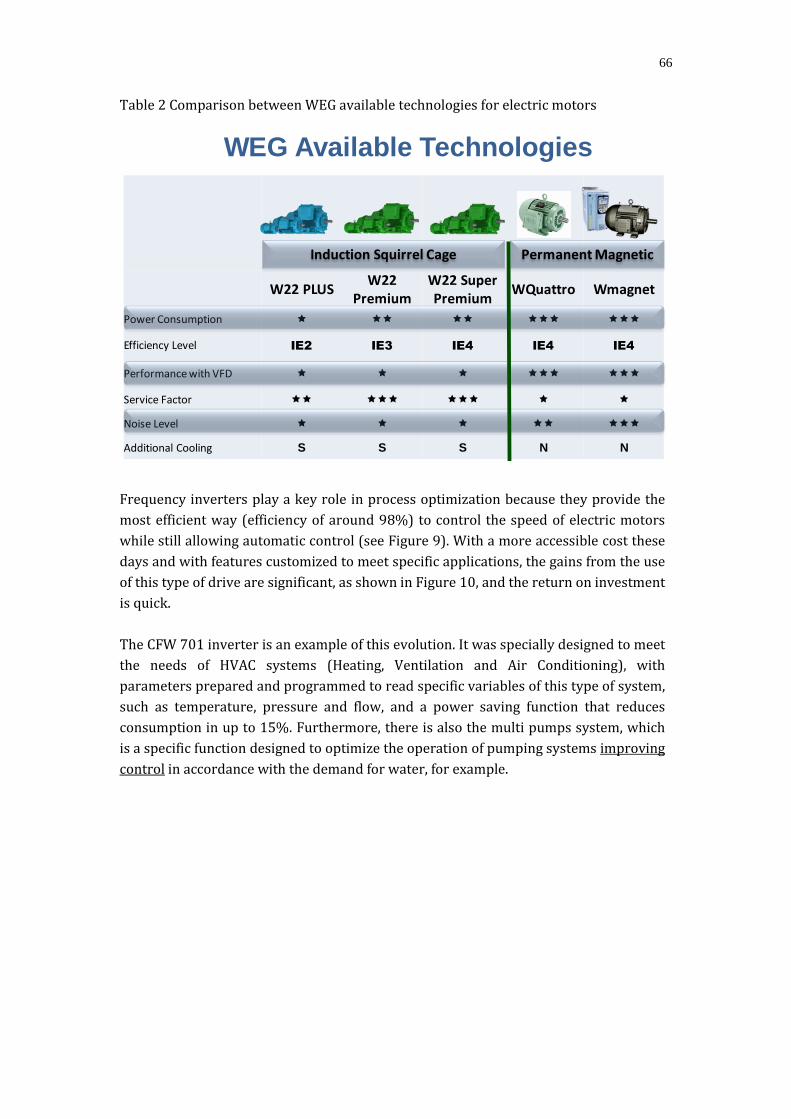
66
Table 2 Comparison between WEG available technologies for electric motors
Frequency inverters play a key role in process optimization because they provide the
most efficient way (efficiency of around 98%) to control the speed of electric motors
while still allowing automatic control (see Figure 9). With a more accessible cost these
days and with features customized to meet specific applications, the gains from the use
of this type of drive are significant, as shown in Figure 10, and the return on investment
is quick.
The CFW 701 inverter is an example of this evolution. It was specially designed to meet
the needs of HVAC systems (Heating, Ventilation and Air Conditioning), with
parameters prepared and programmed to read specific variables of this type of system,
such as temperature, pressure and flow, and a power saving function that reduces
consumption in up to 15%. Furthermore, there is also the multi pumps system, which
is a specific function designed to optimize the operation of pumping systems improving
control in accordance with the demand for water, for example.
W22 PLUSW22
PremiumW22 SuperPremium
WQuattro Wmagnet
Power Consumption
Efficiency Level IE2 IE3 IE4 IE4 IE4
Performance with VFD
Service Factor
Noise Level
Additional Cooling S S S N N
WEG Available Technologies
Induction Squirrel Cage Permanent Magnetic
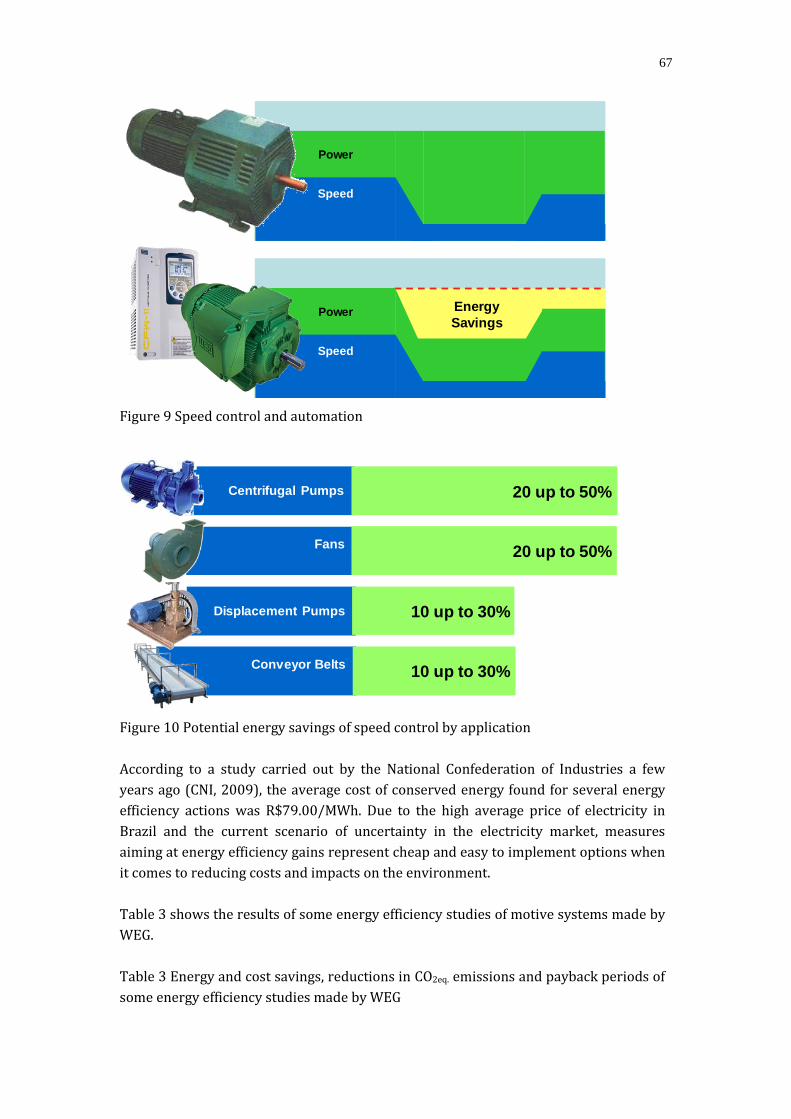
67
Figure 9 Speed control and automation
Figure 10 Potential energy savings of speed control by application
According to a study carried out by the National Confederation of Industries a few
years ago (CNI, 2009), the average cost of conserved energy found for several energy
efficiency actions was R$79.00/MWh. Due to the high average price of electricity in
Brazil and the current scenario of uncertainty in the electricity market, measures
aiming at energy efficiency gains represent cheap and easy to implement options when
it comes to reducing costs and impacts on the environment.
Table 3 shows the results of some energy efficiency studies of motive systems made by
WEG.
Table 3 Energy and cost savings, reductions in CO2eq. emissions and payback periods of
some energy efficiency studies made by WEG
Energy
Savings
Power
Speed
Power
Speed
Potential Energy Savings:
Displacement Pumps
Fans
Centrifugal Pumps
Conveyor Belts
20 up to 50%
20 up to 50%
10 up to 30%
10 up to 30%
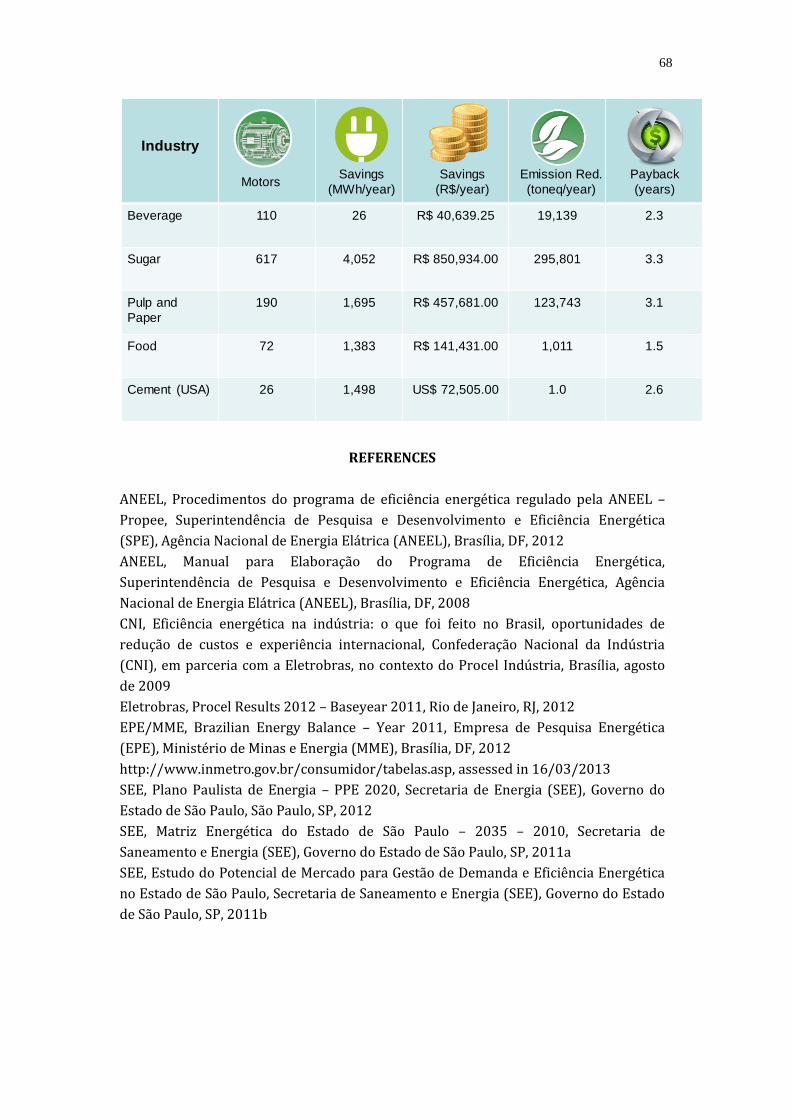
68
REFERENCES
ANEEL, Procedimentos do programa de eficiência energética regulado pela ANEEL –
Propee, Superintendência de Pesquisa e Desenvolvimento e Eficiência Energética
(SPE), Agência Nacional de Energia Elátrica (ANEEL), Brasília, DF, 2012
ANEEL, Manual para Elaboração do Programa de Eficiência Energética,
Superintendência de Pesquisa e Desenvolvimento e Eficiência Energética, Agência
Nacional de Energia Elátrica (ANEEL), Brasília, DF, 2008
CNI, Eficiência energética na indústria: o que foi feito no Brasil, oportunidades de
redução de custos e experiência internacional, Confederação Nacional da Indústria
(CNI), em parceria com a Eletrobras, no contexto do Procel Indústria, Brasília, agosto
de 2009
Eletrobras, Procel Results 2012 – Baseyear 2011, Rio de Janeiro, RJ, 2012
EPE/MME, Brazilian Energy Balance – Year 2011, Empresa de Pesquisa Energética
(EPE), Ministério de Minas e Energia (MME), Brasília, DF, 2012
http://www.inmetro.gov.br/consumidor/tabelas.asp, assessed in 16/03/2013
SEE, Plano Paulista de Energia – PPE 2020, Secretaria de Energia (SEE), Governo do
Estado de São Paulo, São Paulo, SP, 2012
SEE, Matriz Energética do Estado de São Paulo – 2035 – 2010, Secretaria de
Saneamento e Energia (SEE), Governo do Estado de São Paulo, SP, 2011a
SEE, Estudo do Potencial de Mercado para Gestão de Demanda e Eficiência Energética
no Estado de São Paulo, Secretaria de Saneamento e Energia (SEE), Governo do Estado
de São Paulo, SP, 2011b
Industry
Beverage 110 26 R$ 40,639.25 19,139 2.3
Sugar 617 4,052 R$ 850,934.00 295,801 3.3
Pulp and
Paper
190 1,695 R$ 457,681.00 123,743 3.1
Food 72 1,383 R$ 141,431.00 1,011 1.5
Cement (USA) 26 1,498 US$ 72,505.00 1.0 2.6
MotorsSavings
(MWh/year)
Savings
(R$/year)
Emission Red.
(toneq/year)
Payback
(years)

69
Thermodynamic, Thermoeconomic and Economic Analysis of
Integration of Straw Gasification and/or Stillage Biodigestion
in the Cogeneration System of a Sugar-Alcohol Factory
Ricardo Alan Verdú Ramos, Cassio Roberto Macedo Maia,
Emanuel Rocha Woiski, Newton Luiz Dias Filho, Rodnei Passolongo
NUPLEN - Núcleo de Planejamento Energético, Geração e Cogeração de Energia
Laboratório Associado ao Instituto de Pesquisa em Bioenergia da UNESP
UNESP - Campus de Ilha Solteira / Email: [email protected]
ABSTRACT
This work presents a thermodynamic, thermoeconomic and economic evaluation of the
incorporation of gasification and/or biodigestion systems in a sugar-ethanol factory.
Five configurations, combining the present actual cogeneration plant with straw
gasification and stillage biodigestion systems, are considered. Case 1 represents an
actual steam plant of a modern conventional power plant (base case), with a high-
pressure high-temperature steam boiler, an extraction-condensation steam turbine,
and with all mechanical equipment driven by electric power. In the other cases,
gasification systems are associated to the actual plant using the energy from a gas
turbine and a heat recovery steam generator to complete a combined cycle. In Case 2,
the incorporation of a system for biodigestion of stillage is experimented. In Case 3, the
incorporation of the sugar-cane straw gasification in the current plant is considered
and Case 4 considers the straw gasification and stillage biodigestion. Finally, Case 5
considers the straw gasification and stillage biodigestion in an idealized plant with
doubling cane crushing capacity and reduction of the process steam consumption with
respect to Case 4. Thermodynamic analysis takes into account mass balance and first
and second thermodynamics laws applied to each element of the plant. The
thermoeconomic analysis is based on the exergy cost theory, which involves the
balance of costs for each component of the system. For the economic analysis it is
adopted a technique that considers the influence of time on the investment value and
involves the concepts of cash flow, considering Net Present Value and Internal Rate of
Return to assess the financial performance of the projects. The results show that plants
with gasification promote a substantial increase in electricity generation and in the
efficiency of the plant. However, from the thermoeconomic and economic viewpoints,
the plants including gasification systems present higher costs of electricity and longer
payback periods.
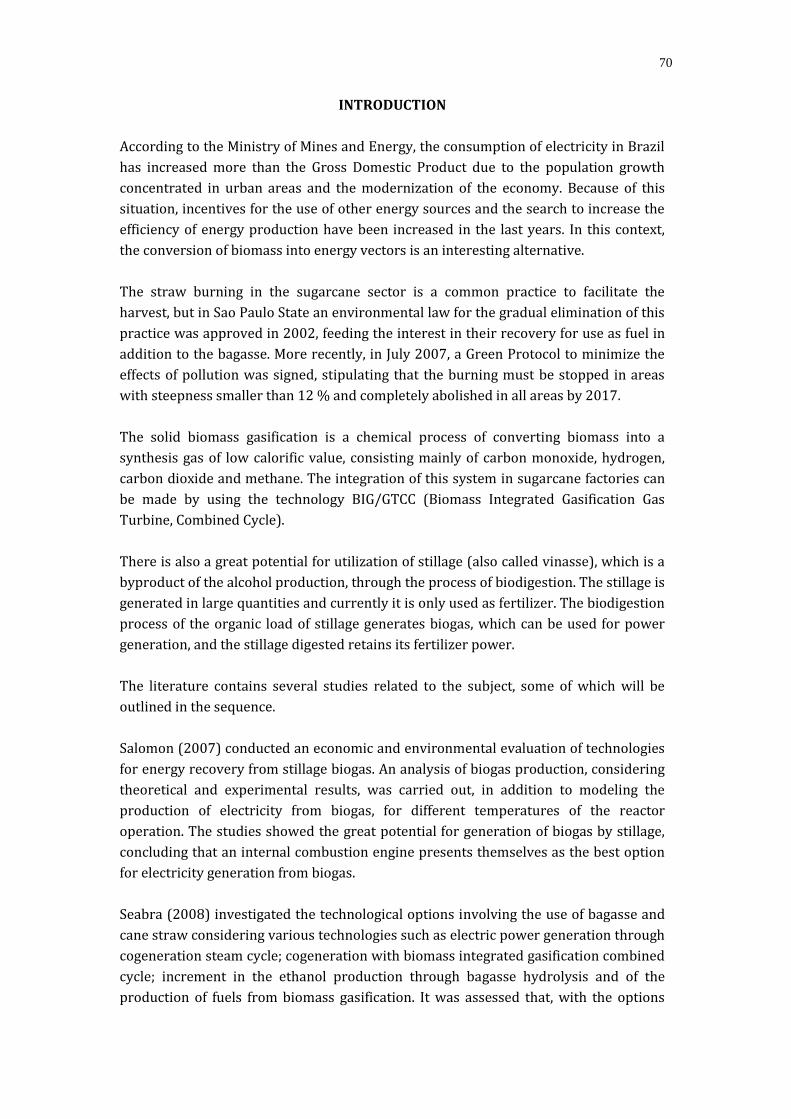
70
INTRODUCTION
According to the Ministry of Mines and Energy, the consumption of electricity in Brazil
has increased more than the Gross Domestic Product due to the population growth
concentrated in urban areas and the modernization of the economy. Because of this
situation, incentives for the use of other energy sources and the search to increase the
efficiency of energy production have been increased in the last years. In this context,
the conversion of biomass into energy vectors is an interesting alternative.
The straw burning in the sugarcane sector is a common practice to facilitate the
harvest, but in Sao Paulo State an environmental law for the gradual elimination of this
practice was approved in 2002, feeding the interest in their recovery for use as fuel in
addition to the bagasse. More recently, in July 2007, a Green Protocol to minimize the
effects of pollution was signed, stipulating that the burning must be stopped in areas
with steepness smaller than 12 % and completely abolished in all areas by 2017.
The solid biomass gasification is a chemical process of converting biomass into a
synthesis gas of low calorific value, consisting mainly of carbon monoxide, hydrogen,
carbon dioxide and methane. The integration of this system in sugarcane factories can
be made by using the technology BIG/GTCC (Biomass Integrated Gasification Gas
Turbine, Combined Cycle).
There is also a great potential for utilization of stillage (also called vinasse), which is a
byproduct of the alcohol production, through the process of biodigestion. The stillage is
generated in large quantities and currently it is only used as fertilizer. The biodigestion
process of the organic load of stillage generates biogas, which can be used for power
generation, and the stillage digested retains its fertilizer power.
The literature contains several studies related to the subject, some of which will be
outlined in the sequence.
Salomon (2007) conducted an economic and environmental evaluation of technologies
for energy recovery from stillage biogas. An analysis of biogas production, considering
theoretical and experimental results, was carried out, in addition to modeling the
production of electricity from biogas, for different temperatures of the reactor
operation. The studies showed the great potential for generation of biogas by stillage,
concluding that an internal combustion engine presents themselves as the best option
for electricity generation from biogas.
Seabra (2008) investigated the technological options involving the use of bagasse and
cane straw considering various technologies such as electric power generation through
cogeneration steam cycle; cogeneration with biomass integrated gasification combined
cycle; increment in the ethanol production through bagasse hydrolysis and of the
production of fuels from biomass gasification. It was assessed that, with the options

71
currently available, it could have obtained a generation of surplus power in excess of
140 kWh/tc, costing around US$ 55.00/MWh for systems with high pressure
cogeneration and use of some straw in conjunction with the bagasse. Going forward,
cogeneration systems with integrated gasification combined cycle biomass should
allow the levels of surplus to exceed 200 kWh/tc, but production costs should be also
higher (> US$ 75.00/MWh).
Romão Júnior (2009) examined the possibility of utilization of straw as a
supplementary fuel in sugar-alcohol factories. It was found that the use of straw as a
supplementary fuel to bagasse in conventional high pressure boilers is a good option to
increase the power generation to be exported, greatly increasing the final revenue.
Pellegrini and Oliveira Jr. Burbano (2010) presented some thermodynamic and
thermoeconomic comparative research on new technologies applied in sugar-alcohol
factories. The configurations studied include supercritical steam cycles, with high
pressure and steam temperature reaching 30 MPa and 600 °C, respectively, and
technologies for biomass gasification, considering atmospheric and pressurized
gasification. The technologies of supercritical cycles and atmospheric gasification allow
to generate electricity surplus of about 150 kWh/tc, whereas with pressurized
gasification could reach up to 202 kWh/tc surplus of electricity. Moreover, the exergy
cost of electricity generated could be reduced by 50% with supercritical steam cycle
and in more than 60% with pressurized gasification.
The objectives of present work are performing a thermodynamic, thermoeconomic and
economic analysis of straw gasification and stillage biodigestion incorporation in a
sugarcane mill. For this, five case studies are defined. The first case considers a steam
plant of a modern conventional power plant (base case). The second case considers the
anaerobic digestion of stillage; the third case considers the straw gasification in a
combined cycle; the fourth case considers the gasification of straw and biodigestion of
stillage; and the fifth case studies the concept of a new plant with the double of the
crushing mill and reduction of process steam consumption, over the straw gasification
and stillage biodigestion.
METHODOLOGY
Thermodynamic Analysis
The problem solution involves the basic principles of thermodynamics: the mass
conservation, the first law of thermodynamics (energy conservation) and the second
law of thermodynamics.
Considering a steady-state process and assuming overall negligible kinetic and
potential energy, the mass conservation as well as First and Second Laws of

72
Thermodynamics for a control volume are represented in a simplified form by Eqs. (1)
to (3):
0mm oi
(1)
0hmhmWQ ooiic.v.c.v.
(2)
0smsmTQS ooiijjc.v.,c.v. ger,
(3)
where:
m : Mass flow rate crossing the control volumes (kg/s);
hm : Enthalpy flow rate crossing the control volumes (kW);
c.v.Q : Heat transfer rate to the control volumes (kW);
c.v.W : Power produced in the control volumes (kW);
c.v. ger,S : Irreversible entropy rate generated in the control volumes (kW/K);
TQc.v. : Entropy flow rate associated to
c.v.Q (kW/K);
sm : Entropy flow rate crossing the control volumes (kW/K).
Energy analysis alone is incapable of taking into account the energy quality and the
sources of irreversibility for the processes. The combination of the First and Second
Laws leads to the exergy inventory and to the evaluation of the irreversibility of the
processes.
In this work the reference temperature and pressure for the ground state are T0 =
298.15 K and P0 = 101.3 kPa, as usual.
According to Szargut et al. (1988), Kotas (1985) and others, total specific exergy is
composed by physical and chemical exergies. Disregarding effects of kinetic and
potential energy, the specific physical exergy of a flow is evaluated based on a
restricted equilibrium state of the system with a standard environment (P0, T0), by
means of:

73
000ph ssThhex
(5)
For an ideal solution of pure substances, the chemical exergy is given by (Bejan et al.,
1996):
i
iik
kchich xxTRexxex ln0;
(6)
where:
ix : Molar fraction of the component in the mixture;
chex : Chemical standard molar exergy of the component in the mixture (kJ/kmol).
The specific chemical exergy of the solid fuels (bagasse and straw) are evaluated with
the help of the expression presented by Szargut et al. (1988) that takes into account the
correlation between the chemical exergy and LHV of each fuel, considering its
elementary composition, the ash content and the humidity, as follows:
waterwaterwaterwaterfuelfuel ch, ZexZLLHVβex
(7)
being:
C
O
C
N
C
H
C
O
C
H
Z
Z0,30351
Z
Z0,0450
Z
Z0,78841
Z
Z0,2499
Z
Z0,21601,0412
β2
2222
(8)
where:
β : Function of the mass fraction of biomass chemical components (%);
Zi: Fraction in mass of the chemical components (%);
Zwater: Fraction in mass of the water in the biomass (%);
Lwater: Water vaporization enthalpy (2,442 kJ/kg);
exwater: Chemical exergy of water liquid (50 kJ/kg).
74
In order to evaluate the plant performance some indexes are defined, permitting to
compare products from different thermodynamic qualities, such as thermal energy and
power produced (Sánchez Prieto, 2003).
The overall efficiency of the plant (overall ) is the ratio of useful energy, either thermal (
usefulQ ) or electrical power available to exportation in the plant (
nconsumptiopumpcompelectric WWWW ), and the power supplied to the system by the
fuel (fuelfuel LHVm ) that is being utilized in the plant (bagasse, straw and/or stillage
or association between them), according to:
fuelfuel
nconsumptiopumpcompusefulelectric
overallLHVm
WWWQW
(9)
This definition of overall efficiency is based only in the power supplied to the plant,
disregarding the energy from other sources available in the industry that could be used
for energy purposes, but are not being used. Thus, it is also considered an efficiency of
biomass utilization ( util_iombη ) as the ratio of useful energy, either thermal or
electromechanical, total biomass and energy available for use, regardless of whether or
not it is being used in the plant (straw, bagasse, and biogas of stillage), being defined
by:
biogasbiogasstrawstrawbagassebagasse
nconsumptiopumpcompusefulelectric
util_biomLHVmLHVmLHVm
WWWQWη
(10)
Another important index is the Power-Heat Ratio (PHR), which is the ratio between the
electrical power available to exportation and the thermal energy used in the process,
namely:
usefulortexp QWPHR
(11)
With respect to the thermal demand for the sugar-alcohol production, the relation
vapor-sugarcane (Rsteam_cane) represents the heat that is being used in the process,
expressed by kilograms of steam per ton of sugarcane. It is recommendable to reduce
this number, so that the plant is able to process the cane with the lowest possible steam

75
demands. Equation (12) illustrates the calculation of this relationship for a certain
amount of cane milled.
1000mmR canesteamcane_steam
(12)
Another important parameter is the ratio of the electrical power available to
exportation and the quantity of cane milled (Rpower_cane), given in kWh/tc:
caneortexpcane_power mWR
(13)
THERMOECONOMIC ANALYSIS
The thermoeconomic evaluation of the plant is based on the theory of exergy cost,
which involves the balance of costs for each component of the same. Thus, for a given
component (k) that receives heat and generates power, the balance of cost should take
into account the cost rates (US$/s) associated with the exergy input ( iC ) and exit (oC
), and the rates associated with power ( wC ) and heat transfer ( qC ), beyond the rate of
cost of equipment (eC ), considering the equipment cost (Ce) and factors related to
amortization (fa), fixed expenses (ffom) and variable (fvom) with operation and
maintenance, according to the load factor (LF) and the number of hours of operation
(Toper). These cost rates are related by (Bejan et al., 1996):
kekokqkwki CCCCC
(14)
being:
iiiiii exmcxEcC
(15)
oooooo exmcxEcC
(16)
76
WcC ww
(17)
QcC qq
(18)
3600t
fLFffCC
oper
vomfomaee
(19)
where:
c : Average cost per unit of exergy (US$/kJ);
C : Monetary cost (US$);
C : Cost rate of exergy (US$/s);
xE : Exergy rate (kJ/s);
Q : Heat rate (kJ/s);
W : Power (kJ/s).
The depreciation factor (fa) can be calculated using the annual percentage rate of
interest (j) and number of years of useful life of equipment (N), according to the
following equation (Bejan et al., 1996):
1j1
j1jf
N
N
a
(20)
ECONOMIC ANALYSIS
Usually, the financial analysis of projects is based on estimates of future cash flow,
derived from forecasts for several variables. The initial analysis of cash flow is done by
representative values for the variables considered, allowing the calculation of
deterministic financial indicators. However, these variables cannot be predicted with
accuracy, indicating the importance of considering, in greater or lesser degree, the risk
associated with expected financial return for the project.
The more sophisticated techniques for analyzing capital investment, according to
Gitman (2004), consider the time factor in the amount of money and involve the
concepts of cash flow supposedly known throughout the lifetime of the project.
Techniques based on the cash flows are the most frequently utilized to describe the
interaction between capital expenditures and the benefits received in each year with

77
the implementation of a project.
These benefits are obtained through the use of fuel in a more rational way. The method
returns to the zero years of operation the benefits achieved during the life of the
project at a discount rate, then these values are added and deducted from capital
spending initially, and the resulting value is defined as Net Present Value (NPV). The
NPV method explicitly demonstrates the real net profit that investors must receive over
the lifetime of the project, being calculated by:
I
j1
BENPV
N
1kk
(21)
where:
BE: Annual benefit obtained (US$); j : Discount rate adopted; N : Number of years analyzed; I : Total invested capital at the start of project operation (US$).
The criterion when NPV is used to make decisions like "accept" or "reject" the project is
the following: if the NPV is greater than or equal to zero, the project must be accepted
because the company will obtain a return equal to or greater that the cost of capital
invested and the project will retain or increase its equity; otherwise, if the NPV is less
than zero, the project should be refused.
Gitman (1984) says that probably the most used technical analysis to evaluate
investment alternatives is the Internal Rate of Return (IRR), determined iteratively
according to the expression:
0I
j1
BEN
1kk*
(22)
where:
j* : Internal rate of return on investment.
The internal rate of return of an investment is the rate j* that returns the present value
of net cash inflow associated with the project equal to the initial investment or,
equivalently, the rate j* that makes the NPV of the project equal to zero. This is a more
objective criterion on which the decision to evaluate the project is based on the cost of
capital. If the IRR is greater than or equal to the cost of capital or discount rate adopted,
the project can be accepted; otherwise, the project should be rejected.
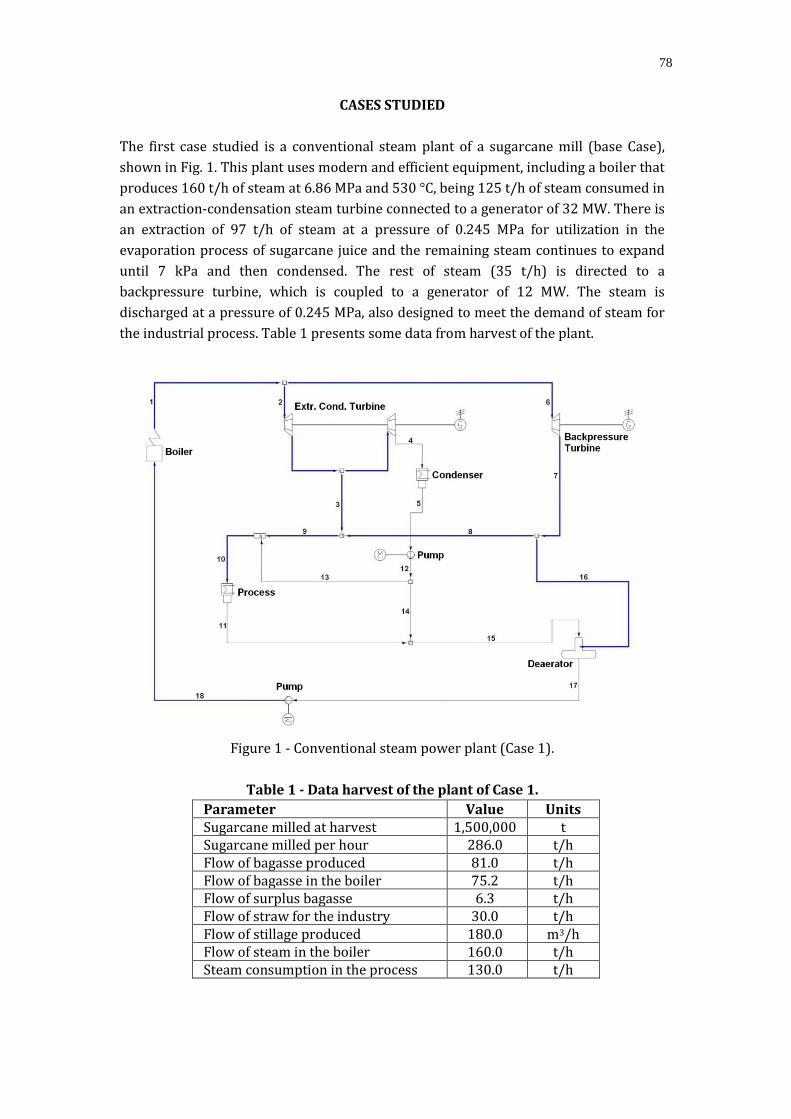
78
CASES STUDIED
The first case studied is a conventional steam plant of a sugarcane mill (base Case),
shown in Fig. 1. This plant uses modern and efficient equipment, including a boiler that
produces 160 t/h of steam at 6.86 MPa and 530 °C, being 125 t/h of steam consumed in
an extraction-condensation steam turbine connected to a generator of 32 MW. There is
an extraction of 97 t/h of steam at a pressure of 0.245 MPa for utilization in the
evaporation process of sugarcane juice and the remaining steam continues to expand
until 7 kPa and then condensed. The rest of steam (35 t/h) is directed to a
backpressure turbine, which is coupled to a generator of 12 MW. The steam is
discharged at a pressure of 0.245 MPa, also designed to meet the demand of steam for
the industrial process. Table 1 presents some data from harvest of the plant.
Figure 1 - Conventional steam power plant (Case 1).
Table 1 - Data harvest of the plant of Case 1.
Parameter Value Units Sugarcane milled at harvest 1,500,000 t Sugarcane milled per hour 286.0 t/h Flow of bagasse produced 81.0 t/h Flow of bagasse in the boiler 75.2 t/h Flow of surplus bagasse 6.3 t/h Flow of straw for the industry 30.0 t/h Flow of stillage produced 180.0 m3/h Flow of steam in the boiler 160.0 t/h Steam consumption in the process 130.0 t/h

79
Figure 2 shows the steam power plants of Cases 2, 3 and 4. Case 2 presents the
incorporation of a system for biodigestion of stillage (also called vinasse). In this plant,
the biogas is utilized in a gas turbine to generate electricity, heat and exhaust gas,
which is utilized in a recovery boiler, generating steam to drive a condensation steam
turbine.
Figure 2 - Modified steam power plants (Cases 2, 3 and 4).
In Case 3 a hypothetical configuration is studied in which is inserted a system for straw
gasification. This system consists of a straw gasifier (atmospheric circulating fluidized
bed type), a gas turbine coupled to an electric generator, a heat recovery steam
generator and a steam system, comprising a condensation turbine, a condenser and
pump power of the recovery boiler, and steam plant at the mill.
Case 4 considers a plant for straw gasification and stillage biodigestion. The synthesis
gas from straw and biogas from stillage are compressed and mixed for use in a single
gas turbine. This system is also composed of a recovery boiler that generates steam to a
condensation steam turbine and to the steam plant.
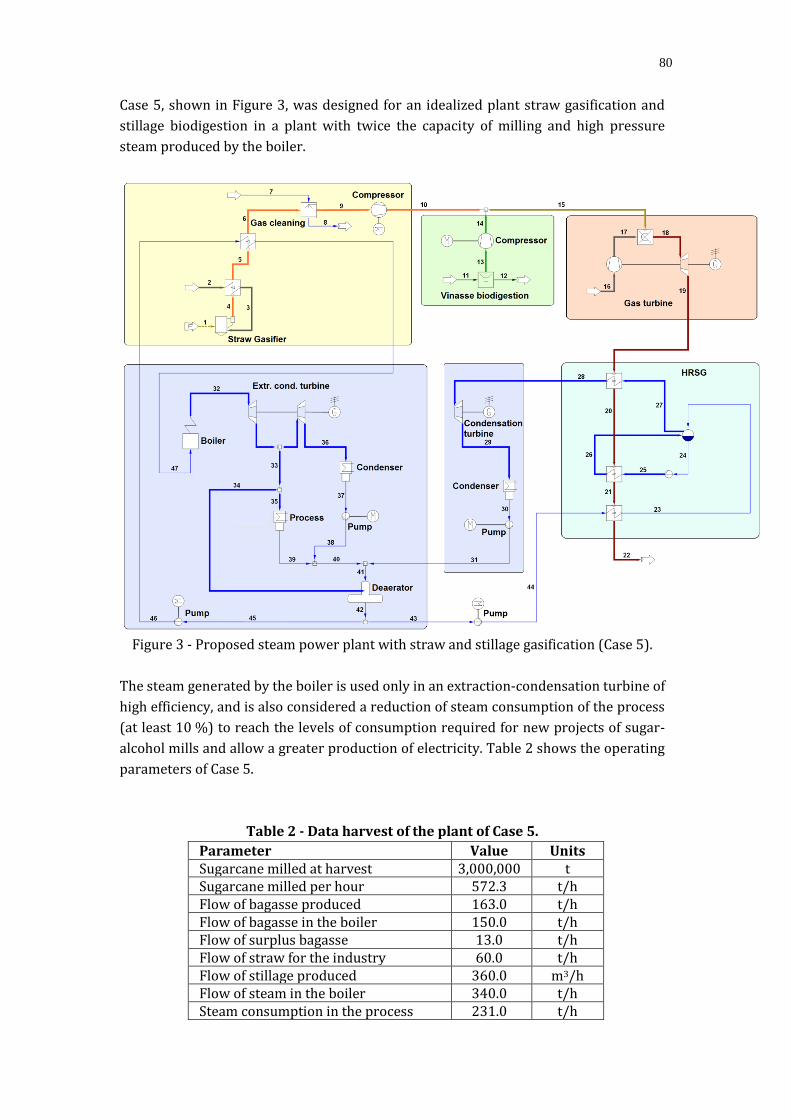
80
Case 5, shown in Figure 3, was designed for an idealized plant straw gasification and
stillage biodigestion in a plant with twice the capacity of milling and high pressure
steam produced by the boiler.
Figure 3 - Proposed steam power plant with straw and stillage gasification (Case 5).
The steam generated by the boiler is used only in an extraction-condensation turbine of
high efficiency, and is also considered a reduction of steam consumption of the process
(at least 10 %) to reach the levels of consumption required for new projects of sugar-
alcohol mills and allow a greater production of electricity. Table 2 shows the operating
parameters of Case 5.
Table 2 - Data harvest of the plant of Case 5.
Parameter Value Units Sugarcane milled at harvest 3,000,000 t Sugarcane milled per hour 572.3 t/h Flow of bagasse produced 163.0 t/h Flow of bagasse in the boiler 150.0 t/h Flow of surplus bagasse 13.0 t/h Flow of straw for the industry 60.0 t/h Flow of stillage produced 360.0 m3/h Flow of steam in the boiler 340.0 t/h Steam consumption in the process 231.0 t/h
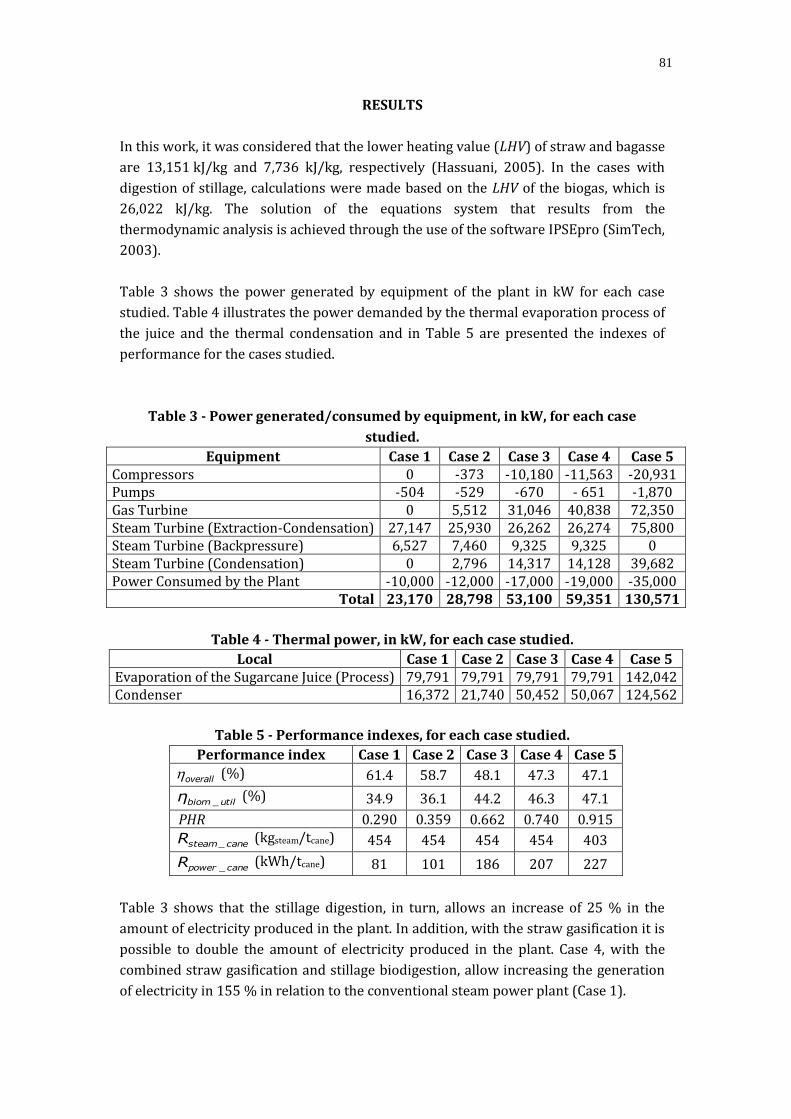
81
RESULTS
In this work, it was considered that the lower heating value (LHV) of straw and bagasse
are 13,151 kJ/kg and 7,736 kJ/kg, respectively (Hassuani, 2005). In the cases with
digestion of stillage, calculations were made based on the LHV of the biogas, which is
26,022 kJ/kg. The solution of the equations system that results from the
thermodynamic analysis is achieved through the use of the software IPSEpro (SimTech,
2003).
Table 3 shows the power generated by equipment of the plant in kW for each case
studied. Table 4 illustrates the power demanded by the thermal evaporation process of
the juice and the thermal condensation and in Table 5 are presented the indexes of
performance for the cases studied.
Table 3 - Power generated/consumed by equipment, in kW, for each case
studied.
Equipment Case 1 Case 2 Case 3 Case 4 Case 5 Compressors 0 -373 -10,180 -11,563 -20,931 Pumps -504 -529 -670 - 651 -1,870 Gas Turbine 0 5,512 31,046 40,838 72,350 Steam Turbine (Extraction-Condensation) 27,147 25,930 26,262 26,274 75,800 Steam Turbine (Backpressure) 6,527 7,460 9,325 9,325 0 Steam Turbine (Condensation) 0 2,796 14,317 14,128 39,682 Power Consumed by the Plant -10,000 -12,000 -17,000 -19,000 -35,000
Total 23,170 28,798 53,100 59,351 130,571
Table 4 - Thermal power, in kW, for each case studied.
Local Case 1 Case 2 Case 3 Case 4 Case 5 Evaporation of the Sugarcane Juice (Process) 79,791 79,791 79,791 79,791 142,042 Condenser 16,372 21,740 50,452 50,067 124,562
Table 5 - Performance indexes, for each case studied.
Performance index Case 1 Case 2 Case 3 Case 4 Case 5
overall (%) 61.4 58.7 48.1 47.3 47.1
util_iombη (%) 34.9 36.1 44.2 46.3 47.1
PHR 0.290 0.359 0.662 0.740 0.915
cane_steamR (kgsteam/tcane) 454 454 454 454 403
cane_powerR (kWh/tcane) 81 101 186 207 227
Table 3 shows that the stillage digestion, in turn, allows an increase of 25 % in the
amount of electricity produced in the plant. In addition, with the straw gasification it is
possible to double the amount of electricity produced in the plant. Case 4, with the
combined straw gasification and stillage biodigestion, allow increasing the generation
of electricity in 155 % in relation to the conventional steam power plant (Case 1).
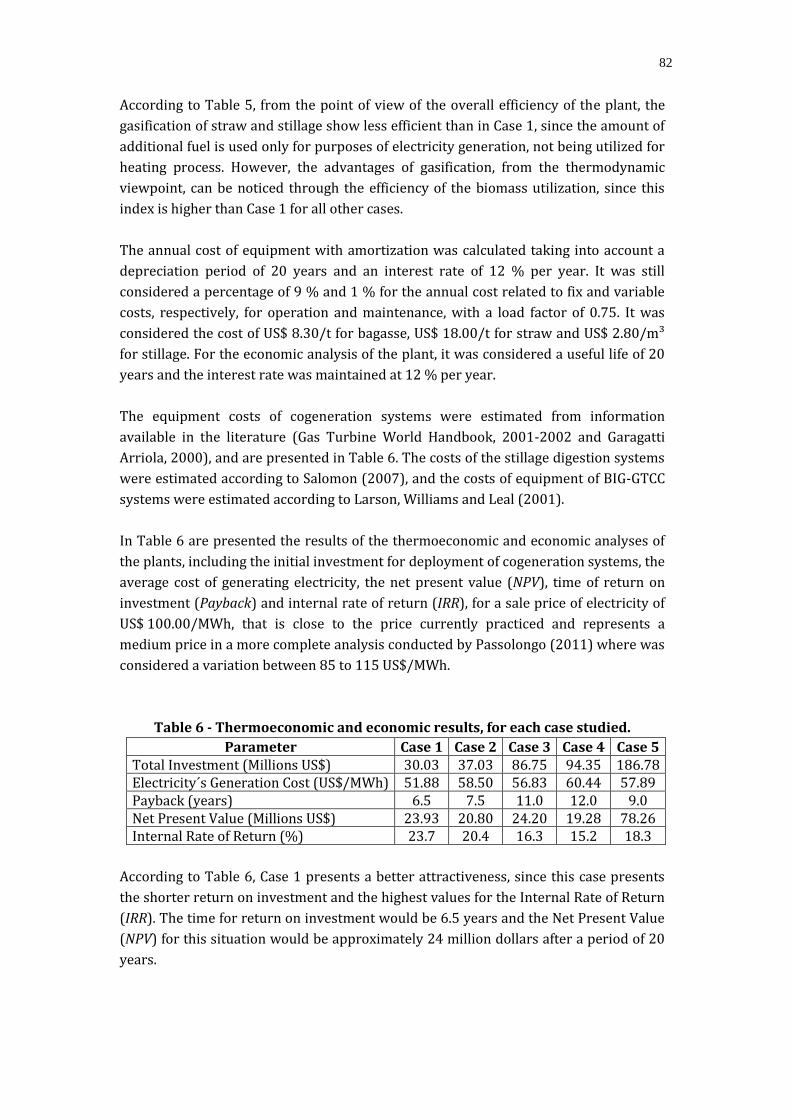
82
According to Table 5, from the point of view of the overall efficiency of the plant, the
gasification of straw and stillage show less efficient than in Case 1, since the amount of
additional fuel is used only for purposes of electricity generation, not being utilized for
heating process. However, the advantages of gasification, from the thermodynamic
viewpoint, can be noticed through the efficiency of the biomass utilization, since this
index is higher than Case 1 for all other cases.
The annual cost of equipment with amortization was calculated taking into account a
depreciation period of 20 years and an interest rate of 12 % per year. It was still
considered a percentage of 9 % and 1 % for the annual cost related to fix and variable
costs, respectively, for operation and maintenance, with a load factor of 0.75. It was
considered the cost of US$ 8.30/t for bagasse, US$ 18.00/t for straw and US$ 2.80/m³
for stillage. For the economic analysis of the plant, it was considered a useful life of 20
years and the interest rate was maintained at 12 % per year.
The equipment costs of cogeneration systems were estimated from information
available in the literature (Gas Turbine World Handbook, 2001-2002 and Garagatti
Arriola, 2000), and are presented in Table 6. The costs of the stillage digestion systems
were estimated according to Salomon (2007), and the costs of equipment of BIG-GTCC
systems were estimated according to Larson, Williams and Leal (2001).
In Table 6 are presented the results of the thermoeconomic and economic analyses of
the plants, including the initial investment for deployment of cogeneration systems, the
average cost of generating electricity, the net present value (NPV), time of return on
investment (Payback) and internal rate of return (IRR), for a sale price of electricity of
US$ 100.00/MWh, that is close to the price currently practiced and represents a
medium price in a more complete analysis conducted by Passolongo (2011) where was
considered a variation between 85 to 115 US$/MWh.
Table 6 - Thermoeconomic and economic results, for each case studied.
Parameter Case 1 Case 2 Case 3 Case 4 Case 5 Total Investment (Millions US$) 30.03 37.03 86.75 94.35 186.78 Electricity´s Generation Cost (US$/MWh) 51.88 58.50 56.83 60.44 57.89 Payback (years) 6.5 7.5 11.0 12.0 9.0 Net Present Value (Millions US$) 23.93 20.80 24.20 19.28 78.26 Internal Rate of Return (%) 23.7 20.4 16.3 15.2 18.3
According to Table 6, Case 1 presents a better attractiveness, since this case presents
the shorter return on investment and the highest values for the Internal Rate of Return
(IRR). The time for return on investment would be 6.5 years and the Net Present Value
(NPV) for this situation would be approximately 24 million dollars after a period of 20
years.
83
The cases which consider the gasification of biomass had worse economic performance
when compared to Case 1, since the time of return of investment was higher in all of
them. The initial investment in the plant of Case 4 is three times higher than in Case 1
and NPV of Case 4 at the end of 20 years is lower than that accumulated in the first
case. In addition, Case 4 has the lowest value for the IRR among the cases analyzed.
Furthermore, note that the Case 5, in which is considered an idealized plant with a
modern and efficient equipment and with biomass gasification, would allow an IRR of
18.3% with an NPV of 140 million dollars after 20 years and return on investment
happen before the middle of the useful life of the plant, according to the one shown in
Table 6, which could make the project more interesting.
CONCLUSIONS
In this work it was considerate the integration of straw gasification and stillage
biodigestion in a conventional sugarcane mill and in the design of a modern plant with
a combined cycle.
From the thermodynamic point of view, the incorporation of the straw gasification was
the best technology experimented because it allows an increase of 105 kWh/tc in
electricity generation. In relation to the digestion of stillage, there is also a gain in
generation, although in lower scale (20 kWh/tc). In economic terms, Case 1 presents a
better economic attractiveness, since it has the lowest payback time and the highest
values for the Internal Rate of Return. However, for Cases 2 and 5, the investment
return would be obtained before even half the life of plants.
It is important to remember that the BIG-GTCC technology used in the work applied to
gasification of the straw is still far from becoming a commercial technology and its
maturity cannot be expected in the coming years. But its development has been
steadily increasing, so that, in the long term, this technology associated with a better
remuneration for the electricity sale could become an interesting alternative to the
sugarcane sector, contributing to avoid a possible crisis in the supply of electricity in
the future.
ACKNOWLEDGEMENTS
The authors thank the industry Pioneiros Bioenergia for providing data needed for this
work. Thanks also to FAPESP for funding the project in which this work is inserted
(Process 2005/01197-6) and for providing a graduate scholarship to the author Rodnei
Passolongo (Process 2008/56944-9).
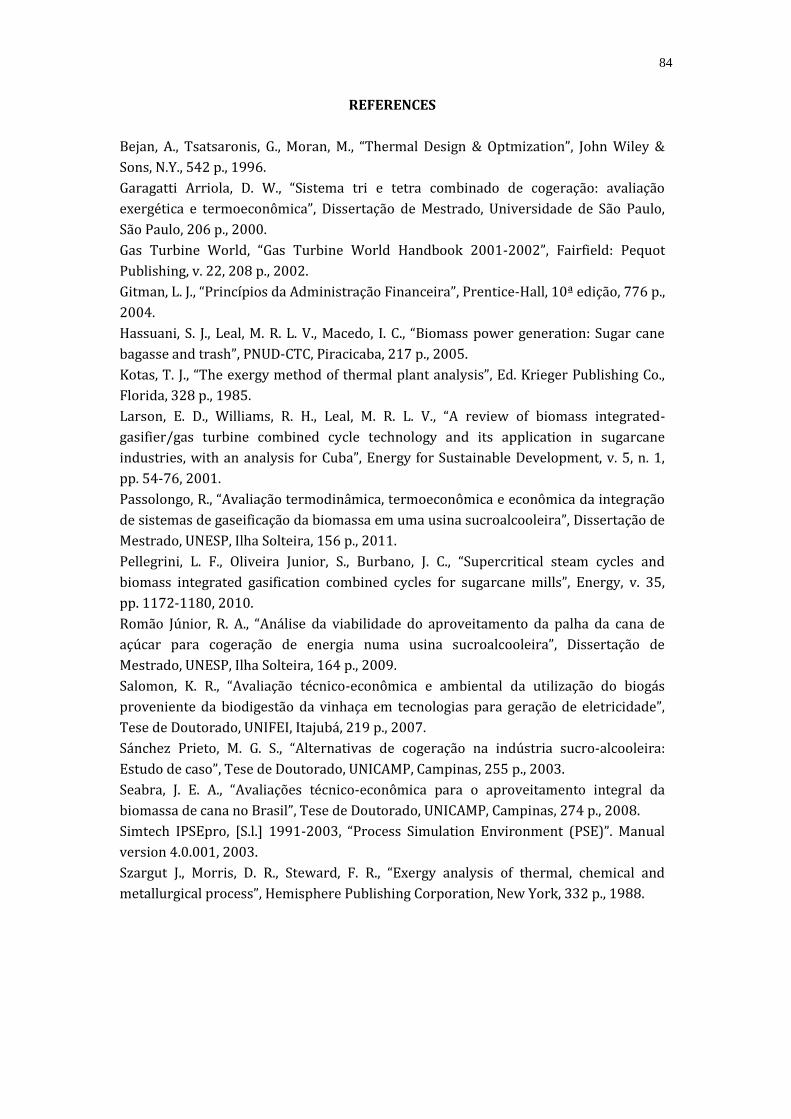
84
REFERENCES
Bejan, A., Tsatsaronis, G., Moran, M., “Thermal Design & Optmization”, John Wiley &
Sons, N.Y., 542 p., 1996.
Garagatti Arriola, D. W., “Sistema tri e tetra combinado de cogeração: avaliação
exergética e termoeconômica”, Dissertação de Mestrado, Universidade de São Paulo,
São Paulo, 206 p., 2000.
Gas Turbine World, “Gas Turbine World Handbook 2001-2002”, Fairfield: Pequot
Publishing, v. 22, 208 p., 2002.
Gitman, L. J., “Princípios da Administração Financeira”, Prentice-Hall, 10ª edição, 776 p.,
2004.
Hassuani, S. J., Leal, M. R. L. V., Macedo, I. C., “Biomass power generation: Sugar cane
bagasse and trash”, PNUD-CTC, Piracicaba, 217 p., 2005.
Kotas, T. J., “The exergy method of thermal plant analysis”, Ed. Krieger Publishing Co.,
Florida, 328 p., 1985.
Larson, E. D., Williams, R. H., Leal, M. R. L. V., “A review of biomass integrated-
gasifier/gas turbine combined cycle technology and its application in sugarcane
industries, with an analysis for Cuba”, Energy for Sustainable Development, v. 5, n. 1,
pp. 54-76, 2001.
Passolongo, R., “Avaliação termodinâmica, termoeconômica e econômica da integração
de sistemas de gaseificação da biomassa em uma usina sucroalcooleira”, Dissertação de
Mestrado, UNESP, Ilha Solteira, 156 p., 2011.
Pellegrini, L. F., Oliveira Junior, S., Burbano, J. C., “Supercritical steam cycles and
biomass integrated gasification combined cycles for sugarcane mills”, Energy, v. 35,
pp. 1172-1180, 2010.
Romão Júnior, R. A., “Análise da viabilidade do aproveitamento da palha da cana de
açúcar para cogeração de energia numa usina sucroalcooleira”, Dissertação de
Mestrado, UNESP, Ilha Solteira, 164 p., 2009.
Salomon, K. R., “Avaliação técnico-econômica e ambiental da utilização do biogás
proveniente da biodigestão da vinhaça em tecnologias para geração de eletricidade”,
Tese de Doutorado, UNIFEI, Itajubá, 219 p., 2007.
Sánchez Prieto, M. G. S., “Alternativas de cogeração na indústria sucro-alcooleira:
Estudo de caso”, Tese de Doutorado, UNICAMP, Campinas, 255 p., 2003.
Seabra, J. E. A., “Avaliações técnico-econômica para o aproveitamento integral da
biomassa de cana no Brasil”, Tese de Doutorado, UNICAMP, Campinas, 274 p., 2008.
Simtech IPSEpro, [S.l.] 1991-2003, “Process Simulation Environment (PSE)”. Manual
version 4.0.001, 2003.
Szargut J., Morris, D. R., Steward, F. R., “Exergy analysis of thermal, chemical and
metallurgical process”, Hemisphere Publishing Corporation, New York, 332 p., 1988.

85
The Application of the Energy Saving Technology of Refrigerating System in a Food Processing and Refrigerating
Factory
By Jiao Yuxue, Yantai Moon Group Co.,Ltd
PROGRAM OVERVIEW
Yantai Haijie Food Co., Ltd located in Export Processing Zone in Yantai City, established
in Dec.2001, cover a total area of 21,700 square meters and building area of 9400
square meters. The buildings built with polyurethane insulation composite materials,
in which integrates processing and refrigerating. And the work shop has 3,000 square
meters. The storage capacity of refrigerating is 5,000 tons. The daily production
capacity is 40 tons and annual production capacity is more than 6,000 tons. The cold
gradient and thermal gradient have been used in full producing program. The cold
gradient is mainly in the plant air conditioning, food refrigeration and cold chain. The
thermal gradient is mainly in the domestic hot water, winter heating and food cooking
smoked hot links.
Two aspects problem can be certain after comprehensive analysis and calculation. First
of all, the refrigeration energy efficiency is low by using low-temperature with
economizer screw causing cold source; Secondly, it is a lot of waste of energy to use
cold and heat at the same time in the entire production workshop. So the cost of
processing is higher and the competitive ability drops fast for the two aspect problems.
The reform program of "energy-saving" has been proposed to deal with the problems
related above. On one hand, on the low-temperature cold source shall be integrated
and used the Moon IEMC [Intelligent Energy Manage Control] to improve the cooling
coefficient; On the other hand, according to Moon's own fork point of the entire plant's
cold, the heat source for comprehensive utilization, improve initial energy utilization!
The energy saving was officially completed in January 2009, and run for four
consecutive years, which proved that under the premise of the same production and
quality, the energy saving energy saving is greater than 18.6%.
ENERGY SAVING PROGRAM AND TRANSFORMATION
1. The IEMC energy-saving program of the low-temperature cold source
IEMC is word abbreviation of the Intelligent Energy Manage Control and its Chinese
meaning for intelligent energy management and control system", which is formed of
Yantai Moon Co., Ltd. in 2007 officially approved the energy-saving projects. The
system of cold, heat source optimizes the configuration. User system products cold and
heat production at maximum efficiency, and improve overall system COP values.

86
The Transformation Of Energy Efficiency To Determine
Cold storage of quick-frozen process in Haijie food has four frozen libraries, a single-
freezing machine and a flat-screen freezer, corresponding to the cold source using the
three 2KA20CY with economic manual single-stage screw unit design conditions of -40
° C / 40 ℃, the theoretical displacement of 1072 cubic meters / hour.
Data detection: the transformation of the former system production in the month of
November to 14 tons, invested # 4 compressor, the evaporation pressure average-
0.04MP condensing pressure 0.78MP load Maekawa refrigeration software above data,
the EER calculate / / ξ = 144.1/89.2 = 1.62
Corresponds to the condensation pressure August average 1.37MP, corresponding to
the condensing pressure of 38 ° C for a maximum of one year, the evaporation pressure
constant remains -44 ° C, Maekawa software to load this data and calculation results
are as follows: calculation / / ξ = 117.8/122.6 = 0.96
In the same way into the condensation temperature within a year Haijie the Maekawa
software calculated, the calculated amount of cold and EER description made of curves,
shown in Table 1 and the average monthly cold EER control table
The single compressor Haijie Cold Storage corresponding condensing pressure average monthly calculations within one year
Jan. Feb. Mar. Apri. May Jun. Jul. Aug. Sep. Oct Nov. Dec.
Condensing pressure
20℃ 22℃ 26℃ 29℃ 32℃ 36℃ 38℃ 37℃ 34℃ 31℃ 27℃
23℃
Corresponding amount
145.3 142.8 137.4 133.0 128.3 121.5 115.8 119.6 125.0 129.9 136.0
141.5
Shaft power 87.6 90.8 97.7 103.3 109.3 118.0 125.0 120.3 113.6 107.3 99.6 92.5
EER 1.66 1.57 1.41 1.29 1.17 1.03 0.93 0.99 1.10 1.21 1.37 1.53
Table 1.1
Apparent by comparing the "energy
efficiency" of the compressor as
condensation temperature rise
significantly reduced, mainly due to
the condensation temperature rise
in the evaporation temperature
under certain circumstances result
in increasing the pressure ratio of
the compressor, because the
compressed the presence of the
clearance gap between the rotor
when the pressure ratio reaches a certain level, will seriously reduce gas transmission
Refrigerating Capacity Comparison
0.0 20.0 40.0 60.0 80.0 100.0 120.0 140.0 160.0
1 2 3 4 5 6 7 8 9 10 11 12
Month
RC/EQ RC PI

87
coefficient deviates from the design value of the gas transmission capacity, the exhaust
temperature will rise, so that the compressor power consumption not only elevated ,
and the output of the cooling capacity will
be greatly reduced.
RC:Refrigerating Capacity;
EQ:Electric Quantity
PI:Power input
IEMC energy saving program
In order to solve the bottleneck of large
pressure than high condensing
temperature to the compressor efficiency,
multi-stage compression mode can be
used to reduce the run of a compressor
pressure ratio, the existing low-temperature conditions of single-stage single screw
Manual mode is changed to automatic mode for multi-unit dual-class match. Loaded
IEMC intelligent energy management and control system for the entire system at the
same time, the concrete form as follows:
[Description]: # 2 screw compressors and the existing quick-freeze system within the
engine room 6 # screw compressor [2KA16CY] is [2KA20CY] system transformation,
namely to increase the signal acquisition equipment required for stand-alone
automatic run mode and accept hardware after transformation, Unit # 6 as the high
pressure stage of the system, Unit # 2 as a low pressure system level, and then the two
devices by a intercooler composed of a two-stage match.
After transformation, the dual-class match system will automatically track the running
of the maximum efficiency of the end of the load and the external environment changes,
the principle automation control cabinet will be automatically adjusted in accordance
Monthly EER
0.00
0.50
1.00
1.50
2.00
1 2 3 4 5 6 7 8 9 10 11 12
Month
EER EER

88
with the change of the condensation temperature and evaporation temperature system
high pressure and low pressure level running upload bit in order to establish a
reasonable intermediate pressure to improve the operating efficiency of the low
pressure level and high-pressure-level equipment.
The IEMC "mathematical model" is established in accordance with the transformation
program content, and Situation analysis within a year of the external environment
Loading the Maekawa software calculated fitting the results of the comparison to the
original operation mode, the following results:
EER control before and after the cold before and after the reference to "reform and
shaft power control graph and transformation graph can be remarkable that, after the
transformation of the system cooling capacity with condensing temperature rise is
essentially the same, although after the transformation axis The slight increase in
power with the rise of condensing temperature, the energy efficiency of the whole
system is basically maintained at more than 1.34, much higher than the energy
efficiency in the transformation of the former.
The right transformation EER
graph called the slow
transformation of precancerous
changes, affected by the
condensing temperature is far
Haijie cold storage dual-class match within one year after the transformation corresponding the condensing pressure monthly average calculations
Jan. Feb. Mar. Apr. May Jun. Jul. Aug. Sep. Oct. Nov. Dec. Condensing pressure 20℃ 22℃ 26℃ 29℃ 32℃ 36℃ 38℃ 37℃ 34℃ 31℃ 27℃ 23℃ Corrpesponding cold quantify
164.9 164.8 164.5 164.2 164.0 163.6 163.3
163.5
163.8
164.1
164.4
164.1
Shaft Power 98.7 100.7 105.0 108.5 112.2 117.6 121.9
119.0
114.9
111.0
106.1
101.7
EER/T 1.67 1.64 1.57 1.51 1.46 1.39 1.34 1.37 1.43 1.48 1.55 1.61
EER/F 1.66 1.57 1.41 1.29 1.17 1.03 0.93 0.99 1.10 1.21 1.37 1.53 Rate of Rising Value 1% 4% 11% 18% 25% 35% 45% 38% 30% 22% 13% 5%
The graph of EER after and before transformation
0.00
0.50
1.00
1.50
2.00
1 2 3 4 5 6 7 8 9 10 11 12
Month
EER After Before

89
less than the transformation of the former.
Based on the integral summation formula to the following conclusions:
After transformation, an average 21% increased in the energy efficiency of the system
than before the transformation, if coupled with automatic than manually increase the
efficiency of the compressor section throughout the year can save 30% power
consumption.
Annual savings calculated as follows: [Note: the transformation of the former summer
energy consumption correction factor of 1.4
Σ = 110x0.30x12x300x0.6x1.4 = 99792 yuan
Energy Saving transformation of Cold, Heat source of fork point
The transformation of the former
the production workshops
Memory "parallel" in more energy
use, resulting in a lot of wasted
energy! Such liquefied petroleum
gas is consumed in the run-time
of the one hand Barbecue
generate a lot of energy, wherein
a small part of the heat to grill
fillets to a predetermined level,
and discharged to the external
portion of the heat to "waste heat" form, in addition to a part of the heat is released in
the database, increase the heat load of the workshop; many processes within the other
hand, the workshop also need to consume energy heating thaw process is needed to
counteract the heat from the tap water to thaw, the amount of water wasted! Red
cream pool, shop dressing room, domestic hot water and the engine room heating units
need to consume a large amount of steam, because of the large amount of serious
impact on the supply pressure of the boiler side.
Using Moon "pinch" technology re-distribution of the source of hot and cold in the
workshop, barbecue machine to produce the cooling water and the collection and
processing of direct application tool cleaning process; establish a "cold in red cream
pool and barbecue products - hot "balance to reduce dual energy consumption;" hot
and cold - "balance between barbecue machine exhaust and thawing water, smoke
latent heat to maintain the temperature of the bath, to speed up the thawing progress
at the same time to reduce the consumption of tap water.
The graph of EER after and before transformation
0.0
50.0
100.0
150.0
200.0
1 2 3 4 5 6 7 8 9 10 11 12
Month
CE/EQ Before trans.
Shaft Power
After trans.
After trans.
of shaft power
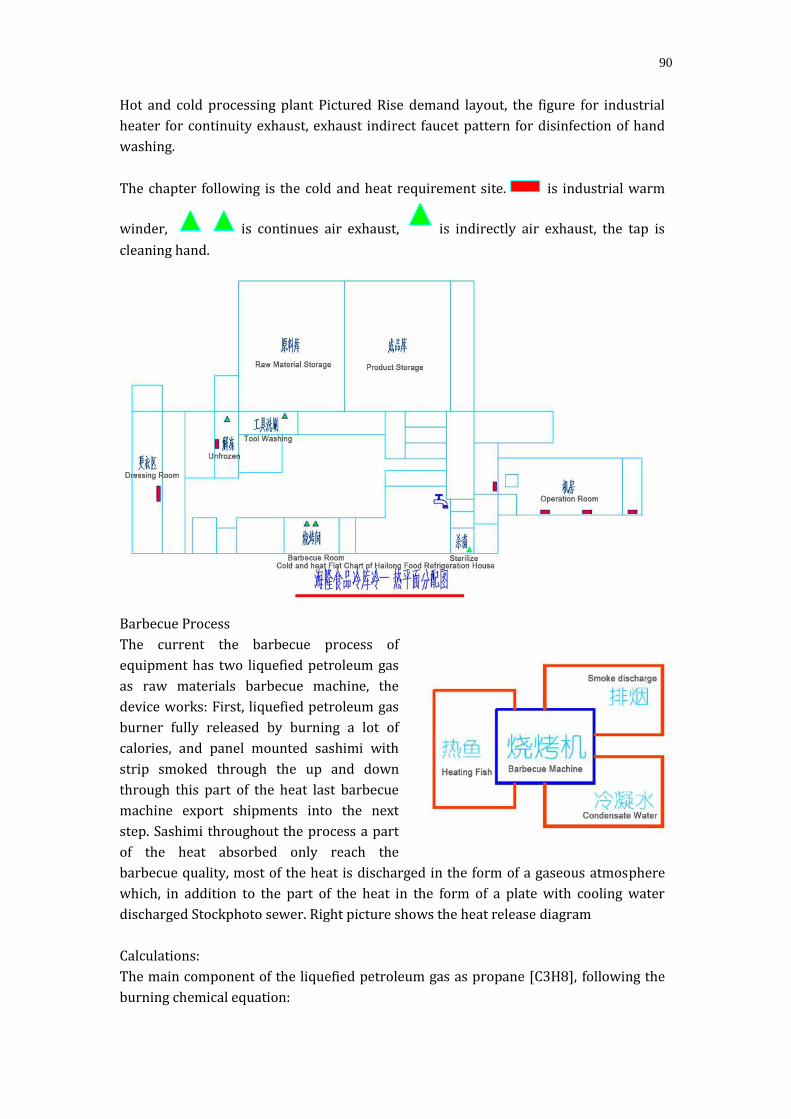
90
Hot and cold processing plant Pictured Rise demand layout, the figure for industrial
heater for continuity exhaust, exhaust indirect faucet pattern for disinfection of hand
washing.
The chapter following is the cold and heat requirement site. is industrial warm
winder, is continues air exhaust, is indirectly air exhaust, the tap is
cleaning hand.
Barbecue Process
The current the barbecue process of
equipment has two liquefied petroleum gas
as raw materials barbecue machine, the
device works: First, liquefied petroleum gas
burner fully released by burning a lot of
calories, and panel mounted sashimi with
strip smoked through the up and down
through this part of the heat last barbecue
machine export shipments into the next
step. Sashimi throughout the process a part
of the heat absorbed only reach the
barbecue quality, most of the heat is discharged in the form of a gaseous atmosphere
which, in addition to the part of the heat in the form of a plate with cooling water
discharged Stockphoto sewer. Right picture shows the heat release diagram
Calculations:
The main component of the liquefied petroleum gas as propane [C3H8], following the
burning chemical equation:

91
C3H8 +5 O2 = 3CO2 +4 H2O
1. Exhaust parts:
The average monthly consumption of fuel: 10 tons
Low calorific value of LPG: 11700 Kj / Kg
Big barbecue machine chimney diameter: 226 mm
The small barbecue machines chimney diameter: 162.4 mm
Live smoke wind speed measurements: 7.62 ~ 8.3 m / s
Field exhaust gas temperature measurement: 139.6 ℃
Barbecue machine exhaust air volume calculation:
The FL (large) = 3.14x0.113x0.113x8x60 = 19.2 m3/min
FL () = 3.14x0.0812x0, 0812x8x60 = 10.08 m3/min
Exhaust in the latent heat of water vapor (excluding steam) in the fish:
Q latent = 10x1000x40x2320 / (26x12x26) = 114 398 Kj == 31.7 KW
Sensible heat in the exhaust:
Q to = 1.39x65x130 = 11745 Kcal == 13 KW.
Heat loss barbecue machine smoke process:
M smoke = 31.7 +13 = 44.7 KW
2. The barbecue after the completion of heat load:
Standard yield big barbecue machine: 330 Kg / h
Small barbecue machine standard output: 160 Kg / h
BBQ premortal fillets temperature: 10 ℃; [304.3KJ/Kg]
After a barbecue cooked fillets temperature: 85 ℃; [545.2KJ/Kg]
Accordance with BBQ complete the fish temperature drops to 30 ° C calculate the heat
load:
Q load = 490x176 = 118041 Kj == 32.7 KW
4 calculated to increase electricity tariffs in accordance with the plant air conditioning
energy efficiency as:
M electric = 32.7/4x12 = 96 kw.h = 67 yuan / day
3. The barbecue to cool down the drainage portion:
Large barbecue machine cooling water: 1084 Kg / h
Small barbecue machine cooling water: 680 Kg / h
Measured cooling water discharge temperature: 62 ~ 72.6 ℃
Average daily working time: 12h
The cooling water is heated to 70 ° C heat absorbed from 20 ℃ Calculated:
Q waste heat = 1000x1.764x12x50 = 1058400 kcal == 1230 KW
Standard coal calorific value: 7000 kcal / kg
The conversion efficiency of the existing boiler is tentatively set at 80%, the amount of
coal converted into:
M Coal = 1058400/7000 = 151.2 kg == 181 yuan / day
The daily amount of water discharged is:
M water = 1.764x12 = 21.2 m3 == 78 yuan / day
2.2.2. Raw materials thaw process
Thawing room the sink number: 11
Thaw slot single water storage capacity: 600 Kg
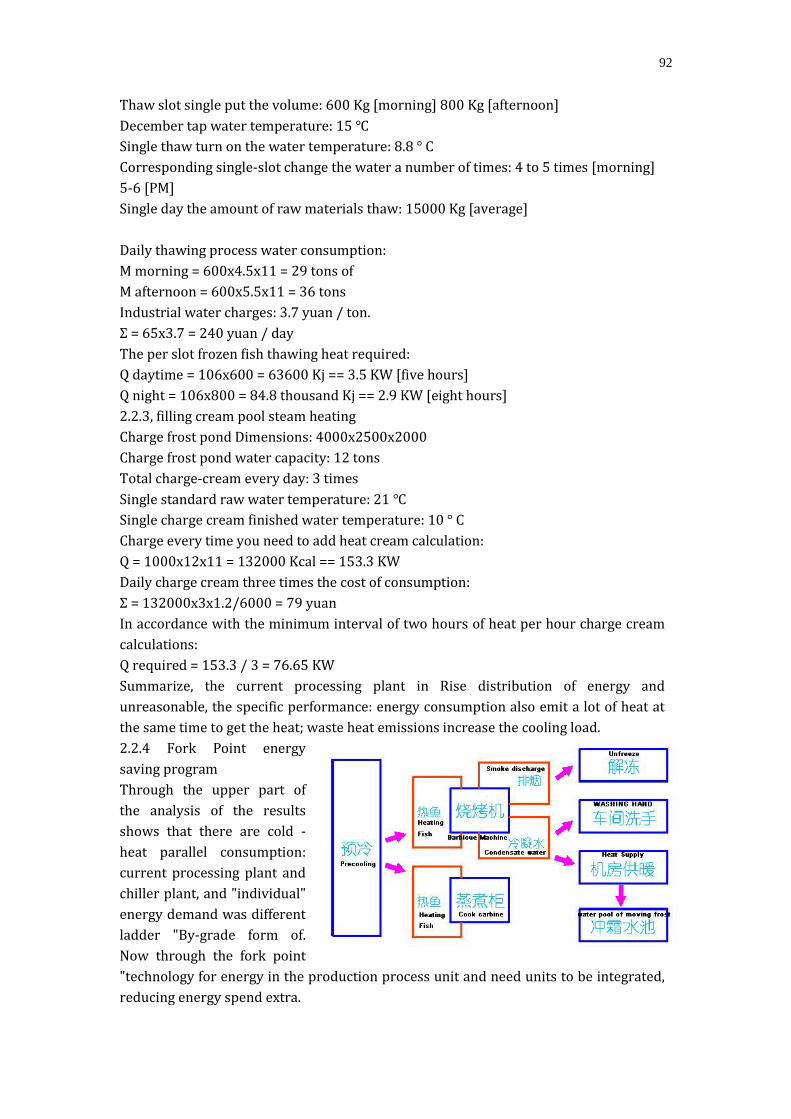
92
Thaw slot single put the volume: 600 Kg [morning] 800 Kg [afternoon]
December tap water temperature: 15 ℃
Single thaw turn on the water temperature: 8.8 ° C
Corresponding single-slot change the water a number of times: 4 to 5 times [morning]
5-6 [PM]
Single day the amount of raw materials thaw: 15000 Kg [average]
Daily thawing process water consumption:
M morning = 600x4.5x11 = 29 tons of
M afternoon = 600x5.5x11 = 36 tons
Industrial water charges: 3.7 yuan / ton.
Σ = 65x3.7 = 240 yuan / day
The per slot frozen fish thawing heat required:
Q daytime = 106x600 = 63600 Kj == 3.5 KW [five hours]
Q night = 106x800 = 84.8 thousand Kj == 2.9 KW [eight hours]
2.2.3, filling cream pool steam heating
Charge frost pond Dimensions: 4000x2500x2000
Charge frost pond water capacity: 12 tons
Total charge-cream every day: 3 times
Single standard raw water temperature: 21 ℃
Single charge cream finished water temperature: 10 ° C
Charge every time you need to add heat cream calculation:
Q = 1000x12x11 = 132000 Kcal == 153.3 KW
Daily charge cream three times the cost of consumption:
Σ = 132000x3x1.2/6000 = 79 yuan
In accordance with the minimum interval of two hours of heat per hour charge cream
calculations:
Q required = 153.3 / 3 = 76.65 KW
Summarize, the current processing plant in Rise distribution of energy and
unreasonable, the specific performance: energy consumption also emit a lot of heat at
the same time to get the heat; waste heat emissions increase the cooling load.
2.2.4 Fork Point energy
saving program
Through the upper part of
the analysis of the results
shows that there are cold -
heat parallel consumption:
current processing plant and
chiller plant, and "individual"
energy demand was different
ladder "By-grade form of.
Now through the fork point
"technology for energy in the production process unit and need units to be integrated,
reducing energy spend extra.

93
1. Barbecue machine temperature condensate collection, supplement to the steam
boiler to the water through the pumps after treatment;
2. Cold - thermal equilibrium established between the the red cream pool and barbecue
finished goods, red pumps and surface cooler the cold cream pool is sent to the
database, hot fish consumption distributed heat load;
3. Barbecue smoke of latent heat application to thaw process through a heat exchanger,
the heat of the exhaust gas in the form of supplementary pool of red cream which
reduce the exchange of water in the thawing process:
4. Tool for cleaning wastewater and high-temperature sterilization revealed tube
effective treatment, to ensure increase in library thermal load to maximize.
1. Boiler cost savings:
M Coal + M water = 181 +78 = 259 yuan / day
2. BBQ hot load reduction
-Electric M = 67 yuan / day
3. Red cream pool savings
M coal = 79
4. Tool disinfection reduced heat load and high-temperature sterilization
-Electric M = 30 yuan / day
5. Thaw the pool water cost savings
M water = 240 yuan / day
III. Energy Saving Summarization
At the top of the global height, the true meaning of "energy-saving" is only considering
in order achieving the most efficiency. The energy saving is integrated throughout the
plant cold, heat demand, at the same time improve the cooling efficiency of the hot and
cold rational allocation and utilization, and ultimately reduce the initial energy
consumption. On one hand, the IEMC smart energy management and control system
has a wide range of applications in cryogenic which, on the one hand, users saves a lot
of production costs, on the other hand made a huge contribution to energy saving for
society.

94
Vehicle Technology Development – Focus on Energy Efficiency.
Oswaldo Lucon and José Goldenberg
São Paulo State Environment Secretariat and University of São Paulo
Sustainable transportation is a priority worldwide, both in terms of energy security,
environmental protection, public health in urban areas, mobility and economic
productivity. There are three approaches to these challenges: new technologies,
efficiency and fuel decarbonization. This paper will present how the State of São Paulo
addresses such issues.
CHALLENGES IN TRANSPORT
The transportation sector has a high relevance in total energy consumption (Figure 1).
Still relatively low in developing countries (Figure 2), private vehicle ownership is
expected to grow rapidly towards the level of motorization of the OECD. This growth is
strongly related to the per capita gross domestic product, and countries can be
clustered in two developed and emerging economies (Figure 2). Level of motorization
in 2012 is shown in Figure 3
Figure 1. Shares of transport sector in total energy consumption by country or region,
2009 (IEA, 2012a)
28%
9% 8%
17%
39%
14%
26% 21%
Brazil China India Russia Mexico Non-OECD OECD World

95
Figure 2. Per capita, vehicle ownership versus GDP over time
Figure 3. Motor vehicles per 1,000 people (World Bank, 2012)
Mobility improvements require systemic approaches. Commuting times are high in São
Paulo Metropolitan Area, compared with other large cities worldwide (Figure 4).
High income: nonOECD
Latin America & Caribbean (all income levels)
Middle income
OECD
Sub-Saharan Africa (all income levels)
Austria
Canada
Germany
United States
549 259
634 186
10 68
797 564
17 28
175 578
209 607
58 572
165 797
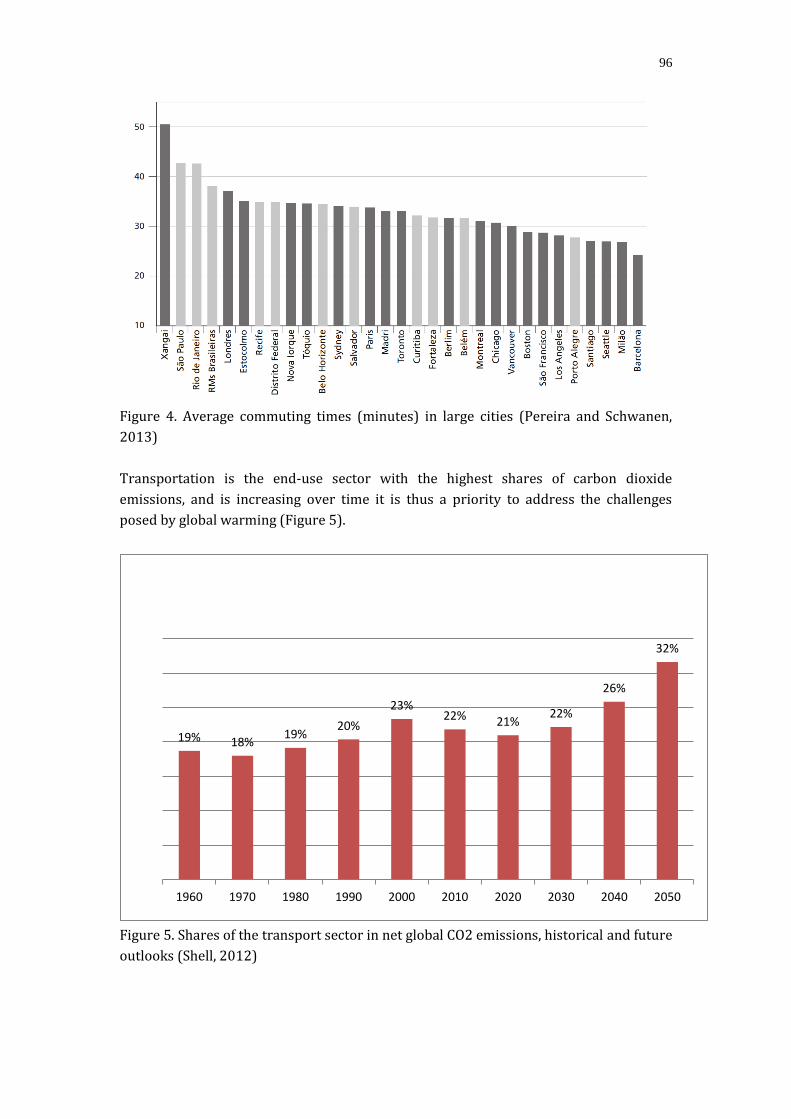
96
Figure 4. Average commuting times (minutes) in large cities (Pereira and Schwanen,
2013)
Transportation is the end-use sector with the highest shares of carbon dioxide
emissions, and is increasing over time it is thus a priority to address the challenges
posed by global warming (Figure 5).
Figure 5. Shares of the transport sector in net global CO2 emissions, historical and future
outlooks (Shell, 2012)
19% 18% 19%
20%
23% 22% 21%
22%
26%
32%
1960 1970 1980 1990 2000 2010 2020 2030 2040 2050
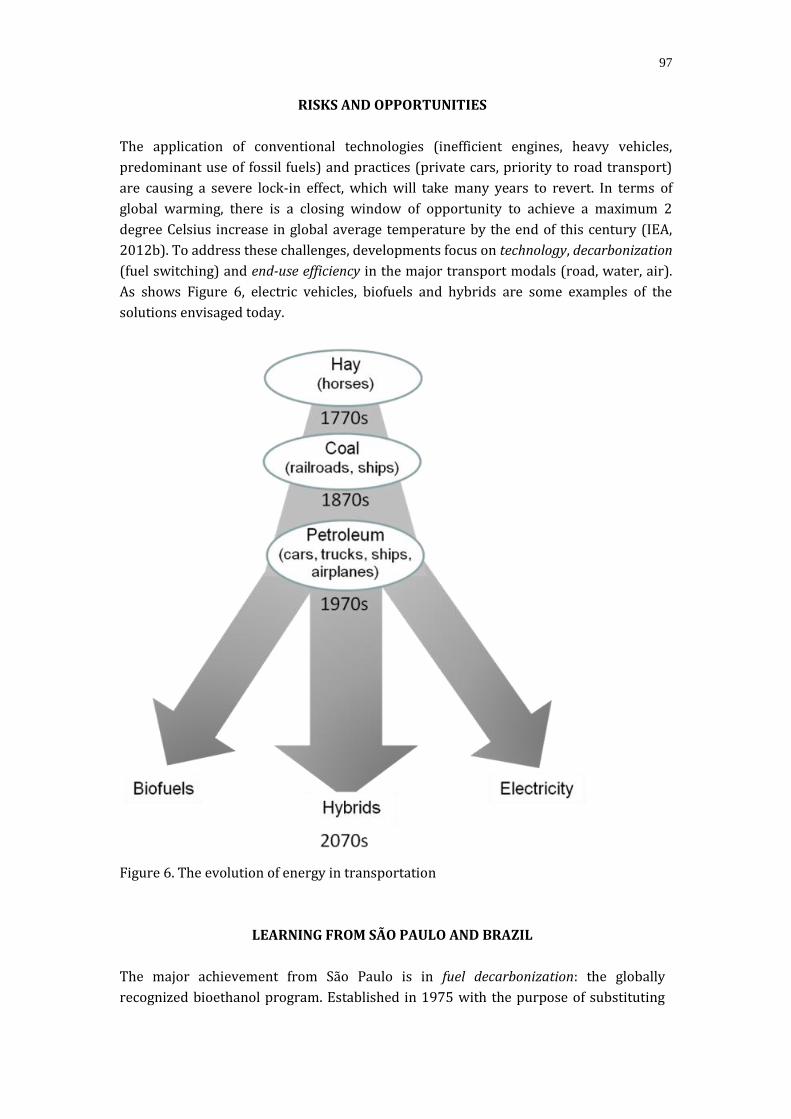
97
RISKS AND OPPORTUNITIES
The application of conventional technologies (inefficient engines, heavy vehicles,
predominant use of fossil fuels) and practices (private cars, priority to road transport)
are causing a severe lock-in effect, which will take many years to revert. In terms of
global warming, there is a closing window of opportunity to achieve a maximum 2
degree Celsius increase in global average temperature by the end of this century (IEA,
2012b). To address these challenges, developments focus on technology, decarbonization
(fuel switching) and end-use efficiency in the major transport modals (road, water, air).
As shows Figure 6, electric vehicles, biofuels and hybrids are some examples of the
solutions envisaged today.
Figure 6. The evolution of energy in transportation
LEARNING FROM SÃO PAULO AND BRAZIL
The major achievement from São Paulo is in fuel decarbonization: the globally
recognized bioethanol program. Established in 1975 with the purpose of substituting
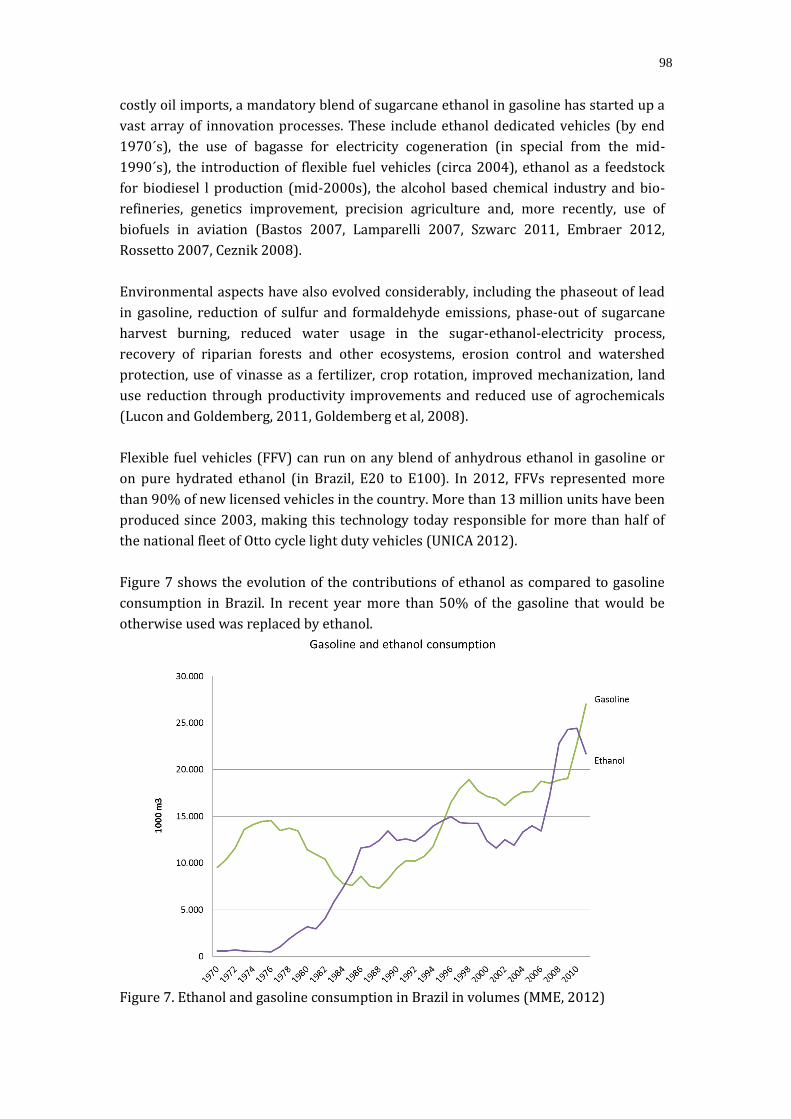
98
costly oil imports, a mandatory blend of sugarcane ethanol in gasoline has started up a
vast array of innovation processes. These include ethanol dedicated vehicles (by end
1970´s), the use of bagasse for electricity cogeneration (in special from the mid-
1990´s), the introduction of flexible fuel vehicles (circa 2004), ethanol as a feedstock
for biodiesel l production (mid-2000s), the alcohol based chemical industry and bio-
refineries, genetics improvement, precision agriculture and, more recently, use of
biofuels in aviation (Bastos 2007, Lamparelli 2007, Szwarc 2011, Embraer 2012,
Rossetto 2007, Ceznik 2008).
Environmental aspects have also evolved considerably, including the phaseout of lead
in gasoline, reduction of sulfur and formaldehyde emissions, phase-out of sugarcane
harvest burning, reduced water usage in the sugar-ethanol-electricity process,
recovery of riparian forests and other ecosystems, erosion control and watershed
protection, use of vinasse as a fertilizer, crop rotation, improved mechanization, land
use reduction through productivity improvements and reduced use of agrochemicals
(Lucon and Goldemberg, 2011, Goldemberg et al, 2008).
Flexible fuel vehicles (FFV) can run on any blend of anhydrous ethanol in gasoline or
on pure hydrated ethanol (in Brazil, E20 to E100). In 2012, FFVs represented more
than 90% of new licensed vehicles in the country. More than 13 million units have been
produced since 2003, making this technology today responsible for more than half of
the national fleet of Otto cycle light duty vehicles (UNICA 2012).
Figure 7 shows the evolution of the contributions of ethanol as compared to gasoline
consumption in Brazil. In recent year more than 50% of the gasoline that would be
otherwise used was replaced by ethanol.
Figure 7. Ethanol and gasoline consumption in Brazil in volumes (MME, 2012)
99
WHAT SÃO PAULO AND BRAZIL STILL NEED TO DO
Many technology deployment challenges persist. One of these is improved vehicle
efficiency, catching up with the global developments. In Brazil, where vehicle standards
are defined nationally, so the State of São Paulo does not have autonomy to do it.
Fuel consumption can be translated into tailpipe CO2 emissions, regardless
energetically if the energy consumed comes from renewable biofuels, from non-
renewable fossil fuels or from blends. The national Inovar Auto Program, established in
2012, has efficiency targets with are relatively less ambitions if compared to developed
and other emerging economies (Figure 8). China and India have lower emission targets.
The US, after a long stagnant period since 1980´s CAFE (Corporate Auto Fuel
Efficiency) Program, has now adopted more stringent standards under the Obama
administration.
Hybrid vehicles are more efficient than the conventional ones and Sao Paulo has
started discussions on how to connect through R&D the FFV and hybrid technologies.
Hybrid vehicles are entering the national market and car manufacturers are adapting
the technology to the Brazilian gasoline (called gasohol, or E22). However, without
incentives the hybrid technology will hardly incorporate the multi-fuel one.
Beyond hybrid, electric vehicles (plug-in and grid connected public transport) offer
interesting possibilities for an agenda of R D&D. The University of São Paulo, in
conjunction with the Sao Paulo State Environment and Energy Secretariats, has
launched a program for electric vehicle charging infrastructure. The first charging
stations were implemented at the University campus (Miguel, 2012) and a Shopping
Center (DC 2012), all in the City of São Paulo. Also in São Paulo City Capital, AES
Eletropaulo, a power utility company, installed five charging points for Nissan Leaf
model taxis. In Aparecida do Norte, five charging points were installed by EDP
Bandeirante, another utility (Smart Energy, 2012 a, b).
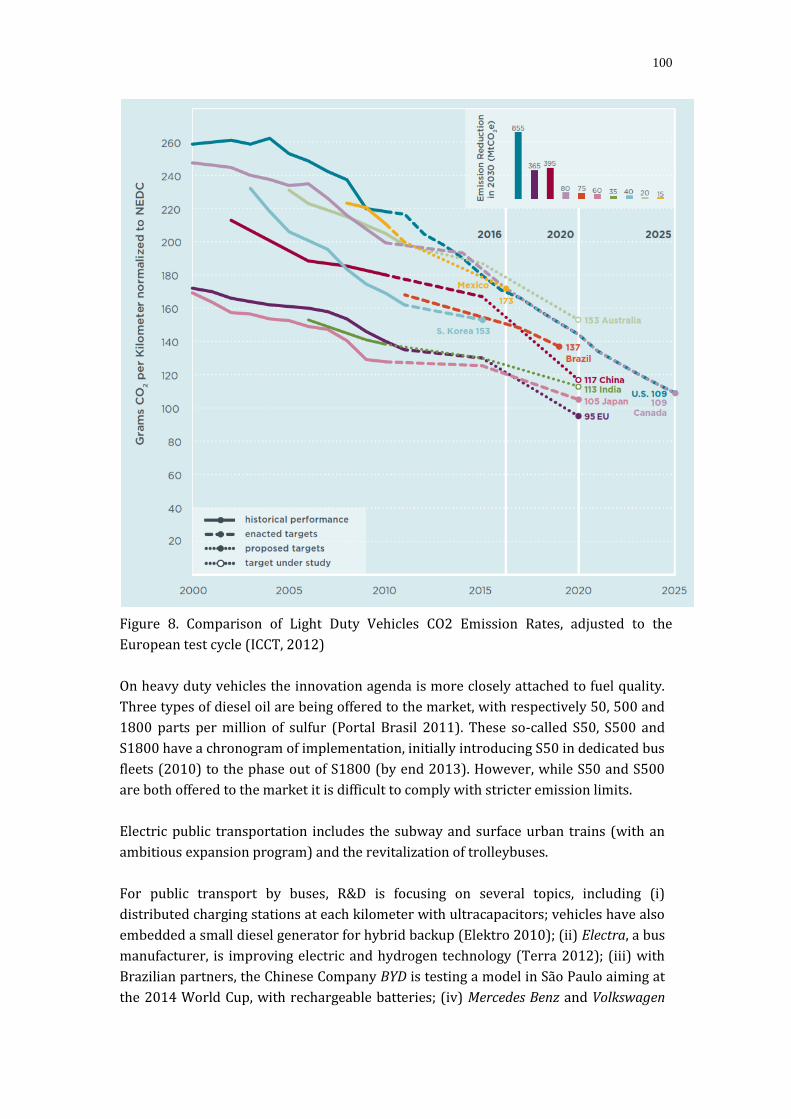
100
Figure 8. Comparison of Light Duty Vehicles CO2 Emission Rates, adjusted to the
European test cycle (ICCT, 2012)
On heavy duty vehicles the innovation agenda is more closely attached to fuel quality.
Three types of diesel oil are being offered to the market, with respectively 50, 500 and
1800 parts per million of sulfur (Portal Brasil 2011). These so-called S50, S500 and
S1800 have a chronogram of implementation, initially introducing S50 in dedicated bus
fleets (2010) to the phase out of S1800 (by end 2013). However, while S50 and S500
are both offered to the market it is difficult to comply with stricter emission limits.
Electric public transportation includes the subway and surface urban trains (with an
ambitious expansion program) and the revitalization of trolleybuses.
For public transport by buses, R&D is focusing on several topics, including (i)
distributed charging stations at each kilometer with ultracapacitors; vehicles have also
embedded a small diesel generator for hybrid backup (Elektro 2010); (ii) Electra, a bus
manufacturer, is improving electric and hydrogen technology (Terra 2012); (iii) with
Brazilian partners, the Chinese Company BYD is testing a model in São Paulo aiming at
the 2014 World Cup, with rechargeable batteries; (iv) Mercedes Benz and Volkswagen

101
have tested biodiesel (pure and B20 blends) and 30% sugarcane diesel blends in buses
for the Rio +20 Conference (Ponto de Onibus 2012).
Air transportation is also a target for R D &D in Sao Paulo. The North American Boeing
and the Brazilian Embraer (located in Sao Jose dos Campos, Sao Paulo) have an
agreement with FAPESP (the SP Research Funding Agency) focusing on the use of
biofuels. Other support comes from the Interamerican Development Bank and the US
biotechnology company Amyris (UNICA 2011). Embraer has already developed a
bioethanol fuelled aircraft (Embraer 2011).
Energy savings in transportation can be achieved through modal shift. Sao Paulo State
has issued a first draft of the Transportation Plan (Sao Paulo, 2011). Such Plan is
connected to the 2009 Climate Change Policy mandatory and economy-wide target of
20% CO2 reduction by 2020, compared to 2005 levels (Sao Paulo, 2009). Modal shift
includes extensive use of waterways, pipelines, railways and public mass
transportation.
THE WAY AHEAD
Implementing such ambitious plan will require intensive actions, including technology
innovation, policymaking, enforcement, capacity building, information exchange,
financing and others, to which the Regional Leader Partner Regions will be able to
contribute.
REFERENCES
1. Bastos VD, 2007. Etanol, Alcoolquímica e Biorrefinarias. BNDES Setorial, Rio de
Janeiro, n. 25, p. 5-38, http://www.ambiente.sp.gov.br/wp-
content/uploads/publicacoes/etanol/alcoolquimica.pdf
2. Cesnik R , 2008. Melhoramento da cana-de-açúcar: marco sucro-alcooleiro no
Brasil, http://www.cnpma.embrapa.br/down_hp/344.pdf
3. DC 2012. Vaga verde se antecipa à chegada do carro elétrico. Diário do
Comércio, July 4th, http://www.dcomercio.com.br/index.php/cidades/sub-
menu-cidades/91605-vaga-verde-se-antecipa-a-chegada-do-carro-eletrico
4. Elektro 2010. Elektro pesquisa nova tecnologia para ônibus elétrico,
http://www.elektro.com.br/Paginas/noticias/ExibeNoticia.aspx?ID=62
5. Embraer 2012. Avião Ipanema a Etanol da Embraer é destaque na Agrishow
2012 http://www.embraer.com/pt-BR/ImprensaEventos/Press-
releases/noticias/Paginas/AVIAO-IPANEMA-A-ETANOL-DA-EMBRAER-E-
DESTAQUE-NA-AGRISHOW-2012.aspx
6. Goldemberg J, Coelho ST, Guardabassi P, 2008. The sustainability of ethanol
production from sugarcane. Energy Policy 36 (2008) 2086– 2097
7. ICCT 2012. Global Transportation Energy and Climate Roadmap. International
Council on Clean Transportation,

102
http://www.theicct.org/sites/default/files/publications/ICCT%20Roadmap%2
0Energy%20Report.pdf
8. IEA, 2010. World Energy Outlook 2010. International Energy Agency, Paris
9. IEA, 2012a. Statistics. International Energy Agency website,
http://www.iea.org/stats/index.asp
10. IEA, 2012b. World Energy Outlook 2012. International Energy Agency, Paris
11. Lamparelli RAC, 2007. Agricultura de precisão. Empresa Brasileira de Pesquisa
Agropecuária, http://www.agencia.cnptia.embrapa.br/gestor/cana-de-
acucar/arvore/CONTAG01_72_711200516719.html
12. Lucon O, Goldemberg J, 2011. São Paulo—The “Other” Brazil: Different
Pathways on Climate Change for State and Federal Governments. The Journal of
Environment Development September 2010 vol. 19 no. 3 335-357
13. Miguel S, 2012. IEE inaugura primeiro eletroposto em São Paulo para veículos
elétricos. USP Online, http://www5.usp.br/18137/iee-inaugura-primeiro-
eletroposto-em-sao-paulo-para-veiculos-eletricos/
14. MME, 2012. Brazilian Energy Balance, https://ben.epe.gov.br/
15. Pereira RHM, Schwanen T, 2013. Tempo de deslocamento casa-trabalho no
Brasil (1992-2009): diferenças entre regiões Metropolitanas, níveis de renda e
sexo. Instituto de Pesquisa Econômica Aplicada, IPEA,
http://www.ipea.gov.br/agencia/images/stories/PDFs/TDs/td_1813.pdf
16. Ponto de Onibus 2012. Sustentabilidade: Chinesa testa ônibus elétrico em São
Paulo e RIo + 20 mostra tecnologias da indústria Nacional,
http://blogpontodeonibus.wordpress.com/2012/06/14/sustentabilidade-
chinesa-testa-onibus-eletrico-em-sao-paulo-e-rio-20-mostra-tecnologias-da-
industria-nacional/
17. Portal Brasil 2011. ANP aprova abastecimento com Diesel de baixo teor de
enxofre a partir de janeiro de 2012,
http://www.brasil.gov.br/noticias/arquivos/2011/12/9/anp-aprova-
abastecimento-com-diesel-de-baixo-teor-de-enxofre-a-partir-de-janeiro-de-
2012
18. Rossetto R, 2007. Melhoramento genético. Empresa Brasileira de Pesquisa
Agropecuária, http://www.agencia.cnptia.embrapa.br/gestor/cana-de-
acucar/arvore/CONTAG01_70_711200516719.html
19. Sao Paulo, 2009. Law #13798. The São Paulo State Climate Change Policy ,
www.sp.gov.br/spcc
20. Sao Paulo (2011) Plano Transportes,Preliminary Version,
http://www.ambiente.sp.gov.br/wp-content/uploads/2013/01/plano-
transporte-dez-2011.pdf
21. Smart Energy, 2012a. AES Eletropaulo instala cinco pontos de recarga elétrica
para táxis em SP. Smart Energy Online,
http://www.smartenergyonline.com.br/article.php?a=2292
22. Smart Energy, 2012b. EDP Bandeirante lança projeto de mobilidade elétrica em
Aparecida. Smart Energy Online,
http://www.smartenergyonline.com.br/article.php?a=1673

103
23. Szwarc A, 2011 A alcoolquímica no cenário futuro da cana-de-açúcar . In:
Relatório de Qualidade Ambiental 2011, Secretaria Estadual do Meio Ambiente
(SMA)
24. Terra 2012. Ônibus elétricos já são realidade no Brasil ,
http://tecnologia.terra.com.br/onibus-eletricos-ja-sao-realidade-no-
brasil,3a080fcc7696b310VgnCLD200000bbcceb0aRCRD.html
25. UNICA 2011. Brasil pode se tornar centro de desenvolvimento de
biocombustíveis para aviação,
http://www.unica.com.br/noticia/3958491092036406485/brasil-pode-se-
tornar-centro-de-desenvolvimento-de-biocombustiveis-para-aviacao/
26. UNICA 2012. Veículos flex superam participação de 90% nas vendas registradas
em 2012. União da Indústria de Cana-de-Açúcar,
http://www.unica.com.br/noticia/32026594920338370133/veiculos-flex-
superam-participacao-de-90-por-cento-nas-vendas-registradas-em-2012/
27. World Bank, 2012. Motor vehicles (per 1,000 people),
http://data.worldbank.org/indicator/IS.VEH.NVEH.P3/countries?display=defaul
t

104
Vermicelli Production Enterprises Discussions of Comprehensive Utilization for Wastewater Production Biogas
By Zhang Yuhong, Energy-saving Office of Yantai City
Zhaoyuan is the birthplace of Longkou vermicelli and production area,is the country's
largest Longkou vermicelli production base. Zhaoyuan city has a total of 110 vermicelli
production enterprises, annual production capacity of 250000 tons, realize output
value of 2.6 billion,sold to more than 80 countries and regions in the world,export
earned foreign exchange of 150000000 dollars.
I.Vermicelli production associated wastewater
The nature of the vermicelli enterprise production enterprises have a lot of high
concentration wastewater waste residue to be discharged,contains a large number of
proteins, polysaccharides , and other organic matter in the wastewater , wastewater
(wastewater composition : CODcr : 19000mg / l; BOD5 : 4500mg / l ; SS: 1500mg / l ;
PH :4.5- 5 .5 ; T: winter 7-8 ℃ summer 15-16 ℃) emissions from large, high
concentrations of suspended solids, direct emissions has greater impact on the
environment, wastewater directly to the irrigation of crops will result in a drop in grain
production, hazards of drinking water, but also resulted in a waste of resources, a large
amount of COD emissions , the growth of a variety of micro-organisms grow and
multiply, and easy to breed biogas harm.
The previous vermicelli enterprise in this part of the high concentration wastewater
adopted a method of simple aerobic treatment for processing, As aerobic
microorganism in the reaction process, need a lot of consumption of dissolved oxygen
in water, thus must be continuously to supply oxygen to water, so want to consume a lot
of energy in the reaction process, relatively high energy consumption, increasing the
sewage treatment cost. At the same time also have a small amount of methane
generated in the process of wastewater treatment, the enterprise for this portion of the
methane gas torch burning, which caused the environment pollution and energy loss. If
separate anaerobic treatment, the effect of wastewater treatment is not ideal, which
cannot reach direct emissions standards.
II. Comprehensive pollution control through the production of biogas
The wastewater discharged how to deal with in the vermicelli production process, has
been plagued vermicelli manufacturers in the development of a "heart disease ". In
recent years, the Zhaoyuan City vermicelli enterprise adopt anaerobic process +
aerobic process high concentration organic wastewater treatment technology , its final
product combustible methane gas , can recycle as energy ; Less quantity of sludge and
prone to dehydration enrichment, can be used as fertilizer. Growing tensions in the

105
current energy situation, as a kind of low energy consumption, recycling treatment
technology is increasingly subject to the attention of the world.
Compared with anaerobic method, the aerobic biological method in dealing with
vermicelli processing wastewater has many shortcomings, such as the need for oxygen,
large power consumption, no energy recovery, microbial nutritional requirements of
multi- and large amount of sludge, it is suitable for low concentration of organic
wastewater treatment. In the wastewater of vermicelli production, COD content in
general are larger, so a separate application in wastewater treatment is less, in the
treatment of high concentration organic wastewater treatment, aerobic biological
treatment is generally used for subsequent processing. The process of anaerobic +
aerobic process is a perfect combination of high concentration organic wastewater
treatment .After processing with this method, it will produce biogas, biogas slurry and
sludge, biogas through a sealed pipe fed to the gas turbine to generate power, the
biogas slurry supply enterprises organic vegetable base and surrounding farmers,
produced sludge used for organic fertilizer production process.
After high concentration wastewater discharged from the production workshop ,mixed
enter into the regulation pool, adjust the quality of wastewater etc, then from
regulation pool pump upgrade to BIC anaerobic reactors for anaerobic fermentation,
Using anaerobic microorganisms under anaerobic and optimum temperature and PH
conditions, break down organic matter in waste water, produce CH4, CO2, water and a
small amount of other gases, get rid of most of the organic matter in the waste water, to
make high concentration organic wastewater preliminary purified, at the same time to
recycle and reuse, so this part of the biogas after sealing pipe supply boiler combustion
or gas generators to supply electricity production. Standards wastewater can used for
irrigation farmland, produced sludge in the mixed precipitation pool as organic
fertilizer returned farmland.
III. Processing Diagrams
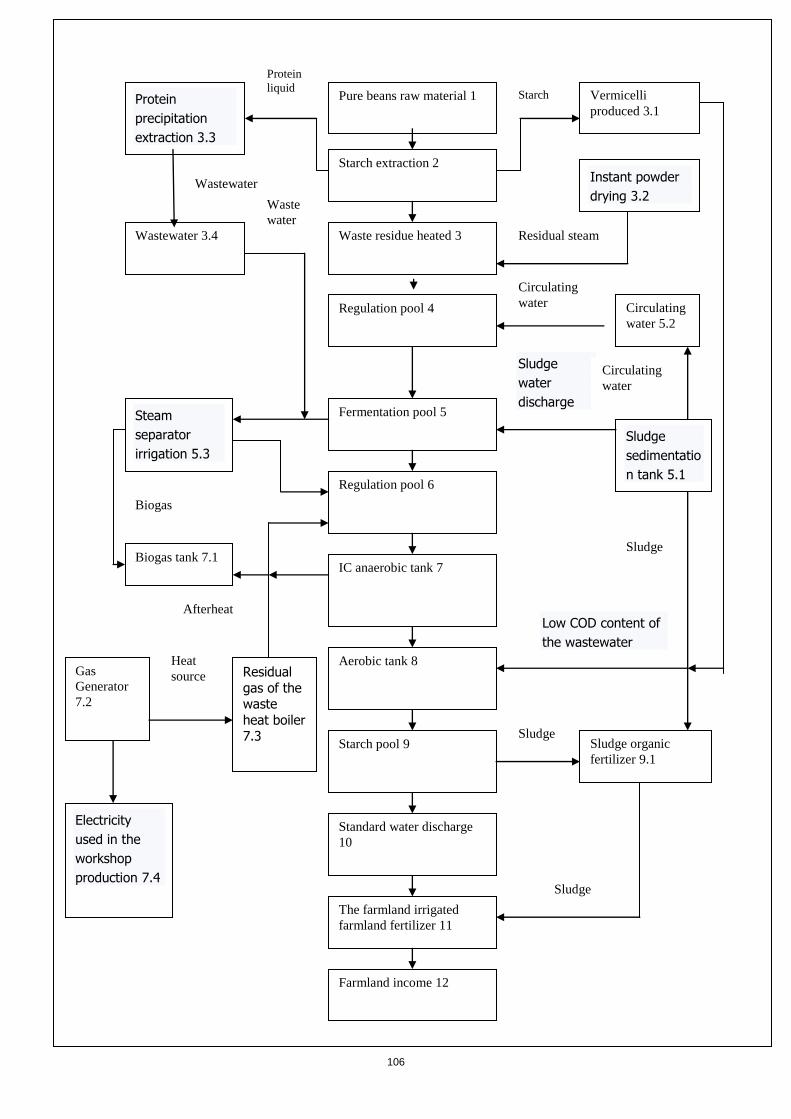
106
IV. The benefits of wastewater produced biogas
Protein
precipitation
extraction 3.3
Pure beans raw material 1
Starch extraction 2
Waste residue heated 3
Regulation pool 4
Fermentation pool 5
Aerobic tank 8
IC anaerobic tank 7
Regulation pool 6
Starch pool 9
Standard water discharge
10
The farmland irrigated
farmland fertilizer 11
Farmland income 12
Vermicelli
produced 3.1
Instant powder
drying 3.2
Circulating
water 5.2
Sludge
sedimentatio
n tank 5.1
Wastewater 3.4
Sludge organic
fertilizer 9.1
Steam
separator
irrigation 5.3
Biogas tank 7.1
Gas
Generator
7.2
Electricity
used in the
workshop
production 7.4
Residual
gas of the waste
heat boiler 7.3
Starch
Protein
liquid
Wastewater
Waste
water
Biogas
Afterheat
Residual steam
Circulating
water
Sludge
water
discharge
Sludge
Low COD content of
the wastewater
Circulating
water
Sludge
Sludge
Heat
source

107
IV. The benefits of wastewater produced biogas Zhaoyuan City at present, Twin Towers Of Food Shares Co., Ltd. LIULIUSHUN Food Co., Ltd., Sanjia Foods Co. Ltd., Xinzhuang Longkou Vermicelli, Deshengda Longkou Vermicelli Co., Ltd., Jindu Tallinn Foods Co.Ltd., Hongfa Food Co., Ltd etc,a group of vermicelli production enterprises have implemented such vermicelli sewage treatment project. After the project is completed , the annual produce biogas 54 million tons, the annual savings of 48,000 tons of standard coal , and produce more than 10 million m3 of irrigation water emission, reduction COD7.61 tons, BOD1.62 million tons , SS0.815 tons, SO2 133.07 tons, reduce soot 13,600 tons. After " extract - Power Generation – irrigation "tertiary treatment, vermicelli after production wastewater by the past turned into a "golden bumps", Zhaoyuan vermicelli enterprise by vigorously developing circular economy, achieve the reuse of waste resources in production processes, turn waste into treasure, not only solve the problem of environmental pollution in the production, and enable enterprises to achieve better economic and social benefits,and enhance the competitiveness of enterprises, achieve the sustainable development of enterprises .
108
The Energy Consumption Future in Vehicular Technology
Márcio Schettino - Secretaria Municipal de Transportes de São Paulo
ABSTRACT
The issues related to climate change and increased air pollution and their effects on human life is today one of the most debated by society. In this scenario the transportation sector appears as one of the great villains, one of the major emitters of greenhouse gases and pollutants such as CO, HC, NOx and PM. Besides the pressure that society has exerted in order to minimize these emissions the cost and difficulty of this viable energy resources increasing. Given this scenario what will be the future of energy consumption in vehicle technology?
INTRODUCTION To evaluate the future of energy consumption in vehicle technology must first understand the context in the past and at present. We went from a scenario where pollution and consumption were not important. We migrated to a scenario where emissions of pollutant gases began to be controlled and we are now focusing beyond the polluting emissions, greenhouse gases and fuel consumption. Also in this context it is important to emphasize that the understanding that greenhouse gases and pollutants originate, effects and different treatments is not fully consolidated by the majority of society making it difficult in many cases to take the right decisions. The emission of greenhouse gases is a result of incomplete burning of fuels for internal combustion engines fitted to vehicles and is directly linked to technology used in these engines. Its impact is local, more directly related to the health of people living where the issue occurs. An example is the study of the USP Faculty of Medicine which indicates that life expectancy for the population of the city of São Paulo reduces in a year and a half due to the existing pollution. Since the emission of greenhouse gases is related to the amount of fossil fuel burned to generate the energy needed to move the vehicle, thus depending on the efficiency of the drive system used or the fuel used. Biofuels like ethanol while emitting CO2 (greenhouse gas) from burning, these are not of fossil origin and therefore do not impact the balance of the ecosystem. The greenhouse gases have global impact and its major consequence is global warming and its effects. The constant improvement of the knowledge society has been promoting actions that seek a complete improvement in vehicle technology. This improvement must necessarily focus on energy efficiency and lower emissions of greenhouse gases and air pollutants. This will be the basis of vehicle technology developments.

109
PROCONVE In 1986 the program was instituted Control of Air Pollution by Motor Vehicles - PROCONVE. This program was the first step in controlling pollutants gas emissions from vehicles, which stipulated the various phases of development of technology over the years for light and heavy vehicles. Since its beginning until today the program was responsible for a major technological development in vehicles that cut emissions by about 20 times. Phases and specified emission limits are described in the following tables.
EMISSIONS
POLLUTANTSHC – CO – NOX – MP
LOCAL
GHGEFFICIENCY
GLOBAL
PROCONVE (1986) GREEN SCORE (2009)NOTA VERDE
PROCONVE – LIGHT VEHICLES
FONTE: ANFAVEA

110
As an example of the development occurred in Otto cycle engines can mention: • Electronic injection • Dash pot • Preheat mixture • Control of evaporative emissions • Compression • Profile of combustion chamber • Lean-burn • Catalysts • filter particulate material In diesel engines can mention: • Intercooled • Electronic modules • Electronic injection of high pressure • EGR System • SCR System All this development has focused on the direct reduction of pollutant emissions, which in parallel, made more efficient engines and with it a small reduction of emissions of greenhouse gases. The new phases of PROCONVE will further reduce emissions, but energy efficiency and therefore reduce consumption for internal combustion engines has reached its limit.
GREEN SCORE As previously mentioned the PROCONVE is a program that acts directly on the emission of pollutants having no action on emissions of greenhouse gases or energy efficiency.
PROCONVE – HEAVY VEHICLES
FONTE: ANFAVEA

111
The constant in the media about the negative effects of climate change is resulting expectations by society actions that somehow reverse this process. These actions are now being conducted primarily by local laws as the São Paulo Municipality and State laws of climate change of who set goals to reduce CO2. Following this current IBAMA in 2009 established the green score program, which while not setting limits on the emission of CO2, but give for the consumer, an indication of the vehicle more efficient and may in the future be part of the certification process of the vehicle. FUELS AND NEW TECHNOLOGIES Once the engine technologies that exist today still lets you reduce the pollutant emissions, but hardly decrease the emissions of greenhouse gases, it is mandatory to find a way to improve the existing landscape. In order to effectively reduce CO2 emissions is necessary to change the paradigm with the introduction of new technological concepts. In this scenario enters biofuels, alternative fuels and new technologies traction. Among the new technologies we can mention the hydrogen fuel cell vehicles, battery electric vehicles and hybrid vehicles.
With respect to fuel the chart below shows the various possibilities and effects.
ELETRIC - BATTERY
HYBRID
H2 – FUEL CELL
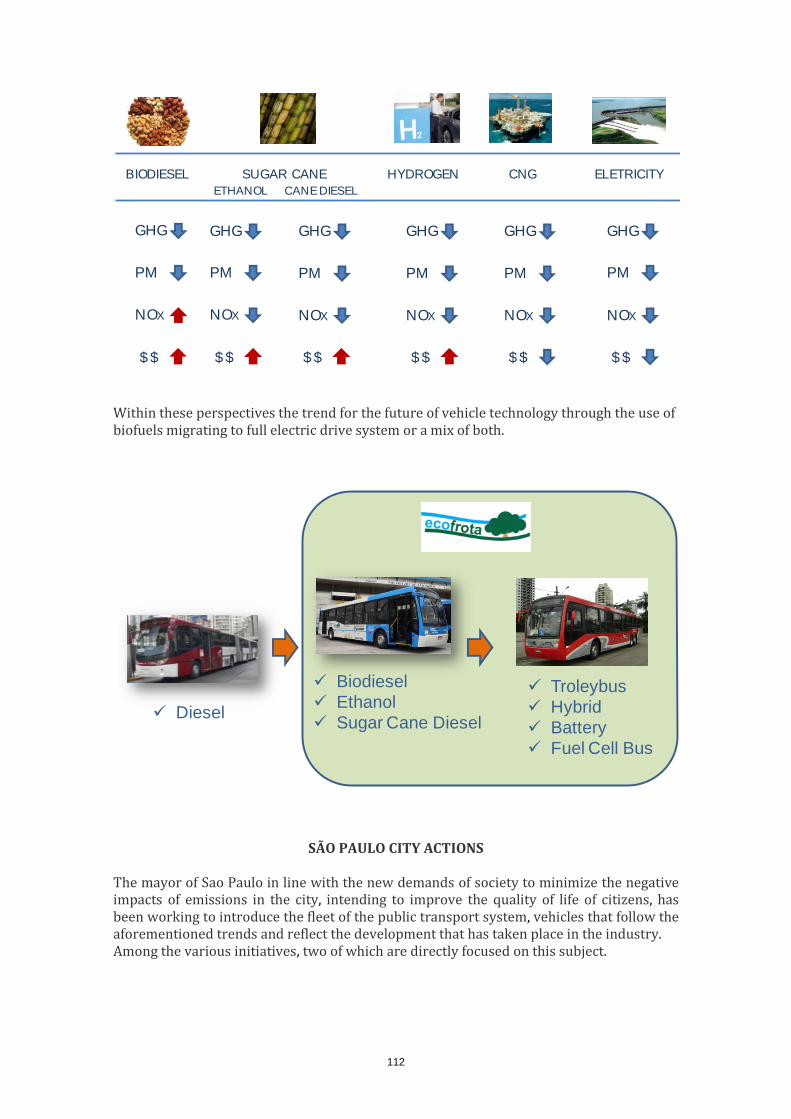
112
Within these perspectives the trend for the future of vehicle technology through the use of biofuels migrating to full electric drive system or a mix of both.
SÃO PAULO CITY ACTIONS
The mayor of Sao Paulo in line with the new demands of society to minimize the negative impacts of emissions in the city, intending to improve the quality of life of citizens, has been working to introduce the fleet of the public transport system, vehicles that follow the aforementioned trends and reflect the development that has taken place in the industry. Among the various initiatives, two of which are directly focused on this subject.
BIODIESEL SUGAR CANE HYDROGEN CNG ELETRICITY
ETHANOL CANE DIESEL
PM
GHG
NOX
GHG GHG GHG GHG GHG
PM PM PM PM PM
NOX NOX NOX NOXNOX
$ $ $ $ $ $$ $ $ $ $ $
Diesel
Biodiesel
Ethanol
Sugar Cane Diesel
Troleybus
Hybrid
Battery
Fuel Cell Bus
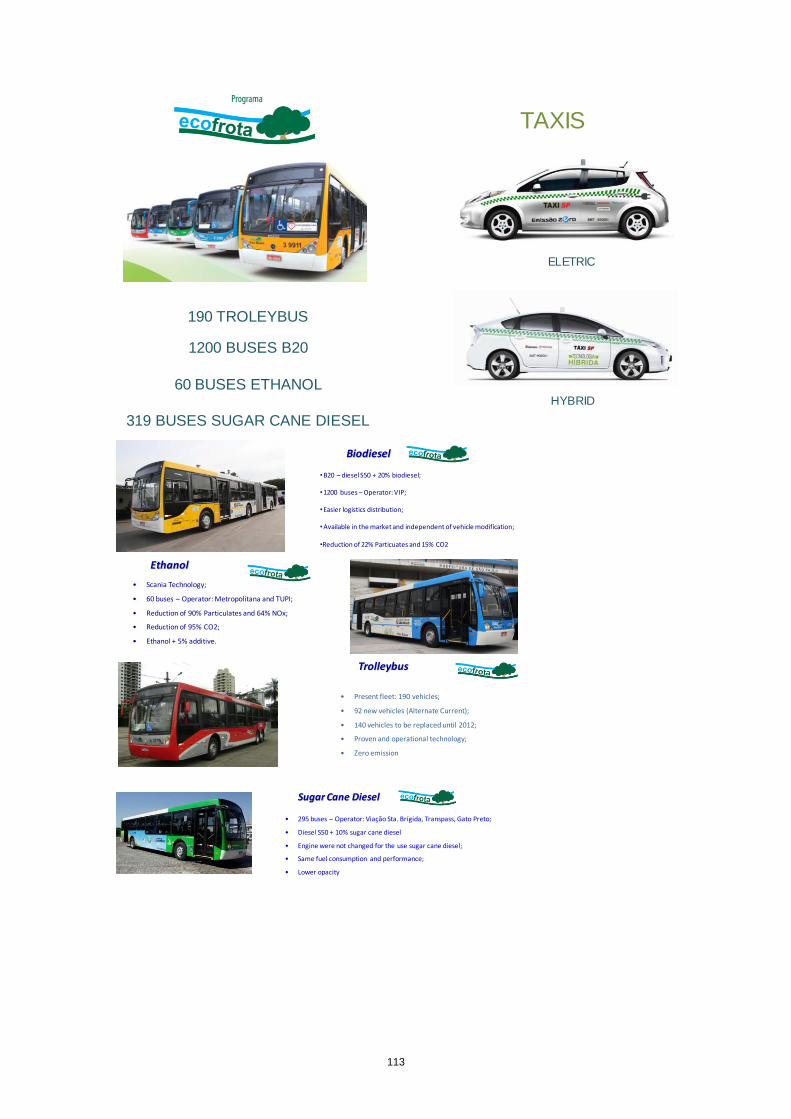
113
190 TROLEYBUS
1200 BUSES B20
60 BUSES ETHANOL
319 BUSES SUGAR CANE DIESEL
TAXIS
HYBRID
ELETRIC
• Scania Technology;
• 60 buses – Operator: Metropolitana and TUPI;
• Reduction of 90% Particulates and 64% NOx;
• Reduction of 95% CO2;
• Ethanol + 5% additive.
Ethanol
•B20 – diesel S50 + 20% biodiesel;
•1200 buses– Operator: VIP;
•Easier logistics distribution;
•Available in the market and independent of vehicle modification;
•Reduction of 22% Particuates and 15% CO2
Biodiesel
• Present fleet: 190 vehicles;
• 92 new vehicles (Alternate Current);
• 140 vehicles to be replaced until 2012;
• Proven and operational technology;
• Zero emission
Trolleybus
Sugar Cane Diesel
• 295 buses – Operator: Viação Sta. Brígida, Transpass, Gato Preto;
• Diesel S50 + 10% sugar cane diesel
• Engine were not changed for the use sugar cane diesel;
• Same fuel consumption and performance;
• Lower opacity
114
PERSPECTIVES
In the short term with the entry L5 and P7 PROCONVE phases prospects regarding pollutant emissions are quite positive since gradually vehicle fleet is being renewed for newer models and less polluting, but regarding emissions CO2 prospects are extremely negative. The big gain in CO2 emissions that had over the last few years was mainly due to entry of the fleet of flex cars on the market and use for her, ethanol replacing gasoline. This fact was responsible for the elimination of emission of thousands of tons of CO2 into the atmosphere. This panorama unfortunately changed last year due to the bad phase of the alcohol sector deficit in the supply of ethanol and consequent high price, which made the flex fuel car users to migrate to gasoline, thereby increasing CO2 emissions. This situation should continue for the next few years until appropriate policies are adopted and their effects reach the market. The long-term prospects are more favorable for both the emission of pollutants and for the reduction of emissions of greenhouse gases with the entry of new more efficient technologies. An example of this would be the realization of hybrid vehicles on the market. Also the alcohol sector is expected to recover and with it the adjustment of consumption of ethanol over the gasoline and consequently reducing emissions of greenhouse gases.
CONCLUSION
To that actually succeeds in the goal of reducing emissions of pollutants and greenhouse gases in the transportation sector is essential to break paradigms and effectively introduce new technologies, whether in fuel used, in the traction system or both, in order to make vehicles more efficient and less polluting. Several actions are needed to make this happen, but two of them are critical and deserve special attention: • appropriate legislation - is essential to adjust current law to require and ensure the continuous development of vehicles so they are more efficient and less polluting. • Incentives - create real incentives to minimize the high costs of implementing new technologies, according to the benefits that they bring to society.
115
SUBSTITUTE NATURAL GAS FROM BIOMASS – DECENTRALISED GASIFICATION AND METHANATION
Marius Dillig, Juergen Karl
Chair of Energy Process Engineering, Universität Erlangen-Nürnberg
ABSTRACT
The production of synthetic natural gas (SNG = Substitute Natural Gas) from biomass is one of the promising options to reduce bottlenecks in supply with natural gas and to substitute fossil fuel with renewably energy. The SNG production offers significant economic and commercial advantages in case that the SNG is produced in small-scale decentralized plants. In particular, the option to use the waste heat of the process for domestic heating or heating grids increases the total efficiency. Analogously to combined heat and power production (CHP) this so-called polygeneration provides additional revenues for the plant operator. This ‘double income’ situation allows for higher specific investment costs and increases the market for small-scale methanation sites. Keywords: substitute natural gas, biomass, gasification, hot gas cleaning, methane
1. INTRODUCTION
1.1. Motivation The conversion of solid biomass and wastes into a hydrogen rich synthesis gas enables the synthesis of a huge variety of so-called second generation fuels like hydrogen, biomass-to-liquids (BtL), bioethanol, methanol and several other gaseous and liquid other hydrocarbons. These concepts have to compete with established conversion technologies for heat and power production from biomass. The main drawbacks of the conversion into Second Generation Fuel are high energy losses and the fact that complex conversion routes require large-scale applications. ‘Economy-of-scale’ is commonly considered to be essential for overcoming financial barriers and to get these technologies competitive. A quite promising alternative is the conversion of woody biomass into so-called ‘Substitute Natural Gas’ (SNG). The methanation of wood allows to producing a highly valuable gas composition, which meets the technical requirements for its feeding into existing natural gas pipelines. The substitution of fossil natural gas with biogenous SNG will not only contribute to the reduction of CO2 emissions – it will also moderate upcoming restrictions European energy supply with natural gas (see Figure 1). The widespread availability of natural gas pipelines allows applying the SNG technology in small-scale decentralized plants. The necessary technologies for the upgrading of the methanized syngas – namely the drying, removal of CO2 requires the same technologies, which are already commonly used for to the feeding of biogas into these pipelines.
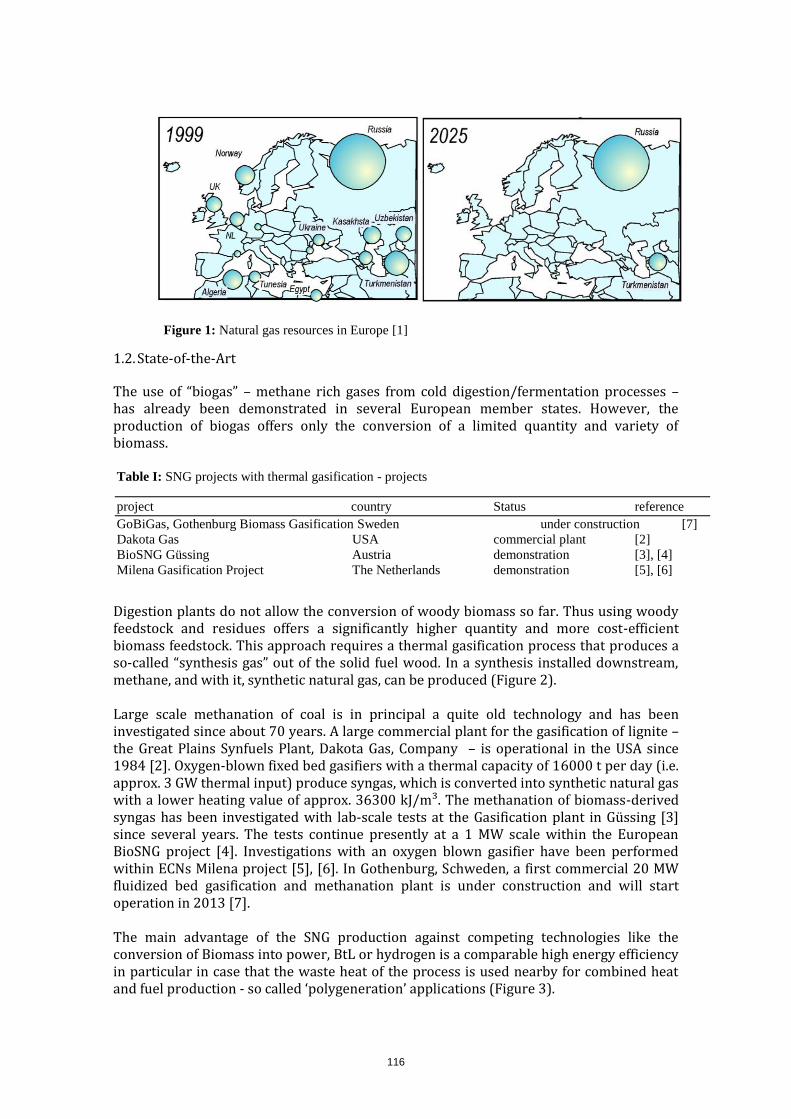
116
1.2. State-of-the-Art
The use of “biogas” – methane rich gases from cold digestion/fermentation processes – has already been demonstrated in several European member states. However, the production of biogas offers only the conversion of a limited quantity and variety of biomass.
Digestion plants do not allow the conversion of woody biomass so far. Thus using woody feedstock and residues offers a significantly higher quantity and more cost-efficient biomass feedstock. This approach requires a thermal gasification process that produces a so-called “synthesis gas” out of the solid fuel wood. In a synthesis installed downstream, methane, and with it, synthetic natural gas, can be produced (Figure 2). Large scale methanation of coal is in principal a quite old technology and has been investigated since about 70 years. A large commercial plant for the gasification of lignite – the Great Plains Synfuels Plant, Dakota Gas, Company – is operational in the USA since 1984 [2]. Oxygen-blown fixed bed gasifiers with a thermal capacity of 16000 t per day (i.e. approx. 3 GW thermal input) produce syngas, which is converted into synthetic natural gas with a lower heating value of approx. 36300 kJ/m³. The methanation of biomass-derived syngas has been investigated with lab-scale tests at the Gasification plant in Güssing [3] since several years. The tests continue presently at a 1 MW scale within the European BioSNG project [4]. Investigations with an oxygen blown gasifier have been performed within ECNs Milena project [5], [6]. In Gothenburg, Schweden, a first commercial 20 MW fluidized bed gasification and methanation plant is under construction and will start operation in 2013 [7]. The main advantage of the SNG production against competing technologies like the conversion of Biomass into power, BtL or hydrogen is a comparable high energy efficiency in particular in case that the waste heat of the process is used nearby for combined heat and fuel production - so called ‘polygeneration’ applications (Figure 3).
Table I: SNG projects with thermal gasification - projects
project country Status reference
GoBiGas, Gothenburg Biomass Gasification Sweden under construction [7]
Dakota Gas USA commercial plant [2]
BioSNG Güssing Austria demonstration [3], [4]
Milena Gasification Project The Netherlands demonstration [5], [6]
Figure 1: Natural gas resources in Europe [1]
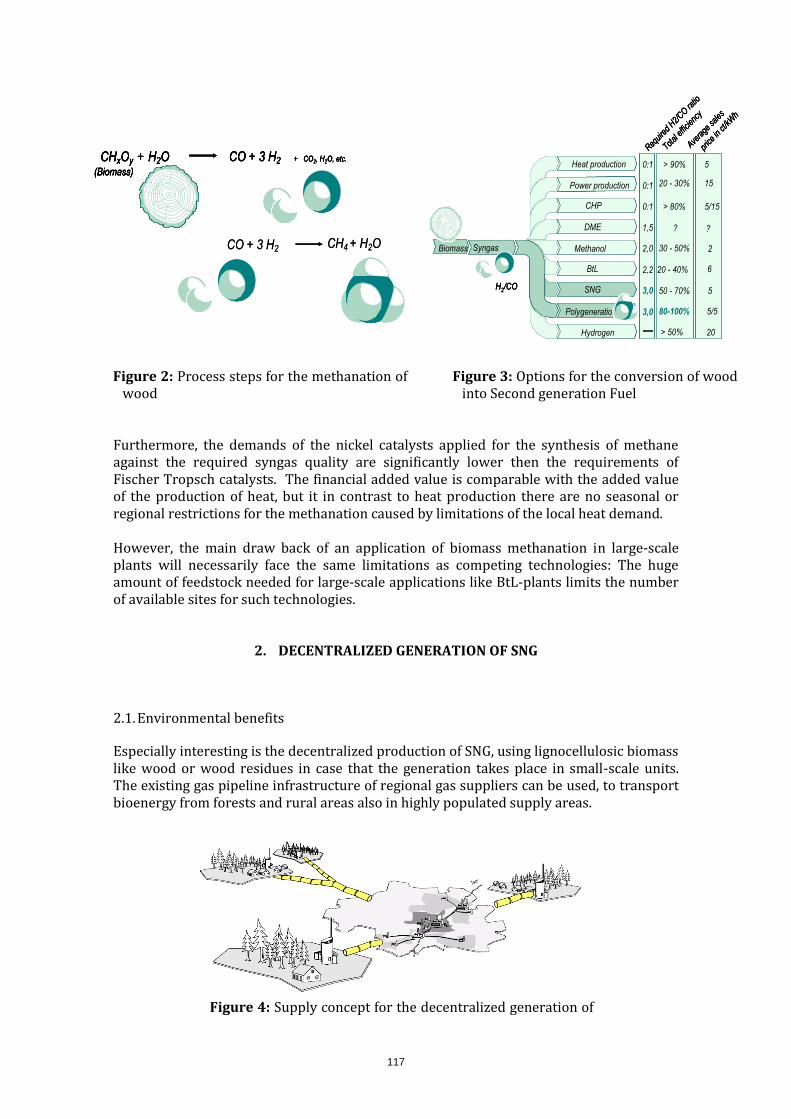
117
Figure 2: Process steps for the methanation of
wood
Figure 3: Options for the conversion of wood into Second generation Fuel
Furthermore, the demands of the nickel catalysts applied for the synthesis of methane against the required syngas quality are significantly lower then the requirements of Fischer Tropsch catalysts. The financial added value is comparable with the added value of the production of heat, but it in contrast to heat production there are no seasonal or regional restrictions for the methanation caused by limitations of the local heat demand. However, the main draw back of an application of biomass methanation in large-scale plants will necessarily face the same limitations as competing technologies: The huge amount of feedstock needed for large-scale applications like BtL-plants limits the number of available sites for such technologies.
2. DECENTRALIZED GENERATION OF SNG
2.1. Environmental benefits
Especially interesting is the decentralized production of SNG, using lignocellulosic biomass like wood or wood residues in case that the generation takes place in small-scale units. The existing gas pipeline infrastructure of regional gas suppliers can be used, to transport bioenergy from forests and rural areas also in highly populated supply areas.
Figure 4: Supply concept for the decentralized generation of
CO + 3 H2 CH4 + H2O
CO + 3 H2CHxOy + H2O(Biomass)
+ CO2, H2O, etc.
CO + 3 H2 CH4 + H2O
CO + 3 H2CHxOy + H2O(Biomass)
+ CO2, H2O, etc.CO + 3 H2CHxOy + H2O(Biomass)
+ CO2, H2O, etc.CO + 3 H2CHxOy + H2O(Biomass)
+ CO2, H2O, etc.
Syngas
H2/CO
Polygeneration
BtL
Heat production
CHP
Methanol
DME
Power production
SNG
Hydrogen
Biomass
0:1
0:1
0:1
2,2
2,0
1,5
3,0
3,0
> 90%
20 - 30%
> 80%
20 - 40%
30 - 50%
50 - 70%
80-100%
> 50%
Requir
edH2/
CO ratio
Total
effic
iency
Avera
gesa
les
price
in ct/
kWh
?
5
15
5/15
6
2
5
5/5
20
?
Syngas
H2/CO
Polygeneration
BtL
Heat production
CHP
Methanol
DME
Power production
SNG
Hydrogen
Biomass
0:1
0:1
0:1
2,2
2,0
1,5
3,0
3,0
> 90%
20 - 30%
> 80%
20 - 40%
30 - 50%
50 - 70%
80-100%
> 50%
Requir
edH2/
CO ratio
Total
effic
iency
Avera
gesa
les
price
in ct/
kWh
?
5
15
5/15
6
2
5
5/5
20
?
Syngas
H2/CO
Polygeneration
BtL
Heat production
CHP
Methanol
DME
Power production
SNG
Hydrogen
Biomass
0:1
0:1
0:1
2,2
2,0
1,5
3,0
3,0
> 90%
20 - 30%
> 80%
20 - 40%
30 - 50%
50 - 70%
80-100%
> 50%
Requir
edH2/
CO ratio
Total
effic
iency
Avera
gesa
les
price
in ct/
kWh
?
5
15
5/15
6
2
5
5/5
20
?
5
15
5/15
6
2
5
5/5
20
?

118
SNG Due to the substitution of fossil natural gas and the protection of natural gas resources, such concepts would contribute fundamentally to a sustainable energy system. Feeding renewable SNG gas into existing gas grids substitutes not only fossil fuel; it reduces also dependencies from non-European gas suppliers and contributes therefore to improving the security of supply for natural gas. Thus, the methanation of wood makes the bioenergy also available to urban areas. Towns and urban areas provide a much better infrastructure for an efficient use of the renewable energy in combined heat and power system than rural areas. The decentralized generation and transportation of SNG via existing gas grids avoids furthermore emissions (in particular fine dust emissions) in urban centers. The transportation of large quantities of Biomass from rural areas over long distances into urban centers causes usually not only high emissions but also significant logistic costs. Transportation of the bioenergy by means of existing gas pipelines is the most adequate and sustainable measure to avoid these emissions and costs. A decentralized approach will therefore allow to using in particular huge potentials of woody biomass to provide large quantities of renewable energy into the Pan-European natural gas networks. The advantage of the production of SNG with thermal gasification processes over biomethane out of cold digestion processes is, that
SNG-plants can also use woody biomass and residual material plants can not only be realised in rural areas.
2.2. Financial benefits The decentralized generation of SNG provides also significant financial benefits. In case that the waste heat can be used locally or for district heating the operation allows additional revenues from heat sales. This allows a ‘double income’ situation (Figure 5) similar to combined-heat-and-power applications, which make power production competitive also in the small-scale range.
Figure 5: Specific SNG production costs (reference scenario: total plant costs 900 000 €, depreciation period 12 years, bank rate 6%, conversion efficiency 70%, wood chips 50 €/t)
0
2
4
6
8
10
12
14
16
18
20
0 2000 4000 6000 8000
Full load hours
SN
G-p
rice
in c
t/kW
h
Operational costs
fuel costs
reference-Scenario:
SNG plant 500 kW
total investment 900 000 €
Fuel costs 50 €/t
investment costs
Reformer
methanationgas conditioning
2
4
6
8
10
12
14
16
18
-2
SN
G-p
ricewith
heatrevenues
in c
t/kW
h
heatrevenues
in c
t/kW
h
0
2
4
6
8
10
12
14
16
18
20
0 2000 4000 6000 8000
Full load hours
SN
G-p
rice
in c
t/kW
h
Operational costs
fuel costs
reference-Scenario:
SNG plant 500 kW
total investment 900 000 €
Fuel costs 50 €/t
investment costs
Reformer
methanationgas conditioning
2
4
6
8
10
12
14
16
18
-2
SN
G-p
ricewith
heatrevenues
in c
t/kW
h
heatrevenues
in c
t/kW
h
119
2.2. Further commercial benefits
Decentralized methanation offers additional commercial benefits in particular for investors and developers: Introducing a new technology in the small-scale range reduces technical and financial risks and allows gaining scale effects due to standardization. The main advantages for customers are reduced technical and commercial risks and in particular the favorable option to achieve additional heat revenues with polygeneration. Polygeneration allows even to overcome the main advantage of large-scale applications - the usually higher process efficiency. Table II: Comparison decentralized and large-scale methanation
Decentralized methanation Large-scale methanation
for developers + lower capital demand + lower specific engineering
costs due to volume production
for customers + appropriate for low density
fuels (i.e. Biomass) + significantly reduced
technical and financial risks + enables Polygeneration
for customers + lower specific costs + higher efficiencies
TECHNICAL APPROACH
3.1. Appropriate Gasification technologies
The methanation of woody fuels basically requires four process steps: 1. gasification (reformation of biomass) 2. hot gas conditioning (removal of particles, hydrocarbons, alkalis, heavy metals,
chlorine and sulphur) 3. methanation 4. raw SNG processing (removal of CO2 and water)
Particularly advantageous for this process is the so-called “steam gasification” or “reformation” of the biomass, due to the production of a synthesis gas, which has a composition perfectly suited for methanation. A technology that provides a syngas with a particularly high H2/CO-ratio is the so-called Biomass Heatpipe Reformer. The Heatpipe-Reformer-Technology was developed within the FP5 Project “Biomass Heatpipe Reformer” (EU-Project ENK5-CT-2000-00311, [8]) and enables the production of a high-quality syngas, which is perfectly suitable for a methanation installed downstream, due to
an ideal H2/CO ratio of 3:1 gasification pressure > 5 bar
Due to its simpleness the technology allows even to realize synthesis processes in small- and medium-scale units. The manufacturer – the SME company Agnion [9], [10] – expects

120
economic feasible operation of the plant even within a range of 500 kW (see Figure 5). In particular the pressurized gasification (Heatpipe Reformer) and the hot gas cleaning allows for more cost effective units.
3.2. Hot gas cleaning A key technology for the application of biomass methanation within the small-scale range is the gas cleaning. Cold gas cleaning at atmospheric conditions are reliably and well-known systems but cooling, syngas scrubbing and compression cause high energetic losses. A large amount of the waste heat of the process is provided at low temperatures and cannot be used for heating applications. These losses and the complexity of these systems have been the main obstacle for internal combustion engines with integrated gasification to become competitive. Hot gas conditioning technologies may provide significantly simpler systems. Systems for the methanation will base on gas cleaning technologies which have been developed for so-called Solid Oxide Fuel Cells within the EU Project BioCellus (FP6 STREP Project BioCellus SES6 – 502759 [11]). The performance of Solid Oxide fuel cells depends on quite similar Nickel based catalysts as the methanation synthesis. Thus, proven technologies for the pre-reforming of tars and the removal of particles, alkali and heavy metal components sulphur and chlorine may provide less complex systems that make decentralized applications feasible. 3.3 Feasible Efficiencies The methanisation converts 60-70% of the biomass energy into burnable gases. The local use of the waste heat and in particular the heat-of-condensation of the gas improves the total energy conversion - like in condensing boilers - up to 100 %: The option to use not only the waste heat of gasification and methanation, but also the heat-of-condensation of the steam content of the raw gas (due to the increased system pressure) is especially profitable: In case that the complete process is pressurized for instance to 5 bars, the heat-of-condensation of the steam content in the produced gas can be used at a considerable high temperature level (i.e. approx. 120°C). Thus analogously to the condensing boiler technology, total energy conversion efficiencies of 90% to 100% can be achieved. This “combined synthesis and heat” (“polygeneration”) provides therefore exceptionally high fuel utilizations.
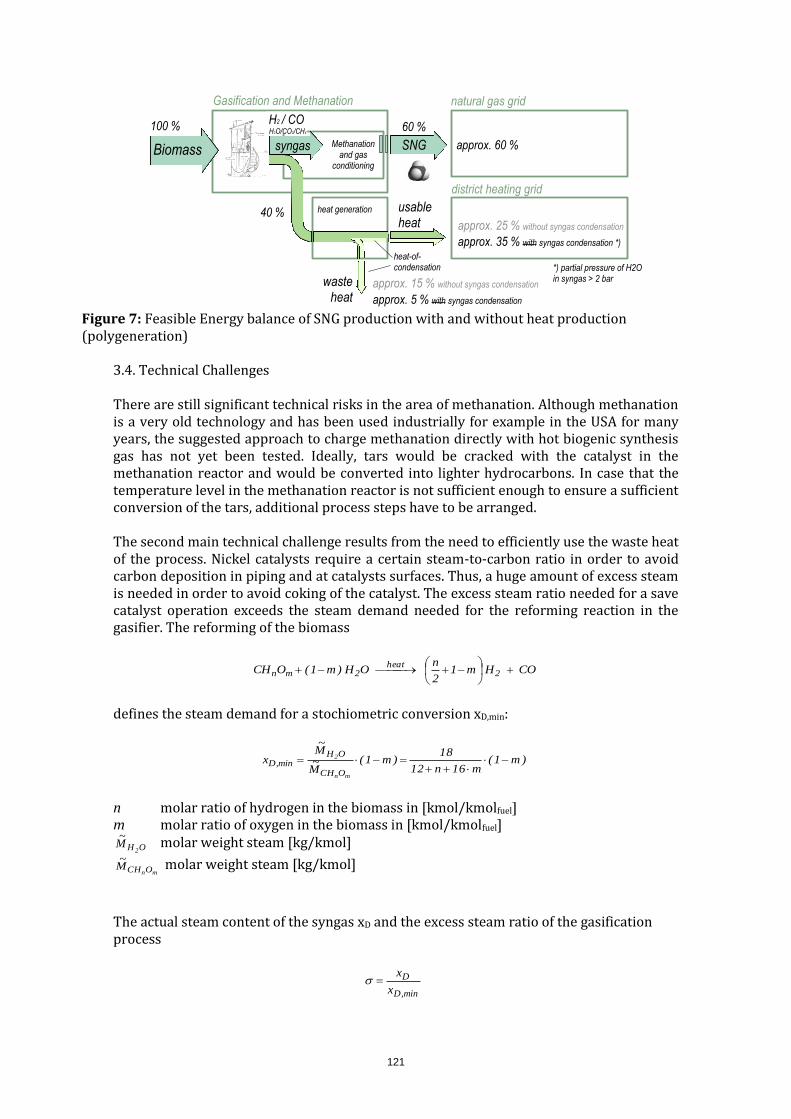
121
3.4. Technical Challenges There are still significant technical risks in the area of methanation. Although methanation is a very old technology and has been used industrially for example in the USA for many years, the suggested approach to charge methanation directly with hot biogenic synthesis gas has not yet been tested. Ideally, tars would be cracked with the catalyst in the methanation reactor and would be converted into lighter hydrocarbons. In case that the temperature level in the methanation reactor is not sufficient enough to ensure a sufficient conversion of the tars, additional process steps have to be arranged. The second main technical challenge results from the need to efficiently use the waste heat of the process. Nickel catalysts require a certain steam-to-carbon ratio in order to avoid carbon deposition in piping and at catalysts surfaces. Thus, a huge amount of excess steam is needed in order to avoid coking of the catalyst. The excess steam ratio needed for a save catalyst operation exceeds the steam demand needed for the reforming reaction in the gasifier. The reforming of the biomass
COHm12
nOH)m1(OCH 2
heat2mn
defines the steam demand for a stochiometric conversion xD,min:
)m1(m16n12
18)m1(
M~M~
x
mn
2
OCH
OHmin,D
n molar ratio of hydrogen in the biomass in [kmol/kmolfuel] m molar ratio of oxygen in the biomass in [kmol/kmolfuel]
OH 2M~
molar weight steam [kg/kmol]
mnOCHM~ molar weight steam [kg/kmol]
The actual steam content of the syngas xD and the excess steam ratio of the gasification process
min,D
D
x
x
Figure 7: Feasible Energy balance of SNG production with and without heat production (polygeneration)
syngas Methanation and gas
conditioning
H2 / CO H2O/CO2/CH4
SNG
Gasification and Methanation
100 %
Biomass
heat generation40 % approx. 25 % without syngas condensation
approx. 35 % with syngas condensation *)
approx. 15 % without syngas condensation
approx. 5 % with syngas condensation
approx. 60 %
usable heat
waste heat
natural gas grid
district heating grid
60 %
heat-of-condensation *) partial pressure of H2O
in syngas > 2 bar

122
determine the heat demand and the energy efficiency of the gasification process and thus the complete methanation process.
Figure 8: Influence of the excess steam ratio
on the chemical efficiency of indirect gasification systems
Figure 9: Thermodynamic limits for
carbon deposition during methanation of biomass
The minimum steam-to-carbon ratio of the process depends basically on thermodynamic equilibria of the processes. The thermodynamic limits to prevent carbon formation in a syngas / water steam mixture derived from steam gasification of biomass are shown in Fig. 9. Methanation Temperatures in the range of 500°C require steam-to-biomass or correspondingly steam-to-carbon-ratios of approximately two. This means that the required excess steam ratio for the gasification process exceeds = 5. This affects severely the total process efficiency as shown in Fig. 8. Thus, an efficient use of the latent heat of the steam by means of an efficient syngas condensation gets highest priority.
3. CONCLUSION
Methanation of wood is an extraordinarily convincing concept for the substitution of fossil fuels. The energy losses during the conversion process are significantly lower as the losses caused by the synthesis of any other second generation fuel. However, the most important argument for the conversion of biomass into SNG comes from the favorable properties of natural gas: The end user will be able to use also substitute natural gas with highest flexibility and efficiency as stated in Figure 10. Applying SNG in condensing boilers for domestic heating or in combined cycle power plants compensates in many cases the energy losses of gasification and methanation in comparison to the direct use of solid biomass.
chemically bonded energy
sensible heat syngas
Sensiblee heat steam
latent heat steam
indirect gasification (reforming)
100%100% 75%75%
800°Cbiomass
= 2,6
S/C = 1
xH2O= 21%
3,1
1,2
31%
73%73%
3,8
1,5
39%
70%70%
5,1
22
51%
65%65%1/31/3
2/32/3
chemically bonded energy
sensible heat syngas
Sensiblee heat steam
latent heat steam
indirect gasification (reforming)
100%100% 75%75%
800°Cbiomass
= 2,6
S/C = 1
xH2O= 21%
3,1
1,2
31%
73%73%
3,1
1,2
31%
73%73%
3,8
1,5
39%
70%70%
3,8
1,5
39%
70%70%
5,1
22
51%
65%65%
5,1
22
51%
65%65%1/31/3
2/32/3
H
C
80%
O
100%
20%60% 10%
40%
100%
100%
20%
20%80%
80%
60%
60% 40%
40%
10%
10%
30%
30%
30%
50%
50%
50%
70%
70%
70%
90%
90%
90%
mol% Cmol% O
mol% H
700°C
850°C
500°C
carbon formation
no carbon formation
BiomassBiomass
waterwater
SteamSteam--toto--carboncarbon ratioratio = 2= 2
22
11
H
C
80%
O
100%
20%60% 10%
40%
100%
100%
20%
20%80%
80%
60%
60% 40%
40%
10%
10%
30%
30%
30%
50%
50%
50%
70%
70%
70%
90%
90%
90%
mol% Cmol% O
mol% HH
C
80%
O
100%
20%60% 10%
40%
100%
100%
20%
20%80%
80%
60%
60% 40%
40%
10%
10%
30%
30%
30%
50%
50%
50%
70%
70%
70%
90%
90%
90%
mol% Cmol% O
mol% H
700°C
850°C
500°C
carbon formation
no carbon formation
BiomassBiomass
waterwater
BiomassBiomass
waterwater
SteamSteam--toto--carboncarbon ratioratio = 2= 2
22
11
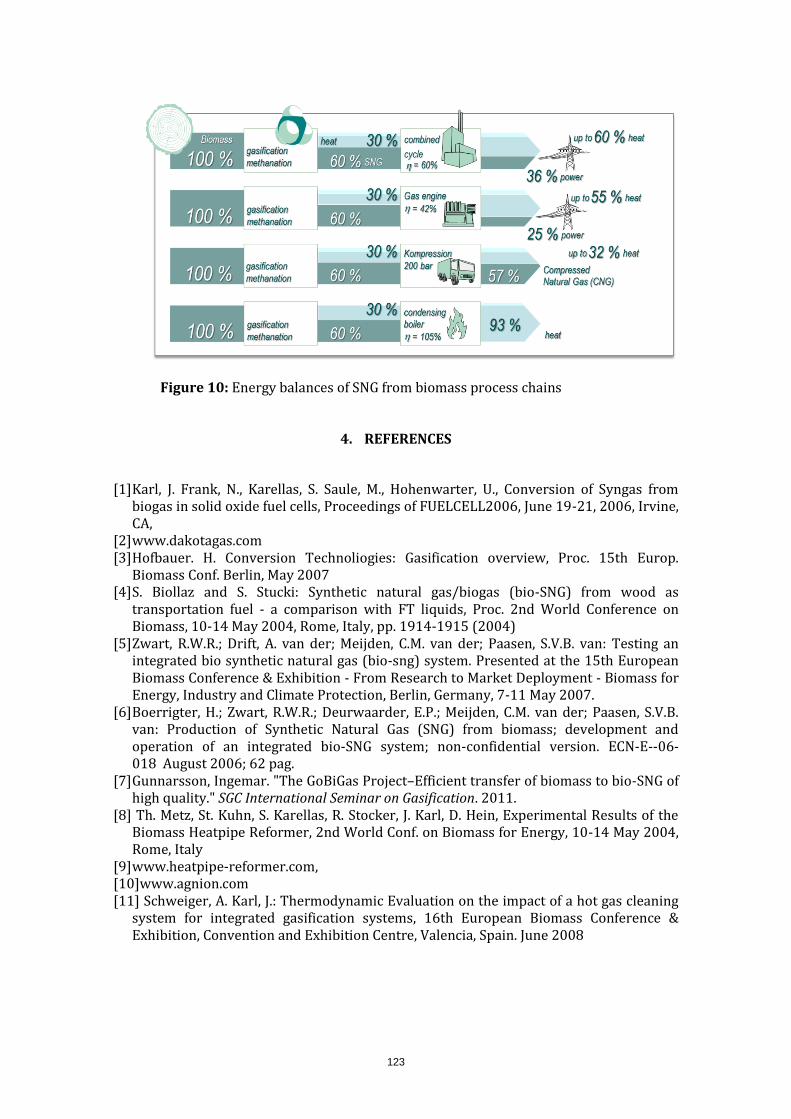
123
4. REFERENCES
[1] Karl, J. Frank, N., Karellas, S. Saule, M., Hohenwarter, U., Conversion of Syngas from
biogas in solid oxide fuel cells, Proceedings of FUELCELL2006, June 19-21, 2006, Irvine, CA,
[2] www.dakotagas.com [3] Hofbauer. H. Conversion Technoliogies: Gasification overview, Proc. 15th Europ.
Biomass Conf. Berlin, May 2007 [4] S. Biollaz and S. Stucki: Synthetic natural gas/biogas (bio-SNG) from wood as
transportation fuel - a comparison with FT liquids, Proc. 2nd World Conference on Biomass, 10-14 May 2004, Rome, Italy, pp. 1914-1915 (2004)
[5] Zwart, R.W.R.; Drift, A. van der; Meijden, C.M. van der; Paasen, S.V.B. van: Testing an integrated bio synthetic natural gas (bio-sng) system. Presented at the 15th European Biomass Conference & Exhibition - From Research to Market Deployment - Biomass for Energy, Industry and Climate Protection, Berlin, Germany, 7-11 May 2007.
[6] Boerrigter, H.; Zwart, R.W.R.; Deurwaarder, E.P.; Meijden, C.M. van der; Paasen, S.V.B. van: Production of Synthetic Natural Gas (SNG) from biomass; development and operation of an integrated bio-SNG system; non-confidential version. ECN-E--06-018 August 2006; 62 pag.
[7] Gunnarsson, Ingemar. "The GoBiGas Project–Efficient transfer of biomass to bio-SNG of high quality." SGC International Seminar on Gasification. 2011.
[8] Th. Metz, St. Kuhn, S. Karellas, R. Stocker, J. Karl, D. Hein, Experimental Results of the Biomass Heatpipe Reformer, 2nd World Conf. on Biomass for Energy, 10-14 May 2004, Rome, Italy
[9] www.heatpipe-reformer.com, [10]www.agnion.com [11] Schweiger, A. Karl, J.: Thermodynamic Evaluation on the impact of a hot gas cleaning
system for integrated gasification systems, 16th European Biomass Conference & Exhibition, Convention and Exhibition Centre, Valencia, Spain. June 2008
Figure 10: Energy balances of SNG from biomass process chains
124
ENERGY RESEARCH IN BAVARIA: WHY INTERNATIONAL COOPERATION
MATTERS7
Florence Gauzy Krieger, WKS Bayern-Québec/Alberta/International
(Bavarian Office for International Scientific Cooperation)
ABSTRACT
In 2011, after the Fukushima nuclear accident, Germany suddenly enforced a radical change in its energy policy. With the energy transition, the switch from nuclear and fossil energy to renewable energy and more efficiency is now in progress. By approximately 2022, the last nuclear plant in Germany is to be shut down; at the beginning of 2011, 17 were still in operation. To fill the gap in the energy supply during the nuclear phase-out, a significant effort in research and development is needed. The State of Bavaria has therefore set up a new cross-ministry Alliance on Energy Research and Technology that supports scientific projects at the regional level. Around 147 million Euros will be invested over the next five years. Together with the German federal funding schemes and the Research Framework Program of the European Union, which both focus on energy research, this Alliance offers real opportunities – and challenges as well – for international cooperation. Part 1: The German energy transition - key facts After the Fukushima nuclear accident in 2011, Chancellor Merkel suddenly decided to enforce a radical change in the German energy policy towards independence from nuclear power. The new energy program is based upon six principles:
1. Phase-out of nuclear power plants by 2022
2. Increase the share of renewable energies in the production of electricity to 50%
3. Maintain the current level of electricity consumption through improvements of energy saving and energy efficiency
4. Improvement and development of energy grids and energy storage technology
5. Filling the energy gap through flexible gas-based power plants
6. Further R&D on innovative energy technologies
This is a challenging program. One crucial aspect is to facilitate a sophisticated harmonization and cost-efficient synchronization of the further development of
• renewable energies,
• power-grids (esp. high voltage power lines)
• complementary flexible natural gas-based power plants
7 The following contribution has benefitted from several conversations with colleagues and experts in
Munich. I would like to acknowledge particularly the support provided by Michael Tyrkas (Bavarian
State Ministry of the Environment and Public Health), Kelvin Strausman and Volker Pitts-Thurm
(Bavarian Business Association)
125
• demand-side management activities
• energy efficiency/ energy savings
• R&D activities on energy storage
A particularly important issue on the current political agenda is the reformation of the German Renewable Energy Sources Act that is expected to become more market-based and more cost-efficient. In the long term a new electricity market design is already viewed as necessary. Like the German public, German industry welcomed the official announcement of the German energy transition program as a tremendous step forward in terms of environmental protection. At the same time, both groups stressed the program’s ambition and expressed concerns about timelines and expected costs. Why now? There are many good reasons for switching to renewable energies and increasing energy conservation: fighting climate change; reducing energy imports; stimulating technology innovation and the green economy; reducing and eliminating the risks of nuclear power; strengthening energy security; strengthening local economies and providing social justice. Historically, the Chancellor’s decision of 2011 was not such a surprise. The German Energiewende did not just come about after Fukushima. It is rooted in the anti-nuclear movement of the 70s and brings together both conservatives and conservationists — from environmentalists to the churches. The shock of the oil crisis of 1973 and the meltdown in Chernobyl in 1986 led to a search for alternatives — and the invention of feed-in tariffs in 1991 under Chancellor Helmut Kohl’s coalition of the conservative Christian Democrats and the Liberals FDP. They stipulate that green power takes priority over conventional power. In 1999, a unique incentive program was launched to support renewable heating systems (the 100,00 solar roofs program). Since 2000, Germany’s Renewable Energy Act (EEG) designed by the Social Democrats and the Greens under Chancellor Schröder has replaced the Feed-in Act. EEG guaranties full-cost compensation to cover the actual cost of a specific investment in terms of size and technology over 20 years (with decreasing rates). In 2001, the European Court of Justice confirmed that feed-in tariffs do not constitute State aid and are therefore legal. This is only one example of how much influence the German energy policy has in Europe.
In Bavaria The Bavarian State Government decided to make all necessary efforts to ensure a timely achievement of the energy transition. Energy efficiency/-saving and further development of renewable energies are the main vehicles to achieve Bavaria‘s climate protection and energy transformation objectives [Figures 1-2]. The policies implemented intend to increase energy security by reducing fossil fuels imports, to decrease the GHG emissions, and to create a green industry. The overall objective is to take the opportunity of reducing Bavarian energy dependency during the global economic crisis. In the German context, the State of Bavaria’s main objective is to ensure an environmentally friendly and secure energy supply at a reasonable price for Bavarian industry and the general public. Part 2: A technological challenge As illustrated in Figure 1 and Figure 2, Bavaria’s main effort applies to an extended use of all renewable potentials until 2020:

126
• The use of Hydraulic Power is to be increased from 15% to 17%. To this end, existing power plants and stations will be modernized. New power stations at existing cross-river constructions are in preparation.
• The use of Photovoltaic Power is to increase from 5% to 16% with the following measures:
PV on dumps, contaminated sites, alongside highways, railways, noise prevention structures
Citizen cooperative projects, e.g. on public buildings
• The use of Wind Power is to increase from <1% now to 6-10%
1.000 to 1.500 new wind turbines will be installed (especially 2,5 to 3 MW-turbines)
An accelerated administrative authorization process has to be set up
Update on evaluation of suitable territory (e.g. environmental aspects)
Citizen cooperative projects are encouraged
• The use of Biomass is to increase from 6% to 10%
Increased usage of residue and garbage substances
Challenge: avoidance of monocultures in the Bavarian landscape
As it can provide heat, electricity, and motor fuel, biomass is seen as the most promising renewable energy in the future. It is expected to make up nearly 2/3 of Germany's renewable energy consumption by 2020. However demand for biomass emerges from many other sectors besides the energy market. Germany promotes the use of residue and waste.
• Concerning Geothermal Energy, whose share is very limited, there is a Bavarian project to exploit the South German „Mollasse facies“: one of the largest geothermal areas.
There is a potential for renewable energy in Bavaria but two main obstacles remain: the distance between Bavaria in the South (with big industries and cities), and the North of Germany where the wind blows off the coasts (transportation issue); the lack of storage capacities (storage issue). Currently there are no technological solutions to store renewable energy for more than 2-3 days. In order to meet this technological challenge, Bavaria has launched a dedicated program to support research towards the objectives of the German energy transition. Under the umbrella of the Bavarian Alliance for Energy Research and Technology new research projects have been emerging for two years which will offer cooperation opportunities for international partners. Part 3: New energy research landscape Traditionally science is Bavaria’s most obvious resource (figure 3.)! The concentration of 9 Bavarian state universities, 7 Bavarian non-state universities, 13 Max-Planck institutes, 9 Fraunhofer institutes and 17 universities for applied sciences creates an exceptional

127
research landscape that was labeled “excellent” in three successive German federal research competitions between 2005/2006 and 2012. One major aspect of the Bavarian Alliance for Energy Research and Technology is to rely on this research excellence in basic and applied sciences as well as in industrial research to initiate specific energy research in a few dedicated sites mostly in the greater Munich area and in the North of Bavaria, in and around Nuremberg (figure 4.) that concentrate and cluster 13 newly funded research projects. The Bavarian Alliance for Energy Research and Technology is a cross-ministry initiative of four ministries (Research, Economy, Environment, and Agriculture). All together the Alliance invests more than 430 million Euros for three years (2012-2014) in Bavarian energy research projects. Renewable, transportation, storage and energy efficiency are a focus in these 13 new projects. EnCN (Energie Campus Nürnberg) is a consortium of 10 local research partners (Friedrich-Alexander-Universität Erlangen-Nürnberg, Georg-Simon-Ohm-Hochschule Nürnberg, 3 Fraunhofer Institutes, a Helmholtz Institute, and the Bavarian Centre for Applied Energy Research ZAE). They work together on research along the whole energy chain from production to transportation, storage and consumption. EnCN is unique in Germany. TUM.Energy with around 100 senior professors in 10 departments and 4 specific centers deal with power generation, renewable energies, e-mobility and energy efficiency in buildings. A very interesting aspect of TUM.Energy is the implication of socio-economic and environmental perspectives in the research design that involves the social sciences. There is a common understanding that the technological challenge can only be met in cooperation with international research partners. In the field of renewable energy, for example, Bavaria can learn a lot from its partners in the regional leaders’ summit. Students exchange and researchers’ mobility as well as joint research programs at the bilateral level pave the way to a fruitful cooperation. This is also true at the federal level. The 6th German Energy Research Program (2011) is based upon a similar assumption that the German researchers can only benefit from their international colleagues. The Federal Ministry of Economics and Technology, the Federal Ministry for the Environment, Nature Conservation and Nuclear Safety, the Federal Ministry of Food, Agriculture and Consumer Protection and the Federal Ministry of Education and Research state clearly the need and value of international cooperation in their operating principles. Horizon 2020, the incoming framework program of the European Union will follow the same international approach. Dedicated to excellent science, industrial leadership and societal challenges, Horizon 2020 is due to start on 1st January 2014 with a planned budget of €80 billion. One third of the overall budget will be provided to help address major concerns such as climate change, developing sustainable transport and mobility, making renewable energy more affordable. Looking back on the previous framework program FP7 (Figure 5.), there is some evidence that the funding repartition will be again favorable to energy-related topics that could already be supported under the energy scheme but also in the schemes of environment, ICT, nanotechnologies, and transportation. International cooperation will be a priority. All calls are expected to be open to international partners. In addition, targeted actions with key partner countries – and regions – will address specific priorities. A new strategy for international cooperation is already in place. No doubt the Regional Leaders’ Forum has the potential to become a platform and an accelerator for more international cooperation in science and technology. FIGURES
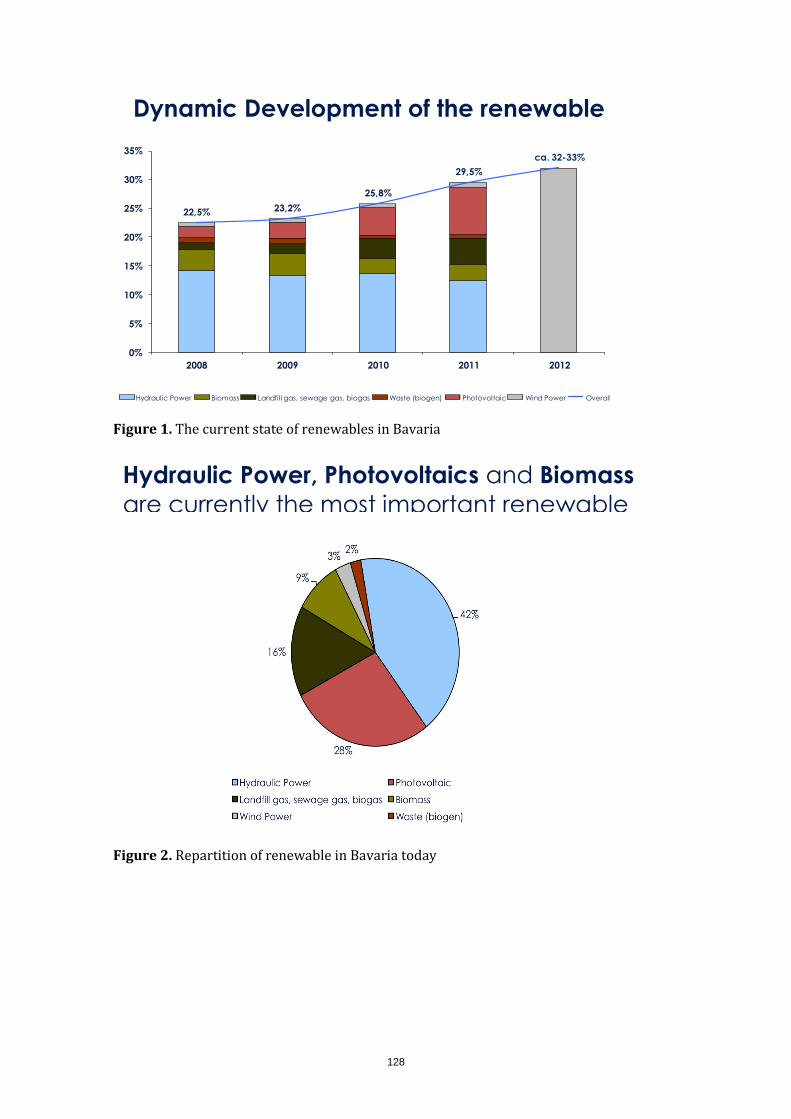
128
Figure 1. The current state of renewables in Bavaria
Figure 2. Repartition of renewable in Bavaria today
Hydraulic Power, Photovoltaics and Biomass
are currently the most important renewable
energies in Bavaria
Dynamic Development of the renewable
energies in Bavaria (2006-2011)
22,5% 23,2%
25,8%
29,5%
ca. 32-33%
0%
5%
10%
15%
20%
25%
30%
35%
2008 2009 2010 2011 2012
Hydraulic Power Biomass Landfill gas, sewage gas, biogas Waste (biogen) Photovoltaic Wind Power Overall

129
Figure 3. Research Institutions in Bavaria
Figure 4. Universities in Bavaria
Julius-Maximilians-
Universität Würzburg
Universität Bayreuth
Friedrich-Alexander-
Universität Erlangen-
Nürnberg
Universität Regensburg
Universität Augsburg
Ludwig-Maximilians-
Universität München
Technische Universität
9 Bavarian State
Universities
7 Bavarian Non-State
Universities
13 Max Planck Institutes
9 Fraunhofer Institutes
8 other research centres
(for example: Helmholtz,
Leibniz)
17 Bavarian universities
of applied sciences

130
Figure 5. FP7 overview
REFERENCES Reports: Bayerische Allianz für Energieforschung und –technologie: Rahmenkonzept. Empfehlungen der Expertenkommission, 2011 (online: http://www.stmwfk.bayern.de/forschung/energieforschung/) Michael Tyrkas : Energy Transition in Bavaria. A short overview on the current status and the future challenges. Bavarian State Ministry of the Environment and Public Health, 2012 (internal document). http://www.bmwi.de/English/Redaktion/Pdf/6th-energy-research-programme-of-the-federal-government,property=pdf,bereich=bmwi2012,sprache=en,rwb=true.pdf http://ec.europa.eu/research/horizon2020/index_en.cfm?pg=h2020 http://ec.europa.eu/research/iscp/index.cfm?pg=strategy http://energytransition.de/ Press articles: http://www.spiegel.de/spiegel/print/d-88963871.html http://www.economist.com/news/europe/21571440-germanys-national-energy-project-becoming-cause-disunion-troubled-turn

131
THE BIOGAS INDUSTRY DEVELOPMENT IN CHINA
By Li Aimin, Energy-saving Office of Shandong Province
Biogas is a kind of renewable energy which has the most prominent feature of clean, can efficiently utilize the organic waste, livestock manure, crop straw and other biomass waste. Due to the Biogas in accordance with the requirements of sustainable development, as well as its characteristics of green, clean, environmental protection and others, European Union, Japan, the United States and other developed countries are more and more in favor of Biogas, which formed the industry foundation for the good work in the gas storage, transportation and delivery. In 2006, the production quantity of Biogas in EU is about 5300000 tons of oil equivalent, growth 13.6% for year-on-year, and has been used as a motor fuel for large-scale applications. China is one of the early few countries in the world, which discovered and applied biogas as in embryonic form of biogas industrialization. In 1920s, Mr. Luo Guorui invented the first Chinese Hydraulic Floating Batch Digesters that is named as "China Guorui Methane Generator" (China Guorui Gas Vesse1). It can meet all the demand of energy use in a 6 member family for lighting and cooking. In 1970s, the peasant household biogas in some area are widely be used, becoming a supplement of rural life energy. In twenty-first Century, the biogas of China household digesters is in rapid growth. A total of number more than 40000000 in 2010. Unfortunately, we have had no Brand in the world. And we are fall behind in the industrial gas field, which is worthy of in-depth analysis. According to statistics, the number of pigs in China took up 51% of the world, the number of poultry took up more than 20% of the world. According to estimates, 1 pig manure emissions equivalent to 7 people, and 1 chickens of biochemical oxygen demand (BOD) emissions equivalent to 0.7 person. Such a large breeding population and the huge amount of excrement, annual is huge, and caused the water pollution and eutrophication problem. According to estimates, at present Chinese only livestock manure resources amount to about 8.5 tons. If converted to biogas can be reduced more than 78400000 tons of standard coal. If fully implemented, not only can effectively improve China's energy structure, to solve the shortage of energy, but also can improve the environmental situation in China in the very great degree. The conditions of Chinese biogas development is richly endowed by nature. However the production mode to farmers as the main body, the vast majority are small scattered rural biogas engineering. In 2008, the national household biogas digester gas production of about 12.2billion cubic meters. Rural household biogas digester volume of 6-10 cubic meters, the basic construction unit as "a pool of three changes", namely the household biogas digesters and ring, lavatories, changing kitchen. Some of the biogas production and breeding and combined, the development of ecological agriculture. Biogas production scale to farmers as the main body of the small, the industrial association is poor, can not form a complete industrial chain, severely limiting the biogas industrialization and biogas technology to the development of high-end. Most of the biogas is no commercialization for farmers built their own pools, own use, self-contained production approach, which limits the market consumption. Biogas produced by farmers is not for sale, which mainly meets their own needs. The vast majority is the demand of life, biogas is just as a consumer item. The amount of gas supplied in pipe network, gas-fired power generation, or car is very small.
132
Not only the biogas industry chain is incomplete, but also it is the lack of large-scale, market-oriented infrastructure and supporting industries. So most of the gas and electricity produced by the gas company or the grid can not be supplied to consumers. And all the related running match, increasing capacity, security such as a series of technical problems has not been put on the agenda. The biogas technical standards, quality certification system, as well as market access system has not been established.The biogas is not standardized commodity, which makes the town market or regional market is difficult to form. So It is difficulty for more talk less than a unified national market. China also built a number of large and medium-sized biogas projects. There are many equipment manufacturers and construction companies. Generally speaking, many biogas enterprises, the production model of the enterprise is small, which has not yet become a biogas industry body. China's large and medium-sized digesters was 15,625 in 2008, the total pool capacity was 3.58 million cubic meters, 460 million cubic meters of biogas production, only 3% of the total production of biogas, which is about 10% of the German biogas production. Biogas power generation installed capacity capacity took up only 1% of Germany. In order to deal with the problem, the corresponding guide policy for the development of biogas industry. As The National long-term science and technology development plan (2006-2020) explicitly biogas and other agricultural, forestry biomass integrated development and utilization are included in national key development target. According to the renewable energy and long-term development plan, by 2020, the 10,000 large-scale livestock farms biogas project built will have been built, industrial organic wastewater biogas projects will be 6,000, with an annual output of about 14 billion cubic meters of biogas. Ministry of Agriculture and the National Development and Reform Commission are doing the 12th five year’s biogas development plan. In addition, the country has just offered the seven major new industry development plan, in which four are associated with biogas. We need to achieve three strategic change to promote biogas industry in the future. As to achieve the transfer from single family to enterprises, consumption patterns from self-consumption of farmers to the market consumption, the development of the separation rural-urban to the urban-rural integration. Specific measures include: 1. Start development project of large-scale "the biogas field". The goal is to build a world-class biogas industry and significantly increase the proportion of biomass energy in China's energy structure. Our national government will the establishment of a complete industrial chain and supporting industries. The subsidization projects such as cogeneration, large-scale power generation and network integration in urban and rural areas, car gas, biogas fuel cell-based biogas energy complementary power generation. Grid service will be provided for gas network companies, power companies. The generate electricity volume will be purchased as approved by the national bench mark price. State-funded high-end chain technology research and development. A large number of foster innovative enterprises will be supported around the goal of a high-end chain which will be focused on solving the bio-transformation technology diversification, efficient, precision equipment and technology, serialization, and renewable energy technology integration.

133
The State-funded will be in the style of market-oriented approach. Enterprise will be invited for public bidding. Legal person as enterprise will be set up for operation, gradually The enterprise will earn profit as a virtuous economic cycle. 2. Carbon trading guide policy will be piloted in biogas industry. The main international carbon trading system is a mandatory system established on a basement of "measurable, reportable and verifiable". As well there are voluntary markets mainly limited to the exchange and businesses. Under the case that China does not have the conditions to implement mandatory carbon trading. The Government commissions bank or enterprise to set up foundation for incentivizing. To guide enterprises to establish a member low carbon alliance system, voluntary trading of carbon emission rights within the Union. At the same time, actively convergence with international carbon trading system. Access to financial and technical assistance to international organizations and developed countries by using of the Clean Development Mechanism (CDM) and international carbon trading system application sales biogas carbon credit indicators. A broiler farming enterprises in Shandong Province named Shandong Minhe Stock Raising Co., Ltd.invested more than RMB 7000 million using its own funds to build the world's largest chicken manure biogas power generation project in 2008. The project applies the raw material of company's day-to-day chicken manure and waste water as. The biogas cogeneration power generation technology is applied for resource development and multi-level use of chicken manure waste. The project generator sets was installed capacity of 3 MW for annual processing chicken manure of about 18 million tons, about 12 tons of sewage; 10,950,000 m3 to produce biogas. Electricity can be generated 21.9 million electrial dregree; production of solid organic fertilizer annual output of 1.3 million tons, liquid organic fertilizer production capacity of 24 million tonnes per annum, which has economic and ecological benefits. Currently, the project has been all completed and the power generation is going on smooth and has been continuous and stable operated for four years. And It becomes first successful registered CDM projects at the United Nations in the field of China's agricultural. The project, being built in this company, calling Purification Compression Project of Manure Biogas which is used for producing biogas from the chicken manure anaerobic fermentation process. And then the compressed purification biogas is used to generate biogas as a vehicle with a clean fuel, which further extending the biogas industry chain. The project reached the international advanced level in the production process. It processed 250,000 tons chicken excrement year after completion, processed180,000 tons of sewage farms, with an annual output of 10.99 million m3 biogas, the equivalent of 12.8 million liters of gasoline, the annual output of biogas slurry 446,000 tons, reduced greenhouse gas emissions by 226,000 tons. 3. Support enterprises to appointing train of Biomass Graduate. At present, there about 3.8 million people working China's rural energy professional and technical personnel, 22.7 million biogas technicians. But the R & D biomass personnel is serious lack. The professional universities and research institutions is rarely for establishment of the biomass. Biomass energy technology patent application was only 609 in 2008. We should encourage enterprises to commission post-graduate from universities and research institutes, government will grant funding universities for post-graduate studies or project support.

134
The industrial development is the only corner stone for that the biogas to achieve efficient, promote the use of the massive scale. Therefore we have to take a variety of ways to promote the industrialization of biogas. We believe that through our unremitting efforts, we must be able to realize the huge potential in China, the rapid development of biogas industry that is ready to go to really reach the goal of sustainable development of the national economy.
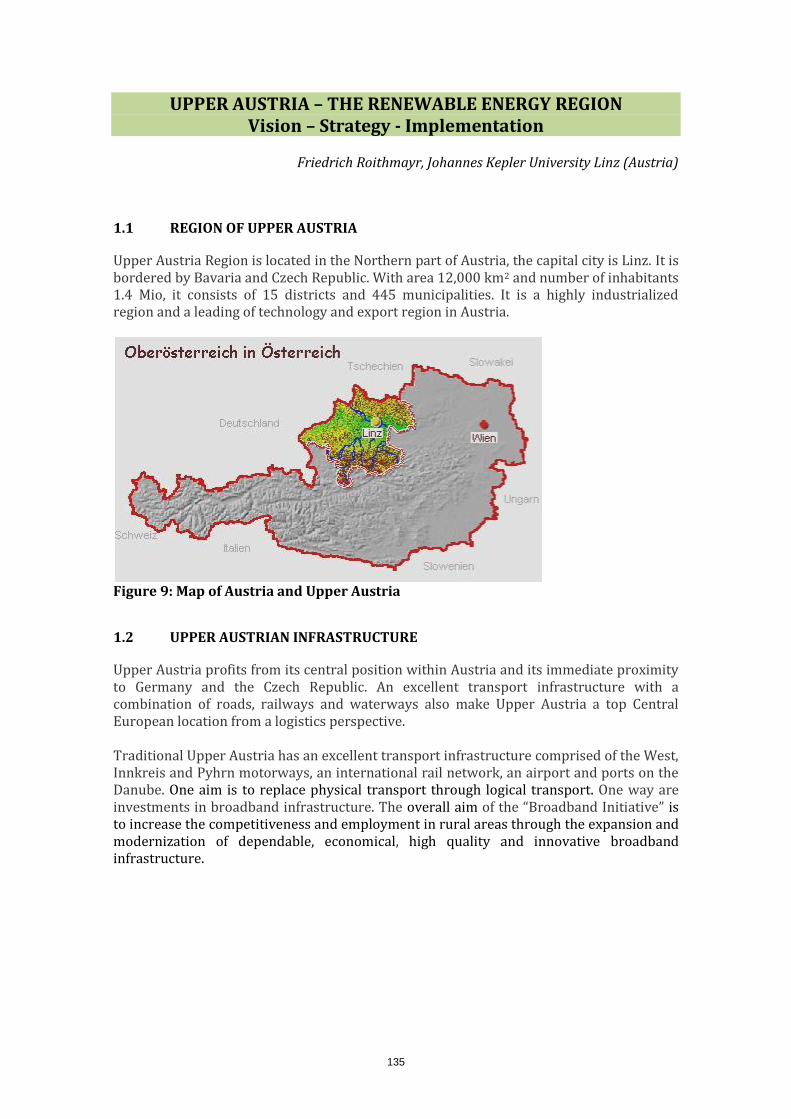
135
UPPER AUSTRIA – THE RENEWABLE ENERGY REGION Vision – Strategy - Implementation
Friedrich Roithmayr, Johannes Kepler University Linz (Austria)
1.1 REGION OF UPPER AUSTRIA
Upper Austria Region is located in the Northern part of Austria, the capital city is Linz. It is bordered by Bavaria and Czech Republic. With area 12,000 km2 and number of inhabitants 1.4 Mio, it consists of 15 districts and 445 municipalities. It is a highly industrialized region and a leading of technology and export region in Austria.
Figure 9: Map of Austria and Upper Austria
1.2 UPPER AUSTRIAN INFRASTRUCTURE
Upper Austria profits from its central position within Austria and its immediate proximity to Germany and the Czech Republic. An excellent transport infrastructure with a combination of roads, railways and waterways also make Upper Austria a top Central European location from a logistics perspective. Traditional Upper Austria has an excellent transport infrastructure comprised of the West, Innkreis and Pyhrn motorways, an international rail network, an airport and ports on the Danube. One aim is to replace physical transport through logical transport. One way are investments in broadband infrastructure. The overall aim of the “Broadband Initiative” is to increase the competitiveness and employment in rural areas through the expansion and modernization of dependable, economical, high quality and innovative broadband infrastructure.

136
Figure 10: Distance from Linz
1.3 UPPER AUSTRIA EDUCATION-, LEARNING AND TRAINING STRUCTURE
Upper Austria has a mellowed school system of public and private schools, from the “Kinder garden” until the university. Modern didactic concepts (blended learning, …) are realized. The education highway stands for modern education. The use of new technologies and media in schools signifies a major opportunity and challenge. This innovation center supports teachers with respect to questions of a didactic nature and with regard to the use of new teaching media. Furthermore it endeavors to point out new teaching and learning methods. The culture of internationalization is ongoing. 1.4 UPPER AUSTRIA RESEARCH STRUCTURE
Research and innovation are the key to a successful future. This is something emphasised by the European Commission in its Strategy “Europe 2020” to increase competitiveness and prosperity. Therefore, the research location of Upper Austria has set the goal of a research quota of four percent by 2015. To attain this goal, the former focus of research work will be intensified and new future fields of research will be exploited. The core competencies of upper Austrian research structure can be seen on the one side in research, education training and learning in Johannes Kepler University (JKU) and the University of Applied Sciences (Fachhochschule Upper Austria) and on the other side in research in the Upper Austrian Research GmbH. All these activities are encircled by TMG - Upper Austria's Business Agency. Upper Austria has 4 Universities. The following figure visualizes the research structure in Upper Austria. While in JKU primary basic research is done, in the University of Applied Sciences primary application research is done, TMG gives an additional framework for building a main focus oriented on the demand of the Upper Austrian Industry.

137
Figure 11: Upper Austria Research Structure
Upper Austrian Research Structure
Johannes Kepler University (JKU)
University of Applied Sciences
Upper Austrian Research GmbH
(UAR)
TMG - Framwork
4 Locations Wels:
- Eco Energy Engineering (B/M).
- „Bio- and Environmental technology“ (B)
- Bio Energy Research Group
Hagenberg:
- Informatics - Linz: - Health Care
Steyr: - Management
Ranking: For the fifth consecutive year the Upper Austria University of Applied Sciences FH was named the ranking of industry magazine for the best FH Austria.
3 Faculties Social and Economic Sciences. In this Faculty environmental issues and energy issues from an economic and sociological point of view are considered. Law Faculty. In this Faculty environmental issues and energy issues from juridical point of view are considered. Faculty of Engineering and Natural Sciences. In this Faculty environmental issues and energy issues technically be considered. Ranking: Higher Times Education Ranking has positioned JKU „100 under 50“ on position 41.
138
1.5 THE JOHANNES KEPLER UNIVERSITY (JKU) (19.5000 STUDENTS) IS THE LARGEST UNIVERSITY IN THE FEDERAL STATE AND DEDICATED TO RESEARCH AND INSTRUCTION OF THE HIGHEST INTERNATIONAL LEVEL. THE VISION OF JKU IS:
SOCIO-POLITICAL RESPONSIBILITY;
SCIENCE AND RESEARCH (HIGHER TIMES EDUCATION RANKING HAS POSITIONED JKU „100 UNDER 50“ ON POSITION 41);
EDUCATION IN THE STATE OF THE ART;
INTERNATIONALIZATION;
DRIVING MANAGEMENT STRATEGIES.
Its specific core competences lie in social sciences and economics, law as well as engineering and natural sciences, represented in the “Law Faculty”, “faculty of Social and economic Sciences and Faculty for Natural sciences and Engineering”. Around 19.500 students are enrolled at these three faculties. The JKU leads the way when it comes to applying ultra-modern information and communication technologies; this includes the use of multimedia and E-Learning offers as an alternative to the classical way of studying requiring student attendance. Likewise the introduction of the “Wireless Campus” underlines the pioneering role of the JKU in this trend-setting sector (www.jku.at). The JKU recognises important trends in the economy and regularly conceives new and contemporary training programmes. 1.5.1 Austrian Center of Competence in energy (ACCE)
The ACCE was founded at the JKU. The themes of energy production, transport and utilization in the future play a much more important role than it does today. The links between regionally adapted production and use must be optimized at all levels. Energy efficiency becomes a new role. In addition to technical development needs this must be accompanied by legal, economic and ecological research. ACCE is focused on sustainable technologies as well as energy law and economics.
1. Technology development is focused in four fields.
a. Hydrogen economy
b. Carbon capture utilization
c. Energy storage
d. Use of ambient heat and waste heat.
2. Energy law. Economic changes are not only technical innovations, but also by social standards driven. For this purpose, it is also a change of the legal framework required.
3. Energy economy. Systematic processing overarching questions to energy-related issues in the coming years, resulting in the conversion of the economic system.

139
4. Structural implementation
Figure 12: Structure of ACCE
As you can see in the figure above, the structural implementation follows an interdisciplinary and interuniversity approach. Depending from their core competences (technological questions, questions of the energy law, and questions of the energy policy) four universities and the University of Applied Sciences, companies, clusters and the public sector are involved. Sample of projects:
Figure 13: Sample of Eco Energy Projects
University of Applied Sciences (4.000 students): The courses of study of the Universities of Applied Sciences in Upper Austria (FH OÖ) have, since the introduction of studies at the university of applied sciences in Austria in 1994, offered practical and at the same time academic courses of study. With sites in Linz, Hagenberg, Wels and Steyr, the FH OÖ is one of the best universities of applied sciences in Austria in terms of quality. Around 4,000 students attend the four faculties of
Project Name Project (samples) Cost €
Regstore Production of hydrocarbons from electricity and from
and CO2 in a biotechnology / physicochemical method 650.000,--
systemanalysis
power to gasDetermination of the minimum cost of chemical storage
240.000,--
of electricity in the natural gas grid
SunH2 Pilot projects hydrogen production using high-pressure 1.350.000,--
electrolysis, fuel cell, hydrogen feed
H2Storage Storing hydrogen in natural gas deposites 1.500.000,--

140
“Informatics, Communications and Media“(Hagenberg), “Applied Health and Social Sciences“ (Linz), “Management“(Steyr) and “Engineering and Environmental Sciences” (Wels).
Since the foundation of the Applied Sciences Research & Development Ltd. in the year 2003, a continuous rise has been recorded in the field of research. At the four sites, twelve focal points of research deal with the most current and significant themes of the 21st century, such as bioinformatics, biomechanics, digital economy or production optimization (www.fh-ooe.at). Bachelor Bio and Environmental Technology. This course offers students the unique opportunity to study two growing areas of technology at the same time: biotechnology and environmental technology. Biotechnology and Environmental Technology is important in the chemical, pharmaceutical and food industries (including, for example, identification of gene-modified foods). Environmental technology covers important areas such as cleaning of water, air and earth as well as prevention of pollution in all fields. The Master’s Degree course in Bio-and Environmental Technology offers the opportunity of specialization in either Biotechnology or Environmental Engineering. Core subjects are Environmental Process Engineering and Environmental Biotechnology, Plant Planning and Plant Engineering, Bio-Analytics, Food Production Technology and Quality Management. These subjects are complemented by advanced study of Social Skills, English and relevant aspects of Business Economics: altogether the ideal preparation for a career in this field. The Master´s Degree in Eco- Energy provides a basic deepening in subjects the conversion of the distribution and of the optimized, environmentally friendly use of energy in plants and buildings. With a focus on "Solar Technology" and "building optimization" is a special focus on functionality, design, construction and operation of power engineering facilities and buildings. Project-based learning provides for the immediate implementation and practical relevance. Bachelor in Eco-Energy Engineering. Energy consumption is rising, reserves dwindling worldwide. It is vital that we cover our energy needs (lighting, heating, power etc.) as economically and efficiently as possible and minimize primary energy use. This must be achieved as far as possible by using the sun, wind, water and geothermal energy, for these are our future. This programme is about efficient and environmentally friendly production and use of energy. It offers an innovative education in ecology, technology and business economics. You will learn to develop, plan and market efficient technologies for energy production and conversion. A further specialization of the course is in the field of ecological and energy efficient buildings. Research Group in Advanced Biofuels focussing on Biogas production, Bioethanol production from lignocelluloses (straw & wood), Biodiesel generation by means of yeast from residues, Production of Algae and Ingredients is situated on the Wels Campus. The University for Art and Industrial Design Linz, which evolved from the “Art School of the City of Linz“ founded in 1947, is characterized by the core competences of free and applied design, interdisciplinary education and teacher training at a high level. It has a unique profile in all fields ranging from technical courses of study to artistic projects, from the highest interior design competence to outstanding media design work. Students regularly win national and international prizes for design and photography (www.ufg.ac.at).

141
Around 850 musicians, dancers and actors from all over the world study at the Anton Bruckner Private University with teachers who are internationally qualified artists, scientists and teachers. This is a university for music, drama and dance (www.bruckneruni.at). In historical terms, the Catholic-Theological Private University Linz (KTU), which has taught theology since 1672, is the oldest of the “universities” in Linz. With two faculties, the Theological Faculty and the faculty-ranked Institute for History and Theory of Art and Philosophy, as well as around 500 students, the private university forms a centre of humanities in Upper Austria. The Upper Austrian Research GmbH (UAR) is a subsidiary of the Upper Austrian Innovation Holding GmbH. Upper Austrian Research GmbH increases the social standing of research and innovation and, as the motivating force in non-university research in Upper Austria, contributes to social wellbeing. Technology Marketing Society (TMG). The objective of the TMG Group is the strengthening of the competitive capacity of the Upper Austrian economy in the global contest among locations. The Group thus makes a major contribution to the creation and securing of employment and increased prosperity and social security in Upper Austria.
Figure 14: TMG - Group
1.6 UPPER AUSTRIA ENERGY
Upper Austria is an energy-intensive state that is also highly energy efficient. The security of energy supplies, economic efficiency, and environmental soundness and the gentle use of resources as well as the social compatibility of the energy supply and use of energy are at the forefront. Renewable sources of energy have a high political status. The Upper Austrian energy strategy is future-oriented and extends to the year 2030. In 2007 the Upper Austrian government introduced its „Energy Future 2030”programme. The focal point of this trend-setting energy strategy is to have electrical energy and space

142
heating originate to 100 percent from renewable sources of energy by the year 2030. 148 suggested measures were elaborated for this purpose. This will be the greatest energy conversion in the history of Upper Austria and will lower energy consumption by one third. Energy costs will be clearly reduced, CO2 emissions will be reduced by two thirds and, all in all, a total of 38 billion euros will be saved by the year 2030. According to a study performed by the Energy Institute of the University of Linz, the first 30 measures alone will create 10,000 new jobs per annum. To achieve these ambitious goals, packages of measures have already been implemented for various target groups and technologies. These comprised both grants and activities to heighten awareness (energy related advisory services, information campaigns) as well as legal measures (compulsory regulations, removal of legal barriers). Within the framework of realizing these measures, the energy agency of Upper Austria (www.energiesparverband.at) performs around 15,000 energy consultations a year on all products for various target groups. A considerable number of leading producers of renewable heating technologies are located in Upper Austria, particularly when it comes to biomass boilers, solar collectors and heat pumps. Around 150 companies from the sectors of energy efficiency and renewable energy sources work together in the Oekoenergie- Cluster (OEC) (www.oec.at). Together they generate a turnover of around 1.6 billion Euros and in 2009 they employed around 4,500 people. In the field of R&D, Upper Austria focuses its research on eco energy and environmental engineering issues. This covers both fundamental and application-oriented research in the fields of solar energy/hydrogen, the optimization of buildings/solar mobility, biogas, bioethanol, biomass or waste water purification. In Upper Austria the following plants, which are based on renewable forms of energy, are currently in operation:
Over 1 million m2 of thermal solar plants (this corresponds to 0.7 m2 per inhabitant –an absolutely top value in Europe)
The largest photovoltaic power station in Austria featuring 4,638 solar panels 40,000 automatic biomass heating systems in private households, in public
buildings and companies (of which 16,000 are accounted for by pellet heating systems)
300 biomass district heating plants 2,000 photovoltaic plants 30,000 heat pumps for space heating and warm water 23 large-scale wind energy plants 75 biogas plants 600 small hydro power plants 12 biomass combined heat and power plants.
Composition of overall energy consumption in Upper Austria (Energiesparverband).

143
Figure 15: Composition of overall energy consumption in Upper
UAR Research Field Energy Efficiency The main focus lies in:
Energy efficiency processes. The focus is resource saving machines and equipment as well as developing and the use of components for recovery of energy. With simulation tools for example optimization of material input in electric motors can be reached.
Resources, materials, renewable energy. Targets are the efficient use of resources and the optimization and simulation of material and energy cycles.
Decentralization energy. Software systems for realistic and efficient simulations and works out concepts for a safe common use of distributed resources and the coordination of those in virtual ogranisations. Optimisation, steering and simulation of production- and logistics processes as well as network management is one of the core competences.
Storing, security technology. In the project SenTherms togehter with the Austria Solar Innovation Center (ASiC) RECENDT develops sensor technologies for efficient storing of solar energy
Electro mobility storage. Together with 10 project partners, Transfercenter für Kunststofftechnik GmbH (TCKT) develops ECO-WPC, economic and ecologic Wood Plastic Composites. The target is to improve the recipe and be cost efficient.
Smart grids, network management

144
Energy Efficiency, Processes
Resources, Materials, Renewable Energy
Decentralisation Energy
Storing, Security Technologies
Electro Mobility, Storage
Smart Grids, Network Management
4 Locations Wels:
- Eco Energy Engineering (B/M).
- „Bio- and Environmental technology“ (B)
- Bio Energy Research Group
Hagenberg:
- Informatics Linz:
- Health Care Steyr:
- Management Ranking: For the fifth consecutive year the Upper Austria University of Applied Sciences FH was named the ranking of industry magazine for the best FH Austria.
3 Faculties Social and Economic Sciences. In this Faculty environmental issues and energy issues from an economic and sociological point of view are considered. Law Faculty. In this Faculty environmental issues and energy issues from juridical point of view are considered. Faculty of Engineering and Natural Sciences. In this Faculty environmental issues and energy issues technically be considered. Ranking: Higher Times Education Ranking has positioned JKU „100 under 50“ on position 41.
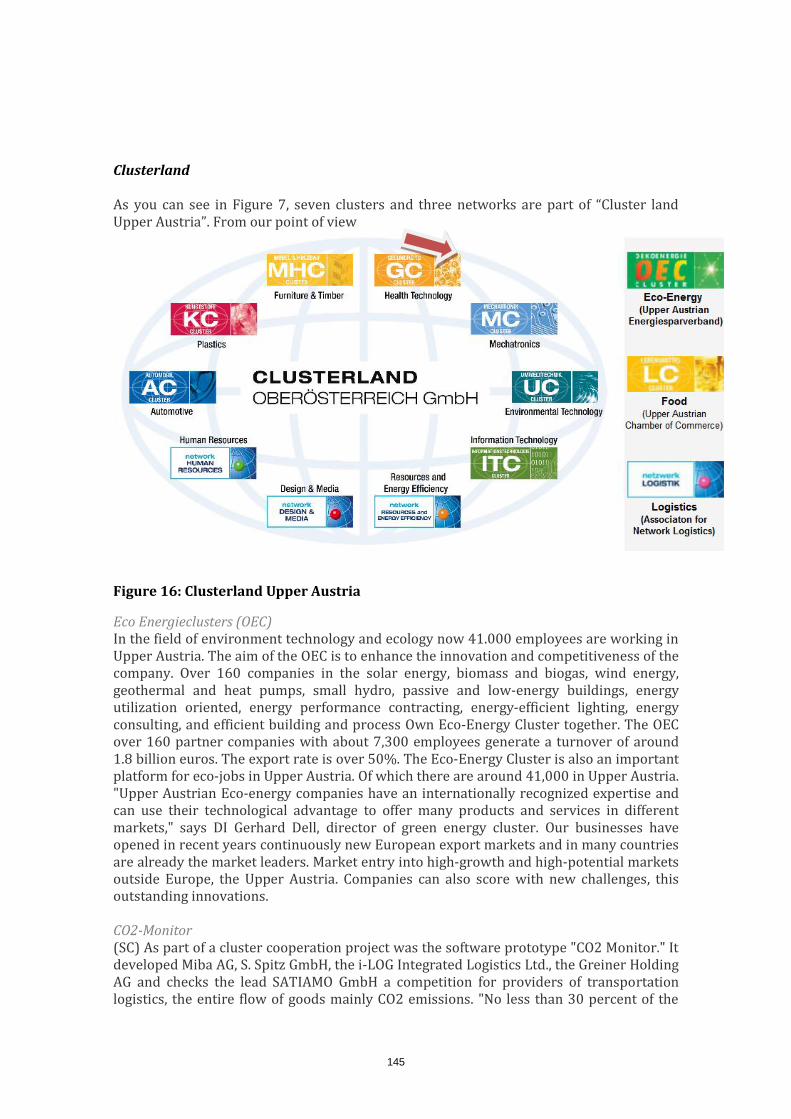
145
Clusterland As you can see in Figure 7, seven clusters and three networks are part of “Cluster land Upper Austria”. From our point of view
Figure 16: Clusterland Upper Austria
Eco Energieclusters (OEC) In the field of environment technology and ecology now 41.000 employees are working in Upper Austria. The aim of the OEC is to enhance the innovation and competitiveness of the company. Over 160 companies in the solar energy, biomass and biogas, wind energy, geothermal and heat pumps, small hydro, passive and low-energy buildings, energy utilization oriented, energy performance contracting, energy-efficient lighting, energy consulting, and efficient building and process Own Eco-Energy Cluster together. The OEC over 160 partner companies with about 7,300 employees generate a turnover of around 1.8 billion euros. The export rate is over 50%. The Eco-Energy Cluster is also an important platform for eco-jobs in Upper Austria. Of which there are around 41,000 in Upper Austria. "Upper Austrian Eco-energy companies have an internationally recognized expertise and can use their technological advantage to offer many products and services in different markets," says DI Gerhard Dell, director of green energy cluster. Our businesses have opened in recent years continuously new European export markets and in many countries are already the market leaders. Market entry into high-growth and high-potential markets outside Europe, the Upper Austria. Companies can also score with new challenges, this outstanding innovations. CO2-Monitor (SC) As part of a cluster cooperation project was the software prototype "CO2 Monitor." It developed Miba AG, S. Spitz GmbH, the i-LOG Integrated Logistics Ltd., the Greiner Holding AG and checks the lead SATIAMO GmbH a competition for providers of transportation logistics, the entire flow of goods mainly CO2 emissions. "No less than 30 percent of the
146
CO2 emissions of the individual, that is also attributed to the transportation of goods. The topic, of CO2 emissions is' why here in the first place. I am pleased that on the one hand, several partners of the Environmental cluster with the cooperation project "CO2 monitoring" set an example for clean transport routes and secondly, that this innovation was awarded the Austrian Supply Excellence Award 2012 ", applauded Economic Provincial KommR Viktor Sigl the winning project and underlines the importance of cooperation. The green footprint on transport to schedule transportation and supply chain and handle, manufacturing companies and shippers work with different methods and tools. An essential basis for the selection of the service is the total cost. The CO2 emissions are found here so far no attention because it was so far no useful information. Medium to long term, however, these are the routes and costs significantly influence. With the software prototype "CO2 Monitor" tool was developed in the selection of the transport service calculates both the total cost than light even the fleet profile of the provider and take on resource-conserving and efficient transport routes and chains consideration. This means that the entire path of the material is shown. It is possible to save up to 15 percent of harmful CO2. Excellent economic performance along the value chain as part of the Austrian shopping Forums 2012 in Salzburg, the cluster cooperation project "CO2 Monitor" with the Austrian Supply Excellence Award BMÖ (Association Materials Management, Purchasing and Logistics in Austria) was awarded in the category "CSR and Sustainability in the Supply Chain". This award is presented annually to those technically and / or economically innovative solutions that can be demonstrated to increase a company's corporate social responsibility and sustainability in the value chain. "The jobs created by the project CO2 Monitor basics can lead the way for the inclusion of environmental and economic aspects in the practical transportation logistics and thus have a role model. It is hoped that these results have proven in practical use and disseminate the appropriate planning and control systems in the industry, "Professor Bogaschewsky in his speech congratulated the winning team. About the Environmental Technology Cluster Innovation through cooperation - the secret of sustained success the Environmental Technology Cluster (UC) of the cluster OÖ GmbH is primarily concerned with the initiation, implementation and monitoring of national and international cooperation projects. He also serves as a knowledge-sharing platform and know-who, to enhance innovation and competitiveness of its partner companies. Special focus: small and medium enterprises (SMEs). These are supported by the project outline on the search for suitable partners by then to seek appropriate funding rails. UC also helps with the application and submission of the final report and provides tips. Also on offer is the overall project management. The project-based public relations means-house journal, and online media provides the UC its partners available for free. Closely linked to the UC is the network resource and energy efficiency, in which the focus is on the one hand in the "house energy efficiency in commercial and industrial manufacturing processes" is, on the other hand, the concomitant use of resources.

147
About the Environmental Technology Cluster Innovation through cooperation - the secret of sustained success the Environmental Technology Cluster (UC) of the cluster OÖ GmbH is primarily concerned with the initiation, implementation and monitoring of national and international cooperation projects. He also serves as a knowledge-sharing platform and know-who, to enhance innovation and competitiveness of its partner companies. Special focus: small and medium enterprises (SMEs). These are supported by the project outline on the search for suitable partners by then to seek appropriate funding rails. UC also helps with the application and submission of the final report and provides tips. Also on offer is the overall project management. The project-based public relations means-house journal, and online media provides the UC its partners available for free. Closely linked to the UC is the network resource and energy efficiency, in which the focus is on the one hand in the "house energy efficiency in commercial and industrial manufacturing processes" is, on the other hand, the concomitant use of resources.

148
Integration of HQP training in second and third generation biofuels’ R&D work
Jean-Michel Lavoie Department of Chemical and Biotechnological Engineering
Université de Sherbrooke Sherbrooke, Québec
Abstract
On the market today are different sources of green energy that can, to a certain extent, displace fossil fuel consumption and reduce the overall carbon footprint of industrialized countries. Despite the fact that many forms of renewable energy such as solar, wind or hydropower can provide electricity, at this point in time none of these technologies can efficiently displace liquid transportation fuel and in that sense biomass has a unique potential. In Québec, an average of 8.4 BL of gasoline as well as 3 BL of diesel are used for transportation on a yearly basis. In some cases, alternative transportation methods such as the use of electric cars in metropolitan areas could be considered but even in best-case scenarios, the use of liquid fuel is still an essential part of transportation, especially for aviation fuel. Thus, liquid biofuels, although they may not be the sole alternative in the upcoming expanding energy market, will certainly remain a suitable option, especially in geographical zones where biomass is abundant. The latter, combined with the available conversion technologies, are two significant constraints that limit the economics of second and third generation biofuels, which in turn, impact on the expansion of these industries. Among available and industry-ready technologies, first generation biofuels – mostly ethanol (corn or sugarcane) and biodiesel – are the only technologies to be operational at an industrial level today. However, the use of food crops to produce fuel, although effective, raises significant concerns about food safety and therefore, the focus is shifted toward other sources of carbon as residual biomass. Biomass can be classified as homogeneous, quasi-homogeneous and non-homogeneous in close relationship to its chemical composition and downstream to its market value. In that sense, even though many conversion approaches can convert different types of biomass, the process selected depends intimately on the composition of biomass and therefore its price. That is why the processes that are being developed for second and third generation biofuels have to take into consideration biomass value and the fact that downstream, the product is a low-value commodity. Keywords: Algae, Biofuels, Biomass, Conversion, Ethanol, Liquid fuel, Quebec 2
INTRODUCTION North American infrastructure highly depends on liquid fuels in relationship, amongst many other parameters, to the distance that are involved and to the lack of public transportation in remote locations of the territory. The province of Quebec (in Canada), has a superficy of 1.67M km2, about 17% of the Canadian territory and about one fifth of the superficy of Brazil, about the same for China whilst being larger than countries as South Africa (factor 1,37) and Germany (factor 4,67) [1]. In this large territory is spread a population of 8 million [2], about 4% of the total population of Brazil [3], 0.6% of the population of China [4], about 16% of the population of South Africa [5] and about 10% of

149
the population of Germany [6]. The relationship between the large superficies and the small population has a direct impact on transportation where public transportation is rather difficult and expensive to install in remote regions of the province. In that sense, large consumption of liquid fuels are rather unavoidable, in 2011, more than 8.7 BL of octane were sold in Quebec combine with 3.1BL of diesel fuel [7]. Such number shows that each inhabitant of Quebec consumed per year more than 1375L of liquid fuel either directly or via the goods that they buy that were transported via road. Although fossil fuels are abundant in other provinces of Canada (Alberta) the province of Quebec is not a major producer at this point of fossil derived hydrocarbons and is rather dependent on either the rest of the country or from other countries. Despite the lack of the fossil fuel economy in the province there is nevertheless a significant production of hydroelectricity, making of Canada the second most important producer of hydroelectricity in the world second to China and right before Brazil [8]. Hydroelectricity could be a vector for road transportation, however at this point in time the options are not well adapted to the Quebec geography and climate thus there is unavoidably a necessity to reduce dependency on liquid fossil fuel both for economic and environmental reasons. Via the C-33 law, the federal government has imposed that a minimum 5% of the fuel consumed in Canada should be replaced by ethanol and the latter can be either produced locally or bought from national or international suppliers. Production of liquid biofuels, ethanol being the most appropriate example in Quebec, is bound to the carbon-based feedstock used for the process and can be separated into three main categories either first generation, second generation or third generation. Whilst the first generation relies more on crops as sugarcane and corn, the second generation is usually linked to lignocellulosic biomass and the third generation to carbon dioxide. The previously mentioned biomasses were mentioned chronologically in relation to the generation of biofuels they were linked to but as well to their complexity to transform. In that sense the technology for the production of first generation biofuels is well assimilated while the technologies available for the second technology are actually breaking through to industrial processes and third generation are still a little further downstream. Therefore, conversion of more complex feedstock will as well require technologies of increasing complexity leading to an increasing price of production despite the fact that the end product is still a low-value commodity. In common with this carbon economy emerging in the case of the second an third generation and well installed in the case of the first generation biofuels, there will be an increasing demand for highly qualified personnel (HQP) that will be able to interact in those industries. The biofuels situation as therefore allowed a strong partnership between the government, the industry and academia to provide answers as well as manpower to operate the biofuel industry.
FIRST GENERATION BIOFUELS
The first generation of biofuels depicts biofuels that are generally produced from edible feedstock and in this category lays biodiesel and bioethanol. Biodiesel is produced from transesterification of lipids using methanol in an acidic or a basic solvent producing fatty acids methyl esters [9]. The concept is rather straightforward, although the uses of other alcohol could be favoured for the production of the esters methanol is usually the targeted one because of its low market value [10]. Taking canola oil as an example, 1 tonne (1000kg) can generate
150
about the same mass of biodiesel, consuming about 100kg of methanol (usually produced from fossil fuel) and producing about 100kg of glycerol as side-product. The production of biodiesel is highly dependent on the oily feedstock used to generate the oil that is converted downstream and therefore, production of biodiesel are usually linked to the biodiesel potential of crops since the conversion of pure oil will be relatively constant although not all plant metabolise lipids with the same kinetics. From a wide array of lipid-producing plants, it would seem that oil palm and coconut are the crops that produces the most per unit of superficy with 508 and 230 gallons respectively [11]. On the international market, the production of biodiesel is mostly related to the price of oil per tonnage. As an example in August 2012, the price for oils generated from crops ranged from 931USD/tonne for palm oil to 1230USD/tonne for soybean oil with canola oil at 1180USD/tone [9]. Since as in many case the price of the feedstock is the most economically constraining aspect of the biofuel production, lowering the price of the oil is a major concern for this industry which relies on finding cheaper oils as well as on valorizing all the output from the process, in this case in particular glycerol. Cheaper oils are available on the market, as jatropha (350-500 USD/tonne) [9] or even spent cooking oil for which the price varies locally. Although rather less expensive those oils were reported to be harder to process and therefore could as well be introduced as second generation biodiesels. The second important actor on the first generation biofuel market is ethanol, being a widespread fuel in the Americas. The latter is being actually produced from carbohydrate-based feedstocks among which the most popular are sugar cane, corn, sugar beet, cassava, sorghum and wheat. According to the same comparison factors as the one used for biodiesel, it was reported that the most efficient crops were shown to be sugar beet and sugar cane [11]. Contrarily to the biodiesel, the production of first generation ethanol is a biotechnological process where microorganisms, most frequently Saccharomyces cerevisiae, convert ethanol (typically ½ of the carbohydrate mass) into ethanol generating CO2 as side-product. For specific crops as sugar cane, the plant is first crushed in hot water to release sugars and the latter can then be fermented to ethanol. Not all feedstock behave as sugar can and starch-producing biomass as corn can not be fermented as is and the carbohydrate, polymerized in form of starch, has to be first hydrolyzed using either enzymes or chemicals. Once this first part is complete the sugar generated can be assimilated by the same microorganisms and converted to ethanol. Extraction of raw sugar from sugar cane is a process commonly used for the production of ethanol without forgetting however that the sugar has a market on its own leading to a competition as for this feedstock. As an example, the price of sugar was in August of 2012 of 0.20 USD per pound therefore 44 cents per kg and 440$ per tonne. From one tonne of sugar can be generated about 500kg of ethanol and 630 litres. At a market value around 0.68USD/L, the ethanol value from this tonne of sugar is inferior to the value of the sugar sold as is. As for corn, the market value for corn in August 2012 was of 338USD/tonne and the latter could produce 400-450L of ethanol. Still at a market value of 0.68USD/L, conversion of the starch part of corn to ethanol will generate less profit as the value 4 of corn itself. Nevertheless, production of corn ethanol also generates spent grain as side product and the latter is a valuable product to be used as animal feed leading to a profitable conversion of corn into bioethanol.
SECOND GENERATION BIOFUELS
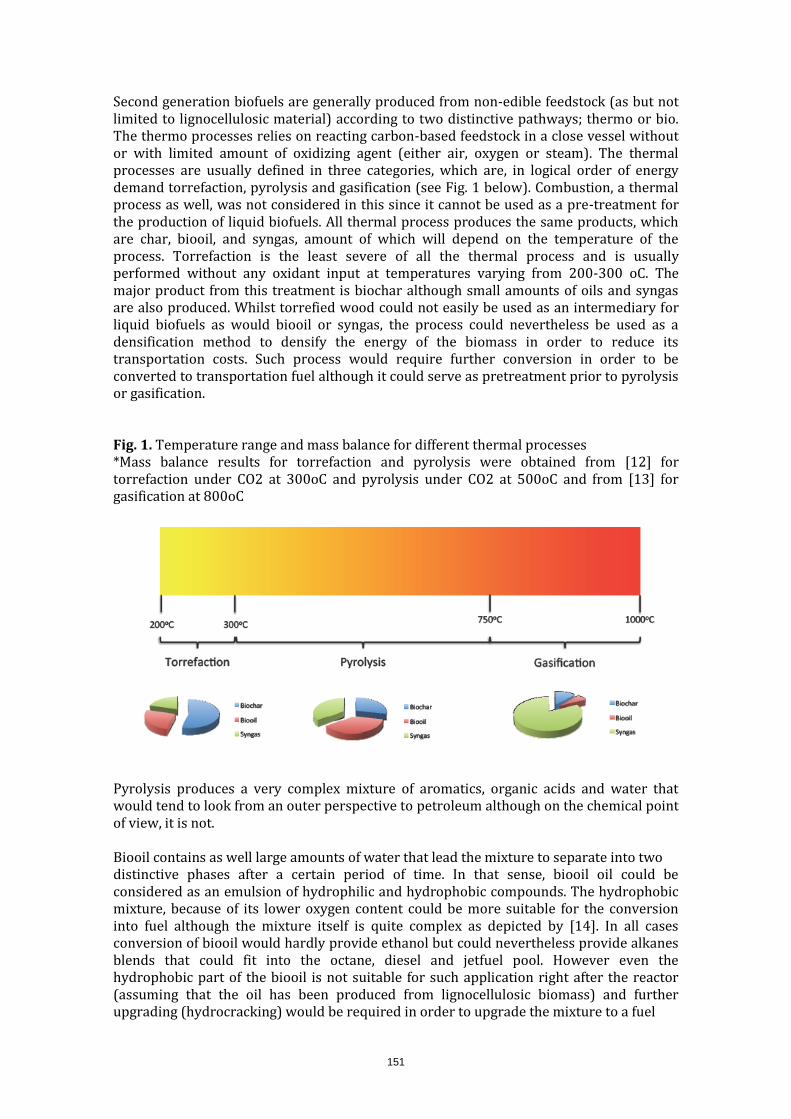
151
Second generation biofuels are generally produced from non-edible feedstock (as but not limited to lignocellulosic material) according to two distinctive pathways; thermo or bio. The thermo processes relies on reacting carbon-based feedstock in a close vessel without or with limited amount of oxidizing agent (either air, oxygen or steam). The thermal processes are usually defined in three categories, which are, in logical order of energy demand torrefaction, pyrolysis and gasification (see Fig. 1 below). Combustion, a thermal process as well, was not considered in this since it cannot be used as a pre-treatment for the production of liquid biofuels. All thermal process produces the same products, which are char, biooil, and syngas, amount of which will depend on the temperature of the process. Torrefaction is the least severe of all the thermal process and is usually performed without any oxidant input at temperatures varying from 200-300 oC. The major product from this treatment is biochar although small amounts of oils and syngas are also produced. Whilst torrefied wood could not easily be used as an intermediary for liquid biofuels as would biooil or syngas, the process could nevertheless be used as a densification method to densify the energy of the biomass in order to reduce its transportation costs. Such process would require further conversion in order to be converted to transportation fuel although it could serve as pretreatment prior to pyrolysis or gasification. Fig. 1. Temperature range and mass balance for different thermal processes *Mass balance results for torrefaction and pyrolysis were obtained from [12] for torrefaction under CO2 at 300oC and pyrolysis under CO2 at 500oC and from [13] for gasification at 800oC
Pyrolysis produces a very complex mixture of aromatics, organic acids and water that would tend to look from an outer perspective to petroleum although on the chemical point of view, it is not. Biooil contains as well large amounts of water that lead the mixture to separate into two distinctive phases after a certain period of time. In that sense, biooil oil could be considered as an emulsion of hydrophilic and hydrophobic compounds. The hydrophobic mixture, because of its lower oxygen content could be more suitable for the conversion into fuel although the mixture itself is quite complex as depicted by [14]. In all cases conversion of biooil would hardly provide ethanol but could nevertheless provide alkanes blends that could fit into the octane, diesel and jetfuel pool. However even the hydrophobic part of the biooil is not suitable for such application right after the reactor (assuming that the oil has been produced from lignocellulosic biomass) and further upgrading (hydrocracking) would be required in order to upgrade the mixture to a fuel

152
grade. The latter would require hydrogen which could surely lead to another debate on what would be the source of hydrogen when it is well known that the latter is more economically produced from steam reforming of natural gas combined with a water-gas shift of carbon dioxide (thus producing unbalanced CO2). Production of hydrogen from hydroelectricity, an option that could be advantageous to regions as Quebec where the hydroelectricity is abundant, could be considered since new technologies of polymeric membrane [15] may contribute to make such an approach economical and competitive when compared to natural gas, which is still a very economical option (3.96USD/GJ – April 2013). Gasification is also a technology that could show a lot of potential since the latter has a versatility that is far above torrefaction or even pyrolysis in that sense that the technology could be adapted to a wide array of feedstock from the most expensive (as forest or agricultural biomass) to very cheap feedstock as municipal solid wastes (MSW) [16] or even sludge from water treatment facilities [17]. Production of cold gas from the gasification technology is close to 80% [13] and the latter is mostly composed of hydrogen, carbon monoxide, carbon dioxide and alkanes typically at a molar ratio of 22, 44, 12 and 20% respectively for a HHV of 17.3 MJ/Nm3 [18]. Syngas has a low energy density as compared to other common gases as methane, one of the reason is that it has already being partly oxidized. Nevertheless, it could easily serve as a building block for the production of commodities (as fuels) as well as higher value chemicals. There is actually to major approaches relying on syngas as feed, one is for the production of ethanol through methanol [16] and the other is for the production of alkanes via the Fischer-Tropsch process [19]. Although both processes could easily work from different types of feedstock, the FT processes that are at this point operational relies on a source of carbon that is low in oxygen as coal or natural gas. The utilisation of biomass is somehow more challenging from the higher oxygen content (thus lower productivity and higher hydrogen consumption) of lignocellulosic biomass to the high level of contaminants that could be found in really cheap biomasses as municipal solid wastes. On the other hand, feedstocks as MSW are usually rather cheap as feedstock since they may come with a tipping fee. Overall such a reality can justify using the latter as a feedstock but comes with its share of technical challenges [16]. In contrast with the thermo processes, the “bio” processes will require the use of microorganisms at one point or the other during the conversion process. Although a combination of thermal and bio in unheard of [20] the bio processes are usually linked to the first generation process in that sense that they usually target lignocellulosic biomass, but more specifically the cellulose from this biomass in order to try to convert it to sugar, then ferment the latter to ethanol. Prior to the conversion of cellulose, the latter has to be isolated from the lignocellulosic matrix and although 6 this goal as been successfully reached for decades by the pulp and paper industry, there is a growing necessity to reuse a vast majority of the lignocellulosic biomass, which means that not only the carbohydrate should be valorized but the aromatics (from lignin) as well. In that sense, many techniques have been suggested for the isolation of cellulose from the lignocellulosic matrix including but not limited to classical kraft processes, steam explosion, organosolv and ammonia explosion treatments [21]. In case of organosolv process the target is to solubilize lignin in a aqeous organic solvent mixture catalyzed with organic acids. Once the lignin as been removed from the lignocellulosic matrix, it is precipitated by removing part or the entire solvent. Isolating both lignin and carbohydrates (mostly cellulose) at the same time. Steam process on the other hand will work with pressurised water that will be used to cook the lignocellulosic biomass.
153
After the cooking period the cooking vessel is flashed to atmospheric pressure provoking a severe passage from liquid to vapour and “explosion” of the lignocellulosic biomass in which the water was impregnated. Using a base catalyst may also allow the removal of lignin from the lignocellulosic fibers [22]. In all cases the first target is the carbohydrate content of the cellulose which again has to go through further transformation in order to be converted to ethanol. The most sensitive technological aspect of the conversion of the cellulose fibre to glucose is the hydrolysis and the latter can be performed either with chemicals (acids) or with enzymes [9]. Both concept comes with specific problems and whilst the chemical-based approach will require an improved recuperation of the acid, the enzymes are rather expensive to produce making hydrolysis of cellulose the key technological challenge for the production or cellulosic ethanol, or the production of second-generation biofuels using the “bio” approach. Since the production of ethanol is a prior concern but that the cellulose content is usually around 45-50% in lignocellulosic biomass, the total production of ethanol can difficultly reach more than 360L per dry tonne of lignocellulosic biomass processed. And since the lignocellulosic biomass will cost from 60-120USD/tonne from residual forest or agricultural biomass up to the high value white wood chips, there is a growing concern that rise on the transformation of the other macromolecules found in the lignocellulosic biomass, but mostly hemicelluloses and lignin. The latter is a polymer composed of aromatics and has a very high energy density. Different approaches have been considered to valorize lignin although one of the most popular approaches is to convert it into monomeric hydroxyl-aromatics. [23]. The production of monomer is somehow limited to the amount of ether bonds in the lignin which were shown to produce, in the best of cases up to 15% of hydroxyl-aromatics as cathecol, guaiacol and phenol. The latter are high-value products and could generate more profits to balance the economics of cellulosic ethanol. Hemicelluloses are another example of key macromolecules that has to be converted in order refine all the carbon sources from biomass (thus the concept of biorefinery). There are actually two pathways that are being considered to convert hemicelluloses but the key challenge with the latter is that they are mostly composed of C5 sugars, more specifically xylose. The latter, although it can hardly be fermented to ethanol with classical yeast strains can nevertheless be fermented with GMO. Another approach for the conversion of C5 sugars would be through chemical processes and although many have been considered as the reduction of xylose to xylitol or the oxidation of xylose to xylonic acid, the most popular approach is still to react the C5 sugars with acids in order to dehydrate to furfural, a high value chemical for the industry as well as a gateway to other compounds and possibility biofuels [24].
THIRD GENERATION BIOFUELS Most of the work performed on third generation biofuels is usually linked to algal biomass although it might be the case if you consider the algae as the feedstock, it could as well be extrapolated to the CO2 economy since the algae are using carbon dioxide as a feed, which they reduce using water and the energy of the sun. Photosynthesis has been an inspiration both in the chemical and the biochemical field although it might not be the only suitable approach that could lead to the conversion of carbon dioxide into fuels and added value products. However, the net advantage of using carbon dioxide is that it uses a feedstock that is locally abundant everywhere in the world. This approach would be sustainable since it would not (in theory) generate more CO2 and therefore would not contribute to the growing concentration of carbon dioxide in the atmosphere. On the other hand, the use of CO2 comes with a thermodynamic penalty, the latter being the most oxidized form of carbon, the energy required to reduce it to a usable product will be at least equal to the energy that it produced when it was oxidized.
154
The biological approach is one of the most popular when it comes to CO2 conversion. Many researches have been focusing on the production of many valuable products from lipids [25] to ethanol [26]. Although algae are reported to be fast growing and able to assimilate large amount of carbon dioxide per unit of time as per comparison to other plants, their growth still involves large volumes of water and on an industrial scale, those large volume can soon become a problem. Therefore, two major technological challenges are facing the algal biomass utilization for fuel, the first is the water content and the second is the algal biomass conversion. As for the water content, different techniques are actually considered on the market but the most common technique that was reported to be used at large scale is a combination of filtration and centrifugation. Whilst filtration is used in the first part of the dewatering, centrifugation is then used when the water content as significantly reduce making the best of both unit operations. As for the conversion of the algal biomass, many techniques as solvent extraction, in situ transesterification as well as different types of cell disruption have been mentioned although so far no technique was reported to be significantly above the others. Other approaches could lead to the conversion of carbon dioxide and most of them relies on two chemical reaction, the first being dry reforming and the second being the reverse-Boudouard reaction. As for dry reforming, it is a concept in which the carbon dioxide is used as oxidizing agent to convert alkane, but in mots of the reported cases methane. The involved reaction is depicted below:
CO2 + CH4 2CO + 2H2
The end product being a mixture of carbon dioxide and hydrogen, it is therefore suitable to be used as building block as syngas in the previous section. Dry reforming has been achieved at high temperature, with the use of nickel catalyst and even with the utilisation of electricity [27]. As for the reverse Boudouard reaction, it is a reaction by which carbon dioxide is used to oxidize carbon (or char). The general reaction for the reverse Boudouard is shown below.
C + CO2 2 CO
This reaction could occur in thermal process as pyrolysis [12] as well as it could occur in gasification although the amount of char as reported previously, is far less important in 8 gasification process when compared to pyrolysis. Torrefaction would be the most suitable process to induce de reverse Boudouard reaction, however the low temperature does not suffice to induce the activation energy necessary for this reaction to occur.
OPPORTUNITIES IN QUEBEC – HQP AND R&D
The province of Quebec has abundant natural resources, ranging from large volumes of fresh water to abundant resources in terms of biomass. The province is one of the most important producers of electricity in the world and in that sense it could be seen as a leader in the field of energy. However, the large superficy of the province in correlation with its small population leads to a very important need in terms of liquid fuels. At this point, Quebec is not a significant producer of hydrocarbons but has nevertheless the opportunity to develop its biofuel industry. The first generation biofuel has develop in the province that holds one corn ethanol distillery. Although the annual production of this facility is significantly below the annual fuel consumption in Quebec, increasing the production would rather be difficult because of the public opinion on the food versus fuel debate. As for second generation, even if it is a very

155
interesting perspective, there is however an unavoidable necessity to create efficient and economical processes so that they could be implemented by the industry. Most of constraints associated with biofuels are linked to the price of biomass, which is related to its chemical composition. The easiest it will be to convert specific biomass and the more expensive it will be since their will be many possible users for this feedstock. The price of biomass ranges from -30 to +120USD/tonne, where a negative value shows that biomass comes with a tipping fee while a positive value shows how much industry would have to pay for this biomass. The most expensive biomasses are generally biomasses as white wood chips, usually used for the production of pulp and paper. This biomass comes with a lot a competition and implementing a new industry working with this biomass would generate problems both on the economy but on the general wealth as well. Lower down on the biomass scale is the residual biomass that comes from either forest or agricultural exploitation. Such biomass as a value ranging from 60-80 USD/tonne and has actually a lower market in that sense that fewer industries are willing to take it and to convert it, therefore opening a niche for a second generation biofuel industry. However, even if such biomass is abundant (typically around 13-15M tonnes per year) not all conversion process are fit to convert it economically. Whilst processes as gasification could lead to the production of 360L of ethanol per dry ton of biomass, the price of the feedstock combined with the downstream conversion processes of the syngas would make it difficult to achieve. Pyrolysis is also an option that would lead to liquid fuel, however the technology is not yet at a point where pyrolysis could be considered as a suitable process for the efficient and economical production of liquid fuel. One of the best possible alternatives for residual lignocellulosic biomass would be the optimized conversion into added value through “bio” processes whilst optimizing the different fractions as mentioned above. Finally, in Quebec as in other part of the world, there is a large amount of municipal solid waste, a very cheap carbon-based biomass that could be used for the production of fuels. Utilisation of MSW is of course a good alternative since it settle at the same time the problems of landfill and of liquid fuel and in that sense would be a win-win situation. The usual production of MSW is of 1kg per person per day so large cities with more than half a million of inhabitants would be able to sustain partly from their garbages. Since the first generation of biofuels is well installed in North America and in Quebec, it is now time to invest into second and eventually third generation biofuels. Since the annual consumption of liquid fuel should not decrease in the upcoming years the conversion or residual biomass has become a significant opportunity. In that sense more than R&D projects, there is as well an opportunity to train highly qualified personnel in this new industry. In that sense, the government of Quebec as invested in a research chair, the Industrial Research Chair on Cellulosic Ethanol that was held from 2007-2012. This Chair, founded by Pr Esteban Chornet allied the strength of the academics, the entrepreneurship of the industry with support of the government. Over time, this group has trained more than 20 students that all found jobs, for most of them in the biofuel industry directly. Allying a situation where students can interact with the industry as well as with the university, the Chair allowed training of highly qualified students that were able to interact both on the applied and fundamental aspect of second generation biofuels.
REFERENCES [1] http://www.stat.gouv.qc.ca/publications/referenc/quebec_stat/ter_ter/ter_ter_3.htm [2]http://www.stat.gouv.qc.ca/publications/referenc/quebec_stat/pop_pop/pop_pop_fs.htm [3] http://www.indexmundi.com/brazil/population.html
156
[4] http://factsanddetails.com/china.php?itemid=129 [5] http://www.tradingeconomics.com/south-africa/population [6] http://www.tradingeconomics.com/germany/population [7] http://www.statcan.gc.ca/tables-tableaux/sum-som/l01/cst01/trade37b-eng.htm [8] http://energyscience.knoji.com/top-5-largest-producers-of-hydroelectricity-3/ [9] Lee, R.A. & Lavoie, J.-M. (2013) From first-to third-generation biofuels: Challenges of producing a commodity from a biomass of increasing complexity. Animal Frontiers 3 (2), 6-11 [10] http://www.methanex.com/products/methanolprice.html [11] Brown, L. R. (2006) Plan B 2.0: Rescuing a Planet Under Stress and a Civilization in Trouble. Norton Publisher. [12] Pilon, G, & Lavoie, J-M (2013) Pyrolysis of Switchgrass (Panicum virgatum L.) at Low Temperatures within N2 and CO2 Environments: Product Yield Study. ACS Sustainable Chemistry & Engineering. 1 (1), 198–204 [13] Shen, Y., Yoshikawa, K. (2013) Recent progresses in catalytic tar elimination during biomass gasification or pyrolysis-A review. Renewable & Sustainable Energy Reviews, 21, 371-392. [14] Pilon, G. & Lavoie, J.-M. (2013) Pyrolysis of switchgrass (Panicum virgatum L.) at low temperatures in N2 and CO2 environments; a study on chemical composition of chars extracts and bio-oils. Journal of Analytical and Applied Pyrolysis. In press [15] Grigorieva, S.A., Milletb, P., Korobtseva, S.V., Porembskiya V.I., Pepicc M., Etievantd C., Puyenchetd C., Fateeva V.N. (2009) International Journal of Hydrogen Energy. 34(14), 5986–5991 [16] Lavoie, J.M., Marie-Rose, S., Lynch, D. (2013) Non-homogeneous residual feedstock to biofuels and chemicals via the methanol route. Biomass Conversion and Biorefinery, 1-6 [17] Manyà, J.J., Sánchez, J.L., Ábrego, J., Gonzalo, A., Arauzo, J. (2006) Influence of gás residence time anda ir ratio on the air gasification of dried sewage sludge in a bubbling fluidised bed. Fuel, 85 (14-15), 2027-2033 [18] Higman, C., van der Burgt, M. (2008) Gasification. Gulf Professionnal Publishing (Elsevier) 435 pp. [19] Dry, M.E. (2002) The Fischer-Tropsch process: 1950-2000. Catalysis Today, 71 (3-4), 227-241 [20] Köpke, M., Mihalcea, C., Bromley, J.C., Simpson, S.D. (2011) Fermentative production of ethanol from carbon monoxide. Current Opinion in Biotechnology, 22 (3), 320-325 [21] Lavoie, J.-M., Beauchet, R., Berberi, V., Chornet, M. (2011) Biorefining quasi homogeneous biomass via the Feedstock Impregnation Rapid and Sequential Steam Treatment. Biofuel’s engineering process technology. Intech publishing. 685-715 [22] Lavoie, J.-M, Beauchet, R. (2012) Biorefinery of Cannabis sativa using one-and two-step steam treatments for the production of high quality fibres. Industrial Crops and Products 37 (1), 275-283 [23] Beauchet, R., Monteil-Rivera, F., Lavoie, J.-M. (2012) Conversion of lingnin to aromatic based chemicals (L-chems) and biofuels (L-fuels). Bioresource Technology. 121, 328-334 [24] Fuente-Hernandez, A., Corcos, P.O, Beauchet, R. & Lavoie, J.-M. (2013) Biofuels and co-products out of hemicellulose. Liquid, Gaseous and Solid Biofuels – Conversion Techniques. Intech Publishing, p.3-46. [25] Scott, S.A., Davey, M.P., Dennis, J.S., Horst, I., Howe, C.J., Lea-Smith, D.J., Smith, A.G. (2010) Biodiesel from algae: challenges and prospects. Current Opinion in Biotechnology, 21(3), 277-286. [26] Johna, R.J. Anishab, G.S., Nampoothiric, C.M., Pandey, A. (2011) Micro and macroalgal biomass: A renewable source for bioethanol. Bioresource Technology, 102(1), 186-193. [27] Labrecque, R&Lavoie, J-M. (2011) Dry reforming of methane with CO² on an electron-activated iron catalytic bed.

157