460 ieee transactions on information forensics and
TRANSCRIPT

460 IEEE TRANSACTIONS ON INFORMATION FORENSICS AND SECURITY, VOL. 4, NO. 3, SEPTEMBER 2009
Digital Image Source Coder Forensics Via IntrinsicFingerprints
W. Sabrina Lin, Member, IEEE, Steven K. Tjoa, H. Vicky Zhao, Member, IEEE, and K. J. Ray Liu, Fellow, IEEE
Abstract—Recent development in multimedia processing andnetwork technologies has facilitated the distribution and sharingof multimedia through networks, and increased the securitydemands of multimedia contents. Traditional image content pro-tection schemes use extrinsic approaches, such as watermarkingor fingerprinting. However, under many circumstances, extrinsiccontent protection is not possible. Therefore, there is great interestin developing forensic tools via intrinsic fingerprints to solvethese problems. Source coding is a common step of natural imageacquisition, so in this paper, we focus on the fundamental researchon digital image source coder forensics via intrinsic fingerprints.First, we investigate the unique intrinsic fingerprint of manypopular image source encoders, including transform-based coding(both discrete cosine transform and discrete wavelet transformbased), subband coding, differential image coding, and also blockprocessing as the traces of evidence. Based on the intrinsic fin-gerprint of image source encoders, we construct an image sourcecoding forensic detector that identifies which source encoder isapplied, what the coding parameters are along with confidencemeasures of the result. Our simulation results show that theproposed system provides trustworthy performance: for most testcases, the probability of detecting the correct source encoder isover 90%.
Index Terms—Image source coding, intrinsic fingerprint, multi-media forensics.
I. INTRODUCTION
W ITHIN the past decades, the explosive combinationof multimedia signal processing, communications,
and networking technologies has facilitated the sharing ofdigital multimedia data and enabled pervasive digital mediadistribution. Digital images, in particular, have been widelyused in news reporting, insurance claim investigation, crim-inal investigation, and many other applications. However, thedigital nature of information also allows individuals to access,duplicate, or manipulate information beyond the terms andthe conditions agreed upon, for example, with the assistanceof popular image editing software such as Adobe Photoshop.Therefore, the traditional faith that a photograph tells the truthis diminished for digital images, and it raises critical issuesabout the legitimacy and authenticity of the image.
Manuscript received March 03, 2009; revised May 27, 2009. First publishedJune 05, 2009; current version published August 14, 2009. The associate editorcoordinating the review of this manuscript and approving it for publication wasDr. Nasir Memon.
W. S. Lin, S. K. Tjoa, and K. J. R. Liu are with the Department of Electricaland Computer Engineering, University of Maryland, College Park, MD 20742USA (e-mail: [email protected]; [email protected]; [email protected]).
H. V. Zhao is with the Department of Electrical and Computer Engineering,University of Alberta, Edmonton, AB, T6G 2V4 Canada, (e-mail: [email protected]).
Color versions of one or more of the figures in this paper are available onlineat http://ieeexplore.ieee.org.
Digital Object Identifier 10.1109/TIFS.2009.2024715
Image forensics offers the ability to verify the credibility andvalidate the origin of digital images. Conventional forensic tech-nologies use proactive and additive means to protect multimediacontent by hiding additional information in the original signal.For example, the idea of the trustworthy camera was proposedin [1] to make the trustworthiness of digital images accountable,where a digital watermark was embedded into the image at theinstance of its acquisition. Any later tampering of the image canbe detected based on the changes on the digital watermark. Sim-ilarly, in traitor-tracing digital fingerprinting, user identificationinformation is embedded in each distributed copy to identify thecorresponding user and trace the source of the illicit copies [2].However, they require that all camera manufacturers agree upona common standard, and for some real applications, it may betoo expensive and impractical to implement such extrinsic pro-tection mechanisms.
Often it is not possible to enforce content protection throughany extrinsic means. However, for each copy of multimediadata, its acquisition, processing, and transmission processconstitutes a unique data path. To ensure that multimediadata are processed by the appropriate entities for intendedpurposes only, its data path must be validated by identifyingeach of its steps: acquisition, source coding, channel coding,transmission, and other possible processing at the user’s side.Each operation leaves its unique artifact in the image. Suchintrinsic “fingerprints” are naturally and inherently generatedthroughout the chain of content acquisition and processing, andthey provide evidence to help identify the origin and detect thealterations of multimedia content. Thus in the scenarios whereextrinsic content protection techniques are not applicable,image forensics via intrinsic fingerprints offers technologies todetect alterations and identify the source of the image withoutany proactive protection mechanisms. Fig. 1 illustrates thedifference between the methodologies that rely on extrinsicoperations to protect multimedia content versus those thatemploy intrinsic fingerprint analysis. With extrinsic protectionof multimedia, an additive signal is embedded into the imagebefore distribution and is available to the forensic detector,while with intrinsic-fingerprint forensics, the only input to theforensic detector is the received image in a raw format.
Image forensics via intrinsic fingerprints can be applied toidentify many types of image processing. For instance, it is oftenuseful to determine the source of image acquisition: a digitalcamera or a postediting software. Since most image acquisitiondevices reduce the data size by applying lossy encoders to theimages, there are prior arts in the literature which identify thecamera model based on the JPEG quantization table [3]. Foren-sics on other steps in image compression such as block sizeestimation [4]–[7] via the intrinsic fingerprints have also beenstudied in the literature. In this paper, we build a frameworkto integrate the image source encoding forensics that provides a
1556-6013/$26.00 © 2009 IEEE
Authorized licensed use limited to: University of Maryland College Park. Downloaded on August 21, 2009 at 00:14 from IEEE Xplore. Restrictions apply.

LIN et al.: DIGITAL IMAGE SOURCE CODER FORENSICS VIA INTRINSIC FINGERPRINTS 461
Fig. 1. Multimedia security using extrinsic means versus intrinsic information.
general methodology and fundamental research of image sourcecoding identification.
There exists some literature devoted to identify the uniquefeatures associated with each form of image processing, forexample, resampling [8], inconsistent noise patterns [9], copyand paste [10], double compression [11], [12], etc. Inconsistencyin higher order statistics, such as the bispectrum and bicoherence[13], were used to identify contrast changes such as gammacorrection [14] and other nonlinear operations on images [15].Inconsistency in lighting conditions [16], geometry invariants,andconsistencyofcameracharacteristics[17]werealsoproposedto detect image alteration. The work in [18] used wavelet-based features to detect image tampering. Physics-motivatedfeatures were introduced to distinguish photographic imagesand computer graphics [19]. To identify the source of animage, pixel defects [20] and image sensor noise [21] wereused to uniquely identify the source camera. Features suchas RGB-pair correlation and neighbor center of mass [22]were extracted as features and a support vector machine wereused to train classifiers to identify the camera. In [23] and[24], color filter array and color interpolation were used toclassify the camera brands.
This paper investigates the identification of source coding al-gorithms which is often an unavoidable step in image acquisi-tion and transmission. Each compression scheme leads to dif-ferent types of distortions. These distortions become an intrinsicpart of the compressed image, acting like a fingerprint. By dif-ferentiating amongst these distortion types, we can identify thescheme and estimate the parameters used to compress a digitalimage.
Source coder identification has many applications in multi-media security, coding, and communication, particularly whenwe lack access to the original signal or the device. As mentionedearlier, we can verify the datapath integrity of multimedia data.For example, consider two datapaths and . Imagetravels over datapath and image travels over datapath
. Each datapath consists of different digital cameras usedfor image acquisition, different source coders, and differenttransmission channels. We can certify the datapath taken bypossibly examining evidence of a particular color filter arrayused by the camera, the intrinsic fingerprints produced by thesource coder, and traces of error concealment due to channelerrors or network failure.
Also, digital image integrity is of paramount importance inmany forensic scenarios. The Scientific Working Group on
Fig. 2. Tree-structure of the image coding forensics system.
Imaging Technologies—part of the International Association forIdentification, an organization devoted to forensic science—citespotential legal ramifications regarding the use of digital imageprocessing in forensic contexts [25]. For example, compressionis often an unavoidable step in the image acquisition process.The compression history of an image may become relevant injudicial proceedings, since one could argue that compressionartifacts had obscured relevant information.
Unfortunately, the compression algorithm and settings maynot be immediately obvious, especially if performed automati-cally as a result of the acquisition device (e.g., compression indigital cameras). In this case, when the compressor is unknownand possibly proprietary, is there any way to determine the com-pression algorithm? This information is critical in subsequentquantitative image analysis, where the use of image compres-sion can degrade the accuracy of object measurements. Suchinaccuracies could lead to an incorrect diagnosis from a med-ical image, or an incorrect statement of guilt regarding a sub-ject involved in a crime as viewed by a surveillance camera.Through nonintrusive forensic analysis, we can identify the na-ture of the processing module in the absence of the originalimage, thereby offering some measure of confidence regardingsubsequent image analysis.
The primary objective of this paper is to introduce a forensicmethodology that uses intrinsic fingerprints to detect traces andidentify the history of source coding operations applied to dig-ital images. Section II formulates the problem and introducesthe system model. In Section III, we address the identificationof preprocessing applied to the image before compression. InSection IV, for each source encoder studied in this paper, weanalyze its unique intrinsic fingerprint and propose a similaritymeasure to quantify the likelihood that an image is compressedusing this source coding scheme. In Section V, we propose animage source coding forensic detector that uses intrinsic finger-prints to identify the source coding scheme used to compress animage, estimate the coding parameters, and provide confidencemeasurement of the detection results. Section VI shows simula-tion results. Conclusions are drawn in Section VII.
II. PROBLEM FORMULATION AND SYSTEM MODEL
Given a received and decoded image which has been source-encoded once, we analyze the image in order to answer whichcompression scheme was used to compress the image, if anypreprocessing such as blocking was performed before compres-sion, what the parameters of the coding scheme are, as well ashow confident we are of the detection and estimation results.
Authorized licensed use limited to: University of Maryland College Park. Downloaded on August 21, 2009 at 00:14 from IEEE Xplore. Restrictions apply.

462 IEEE TRANSACTIONS ON INFORMATION FORENSICS AND SECURITY, VOL. 4, NO. 3, SEPTEMBER 2009
Fig. 3. Overview of the proposed system model for source coder identification.
To answer the above questions, the first step is to catego-rize the major source encoders. Today, discrete cosine trans-form (DCT)-based encoders [26] such as JPEG are the mostwidely used image encoding schemes. Discrete wavelet trans-form (DWT)-based encoders like JPEG2000 and SPIHT are alsowidely used in modern image source coding, and they can beviewed as special realizations of subband encoders which sharethe same intrinsic fingerprints. Therefore, to make our systemmore generalized, it is important to investigate the common in-trinsic fingerprint of subband coding [27]. Differential imageencoders remove the redundancy among pixels by spatial fil-tering. This technology is still in use today as seen in the in-traprediction mode in H.264 [28], video interframe prediction,and lossless JPEG. Therefore, to provide a fundamental tech-nology, our forensic system includes these three source codingschemes, as shown in Fig. 2.
Fig. 3 illustrates our proposed system model. All of the testimages used throughout this work are digital grayscale imageswith eight bits per pixel. Given a test image , we develop an it-erative source coder identification and verification system. Thefirst step of the identification process is to identify any prepro-cessing performed upon the image before compression. Then,for each candidate source coding scheme in Fig. 2, we look forits trace in the test image and calculate its similarity measure(that is, the likelihood that the test image was compressed usingthis source coding scheme). We then select the one that gives thehighest similarity measure and estimate the coding parameters.
The next step is to verify our estimation result. If we selectthe correct source coding scheme and accurately estimate allof the coding parameters during the classification stage, then ifwe compress and decompress the input test image using theselected source coding schemes with the estimated parameters,then the output will be identical to the test image except forrounding errors. When the difference between and is smallerthan a threshold, we stop the search process and output the con-fidence measure of the system. Otherwise, we take this sourcecoding scheme out of our search space, select another candidatein Fig. 2 with the second highest similarity measure, and repeatthe classification and the parameter estimation processes againuntil we find one solution that satisfies the stopping criteria. If
we search over the entire image coding scheme set and none ofthem can pass the verification stage, the system outputs the errormessage “No source coding scheme detected.”
III. IMAGE BLOCK PROCESSING IDENTIFICATION
As shown in Fig. 3, to begin the forensic process, we must firstaddress any form of preprocessing performed upon the image.Detection of preprocessing is an obvious and crucial first step,because any inaccuracies at this stage could possibly invalidateall subsequent tests. The most common form of image prepro-cessing is block processing, which we focus on here.
Existing work in block processing measurement is not tai-lored to answer this question due to strong assumptions placedupon the input data. Works such as Minami and Zakhor [4], Tanand Ghanbari [5], Liu and Bovik [6], and Gao et al. [7] assume apriori that the image data is compressed through an establishedscheme such as JPEG or MPEG with some known block size.In a forensic scenario, we have no idea of the block size. Giventhis problem, we need a scheme that does not rely on such strongassumptions regarding the block size.
A. Intrinsic Fingerprint Analysis
Blocking artifacts may appear as a result of coarse quantiza-tion of individual blocks either in the spatial domain or the trans-form domain. Since quantization is performed on each blockseparately, a boundary will appear between the blocks as anabrupt change in the luminance value. For an original, unquan-tized image, this artifact is unlikely to appear because naturalimages have smooth variations, on the whole. Considering theluminance discontinuities present across block boundaries, thegradient magnitude image should reveal the presence of blockartifacts.
Therefore, after computing the gradient magnitude of eachrow and column in a block-processed image, we expect to findpeaks at every block boundary position. We can further revealthese peaks by averaging the gradient magnitudes of all rows (orcolumns) together. Let be the input image of size ,and be the luminance value of pixel , where
and . First, obtain the gra-dient image along a desired direction. For example, we operate
Authorized licensed use limited to: University of Maryland College Park. Downloaded on August 21, 2009 at 00:14 from IEEE Xplore. Restrictions apply.

LIN et al.: DIGITAL IMAGE SOURCE CODER FORENSICS VIA INTRINSIC FINGERPRINTS 463
Fig. 4. Signals �, � , and � for JPEG-compressed Lena with a block size of 16.
along the vertical direction to obtain.
Then obtain the average of the gradient magnitude by aver-aging along the orthogonal direction. For example, we now av-erage along the horizontal direction, where
(1)
Let be the block size, if it exists. If block processing is present,the one-dimensional signal will have peaks at multiples of theblock size (i.e., at , for ). To extract these peaks, weuse median filtering as follows. Let be the median-filteredversion of : . If wesubtract from itself, we will obtain the peaks in whichwe call , the intrinsic block artifact fingerprint
(2)
Fig. 4 shows the signals , , and for the 512-by-512 testimage Lena which has been JPEG-compressed using a blocksize of 16 and standard JPEG compression table. We expectto resemble an impulse train, where the magnitude of the im-pulses is determined by the strength of the block artifacts, andthe period of the impulses is determined by the block size.
One problem we face is the presence of spurious peaks inthe signal as a result of edges from objects in the image.Note that an edge will have the same gradient direction along itsentire length. However, the gradient direction of block artifactswill oscillate. Therefore, we perform the following test. Let thesignal be a sum of the gradients
(3)
A peak in this signal will indicate the presence of an edge.Therefore, we find , where is a median-filteredversion of . Then we set for all , where ,for some suitable threshold . For the images used in our dataset, the value maximizes the number of correctly esti-mated block sizes among all images tested. Images which usemore or less than eight bits per pixel may require a differentthreshold; this value can be chosen by the system designer basedupon the nature of the images processed.
B. Block Size Estimation
Fig. 5 shows the block diagram for our detection scheme.The periodicity of allows us to use a maximum-likelihoodestimation scheme used in pitch detection [29] to determine theperiod of the signal . Suppose that consists of a knownperiodic signal plus zero-mean i.i.d. Gaussian noise
(4)
Let us express the signal as a periodic repetition of a signalwith period
(5)
To obtain the maximum-likelihood estimate, we maximize theconditional probability density function with re-spect to the signal parameter , the noise variance , and theperiod . It can be shown that the estimated period that max-imizes is achieved by minimizing the estimatednoise variance as a function of
(6)
This is our estimate for the block size along one dimension (e.g.,the vertical or horizontal dimension). We repeat the process forthe other dimension to obtain the estimate for the block size inboth dimensions.
Authorized licensed use limited to: University of Maryland College Park. Downloaded on August 21, 2009 at 00:14 from IEEE Xplore. Restrictions apply.

464 IEEE TRANSACTIONS ON INFORMATION FORENSICS AND SECURITY, VOL. 4, NO. 3, SEPTEMBER 2009
Fig. 5. Block diagram for the block artifact fingerprint detection and block size estimation scheme.
C. Intrinsic Fingerprint Detection Performance
After having found an estimated block size , we still haveto answer if block processing is truly present. Consider a simpledetection problem with the following two hypotheses:
(7)
Detection of implies that our block size estimate is correct,while corresponds to an incorrect block size estimate oran absence of block processing. Actual execution of a likeli-hood ratio test requires exact knowledge of which we do nothave. In theory, we can use the signal-to-noise ratio (SNR) asa measure of our detection accuracy. The SNR is defined asSNR . Unfortunately, we only have estimates of and
instead of their true values. Calculating the SNR using thesignal estimate is inaccurate since it relies on the accuracy ofthe signal estimate itself. Furthermore, since is not exactly pe-riodic, the variance in the peaks of will erroneously contributeto our estimate of the noise power. In practice, we will use theobserved signal-to-noise ratio (OSNR) for our measure of de-tection accuracy, defined as
(8)
where is a modified estimate for the noise power which doesnot include the variance of the peaks in , i.e,
(9)
where the set ,, and
(10)
Fig. 6(a) shows plots of the block size estimation results forthe standard test images Lena. We test for block sizes 4, 8, 16,32, and 64. To create our block-processed images, we use JPEGcompression with quality factors from 20 to 90. Each circle rep-resents correct estimation, and each star represents incorrect es-timation.
We see that correct estimation varies as a function of bothPSNR and block size. Naturally, the strength of block artifactsdecreases as image quality increases. As block size increases,the signal has fewer periods, and therefore, our estimate isless accurate. For example, as shown in Fig. 6(a), the estimationaccuracy for compressed Lena with block sizes of 4 and 8 in thehorizontal direction is 100%, while estimation for block sizes
of 16, 32, and 64 fails for PSNR above 41.1, 39.5, and 38.6 dB,respectively. Nevertheless, estimation is still accurate at highPSNRs where the artifacts are not perceptually visible. Fig. 6(b)is a close view of the high frequency part of a JPEG compressedLena. It is clear that there is no visual blocking effect presence,however, as shown in Fig. 6(a), our block size estimation worksperfectly.
We also plot the receiver operating characteristic curve toillustrate our detection accuracy as a function of the OSNRthreshold in Fig. 7 which shows the probability of detectionversus the probability of false alarm for the test in (7). As thethreshold varies, correct estimates with an OSNR that lies abovethe threshold are hits. Incorrect estimates with an OSNR that liesabove the threshold are false alarms. This plot uses detection re-sults from 24 digital images of natural photographs with varyingfrequency characteristics, all with size 512-by-512. We test forthe same block sizes and quality factors mentioned previouslyand also across both dimensions. We see that our scheme can ob-tain a of 95.0% for a of 7.4%, and a of 98.0% for a
of 16.5%. In practice, we can decrease our OSNR thresholdto accommodate a higher . The cost of a miss (i.e., detectingno block artifacts when in fact block processing is present) canbe significant in a forensic setting where subsequent forensictests depend on some block size estimate.
As for the purpose of block size estimation, considering thehorizontal and vertical estimations of the block sizes separatelycan provide a guideline of how good the identification methodis. The horizontal and vertical estimations of the block sizemight not agree. However, the block processing can use rec-tangle block sizes such as 4 8 and our source-coding forensicdetector has no prior information that the preprocessing blockis square ( ) or not. Hence, when the source-coding forensic detector is identifying the block processing, itwill estimate the block size horizontally and vertically sepa-rately, and combine the estimation results. For instance, if thehorizontal block-size estimation is 4 and the vertical estima-tion is 8, then the source-coding forensic detector will adopt theblock size 8 4.
IV. INTRINSIC FINGERPRINT ANALYSIS OF SOURCE ENCODERS
As shown in Fig. 3, after estimating the block size, if any, theforensic detector can start to determine which kind of sourceencoder used by utilizing the intrinsic fingerprint of each imagesource encoder as trace of evidence. In this section, we analyzethe intrinsic fingerprints of subband coding, transform coding,and differential image coding. For each type of encoder, we in-vestigate the intrinsic fingerprint and define a similarity measureto determine how likely this encoder has been applied.
Authorized licensed use limited to: University of Maryland College Park. Downloaded on August 21, 2009 at 00:14 from IEEE Xplore. Restrictions apply.

LIN et al.: DIGITAL IMAGE SOURCE CODER FORENSICS VIA INTRINSIC FINGERPRINTS 465
Fig. 6. Block size estimation results of Lena.
Fig. 7. Performance of the block size estimation algorithm.
A. Transform Coding
In this section, we discuss the most commonly used trans-forms, DCT and DWT.
1) A Unified Approach for Transform Coding: DCT-basedimage compression is usually a block-based processing of theimage, where the whole image is decomposed into nonoverlap-ping blocks of the same size (for example 8-by-8 in JPEG base-line) and each block is transformed and compressed separately,while DWT-based source coding schemes often consider thewhole image as a single block, apply wavelet transform to theentire image, and decompose it into different frequency bandsof different statistics. We unify the transformation mechanismsof DCT coders with that of embedded DWT by drawing someinsight from [30], which treated each 8-by-8 block of transformcoefficients in a DCT-block coder as a 64-subband decomposi-tion of the original 8-by-8 image block. In other words, we takethe (0,0) coefficients of all blocks as a subband, treat all (0,1)coefficients as another subband, and so on.
After tiling all of these subbands together, we obtain a co-efficient subband representation similar to the one shown in
Fig. 8. Left: Reorganization of 4-by-4 DCT coefficients into subbands. Right:Histograms for each coefficient subband.
Fig. 8. In this figure, a discrete cosine transformation with blocksize of 4 was applied to the original uncompressed image Lena.All of the DCT coefficients of the same frequency are com-bined into one subband, and these subbands are tiled together.For example, the subband on the first row and first column of
Authorized licensed use limited to: University of Maryland College Park. Downloaded on August 21, 2009 at 00:14 from IEEE Xplore. Restrictions apply.

466 IEEE TRANSACTIONS ON INFORMATION FORENSICS AND SECURITY, VOL. 4, NO. 3, SEPTEMBER 2009
Fig. 9. Example coefficient histograms of two images previously compressed with different schemes. Left: DCT coefficient histogram of position (0,1) after JPEGdecoding. Right: Wavelet coefficient histogram of the level-4 LH subband after SPIHT decoding.
the left image is tiled from the DC coefficient, and the sub-band on the first row and second column is tiled from all the(0,1) DCT coefficients. The corresponding subband histogramsare shown in the right figure in Fig. 8. Therefore, we can statethat for both types of transforms, if we perform the appropriatesubband decomposition and then observe the histogram withineach subband, we should find histogram peaks. We can applythe same concept to JPEG2000 images which have been codedusing tiling. JPEG2000 allows the use of optional tile sizes of al-most any size; subsequent coefficient transformation and quan-tization is performed on each tile separately. Nevertheless, if weobtain the wavelet coefficient subbands from each tile and thenreorganize them as mentioned earlier, we arrive at a single co-herent wavelet decomposition.
2) Intrinsic Fingerprint Analysis: First, we consider a DCTblock coder. During quantization, the DCT coefficients are dis-cretized. During inverse quantization, the quantized coefficientsare multiplied by the quantization step size. As a result, we ex-pect to find peaks in the histogram at multiples of the step sizeand zeros elsewhere. However, as noted by [31], due to the trun-cation and rounding affects caused during reconstruction, thehistogram peaks do not appear as perfect impulses, as shown inFig. 9, where Fig. 9(a) shows the DCT coefficient histogram ofposition (0,1) of JPEG compressed Lena.
Next, consider an embedded DWT coder. Each embeddedcoder has its own algorithm for deciding the order in which thezerotree is traversed and the coefficients are transmitted. Sincethe coefficient values are bit-plane encoded, the transform coef-ficient histogram of the previously compressed image will alsocontain peaks at the designated reconstruction values, thoughnot necessarily evenly spaced. Fig. 9(b) shows the coefficienthistogram at the level-4 LH subband of a SPIHT-coded imagewith a bit rate of 1.0 bit per pixel. Although quantization is usedin all source coding schemes to reduce the bit rate, we could onlyobserve such coefficient histogram peaks in the domain wherequantization is applied. For an image that is compressed usingsubband coding or differential image coding, its DCT or DWTcoefficient histograms do not contain such peaks. In addition, fora DCT-compressed image, such peaks do not exist in its DWT
coefficient histogram either, and vice versa. Therefore, DCT orDWT coefficient histogram peaks can be used to identify trans-form-compressed images, as well as to differentiate DCT-com-pressed images from DWT-compressed ones.
3) Intrinsic Fingerprint Detection: Having discussed amajor difference between the transform coefficient histogramsof transform-compressed and nontransform compressed im-ages—the presence of histogram peaks, which is the intrinsicfingerprint of transform coding—we would like to characterizethis difference between different types of histograms using adistance metric.
Our goal is to compare the transform coefficient histogram forthe observed image against the transform coefficient histogramof nontransform compressed image (i.e., no quantization in thetransform domain), and decide how similar the two histogramsare. Although the original coefficient histogram is irretrievable,we can approximate the original coefficient histogram usinga least-squares approximation. Research has previously shownthat both the histograms of DCT coefficients and wavelet coeffi-cients of the transform coded image can be accurately modeledusing a generalized Gaussian distribution [32]–[34]. Therefore,let be the probability mass function of the original coeffi-cients within a subband, modeled as follows for simplicity:
(11)
where is the index of the subband, is a normalization con-stant, , and is the same exponent found in the general-ized Gaussian distribution.
Given a fixed , linear least-squares can be used to solve forand . However, this procedure is sensitive to small perturba-
tions in the input data, and it cannot optimize all three param-eters simultaneously. To overcome these problems, we will usea nonlinear least-squares method to obtain the best fit. The op-timization problem is formulated as follows:
(12)
(13)
Authorized licensed use limited to: University of Maryland College Park. Downloaded on August 21, 2009 at 00:14 from IEEE Xplore. Restrictions apply.
LIN et al.: DIGITAL IMAGE SOURCE CODER FORENSICS VIA INTRINSIC FINGERPRINTS 467
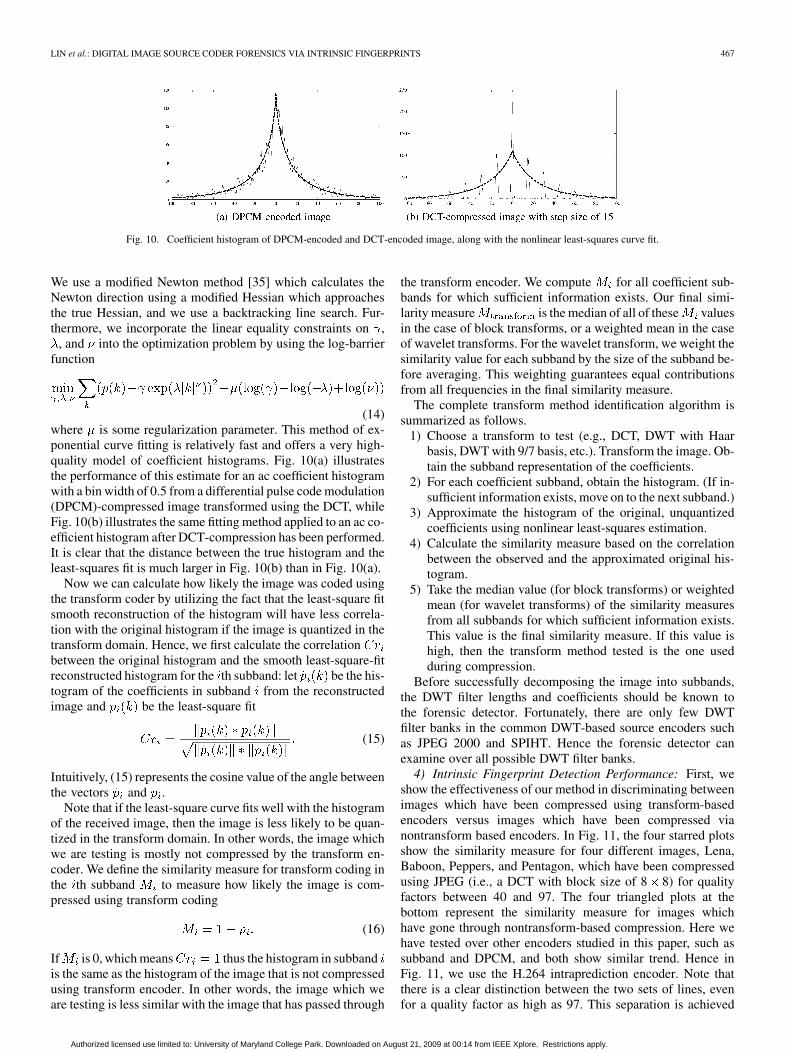
Fig. 10. Coefficient histogram of DPCM-encoded and DCT-encoded image, along with the nonlinear least-squares curve fit.
We use a modified Newton method [35] which calculates theNewton direction using a modified Hessian which approachesthe true Hessian, and we use a backtracking line search. Fur-thermore, we incorporate the linear equality constraints on ,
, and into the optimization problem by using the log-barrierfunction
(14)where is some regularization parameter. This method of ex-ponential curve fitting is relatively fast and offers a very high-quality model of coefficient histograms. Fig. 10(a) illustratesthe performance of this estimate for an ac coefficient histogramwith a bin width of 0.5 from a differential pulse code modulation(DPCM)-compressed image transformed using the DCT, whileFig. 10(b) illustrates the same fitting method applied to an ac co-efficient histogram after DCT-compression has been performed.It is clear that the distance between the true histogram and theleast-squares fit is much larger in Fig. 10(b) than in Fig. 10(a).
Now we can calculate how likely the image was coded usingthe transform coder by utilizing the fact that the least-square fitsmooth reconstruction of the histogram will have less correla-tion with the original histogram if the image is quantized in thetransform domain. Hence, we first calculate the correlationbetween the original histogram and the smooth least-square-fitreconstructed histogram for the th subband: let be the his-togram of the coefficients in subband from the reconstructedimage and be the least-square fit
(15)
Intuitively, (15) represents the cosine value of the angle betweenthe vectors and .
Note that if the least-square curve fits well with the histogramof the received image, then the image is less likely to be quan-tized in the transform domain. In other words, the image whichwe are testing is mostly not compressed by the transform en-coder. We define the similarity measure for transform coding inthe th subband to measure how likely the image is com-pressed using transform coding
(16)
If is 0, which means thus the histogram in subbandis the same as the histogram of the image that is not compressedusing transform encoder. In other words, the image which weare testing is less similar with the image that has passed through
the transform encoder. We compute for all coefficient sub-bands for which sufficient information exists. Our final simi-larity measure is the median of all of these valuesin the case of block transforms, or a weighted mean in the caseof wavelet transforms. For the wavelet transform, we weight thesimilarity value for each subband by the size of the subband be-fore averaging. This weighting guarantees equal contributionsfrom all frequencies in the final similarity measure.
The complete transform method identification algorithm issummarized as follows.
1) Choose a transform to test (e.g., DCT, DWT with Haarbasis, DWT with 9/7 basis, etc.). Transform the image. Ob-tain the subband representation of the coefficients.
2) For each coefficient subband, obtain the histogram. (If in-sufficient information exists, move on to the next subband.)
3) Approximate the histogram of the original, unquantizedcoefficients using nonlinear least-squares estimation.
4) Calculate the similarity measure based on the correlationbetween the observed and the approximated original his-togram.
5) Take the median value (for block transforms) or weightedmean (for wavelet transforms) of the similarity measuresfrom all subbands for which sufficient information exists.This value is the final similarity measure. If this value ishigh, then the transform method tested is the one usedduring compression.
Before successfully decomposing the image into subbands,the DWT filter lengths and coefficients should be known tothe forensic detector. Fortunately, there are only few DWTfilter banks in the common DWT-based source encoders suchas JPEG 2000 and SPIHT. Hence the forensic detector canexamine over all possible DWT filter banks.
4) Intrinsic Fingerprint Detection Performance: First, weshow the effectiveness of our method in discriminating betweenimages which have been compressed using transform-basedencoders versus images which have been compressed vianontransform based encoders. In Fig. 11, the four starred plotsshow the similarity measure for four different images, Lena,Baboon, Peppers, and Pentagon, which have been compressedusing JPEG (i.e., a DCT with block size of 8 8) for qualityfactors between 40 and 97. The four triangled plots at thebottom represent the similarity measure for images whichhave gone through nontransform-based compression. Here wehave tested over other encoders studied in this paper, such assubband and DPCM, and both show similar trend. Hence inFig. 11, we use the H.264 intraprediction encoder. Note thatthere is a clear distinction between the two sets of lines, evenfor a quality factor as high as 97. This separation is achieved
Authorized licensed use limited to: University of Maryland College Park. Downloaded on August 21, 2009 at 00:14 from IEEE Xplore. Restrictions apply.

468 IEEE TRANSACTIONS ON INFORMATION FORENSICS AND SECURITY, VOL. 4, NO. 3, SEPTEMBER 2009
Fig. 11. Similarity measure as a function of quality factor for test images whenusing transform encoder or nontransform encoders.
thanks to the quality of the nonlinear least-squares estimate ofthe original coefficient histograms. When least-squares esti-mation tries to approximate a histogram of coefficients from atransform-compressed image using a generalized Gaussian dis-tribution, the curve fit will be poor and the difference betweentwo histograms will be high, as shown earlier in Fig. 10(b).Also, the difference between the JPEG-compressed images andimages that were compressed by other source encoders doesnot decrease as the quality factor increases. As long as theimage was quantized in the transform domain, its coefficienthistogram will be like Fig. 10(b) independent of the quanti-zation table is used. Although a higher quality factor impliesa smaller quantization step, the coefficient histogram of thecompressed image still contains noticeable spikes and is verydifferent from the least-square estimated histogram.
B. Subband Coding
1) Intrinsic Fingerprint Analysis: The subband encoder firstpasses the image through a bank of filters, called the analysisfilter bank, and then applies decimation (downsampling) to de-compose the image into several frequency bands of differentstatistics and different perceptual importance. Then, each fre-quency band is encoded independently using one of several en-coding schemes (for example, differential image coding or DCTcoding). At the decoder’s side, after decoding each frequencyband, the decoded values are upsampled and passed througha bank of synthesis filters to generate the final reconstructedimage. There are four sources that will leave traces in a subband-coded image: lack of perfect reconstruction, aliasing, quantiza-tion, and signal ringing effect.
When choosing the filter banks, longer filters are oftenpreferred to minimize the aliasing in the later decimation step.However, longer filters also produce more serious ringingeffects which are the spurious oscillations in the vicinity ofmajor edges. When addressing the tradeoff between aliasingand ringing, most subband coding schemes use longer filterssince aliasing is much less desired than the ringing effect. Inaddition, ringing exists in all kinds of subband coding no matterwhich encoding schemes are used to compress each frequency
band, and it makes ringing the ideal candidate as the intrinsicfingerprint for all subband coding schemes. DWT coding canbe viewed as a special case of subband coding, so it also leavesthe same ringing trace in the decoded image. However, inrecent development of image source encoders, DWT encodersforms a special and widely used family with standard waveletbases, so we consider DWT encoders separately using the moresignificant intrinsic fingerprints as discussed in Section IV-A.II.
2) Similarity Measure: From the previous analysis, theringing effect is the most significant trace of all subband codingschemes. To extract the trace of ringing effect, we first apply aderinging algorithm to the input image to generate a deringedimage . The deringing algorithm is maximum-likelihoodbased which fits the major edges to flat surface model, as in [36].We then subtract the deringed image from the test imageand calculate the difference image . The ringingeffects often happen on the edges of the image; therefore, ifis a subband-encoded image, then the energy of the differenceimage should concentrate on the edges. If was compressedusing other schemes, then we would observe that the energy of
is evenly distributed all over the entire image. Fig. 12 showsan example of extracting the trace of ringing effect. Fig. 12(b)shows the difference image . If we comparewith the edge map shown in Fig. 12(a), we can see thatthe energy of concentrates on the edges. Fig. 12(c) is thedifference image of a DPCM-coded Lena withthe same SNR, 36 dB. It is clear that the energy of Fig. 12(c)does not concentrate on the edges, which shows the observedphenomenon used to classify subband coding does not happenin other coding schemes.
To quantify the energy distribution of on edges, we definethe similarity measure of the subband coding schemes as
(17)
In (17), is the binary edge map of , where a pixel equals 1if it is detected as an edge pixel and has value 0 otherwise.is the number of pixels that are detected as edge pixels. In (17),the numerator calculates the energy of the edge pixels in the dif-ference image , and the denominator is the normalizationterm for fair comparison with other similarity measurements. Alarger value of gives us a higher confidence that thetest image was subband coded.
Fig. 13(a) shows the simulation results on the similarity mea-sures of four test images that are encoded using different sourcecoding schemes. The lines that are marked with triangles arethe similarity measures of the images compressed by subbandencoders, and the starred lines are the similarity measures ofthose compressed using other encoders (DCT and DPCM). Itis obvious that there is a significant gap between the similaritymeasure values of these two groups, and we can easily distin-guish subband-coded images from nonsubband-coded images.The trace of subband coding is stronger when the test image haslower PSNR when compared with the original uncompressedimage.
The typical subband coding will further encode the lowestfrequency subband (the LL band) using other image codingmethods, and the trace of the LL band encoder can also be ex-tracted from the image. In our system, we include two LL-band
Authorized licensed use limited to: University of Maryland College Park. Downloaded on August 21, 2009 at 00:14 from IEEE Xplore. Restrictions apply.

LIN et al.: DIGITAL IMAGE SOURCE CODER FORENSICS VIA INTRINSIC FINGERPRINTS 469
Fig. 12. Example of similarity measure calculation of subband coding.
encoders: the DCT encoder and the differential encoder asshown in Fig. 2. We will apply the analysis in Sections IV-Aand IV-C based on to give the similarity measure of the twosubcategories in the subband category.
C. Intrinsic Fingerprint of Differential Image Coding
Although differential image coding (DPCM) is one of thevery first image encoding methods, it is still applied to currentimage and video coding standards. The basic idea of differentialimage coding is to remove the strong correlation between adja-cent pixels by representing a pixel as a linear combination of itsneighbors and then quantize the residue in the spatial domain.
Today, the most popular lossy application of DPCM is theintraprediction mode of H.264 [28]. H.264 mainly uses DCTto remove the pixel redundancy and the intraprediction in spa-tial domain as an assistant tool. As a result, the fingerprintsof H.264 must be different from that of the traditional differ-ential image coding since they use different tools to removethe pixel redundancy. Therefore, in this section, we proposetwo different forensic methods to identify traditional differen-tial coding schemes and the H.264 intraprediction.
1) H.264 Intraprediction: Prior to encoding, the luma in-traprediction in H.264 first subtracts some reference samplesfrom previously encoded and reconstructed blocks. Then, a pre-diction block (either 4 4 or 16 16) is formed based on thereference samples. There are nine modes for 4 4 blocks andfour modes for 16 16 macroblocks [37]. The residue is trans-formed by integer DCT bases followed by a uniform scalarquantization. The quantization step is the same for all coeffi-cients within the same macroblock. If necessary, the decodedimage will go through a deblocking filter which only effects thepixels on the block boundaries.
• Intrinsic Fingerprint Analysis: Since residues are quan-tized in the integer DCT domain, we expect to observethe same histogram peaks as transform coding if we cal-culate the residue correctly. However, the boundary pixelsof the decoded image might go through linear filters to re-duce the blocking effect, thus changing the value of refer-ence samples in the decoded image. As a result, the peaksdo not appear as perfect impulses, as shown in Fig. 14.Since the value of the boundary pixels might be changedby deblocking filters, the residue of the boundary pixels are
not included in the histogram calculation. Fig. 14 showsthe histogram in transform domain of the 64 residues in a16 16 macroblock under the 4 4 intraprediction mode0. The boundary pixels in Fig. 14(a) are not deblocking fil-tered, thus Fig. 14(a) shows perfect peaks. Fig. 14(b) is thehistogram of the transformed residue pixels after the wholeH.264 reconstruction process (including deblocking). It isclear that the peaks are not perfect impulses but still muchhigher than other values, in comparison to the Fig. 14(c),which is calculated from a JPEG-compressed image.
• Similarity Measure: Since the intrinsic fingerprint of theH.264 intraprediction is the presence of histogram peaks intransform domain, we would like to characterize the differ-ence between different types of histograms using a distancemetric as in Section IV-A3.We first need to obtain the estimated residues of eachblock (or macroblock). In the encoding process of H.264intraprediction, the prediction mode is chosen to minimizethe sum of residue energy. Therefore, we apply the samealgorithm to estimate the prediction mode by choosing theone that has minimal square error.The similarity measure of the macroblock is defined andcalculated as in (16). We calculate the similarity measure
over all the macroblocks of the whole image, andchoose the median value as the similarity measure ofdifferential image coding .We test on four images, Lena, Baboon, Peppers, andPentagon, that are compressed using H.264 intrapredictionmode with macroblock 16-by-16 and prediction mode0. The similarity measures versus quantizationstep are shown in Fig. 13(c). The lines marked with starsare for H.264-compressed images, and the lines withtriangle markers represent those transform-coded andsubband-coded images. From Fig. 13(c), it is obviousthat there is a significant gap between of thesetwo groups. Therefore, can accurately identifyH.264-coded images from images compressed using othersource coding schemes studied in this paper. Note that thesimilarity measure does not decrease significantly whenthe quantization step decreases. Even with small quantiza-tion step sizes, the residues are still discretized. When thequantization step size becomes very small (for instance,
Authorized licensed use limited to: University of Maryland College Park. Downloaded on August 21, 2009 at 00:14 from IEEE Xplore. Restrictions apply.

470 IEEE TRANSACTIONS ON INFORMATION FORENSICS AND SECURITY, VOL. 4, NO. 3, SEPTEMBER 2009
Fig. 13. Similarity measures of subband coding, differential coding, and H.264 intraprediction on test images.
Fig. 14. Example of residue histogram of 4� 4 intraprediction in H.264.
Fig. 15. Example of intrinsic fingerprints of differential coding at SNR � �� dB.
0.875), the decoded image is not deblocked, which keepsthe sharp peaks in the histogram. Therefore, the intrinsicfingerprint is still preserved.
2) Traditional Differential Coding: In traditional differen-tial image coding schemes, the encoders are allow to changethe estimation coefficients and the filter lengths. As a result, theestimation mode is not a small finite set as in H.264 intrapre-diction, thus the residue histogram cannot be estimated as inSection IV-C.
• Intrinsic Fingerprint Analysis: Assuming that the receivedimage was differential-coded, to identify the intrinsicfingerprints, we first apply image denoising [38] to removethe white quantization noise. We then use the differencebetween the test image and the denoised image toestimate the quantization noise in DPCM. If the receivedimage was compressed using differential coding, then theestimated quantization noise should have a whitespectrum.Fig. 15 shows an example where the Lena image was en-coded using DPCM with PSNR of 30 dB. Fig. 15(a) and (b)show the estimated quantization noise and its spec-trum, respectively. As we can see, has a flat spec-trum, resembling a white noise. As an illustration of theintrinsic fingerprints of DPCM encoders, in Fig. 15(c) we
also show the of a subband coded Lena with thesame SNR 30 dB; it is clear that Fig. 15(c) does not showthe same characteristic as Fig. 15(a).
• Similarity Measure: Let be the spectrum of andbe the spectrum of a white noise with the same power as. To quantify the resemblance of to , we define the
similarity measure for DPCM as
(18)
Similar to (17), the numerator calculates the similarity be-tween and and the denominator normalizes the sim-ilarity for fair comparison with other measures.We test on four images that are compressed using differentcoding schemes and plot their in Fig. 13(b).The lines marked with stars are the similarity mea-sures of DPCM-compressed images, and the lines withtriangle markers represent those transform-coded andsubband-coded images. From Fig. 13(b), it is obviousthat there is a significant gap between of thesetwo groups, and that can accurately differentiateDPCM-coded images from images compressed usingother source coding schemes.
Authorized licensed use limited to: University of Maryland College Park. Downloaded on August 21, 2009 at 00:14 from IEEE Xplore. Restrictions apply.

LIN et al.: DIGITAL IMAGE SOURCE CODER FORENSICS VIA INTRINSIC FINGERPRINTS 471
Fig. 16. Detailed image source-coding forensic system flowchart.
V. IMAGE SOURCE CODING FORENSIC DETECTOR
Now that we have all the similarity measures for differentsource coding schemes in Fig. 2, we can construct an imagecoding forensic system. The system flowchart is shown inFig. 16, where is a predetermined threshold and
is the maximum size of the output candidate set deter-mined by the system designer. The threshold TH is determinedby a training database including 24 natural images, and theseimages are not included in the test database.
The key steps to detect the source coding schemes are as fol-lows:
1) Determine whether the image has been block processed, ifso, estimate the block size.
2) Apply the intrinsic fingerprint detection as discussed inSection IV, and calculate the similarity measure of allleaves in Fig. 2.
3) Choose the node in the tree with the highest similarity mea-sure and estimate the coding parameters.
4) Calculate the similarity between the re-encoded imageand the received image.
5) If , discard this source coding scheme. If thereare still some other source encoders in the tree, go back tostep 3. If there are no more source encoders in the tree, andthe output candidate set is empty, return N/A. If it is notempty, compute the confidence measure and output.
6) If , put this codec in the output candidate set .7) Test whether the size of the output candidate set equals
. If so, compute the confidence measure and output
the one with lowest noise variance as calculated inSection V-B. If not, go back to Step 3.
A. Parameter Estimation
For DCT-based transform coding, we take JPEG as an ex-ample. The DCT basis can be directly acquired once we finishthe block processing detection as discussed in Section III-A, soall we need to discuss here is quantization table estimation.
First, given a block size of , we obtain the histogram foreach of the transform coefficient positions by counting thevalue for one particular coefficient position over all blocks andfinding the distance between two consecutive peaks in the his-togram to determine the quantization step size [39]. However,high-frequency coefficients do not contain enough informationto determine the step size. Therefore, we extrapolate the re-maining coefficients by expressing the quantization table as alinear combination of existing quantization tables.
To do this, we find all of the coefficients which were ac-curately estimated in our initial procedure. Let bethe vector of quantization table elements estimated by findingthe distance between consecutive peaks in the coefficient his-tograms. Then let equal the vector without those coefficientswhose step size has not yet been determined. Let the matrix
be a collection of existing quantizationtables, and let only include the same coefficient positions asin . In order to minimize , for some scalars ,we solve the following normal equations:
(19)
which gives us . The rest of the coefficients are then estimatedusing .
To illustrate the accuracy of this approach, we ran 1000 trialsof the following experiment. We define the matrix to includeten existing quantization tables including those used in AdobePhotoshop, digital cameras, and the JPEG standard luminanceand chrominance tables [40]. We compressed a 512-by-512 testimage using an 8-by-8 quantization table obtained through arandom linear combination of 23 existing tables. Fig. 17 illus-trates the average absolute error obtained using our quantizationtable estimation method for each of the 64 coefficient frequen-cies.
As we see from Fig. 17, the coefficients in the low- and mid-frequency ranges are estimated perfectly. For high-frequencycoefficients, the algorithm produces estimates that are close tothe original table elements. The accuracy of the algorithm cer-tainly depends on how similar the tested quantization table isto the set of known tables. Clearly, if the quantization tableused during compression happens to be an element in the setof known quantization tables which comprise the training data,then the quantization table estimate will be perfect.
1) Subband Coding: For subband coding schemes, the en-coding parameters that we need to estimate are the filter banksand the decimation factor (or equivalently, the number of fre-quency bands).
Since the quadrature mirror filter (QMF) banks are the mostcommonly used filter banks in the literature, we consider someof the most popular QMFs [27] in our system. To estimate theQMF that was used, for each candidate, we first apply a subbandcoder of level 1 to the test image and divide it into four subbands
Authorized licensed use limited to: University of Maryland College Park. Downloaded on August 21, 2009 at 00:14 from IEEE Xplore. Restrictions apply.

472 IEEE TRANSACTIONS ON INFORMATION FORENSICS AND SECURITY, VOL. 4, NO. 3, SEPTEMBER 2009
Fig. 17. Average absolute error for the quantization table estimation method.
(LL, LH, HL, and HH) in the 2-D spatial domain. We choose theQMF that gives the most energy concentration in LL subband.
2) Differential Image Coding:Traditional DPCM: Without loss of generality, we
assume there are possible lengths of the spatial filters. Let [ , ] be the residue range. If the
prediction error of the current pixel is larger than , increasethe filter length to the next level; if the prediction error is lessthan , shorten the filter length.
• First, divide the image into flat regions and nonflat re-gions by the edge map.
• Compute the energy of , the estimated quantizationerror, in both the flat regions and the nonflat region. If thetwo values are not comparable, then a nonadaptive DPCMencoder was used.
• To determine the order of the spatial filter, and thefilter coefficients jointly, for each filter length , solvethe least-square solution for the filter coefficientsand the corresponding error for dif-ferent filter lengthes. The estimate filter lengthand filter coefficient is the one that minimizes
H.264 Intraprediction: The parameters of H.264 intrapre-diction are the prediction mode and the quantization step of eachmacroblock. The prediction mode is already identified in thesimilarity measure calculation as in Section IV-C, thus the onlyparameter to be estimated is the quantization step for each mac-roblock.
• For each macroblock , threshold the histogram with itsleast-square fit . If , then ;otherwise
• Given a quantization step in H.264 standard, generate animpulse train in transform domain with interval .
• Multiply the thresholded histogram with the impulsetrain, and calculate the energy.
• Choose the quantization step that gives the highest energy.
B. System Confidence Measure
In our system, we also design a confidence measure to quan-tify the confidence of the proposed source-coding forensic de-tector on the classification and estimation results. A higher con-fidence value in estimation would increase the trustworthinessof the decision made by a forensic analyst.
Given a test image , for the th source-coding scheme candi-date, we first remove from the effect of compression and usethe resulting image to estimate the original uncompressedimage. For example, with subband coding, we use deringing toremove the ringing effect and thus estimate the original image,
and we apply denoising to the test image to remove the whitequantization noise with differential image coding. Then, we usethe th compression scheme to re-encode and generate there-encoded image . We then calculate the difference betweenthe test image and the re-encoded image, i.e., .
Let denote the variance of . If the th candidate is thesource coding scheme that was used to generate the test image ,then will be the same as except for rounding errors. If wetreat as noise, then should have low energy, andwill have a much smaller value than other , where .Let be the number of candidate source coding schemes, andlet denote the minimum of .The smaller that is, the more confidence we have in theestimation results.
We propose a noise-variance-based measure to quan-tify the confidence level on the estimation result. Define
, where
(21)
is the normalized variance reciprocal vector. Our confidencemeasure is defined as
(22)
where is the entropy of the vector. From the above analysis, when is much smaller than
any other (or equivalently, is much larger thanthe reciprocals of all other ), the vector has a smallerentropy , and we have more confidence in the classifica-tion and estimation results.
VI. SIMULATION RESULTS
In our simulations, we have two sets of test images. For imageset 1, we collect seven benchmark images that are widely used inimage processing and analysis: Lena, Baboon, Barbara, Couple,Man, Boat, and Tank. We test over five different categories ofimage encoders as shown in the leaf nodes in Fig. 2, and withinevery category, we have used different sets of parameters tocompress the images, resulting in a database of 427 images. Forthe DCT, we consider the most common block transform thatuses a block size of 8-by-8, 16-by-16, and 4-by-4 and we usebaseline JPEG with a quality factor of 60, 70, and 80 to quan-tize the DCT coefficients. For DWT-based transforms, we con-
Authorized licensed use limited to: University of Maryland College Park. Downloaded on August 21, 2009 at 00:14 from IEEE Xplore. Restrictions apply.

LIN et al.: DIGITAL IMAGE SOURCE CODER FORENSICS VIA INTRINSIC FINGERPRINTS 473
Fig. 18. Performance of the image source coding forensic detector.
TABLE ICONFUSION MATRIX WHEN PSNR � �� dB.
sider the three widely adopted wavelet transforms, 5/3, 9/7, and17/11, as an example in our simulations, and we use the stan-dard five-level multiresolution decomposition. SPIHT is usedfor quantization with a bit rate of 0.8 and 0.9 bits per pixel.For DPCM, we set the set of filter length as [10, 15, 20]. ForH.264 intraprediction, we use either 16 16 macroblocks or4 4 blocks. For subband coding, we use the filters as in [41].Image set 2 contains 20 raw images taken from two digital cam-eras (Canon and Olympus) and then sent through the compres-sion and decompression process.
The PSNR of the compressed images varies from 20 to 40 dB.Fig. 18(a) illustrates the probability that our forensic detectoroutputs the correct category of source encoder (DCT based,DWT based, DCT subband, DPCM subband, DPCM and H.264)of the two image sets. The results of both image sets are sim-ilar; both show that our method works quite well with accuracyover 90% when PSNR is less then 36 dB. Not surprisingly, theresult degrades when PSNR increases. With a higher PSNR, thedifference between the compressed image and the original oneis smaller, and therefore, the trace of the source coding schemesis more difficult to detect. Thus, it is more challenging to deter-mine what kind of source encoder has been applied to the testimage with a higher PSNR. Fig. 18(b) shows the correspondingconfidence measure of the image source coding forensic de-
tector for the two image sets. Though the performance degrades18% at high PSNR (PSNR dB), the system also outputs asmaller confidence measure and indicates to the forensic analystthat there might be errors.
Our forensic detector provides very accurate detection (over90% detection rate) when the PSNR is less than 36 dB. We alsoprovide indicating confidence measure over all PSNR range togive the users of the forensic detector the level of correctness.When the detection rate of the system is lower than 85%, theconfidence measure is less than 0.65 (when PSNR dB)which reflects the uncertainty of the system. Such results showour image source coding detector is a reliable forensic tool overa wide range of PSNR.
Table I shows the confusion matrix between the four sourceencoders when PSNR dB within image set 1. Here, theDCT-subband method and the DPCM-subband method are sep-arated in the subband coding category to show the trend; H.264and traditional DPCM are combined together to simplify theanalysis. Each row represents the true source coding schemethat was used to generate the test image, and each column repre-sents the encoder that our image source coding forensic engineoutputs. The forensic engine will output N/A if no candidateimage encoders can pass the verification process as in Fig. 16.From Table I, the largest estimation error for every source en-
Authorized licensed use limited to: University of Maryland College Park. Downloaded on August 21, 2009 at 00:14 from IEEE Xplore. Restrictions apply.

474 IEEE TRANSACTIONS ON INFORMATION FORENSICS AND SECURITY, VOL. 4, NO. 3, SEPTEMBER 2009
coder occurs when outputting N/A. That is, the intrinsic finger-print has low energy in high image quality as PSNR dB.Thus, the forensic engine cannot identify the source encoders.The intrinsic fingerprint we find for each source encoder is dis-tinguishing enough that even when the fingerprint energy is low,the image source encoder forensic detector still does not confusedifferent encoders within the system.
Another big estimation error occurs when identifying a DWT-compressed image as a subband-encoded image or when mis-classifying the two subcategories in the subband encoder family.A DWT-based encoder has a similar encoding structure to a sub-band coder, and therefore, we can also observe ringing effects insome DWT-compressed images. The DCT-subband method andDPCM-subband method also share the ringing effect as the mostsignificant fingerprint, where the fingerprint of DCT or DPCMhas lower significance and causes misclassification.
VII. CONCLUSION
In this paper, we have proposed a forensic methodology viaintrinsic fingerprints to identify the compression method ap-plied, if any, to a digital image, along with estimation of allparameters and a confidence measure of the estimated codingscheme. Our forensic detector does not need any informationother than the decoded image at the receiver because we inves-tigate and probe the unique intrinsic fingerprint of image sourceencoder embedded in the received image.
By using the intrinsic fingerprint of each source encoder, ourimage source coding forensic detector via intrinsic fingerprintcan choose the correct image encoder among transform-basedencoders, subband encoders, and DPCM encoders with proba-bility higher than 90% when PSNR dB. Even with PSNRof 40 dB, the probability of correct estimation is still 80%. Inthe future, as mentioned in Section IV-A, our system can be ap-plied to JPEG 2000, KL-transform based encoders, and otherlossy image source encoders.
In our future work, we plan to investigate multiple imagesource coding forensics. Since many digital cameras in themarket do not provide raw sensor output, and since most digitalimages are compressed before any possible tampering, de-tecting how many times the images have been compressed andwhat the source encoders are will provide valuable informationon identifying the datapath that the image has gone through, forinstance, the order of compression steps performed previously.
REFERENCES
[1] G. Friedman, “The trustworthy digital camera: Restoring credibility tothe photographic images,” IEEE Trans. Consumer Electron., vol. 39,no. 4, pp. 905–910, Nov. 1993.
[2] K. J. R. Liu, W. Trappe, Z. J. Wang, M. Wu, and H. Zhao, Multi-media Fingerprinting Forensics for Traitor Tracing. New York: Hin-dawi Pub. Corp., 2005, EURASIP Book Series on Signal Processingand Communications.
[3] H. Farid, Digital image ballistics from JPEG quantization Tech. Rep..[4] S. Minami and A. Zakhor, “An optimization approach for removing
blocking effects in transform coding,” IEEE Trans. Circuits Syst. VideoTechnol., vol. 5, no. 2, pp. 74–82, Apr. 1995.
[5] K. T. Tan and M. Ghanbari, “Blockiness detection for MPEG2-codedvideo,” IEEE Signal Process. Lett., vol. 7, no. 8, pp. 213–215, Aug.2000.
[6] S. Liu and A. C. Bovik, “Efficient DCT-domain blind measurementand reduction of blocking artifacts,” IEEE Trans. Circuits Syst. VideoTechnol., vol. 12, no. 12, pp. 1139–1149, Dec. 2002.
[7] W. Gao, C. Mermer, and Y. Kim, “A de-blocking algorithm and ablockiness metric for highly compressed images,” IEEE Trans. CircuitsSyst. Video Technol., vol. 12, no. 12, pp. 1150–1159, Dec. 2002.
[8] A. C. Popescu and H. Farid, “Exposing digital forgeries by detectingtraces of resampling,” IEEE Trans. Signal Process., vol. 53, no. 2, pt.2, pp. 758–767, Feb. 2005.
[9] A. C. Popescu and H. Farid, “Statistical tools for digital forensics,” inInt. Workshop Information Hiding, Toronto, Canada, 2004.
[10] J. Fridrich, D. Soukal, and J. Lukas, “Detection of copy-move forgeryin digital images,” in Proc. Digital Forensics Research Workshop,Columbus, OH, Aug. 2003.
[11] Z. Fan and R. L. de Queiroz, “Identification of bitmap compressionhistory: Jpeg detection and quantizer estimation,” IEEE Trans. ImageProcess., vol. 12, no. 2, pp. 230–235, Feb. 2003.
[12] J. Lukas and J. Fridrich, “Estimation of primary quantization matrix indouble compressed JPEG images,” in Proc. Digital Forensics ResearchWorkshop (DFRWS 2003), Cleveland, OH, Aug. 2003.
[13] T.-T. Ng, S.-F. Chang, and Q. Sun, “Blind detection of photomontageusing higher order statistics,” in IEEE Int. Symp. Circuits and Systems(ISCAS), Vancouver, Canada, May 2004.
[14] H. Farid, “Blind inverse gamma correction,” IEEE Trans. ImageProcess,, vol. 10, no. 10, pp. 1428–1433, Oct. 2001.
[15] H. Farid and A. Popescu, “Blind removal of image non-linearities,” inProc. IEEE Int. Conf. Computer Vision, Jul. 2001, vol. 1, pp. 76–81.
[16] M. K. Johnson and H. Farid, “Exposing digital forgeries in complexlighting environments,” IEEE Trans. Inf. Forensics Security, vol. 2, no.3, pp. 450–461, Jun. 2007.
[17] Y.-F. Hsu and S.-F. Chang, “Detecting image splicing using geometryinvariants and camera characteristics consistency,” in IEEE Int. Conf.Multimedia and Expo (ICME), Toronto, Canada, Jul. 2006.
[18] H. Farid and S. Lyu, “Higher-order wavelet statistics and their appli-cation to digital forensics,” in IEEE Workshop Statistical Analysis inComputer Vision, Feb. 2003, p. 94.
[19] T.-T. Ng, S.-F. Chang, and Q. Sun, “Blind identification of photomon-tage using higher order statistics,” in IEEE Int. Symp. Circuits and Sys-tems, Vancouver, Canada, May 2004.
[20] Z. J. Geradts, J. Bijhold, M. Kieft, K. Kurosawa, K. Kuroki, and N.Saitoh, “Methods for identification of images acquired with digitalcameras,” Proc. SPIE, Enabling Technologies for Law Enforcementand Security, vol. 4232, pp. 505–512, Feb. 2001.
[21] K. Kurosawa, K. Kuroki, and N. Saitoh, “Ccd fingerprint method– Identification of a video camera from videotaped images,” inProc. IEEE Int. Conf. Image Processing, Oct. 1999, vol. 3, pp.537–540.
[22] M. Kharrazi, H. T. Sencar, and N. Memon, “Blind source camera iden-tification,” in Proc. IEEE Int. Conf. Image Processing, Oct. 2004, vol.1, pp. 709–712.
[23] S. Bayram, H. T. Sencar, N. Memon, and I. Avcibas, “Source cameraidentification based on cfa interpolation,” in Proc. IEEE Int. Conf.Image Processing, Sep. 2005, vol. 3, pp. 69–72.
[24] A. Swaminathan, M. Wu, and K. J. R. Liu, “Non-intrusive compo-nent forensics of visual sensors using output images,” IEEE Trans. Inf.Forensics Security, vol. 2, no. 1, pp. 91–106, Mar. 2007.
[25] Scientific Working Group on Imaging Technology (SWGIT) Interna-tional Association for Identification, 2006 [Online]. Available: http://www.theiai.org/guidelines/swgit/index.php
[26] R. Veldhuis and M. Breeuwer, An Introduction to Source Coding.Englewood Cliffs, NJ: Prentice-Hall, 1993.
[27] J. Woods and S. O’Neil, “Subband coding of images,” IEEE Trans.Acoust., Speech, Signal Process., vol. 34, no. 5, pp. 1278–1288, Oct.1986.
[28] I. E. Richardson, H.264 and MPEG-4. New York: Wiley, 2003.[29] J. D. Wise, J. R. Caprio, and T. W. Parks, “Maximum likelihood pitch
estimation,” IEEE Trans. ASSP, vol. ASSP-24, no. 5, pp. 418–423, Oct.1976.
[30] Z. Xiong, O. G. Guleryuz, and M. T. Orchard, “A DCT-based em-bedded image coder,” IEEE Signal Process. Lett., vol. 3, no. 11, pp.289–290, Nov. 1996.
[31] Z. Fan and R. L. de Queiroz, “Identification of bitmap compressionhistory: JPEG detection and quantizer estimation,” IEEE Trans. ImageProcess., vol. 12, no. 2, pp. 230–235, Feb. 2003.
[32] E. Y. Lam and J. W. Goodman, “A mathematical analysis of the DCTcoefficients distributions for images,” IEEE Trans. Image Process., vol.9, no. 10, pp. 1661–1666, Oct. 2000.
[33] S. G. Mallat, “A theory for multiresolution signal decomposition: Thewavelet representation,” IEEE Trans. Pattern Anal. Mach. Intell., vol.11, no. 7, pp. 674–693, Jul. 1989.
Authorized licensed use limited to: University of Maryland College Park. Downloaded on August 21, 2009 at 00:14 from IEEE Xplore. Restrictions apply.

LIN et al.: DIGITAL IMAGE SOURCE CODER FORENSICS VIA INTRINSIC FINGERPRINTS 475
[34] F. Muller, “Distribution shape of two-dimensional DCT coefficients ofnatural images,” Electron. Lett., vol. 29, pp. 1935–1936, Oct. 1993.
[35] S. G. Nash and A. Sofer, Linear and Nonlinear Programming. NewYork: McGraw-Hill, 1996.
[36] S. Yang, Y.-H. Hu, T. Nguyen, and D. Tull, “Maximum-likelihood pa-rameter estimation for image ringing-artifact removal,” IEEE CircuitsSyst. Video Technol., vol. 11, no. 8, pp. 963–973, Aug. 2001.
[37] W. B. Pennebaker and J. L. Mitchell, JPEG Still Image Data Compres-sion Standard. New York: Van Nostrand, 1993.
[38] M. K. Mihcak, I. Kozintsev, K. Ramchandran, and P. Moulin, “Low-complexity image denoising based on statistical modeling of waveletcoefficients,” IEEE Signal Process. Lett., vol. 6, no. 12, pp. 300–303,Dec. 1999.
[39] R. Samadani, Characterizing and Estimating Block DCT Image Com-pression Quantization Parameters Imaging Systems Laboratory, HPLaboratories, Palo Alto, Tech. Rep. HPL-2005–190, 2005.
[40] C. Hass, Impulseadventure – JPEG Quality and Quantization Tablesfor Digital Cameras, Photoshop 2008 [Online]. Available: http://www.impulseadventure.com/photo/jpeg-quantization.html
[41] J. W. Woods, Subband Image Coding. Norwell, MA: Kluwer, 1991.
W. Sabrina Lin (M’06) received the B.S. and M.S.degrees in electrical engineering from NationalTaiwan University in 2002 and 2004, respectively.She is currently pursuing the Ph.D. degree with theElectrical and Computer Engineering Department,University of Maryland, College Park.
Her research interests are in the area of informationsecurity and forensics, multimedia signal processing,and multimedia social network analysis. She receivedthe University of Maryland Future Faculty Fellow-ship in 2007.
Steven K. Tjoa received the B.S. degree in computerengineering in 2004 and the M.S. degree in electricalengineering in 2006 from the University of Mary-land, College Park, where he is currently pursuing thePh.D. degree in electrical engineering.
Since 2005, he has been a graduate researchassistant with the Signals and Information Group atthe University of Maryland. His research interestsinclude multimedia signal processing, digital imageforensics, and music information retrieval.
Mr. Tjoa earned awards from the University ofMaryland including a Presidential Scholarship in 2000, the George CorcoranMemorial Award from the Department of Electrical and Computer Engineeringin 2007, a Graduate School Fellowship in 2008, and a Future Faculty Fellow-ship from the Clark School of Engineering in 2008.
H. Vicky Zhao (S’01–M’04) received the B.S. andM.S. degrees from Tsinghua University, China, in1997 and 1999, respectively, and the Ph.D. degreefrom University of Maryland, College Park, in 2004,all in electrical engineering.
She was a Research Associate with the Depart-ment of Electrical and Computer Engineering andthe Institute for Systems Research, University ofMaryland, College Park, from January 2005 to July2006. Since August 2006, she has been an AssistantProfessor with the Department of Electrical and
Computer Engineering, University of Alberta, Edmonton, AB, Canada. Herresearch interests include information security and forensics, multimedia,digital communications, and signal processing.
Dr. Zhao received the IEEE Signal Processing Society (SPS) 2008 YoungAuthor Best Paper Award. She coauthored the book Multimedia FingerprintingForensics for Traitor Tracing (Hindawi, 2005). She has been the Associate Ed-itor for IEEE SIGNAL PROCESSING LETTERS since November 2008.
K. J. Ray Liu (S’86–M’90–SM’93–F’03) is aDistinguished Scholar-Teacher of the Universityof Maryland, College Park. He is Associate Chairof Graduate Studies and Research of the Electricaland Computer Engineering Department and leadsthe Maryland Signals and Information Group con-ducting research encompassing broad aspects ofinformation technology including communicationsand networking, information forensics and security,multimedia signal processing, and biomedicaltechnology. He was Vice President – Publications
and will serve as President-Elect in 2010. He was the Editor-in-Chief of IEEESignal Processing Magazine and the founding Editor-in-Chief of EURASIPJournal on Applied Signal Processing. His recent books include CooperativeCommunications and Networking (Cambridge Univ. Press, 2008); ResourceAllocation for Wireless Networks: Basics, Techniques, and Applications(Cambridge Univ. Press, 2008); Ultra-Wideband Communication Systems: TheMultiband OFDM Approach (IEEE-Wiley, 2007); Network-Aware Security forGroup Communications (Springer, 2007); Multimedia Fingerprinting Forensicsfor Traitor Tracing (Hindawi, 2005); and Handbook on Array Processing andSensor Networks (IEEE-Wiley, 2009).
Dr. Liu is the recipient of numerous honors and awards including best paperawards from IEEE Signal Processing Society, IEEE Vehicular Technology So-ciety, and EURASIP; IEEE Signal Processing Society Distinguished Lecturer,EURASIP Meritorious Service Award, and National Science Foundation YoungInvestigator Award. He also received various teaching and research recogni-tions from the University of Maryland including a university-level Inventionof the Year Award; and Poole and Kent Senior Faculty Teaching Award andOutstanding Faculty Research Award, both from A. James Clark School of En-gineering Faculty. He is a Fellow of AAAS.
Authorized licensed use limited to: University of Maryland College Park. Downloaded on August 21, 2009 at 00:14 from IEEE Xplore. Restrictions apply.