5-1 observing clima - remo sensing -...
TRANSCRIPT

Climate and Global Change Notes
5-1
Observing Climate - Remote SensingRemote Sensing Observations
Fundamental Principle
Satellite Remote Sensing ComponentsTypes of Sensing
Passive SensingActive Sensing
Fundamental PropertiesRadiometric ResolutionSpectral ResolutionSpatial Resolution
Science Concepts
Definition
Climate and Global Change Notes
5-2
Observing Climate - Remote Sensing
View NOVA Mayan Movie
Climate and Global Change Notes
5-3
Observing Climate - Remote SensingDefinition
Science and art of obtaining information about an object, area orphenomenon through an analysis of data acquired by a device that is not indirect contact with the area, object or phenomenon under investigation
Lillesand, Thomas M., and Ralph W. Kiefer, 1979, Remote Sensing and Image Interpretation, JohnWiley and Sons, Inc., p. 1
What are some common examples of remote sensors?

Climate and Global Change Notes
5-4
Observing Climate - Remote SensingHistory• Telescope invented by
spectical-maker HansLippershey (c1570-c1619) ofHolland
• Galileo introduced the telescopeto astronomy in 1609
- Limited magnification -up to 30 times - and anarrow field of view
- First to see the craters of the moon,discover sunspots, the four large moons of Jupiter, andthe rings of Saturn
Galileo
http://www-groups.dcs.st-and.ac.uk/
~history/Posters2/Galileo.html

Climate and Global Change Notes
5-5
Observing Climate - Remote SensingHistory (Con’t)• 1858 — First aerial (balloon)
photographer Gaspard Felix Tournachon, also known as Nadar; picture of Paris
• 1903 — The Bavarian Pigeon Corps
http://latteier.com/pigeoncam/
http://latteier.com/pigeoncam/
http://latteier.com/pigeoncam/
San Francisco from a kite, 1906
http://www.skyeyephotography.
com/history.htm
Climate and Global Change Notes
5-6
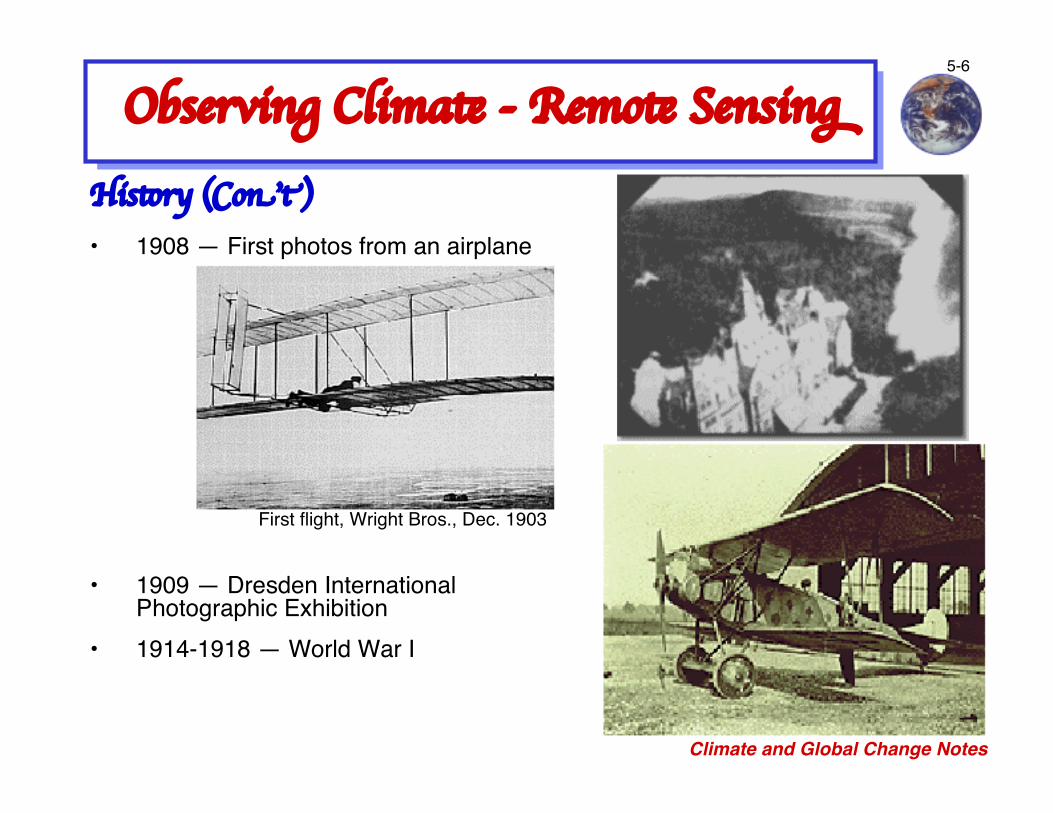
Observing Climate - Remote SensingHistory (Con’t)• 1908 — First photos from an airplane
First flight, Wright Bros., Dec. 1903
• 1909 — Dresden International Photographic Exhibition
• 1914-1918 — World War I

Climate and Global Change Notes
5-7
Observing Climate - Remote SensingHistory (Con’t)• Today — Many platforms
- Ground based
- Aircraft
- Space shuttle
- Satellite
Climate and Global Change Notes
5-8
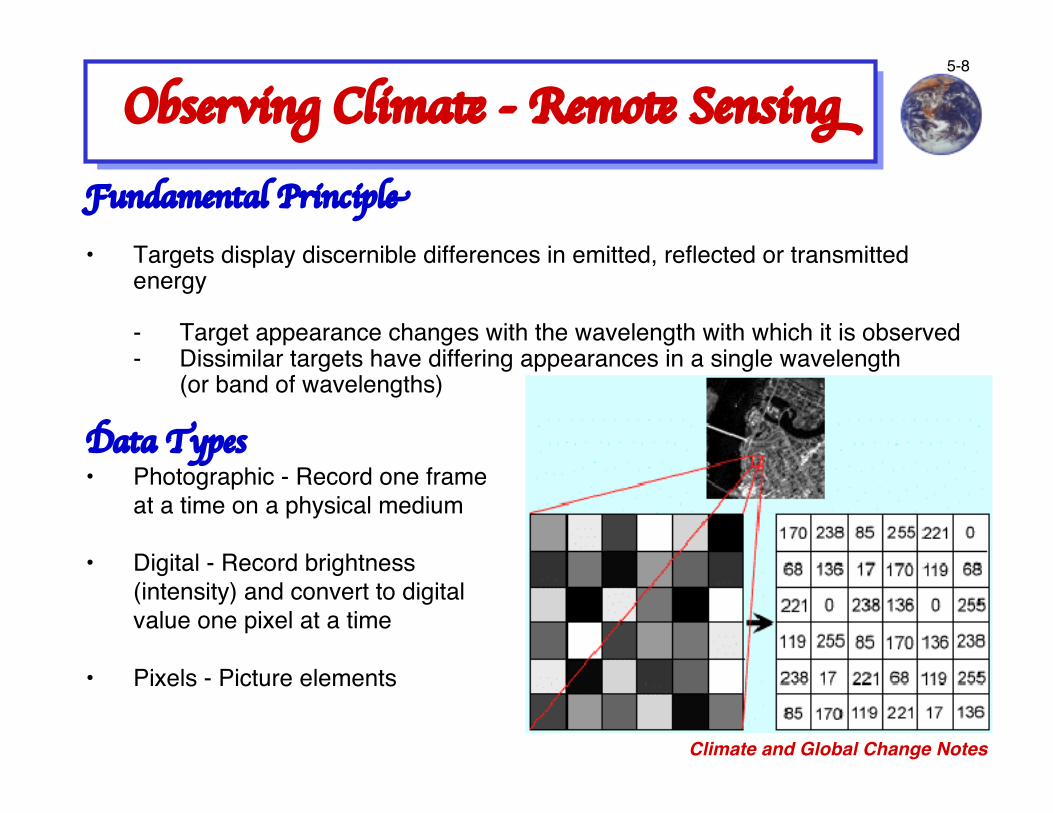
Observing Climate - Remote SensingFundamental Principle• Targets display discernible differences in emitted, reflected or transmitted
energy
- Target appearance changes with the wavelength with which it is observed- Dissimilar targets have differing appearances in a single wavelength
(or band of wavelengths)
Data Types• Photographic - Record one frame
at a time on a physical medium
• Digital - Record brightness(intensity) and convert to digitalvalue one pixel at a time
• Pixels - Picture elements
Climate and Global Change Notes
5-9
Observing Climate - Remote SensingSatellite Remote Sensing Components• Source of illumination
• Atmosphere
• Target
• Sensing system
• Data processing and analysis system
• Output product
Two Types of Sensing Systems• Passive
• Active

Climate and Global Change Notes
5-10
Observing Climate - Remote SensingPassive Sensing• Satellite measures energy that is reflected, emitted or transmitted (i.e., not
absorbed or reflected) from the object, i.e., after the radiation has interactedwith the object- Human eye- Camera- Radiometer
• Passive scanning geometrymeasuring Earthʼs emittedradiation
• Passive scanning geometry measuring Earthʼsreflected solar radiation
Sensor ImageOutput
Processing & Analysis
Source of Illuminationand Target
Scattered Transmitted
AtmosphereAbsorbed
Source of Illumination
Sensor
Target

Climate and Global Change Notes
5-11
Observing Climate - Remote SensingPassive Sensing (Con’t)• Passive limb scanning geometry measuring atmosphereʼs transmitted (not
absorbed or reflected solar radiation
Sun
Atmosphere
Target
Source of Illumination Sensing System

Climate and Global Change Notes
5-12
Observing Climate - Remote SensingActive Sensing• Satellite emits energy and then measures return energy after the radiation
has interacted with the Earthʼs surface or atmosphere.
- Radar- Sonar- Laser
Sensor
ImageOutput
Processing & AnalysisTarget
Reflected Energy
AtmosphereTransmitted
Energy

Climate and Global Change Notes
5-13
Observing Climate - Remote SensingFour Fundamental Properties For Design• Image depends on the wavelength response of the sensing instrument
(radiometric and spectral resolution) and the emission or reflection spectra of the target (the signal).
- Radiometric resolution
- Spectral resolution
• Image depends on the size of objects (spatial resolution) that can be discerned
- Spatial resolution
• Knowledge of the changes in the target depends on how often (temporal resolution) the target is observed
- Temporal resolution

Climate and Global Change Notes
5-14
Observing Climate - Remote SensingRadiometric Resolution• Number of shades or
brightness levels at agiven wavelength
• Smallest change inintensity level that canbe detected by thesensing system
Climate and Global Change Notes
5-15
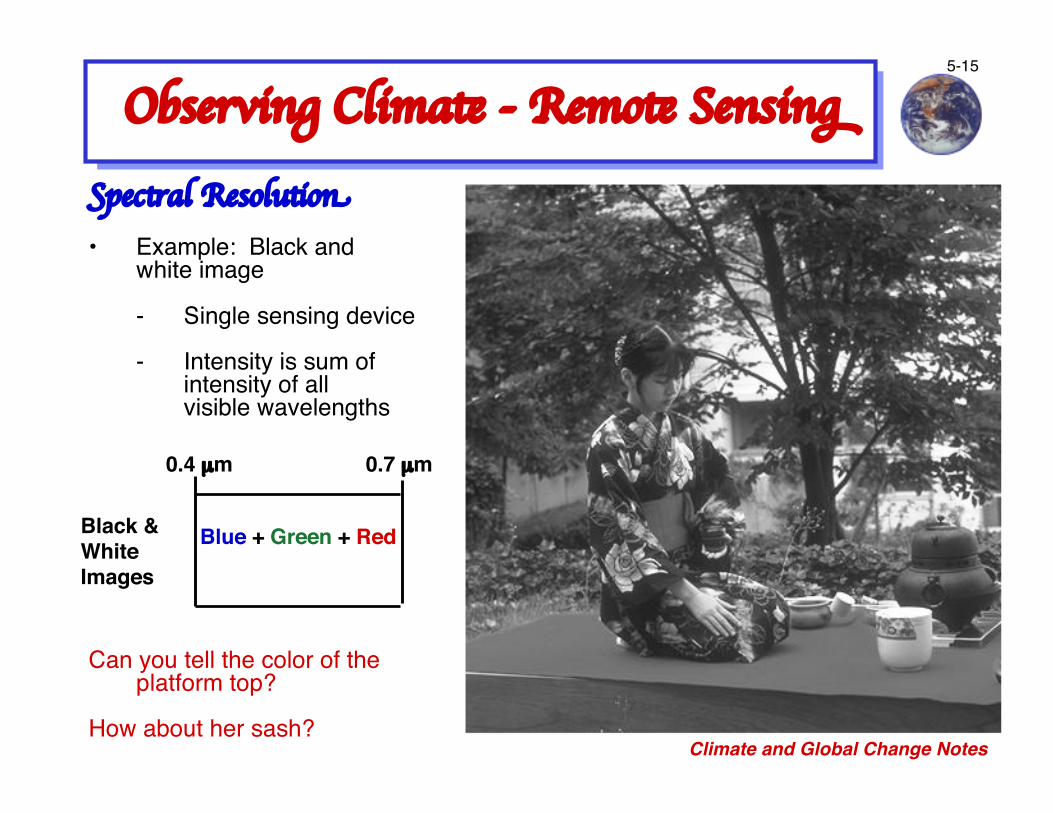
Spectral Resolution• Example: Black and
white image
- Single sensing device
- Intensity is sum of intensity of all visible wavelengths
Can you tell the color of the platform top?
How about her sash?
Observing Climate - Remote Sensing
0.4 µm 0.7 µm
Black & White Images
Blue + Green + Red
Climate and Global Change Notes
5-16
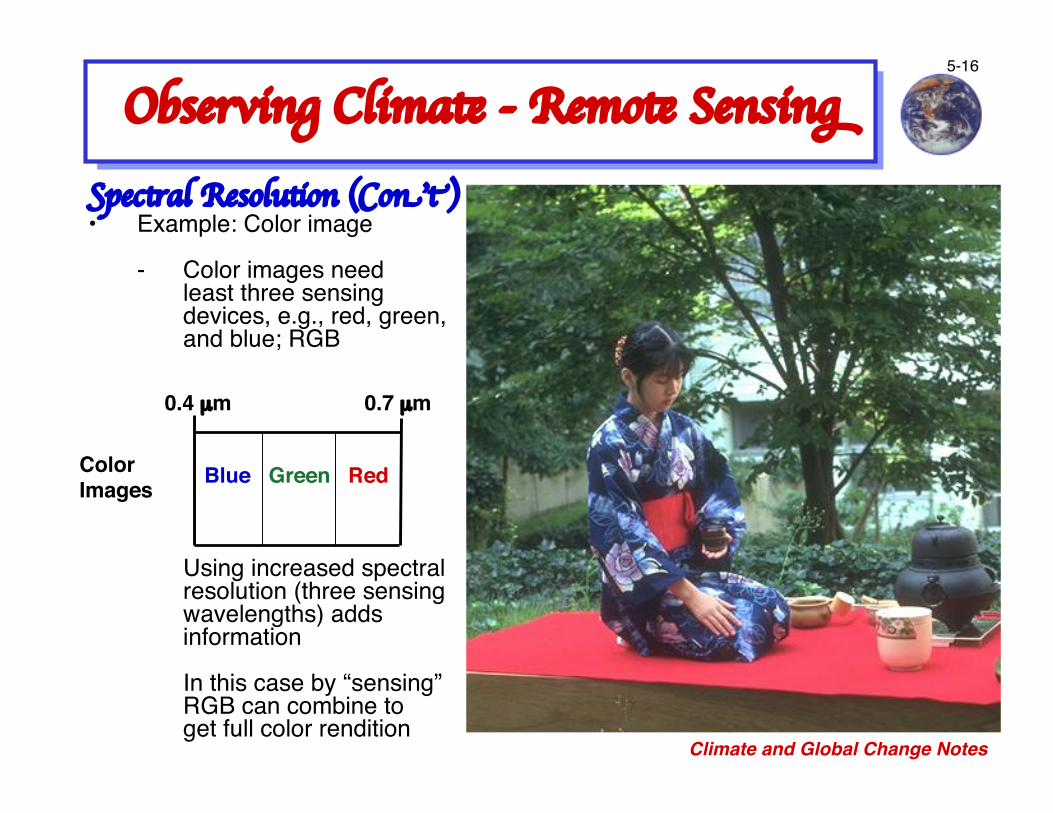
Observing Climate - Remote SensingSpectral Resolution (Con’t)• Example: Color image
- Color images need least three sensing devices, e.g., red, green, and blue; RGB
Using increased spectral resolution (three sensingwavelengths) adds information
In this case by “sensing” RGB can combine toget full color rendition
0.4 µm 0.7 µm
Color Images Blue Green Red

Climate and Global Change Notes
5-17
Observing Climate - Remote SensingSpectral Resolution (Con’t)• Example
- What do you believe the image would look like if you used a blue only sensitive film?
- What do you believe the image would look like if you used a green only sensitive film?
- What do you believe the image would look like if you used a red only sensitive film?

Climate and Global Change Notes
5-18
Observing Climate - Remote SensingSpectral Resolution (Con’t)• Example (Conʼt)
- Blue only sensitive film
- Green only sensitive film
- Red only sensitive film

Climate and Global Change Notes
5-19
Observing Climate - Remote SensingSpectral Resolution (Con’t)• Example (Conʼt)
- What do you believe the image would look like if you used a thermal infrared sensitive film?
Blinded in the darkness, he extended his arms, felt around for obstacles, bothto avoid and to hide behind. The men wearing infrared monocular night-visionunits, the lenses strapped against their eyes by means of a head harness andhelmet mount, were doubtless also carrying handguns. The others had riflesfitted with advanced infrared weapon sights. Both allowed the user to see intotal darkness by detecting the differentials in thermal patterns given off byanimate and inanimate objects.
Ludlum, Robert, 2000: The Prometheus Deception, p. 96.

Climate and Global Change Notes
5-20
Observing Climate - Remote SensingSpectral Resolution (Con’t)• Example (Conʼt)
- What do you believe the image would look like if you used a thermal infrared sensitive film?
Climate and Global Change Notes
5-21
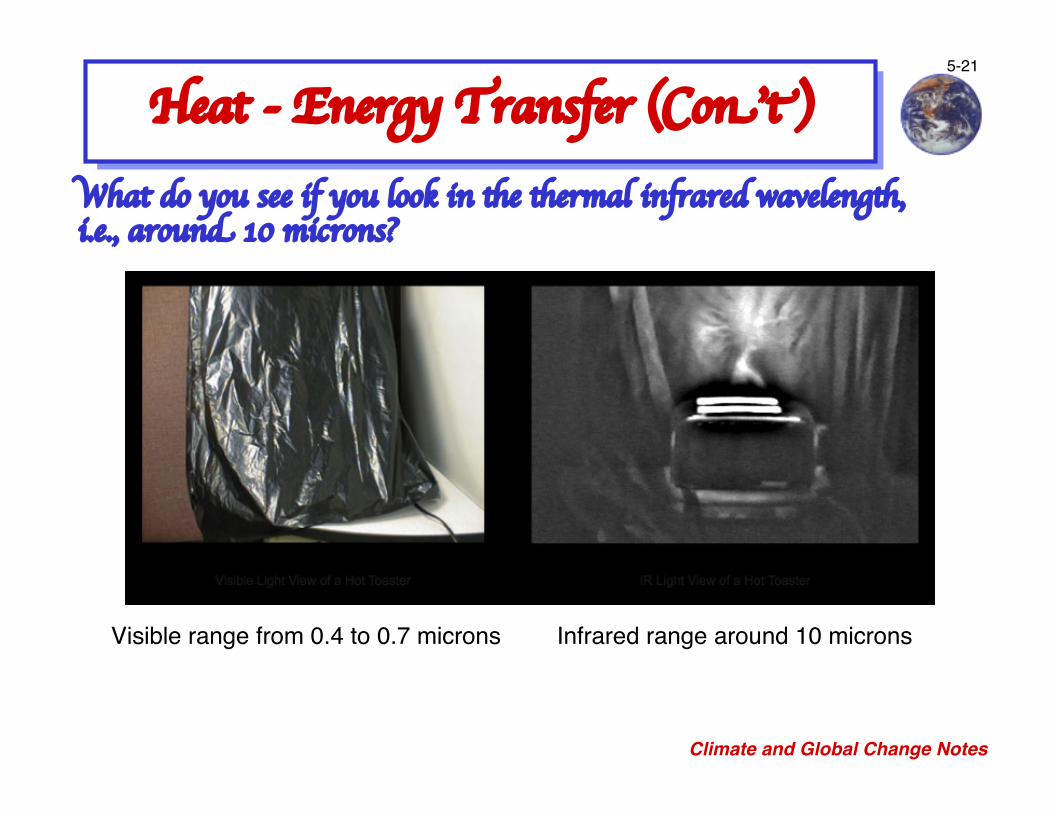
What do you see if you look in the thermal infrared wavelength,i.e., around 10 microns?
Visible range from 0.4 to 0.7 microns Infrared range around 10 microns
Heat - Energy Transfer (Con’t)

Climate and Global Change Notes
5-22
Observing Climate - Remote SensingSpectral Resolution (Con’t)• Example - Thermal infrared view
Note warmer objects are brighter

Climate and Global Change Notes
5-23
Observing Climate - Remote SensingSpectral Resolution (Con’t)• Example
- What do you believe the image would look like if you used near and middle infrared sensitive film?
http://observe.arc.nasa.gov/nasa/education/reference/reflect/ir.html
Near and middle infraredwavelengths, wavelengthsbetween the visible and thethermal infrared (~10 microns)
Climate and Global Change Notes
5-24
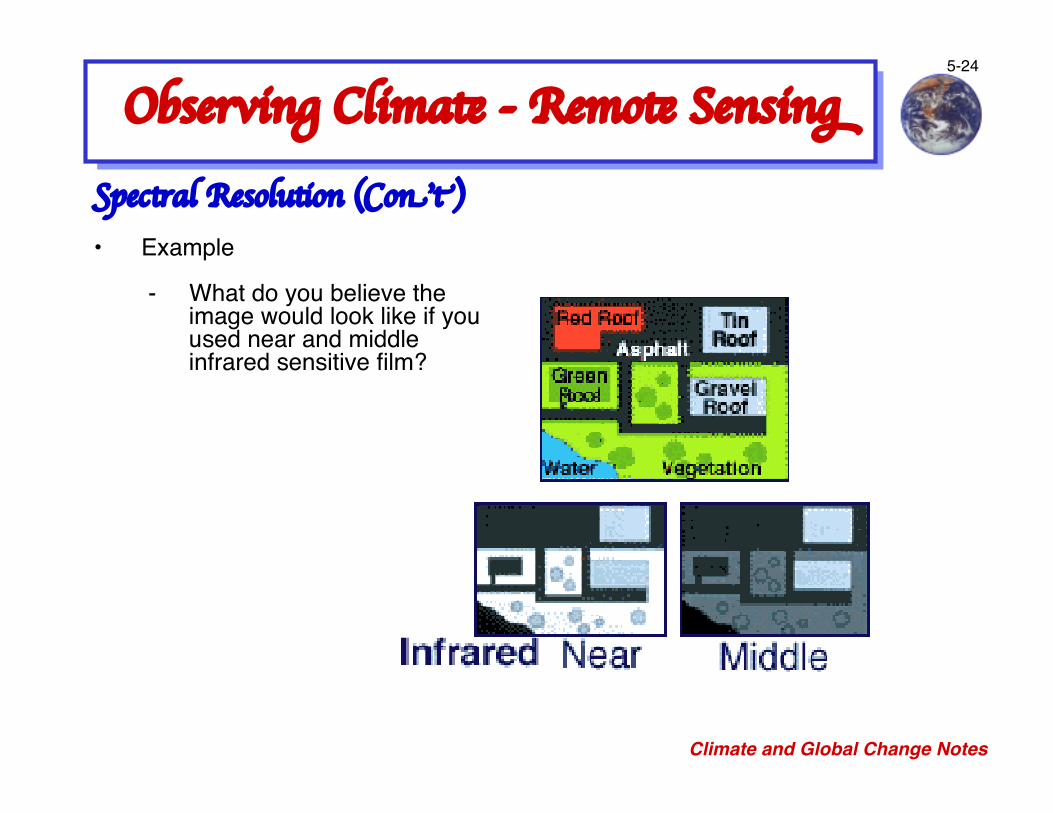
Observing Climate - Remote SensingSpectral Resolution (Con’t)• Example
- What do you believe the image would look like if you used near and middle infrared sensitive film?

Climate and Global Change Notes
5-25
Observing Climate - Remote SensingSpectral Resolution (Con’t)• Spectral response depends on target
• Leaves reflect green and near IR
• Water reflects at lower end of visible range

Climate and Global Change Notes
5-26
Observing Climate - Remote SensingSpectral Resolution (Con’t)• Example of sampling wavelengths
Climate and Global Change Notes
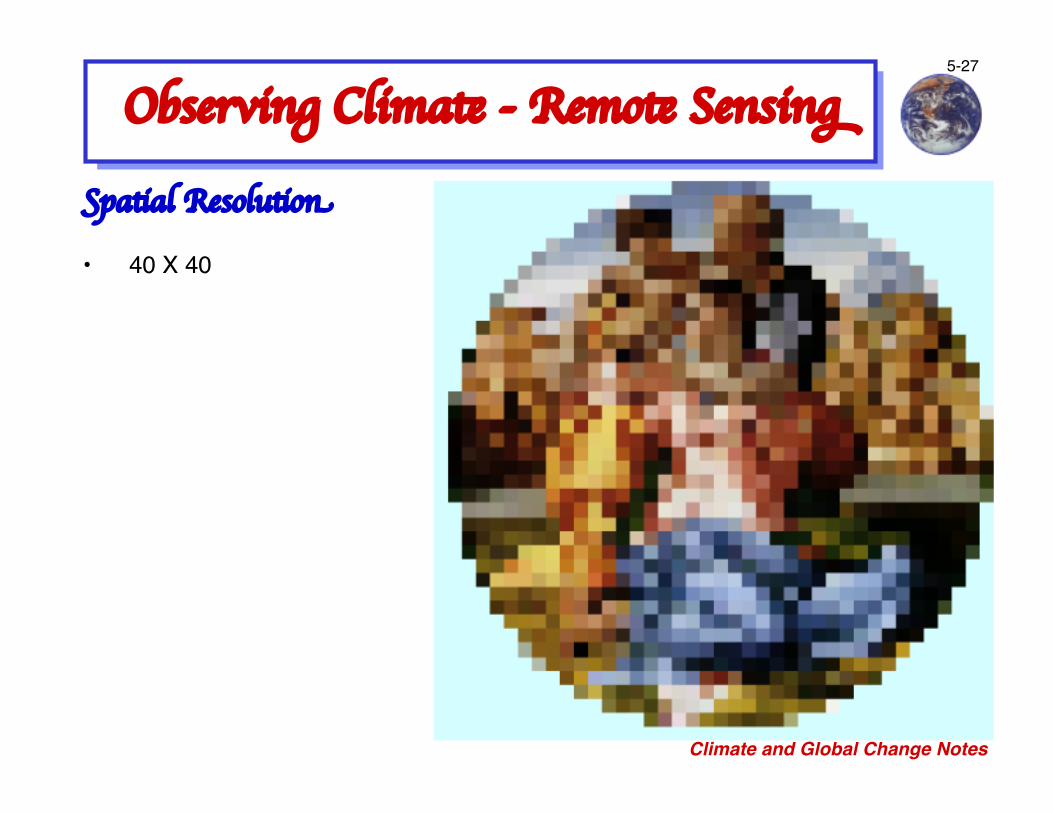
5-27
Observing Climate - Remote SensingSpatial Resolution • 40 X 40
Climate and Global Change Notes
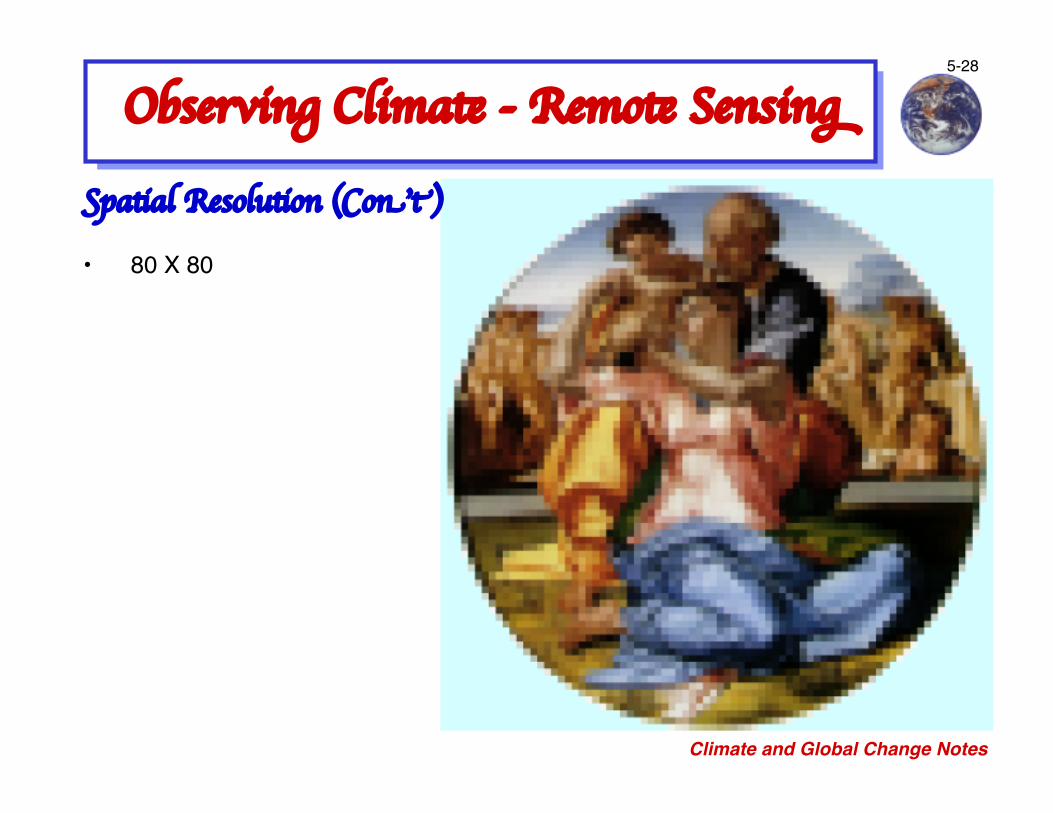
5-28
Observing Climate - Remote SensingSpatial Resolution (Con’t)• 80 X 80

Climate and Global Change Notes
5-29
Observing Climate - Remote SensingSpatial Resolution (Con’t)• 320 X 320
Image depends both onspatial resolution and on radiometric resolution of the optical instrument

Climate and Global Change Notes
5-30
Observing Climate - Remote SensingSpatial Resolution (Con’t)• GOES sounder – temporal resolution every hour; spatial resolution (10 km)
• MODIS instrument on the polar orbiting platforms - up to four passes a day,two daytime and two nighttime; spatial resolution (1 km)
AQUA MODIS 24 JAN 2004 GOES LST 2 AM CST

Climate and Global Change Notes
5-31
Observing Climate - Remote SensingSpatial Resolution (Con’t)• In addition, MODIS observes 36 separate frequencies of radiation, ranging
from visible to infrared. GOES detects only five frequencies.
http://science.nasa.gov/headlines/y2004/09jan_sport.htm