5 environmental and social baseline - erm · 5 environmental and social baseline ... for the...
TRANSCRIPT

ENVIRONMENTAL RESOURCES MANAGEMENT CCGT POWER PLANT, SALDANHA
5-1
5 ENVIRONMENTAL AND SOCIAL BASELINE
The objective of the environmental and social baseline is to establish the characteristics of the existing biophysical and socio-economic conditions in the project’s Areas of Influence (AoI). The baseline serves as the reference point against which changes can be predicted and monitored. This Chapter presents the baseline conditions in the project’s AoI. The baseline was determined through review of existing information and observations and interviews conducted during the site visit.
5.1 AREA OF INFLUENCE (AOI)
For the purposes of this impact assessment, the AoI encompasses (IFC, 2012): • ‘The area likely to be affected by: (i) the project and the client’s activities and
facilities that are directly owned, operated or managed (including by contractors) and that are a component of the project; (ii) impacts from unplanned but predictable developments caused by the project that may occur later or at a different location; or (iii) indirect project impacts on biodiversity or on ecosystem services upon which Affected Communities’ livelihoods are dependent.
• Associated facilities are facilities that would not have been constructed or
expanded if the project did not exist and without which the project would not be viable.
• Cumulative impacts that result from the incremental impact, on areas or resources
used or directly impacted by the project, from other existing, planned or reasonably defined developments at the time the risks and impacts identification process is conducted.’
For the project, the direct AoI is the spatial extent of the project footprint and related facilities as well as on the associated effects on the receiving environment. This encompasses: • The 45 ha CCGT Power Plant site; • Approximately 5 km pipeline route; • Approximately 25 km transmission line. The indirect AoI encompasses areas potentially affected by cumulative impacts as well as areas that could be impacted indirectly by Project activities. The indirect AoI will differ between various resources and receptors depending on the dependencies. For example, indirect impacts to soils would be likely limited to the immediate areas around the direct footprint. Indirect impact to social resources may however extend to nearby towns and cities. The direct and indirect AoI will be determined during the EIA process.
ENVIRONMENTAL RESOURCES MANAGEMENT CCGT POWER PLANT, SALDANHA
5-2
5.2 TERRESTRIAL ENVIRONMENT
5.2.1 Climatic Conditions
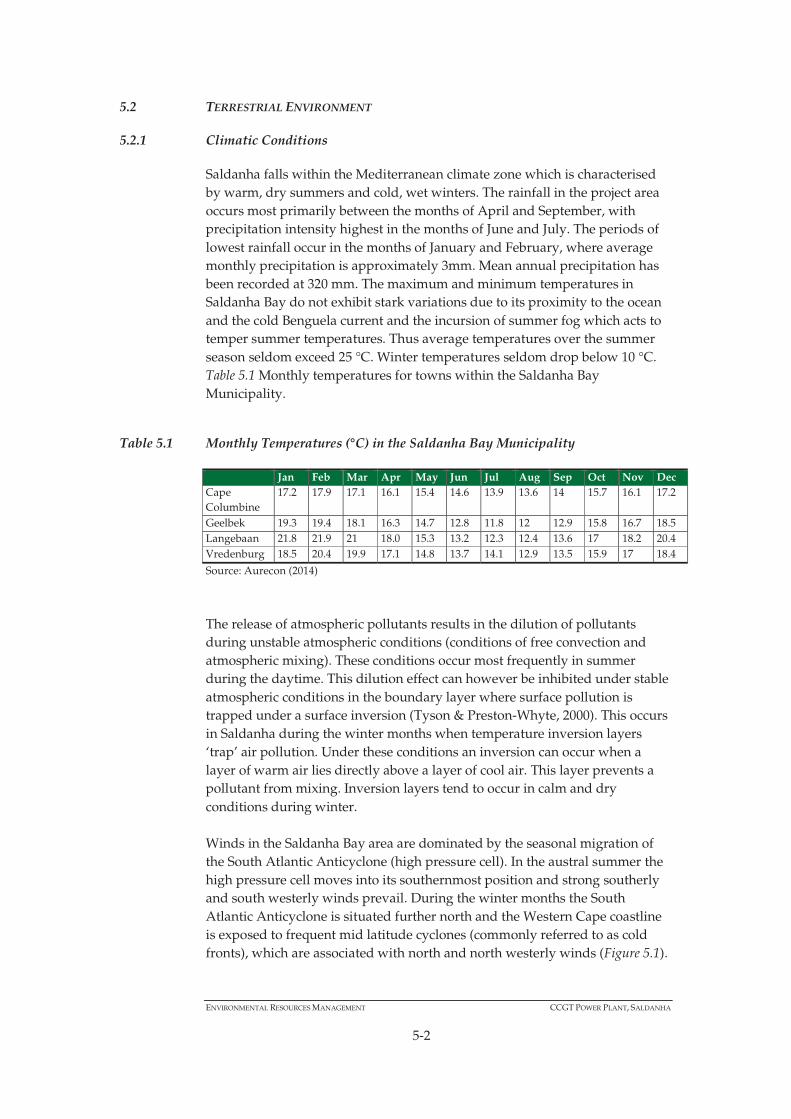
Saldanha falls within the Mediterranean climate zone which is characterised by warm, dry summers and cold, wet winters. The rainfall in the project area occurs most primarily between the months of April and September, with precipitation intensity highest in the months of June and July. The periods of lowest rainfall occur in the months of January and February, where average monthly precipitation is approximately 3mm. Mean annual precipitation has been recorded at 320 mm. The maximum and minimum temperatures in Saldanha Bay do not exhibit stark variations due to its proximity to the ocean and the cold Benguela current and the incursion of summer fog which acts to temper summer temperatures. Thus average temperatures over the summer season seldom exceed 25 °C. Winter temperatures seldom drop below 10 °C. Table 5.1 Monthly temperatures for towns within the Saldanha Bay Municipality.
Table 5.1 Monthly Temperatures (°C) in the Saldanha Bay Municipality
Jan Feb Mar Apr May Jun Jul Aug Sep Oct Nov Dec Cape Columbine
17.2 17.9 17.1 16.1 15.4 14.6 13.9 13.6 14 15.7 16.1 17.2
Geelbek 19.3 19.4 18.1 16.3 14.7 12.8 11.8 12 12.9 15.8 16.7 18.5 Langebaan 21.8 21.9 21 18.0 15.3 13.2 12.3 12.4 13.6 17 18.2 20.4 Vredenburg 18.5 20.4 19.9 17.1 14.8 13.7 14.1 12.9 13.5 15.9 17 18.4
Source: Aurecon (2014)
The release of atmospheric pollutants results in the dilution of pollutants during unstable atmospheric conditions (conditions of free convection and atmospheric mixing). These conditions occur most frequently in summer during the daytime. This dilution effect can however be inhibited under stable atmospheric conditions in the boundary layer where surface pollution is trapped under a surface inversion (Tyson & Preston-Whyte, 2000). This occurs in Saldanha during the winter months when temperature inversion layers ‘trap’ air pollution. Under these conditions an inversion can occur when a layer of warm air lies directly above a layer of cool air. This layer prevents a pollutant from mixing. Inversion layers tend to occur in calm and dry conditions during winter. Winds in the Saldanha Bay area are dominated by the seasonal migration of the South Atlantic Anticyclone (high pressure cell). In the austral summer the high pressure cell moves into its southernmost position and strong southerly and south westerly winds prevail. During the winter months the South Atlantic Anticyclone is situated further north and the Western Cape coastline is exposed to frequent mid latitude cyclones (commonly referred to as cold fronts), which are associated with north and north westerly winds (Figure 5.1).

ENVIRONMENTAL RESOURCES MANAGEMENT CCGT POWER PLANT, SALDANHA
5-3
The wind roses in Figure 5.1 below depict the seasonal variances of the measured wind speeds. In the summer months, the wind blows predominantly from the south-west with wind speeds of greater than 5.6 m/s occurring frequently. During the winter months, the percentage of calm periods increase to 11.5 percent and wind blows at low speeds (frequently less than 3.5 m/s) from the south and higher wind speeds from the north and north westerly direction.
Figure 5.1 Seasonal wind speed as a function of wind direction at Langebaanweg for the period 2005 to 2010
5.2.2 Air Quality
Particulate emissions are a concern at certain locations in Saldanha Bay and whilst these emissions arise mostly from industry, dust emissions from agricultural areas are also high. The main industrial sources of air pollution in Saldanha include (Burger and Krause, 2011): • ArcelorMittal Saldanha Works; • Tronox (previously Exxaro) Namakwa Sands; • Duferco Steel Processing; • Saldanha Iron Ore Terminal; • SFF Saldanha Bay Oil Storage; • St Helena Bay Fishmeal Industries (Oceana, Oranjevis, Hannasbaai, West
Point); and • Limestone and Aggregate Quarries. Pollution originating from these sources may include combustion products, such as SO2, NOx, CO, Particulate Matter (1)(PM 10 and PM 2.5, fugitive dust (TSP, PM 10 and PM 2.5), trace amounts of organic compounds and heavy metals, and odorous compounds (Burger and Bird, 2014).
(1) Particulate matter is the term for solid or liquid particles found in the air. Some particles are large or dark enough to be seen as soot or smoke. Others are so small they can be detected only with an electron microscope. Particles originate from a
variety of sources and as a result their chemical and physical compositions vary widely (EPA, 2015). PM10 particles are <10
μm in size and PM2.5 particles are less than <2.5 μm in size.
ENVIRONMENTAL RESOURCES MANAGEMENT CCGT POWER PLANT, SALDANHA
5-4
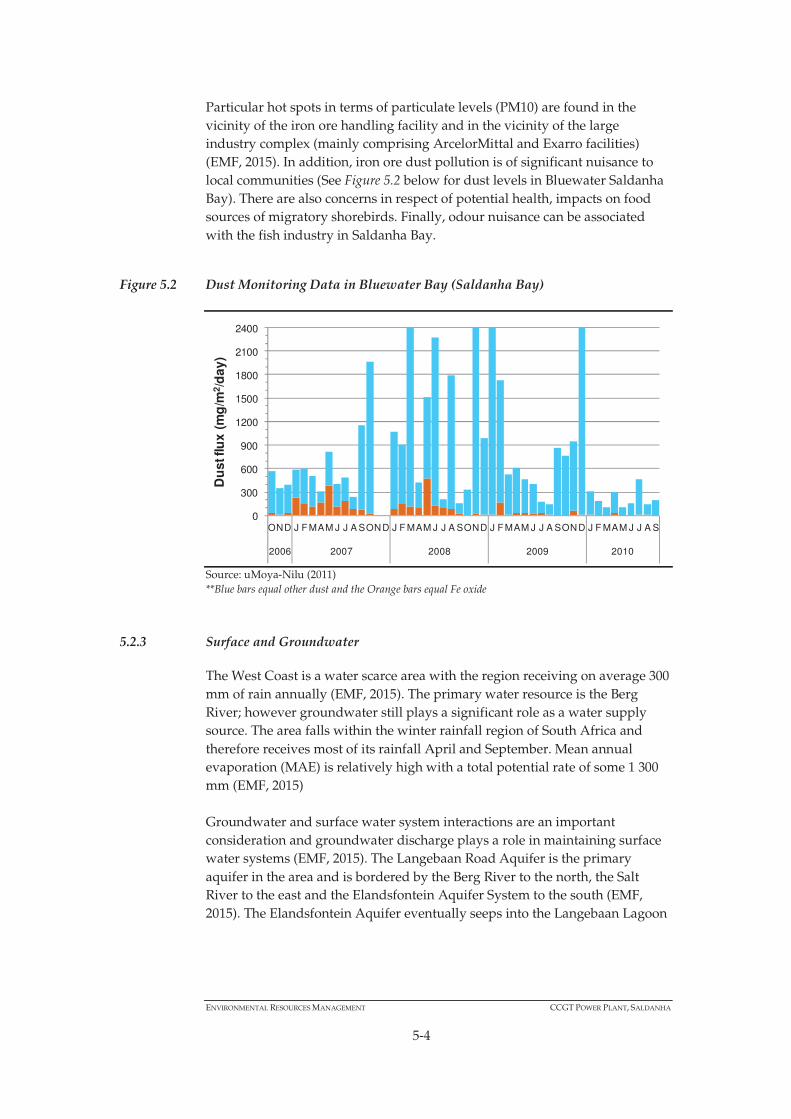
Particular hot spots in terms of particulate levels (PM10) are found in the vicinity of the iron ore handling facility and in the vicinity of the large industry complex (mainly comprising ArcelorMittal and Exarro facilities) (EMF, 2015). In addition, iron ore dust pollution is of significant nuisance to local communities (See Figure 5.2 below for dust levels in Bluewater Saldanha Bay). There are also concerns in respect of potential health, impacts on food sources of migratory shorebirds. Finally, odour nuisance can be associated with the fish industry in Saldanha Bay.
Figure 5.2 Dust Monitoring Data in Bluewater Bay (Saldanha Bay)
Source: uMoya-Nilu (2011) **Blue bars equal other dust and the Orange bars equal Fe oxide
5.2.3 Surface and Groundwater
The West Coast is a water scarce area with the region receiving on average 300 mm of rain annually (EMF, 2015). The primary water resource is the Berg River; however groundwater still plays a significant role as a water supply source. The area falls within the winter rainfall region of South Africa and therefore receives most of its rainfall April and September. Mean annual evaporation (MAE) is relatively high with a total potential rate of some 1 300 mm (EMF, 2015) Groundwater and surface water system interactions are an important consideration and groundwater discharge plays a role in maintaining surface water systems (EMF, 2015). The Langebaan Road Aquifer is the primary aquifer in the area and is bordered by the Berg River to the north, the Salt River to the east and the Elandsfontein Aquifer System to the south (EMF, 2015). The Elandsfontein Aquifer eventually seeps into the Langebaan Lagoon
0
300
600
900
1200
1500
1800
2100
2400
OND J F MAM J J A SOND J F MAM J J A SOND J F MAM J J A SOND J F MAM J J A S
2006 2007 2008 2009 2010
Du
st fl
ux
(mg
/m2 /
day
)

ENVIRONMENTAL RESOURCES MANAGEMENT CCGT POWER PLANT, SALDANHA
5-5
5.2.4 Topography, Geology and Soils
The geology of the region and its paleontological history are closely linked as fossil types, their abundance, and mode of occurrence is directly related to the nature of the sediments in which they occur (EMF, 2015). Thus a description of the fossil potential or sensitivity is closely related to the geology of the area. The Saldanha Bay area has the following key formations: • The Varswater Formation: This consists of two key sub members. The
Langeberg Quartz Sand Member (LQSM) is richly fossiliferous, with a diversity of bones, shells and microfossils reflecting river floodplain, salt marsh and tidal-flat environments; and the Muishond Fontein Pelletal Phosphorite Member (MPPM) reflects further deepening, with deposition in an expanded estuarine system.
• The Uyekraal Formation: Shelly Sands were deposited on the shoreline to form the lower, outer part of the coastal plain after a seal level lowering occurring in the middle of the Pliocene period.
• The Velddrif Formation: includes all Quaternary marine deposits below
about 15 meters above sea level (masl) that fringe the coast. • The Prospect Hill Formation; consists of the inner aeolianite ridge between
Saldanha Bay and Paternoster, includes fossil eggshell of the extinct ostrich Diamantornis wardi.
• The Langebaan Formation: These calcareous aeolianites are evident in the
coastal landscape as the ridges, low hills and mounds beneath a capping calcrete crust, or surface limestone.
• The Springfontyn Formation: This formation comprises the mainly non-
calcareous, windblown sand sheets and dunes that have covered parts of the landscape during the Quaternary.
There have been numerous fossil discoveries in the area many of which are now preserved in the West Coast Fossil Park, near Langebaan. Stone Age artifacts and remains of the indigenous Khoikoi are also widespread. The soils in the area range from calcareous sands at the coast to acidic sands further inland. Shale and granite soils are relatively fertile and form the backbone of agriculture in the region (CWCBR, 2010). The area is primarily underlain by the Langebaan Formation, characterised by old calcareous aeolianites (dune sandstones), beneath a capping calcrete crust. The old dune accumulation dominates the local topography, forming the low mounded hills that are evident in the coastal landscape and are covered with vegetation of darker-green hue. The old dunes were formed during a lower sea level, when Saldanha Bay was exposed. At the coast these old dunes are now erosionally

ENVIRONMENTAL RESOURCES MANAGEMENT CCGT POWER PLANT, SALDANHA
5-6
truncated by previous high shorelines and the present shoreline, forming a cliff that is partly covered by more recent sands. Between the low hills of outcropping “Langebaan Limestones” is a cover of pale sands with less dense vegetation. Due to the erosional truncation of the Langebaan Formation at the present coast, it is exposed in the intertidal zone of the beach fringing the farm Spreeuwal. These beds are fossiliferous, with large mammal bones and some MSA artefacts (Avery & Klein, 2009). These “Spreeuwal Beds” illustrate the palaeo-environments that are a typically interbedded in the lower parts of the Langebaan Formation.
5.2.5 Flora and Fauna
Flora
Saldanha Bay falls within the Fynbos Biome and the Cape Floristic Region (CFR). The CFR is one of only six floristic regions in the world, is the richest temperate flora in the world, and is the only one confined to a single country. It is also the smallest floristic region and supports about 9000 plant species - almost half of all the plant species in South Africa. At least 70% of all the species in the Cape region do not occur elsewhere, and many have very small home ranges (these are known as narrow endemics, and may be confined to a single farm). Many of the vegetation types that are present in the Saldanha Bay area occur only along the West Coast and are thus endemic to this area. The area is characterised by lowland habitats which are under pressure from agriculture, urbanisation, and alien plants, and thus many of the range restricted species are also under threat of extinction, as habitat is reduced to extremely small fragments. Data from the Red Data Book listing process recently undertaken for South Africa is that 67% of the threatened plant species in the country occur only in the Fynbos biome, and these total over 1800 species (Raimondo et al 2009). The south-western Cape is a national and global conservation priority (Helme, 2015). In addition, there are Critical Biodiversity Areas (CBA’s) across Saldanha Bay and the West Coast. CBAs are regarded as essential areas for the achievement of regional conservation targets, and are designed to ensure minimum land take for maximum result (Maree and Vromans 2010). These areas are categorised across the country. Power Plant Site A survey of the proposed site (1) was undertaken by Nick Helme during August 2015 (flowering season). The site is largely disturbed (likely by ripping) and has been heavily grazed and trampled which has reduced the rehabilitation success. The heavy grazing has meant that there were virtually no flowering annuals on the site at the time of the survey. Prior to disturbance the site would have supported Saldanha Flats Strandveld. The site is largely
(1) Note that at the time of survey the site area had not been refined and was larger than the site area now indicated. The area of high conservation concern has been removed from the proposed site.

ENVIRONMENTAL RESOURCES MANAGEMENT CCGT POWER PLANT, SALDANHA
5-7
flat, but with deep neutral sands overlying calcrete, which are seldom exposed at the surface. There are no wetlands.
Figure 5.3 View of the proposed site looking northeast looking toward Blouwater substation
Source: Nick Helme, 2015 * Note the relative lack of flowering spring annuals, due to heavy grazing by livestock.
The northern 5-10% of the study area (adjacent to the road to Blouwaterbaai substation) supports intact Saldanha Limestone Strandveld, which has not been ripped or heavily disturbed, and is thus more structurally diverse and of higher conservation value than the rest of the site. Saldanha Limestone Strandveld was previously listed as an Endangered vegetation type (Rouget et al 2004), and then was unfortunately downgraded to Least Threatened (DEA 2011), due to an oversight by SANBI, and this error will apparently only be remedied only in about 2016. The unit has the highest number of threatened and localised plant species of all vegetation types in the Saldanha region (Helme & Koopman 2007). The unit is also poorly conserved (represented) in the West Coast National Park. Typical species in this intact limestone area include Thamnochortus spicigerus, Zygophyllum morgsana, Limonium capense, Senecio alooides, Pteronia divaricata, Euphorbia burmanii, Othonna cylindrica and Searsia glauca. Two plant Species of Conservation Concern (SCC) were recorded in this limestone area, and the likelihood that any others occur here in viable numbers is low. The recorded SSC include Limonium capense (Near Threatened), Aloe distans (a large population of this regional endemic, but now regarded as a subspecies of A. perfoliata), and Nenax hirta ssp calciphila (Near Threatened).

ENVIRONMENTAL RESOURCES MANAGEMENT CCGT POWER PLANT, SALDANHA
5-8
Indigenous plant species diversity includes Galenia fruticosa, Exomis microphylla (brakbos), Oncosiphon suffruticosum (stinkkruid), Arctotheca calendula (Cape weed), Osteospermum incanum (dune bietou), O. chrysanthemoides (bietou), Muraltia spinosa (tortoise berry), Helichrysum niveum, Phyllobolus canaliculatus, Tetragonia fruticosa (kinkelbos), Stachys ballota, Mesembryanthemum crystallinum (slaai), Lycium ferocissimum, Oxalis pes-caprae (geel suuring), O. obtusa, Limeum aethiopicum (koggelmandervoet), Trachyandra divaricata (duinekool), Carpobrotus edulis (suurvy), Torilis arvensis, Senecio burchellii (hongerblom), Gladiolus cunonius, Calobota sericea (fluitjiesbos), Felicia hyssopifolia, Ehrharta calycina (polgras), Cynodon dactylon (fynkweek), Conicosia pugioniformis, Hermannia prismatocarpa, Ehrharta villosa (pypgras), Pelargonium myrrhifolium, Thamnochortus spicigerus (duinriet), Aspalathus acuminata, Searsia glauca (kunibush), Searsia laevigata (dune taaibos), Melolobium adenodes, Cissampelos capensis, Asparagus africanus, A. capensis, Amellus sp., Gymnosporia buxifolia (pendoring), Oxalis luteola, Crassula expansa, C. vaillantii, Ornithogalum sp., Zygophyllum morgsana, Viscum capense (voelent), Haemanthus pubescens (poierkwas), Trachyandra falcata (veldkool) and T. ciliata. Various annual alien grasses are also present, including Bromus pectinatus, Bromus diandrus (ripgut brome), Lolium sp. (ryegrass), Avena sp. (wild oats) and Vulpia myuros (ratstail fescue), plus the alien herbs Erodium moschatum (cranesbill), Echium plantagineum (Pattersons’s curse), Raphanus rapistrum (wildemostert) and Brassica tournefortii. No woody alien species are present, and none of the alien herbs or grasses is dominant. No plant Species of Conservation Concern were recorded in the disturbed part of the study area, and the likelihood that any occur here in viable numbers is low. Importantly it should be noted that the small northern portion of the study area with high conservation concern has been removed from the proposed site subsequent to the survey. Botanical Conservation Value The terms conservation value and sensitivity are often used interchangeably, but this is not strictly correct. The term “conservation value” refers to the value of the habitat in local and regional conservation terms (i.e. answering the question how important is it?), whilst “sensitivity” strictly means how resilient is the habitat to disturbance. In the case of urban or industrial development any natural or partly natural habitat would effectively be permanently lost in the development footprint, and thus technically sensitivity would be high, irrespective of the conservation value of the underlying habitat. The conservation value of a habitat is a product of species diversity, rarity of habitat, rarity of species, ecological viability and connectivity, vulnerability to impacts, and reversibility of threats (ease of rehabilitation).

ENVIRONMENTAL RESOURCES MANAGEMENT CCGT POWER PLANT, SALDANHA
5-9
Areas that have been cultivated or ripped and have relatively low botanical diversity and no significant populations of plant Species of Conservation Concern (SCC) are considered to be of Low botanical conservation value at a regional scale. High conservation value areas support relatively intact examples of the locally restricted vegetation type Saldanha Limestone Strandveld, with regionally significant populations of various plant Species of Conservation Concern. These areas may or may not be designated CBAs. These areas are considered ecologically irreplaceable, on account of the presence of relatively intact examples (with both high species diversity and high structural heterogeneity) of a regionally restricted vegetation type (in this case Saldanha Limestone Strandveld), and due to the presence of regionally endemic plant Species of Conservation Concern. Conservation of such areas would contribute significantly to species and/or ecological process targets for the region, and should be considered No Go areas for development.

ENVIRONMENTAL RESOURCES MANAGEMENT CCGT POWER PLANT, SALDANHA
5-10
Figure 5.4 Orthophoto showing the proposed site and the area of high conservation concern to the north
Source: ERM, 2016
Fauna
In general, fynbos vegetation cannot support high numbers animals due to the poor nutrients in the soils. However, there is a range of faunal life within the Saldanha Bay area (EMF, 2015). • Birds. 200 bird species occur regularly in the broader Saldanha area (17 of
which are Red Data Book Species) (Aurecon, 2014). Important species including the vulnerable black harrier (Circus maurus), the most restricted range of the world’s 13 harrier species, Ludwig's bustard (Neotis ludwigii) and the Karoo chat (Cercomela schlegelii). In addition, smaller birds, such as Cape Sugarbird and Orange Breasted Sunbird, play an important role in pollinating flowers. The beaches and sheltered islands on the West Coast are particularly important for sea birds where thousands of birds roost or rest. Important bird areas are the Berg River Estuary and the West Coast National Park. Langebaan Lagoon is an important habitat for migrant waterbirds, specifically from the Palaearctic region of Eurasia (Anchor, 2014). Approximately 98 percent of the waterbirds present in the lagoon during summer months are migrant species and the Lagoon is a key habitat for waders on the west coast of southern Africa (Anchor, 2014). During the latter part of the 20th century there was a downward trend in the numbers of Palaearctic waders at the lagoon primarily as a result of disturbances to breeding grounds. The 2013 and 2014 data however, show some limited

ENVIRONMENTAL RESOURCES MANAGEMENT CCGT POWER PLANT, SALDANHA
5-11
recovery in numbers (Anchor, 2014). In addition, there has also been a decline in numbers of resident waders as a result of habitat changes and human disturbance. However, numbers have stabilised between 2005 and 2014 (Anchor, 2014).
• Mammals. A number of mammal species are threatened, endemic or near
endemic to the area. Key species include: The Van Zyl’s Golden Mole (Cryptochloris zyli), Cape Dune Molerat (Batyergus suillus), Cape Gerbil Tatera afra and Grant’s Golden Mole (Eremitalpa granti) (Vulnerable) are endemic or near endemic. The Honey Badger (Mellivora capensis) is listed as Near Threatened, as is the Cape Horseshoe Bat (Rhinolophus capensis), and the White-tailed Mouse (Mystromys albicaudatus) is endangered.
• Reptiles. The diversity of reptile species is relatively high in the drier areas
along the West Coast including snakes, lizards and tortoises. For example. Seven species of girdled lizards of the genus Cordylus, including the armadillo girdled lizard (Cordylus cataphractus, Vulnerable) and the Cape Girdled Lizard (Cordylus niger) (endemic to Cape Peninsula and Saldanha Peninsula) are endemic to the area. The Geometric Tortoise (Psammobatus geometricus) is Critically Endangered and has lost more than 90% of its habitat.
Critical Biodiversity Areas (CBA)
CBA information has been drawn from the Biodiversity Sector Plan that has been prepared for the Saldanha Bay, Berg River, Cederberg and Matzikama municipalities. The sector plan is based on the work conducted under the auspices of Cape Nature’s Fine-Scale Biodiversity Planning project. The study area is within the planning domain of the Saldanha Fine Scale Conservation Plan (Pence 2008). The maps have been produced to satisfy legislation in Chapter 3 of NEMBA. CBA’s defined as biodiversity areas that are of high priority and that is required to maintain biodiversity pattern and process (i.e. functioning ecosystems) and to meet conservation targets (EMF, 2015). Figure 5.5 illustrates the CBA and potential project component, showing that potentially up to 43% of the land within the ArcelorMittal project site is within a declared CBA.

Figure 5.5 Critical Biodiversity Areas close to the Project

ENVIRONMENTAL RESOURCES MANAGEMENT CCGT POWER PLANT, SALDANHA
5-13
5.2.6 Geology, Soils and Fossils
The geology of the region and its paleontological history are closely linked as fossil types, their abundance, and mode of occurrence is directly related to the nature of the sediments in which they occur (EMF, 2015). Thus a description of the fossil potential or sensitivity is closely related to the geology of the area. The Saldanha Bay area has the following key formations: • The Varswater Formation: This consists of two key sub members. The
Langeberg Quartz Sand Member (LQSM) is richly fossiliferous, with a diversity of bones, shells and microfossils reflecting river floodplain, salt marsh and tidal-flat environments; and the Muishond Fontein Pelletal Phosphorite Member (MPPM) reflects further deepening, with deposition in an expanded estuarine system.
• The Uyekraal Formation: Shelly Sands were deposited on the shoreline to form the lower, outer part of the coastal plain after a seal level lowering occurring in the middle of the Pliocene period.
• The Velddrif Formation: includes all Quaternary marine deposits below
about 15 metres above sea level (masl) that fringe the coast. • The Prospect Hill Formation; consists of the inner aeolianite ridge between
Saldanha Bay and Paternoster, includes fossil eggshell of the extinct ostrich Diamantornis wardi.
• The Langebaan Formation: These calcareous aeolianites are evident in the
coastal landscape as the ridges, low hills and mounds beneath a capping calcrete crust, or surface limestone.
• The Springfontyn Formation: This formation comprises the mainly non-
calcareous, windblown sand sheets and dunes that have covered parts of the landscape during the Quaternary.
There have been numerous fossil discoveries in the area many of which are now preserved in the West Coast Fossil Park, near Langebaan. Stone Age artifacts and remains of the indigenous Khoikoi are also widespread. The soils in the area range from calcareous sands at the coast to acidic sands further inland. Shale and granite soils are relatively fertile and form the backbone of agriculture in the region (CWCBR, 2010). The area is primarily underlain by the Langebaan Formation, characterised by old calcareous aeolianites (dune sandstones), beneath a capping calcrete crust. The old dune accumulation dominates the local topography, forming the low mounded hills that are evident in the coastal landscape and are covered with vegetation of darker-green hue. The old dunes were formed during a lower sea level, when Saldanha Bay was exposed. At the coast these old dunes are now erosionally truncated by previous high shorelines and the present shoreline, forming a cliff that is partly covered by more recent sands.
ENVIRONMENTAL RESOURCES MANAGEMENT CCGT POWER PLANT, SALDANHA
5-14
Between the low hills of outcropping “Langebaan Limestones” is a cover of pale sands with less dense vegetation. Due to the erosional truncation of the Langebaan Formation at the present coast, it is exposed in the intertidal zone of the beach fringing the farm Spreeuwal. These beds are fossiliferous, with large mammal bones and some MSA artefacts (Avery & Klein, 2009). These “Spreeuwal Beds” illustrate the palaeoenvironments that are a typically interbedded in the lower parts of the Langebaan Formation.
5.3 SOCIAL
5.3.1 Administrative Structure
The Project is in the Western Cape Province and the West Coast District Municipality (WCDM). The WCDM borders the Northern Cape District Municipality (NDCM) in the north and the Cape Metro District Municipality (CMDM) and Cape Winelands District Municipality (CWDM) in the south and south-east, respectively. The District Municipality has five local municipalities; namely Swartland, Bergrivier, Matzikama, Cederberg, and Saldanha Bay, and the Project site is located in the Saldanha Bay Local Municipality (SBLM) (see Figure 5.6). There are 13 Wards within the SBLM, the Project falls within Ward 2.

Figure 5.6 West Coast District Municipality Boundaries
Source: West Coast District Municipality IDP, 2012

ENVIRONMENTAL RESOURCES MANAGEMENT CCGT POWER PLANT, SALDANHA
5-16
5.3.2 Demographic Profile
The 2011 Community Survey notes that the population of the WCDM is estimated to be 391 758. The District occupies 19 percent of the total land area of the Western Cape Province and is sparsely populated with a population density of 13 people per square kilometre. Approximately 72 percent of the population lives in urban areas with the remaining 28 percent living in rural areas. The District is relatively urbanised and the rural areas are sparsely populated. The SBLM has the second largest population (99,193 people) in the District area with the Swartland Municipality having the highest population (113 763). The population of the Saldanha increased by 3.4 percent between 2001 and 2011 (StatsSA, 2011), greater than the predicted 2.2 percent growth expected in the Saldanha Bay Local Municipality, IDP, 2007/2008. Some 95 percent of SLBM households are concentrated in urban areas with the remaining 5 percent living in rural areas (DEA&DP, 2012). This is the highest proportion of people living in urban area as compared to the other Local Municipalities in the WCDM and well above the District average of 72 percent (StatsSA, 2011). The population density in SBLM is 49 persons per square kilometer which is significantly higher than that of the District Municipality (13 people per square kilometer). The WCDM’s population is composed of three ethnic groups, namely; Coloured, Black Africans and White Communities. The most dominant of these is the Coloured community (67 percent) while both White and Africa groups account from 16 percent of the population, as shown in Figure 5.7. Within the SBLM, the Coloured community account for 56 percent of the population, while Black Africans account for 24 percent and White people account of 18 percent of the population (StatsSA, 2011). Afrikaans is the most dominant language spoken in the SBLM, with an estimated 71 percent of the population being native speakers, isiXhosa is the second most commonly spoken language at 16 percent and English at 6 percent this is illustrated in Figure 5.7.

ENVIRONMENTAL RESOURCES MANAGEMENT CCGT POWER PLANT, SALDANHA
5-17
Figure 5.7 Ethnic Composition in the WCDM and the SBDM
Source: StatsSA (2011)
Figure 5.8 Language Spoken in the SBLM
Source: StatsSA (2011)
5.3.3 Education
The WCDM has a total of 130 schools (primary and secondary schools). The literacy rate (1) in the WCDM is 79.1 percent (Western Cape Government,
(1) The Department of Social Development defines people aged 14 years and older as literate if they have successfully
completed 7 years formal education (passed Grade 7/Standard 5).

ENVIRONMENTAL RESOURCES MANAGEMENT CCGT POWER PLANT, SALDANHA
5-18
2014), which falls short of the Provincial literacy rate of 87.2 percent. The teacher student ratio is 28 students per teacher. SBLM has a total of 19 schools and the literacy rate is 86.7 percent. Similar to the WCDM, the levels of illiteracy are highest amongst those above the age of 14 years. The learner-educator ratio is 1:28.5, in line with that of the WCDM, (Western Cape Government, 2014). Figure 5.9 below shows that overall the level of education is slightly higher in the SBLM than in the WCDM, with a slightly higher percent of people having obtained a Grade 12 or some level of higher education in the SBLM. The figure also shows that in both Municipalities a greater proportion of learners have completed some secondary schooling, while fewer that have completed Grade 12.
Figure 5.9 Levels of Education in the Local Municipality
Source: Statssa, Census 2011
5.3.4 Health
The WCDM has 76 medical facilities (26 clinics, 24 satellite clinics, 19 mobile clinics and seven district hospitals) (Western Cape Government, 2014). Some of the challenges encountered by the Health Department in the WCDM are the poor/insufficient physical infrastructure, overcrowded primary healthcare facilities and the insufficient numbers of skilled health workers in the region. The most common illnesses affecting communities are infectious diseases such as HIV/Aids and TB, as well as chickenpox and measles amongst children. The SBLM has the lowest number of antiretroviral treatment (ART) clinics/treatment sites in the WCDM, which is of concern considering it has the heaviest ART patient load in the WCDM (1,779 patients in March 2014, up from 1,435 patients in 2013) (Western Cape Government, 2014). There has
ENVIRONMENTAL RESOURCES MANAGEMENT CCGT POWER PLANT, SALDANHA
5-19
been a general increase in the numbers of teenage pregnancies recorded in the region; the increase in teenage pregnancies is potentially linked to poverty in the area. Violence and substance abuse are also common in the District leading to increased pressure on the local health services (West Coast District Municipality, 2009). SBLM has 14 medical facilities (8 clinics, 3 satellite clinics, 2 mobile clinics and 1 district hospital) (Saldanha Bay Municipality, 2012). According to the IDP, nine doctors and 59 professional nurses have been employed by the Department of Health to render health services to patients attending the health facilities in Saldanha Bay (1).This indicates that there is high number of patients compared to the nursing staff available to service the patients’ medical needs. The most common illnesses are HIV/Aids and TB; this is similar to the District level. The HIV/Aids prevalence in the District was 4.3 percent in 2005 and it was expected to increase to 5.5 percent by 2010 (West Coast District Municipality, 2006). There is a relationship between the high prevalence of TB and HIV/Aids.
5.3.5 Economic Profile
The WCDM contributed about 4.3 percent to the Western Cape’s total GDPR (Regional Gross Domestic Product) in 2011 (Western Cape Government, 2013). The WCDM has experienced slow economic growth in the past five years. This can be attributed to the contraction in agriculture in some of the municipal areas, namely Bergrivier LM, Matzikama LM and Cederberg LM, as well as a struggling manufacturing sector, particularly in the SBLM, which was affected by the economic downturn. While jobs have been lost in the Agricultural and manufacturing sectors, positive net employment was recorded in the services sector, with SBLM recording the highest number of new jobs in the service sector (Western Cape Government, 2013). The agricultural, forestry and fishing sectors were the sectors that performed the best; contributing 16.8 percent to the GDPR of the WCDM. Sectors such as wholesale, retail trade catering and accommodation, and Finance, insurance, real estate and business services had the lowest contribution to the GDPR of the West Coast Region at 3.7 percent and 3.4 percent respectively (Western Cape Government, 2013). The SBML contributed 33.9 percent towards the GDP of the WCDM. The key economic sectors for the SBLM are shown in Table 5.2. Collectively, these sectors contributed towards approximately 90 percent to the Local Municipality's economic output in 2011 (Western Cape Government, 2014). These sectors are discussed further below.
(1) Note that these totals exclude health professionals employed within the private sector.

ENVIRONMENTAL RESOURCES MANAGEMENT CCGT POWER PLANT, SALDANHA
5-20
Table 5.2 Contribution to the SBLM Economic Output 2014
Economic Sector Percent Contribution to Economic OutputFinance, insurance, real estate and business services
32
General government 18 Manufacturing 13 Wholesale and retail, trade, catering and accommodation
10
Transport, storage and communication 9 Agriculture, forestry and fishing 8
Source: Western Cape Government (2014)
Agriculture, Forestry and Fishing
Between 1994 and 2004 the agriculture, forestry and fishing sectors increased combined contribution to the GDPR increased from 10 percent to 11.9 percent (Western Cape Government, 2006). However, this combined contribution decreased to 8 percent in 2011, supporting the notion that there has been a general retraction in the agricultural sector within the WCDM (Western Cape Government, 2014). The main contributors to these sectors were fish products, animal products, wheat products, vegetables and fruit. Manufacturing and Processing
The main contributors to the SBLM manufacturing sector are metal processing and food processing. The two sectors contributed 54.2 percent and 37.1 percent, respectively in 2009 (Demacon, 2009), and account for over 80 percent of the SBLM manufacturing sector. The high metals contribution is due to the exporting of metals from the Northern Cape mines for steel-manufacturing plants near the port of Saldanha. The contribution of the food processing is largely driven by the processing of products from the fishing industry. While the manufacturing sector enjoyed steady growth in the past (2, 6 and 39 percent from 1995 to 2004), the sector has shown slow and negative growth since 2009, largely linked to the slum in the metal metals industry (Western Cape Government, 2014). Transport and Communication
Transport and communication was the second-largest sector in the Saldanha Bay Municipality, contributing 9 percent to the total GDPR in 2011. The industry showed growth between 1996 and 2001, but has subsequently started to slow, if not retract (Demacon, 2009). This could be linked to the general slow-down in economic growth experienced by the SBLM since 2009. Transport activities included bus and tour-bus services, taxis, school buses, travel agents, the hiring of transport equipment and telephone and radio-communication services.

ENVIRONMENTAL RESOURCES MANAGEMENT CCGT POWER PLANT, SALDANHA
5-21
Wholesale and Retail Trade, Catering and Accommodation
This sector contributed 10 percent towards the SBLM’s total GDPR, largely driven by the wholesale and retail trade sector. This sector has also been bolstered by positive growth in the tourism industry. Tourism
Tourism is one of the fastest growing sectors of South Africa's economy with its contribution to the country's gross domestic product (GDP) reaching almost 12 percent in 2010. The tourism industry in the Western Cape contributes 14 percent to the total (GDP) of the Province and makes a significant contribution to economic development and jobs, thus being the most important growth sector in the Province. The West Coast is well known for tourism. There are numerous protected areas such as the SAS Saldanha Nature Reserve, West Coast National Park, and the West Coast National Fossil Park located in the SBLM ((http://capewestcoastpeninsula.co.za, accessed November 2015). Within these protected areas people can take part in numerous activities such as gaming, whale and bird watching, and seeing wild flowers blooming in the winter and spring. The region is rich in history which has resulted in the unique blend of cultures. It was originally inhabited by the Khoi San tribes and Europeans came to the area around the 1600s (http://capewestcoastpeninsula.co.za, accessed November 2015) The WCDM IDP cites a lack of funding as a major challenge for the development and marketing of the tourism sector in the District. Employment and Unemployment
The unemployment rate in the WCDM was 14.6 percent in 2011. This is comprised of people who are unemployed but seeking employment, as well as those who are not seeking employment. The unemployment rate in the SBLM was higher than that of the District at 23.4 percent (Western Cape Government, 2014). Sectoral–employment data (2011) showed the following sectors as being the biggest employers in Saldanha Bay Local Municipality (Table 5.3). Manufacturing is key employer in the SBLM, which is in contrast to the WCDM where agriculture, forestry and fishing are the major employment sector.
Table 5.3 Formal Employment by Sector 2014
Sector Percent Employed Finance and business services 11.4 Agriculture, forestry and fishing 14.2Manufacturing 24.2 Community, personal, and social services ( 20.4
ENVIRONMENTAL RESOURCES MANAGEMENT CCGT POWER PLANT, SALDANHA
5-22
Sector Percent Employed Wholesale and retail trade; and catering and accommodation
15.1
Source: CCA (2014)
The major employers in the fishing industry include companies such as Sea Harvest, Oceana, Southern Seas and West Point Processors. Within the Steel and mineral-processing companies (Manufacturing sector), the Saldanha Steel Project (ArcelorMittal SA), Namakwa Sands are the major employers. Skills Levels
The population of SBLM is typically engaged in occupations requiring a higher level of skills than that of the WCDM (West Coast District Municipality IDP, 2012 – 2016). Table 5.4 provides a comparison of the skills levels within the two populations.
Table 5.4 Comparison of Skills Levels between District and Local Municipality in 2012
Area Highly Skilled %
Skilled% Low Skilled% Not Specified%
West Coast District Municipality
21.3 41.9 27.9 8.9
Saldanha Bay Local Municipality
28.5 49.3 12.1 10
Source: West Coast District Municipality (2012)
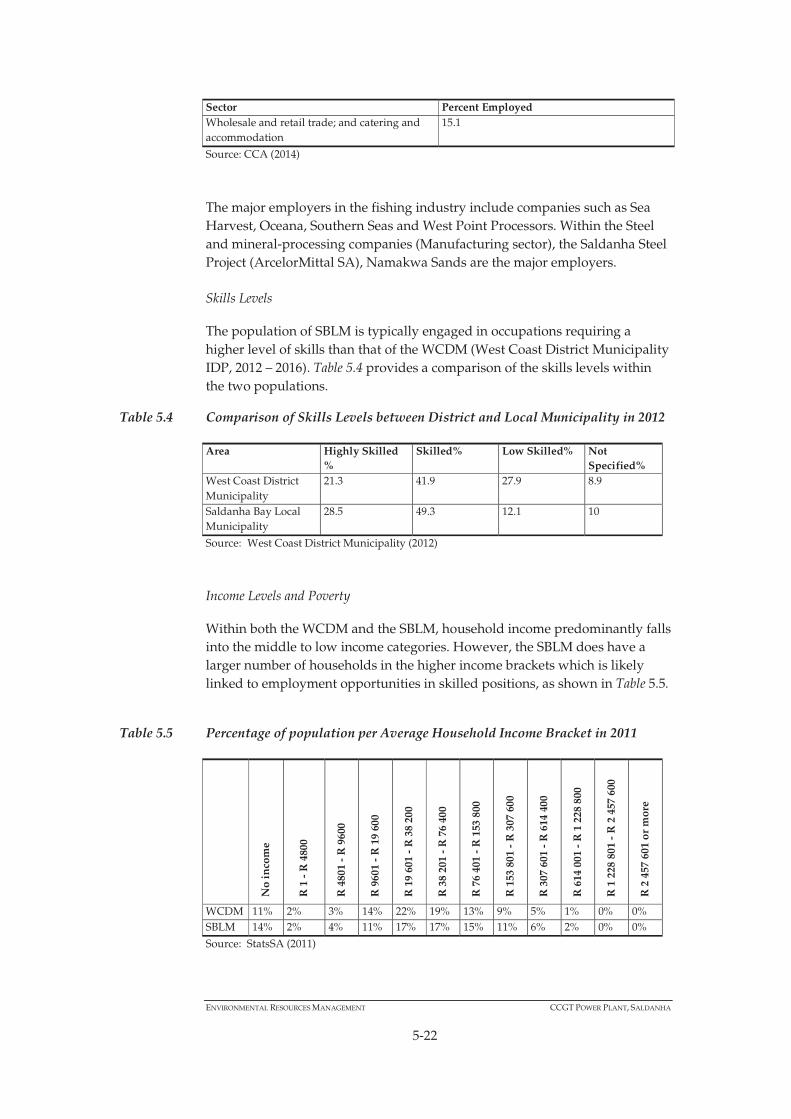
Income Levels and Poverty
Within both the WCDM and the SBLM, household income predominantly falls into the middle to low income categories. However, the SBLM does have a larger number of households in the higher income brackets which is likely linked to employment opportunities in skilled positions, as shown in Table 5.5.
Table 5.5 Percentage of population per Average Household Income Bracket in 2011
No
inco
me
R 1
- R
480
0
R 4
801
- R
960
0
R 9
601
- R
19
600
R 1
9 60
1 -
R 3
8 20
0
R 3
8 20
1 -
R 7
6 40
0
R 7
6 40
1 -
R 1
53 8
00
R 1
53 8
01 -
R 3
07 6
00
R 3
07 6
01 -
R 6
14 4
00
R 6
14 0
01 -
R 1
228
800
R 1
228
801
- R
2 4
57 6
00
R 2
457
601
or
mor
e
WCDM 11% 2% 3% 14% 22% 19% 13% 9% 5% 1% 0% 0% SBLM 14% 2% 4% 11% 17% 17% 15% 11% 6% 2% 0% 0%
Source: StatsSA (2011)

ENVIRONMENTAL RESOURCES MANAGEMENT CCGT POWER PLANT, SALDANHA
5-23
The SBLM has an estimated poverty rate of 23.9 percent. This is lower than the surrounding municipalities and that of the WCDM, which has a poverty rate of 30.4 percent.
5.3.6 Land Use
The Port of Saldanha Bay is South Africa's largest natural anchorage. The port developed into a modern harbour, when it became necessary to facilitate the export of iron ore from the Northern Cape via an 800 km railway line from the mines at Sishen in the Northern Cape. The Port accepts vessels of up to 20.5 m draught. The Port entrance channel is dredged to a depth of -23 m Chart Depth and 400m wide. The total area occupied by the Port (land and water areas) is 18,300 ha and it has a 990 m long jetty containing two iron ore berths linked to the shore along a 3.1 km long breakwater. There is also an 874 m long multipurpose quay for the handling of breakbulk cargo. Between 2011 and 2012 the Port of Saldanha Bay handled a total of 528 ships with a total gross tonnage of 34,503,749-gt. In 2011/12 cargo handled by the port totalled 58,263,030 tonnes, primarily iron ore but also oil.
5.3.7 Cultural Heritage
The West Coast gained to prominence, from quiet coastal village better known for its fishing villages and grain-producing farms, to world heritage locality of international repute, with the discovery of one of the richest deposits of fossils in the world. The bones of over two hundred different kinds of animals have been recovered in the area (Potgieter, 1972). These fossils are now preserved in the West Coast Fossil Park, near Langebaan. The 14ha Park lies on the R45 close to the Langebaanweg Air Force Base, roughly 14 kilometres ENE of the site under review. Stone Age artefacts and remains of the indigenous Khoikoi are also widespread, which makes it imperative that palaeontological, geological and cultural heritage surveys be undertaken to record and preserve the rich heritage of the region. In more recent times it was European settlers that impacted significantly upon the land, and continue to do so to the present. On the 7th November 1497 Vasco da Gama, during his epic first voyage around the southern point of Africa to India, set foot on land at St Helena Bay (Speight, nd.). First mention of St Helena Bay is in Da Gama’s “Roteiro” – his journal of his first voyage around the Cape to India, and the return trip, 1497-1499(Knox-Johnston, 1989). St. Helena Bay was first described by the Portuguese Pacheco Pereira in his “Roteiro”, dated approximately 1506-1508 (Knox-Johnston, 1989):
A bay called Angra de Santa Elena. It is fairly large and dangerous because of its many reefs of rock. The whole of this coast is foul with rocks. On the south the bay runs into a point, where there are shallows and here one must be careful. Its latitude is 32 degrees 30 minutes south of the equator.

ENVIRONMENTAL RESOURCES MANAGEMENT CCGT POWER PLANT, SALDANHA
5-24
Like Diaz in 1488, Antonio de Saldanha, 1470-1535, was also brought to the West Coast by a storm and his ships arrived in Table Bay in 1503. Saldanha Bay, named after him, became an important mooring place due to its rich marine life, although the bane of the day, lack of water, is still a problem, especially with the rapid development and industrialisation of the region. Were it not for the arid nature of the West Coast, Saldanha might have developed into the most important harbour in the Western Cape. However, Saldanha Bay still remains the finest natural harbour in Southern Africa (Knox-Johnston, 1989). Farming activities are recorded far back as in 1715 when the Dutch East India Company allocated loan farms to settlers along the Berg River to supply the Cape Colony with various produce. In addition, one of the Verenigde Oos-Indische Compagnie (V.O.C.) ‘buiteposte’ (Company outposts) was established at Saldanha and another at St. Helena Bay. Their purpose was to serve as administrative and trading posts and as Company farms (Sleigh, 2004). During the late 1700's, fishermen had also settled in the area and supplied dried, salted fish to the local farmers. Most of the towns were settled in the 19th century.
5.3.8 General Infrastructure and Services
Water
In the Saldanha Bay Municipality, 99.2 percent of the population has access to piped water; households that have access to water inside their homes, from outside taps on their properties and from communal taps (Western Cape Government, Socio-economic Profile Saldanha Bay Municipality, 2014). The West Coast District Municipality (WCDM) provides bulk potable water to the Saldanha Bay Municipality through the Misverstand Scheme which is part of the Berg River – Saldanha supply system (EMF, 2015). Water is obtained from both surface water (Berg River) and groundwater (Langebaan Road Aquifer) for the Misverstand Scheme. This scheme supplies the Saldanha Bay municipality and some of the towns in the Berg River municipality (EMF, 2015). Water demand in the Saldanha Bay municipal area increased significantly with the establishment of a number of industries over the past 30 years (EMF, 2015). This is attributed to the development of the Port and associated infrastructure. According to the IDP Review, industrial water users account for approximately 50% of potable water use within the Saldanha Bay municipal area (EMF, 2015). There are plans to construct a desalination plant in Saldanha Bay to supply additional water to the local area (WCDM IDP, 2012).

ENVIRONMENTAL RESOURCES MANAGEMENT CCGT POWER PLANT, SALDANHA
5-25
Sanitation
The WCDM has provided 92 percent of households with proper sanitation. Compared with the District Municipality, the SBLM has provided 96.2 percent of its households with adequate sanitation facilities (Western Cape Government, 2014). Table 5.7 below illustrates the existing wastewater treatment plants operated by the Saldanha Bay Local Municipality. In addition, it is important to note that a regional Waste Water Treatment Works (WWTW) is proposed for the SBLM, which will service the proposed industrial areas within Saldanha.
Table 5.6 Wastewater Treatment Plants in the Saldanha Bay Municipality
Responsible Municipality/ Organisation
Name Of WWTW
Water Disposal Method Technology Being Used
Saldanha Bay LM Sandy Point (Shelly Point)
Irrigation, 100 % Re-use Package plant, Activated sludge
Saldanha Bay LM Paternoster Irrigation Oxidation pond (lined)
Saldanha Bay LM Laingville (St Helena Bay)
Irrigation, 30 % Re-use Activated sludge, Maturation ponds, Disinfection
Saldanha Bay LM Hopefield Irrigation, 100 % Re-use Activated sludge, Maturation ponds,
Saldanha Bay LM Langebaan Irrigation, 100 % Re-use
Oxidation pond (lined) ,Activated sludge, Maturation ponds, Disinfection
Saldanha Bay LM Saldanha Irrigation, 100 % Re-use
Oxidation pond (unlined), Activated sludge, Maturation ponds, Disinfection
Saldanha Bay LM Vredenburg Watercourse, 50 % Re-use
Oxidation pond (lined), Activated sludge, Maturation ponds, Disinfection
Source: DWA (2009)
Waste
Saldanha Bay Municipality dispose all waste at the licensed Vredenburg landfill and a number of drop-off facilities are provided at various communities (WCDM, 2014). There is also a Materials Recovery Facility at the Vredenburg landfill. Hazardous material can be discarded at the Visserhoek Disposal facility. A new regional waste disposal facility has been planned to be constructed in Vredendal (WCDM, 2012).

ENVIRONMENTAL RESOURCES MANAGEMENT CCGT POWER PLANT, SALDANHA
5-26
Housing
There has been a slow delivery of housing in the WCDM and SBLM. Although 2,535 households gained access to housing for the first time since 2007, the number of households on the waiting list for housing is currently estimated at 8 179 and the number of households effected by the housing backlog is 6,730 (Saldanha Bay Local Municipality IDP, 2012). The housing backlog has been increasing steadily since 2001, when it was 2,836. According to the 2006 West Coast Socio-Economic Profile, the slow pace of housing delivery was attributed to the constantly changing settlement patterns resulting from in-migration. Energy
Within the Saldanha Bay Local Municipality the proportion of households using electricity for lighting has increased in the Municipality from 91.6 percent during the 2001 Census to 97 percent in 2011 (StatsSA, 2011). Even though an increase was seen in the number of households having access to electricity, 92 percent of households use electricity for cooking purposes, and the other 8 percent use gas or paraffin (StatsSA, 2011). Roads
The WCDM has approximately 10 097 km of road, (West Coast District Municipality, 2012). The roads are maintained by the WCDM on behalf of the Western Cape Provincial Department Transport and Public Works. The SBLM has 410 km of tarred Municipal roads and 48, 24 km of gravel roads (excluding private farm roads), and the roads are generally of poor quality. There is a backlog in the SBLM relating to road maintenance, and it is noted in the IDP that 548 households did not have access to a road from their dwelling (Saldanha Bay Local Municipality, 2012) Policing and Crime
There are 26 police stations in the WCDM. These are evenly distributed across the local municipalities, with five in each local municipality. This distribution does not account for the geographic extent or the population size of each local municipality. There are police stations in all the major towns within the SBLM which services the town and the rural surrounding (Saldanha Bay Local Municipality, 2012). The most prolific crimes committed in the SBLM are “burglaries at residential premises” and ‘drug-related crimes” with 995 and 828 incidents being reported in 2013/14 respectively. Crime statistics across all categories increased from 2010 to 2013, but have subsequently started to decrease again (refer to Table 5.8). At this stage the reason for this is unclear.

ENVIRONMENTAL RESOURCES MANAGEMENT CCGT POWER PLANT, SALDANHA
5-27
Table 5.7 Crime in the SBLM between 2009 and 2014
Type of Crime 2009/10 2010/11 2011/12 2012/13 2013/14 Burglary at residential premises
792 787 1 018 1 225 955
Driving under the influence of alcohol or drugs
262 194 161 148 137
Drug-related crime
1 138 1 071 1 006 1 013 828
Murder 35 33 21 29 25 Total Sexual Crimes
154 132 134 147 123
Source: Western Cape Government (2014)