5 h v wr ulq j k d e lwd w ir u f r d v wd o & d olir uq ... · resumen uno de los objetivos de...
TRANSCRIPT

Restoring habitat for coastal California Gnatcatchers(Polioptila californica californica)
Authors: Winchell, Clark S., and Doherty, Paul F.
Source: The Condor, 120(3) : 581-595
Published By: American Ornithological Society
URL: https://doi.org/10.1650/CONDOR-17-221.1
BioOne Complete (complete.BioOne.org) is a full-text database of 200 subscribed and open-access titlesin the biological, ecological, and environmental sciences published by nonprofit societies, associations,museums, institutions, and presses.
Your use of this PDF, the BioOne Complete website, and all posted and associated content indicates youracceptance of BioOne’s Terms of Use, available at www.bioone.org/terms-of-use.
Usage of BioOne Complete content is strictly limited to personal, educational, and non - commercial use.Commercial inquiries or rights and permissions requests should be directed to the individual publisher ascopyright holder.
BioOne sees sustainable scholarly publishing as an inherently collaborative enterprise connecting authors, nonprofitpublishers, academic institutions, research libraries, and research funders in the common goal of maximizing access tocritical research.
Downloaded From: https://bioone.org/journals/The-Condor on 09 May 2020Terms of Use: https://bioone.org/terms-of-use

Volume 120, 2018, pp. 581–595DOI: 10.1650/CONDOR-17-221.1
RESEARCH ARTICLE
Restoring habitat for coastal California Gnatcatchers (Polioptila californicacalifornica)
Clark S. Winchell1#* and Paul F. Doherty, Jr.2#
1 U.S. Fish and Wildlife Service, Carlsbad Fish and Wildlife Office, Carlsbad, California, USA2 Department of Fish, Wildlife, and Conservation Biology, Colorado State University, Fort Collins, Colorado, USA* Corresponding author: [email protected]# Both authors contributed equally to the paper.
Submitted October 24, 2017; Accepted April 18, 2018; Published July 11, 2018
ABSTRACTOne goal of Habitat Conservation Plans is to protect viable populations of animal species. Management actionsincluded in such plans often focus on vegetation restoration to benefit the target animal species. Yet, such restorationactivities are often uninformed by fine-scale animal survey data. Using the California Gnatcatcher (Polioptila californicacalifornica), we demonstrate how survey data can guide restoration toward the goal of improving gnatcatcher viabilityby identifying habitat conditions most favorable for gnatcatcher occupancy. We found that gnatcatcher presence andcolonization probabilities tripled as the coverage of coastal sagebrush (Artemisia californica) increased from 10% to40%. Coastal sagebrush was more likely to be present at low elevations, and was most closely associated with soiltexture of 5%–20% clay, 40%–70% sand, and 20%–40% silt. Higher gnatcatcher extinction probabilities wereassociated with closed, dense habitat; optimal conditions were between 30% and 40% openness, creating a slightlyclosed canopy. Open habitat was associated with southern aspects, shallow slopes, and inland areas. Anunderstanding of the soil types and physical parameters of the environment that affect vegetation, especially theamount of coastal sagebrush needed for high gnatcatcher occupancy and colonization rates, will help to definerestoration target conditions. Using multiseason, occupancy-based surveys in conjunction with detailed habitatmeasurements will allow ornithologists and land managers to design powerful restoration prescriptions, even withinnarrowly defined ecosystems.
Keywords: California Gnatcatcher, coastal sage scrub, colonization, extinction, restoration, habitat
Restauracion del habitat costero de Polioptila californica californica
RESUMENUno de los objetivos de los Planes de Conservacion de Habitat es proteger poblaciones viables de especies animales.Las acciones de manejo incluidas en dichos planes a menudo se enfocan en la restauracion de la vegetacion parabeneficiar las especies animales seleccionadas. Sin embargo, tales actividades de restauracion a menudo no cuentancon informacion de base derivada de censos de animales a escala fina. Usando la especie Polioptila californicacalifornica, demostramos como los datos de censos pueden orientar la restauracion hacia el objetivo de mejorar laviabilidad de P. c. californica mediante la identificacion de las condiciones del habitat mas favorables para la ocupacionde esta especie. Descubrimos que la presencia de P. c. californica y las probabilidades de colonizacion se triplicaron amedida que la cobertura de Artemisia californica aumento de 10% a 40%. A. californica presento una mayorprobabilidad de estar presente en las elevaciones mas bajas y se asocio mas estrechamente con la textura del suelocon 5% a 20% de arcilla, 40% a 70% de arena y 20% a 40% de limo. Las mayores probabilidades de extincion de P. c.californica estuvieron asociadas con habitats densos y cerrados; las condiciones optimas de apertura fueron de 30% a40%, creando un dosel ligeramente cerrado. El habitat abierto se asocio con las orientaciones sur, laderas pocoprofundas y areas de interior. Comprender los tipos de suelo y los parametros fısicos del entorno que afectan a lavegetacion, especialmente la cantidad de A. californica necesaria para altas tasas de ocupacion y colonizacion porparte de P. c. californica, ayudaran a definir las condiciones de restauracion deseadas. El uso de censos basados en laocupacion de varias estaciones, en conjunto con mediciones detalladas del habitat, permiten a los ornitologos yadministradores territoriales disenar prescripciones de restauracion potentes, incluso dentro de ecosistemasestrechamente definidos.
Palabras clave: colonizacion, extincion, habitat, matorral costero de Artemisia californica, Polioptila californicacalifornica, restauracion
Q 2018 American Ornithological Society. ISSN 0010-5422, electronic ISSN 1938-5129Direct all requests to reproduce journal content to the AOS Publications Office at [email protected]
Downloaded From: https://bioone.org/journals/The-Condor on 09 May 2020Terms of Use: https://bioone.org/terms-of-use

INTRODUCTION
Implementation of Habitat Conservation Plans is com-
monly used to aid the recovery and persistence of species
of concern (Kareiva et al. 1999). Monitoring of animal
population trends is required to assess the effectiveness of
these plans (Noss et al. 1997, Case and Fisher 2001). Even
so, a disconnect exists between an understanding of the
indirect effects of environmental factors that influence
vegetation communities and the optimization of condi-
tions for target species. Although habitat suitability models
developed using broad-scale data, such as remote sensing,
are useful for planning purposes, restoration projects,
where the goal is the recovery of populations, are most
effective when models are refined using covariates that
vary at a smaller scale relative to species occupancy
patterns in the field. For example, breeding sites selected
for Black Terns (Chlidonias niger) using only landscape
suitability indices had ,20% occupancy (Wyman and
Cuthbert 2016). In contrast, Taillie et al. (2015) used both
local and landscape level predictors to explain the
distribution patterns of Bachman’s Sparrows (Peucaea
aestivalis), and showed that small prescribed burns to
control the density of high grass increased the predictedoccupancy probability to 75%. This disconnect of scale
between landscape-level planning and site-specific resto-
ration often leaves a wide gap between vertebrate
conservation and ecological restoration (Cabin 2007,
Cabin et al. 2010, DeSimone 2013). Our goal was to lessen
this gap by demonstrating an approach that provides
guidance for restoring vegetation to benefit animals
covered under conservation plans. As a case study, we
focused on Habitat Conservation Plans for southern
California that aim to preserve or restore habitat for the
coastal California Gnatcatcher (Polioptila californica
californica).
In southern California, the gnatcatcher serves as an
umbrella and flagship species for many Habitat Conserva-
tion Plans (R.J. Meade Consulting 1996, San Diego County
1998, Dudek Consulting 2006). Past work (Winchell and
Doherty 2008, 2014, TAIC 2002) has studied gnatcatcher
occupancy as a function of climatic and landscape variables,
but this work is of limited utility to restoration ecologists
because of the coarse scale of inference. Nonetheless, from
these studies we understand that gnatcatcher distribution
west of the Peninsular Range Provinces (coastal mountains)
is limited by steep slopes, too much precipitation, low
temperatures, and high elevations. Thus, colonization is
greater on relatively gentle slopes with dry, warm climates
that occur mainly at comparatively low elevations. In
addition, gnatcatcher occupancy has been found to be
strongly dependent on the presence of coastal sagebrush
(Artemisia californica; Bontrager 1991, Beyers and Wirtz
1997, Atwood et al. 1998).
Preserving and restoring coastal sagebrush has been a
key component of actions to improve the viability of the
gnatcatcher in southern California, but gnatcatcher
monitoring activities have not been directly linked to
coastal sagebrush restoration activities (e.g., Winchell and
Doherty 2008, 2014). Questions about the optimal spacing
and density of coastal sagebrush for gnatcatcher presence,
whether nonnative plants affect gnatcatcher presence, and
what vegetation characteristics are related to gnatcatcher
occupancy, colonization, and extinction all need answers.
Identifying suitable locales for restoring coastal sagebrush,
and thus gnatcatchers, is the next step. In particular,
identifying combinations of aspect, slope, and soil type that
are most likely to produce optimal vegetation conditions
can focus restoration. Our goal was to guide restoration at
a scale relative to habitat usage by nesting pairs of
gnatcatchers. We measured biological and environmental
parameters to determine what covariates maximized
sustained occupancy by gnatcatchers. Our objectives were
to analyze gnatcatcher occupancy dynamics (occupancy,
local colonization, and extinction) in relation to habitat
covariates (e.g., vegetation and soil types) at a finer scale
than has been done with previous models. This informa-
tion can guide land managers toward more effective
restoration and maintenance of gnatcatcher habitat.
METHODS
We worked within San Diego County, California, USA, on
lands designated as public or quasi-public, and on some
military lands (Figure 1). In general, the area included
preserve lands regulated under Habitat Conservation
Plans, other public lands designated as open space and
regulated by local jurisdictions, and lands separately
managed by Marine Corps Air Station Miramar or Naval
Weapons Station Seal Beach, Detachment Fallbrook. All
lands had some component that was distinctly managed
for gnatcatcher conservation. Marine Corps Base Camp
Pendleton, private lands, and Tribal lands were excluded
from the sampling frame because of access limitations,
logistic difficulties, and liability concerns.
We collected data on gnatcatchers and their habitat in
2004, 2007, and 2009 as part of the San Diego Multiple
Species Conservation Program (San Diego County 1998).
Each study year recorded below average rainfall for San
Diego County. During our entire survey time frame, only
2005 had above average rainfall. Because we sought to use
fine-scale data for our occupancy analyses, we focused on
areas that were within strata labeled as high or very high
quality by TAIC (2002), were generally within the preferred
climatic and landscape conditions identified by previous
analyses (Winchell and Doherty 2014), and were located
where gnatcatchers were more likely to occur. These strata
represented habitat covering 22,230 ha. In 2007, our study
The Condor: Ornithological Applications 120:581–595, Q 2018 American Ornithological Society
582 California Gnatcatcher habitat preferences C. S. Winchell and P. F. Doherty, Jr.
Downloaded From: https://bioone.org/journals/The-Condor on 09 May 2020Terms of Use: https://bioone.org/terms-of-use

area experienced a massive wildfire, reducing our area to
14,150 ha and our sample size to 76 survey point locations
that were unburned and thus still likely to have
gnatcatchers. Bird survey details have been previously
described (Winchell and Doherty 2008, 2014); in brief,
point locations were surveyed for gnatcatchers for 15 min
during 5–6 visits each year during the breeding season. We
included gnatcatcher observations within 50 m of survey
points, with distance determined using a rangefinder. From
these data, multiple season robust design occupancy
encounter histories were constructed (MacKenzie et al.2003), from which gnatcatcher occupancy, local coloniza-
tion, local extinction, and detection probabilities were
estimated.
In 2007, we collected habitat data along two 50-m
transects centered on each of the 76 survey points. The
first transect was along a random azimuth, establishing a
50-m radius, whereas the second transect was along a
random azimuth at least 6458 from the first transect. We
conducted habitat measurements every 2 m along each
transect for a total of 50 sampling locations associated with
each gnatcatcher survey point. At each of the 50 locations,
we recorded the presence of any vegetation, as well as the
presence of individual grass, herb, shrub, and tree species.
We summarized these data as the proportion of the 50
locations at which no plant species occurred, the
proportion at which a particular plant species or growthform (grass, herb, shrub, tree) occurred, as well as whether
a plant species was detected at any of the locations. We
also collected a soil sample at each survey point, from
which we derived the percentage of clay, sand, and silt
(Bouyoucos 1962, Gee and Bauder 1979). Additionally, we
collected soil samples at the end of each transect to
determine whether soil texture was homogeneous within
our 50-m radius area.
Predictions and AnalysisWe first tested predictions concerning gnatcatcher occu-
pancy, colonization, extinction, and detection probabilities.
Specifically, we thought that gnatcatcher occupancy and
colonization probabilities would be positively associated
with, and extinction probability would be negatively
associated with, the proportion of coastal sagebrush
coverage (ARCA; Figure 2). We also anticipated an optimal
intermediate level of coastal sagebrush coverage, so we
included a quadratic term for the proportion of coastal
sagebrush (ARCA2; Figure 2). Similarly, we predicted that
higher proportional coverage of invasive nonnative grasses
or herbs, such as black mustard (Brassica nigra) and stork’s
bill (Erodium spp.), would be negatively associated with
gnatcatcher occupancy and colonization probabilities, and
positively associated with extinction probability, because
invasives may compete for water with germinating native
plants and may provide cover for predators. We predicted
that higher proportional coverage of black sage (Salvia
mellifera; SAME) would be negatively associated with
gnatcatcher occupancy and colonization probabilities but
positively associated with extinction probability were
gnatcatchers to be averse to using black sage due to its
dense structure and limited forage (Robinson and Holmes1982, Roach 1989). We predicted that the presence of
laurel sumac (Malosma laurina; MALA) would be
positively associated with gnatcatcher occupancy and
colonization, but negatively with gnatcatcher extinction,
because laurel sumac is frost intolerant (Riggan et al. 1994)
and gnatcatchers are sensitive to temperatures below 4.58C
(Root 1988, Mock 1998); thus, we viewed MALA as a fine-
scale indicator of temperatures. We predicted that
gnatcatchers might prefer more openness (proportion of
locations with no trees or shrubs; Atwood and Bontrager
2001) in their territories (Figure 2). Thus, we thought that
openness would be positively associated with occupancy
and colonization probabilities and negatively associated
with extinction probability, as gnatcatchers frequently
forage for tiny insects by flying between shrubs rather
than hopping from shrub to shrub, and can probably not
forage as efficiently in dense vegetation. None of these
predictor variables were correlated (r . j0.47j), and, sinceall were proportions or binomial, we did not rescale the
variables prior to analysis. Based on past analyses
(Winchell and Doherty 2014), we predicted that detection
probability would be constant among years (t); we tested
this prediction by including constant and annually variable
detection structures in our modeling efforts.
FIGURE 1. Map shows San Diego County shaded in tan. Landsmodelled as Very High and High quality California Gnatcatcherhabitat is marked as black for unburned and dark gray habitatthat burned during 2003 and 2007 wildfires. The black outline inthe southwest corner is the boundary of the San Diego MultipleSpecies Conservation Program area within which are randomlypositioned 76 sample points, marked as yellow dots.
The Condor: Ornithological Applications 120:581–595, Q 2018 American Ornithological Society
C. S. Winchell and P. F. Doherty, Jr. California Gnatcatcher habitat preferences 583
Downloaded From: https://bioone.org/journals/The-Condor on 09 May 2020Terms of Use: https://bioone.org/terms-of-use

We incorporated the above predictions into models
using the dynamic occupancy model of Mackenzie et al.
(2003) in program MARK (White and Burnham 1999).
This model permits estimates of occupancy, colonization,
extinction, and detection probabilities. If occupancy at
time t, colonization, and extinction are estimated, then
occupancy at time tþ 1 can be derived. Thus, we estimated
the initial occupancy probability (in 2004), as well as time-
specific colonization and extinction probabilities, and
derived future occupancy estimates. Our surveys did not
occur at equal intervals (i.e. 2004, 2007, and 2009), so we
standardized the modeling and estimation of colonization
and extinction between surveys on an annual basis.We had
to assume that annual colonization and extinction
probabilities were identical within survey intervals because
of the lack of intervening survey data. For example, we had
to assume that the colonization probabilities from 2007 to
2008 and from 2008 to 2009 were the same. Considering
the above parameters, hypotheses, and limitations, we
constructed 92 submodels for colonization, 92 submodels
for extinction, 46 submodels for occupancy, and 2
submodels for detection.
Model building and selection is challenging when using
models with numerous submodels (e.g., occupancy,
colonization, extinction, and detection) and many covar-
iates due to the large number of possible models (Doherty
et al. 2012, Bromaghin et al. 2013). To reduce the number
of models, we used a strategy similar to that of Bromaghin
et al. (2013) by focusing on a set of plausible submodels
and variables and combining these submodels in all
possible combinations to examine the effects of the
remaining covariates. We first focused on each parameter
(i.e. occupancy, colonization, extinction, and detection) by
holding the other 3 parameters constant. This procedure
forced the maximum amount of explainable variation intothe focal parameter. For each focal parameter, we
constructed models representing all possible additive
combinations of predictor variables for a balanced model
set and calculated cumulative Akaike model weights for
each predictor variable (Burnham and Anderson 2002).
Barbieri and Berger (2004) implied that variables with
.0.5 cumulative Akaike weights have meaningful rela-
tionships with parameters of interest; at this stage in our
analysis, we used a more liberal cutoff of 0.4 cumulative
Akaike weight to avoid eliminating variables. Using the
reduced set of predictor variables for each parameter, we
then constructed all possible additive combinations of
models across all parameters for a final, balanced model
set and used Akaike’s information criterion with small
sample size correction (AICc) for model selection and for
calculating cumulative Akaike weights for each predictor
variable. Following Barbieri and Berger (2004), and
maintaining our liberal 0.4 cumulative Akaike weight
cutoff for consistency, we defined the model that contained
FIGURE 2. Examples of proportional coastal sagebrush (Artemisiacalifornica) coverage found at our survey points used to identifyhabitat conditions favorable for California Gnatcatchers in southernCalifornia, USA: (A) Open habitat with very little coastal sagebrush.This survey point was never occupied by gnatcatchers during all 3survey years; (B) Closed habitat dominated by coastal sagebrush.This survey point was never occupied during all 3 survey years; and(C) Moderately open habitat with a diverse shrub community, ofwhich 30%–40% is composed of coastal sagebrush. This surveypoint was occupied by gnatcatchers during all 3 survey years.
The Condor: Ornithological Applications 120:581–595, Q 2018 American Ornithological Society
584 California Gnatcatcher habitat preferences C. S. Winchell and P. F. Doherty, Jr.
Downloaded From: https://bioone.org/journals/The-Condor on 09 May 2020Terms of Use: https://bioone.org/terms-of-use

all independent variables with �0.4 cumulative Akaike
weight as our predictor model from which to produce
estimates.
The above analyses identified which vegetation param-
eters were correlated with gnatcatcher occupancy, coloni-
zation, and extinction probabilities. Understanding how
vegetation is correlated with soil type and other variables
can help to identify ideal locations for restoration, so we
focused on explaining variation in the presence of coastal
sagebrush, laurel sumac, and openness (i.e. lack of trees or
shrubs). We focused on the 5 vegetation sampling
locations along each transect nearest to our center-point
soil sample, instead of all sampling locations, because we
found that soil texture differed at the end of at least one
transect at 17% of our survey points. We viewed the 10
locations as repeated vegetation measures associated with
each center point and used a repeated measures logistic
regression in which the dependent variable was the
presence or absence of the plant species of interest. As
independent variables, we considered soil texture, aspect,
slope, elevation, and distance to the coast of the center
point. Because soil texture has 3 components (percent clay,
percent sand, percent silt) that sum to 100%, the 3 values
are not independent. We followed Aitchison’s (1986)
advice for analyzing such compositional data: We used a
log-ratio transformation of percent clay and percent sand
relative to percent silt because percent silt showed the least
variation across our sampled points. Aspect (degrees) can
influence vegetation through the amount of solar radiation
(Kirkby et al. 1990), so we transformed our aspect
measures by taking the cosine of the radian to address
the circular nature of the degree measurement, thus
equalizing the gradient in aspect in both directions of
north (Beers et al. 1966, McCune and Keon 2002). We
thought that elevation (m), slope (degrees), and distance to
the coast (m; because of the fog that can develop) could
predict where particular plant species grow. We construct-
ed all possible additive combinations of predictor variables
and relied upon AICc for model selection and for
calculating cumulative Akaike weights for each predictor
variable. We report estimates and standard errors (SE)
unless otherwise noted.
RESULTS
Using gnatcatcher survey data (summarized in Appendix
Table 4), our first set of analyses focused on each
parameter (occupancy, colonization, extinction, and de-
tection) separately and helped to reduce the number of
predictor variables for further modeling. We identified
ARCA, ARCA2, openness, and MALA as relevant for
further analysis of occupancy; ARCA and year for analysis
of colonization; ARCA, openness, MALA, and year for
analysis of extinction; and year for analysis of detection
(Table 1). We then constructed all possible combinations
of these variables for our final model set and calculated
cumulative Akaike model weights for each variable (Table
2). Influential predictors were ARCA, ARCA2, openness,
and MALA for occupancy; ARCA and year for coloniza-
tion; and openness and MALA for extinction (Table 2).
We found that gnatcatcher occupancy probability
increased with proportional coastal sagebrush coverage
(Figure 3), with .30% coastal sagebrush coverage resulting
in high occupancy probabilities. Occupancy was slightly
negatively associated with the proportion of openness (i.e.
lack of trees and shrubs; b ¼�1.95 6 1.46) and with the
presence of laurel sumac (b¼�0.92 6 0.68). Colonization
probability increased with proportional coastal sagebrush
coverage (Figure 4). Gnatcatcher colonization probability
was greater in 2007–2009 than in 2004–2007. Extinction
probability was negatively correlated with openness
(Figure 5) and increased with the presence of laurel sumac
TABLE 1. Cumulative Akaike model weights for each variable used to model the occupancy, colonization, extinction, and detectionrates of California Gnatcatchers in San Diego County, California, USA, in relation to habitat parameters. We constructed all possibleadditive combinations of variables for each parameter while holding the other 3 parameters constant. Variables with cumulativeweights .0.4 were used in further modeling. ARCA is the proportion of 50 transect intersections (‘locations’) associated with eachgnatcatcher survey point (‘point’) with coastal sagebrush (Artemisia californica) as a linear term, and ARCA2 is a quadratic model;Openness is the proportion of locations at a point with no vegetation; Invasive is the proportion of locations at a point withnonnative grasses (black mustard [Brassica nigra] or stork’s bill [Erodium spp.]); SAME is the proportion of locations at a point withblack sage (Salvia mellifera); MALA is the proportion of locations at points with laurel sumac (Malosma laurina) present (0¼ absent, 1¼ present). The range of values appears in parentheses after the variable name. Asterisks (*) denote that variables were notconsidered for a particular parameter. Appendix Table 5 shows the top 10 models for each parameter.
ParameterARCA
(0.00–0.37) ARCA2Openness(0.02–0.99)
Invasive(0.00–0.10)
SAME(0.00–0.63)
MALA(0, 1)
Year(2004–2009)
Occupancy 0.44 0.43 0.50 0.34 0.37 0.43 §
Colonization 0.60 0.35 0.15 0.29 0.30 0.21 0.86Extinction 0.54 0.20 0.75 0.28 0.28 0.41 0.51Detection * * * * * * 0.51
§ Occupancy was estimated for the first year and derived in future years with estimates of extinction and colonization.
The Condor: Ornithological Applications 120:581–595, Q 2018 American Ornithological Society
C. S. Winchell and P. F. Doherty, Jr. California Gnatcatcher habitat preferences 585
Downloaded From: https://bioone.org/journals/The-Condor on 09 May 2020Terms of Use: https://bioone.org/terms-of-use

(b¼ 1.16 6 0.76). The detection probability of gnatcatch-
ers was 0.42 6 0.03 per survey visit.
Following the above analysis, we investigated how the
presence of coastal sagebrush, openness, and laurel sumac
depended on soil texture, aspect, slope, elevation, and
distance to the coast. We found that soil texture and
elevation were useful predictors of the amount of coastal
sagebrush coverage. Aspect, slope, and distance to the
coast all had cumulative Akaike weights greater than 0.40
for predicting openness. None of our variables were useful
predictors of laurel sumac presence (Table 3).
We primarily found coastal sagebrush in soil textures
ranging from 5% to 20% clay, 40% to 70% sand, and 20% to
40% silt. These soils were more likely to be present at low
elevations, although the relationship with elevation was
not strong (b ¼ �0.003 6 0.003). Openness (absence of
trees and shrubs) declined on steep slopes (Figure 6) and
had a weak positive relationship with aspect (b¼ 0.305 6
0.248). Upon further examination, distance to the coast
was found to be an uninformative parameter (Arnold 2010;
b ¼ 0.269E-4 6 0.201E-4).
DISCUSSION
Our results support the observation that coastal sagebrush
strongly influences gnatcatcher presence (Figure 3; At-
wood and Bontrager 2001). In turn, coastal sagebrush
presence is influenced by soil texture and elevation. We
also found that gnatcatcher colonization probabilities were
most closely associated with coastal sagebrush (Figure 4).
These results give some insight into the dynamic processes
underlying gnatcatcher population dynamics. We found
that gnatcatcher occupancy (Figure 3) and colonization
(Figure 4) increased with coastal sagebrush coverage and
were highest with coastal sagebrush coverage of 30%–40%
of the plant community, the maximum values recorded at
our sites. Restorationists might try to artificially increase
coastal sagebrush coverage above 40% through plant pallet
composition and irrigation, but we caution against such an
approach as this may not be a situation found in natural
TABLE 2. Cumulative Akaike model weights for each variableused to model the occupancy, colonization, extinction, anddetection rates of California Gnatcatchers San Diego County,California, USA, in relation to habitat conditions, from modelswith all possible additive combinations of the variables. SeeTable 1 for variable codes. Asterisks (*) denote that variableswere not considered for a particular parameter. The modelcontaining all variables with �0.4 cumulative Akaike weight wasthe predictor model used in Figures 2–4. Appendix Table 6shows the models with DAICc , 2.
Parameter ARCA ARCA2 Openness MALA Year
Occupancy 0.44 0.42 0.40 0.40 §
Colonization 0.94 * * * 0.80Extinction 0.29 * 0.82 0.49 0.30Detection * * * * 0.27
§ Occupancy was estimated for the first year and derived infuture years with estimates of extinction and colonization.
TABLE 3. Cumulative Akaike model weights for independentvariables used to investigate the presence of coastal sagebrush(Artemisia californica; ARCA), laurel sumac (Malosma laurina;MALA), and the absence of trees and shrubs (Openness) atCalifornia Gnatcatcher survey points in San Diego County,California, USA. We constructed all possible additive combina-tions of independent variables for each dependent variable for abalanced model set. The range of values appears in parenthesesafter each variable name. Appendix Table 7 shows the top 10models for each dependent variable.
Dependentvariable
Soiltexture
Elevation(24–386
m)Aspect
(0–3608)Slope
(0–358)
Distanceto coast
(1.37–34.35km)
ARCA 1.00 0.43 0.31 0.32 0.29MALA 0.34 0.39 0.35 0.38 0.37Openness 0.14 0.37 0.45 0.96 0.42
FIGURE 3. Occupancy (6 1 SE) of surveyed points by CaliforniaGnatcatchers increased with the proportion of coastal sagebrush(Artemisia californica) present in southern California, USA.
FIGURE 4. Colonization of unoccupied habitat by CaliforniaGnatcatchers increased with the proportion of coastal sagebrush(Artemisia californica) present in southern California, USA, andwas greater in 2007–2009 than in 2004–2007.
The Condor: Ornithological Applications 120:581–595, Q 2018 American Ornithological Society
586 California Gnatcatcher habitat preferences C. S. Winchell and P. F. Doherty, Jr.
Downloaded From: https://bioone.org/journals/The-Condor on 09 May 2020Terms of Use: https://bioone.org/terms-of-use

communities (Sproul et al. 2011). Instead, coastal sage-
brush coverage of at least 30% might be a good target for
restoration activities. In addition, we found that coastal
sagebrush presence was most closely associated with a soil
texture of low clay, moderate sand, and moderate silt, a
type of soil most likely to be found at low elevations.
Identifying highly suitable locations for sagebrush and
testing soil texture prior to restoration will likely lead to
increased probabilities of coastal sagebrush restoration
success. Gnatcatcher extinction probability was highest in
dense vegetation (Figure 5). Restoration activities close to
the coast and on slopes less than 208 (Figure 6) are likely to
lead to vegetation characteristics preferred by gnatcatch-
ers. Sites with these characteristics have extinction
probabilities ,50%. We recommend that land managers
evaluate the physical parameters of the ecosystem, namely
soil, slope, and elevation, and use these factors to predict
where coastal sagebrush will best thrive and thereby
provide habitat for gnatcatchers. Although we focused on
occupancy and related parameters to define important
habitat used by birds, other demographic parameters such
as abundance, survival, and reproduction should also be
considered. However, demographic parameters are often
difficult to estimate. In the absence of such parameter
estimates, especially when management funds are limited
and disjointed, we believe that relying on occupancy-
related parameters can lead to successful restoration.
One of our original predictions was that laurel sumac
would be positively correlated with occupancy because
gnatcatchers are frost intolerant. We found the opposite:
Gnatcatcher extinction probability increased with the
presence of laurel sumac. This result may have been a
factor of scale and location. Gnatcatcher occupancy
increased closer to the coast. Near the coast, laurel sumac
is located on moist, cool, northern-aspect slopes (Holland
1986, Bartolome et al. 2007) and is a primary component
of chaparral-type communities, where gnatcatchers have
low occupancy probabilities (Winchell and Doherty 2008).
Inland, laurel sumac sparsely populates midelevation
valleys where coastal sage scrub occurs and frost is a rare
event. Laurel sumac may be a good indicator of
gnatcatcher habitat in areas away from the coast; however,
such areas are limited as interior land was converted to
avocado farms early in the 20th century (Coit 1963,
Shepherd and Bender 2001).
The composition of other shrubs may not be as
significant as the presence of coastal sagebrush for
gnatcatcher habitat. We found that our predictions
pertaining to invasive plants and black sage were not
supported, perhaps because other plants in the commu-
nities dominated by coastal sagebrush can be quite variable
For example, Westman (1981) found a high degree of
variability in species diversity in coastal sage scrub plant
communities. Eastern Mojave buckwheat (Eriogonum
fasciculatum), the second most dominant plant in coastal
sage scrub (Roach 1989), is not necessarily present in sites
used by gnatcatchers (Atwood 1990). However, all of
Atwood’s (1990) sites contained coastal sagebrush. De-
creased diversity of perennials may increase nest success,
at least within plots with a certain amount of perennial
heterogeneity (Braden et al. 1997).
Although we found that gnatcatcher occupancy proba-
bility slightly increased as the proportion of openness
decreased and cover became denser, a stronger relation-
ship existed with extinction probability: Gnatcatcher
extinction probability was highest in the least open sites,
and exceeded 50% with openness ,30% (Figure 5).
Bontrager (1991) and Braden et al. (1997) reported that
areas of dense vegetation had fewer gnatcatchers, and that
fledging success increased with increasing cover of grasses
and forbs. For restoration, it may be important to balance
extinction probability and occupancy probability with a
shrub density between 30% and 40% openness, maintain-
ing a slightly closed canopy. Managing openness requires
constant maintenance, such as cutting or prescribed fire.
FIGURE 5. The extinction (6 1 SE) probability for CaliforniaGnatcatchers decreased with an increasing proportion ofopenness (i.e. lack of trees and shrubs) in southern California,USA.
FIGURE 6. The probability (6 1 SE) of openness (no trees orshrubs) declined on steep slopes in southern California, USA.
The Condor: Ornithological Applications 120:581–595, Q 2018 American Ornithological Society
C. S. Winchell and P. F. Doherty, Jr. California Gnatcatcher habitat preferences 587
Downloaded From: https://bioone.org/journals/The-Condor on 09 May 2020Terms of Use: https://bioone.org/terms-of-use

Once the desired shrub density is established, we
recommend maintaining 40% coastal sagebrush composi-
tion within the shrub community.
Coastal sage scrub is associated with steeper topography,
with grasslands in flatter areas (Westman 1982, Bartolome
et al. 2007). This relationship may explain the association
that we found between slope and openness, wherein
steeper slopes were less open. Areas with slopes .208 had
,50% probability of being open (Figure 6). None of our
sites had slopes greater than 35%; steep slopes in
Mediterranean climates tend to be highly erodible
(Morgan 2005) and unable to support stable plant
communities such as coastal sage scrub. We did not
sample these steep slopes, as they did not include scrub
vegetation.
Restoration projects in coastal sage scrub habitats
should start with targeting loam or sandy loam soils.
Loamy sands should be given a lower priority and clay soils
(clay loam, sandy clay loam, and sandy clay) should
generally be avoided. Next, low-elevation sites with
southern exposures should be given priority. Sites with
elevations ,100 m have a .50% chance of coastal
sagebrush being present. If low-elevation sites, which are
typically nearer to the coast, are not available, then sites
with sparse laurel sumac could be restored, as gnatcatchers
are limited by winter temperatures below 1.18C (Root
1988). Finally, areas with greater topographic relief should
be selected over flatter areas because steeper areas are
associated with coastal sage scrub. Communities domi-
nated by coastal sagebrush should be a goal of restoration
for gnatcatchers. Areas should be managed to maintain
30%–40% coastal sagebrush coverage, thus revegetative
plantings should be dominated by coastal sagebrush, but
include a diversity of other shrubs found in occupied sites,
such as Eastern Mojave buckwheat, torhleaf goldeneye
(Viguiera laciniata), common deerweed (Lotus scoparius),
coyotebrush (Baccharis pilularis), laural sumac, or black
sage.
Habitat Conservation Plans (HCP) are predicated on
maintaining viable populations of animal species of
concern, with management actions focused on supporting
this goal. In southern California, HCPs have been
established to maintain flagship or umbrella species that
represent the rich biodiversity of the California Floristic
Province (Myers et al. 2000). As in many other systems,
vegetation restoration is a common management action,
but is seldom informed by animal survey data. Our results
demonstrate how occupancy surveys combined with
vegetation and abiotic measurements can inform both site
selection and management actions that may be beneficial
to California Gnatcatchers and potentially the diverse suite
of species under the umbrella of their HCP.
ACKNOWLEDGMENTS
We thank the .50 people who were involved with this
project, unselfishly giving their time and talents.
Funding statement: The majority of this work was funded
under San Diego Association of Governments Agreement No.
5000793, with funds provided via local TRANSNET tax. The
findings and conclusions in this article are those of the
author(s) and do not necessarily represent the views of the
U.S. Fish and Wildlife Service (USFWS).
Ethics statement: The authors complied with USFWS 212
FW 1 Standards of Conduct while conducting all aspects of
this work.
Author contributions: Both authors contributed to all
aspects of the study.
Data deposits: Data are deposited with the California
Department of Fish and Wildlife BIOS database, USGS
regional database, San Diego Association of Governments
website, and the USFWS Carlsbad Fish and Wildlife Office.
Office data files are available for public access upon request.
LITERATURE CITED
Aitchison, J. (1986). The Statistical Analysis of CompositionalData. Chapman and Hall, London, UK.
Atwood, J. (1990). Status Review of the California Gnatcatcher(Polioptila californica). Manomet Bird Observatory, Manomet,MA, USA.
Atwood, J. L., and D. R. Bontrager (2001). California Gnatcatcher(Polioptila californica), version 2.0. In The Birds of NorthAmerica (A. F. Poole and F. B. Gill, Editors). Cornell Lab ofOrnithology, Ithaca, NY, USA. https://doi.org/10.2173/bna.574
Atwood, J. L., S. H. Tsai, C. A. Reynolds, and M. R. Fugagli (1998).Distribution and population size of California Gnatcatcherson the Palos Verdes Peninsula, 1993–1997. Western Birds 29:340–350.
Barbieri, M. M., and J. O. Berger (2004). Optimal predictive modelselection. Annals of Statistics 32:870–897.
Bartolome, J. W., W. J. Barry, T. Griggs, and P. Hopkinson (2007).Valley grassland. In Terrestrial Vegetation of California, thirdedition (M. G. Barbour, T. Keeler-Wolf, and A. A. Schoenherr,Editors). University of California Press, Berkeley, CA, USA. pp.367–393.
Beers, T. W., P. E. Dress, and L. C. Wensel (1966). Notes andobservations: Aspect transformation in site productivityresearch. Journal of Forestry 64:691–692.
Beyers, J. L., and W. O. Wirtz, II (1997). Vegetative characteristicsof coastal sage scrub sites used by California Gnatcatchers:Implications for management in a fire-prone ecosystem. InFire Effects on Rare and Endangered Species and Habitats.Proceedings of a conference held in Coeur d’Alene, Idaho,November 13–16, 1995 (J. M. Greenlee, Editor). InternationalAssociation of Wildland Fire, Fairfield, WA, USA. pp. 81–89.
Bontrager, D. R. (1991). Habitat requirements, home range andbreeding biology of the California Gnatcatcher (Polioptilacalifornia) in south Orange County, California. Unpublishedtechnical report prepared for the Santa Margarita Company,Rancho Santa Margarita, CA, USA.
The Condor: Ornithological Applications 120:581–595, Q 2018 American Ornithological Society
588 California Gnatcatcher habitat preferences C. S. Winchell and P. F. Doherty, Jr.
Downloaded From: https://bioone.org/journals/The-Condor on 09 May 2020Terms of Use: https://bioone.org/terms-of-use

Bouyoucos, G. J. (1962). Hydrometer method improved formaking particle size analysis of soils. Agronomy Journal 54:464–465.
Braden, G. T., R. L. McKernan, and S. M. Powell (1997). Associationof within-territory vegetation characteristics and fitnesscomponents of California Gnatcatchers. The Auk 114:601–609.
Bromaghin, J. F., T. L. McDonald, and S. C. Amstrup (2013).Plausible combinations: An improved method to evaluate thecovariate structure of Cormack-Jolly-Seber mark-recapturemodels. Open Journal of Ecology 3:11–22.
Burnham, K. P., and D. R. Anderson (2002). Model Selection andMultimodel Inference: A Practical Information-TheoreticApproach, second edition. Springer-Verlag, New York, NY,USA.
Cabin, R. (2007). Science-driven restoration: A square grid on around earth? Restoration Ecology 15:1–7.
Cabin, R. J., A. Clewell, M. Ingram, T. McDonald, and V.Temperton (2010). Bridging restoration science and practice:Results and analysis of a survey from the 2009 Society forEcological Restoration International Meeting. RestorationEcology 18:783–788.
Case, T. J., and R. N. Fisher (2001). Measuring and predictingspecies presence: Coastal sage scrub case study. In SpatialUncertainty in Ecology: Implications for Remote Sensing andGIS Applications (C. T. Hunsaker, M. F. Goodchild, M. A. Friedl,and T. J. Case, Editors). Springer-Verlag, New York, NY, USA.pp. 47–71.
Coit, J. E. (1963). The California Avocado Society: A HistoricalSketch. Special Publication of the California Avocado Society,San Juan Capistrano, CA, USA.
DeSimone, S. A. (2013). Restoration and science: A practitioner/scientist’s view from rare habitat restoration at a southernCalifornia preserve. Restoration Ecology 21:149–152.
Doherty, P. F., G. C. White, and K. P. Burnham (2012). Comparisonof model building and selection strategies. Journal ofOrnithology 152 (Suppl. 2):317–323.
Dudek Consulting (2006). Southern Orange County subregionnatural community conservation plan/master streambedalteration agreement/habitat conservation plan. County ofOrange Planning and Development Services Department,Santa Ana, CA, USA.
Gee, G. W., and J. W. Bauder (1979). Particle size analysis byhydrometer: A simplified method for routine textural analysisand a sensitivity test of measurement parameters. SoilScience Society of America Journal 43:1004–1007.
Holland, R. F. (1986). Preliminary Descriptions of the TerrestrialNatural Communities of California. State of California, TheResources Agency, Department of Fish and Game, Sacra-mento, CA, USA.
Kareiva, P., S. Andelman, D. Doak, B. Elderd, M. Groom, J.Hoekstra, L. Hood, F. James, J. Lamoreux, G. LeBuhn, C.McCulloch, et al. (1999). Using Science in Habitat Conserva-tion Plans. National Center for Ecological Analysis andSynthesis, University of California, Santa Barbara, CA, USA,and American Institute of Biological Sciences, Washington,DC, USA.
Kirkby, M. J., K. Atkinson, and J. Lockwood (1990). Aspect,vegetation cover and erosion on semi-arid hillslopes. InVegetation and Erosion: Processes and Environments (J. B.
Tornes, Editor). John Wiley and Sons, Chichester, West Sussex,UK. pp. 25–39.
MacKenzie, D. I., J. D. Nichols, J. E. Hines, M. G. Knutson, and A. B.Franklin (2003). Estimating site occupancy, colonization, andlocal extinction when a species is detected imperfectly.Ecology 84:2200–2207.
McCune, B., and D. Keon (2002). Equations for potential annualdirect incident radiation and heat load. Journal of VegetationScience 13:603–606.
Mock, P. J. (1998). Energetic constraints to the distribution andabundance of the California Gnatcatcher. Western Birds 29:413–420.
Morgan, R. P. C. (2005). Soil Erosion and Conservation, thirdedition. John Wiley & Sons, New York, NY, USA.
Myers, N., R. A. Mittermeier, C. G. Mittermeier, G. A. B. daFonseca, and J. Kent (2000). Biodiversity hotspots forconservation priorities. Nature 403:853–858.
Noss, R. F., M. A. O’Connell, and D. D. Murphy (1997). TheScience of Conservation Planning: Habitat ConservationUnder the Endangered Species Act. Island Press. Washing-ton, DC, USA.
Riggan, P. J., S. E. Franklin, J. A. Brass, and F. E. Brooks (1994).Perspectives on fire management in Mediterranean ecosys-tems of southern California. Ecological Studies 107:140–162.
R.J. Meade Consulting (1996). Natural Community ConservationPlan & Habitat Conservation Plan: County of Orange Central& Coastal Subregion, Parts I & II: NCCP/HCP. Final(administrative record copy) report prepared for County ofOrange Environmental Management Agency, Santa Ana, CA,USA.
Roach, J. D. (1989). The influence of vegetation structure andarthropod abundance on the reproductive success ofCalifornia Black-tailed Gnatcatchers, Polioptila melanuracalifornica. M.S. thesis, San Diego State University, San Diego,CA, USA.
Robinson, S. K., and R. T. Holmes (1982). Foraging behavior offorest birds: The relationships among search tactics, diet, andhabitat structure. Ecology 63:1918–1931.
Root, T. (1988). Energy constraints on avian distributions andabundances. Ecology 69:330–339.
San Diego County (1998). Final Multiple Species ConservationProgram MSCP Plan. California Department of Fish andWildlife, Habitat Conservation Planning Branch, Sacramento,CA, USA. https://www.wildlife.ca.gov/Conservation/Planning/NCCP/Plans/San-Diego-MSCP
Shepherd, J., and G. Bender (2001). A history of the avocadoindustry in California. California Avocado Society Yearbook85:29–50.
Sproul, F., T. Keeler-Wolf, P. Gordon-Reedy, J. Dunn, A. Klein, andK. Harper (2011). Vegetation Classification Manual forWestern San Diego County. Prepared for San DiegoAssociation of Governments by AECOM, California Depart-ment of Fish and Game Vegetation Classification andMapping Program, and Conservation Biology Institute.
TAIC (Technology Associates International Corporation) (2002).California Gnatcatcher habitat evaluation model for USFWS.Digital Data. U.S. Fish and Wildlife Service, Carlsbad, CA, USA.
Taillie, P. J., M. N. Peterson, and C. E. Moorman (2015). Therelative importance of multiscale factors in the distribution ofBachman’s Sparrow and the implications for ecosystem
The Condor: Ornithological Applications 120:581–595, Q 2018 American Ornithological Society
C. S. Winchell and P. F. Doherty, Jr. California Gnatcatcher habitat preferences 589
Downloaded From: https://bioone.org/journals/The-Condor on 09 May 2020Terms of Use: https://bioone.org/terms-of-use

conservation. The Condor: Ornithological Applications 117:137–146.
Westman, W. E. (1981). Factors influencing the distribution ofspecies of Californian coastal sage scrub. Ecology 62:439–455.
Westman, W. E. (1982). Coastal sage scrub succession. InProceedings of the Symposium on Dynamics and Manage-ment of Mediterranean-Type Ecosystems (C. E. Conrad andW. C. Oechel, Technical Coordinators). USDA Forest ServiceGeneral Technical Report PSW-58. pp. 91–99.
White, G. C., and K. P. Burnham (1999). Program MARK: Survivalestimation from populations of marked animals. Bird Study46:S120–S139.
Winchell, C. S., and P. F. Doherty, Jr. (2008). Using CaliforniaGnatcatcher to test underlying models in Habitat Conserva-tion Plans. The Journal of Wildlife Management 72:1322–1327.
Winchell, C. S., and P. F. Doherty, Jr. (2014). Effects of habitatquality and wildfire on occupancy dynamics of CoastalCalifornia Gnatcatcher (Polioptila californica californica). TheCondor: Ornithological Applications 116:538–545.
Wyman, K. E., and F. J. Cuthbert (2016). Validation of landscapesuitability indices for Black Terns (Chlidonias niger) in the U.S.Great Lakes region. The Condor: Ornithological Applications118:613–623.
The Condor: Ornithological Applications 120:581–595, Q 2018 American Ornithological Society
590 California Gnatcatcher habitat preferences C. S. Winchell and P. F. Doherty, Jr.
Downloaded From: https://bioone.org/journals/The-Condor on 09 May 2020Terms of Use: https://bioone.org/terms-of-use

APPENDIX TABLE 4. Raw detection data (0¼ not detected, 1¼ detected) for coastal California Gnatcatchers (Polioptila californicacalifornica; CAGN) in 2004, 2007, and 2009 at survey points in San Diego County, California, USA, along with the associatedProportion Openness (the proportion of vegetation transect intercepts [‘locations’] at a gnatcatcher survey point [‘point’] with novegetation); Proportion invasive (the proportion of locations at a point with nonnative grasses, i.e. black mustard [Brassica nigra] orstork’s bill [Erodium spp.]); Proportion ARCA (proportion of locations at a point with coastal sagebrush [Artemisia californica]);Proportion SAME (proportion of locations at a point with black sage [Salvia mellifera]); and Presence of MALA (indicates whetherlaurel sumac [Malosma laurina] was present at any locations associated with points).
CAGNdetected2004
CAGNdetected
2007
CAGNdetected
2009Proportionopenness
Proportioninvasive
ProportionARCA
ProportionSAME
Presenceof MALA
0 0 0 0.99 0.04 0.01 0.00 00 0 0 0.29 0.00 0.06 0.11 10 1 1 0.77 0.00 0.05 0.00 10 0 1 0.75 0.00 0.16 0.00 00 0 1 0.26 0.00 0.14 0.32 11 0 0 0.37 0.00 0.02 0.24 10 0 1 0.31 0.00 0.00 0.01 00 1 1 0.61 0.00 0.15 0.00 10 0 1 0.20 0.00 0.01 0.63 10 0 0 0.89 0.02 0.00 0.00 01 0 0 0.38 0.02 0.25 0.00 10 0 0 0.24 0.00 0.00 0.16 11 0 1 0.02 0.01 0.14 0.00 10 0 0 0.54 0.03 0.03 0.00 00 0 0 0.78 0.01 0.02 0.05 01 1 1 0.36 0.00 0.00 0.11 00 0 0 0.44 0.00 0.09 0.03 01 0 1 0.23 0.00 0.01 0.06 00 0 0 0.20 0.00 0.00 0.21 00 0 0 0.09 0.00 0.06 0.09 00 0 0 0.69 0.06 0.08 0.00 10 0 0 0.68 0.06 0.01 0.00 11 0 1 0.35 0.07 0.02 0.00 10 0 0 0.47 0.08 0.09 0.00 10 0 0 0.34 0.00 0.00 0.15 10 0 0 0.35 0.00 0.02 0.14 00 0 0 0.45 0.00 0.00 0.11 10 0 0 0.55 0.00 0.00 0.20 00 0 0 0.31 0.00 0.00 0.05 10 1 1 0.44 0.00 0.15 0.02 00 1 0 0.44 0.00 0.22 0.01 10 1 0 0.42 0.02 0.08 0.00 10 0 0 0.33 0.00 0.14 0.21 11 1 1 0.64 0.03 0.14 0.00 01 0 1 0.19 0.00 0.09 0.04 00 0 0 0.64 0.06 0.02 0.00 01 1 1 0.44 0.02 0.35 0.02 11 1 1 0.46 0.10 0.25 0.11 11 0 1 0.42 0.00 0.11 0.00 10 0 0 0.53 0.01 0.01 0.00 10 0 0 0.10 0.00 0.03 0.21 10 0 0 0.69 0.07 0.02 0.00 10 0 1 0.30 0.00 0.07 0.00 10 0 0 0.40 0.02 0.04 0.00 10 0 1 0.37 0.03 0.13 0.01 10 1 0 0.50 0.00 0.07 0.00 10 0 0 0.41 0.01 0.10 0.00 10 0 0 0.51 0.00 0.26 0.00 10 0 0 0.93 0.08 0.02 0.00 00 0 0 0.56 0.01 0.09 0.00 10 0 1 0.32 0.02 0.09 0.00 11 0 1 0.22 0.00 0.37 0.00 11 0 0 0.55 0.01 0.07 0.00 0
The Condor: Ornithological Applications 120:581–595, Q 2018 American Ornithological Society
C. S. Winchell and P. F. Doherty, Jr. California Gnatcatcher habitat preferences 591
Downloaded From: https://bioone.org/journals/The-Condor on 09 May 2020Terms of Use: https://bioone.org/terms-of-use
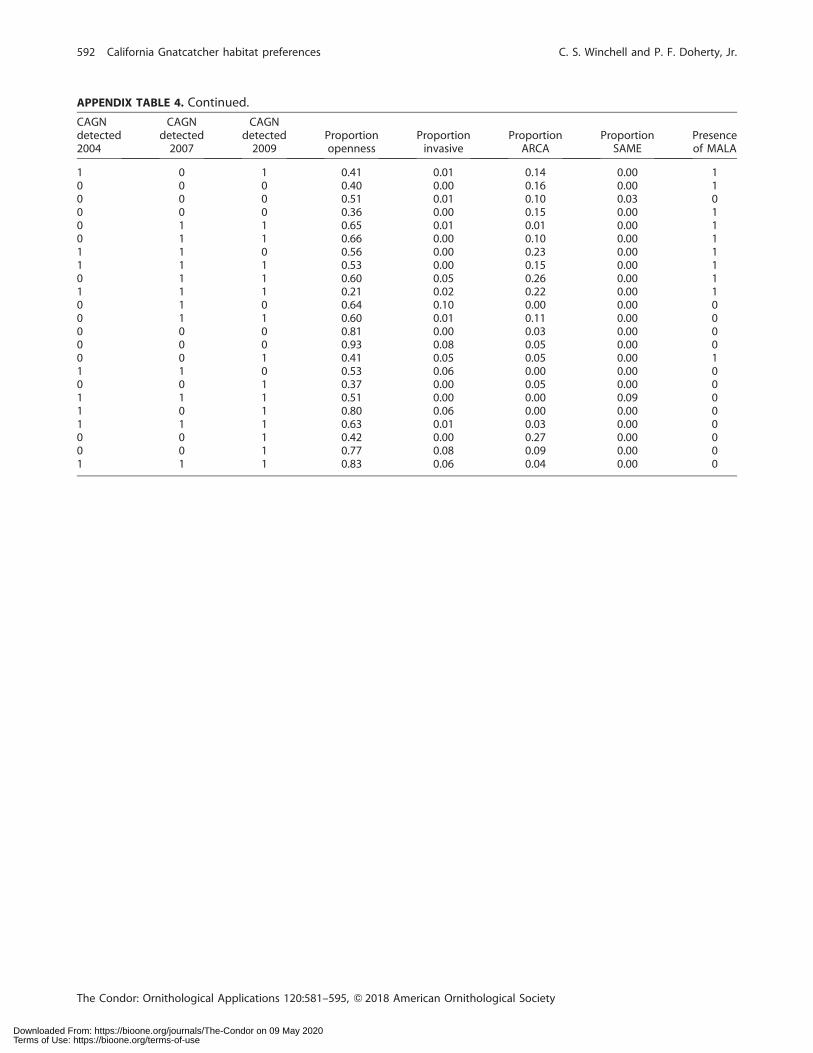
APPENDIX TABLE 4. Continued.
CAGNdetected2004
CAGNdetected
2007
CAGNdetected
2009Proportionopenness
Proportioninvasive
ProportionARCA
ProportionSAME
Presenceof MALA
1 0 1 0.41 0.01 0.14 0.00 10 0 0 0.40 0.00 0.16 0.00 10 0 0 0.51 0.01 0.10 0.03 00 0 0 0.36 0.00 0.15 0.00 10 1 1 0.65 0.01 0.01 0.00 10 1 1 0.66 0.00 0.10 0.00 11 1 0 0.56 0.00 0.23 0.00 11 1 1 0.53 0.00 0.15 0.00 10 1 1 0.60 0.05 0.26 0.00 11 1 1 0.21 0.02 0.22 0.00 10 1 0 0.64 0.10 0.00 0.00 00 1 1 0.60 0.01 0.11 0.00 00 0 0 0.81 0.00 0.03 0.00 00 0 0 0.93 0.08 0.05 0.00 00 0 1 0.41 0.05 0.05 0.00 11 1 0 0.53 0.06 0.00 0.00 00 0 1 0.37 0.00 0.05 0.00 01 1 1 0.51 0.00 0.00 0.09 01 0 1 0.80 0.06 0.00 0.00 01 1 1 0.63 0.01 0.03 0.00 00 0 1 0.42 0.00 0.27 0.00 00 0 1 0.77 0.08 0.09 0.00 01 1 1 0.83 0.06 0.04 0.00 0
The Condor: Ornithological Applications 120:581–595, Q 2018 American Ornithological Society
592 California Gnatcatcher habitat preferences C. S. Winchell and P. F. Doherty, Jr.
Downloaded From: https://bioone.org/journals/The-Condor on 09 May 2020Terms of Use: https://bioone.org/terms-of-use
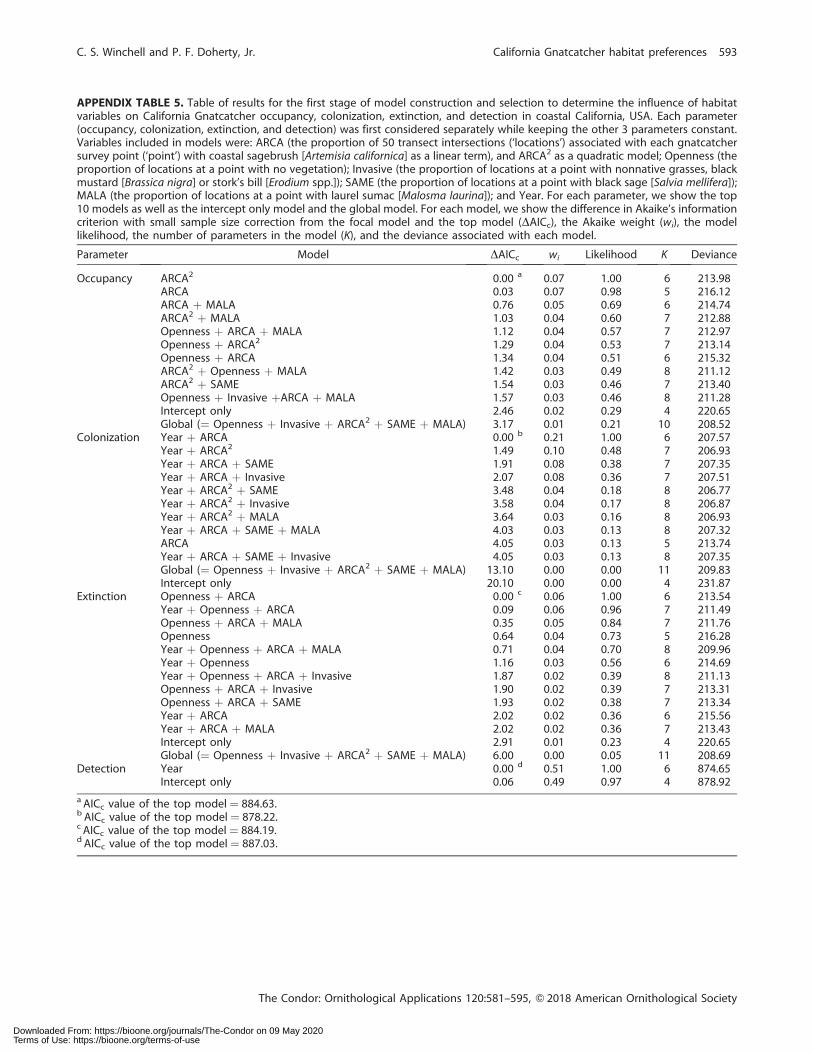
APPENDIX TABLE 5. Table of results for the first stage of model construction and selection to determine the influence of habitatvariables on California Gnatcatcher occupancy, colonization, extinction, and detection in coastal California, USA. Each parameter(occupancy, colonization, extinction, and detection) was first considered separately while keeping the other 3 parameters constant.Variables included in models were: ARCA (the proportion of 50 transect intersections (‘locations’) associated with each gnatcatchersurvey point (‘point’) with coastal sagebrush [Artemisia californica] as a linear term), and ARCA2 as a quadratic model; Openness (theproportion of locations at a point with no vegetation); Invasive (the proportion of locations at a point with nonnative grasses, blackmustard [Brassica nigra] or stork’s bill [Erodium spp.]); SAME (the proportion of locations at a point with black sage [Salvia mellifera]);MALA (the proportion of locations at a point with laurel sumac [Malosma laurina]); and Year. For each parameter, we show the top10 models as well as the intercept only model and the global model. For each model, we show the difference in Akaike’s informationcriterion with small sample size correction from the focal model and the top model (DAICc), the Akaike weight (wi), the modellikelihood, the number of parameters in the model (K), and the deviance associated with each model.
Parameter Model DAICc wi Likelihood K Deviance
Occupancy ARCA2 0.00 a 0.07 1.00 6 213.98ARCA 0.03 0.07 0.98 5 216.12ARCA þ MALA 0.76 0.05 0.69 6 214.74ARCA2 þ MALA 1.03 0.04 0.60 7 212.88Openness þ ARCA þ MALA 1.12 0.04 0.57 7 212.97Openness þ ARCA2 1.29 0.04 0.53 7 213.14Openness þ ARCA 1.34 0.04 0.51 6 215.32ARCA2 þ Openness þ MALA 1.42 0.03 0.49 8 211.12ARCA2 þ SAME 1.54 0.03 0.46 7 213.40Openness þ Invasive þARCA þ MALA 1.57 0.03 0.46 8 211.28Intercept only 2.46 0.02 0.29 4 220.65Global (¼ Openness þ Invasive þ ARCA2 þ SAME þ MALA) 3.17 0.01 0.21 10 208.52
Colonization Year þ ARCA 0.00 b 0.21 1.00 6 207.57Year þ ARCA2 1.49 0.10 0.48 7 206.93Year þ ARCA þ SAME 1.91 0.08 0.38 7 207.35Year þ ARCA þ Invasive 2.07 0.08 0.36 7 207.51Year þ ARCA2 þ SAME 3.48 0.04 0.18 8 206.77Year þ ARCA2 þ Invasive 3.58 0.04 0.17 8 206.87Year þ ARCA2 þ MALA 3.64 0.03 0.16 8 206.93Year þ ARCA þ SAME þ MALA 4.03 0.03 0.13 8 207.32ARCA 4.05 0.03 0.13 5 213.74Year þ ARCA þ SAME þ Invasive 4.05 0.03 0.13 8 207.35Global (¼ Openness þ Invasive þ ARCA2 þ SAME þ MALA) 13.10 0.00 0.00 11 209.83Intercept only 20.10 0.00 0.00 4 231.87
Extinction Openness þ ARCA 0.00 c 0.06 1.00 6 213.54Year þ Openness þ ARCA 0.09 0.06 0.96 7 211.49Openness þ ARCA þ MALA 0.35 0.05 0.84 7 211.76Openness 0.64 0.04 0.73 5 216.28Year þ Openness þ ARCA þ MALA 0.71 0.04 0.70 8 209.96Year þ Openness 1.16 0.03 0.56 6 214.69Year þ Openness þ ARCA þ Invasive 1.87 0.02 0.39 8 211.13Openness þ ARCA þ Invasive 1.90 0.02 0.39 7 213.31Openness þ ARCA þ SAME 1.93 0.02 0.38 7 213.34Year þ ARCA 2.02 0.02 0.36 6 215.56Year þ ARCA þ MALA 2.02 0.02 0.36 7 213.43Intercept only 2.91 0.01 0.23 4 220.65Global (¼ Openness þ Invasive þ ARCA2 þ SAME þ MALA) 6.00 0.00 0.05 11 208.69
Detection Year 0.00 d 0.51 1.00 6 874.65Intercept only 0.06 0.49 0.97 4 878.92
a AICc value of the top model ¼ 884.63.b AICc value of the top model ¼ 878.22.c AICc value of the top model ¼ 884.19.d AICc value of the top model ¼ 887.03.
The Condor: Ornithological Applications 120:581–595, Q 2018 American Ornithological Society
C. S. Winchell and P. F. Doherty, Jr. California Gnatcatcher habitat preferences 593
Downloaded From: https://bioone.org/journals/The-Condor on 09 May 2020Terms of Use: https://bioone.org/terms-of-use

APPENDIX TABLE 6. Models with DAICc , 2 from the second stage of model construction and selection in which the variables andparameters from the first step were combined in all possible additive combinations to determine the influence of habitat variableson California Gnatcatcher occupancy, colonization, extinction, and detection in coastal California, USA. Parameters includedoccupancy (w), extinction (e), colonization (c), and detection (p). Variables included ARCA (the proportion of 50 transect intersections(‘locations’) associated with each gnatcatcher survey point (‘point’) with coastal sagebrush [Artemisia californica] as a linear term),and ARCA2 as a quadratic model; Openness (the proportion of locations at a point with no vegetation); Invasive (the proportion oflocations at a point with nonnative grasses, black mustard [Brassica nigra] or stork’s bill [Erodium spp.]); SAME (the proportion oflocations at a point with black sage [Salvia mellifera]); MALA (the proportion of locations at a point with laurel sumac [Malosmalaurina]); and Year. For each model, we show the difference in Akaike’s information criterion with small sample size correction fromthe focal model and the top model (DAICc), the Akaike weight (wi), the model likelihood, the number of parameters in the model (K),and the Deviance associated with each model.
Model DAICc wi Likelihood K Deviance
w(ARCA2) e(Openness þ MALA) c(ARCA þ Year) p(constant) 0.00 a 0.02 1.00 10 193.21w(ARCA) e(Openness þ MALA) c(ARCA þ Year) p(constant) 0.08 0.02 0.96 9 195.48w(ARCA2) e(Openness) c(ARCA þ Year) p(constant) 0.10 0.02 0.95 9 195.51w(ARCA) e(Openness) c(ARCA þ Year) p(constant) 0.11 0.02 0.94 8 197.68w(ARCA þ MALA) e(Openness) c(ARCA þ Year) p(constant) 1.01 0.01 0.60 9 196.41w(ARCA þ MALA) e(Openness þ MALA) c(ARCA þ Year) p(constant) 1.03 0.01 0.60 10 194.25w(ARCA2 þ MALA) e(Openness þ MALA) c(ARCA þ Year) p(constant) 1.21 0.01 0.55 11 192.21w(ARCA2 þ MALA) e(Openness) c(ARCA þ Year) p(constant) 1.27 0.01 0.53 10 194.48w(ARCA2 þ Openness) e(Openness þ MALA) c(ARCA þ Year) p(constant) 1.31 0.01 0.52 11 192.31w(ARCA þ Openness þ MALA) e(Openness) c(ARCA þ Year) p(constant) 1.33 0.01 0.51 10 194.55w(ARCA þ Openness þ MALA) e(Openness þ MALA) c(ARCA þ Year) p(constant) 1.37 0.01 0.51 11 192.37w(ARCA þ Openness) e(Openness þ MALA) c(ARCA þ Year) p(constant) 1.40 0.01 0.50 10 194.61w(ARCA2 þ Openness) e(Openness) c(ARCA þ Year) p(constant) 1.40 0.01 0.50 10 194.61w(ARCA þ Openness) e(Openness) c(ARCA þ Year) p(constant) 1.43 0.01 0.49 9 196.83w(ARCA2 þ Openness þMALA) e(Openness þ MALA) c(ARCA þ Year) p(constant) 1.56 0.01 0.46 12 190.34w(ARCA2 þ Openness þ MALA) e(Openness) c(ARCA þ Year) p(constant) 1.60 0.01 0.45 11 192.61w(ARCA2) e(Openness þ ARCA) c(ARCA þ Year) p(constant) 1.90 0.01 0.39 10 195.12w(ARCA) e(Openness þ ARCA) c(ARCA þ Year) p(constant) 1.98 0.01 0.37 9 197.38
a The AICc value of the top model ¼ 872.50.
The Condor: Ornithological Applications 120:581–595, Q 2018 American Ornithological Society
594 California Gnatcatcher habitat preferences C. S. Winchell and P. F. Doherty, Jr.
Downloaded From: https://bioone.org/journals/The-Condor on 09 May 2020Terms of Use: https://bioone.org/terms-of-use

APPENDIX TABLE 7. Top 10 models from a repeated measures logistic regression used to investigate the presence of coastalsagebrush (Artemisia californica; ARCA), laurel sumac (Malosma laurina; MALA), and the absence of trees and shrubs (Openness) as afunction of soil texture, aspect, slope, elevation, and distance to the coast. For each model, we show the difference in Akaike’sinformation criterion with small sample size correction from the focal model and the top model (DAICc), the Akaike weight (wi), themodel likelihood, the number of parameters in the model (K), and the Deviance associated with each model.
Dependent variable Model DAICc wi Likelihood K Deviance
ARCA Soil texture 0.00 a 0.20 1.00 4 411.98Soil texture þ Elevation 0.79 0.14 0.68 5 410.74Soil texture þ Aspect 1.57 0.09 0.46 5 411.53Soil texture þ Slope 1.86 0.08 0.39 5 411.82Soil texture þ Distance 1.97 0.08 0.37 5 411.93Soil texture þ Elevation þ Slope 2.06 0.07 0.36 6 409.98Soil texture þ Elevation þ Aspect 2.56 0.06 0.28 6 410.48Soil texture þ Elevation þ Distance 2.66 0.05 0.26 6 410.59Soil texture þ Aspect þ Slope 3.41 0.04 0.18 6 411.33Soil texture þ Aspect þ Distance 3.53 0.04 0.17 6 411.45
MALA Intercept only 0.00 b 0.09 1.00 2 195.47Elevation 0.11 0.08 0.95 3 193.56Slope 0.40 0.07 0.82 3 193.85Distance 0.42 0.07 0.81 3 193.87Soil texture 0.85 0.06 0.65 4 192.28Slope þ Distance 1.23 0.05 0.54 4 192.66Elevation þ Aspect 1.42 0.04 0.49 4 192.85Elevation þ Distance 1.55 0.04 0.46 4 192.98Elevation þ Slope 1.60 0.04 0.45 4 193.03Aspect 1.63 0.04 0.44 3 195.08
Openness Slope 0.00 c 0.15 1.00 3 937.91Slope þ Distance 0.16 0.14 0.92 4 936.05Aspect þ Slope 0.50 0.12 0.78 4 936.39Elevation þ Slope 0.63 0.11 0.73 4 936.52Aspect þ Slope þ Distance 0.77 0.10 0.68 5 934.63Elevation þ Aspect þ Slope 0.92 0.10 0.63 5 934.78Elevation þ Slope þ Distance 1.94 0.06 0.38 5 935.80Elevation þ Aspect þ Slope þ Distance 2.41 0.05 0.30 6 934.24Soil texture þ Slope 3.85 0.02 0.15 5 937.71Soil texture þ Slope þ Distance 3.88 0.02 0.14 6 935.71
a AICc ¼ 420.04.b AICc ¼ 199.48.c AICc ¼ 943.94.
The Condor: Ornithological Applications 120:581–595, Q 2018 American Ornithological Society
C. S. Winchell and P. F. Doherty, Jr. California Gnatcatcher habitat preferences 595
Downloaded From: https://bioone.org/journals/The-Condor on 09 May 2020Terms of Use: https://bioone.org/terms-of-use