50 years of malawi in charts - japan-malawi.orgyears+of+malawi+in+charts.pdf · 50 years of malawi...
TRANSCRIPT
50 Years of Malawi in Charts
A Collection of Time-series Statistical Data
6 July 2014
Malawi Society of Japan
Statistics Study Team
http://www.japan-malawi.org/

To Malawi’s 50th Anniversary of Independence

i

ii
CONTENTS
Introduction iv
0 Brief Chronology 1
1 Environment 2 1.1 Annual Rainfall at Selected Meteorological Stations 2 1.2 Broad Land Use 4
2 Population 6 2.1 Population Growth 6 2.2 Population Cohorts 8 2.3 District Population and Density 10 2.4 Rural and Urban Population 12
3 Infrastructure 14 3.1 Water, Sanitation and Electricity 14 3.2 Roads and Railways 16 3.3 Telephone Lines and Mobile Cellular Subscriptions 18 3.4 Internet 20
4 Social Development 22 4.1 Human Development Index 22 4.2 Total Fertility Rate and Life Expectancy at Birth 24 4.3 Mortality Rates 26 4.4 Maternal Mortality Ratio 28 4.5 Undernourishment and Food Deficit 30 4.6 Prevalence and Therapy of HIV 32 4.7 Incidence and Detection of Tuberculosis 34 4.8 Malaria 36 4.9 Poverty 38
5 Education 40 5.1 School Education 40 5.2 Literacy 42
6 Economy 44 6.1 Gross Domestic Product (GDP) 44 6.2 Household Consumption 46 6.3 Capital Formation 48 6.4 Agricultural Land Area per Farmer 50 6.5 Cereal Production 52 6.6 Labor Productivity 54 6.7 Income Distribution 56

iii
7 External Aspects 58 7.1 Exchange Rate and Inflation 58 7.2 Purchasing Power Parity Ratio 60 7.3 External Balance on Goods and Services 62 7.4 Exports and Imports of Food and Fuel 66 7.5 Exports and Imports of Ores and Metals 68 7.6 International Tourism 70 7.7 Official Development Assistance (ODA) 72 7.8 Foreign Direct Investment (FDI) 74 7.9 Doing Business Rankings in 2013 76
8 Preliminary Analysis and Implications for Development 78 8.1 National Accounts 78 8.2 Macroscopic Productivity 84 8.3 Population Density, Distribution and Industrial Development 88 8.4 Industrial Development Framework 94
iv
Introduction On the occasion of the fiftieth anniversary of independence of the Republic of Malawi, this file intends to help review the historical perspective since its independence in 1964. Each section of this collection of time-series statistical data of Malawi is basically structured as below.
Section Title A data table made from the website of the World Development Indicators 2013 of the World Bank (http://data.worldbank.org/data-catalog/world- development-indicators), unless otherwise specified. Not all the data is available from 1960s.
Brief description and interpretation of the charts below. Charts made from the table on the right side. Some sections quote the source notes of the World Development Indicators to clarify the definitions of selected indicators.
even numbered page odd numbered page All the data are from the World Development Indicators and other official sources. But their description and interpretation are our team’s own and do not represent the views of the Malawi Society of Japan. We hope this file helps its users in their study and practice.
Malawi Society of Japan Statistics Study Team
(TSURUTA, Shinsuke Email: [email protected])
1
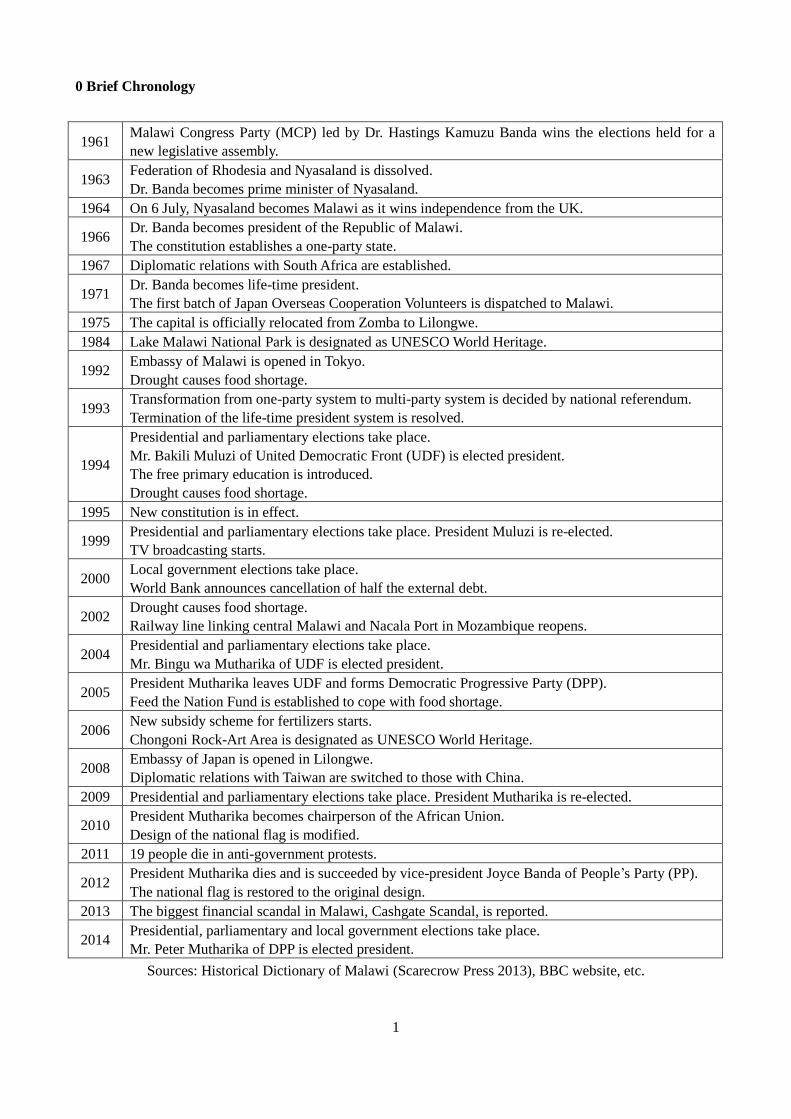
0 Brief Chronology
1961 Malawi Congress Party (MCP) led by Dr. Hastings Kamuzu Banda wins the elections held for a
new legislative assembly.
1963 Federation of Rhodesia and Nyasaland is dissolved.
Dr. Banda becomes prime minister of Nyasaland.
1964 On 6 July, Nyasaland becomes Malawi as it wins independence from the UK.
1966 Dr. Banda becomes president of the Republic of Malawi.
The constitution establishes a one-party state.
1967 Diplomatic relations with South Africa are established.
1971 Dr. Banda becomes life-time president.
The first batch of Japan Overseas Cooperation Volunteers is dispatched to Malawi.
1975 The capital is officially relocated from Zomba to Lilongwe.
1984 Lake Malawi National Park is designated as UNESCO World Heritage.
1992 Embassy of Malawi is opened in Tokyo.
Drought causes food shortage.
1993 Transformation from one-party system to multi-party system is decided by national referendum.
Termination of the life-time president system is resolved.
1994
Presidential and parliamentary elections take place.
Mr. Bakili Muluzi of United Democratic Front (UDF) is elected president.
The free primary education is introduced.
Drought causes food shortage.
1995 New constitution is in effect.
1999 Presidential and parliamentary elections take place. President Muluzi is re-elected.
TV broadcasting starts.
2000 Local government elections take place.
World Bank announces cancellation of half the external debt.
2002 Drought causes food shortage.
Railway line linking central Malawi and Nacala Port in Mozambique reopens.
2004 Presidential and parliamentary elections take place.
Mr. Bingu wa Mutharika of UDF is elected president.
2005 President Mutharika leaves UDF and forms Democratic Progressive Party (DPP).
Feed the Nation Fund is established to cope with food shortage.
2006 New subsidy scheme for fertilizers starts.
Chongoni Rock-Art Area is designated as UNESCO World Heritage.
2008 Embassy of Japan is opened in Lilongwe.
Diplomatic relations with Taiwan are switched to those with China.
2009 Presidential and parliamentary elections take place. President Mutharika is re-elected.
2010 President Mutharika becomes chairperson of the African Union.
Design of the national flag is modified.
2011 19 people die in anti-government protests.
2012 President Mutharika dies and is succeeded by vice-president Joyce Banda of People’s Party (PP).
The national flag is restored to the original design.
2013 The biggest financial scandal in Malawi, Cashgate Scandal, is reported.
2014 Presidential, parliamentary and local government elections take place.
Mr. Peter Mutharika of DPP is elected president.
Sources: Historical Dictionary of Malawi (Scarecrow Press 2013), BBC website, etc.
2
0
500
1,000
1,500
2,000
2,500
3,000
3,500
19
611
963
19
651
967
19
691
971
19
731
975
19
771
979
19
811
983
19
851
987
19
891
991
19
931
995
19
971
999
20
012
003
20
052
007
20
092
011
20
13
mm
Annual Rainfall at Selected Meteorological Stations in Central Region
NkhotakotaCentrallake shore
KasunguCentralhigh land
0
500
1,000
1,500
2,000
2,500
3,000
3,5001
961
19
631
965
19
671
969
19
711
973
19
751
977
19
791
981
19
831
985
19
871
989
19
911
993
19
951
997
19
992
001
20
032
005
20
072
009
20
112
013
mm
Annual Rainfall at Selected Meteorological Stations in Northern Region
Nkhata BayNorthernlake shore
RumphiNorthernhigh land
0
500
1,000
1,500
2,000
2,500
3,000
3,500
19
611
963
19
651
967
19
691
971
19
731
975
19
771
979
19
811
983
19
851
987
19
891
991
19
931
995
19
971
999
20
012
003
20
052
007
20
092
011
20
13
mm
Annual Rainfall at Selected Meteorological Stations in Southern Region
MulanjeSouthernhigh land
MangochiSouthernriver side
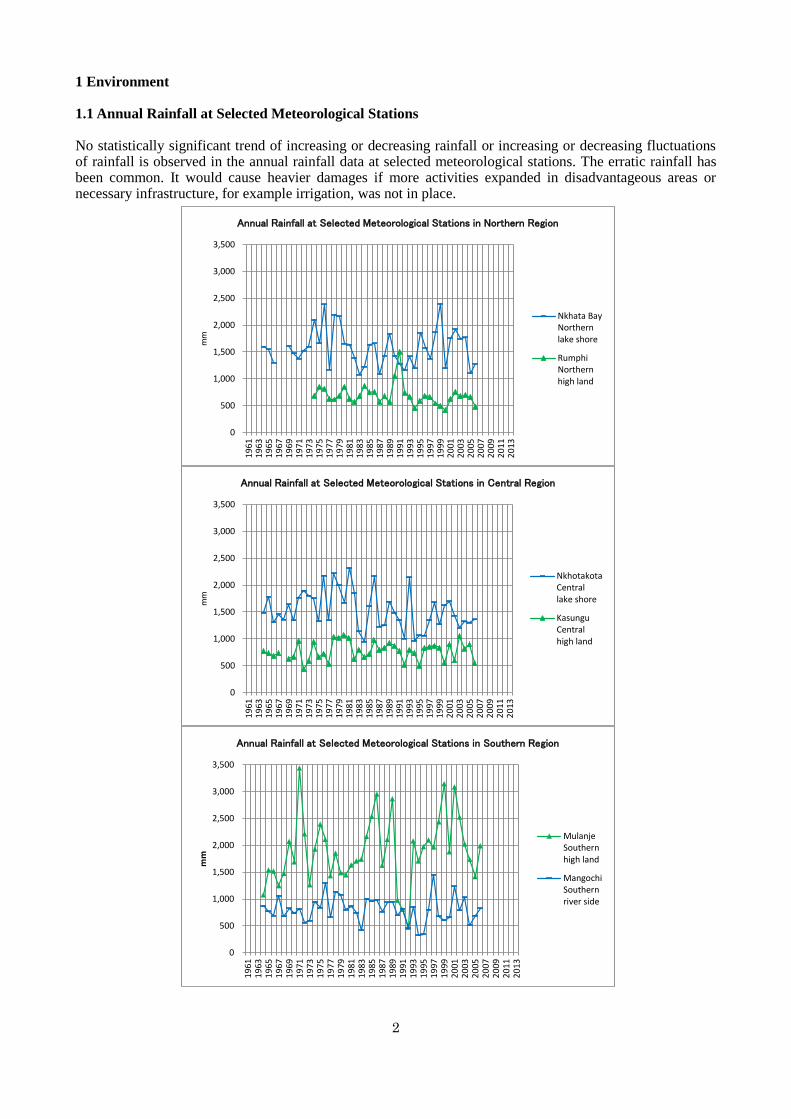
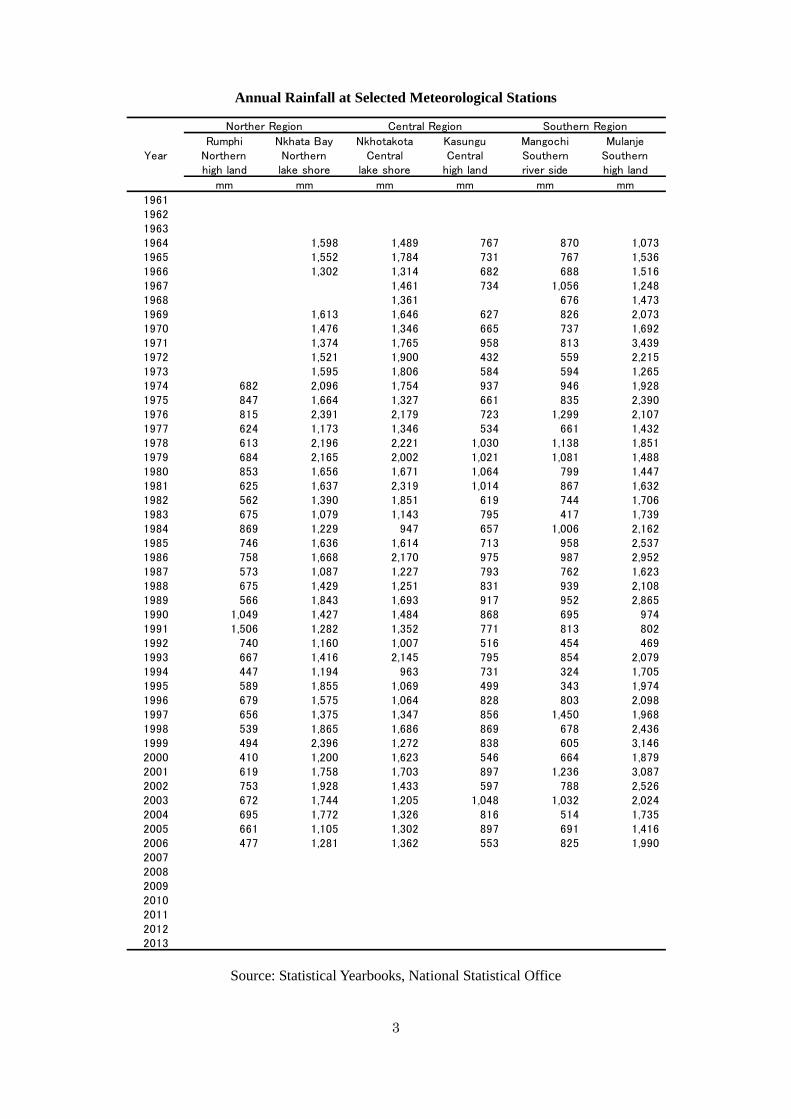
1 Environment 1.1 Annual Rainfall at Selected Meteorological Stations No statistically significant trend of increasing or decreasing rainfall or increasing or decreasing fluctuations of rainfall is observed in the annual rainfall data at selected meteorological stations. The erratic rainfall has been common. It would cause heavier damages if more activities expanded in disadvantageous areas or necessary infrastructure, for example irrigation, was not in place.
3
YearRumphi
Northernhigh land
Nkhata BayNorthernlake shore
NkhotakotaCentral
lake shore
KasunguCentral
high land
MangochiSouthernriver side
MulanjeSouthernhigh land
mm mm mm mm mm mm
1961196219631964 1,598 1,489 767 870 1,0731965 1,552 1,784 731 767 1,5361966 1,302 1,314 682 688 1,5161967 1,461 734 1,056 1,2481968 1,361 676 1,4731969 1,613 1,646 627 826 2,0731970 1,476 1,346 665 737 1,6921971 1,374 1,765 958 813 3,4391972 1,521 1,900 432 559 2,2151973 1,595 1,806 584 594 1,2651974 682 2,096 1,754 937 946 1,9281975 847 1,664 1,327 661 835 2,3901976 815 2,391 2,179 723 1,299 2,1071977 624 1,173 1,346 534 661 1,4321978 613 2,196 2,221 1,030 1,138 1,8511979 684 2,165 2,002 1,021 1,081 1,4881980 853 1,656 1,671 1,064 799 1,4471981 625 1,637 2,319 1,014 867 1,6321982 562 1,390 1,851 619 744 1,7061983 675 1,079 1,143 795 417 1,7391984 869 1,229 947 657 1,006 2,1621985 746 1,636 1,614 713 958 2,5371986 758 1,668 2,170 975 987 2,9521987 573 1,087 1,227 793 762 1,6231988 675 1,429 1,251 831 939 2,1081989 566 1,843 1,693 917 952 2,8651990 1,049 1,427 1,484 868 695 9741991 1,506 1,282 1,352 771 813 8021992 740 1,160 1,007 516 454 4691993 667 1,416 2,145 795 854 2,0791994 447 1,194 963 731 324 1,7051995 589 1,855 1,069 499 343 1,9741996 679 1,575 1,064 828 803 2,0981997 656 1,375 1,347 856 1,450 1,9681998 539 1,865 1,686 869 678 2,4361999 494 2,396 1,272 838 605 3,1462000 410 1,200 1,623 546 664 1,8792001 619 1,758 1,703 897 1,236 3,0872002 753 1,928 1,433 597 788 2,5262003 672 1,744 1,205 1,048 1,032 2,0242004 695 1,772 1,326 816 514 1,7352005 661 1,105 1,302 897 691 1,4162006 477 1,281 1,362 553 825 1,9902007200820092010201120122013
Norther Region Central Region Southern Region
Annual Rainfall at Selected Meteorological Stations
Source: Statistical Yearbooks, National Statistical Office

4
0
20,000
40,000
60,000
80,000
100,000
120,000
19
90
19
91
19
92
19
93
19
94
19
95
19
96
19
97
19
98
19
99
20
00
20
01
20
02
20
03
20
04
20
05
20
06
20
07
20
08
20
09
20
10
20
11
km2
Broad Land Use
Bodies of water
Other land area
Agricultural land area
Forest area
1.2 Broad Land Use The forest area has been decreasing while the agricultural land area has been increasing more rapidly so that the remaining land area is decreasing. It is not sustainable to keep increasing the agricultural land by destroying forests. The agricultural irrigated land area in 2008 was approximately 300 km
2 accounting for less than 1% of the
total agricultural land.
Source note of the World Development Indicators Agricultural land refers to the share of land area that is arable, under permanent crops, and under permanent pastures. Arable land includes land defined by the FAO as land under temporary crops (double-cropped areas are counted once), temporary meadows for mowing or for pasture, land under market or kitchen gardens, and land temporarily fallow. Land abandoned as a result of shifting cultivation is excluded. Land under permanent crops is land cultivated with crops that occupy the land for long periods and need not be replanted after each harvest, such as cocoa, coffee, and rubber. This category includes land under flowering shrubs, fruit trees, nut trees, and vines, but excludes land under trees grown for wood or timber. Permanent pasture is land used for five or more years for forage, including natural and cultivated crops. Forest area is land under natural or planted stands of trees of at least 5 meters in situ, whether productive or not, and excludes tree stands in agricultural production systems (for example, in fruit plantations and agroforestry systems) and trees in urban parks and gardens.

5
YearSurface
areaLand area Forest area Agricultural
land areaOther land
areaBodies of
water
km2 km2 km2 km2 km2 km2
1990 118,480 94,280 38,960 42,180 13,140 24,2001991 118,480 94,280 38,631 43,200 12,449 24,2001992 118,480 94,280 38,302 42,700 13,278 24,2001993 118,480 94,280 37,973 42,700 13,607 24,2001994 118,480 94,280 37,644 40,700 15,936 24,2001995 118,480 94,280 37,315 42,800 14,165 24,2001996 118,480 94,280 36,986 43,800 13,494 24,2001997 118,480 94,280 36,657 44,300 13,323 24,2001998 118,480 94,280 36,328 45,800 12,152 24,2001999 118,480 94,280 35,999 46,750 11,531 24,2002000 118,480 94,280 35,670 47,200 11,410 24,2002001 118,480 94,280 35,340 48,200 10,740 24,2002002 118,480 94,280 35,010 48,200 11,070 24,2002003 118,480 94,280 34,680 49,700 9,900 24,2002004 118,480 94,280 34,350 49,700 10,230 24,2002005 118,480 94,280 34,020 51,700 8,560 24,2002006 118,480 94,280 33,690 52,750 7,840 24,2002007 118,480 94,280 33,360 49,750 11,170 24,2002008 118,480 94,280 33,030 53,750 7,500 24,2002009 118,480 94,280 32,700 54,800 6,780 24,2002010 118,480 94,280 32,370 55,800 6,110 24,2002011 118,480 94,280 32,040 55,800 6,440 24,20020122013
Broad Land Use

6
0
1
2
3
4
5
6
7
19
61
19
63
19
65
19
67
19
69
19
71
19
73
19
75
19
77
19
79
19
81
19
83
19
85
19
87
19
89
19
91
19
93
19
95
19
97
19
99
20
01
20
03
20
05
20
07
20
09
20
11
20
13
% /
year
Population Growth Rate
0
20
40
60
80
100
120
140
160
180
0
2,000,000
4,000,000
6,000,000
8,000,000
10,000,000
12,000,000
14,000,000
16,000,000
18,000,000
19
611
963
19
651
967
19
691
971
19
731
975
19
771
979
19
811
983
19
851
987
19
891
991
19
931
995
19
971
999
20
012
003
20
052
007
20
092
011
20
13
peopl
e p
er
sq k
m o
f la
nd
area
Population and Density
Population(left axis)
Populationdensity(right axis)
2 Population 2.1 Population Growth The population growth rate has been high at around 3%. In 2012, the population density reached nearly 170 per km
2. Rapid population growth causes various issues. Decrease of agricultural area per farmer and
shortage of urban services are among the many serious problems.

7
Population-related Data
YearPopulation(left axis)
Ruralpopulation
Urbanpopulation
(Urbanpopulation)/Population
Ages0-14
Ages15-64
Ages65-
Ages0-14
Ages15-64
Ages65-
Populationdensity
(right axis)
Populationgrowthrate
% % % %/year
1961 3,607,383 3,445,282 162,101 0.04 45.8 51.7 2.5 1,652,486 1,863,468 91,429 38.31962 3,693,680 3,523,874 169,806 0.05 45.6 51.9 2.5 1,685,949 1,915,615 92,115 39.2 2.41963 3,783,766 3,605,899 177,867 0.05 45.5 52.1 2.5 1,720,765 1,970,129 92,872 40.1 2.41964 3,877,229 3,690,951 186,278 0.05 45.4 52.2 2.4 1,759,169 2,024,389 93,670 41.1 2.51965 3,973,960 3,778,918 195,042 0.05 45.4 52.3 2.4 1,802,796 2,076,636 94,528 42.2 2.51966 4,073,777 3,864,507 209,270 0.05 45.5 52.2 2.3 1,852,209 2,126,204 95,363 43.2 2.51967 4,177,347 3,953,191 224,156 0.05 45.7 52.0 2.3 1,907,041 2,174,039 96,268 44.3 2.51968 4,286,430 4,046,604 239,826 0.06 45.9 51.8 2.3 1,966,844 2,221,993 97,595 45.5 2.61969 4,403,344 4,146,893 256,451 0.06 46.1 51.6 2.3 2,030,791 2,272,731 99,821 46.7 2.71970 4,529,749 4,255,563 274,186 0.06 46.3 51.4 2.3 2,098,233 2,328,255 103,261 48.0 2.91971 4,666,194 4,368,827 297,367 0.06 46.5 51.2 2.3 2,169,132 2,388,993 108,069 49.5 3.01972 4,812,216 4,490,154 322,062 0.07 46.6 51.0 2.4 2,243,613 2,454,539 114,062 51.0 3.11973 4,967,159 4,618,842 348,317 0.07 46.7 50.8 2.4 2,321,366 2,525,000 120,792 52.7 3.21974 5,129,915 4,753,779 376,136 0.07 46.8 50.7 2.5 2,402,023 2,600,281 127,609 54.4 3.31975 5,299,532 4,894,012 405,520 0.08 46.9 50.6 2.5 2,485,296 2,680,195 134,041 56.2 3.31976 5,478,781 5,044,226 434,555 0.08 46.9 50.5 2.6 2,571,841 2,766,881 140,056 58.1 3.41977 5,668,178 5,202,753 465,425 0.08 47.0 50.5 2.6 2,661,794 2,860,601 145,784 60.1 3.51978 5,862,115 5,364,375 497,740 0.08 47.0 50.4 2.6 2,753,812 2,957,189 151,113 62.2 3.41979 6,052,940 5,522,073 530,867 0.09 47.0 50.4 2.6 2,846,094 3,050,903 155,945 64.2 3.31980 6,236,824 5,672,391 564,433 0.09 47.1 50.3 2.6 2,937,831 3,138,704 160,289 66.2 3.01981 6,403,934 5,810,123 593,811 0.09 47.2 50.2 2.6 3,025,454 3,214,572 163,910 67.9 2.71982 6,559,281 5,936,464 622,817 0.09 47.4 50.0 2.5 3,110,156 3,282,128 166,997 69.6 2.41983 6,731,171 6,077,049 654,122 0.10 47.6 49.9 2.5 3,201,361 3,359,283 170,524 71.4 2.61984 6,958,278 6,266,597 691,681 0.10 47.6 49.9 2.5 3,311,950 3,470,541 175,785 73.8 3.41985 7,264,519 6,526,226 738,293 0.10 47.5 50.0 2.5 3,449,563 3,631,304 183,652 77.1 4.41986 7,667,832 6,867,126 800,706 0.10 47.2 50.2 2.5 3,621,620 3,851,715 194,498 81.3 5.61987 8,150,040 7,276,209 873,831 0.11 46.9 50.6 2.6 3,821,383 4,120,774 207,883 86.4 6.31988 8,655,185 7,703,011 952,174 0.11 46.5 50.9 2.6 4,025,316 4,407,009 222,860 91.8 6.21989 9,105,429 8,078,282 1,027,147 0.11 46.1 51.2 2.6 4,200,943 4,666,442 238,048 96.6 5.21990 9,447,123 8,355,036 1,092,087 0.12 45.8 51.5 2.7 4,326,435 4,868,281 252,407 100.2 3.81991 9,657,518 8,508,215 1,149,303 0.12 45.5 51.8 2.8 4,391,151 5,000,659 265,710 102.4 2.21992 9,759,434 8,564,762 1,194,672 0.12 45.1 52.0 2.9 4,406,008 5,075,282 278,144 103.5 1.11993 9,800,635 8,567,539 1,233,096 0.13 44.9 52.2 3.0 4,397,115 5,113,939 289,584 104.0 0.41994 9,851,737 8,578,656 1,273,081 0.13 44.7 52.3 3.0 4,402,140 5,149,608 299,988 104.5 0.51995 9,964,065 8,642,531 1,321,534 0.13 44.6 52.3 3.1 4,448,057 5,206,627 309,381 105.7 1.11996 10,153,315 8,779,328 1,373,987 0.14 44.8 52.1 3.1 4,544,066 5,291,615 317,632 107.7 1.91997 10,404,259 8,968,284 1,435,975 0.14 45.0 51.9 3.1 4,681,342 5,398,098 324,818 110.4 2.51998 10,700,180 9,194,536 1,505,644 0.14 45.3 51.6 3.1 4,846,978 5,521,766 331,434 113.5 2.81999 11,012,707 9,433,419 1,579,288 0.14 45.6 51.3 3.1 5,020,443 5,654,093 338,168 116.8 2.92000 11,321,496 9,667,425 1,654,071 0.15 45.8 51.1 3.1 5,186,809 5,789,141 345,546 120.1 2.82001 11,623,166 9,914,700 1,708,466 0.15 46.0 51.0 3.0 5,342,561 5,926,800 353,806 123.3 2.72002 11,926,778 10,163,094 1,763,684 0.15 46.1 50.9 3.0 5,492,908 6,070,947 362,921 126.5 2.62003 12,238,739 10,418,055 1,820,684 0.15 46.1 50.9 3.0 5,641,855 6,224,075 372,809 129.8 2.62004 12,569,091 10,688,101 1,880,990 0.15 46.1 50.8 3.0 5,796,167 6,389,636 383,286 133.3 2.72005 12,924,746 10,979,055 1,945,691 0.15 46.1 50.8 3.1 5,960,485 6,570,012 394,249 137.1 2.82006 13,307,535 11,291,204 2,016,331 0.15 46.1 50.8 3.0 6,135,774 6,766,187 405,572 141.1 3.02007 13,713,758 11,622,465 2,091,293 0.15 46.1 50.9 3.0 6,319,209 6,977,135 417,411 145.5 3.12008 14,138,207 11,968,360 2,169,847 0.15 46.0 50.9 3.0 6,507,202 7,200,750 430,256 150.0 3.12009 14,573,338 12,322,457 2,250,881 0.15 45.9 51.0 3.1 6,694,672 7,433,909 444,759 154.6 3.12010 15,013,694 12,680,116 2,333,578 0.16 45.8 51.1 3.1 6,878,062 7,674,330 461,302 159.2 3.02011 15,457,531 13,031,379 2,426,152 0.16 45.6 51.2 3.1 7,055,632 7,921,733 480,166 164.0 3.02012 15,906,483 13,385,592 2,520,891 0.16 45.4 51.4 3.1 7,228,657 8,176,831 500,992 168.7 2.92013

8
0
2,000,000
4,000,000
6,000,000
8,000,000
10,000,000
12,000,000
14,000,000
16,000,000
18,000,000
19
611
963
19
651
967
19
691
971
19
731
975
19
771
979
19
811
983
19
851
987
19
891
991
19
931
995
19
971
999
20
012
003
20
052
007
20
092
011
Population by Age Group
Ages65-
Ages15-64
Ages0-14
1,500 1,000 500 0 500 1,000 1,500
0-4
5-9
10-14
15-19
20-24
25-29
30-34
35-39
40-44
45-49
50-54
55-59
60-64
65-
2008 1998 1987 1977 1966 Male Unit: thousand Female 1966 1977 1987 1998 2008
Population Pyramids of 1966, 1977, 1987, 1998 and 2008
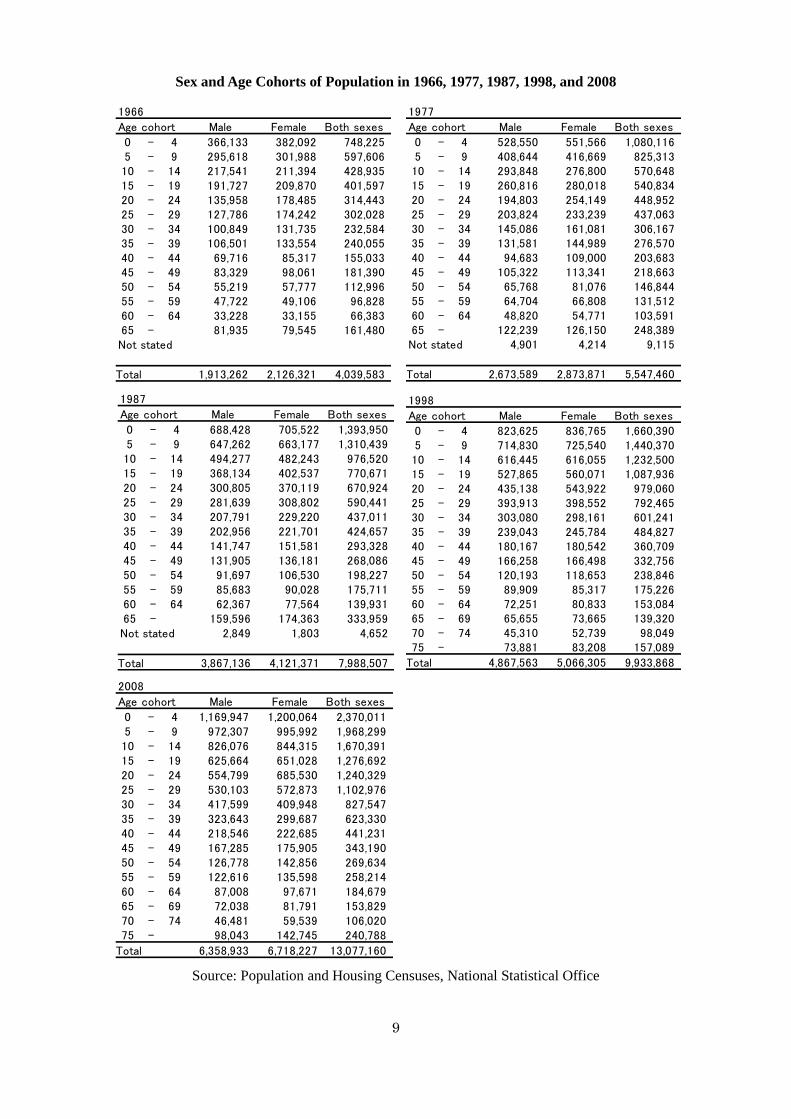
2.2 Population Cohorts The share of young population (0-14 years) before the working ages is large (40-50%) indicating the need for fostering and educating a large number of children and the further population growth in the coming years.
9
Age cohort Male Female Both sexes
0 - 4 528,550 551,566 1,080,1165 - 9 408,644 416,669 825,31310 - 14 293,848 276,800 570,64815 - 19 260,816 280,018 540,83420 - 24 194,803 254,149 448,95225 - 29 203,824 233,239 437,06330 - 34 145,086 161,081 306,16735 - 39 131,581 144,989 276,57040 - 44 94,683 109,000 203,68345 - 49 105,322 113,341 218,66350 - 54 65,768 81,076 146,84455 - 59 64,704 66,808 131,51260 - 64 48,820 54,771 103,59165 - 122,239 126,150 248,389Not stated 4,901 4,214 9,115
Total 2,673,589 2,873,871 5,547,460
1977
Age cohort Male Female Both sexes
0 - 4 688,428 705,522 1,393,9505 - 9 647,262 663,177 1,310,43910 - 14 494,277 482,243 976,52015 - 19 368,134 402,537 770,67120 - 24 300,805 370,119 670,92425 - 29 281,639 308,802 590,44130 - 34 207,791 229,220 437,01135 - 39 202,956 221,701 424,65740 - 44 141,747 151,581 293,32845 - 49 131,905 136,181 268,08650 - 54 91,697 106,530 198,22755 - 59 85,683 90,028 175,71160 - 64 62,367 77,564 139,93165 - 159,596 174,363 333,959Not stated 2,849 1,803 4,652
Total 3,867,136 4,121,371 7,988,507
1987
Age cohort Male Female Both sexes
0 - 4 823,625 836,765 1,660,3905 - 9 714,830 725,540 1,440,37010 - 14 616,445 616,055 1,232,50015 - 19 527,865 560,071 1,087,93620 - 24 435,138 543,922 979,06025 - 29 393,913 398,552 792,46530 - 34 303,080 298,161 601,24135 - 39 239,043 245,784 484,82740 - 44 180,167 180,542 360,70945 - 49 166,258 166,498 332,75650 - 54 120,193 118,653 238,84655 - 59 89,909 85,317 175,22660 - 64 72,251 80,833 153,08465 - 69 65,655 73,665 139,32070 - 74 45,310 52,739 98,04975 - 73,881 83,208 157,089
Total 4,867,563 5,066,305 9,933,868
1998
Age cohort Male Female Both sexes
0 - 4 1,169,947 1,200,064 2,370,0115 - 9 972,307 995,992 1,968,29910 - 14 826,076 844,315 1,670,39115 - 19 625,664 651,028 1,276,69220 - 24 554,799 685,530 1,240,32925 - 29 530,103 572,873 1,102,97630 - 34 417,599 409,948 827,54735 - 39 323,643 299,687 623,33040 - 44 218,546 222,685 441,23145 - 49 167,285 175,905 343,19050 - 54 126,778 142,856 269,63455 - 59 122,616 135,598 258,21460 - 64 87,008 97,671 184,67965 - 69 72,038 81,791 153,82970 - 74 46,481 59,539 106,02075 - 98,043 142,745 240,788
Total 6,358,933 6,718,227 13,077,160
2008
Age cohort Male Female Both sexes
0 - 4 366,133 382,092 748,2255 - 9 295,618 301,988 597,60610 - 14 217,541 211,394 428,93515 - 19 191,727 209,870 401,59720 - 24 135,958 178,485 314,44325 - 29 127,786 174,242 302,02830 - 34 100,849 131,735 232,58435 - 39 106,501 133,554 240,05540 - 44 69,716 85,317 155,03345 - 49 83,329 98,061 181,39050 - 54 55,219 57,777 112,99655 - 59 47,722 49,106 96,82860 - 64 33,228 33,155 66,38365 - 81,935 79,545 161,480Not stated
Total 1,913,262 2,126,321 4,039,583
1966
Sex and Age Cohorts of Population in 1966, 1977, 1987, 1998, and 2008
Source: Population and Housing Censuses, National Statistical Office
10
0 500 1,000 1,500 2,000
Nsanje
Chikwawa
Thyolo
Mulanje
Phalombe
Blantyre including City
Chiradzulu
Mwanza & Neno
Zomba including City
Balaka
Machinga
Mangochi
Ntcheu
Dedza
Lilongwe including City
Mchinji
Salima
Dowa
Ntchisi
Kasungu
Nkhotakota
Mzimba & Mzuzu
Nkhata Bay & Likoma
Rumphi
Karonga
Chitipa
thousand
District Population
1966
1977
1987
1998
2008
0
100
200
300
400
500
600
0 20 40 60 80 100
peopl
e/km
2
District No.
1 2 3 4 5 6 7 8 9 10 11 12 13 14 15 16 17 18 19 20 21 22 23 24 25 26
area in thousand km2
District Population Density
2008
1998
1987
1977
1966
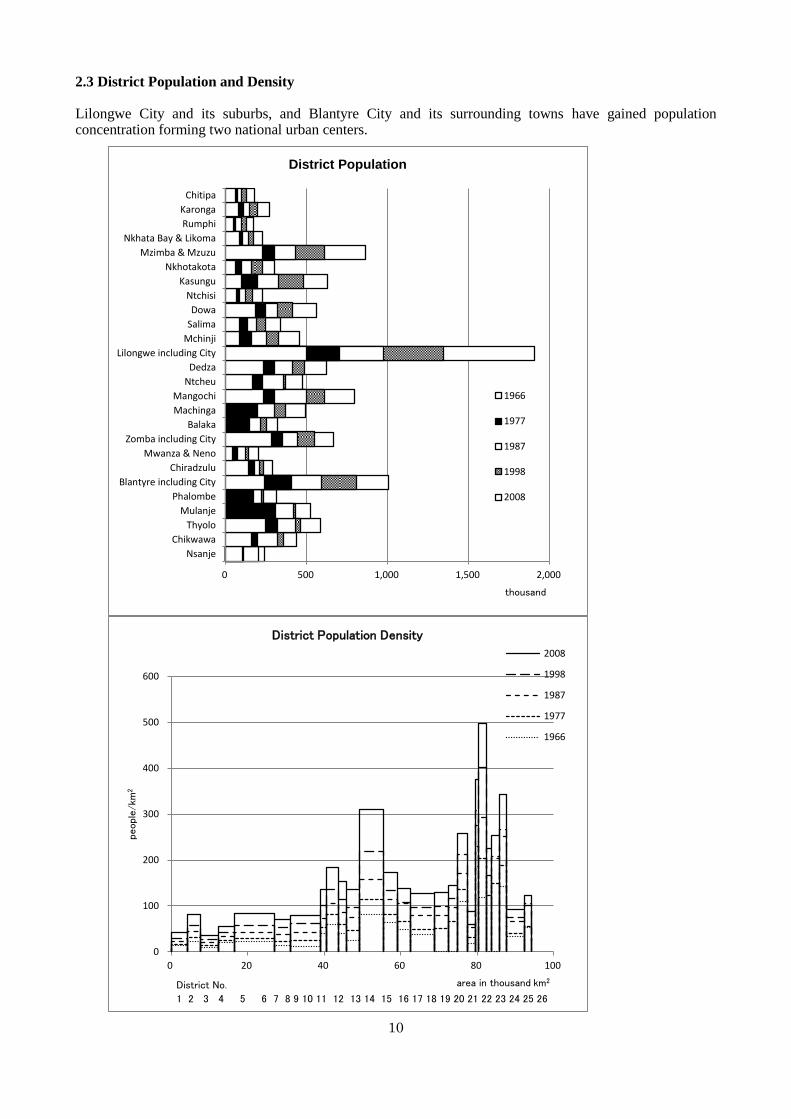
2.3 District Population and Density Lilongwe City and its suburbs, and Blantyre City and its surrounding towns have gained population concentration forming two national urban centers.

11
Region No. District1 Chitipa2 Karonga
Northern 3 Rumphi4 Nkhata Bay & Likoma5 Mzimba & Mzuzu6 Nkhotakota7 Kasungu8 Ntchisi9 Dowa
Central 10 Salima11 Mchinji12 Lilongwe including City13 Dedza14 Ntcheu15 Mangochi16 Machinga17 Balaka18 Zomba including City19 Mwanza & Neno
Southern 20 Chiradzulu21 Blantyre including City22 Phalombe23 Mulanje24 Thyolo25 Chikwawa26 Nsanje
Region District Land area Population Population density per km2
km2 1966 1977 1987 1998 2008 1966 1977 1987 1998 2008
Northern Chitipa 4,288 59,500 72,300 96,794 126,799 178,904 13.9 16.9 22.6 29.6 41.7
Region Karonga 3,355 77,700 106,900 148,014 194,572 269,890 23.2 31.9 44.1 58.0 80.4
Rumphi 4,769 46,600 62,500 94,902 128,360 172,034 9.8 13.1 19.9 26.9 36.1
Nkhata Bay & Likoma 4,089 83,900 105,800 138,381 172,835 226,203 20.5 25.9 33.8 42.3 55.3
Mzimba & Mzuzu 10,430 229,700 301,400 433,696 610,994 861,899 22.0 28.9 41.6 58.6 82.6
Central Nkhotakota 4,259 62,900 94,400 158,044 229,460 303,659 14.8 22.2 37.1 53.9 71.3
Region Kasungu 7,878 97,500 194,400 323,453 480,659 627,467 12.4 24.7 41.1 61.0 79.6
Ntchisi 1,655 66,800 87,400 120,860 167,880 224,872 40.4 52.8 73.0 101.4 135.9
Dowa 3,041 182,000 247,600 322,432 411,387 558,470 59.8 81.4 106.0 135.3 183.6
Salima 2,196 86,600 132,300 189,173 248,214 337,895 39.4 60.2 86.1 113.0 153.9
Mchinji 3,356 85,300 158,800 249,843 324,941 456,516 25.4 47.3 74.4 96.8 136.0
Lilongwe including City 6,159 498,500 704,100 976,627 1,346,360 1,905,282 80.9 114.3 158.6 218.6 309.3
Dedza 3,624 230,700 298,200 411,787 486,682 624,445 63.7 82.3 113.6 134.3 172.3
Ntcheu 3,424 164,700 226,500 358,767 370,757 471,589 48.1 66.2 104.8 108.3 137.7
Southern Mangochi 6,273 232,700 302,300 496,578 610,239 797,061 37.1 48.2 79.2 97.3 127.1
Region Machinga 3,771 226,500 195,200 301,849 369,614 490,579 38.0 51.8 80.0 98.0 130.1
Balaka 2,193 146,600 213,416 253,098 317,324 66.8 97.3 115.4 144.7
Zomba including City 2,580 282,400 352,300 441,615 546,661 667,953 109.5 136.6 171.2 211.9 258.9
Mwanza & Neno 2,295 42,000 71,400 121,513 138,015 200,264 18.3 31.1 52.9 60.1 87.3
Chiradzulu 767 142,200 176,200 210,912 236,050 288,546 185.4 229.7 275.0 307.8 376.2
Blantyre including City 2,012 237,300 408,100 589,525 809,397 1,001,984 117.9 202.8 293.0 402.3 498.0
Phalombe 1,394 169,700 218,134 231,990 313,129 121.7 156.5 166.4 224.6
Mulanje 2,056 398,900 307,800 419,928 428,322 521,391 115.6 149.7 204.2 208.3 253.6
Thyolo 1,715 245,800 322,000 431,157 458,976 587,053 143.3 187.8 251.4 267.6 342.3
Chikwawa 4,755 158,100 194,400 316,733 356,682 434,648 33.2 40.9 66.6 75.0 91.4
Nsanje 1,942 101,200 108,800 204,374 194,924 238,103 52.1 56.0 105.2 100.4 122.6
Total Malawi 94,276 4,039,500 5,547,400 7,988,507 9,933,868 13,077,160 42.8 58.8 84.7 105.4 138.7
Note: In 1966, Balaka was part of Machinga and Phalombe was part of Mulanje, so separate data is not available.
The census population of Nsanje decreased from 1987 to 1998.
Population and Density by District
Source: Population and Housing Censuses, National Statistical Office

12
0
2,000,000
4,000,000
6,000,000
8,000,000
10,000,000
12,000,000
14,000,000
16,000,000
18,000,000
19
611
963
19
651
967
19
691
971
19
731
975
19
771
979
19
811
983
19
851
987
19
891
991
19
931
995
19
971
999
20
012
003
20
052
007
20
092
011
Rural Population and Urban Population
Urbanpopulation
Ruralpopulation
0
100,000
200,000
300,000
400,000
500,000
600,000
700,000
800,000
19
611
963
19
651
967
19
691
971
19
731
975
19
771
979
19
811
983
19
851
987
19
891
991
19
931
995
19
971
999
20
012
003
20
052
007
20
092
011
20
13
City Population
Lilongwe City
Blantyre City
Mzuzu City
Zomba City
2.4 Rural and Urban Population Malawi’s population is dominated by the rural population but the urban population share increased from 4% in 1961 to 16% in 2012. In terms of population, Lilongwe City has surpassed Blantyre City and Mzuzu City has surpassed Zomba City. The total population of local urban areas is smaller than that of the cities but increasing the share, although cautious analysis is required because the city population is from the census and the urban population is from the World Development Indicators.
Source note of the World Development Indicators Urban population: People living in urban areas as defined by national statistical offices. It is calculated using World Bank population estimates and urban ratios from the United Nations World Urbanization Prospects. Rural population: People living in rural areas as defined by national statistical offices. It is calculated as the difference between total population and urban population. Population and Housing Census 2008, National Statistical Office In Malawi, Urban Areas refer to the four major cities of Blantyre, Lilongwe, Mzuzu and Zomba and other urban areas, which consist of Bomas (local administration centers) and gazetted town planning areas.

13
YearMzuzuCity
LilongweCity
ZombaCity
BlantyreCity
Citypopulation
Urbanpopulation
City pop/Urban pop
%
1961 162,1011962 169,8061963 177,8671964 186,2781965 195,0421966 8,490 45,380 19,666 109,461 182,997 209,270 87.41967 224,1561968 239,8261969 256,4511970 274,1861971 297,3671972 322,0621973 348,3171974 376,1361975 405,5201976 434,5551977 16,000 99,000 24,000 219,000 358,000 465,425 76.91978 497,7401979 530,8671980 564,4331981 593,8111982 622,8171983 654,1221984 691,6811985 738,2931986 800,7061987 44,238 233,978 42,878 331,588 652,682 873,831 74.71988 952,1741989 1,027,1471990 1,092,0871991 1,149,3031992 1,194,6721993 1,233,0961994 1,273,0811995 1,321,5341996 1,373,9871997 1,435,9751998 86,980 440,471 65,915 502,053 1,095,419 1,505,644 72.81999 1,579,2882000 1,654,0712001 1,708,4662002 1,763,6842003 1,820,6842004 1,880,9902005 1,945,6912006 2,016,3312007 2,091,2932008 133,968 674,448 88,314 661,256 1,557,986 2,169,847 71.82009 2,250,8812010 2,333,5782011 2,426,1522012 2,520,8912013
City Population
Source: City population data from Population and Housing Censuses, National Statistical Office

14
0
10
20
30
40
50
60
70
80
90
100
19
901
991
19
921
993
19
941
995
19
961
997
19
981
999
20
002
001
20
022
003
20
042
005
20
062
007
20
082
009
20
102
011
20
122
013
% o
f p
op
ula
tio
n w
ith
acc
ess
Access to Improved Water Sources
Urban
Both
Rural
0
10
20
30
40
50
60
70
80
90
100
19
90
19
91
19
92
19
93
19
94
19
95
19
96
19
97
19
98
19
99
20
00
20
01
20
02
20
03
20
04
20
05
20
06
20
07
20
08
20
09
20
10
20
11
20
12
20
13
% o
f p
op
ula
tio
n w
ith
acc
ess
Access to Improved Sanitation Facilities
Urban
Both
Rural
3 Infrastructure 3.1 Water, Sanitation and Electricity Access to improved water sources has been steadily expanded. The level of access to improved sanitation facilities has been lower but improving especially in rural areas, although the actual situation needs to be assessed. According to available data, access to electricity in the total population is still limited accounting for 9.0% in 2009 and 8.7% in 2010.
Source note of the World Development Indicators The improved water source includes piped water on premises (piped household water connection located inside the user’s dwelling, plot or yard), and other improved drinking water sources (public taps or standpipes, tube wells or boreholes, protected dug wells, protected springs, and rainwater collection). The improved sanitation facilities include flush/pour flush (to piped sewer system, septic tank, pit latrine), ventilated improved pit (VIP) latrine, pit latrine with slab, and composting toilet.

15
Year Rural Urban Both Rural Urban Both
% ofpopulation
withaccess
% ofpopulation
withaccess
% ofpopulation
withaccess
% ofpopulation
withaccess
% ofpopulation
withaccess
% ofpopulation
withaccess
1990 35.1 91.5 41.6 37.3 47.9 38.51991 37.3 91.6 43.8 38.1 48.0 39.21992 39.6 91.8 45.9 38.8 48.0 40.01993 41.8 91.9 48.1 39.6 48.1 40.71994 44.0 92.1 50.2 40.4 48.2 41.41995 46.2 92.2 52.3 41.2 48.3 42.11996 48.4 92.4 54.4 41.9 48.4 42.81997 50.6 92.5 56.5 42.7 48.4 43.51998 52.9 92.7 58.6 43.5 48.5 44.21999 55.1 92.8 60.6 44.2 48.6 44.92000 57.3 93.0 62.5 45.0 48.7 45.52001 59.5 93.1 64.4 45.8 48.8 46.22002 61.7 93.2 66.4 46.5 48.9 46.92003 63.9 93.4 68.3 47.3 48.9 47.62004 66.2 93.5 70.3 48.1 49.0 48.22005 68.4 93.7 72.2 48.9 49.1 48.92006 70.6 93.8 74.1 49.6 49.2 49.62007 72.8 94.0 76.0 50.4 49.3 50.22008 75.0 94.1 77.9 51.2 49.3 50.92009 77.2 94.3 79.9 51.9 49.4 51.52010 79.5 94.4 81.8 52.7 49.5 52.22011 81.7 94.6 83.7 53.5 49.6 52.920122013
Access toImproved Water Sources
Access toImproved Sanitation Facilities
Access to Improved Water Sources and Improved Sanitation Facilities

16
0
2,000
4,000
6,000
8,000
10,000
12,000
14,000
16,000
18,0001
980
19
82
19
84
19
86
19
88
19
90
19
92
19
94
19
96
19
98
20
00
20
02
20
04
20
06
20
08
20
10
20
12
km
Total Length of Roads and Railways
Total roads
Total rail lines
3.2 Roads and Railways The road network has been expanded as the dominant land transportation infrastructure. Railway service has been dormant but is being revitalized as a complementary transport means.

17
YearMotor
vehiclesPassenger
carsTotalroads
Pavedroads
Pavedroads
Goodstransportedby railways
Passengerscarried byrailways
Total raillines
per 1,000people
per 1,000people
km% of total
roadskm
million ton-km
millionpassenger-
kmkm
1980 234 80 7891981 225 78 7891982 176 97 7891983 172 102 7891984 117 102 7891985 105 113 7891986 95 121 7891987 128 107 7891988 92 114 7891989 68 111 7891990 10,204 65 115 7891991 13,819 73 101 7891992 14,151 53 88 7891993 14,157 50 65 7891994 14,204 47 41 7891995 14,594 63 22 7891996 14,594 43 26 7101997 16,451 51 17 7101998 50 21 7101999 56 19 7102000 87 27 7102001 70 22 7102002 73 37 7102003 15,451 45.0 6,956 41 30 7102004 38 26 710200520062007 8 42008 33 44 79720092010201120122013
Transportation

18
0
5
10
15
20
25
30
19
611
963
19
651
967
19
691
971
19
731
975
19
771
979
19
811
983
19
851
987
19
891
991
19
931
995
19
971
999
20
012
003
20
052
007
20
092
011
20
13
Telephone Lines and Mobile Cellular Subscriptions per 100 People
Telephone
Mobile
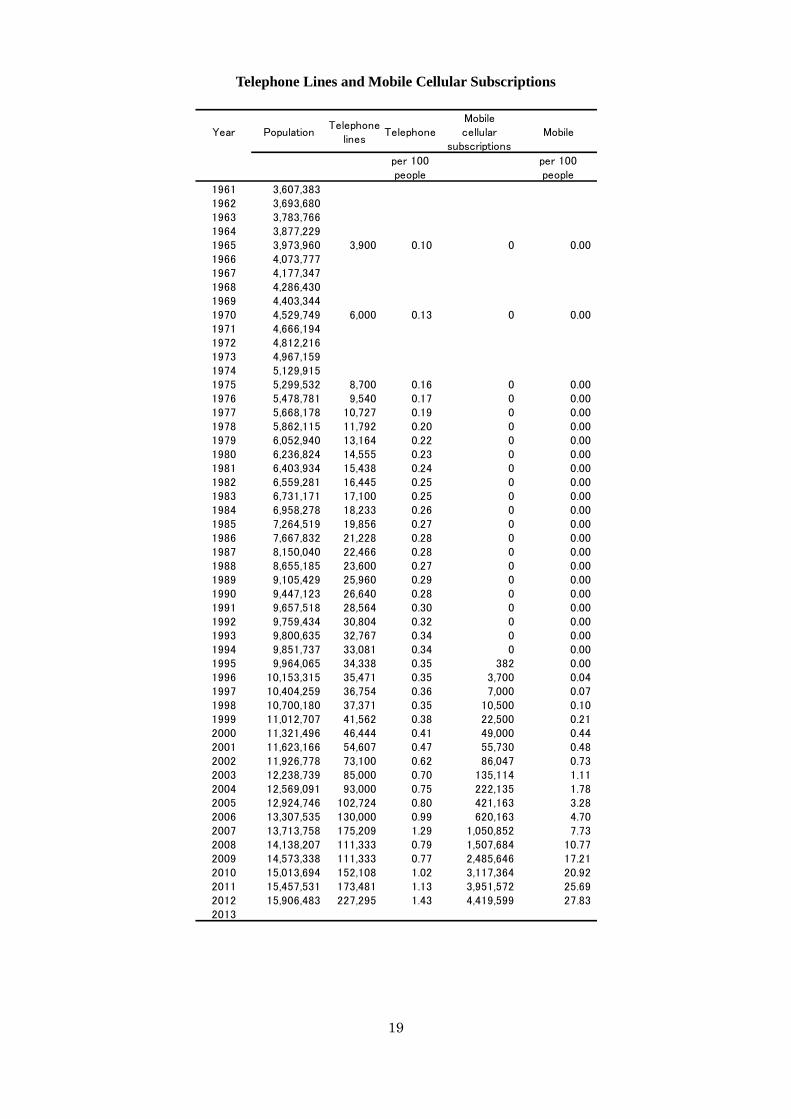
3.3 Telephone Lines and Mobile Cellular Subscriptions The recent expansion of mobile phones has been tremendous. The mobile cellular subscriptions exceeded the telephone lines in 2000. Then in the early 2010s, the number of mobile phones was 20 times that of the telephone lines. Even in villages with no individual tap water and no power network, their traditional market places may have shops of prepaid cards for mobile phones.
19
Year PopulationTelephone
linesTelephone
Mobilecellular
subscriptionsMobile
per 100people
per 100people
1961 3,607,3831962 3,693,6801963 3,783,7661964 3,877,2291965 3,973,960 3,900 0.10 0 0.001966 4,073,7771967 4,177,3471968 4,286,4301969 4,403,3441970 4,529,749 6,000 0.13 0 0.001971 4,666,1941972 4,812,2161973 4,967,1591974 5,129,9151975 5,299,532 8,700 0.16 0 0.001976 5,478,781 9,540 0.17 0 0.001977 5,668,178 10,727 0.19 0 0.001978 5,862,115 11,792 0.20 0 0.001979 6,052,940 13,164 0.22 0 0.001980 6,236,824 14,555 0.23 0 0.001981 6,403,934 15,438 0.24 0 0.001982 6,559,281 16,445 0.25 0 0.001983 6,731,171 17,100 0.25 0 0.001984 6,958,278 18,233 0.26 0 0.001985 7,264,519 19,856 0.27 0 0.001986 7,667,832 21,228 0.28 0 0.001987 8,150,040 22,466 0.28 0 0.001988 8,655,185 23,600 0.27 0 0.001989 9,105,429 25,960 0.29 0 0.001990 9,447,123 26,640 0.28 0 0.001991 9,657,518 28,564 0.30 0 0.001992 9,759,434 30,804 0.32 0 0.001993 9,800,635 32,767 0.34 0 0.001994 9,851,737 33,081 0.34 0 0.001995 9,964,065 34,338 0.35 382 0.001996 10,153,315 35,471 0.35 3,700 0.041997 10,404,259 36,754 0.36 7,000 0.071998 10,700,180 37,371 0.35 10,500 0.101999 11,012,707 41,562 0.38 22,500 0.212000 11,321,496 46,444 0.41 49,000 0.442001 11,623,166 54,607 0.47 55,730 0.482002 11,926,778 73,100 0.62 86,047 0.732003 12,238,739 85,000 0.70 135,114 1.112004 12,569,091 93,000 0.75 222,135 1.782005 12,924,746 102,724 0.80 421,163 3.282006 13,307,535 130,000 0.99 620,163 4.702007 13,713,758 175,209 1.29 1,050,852 7.732008 14,138,207 111,333 0.79 1,507,684 10.772009 14,573,338 111,333 0.77 2,485,646 17.212010 15,013,694 152,108 1.02 3,117,364 20.922011 15,457,531 173,481 1.13 3,951,572 25.692012 15,906,483 227,295 1.43 4,419,599 27.832013
Telephone Lines and Mobile Cellular Subscriptions

20
0
2
4
6
8
10
12
14
16
18
20
0
1
2
3
4
5
19
901
991
19
921
993
19
941
995
19
961
997
19
981
999
20
002
001
20
022
003
20
042
005
20
062
007
20
082
009
20
102
011
20
122
013
No. o
f se
rvers
in M
alaw
i
% o
f po
pula
tion
InternetInternetusers(left axis)
FixedbroadbandInternetsubscribers(left axis)
SecureInternetservers(right axis)
3.4 Internet The internet has been expanding very rapidly but it is still for a very limited population. Infrastructure for utilization of the information and communication technology needs to be further developed.
Source note of the World Development Indicators Internet users: People with access to the worldwide network. Fixed broadband Internet subscribers: Broadband subscribers with a digital subscriber line, cable modem, or other high-speed technology. Secure Internet servers: Servers using encryption technology in Internet transactions.

21
Year
Internetusers
(left axis)
FixedbroadbandInternet
subscribers(left axis)
SecureInternetservers
(right axis)
% of population % of population
1990 0.00001991199219931994199519961997 0.00471998 0.01811999 0.08732000 0.12682001 0.1640 0.00002002 0.2151 0.00002003 0.2788 0.00062004 0.3475 0.0011 12005 0.3845 0.0032 22006 0.4251 22007 0.9659 0.0069 22008 0.7000 0.0070 22009 1.0700 0.0072 42010 2.2600 0.0073 42011 3.3300 0.0074 62012 4.3506 0.0075 142013
Internet
22
0
10
20
30
40
50
60
70
80
90
0.00
0.05
0.10
0.15
0.20
0.25
0.30
0.35
0.40
0.45
19
801
982
19
841
986
19
881
990
19
921
994
19
961
998
20
002
002
20
042
006
20
082
010
20
12
Co
mp
on
en
t in
dic
ato
rs
Hu
man
de
velo
pm
en
t in
de
x
Human Development Index and Component Indicators
Human Development Index(left axis)
GNI per capita (2005 PPP)Unit: 10$(right axis)
Life expectancy at birth(right axis)
Expected years of schooling(right axis)
Mean years of schooling(right axis)
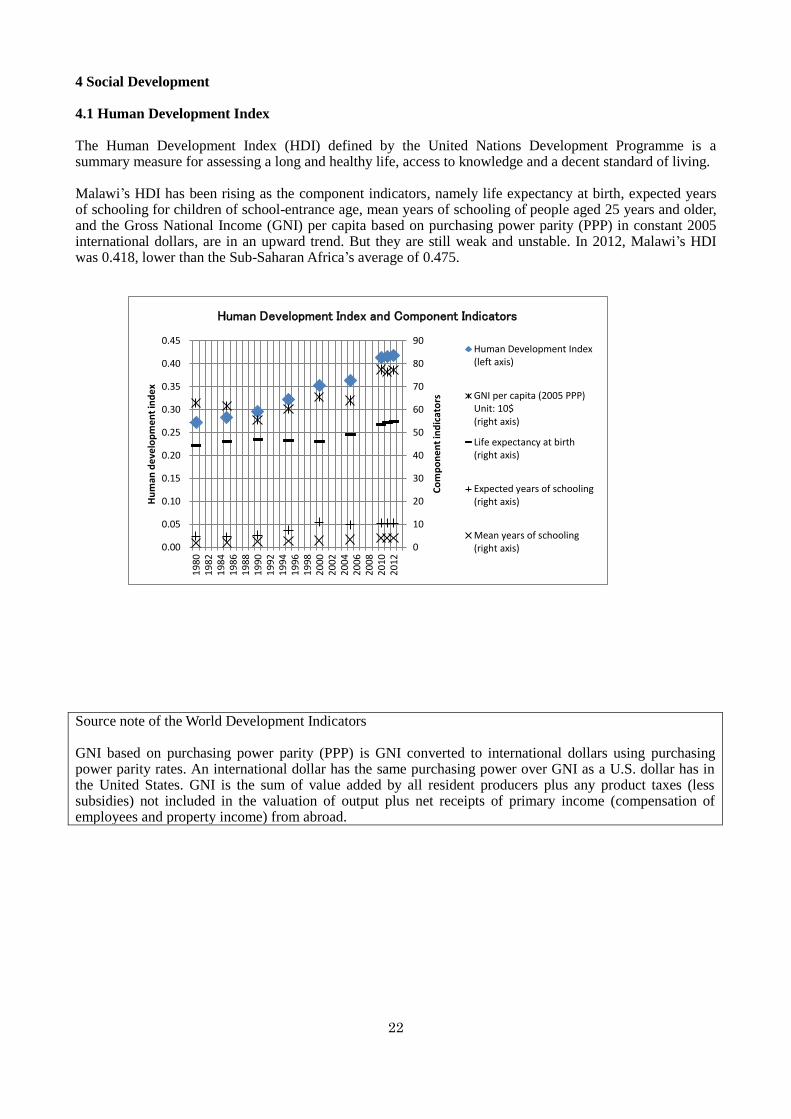
4 Social Development 4.1 Human Development Index The Human Development Index (HDI) defined by the United Nations Development Programme is a summary measure for assessing a long and healthy life, access to knowledge and a decent standard of living. Malawi’s HDI has been rising as the component indicators, namely life expectancy at birth, expected years of schooling for children of school-entrance age, mean years of schooling of people aged 25 years and older, and the Gross National Income (GNI) per capita based on purchasing power parity (PPP) in constant 2005 international dollars, are in an upward trend. But they are still weak and unstable. In 2012, Malawi’s HDI was 0.418, lower than the Sub-Saharan Africa’s average of 0.475.
Source note of the World Development Indicators GNI based on purchasing power parity (PPP) is GNI converted to international dollars using purchasing power parity rates. An international dollar has the same purchasing power over GNI as a U.S. dollar has in the United States. GNI is the sum of value added by all resident producers plus any product taxes (less subsidies) not included in the valuation of output plus net receipts of primary income (compensation of employees and property income) from abroad.

23
Year
Life expectancyat birth
(right axis)
Expected yearsof schooling(right axis)
Mean years ofschooling(right axis)
GNI per capitaGNI per capita
(right axis)
HumanDevelopment
Index(left axis)
years years yearsPPP in
constant 2005international $
PPP inconstant 2005international
10$
1980 44.4 4.8 1.8 628 62.8 0.27219811982198319841985 46.1 4.6 2.1 617 61.7 0.28319861987198819891990 47.1 5.2 2.5 554 55.4 0.29519911992199319941995 46.7 7.5 2.7 602 60.2 0.32219961997199819992000 46.0 11.0 3.0 654 65.4 0.35220012002200320042005 49.0 9.7 3.4 640 64.0 0.36320062007200820092010 53.5 10.4 4.2 775 77.5 0.4132011 54.2 10.4 4.2 763 76.3 0.4152012 54.8 10.4 4.2 774 77.4 0.4182013
Human Development Index and Component Indicators
Source: Human Development Report 2013, UNDP
24
0
10
20
30
40
50
60
70
80
0
1
2
3
4
5
6
7
8
19
611
963
19
651
967
19
691
971
19
731
975
19
771
979
19
811
983
19
851
987
19
891
991
19
931
995
19
971
999
20
012
003
20
052
007
20
092
011
20
13
year
s
birt
hs
per
wom
an
Total Fertility Rate and Life Expectancy at Birth
Totalfertilityrate(left axis)
Lifeexpectancyat birth(right axis)
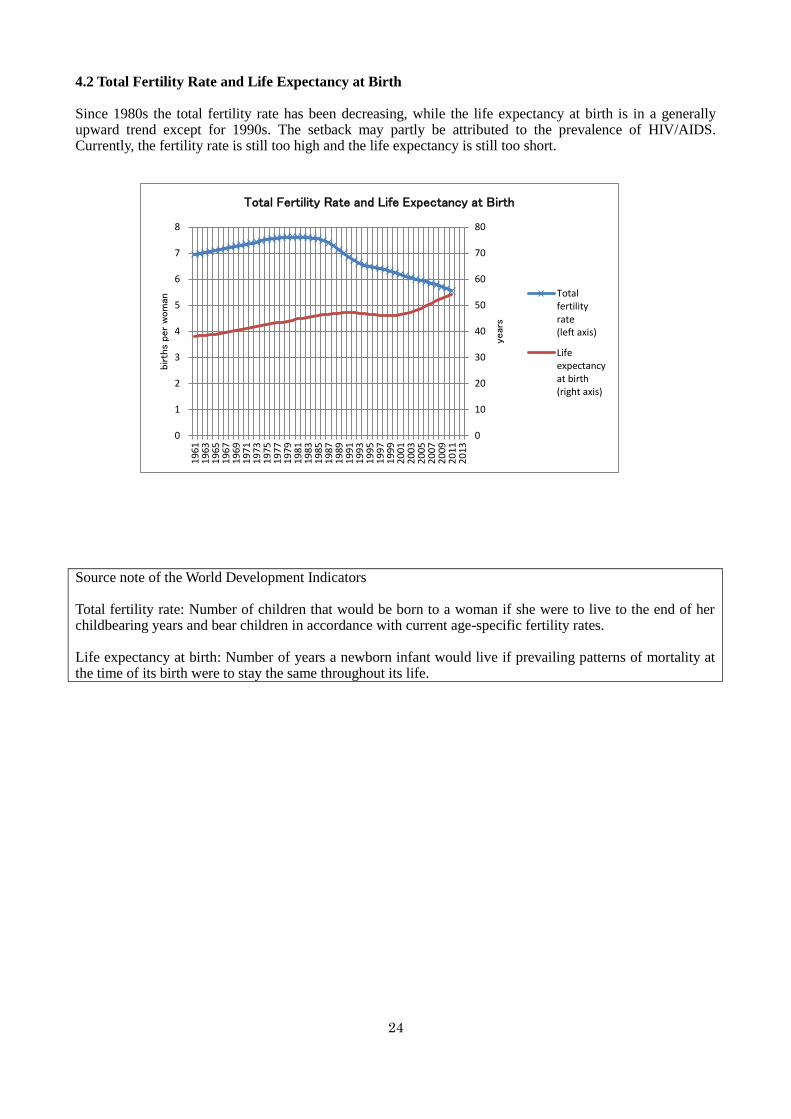
4.2 Total Fertility Rate and Life Expectancy at Birth Since 1980s the total fertility rate has been decreasing, while the life expectancy at birth is in a generally upward trend except for 1990s. The setback may partly be attributed to the prevalence of HIV/AIDS. Currently, the fertility rate is still too high and the life expectancy is still too short.
Source note of the World Development Indicators Total fertility rate: Number of children that would be born to a woman if she were to live to the end of her childbearing years and bear children in accordance with current age-specific fertility rates. Life expectancy at birth: Number of years a newborn infant would live if prevailing patterns of mortality at the time of its birth were to stay the same throughout its life.

25
Year
Totalfertility
rate(left axis)
Lifeexpectancy
at birth(right axis)
birthsper
womanyears
1961 6.9 38.11962 7.0 38.31963 7.0 38.51964 7.1 38.71965 7.1 38.91966 7.1 39.21967 7.2 39.41968 7.2 39.81969 7.3 40.21970 7.3 40.61971 7.3 41.01972 7.4 41.51973 7.4 41.91974 7.5 42.31975 7.5 42.61976 7.6 43.01977 7.6 43.31978 7.6 43.61979 7.6 44.01980 7.6 44.41981 7.6 44.71982 7.6 45.11983 7.6 45.51984 7.6 45.81985 7.5 46.11986 7.5 46.31987 7.4 46.61988 7.3 46.81989 7.1 47.01990 7.0 47.11991 6.9 47.21992 6.7 47.11993 6.6 47.01994 6.5 46.91995 6.5 46.71996 6.4 46.41997 6.4 46.21998 6.4 46.01999 6.3 46.02000 6.3 46.02001 6.2 46.32002 6.1 46.72003 6.1 47.32004 6.0 48.12005 6.0 48.92006 5.9 49.92007 5.8 50.92008 5.8 51.82009 5.7 52.72010 5.6 53.52011 5.6 54.120122013
Total Fertility Rate and Life Expectancy at Birth

26
0
50
100
150
200
250
300
350
400
19
611
963
19
651
967
19
691
971
19
731
975
19
771
979
19
811
983
19
851
987
19
891
991
19
931
995
19
971
999
20
012
003
20
052
007
20
092
011
20
13
per
1,0
00 li
ve b
irth
s
Mortality Rates
Mortality rateunder-5
Mortality rateinfant
4.3 Mortality Rates The mortality rates of infants and under-5 children have considerably decreased in spite of the setback during the middle of the 1980s.
Source note of the World Development Indicators Infant mortality rate: Number of infants dying before reaching one year of age, per 1,000 live births in a given year. Under-five mortality rate: Probability per 1,000 that a newborn baby will die before reaching age five, if subject to current age-specific mortality rates.

27
YearMortality rate
infantMortality rate
under-5
(Mortality rate under-5)-
(Mortality rate infant)
per 1,000live births
per 1,000live births
1961196219631964 217.2 361.7 144.51965 215.7 359.4 143.71966 213.5 355.9 142.41967 211.6 353.0 141.41968 209.2 349.3 140.11969 206.4 344.8 138.41970 202.9 339.3 136.41971 199.1 333.4 134.31972 194.5 326.1 131.61973 189.7 318.5 128.81974 184.4 309.9 125.51975 179.0 301.3 122.31976 173.7 292.6 118.91977 167.9 283.2 115.31978 161.9 273.4 111.51979 156.3 264.2 107.91980 151.5 256.2 104.71981 148.1 250.4 102.31982 146.0 247.0 101.01983 145.4 246.0 100.61984 146.3 247.6 101.31985 147.9 250.3 102.41986 149.1 252.7 103.61987 149.3 253.4 104.11988 148.2 252.1 103.91989 145.8 248.7 102.91990 142.5 243.7 101.21991 138.9 238.1 99.21992 135.3 232.0 96.71993 131.6 225.9 94.31994 127.9 219.4 91.51995 124.4 213.2 88.81996 121.0 207.0 86.01997 117.3 200.3 83.01998 113.2 192.9 79.71999 108.4 184.2 75.82000 102.8 173.9 71.12001 96.5 162.4 65.92002 90.1 150.8 60.72003 83.8 139.7 55.92004 77.9 129.2 51.32005 72.6 119.8 47.22006 67.8 111.4 43.62007 63.4 103.4 40.02008 58.8 95.4 36.62009 55.4 88.5 33.12010 52.6 82.9 30.32011 49.2 77.1 27.92012 46.0 71.0 25.02013
Mortality Rates of Infants and Children under 5 Years Old

28
0
200
400
600
800
1,000
1,2001
990
19
92
19
94
19
96
19
98
20
00
20
02
20
04
20
06
20
08
20
10
20
12
cas
es
per
100,0
00 li
ve b
irth
s
Maternal Mortality Ratio
Maternal mortality ratio(national estimate)
Maternal mortality ratio(modeled estimate)
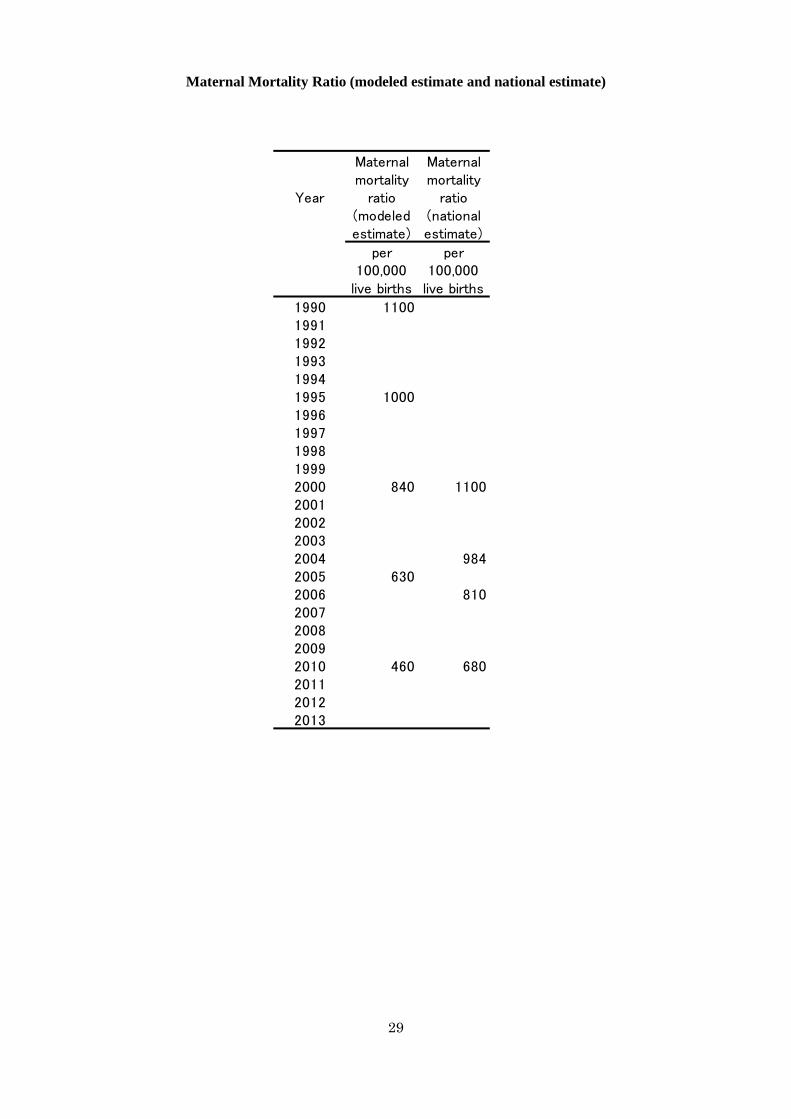
4.4 Maternal Mortality Ratio The maternal mortality ratio has been steadily decreasing, although there is still a serious need for improvement.
Source note of the World Development Indicators Maternal mortality ratio (modeled estimate, per 100,000 live births): Number of women who die during pregnancy and childbirth, per 100,000 live births. The data are estimated with a regression model using information on fertility, birth attendants, and HIV prevalence. Maternal mortality ratio (national estimate, per 100,000 live births): Number of women who die from pregnancy-related causes while pregnant or within 42 days of pregnancy termination per 100,000 live births.
29
Year
Maternalmortality
ratio(modeledestimate)
Maternalmortality
ratio(nationalestimate)
per100,000
live births
per100,000
live births
1990 110019911992199319941995 100019961997199819992000 840 11002001200220032004 9842005 6302006 8102007200820092010 460 680201120122013
Maternal Mortality Ratio (modeled estimate and national estimate)
30
0
50
100
150
200
250
300
350
400
450
500
0
5
10
15
20
25
30
35
40
45
50
19
90
19
92
19
94
19
96
19
98
20
00
20
02
20
04
20
06
20
08
20
10
20
12
kilo
cal
ories
per
day
per
pers
on
% o
f po
pula
tion
Undernourishment and Food Deficit
Prevalenceof under-nourishment(left axis)
Depth offood deficit(right axis)
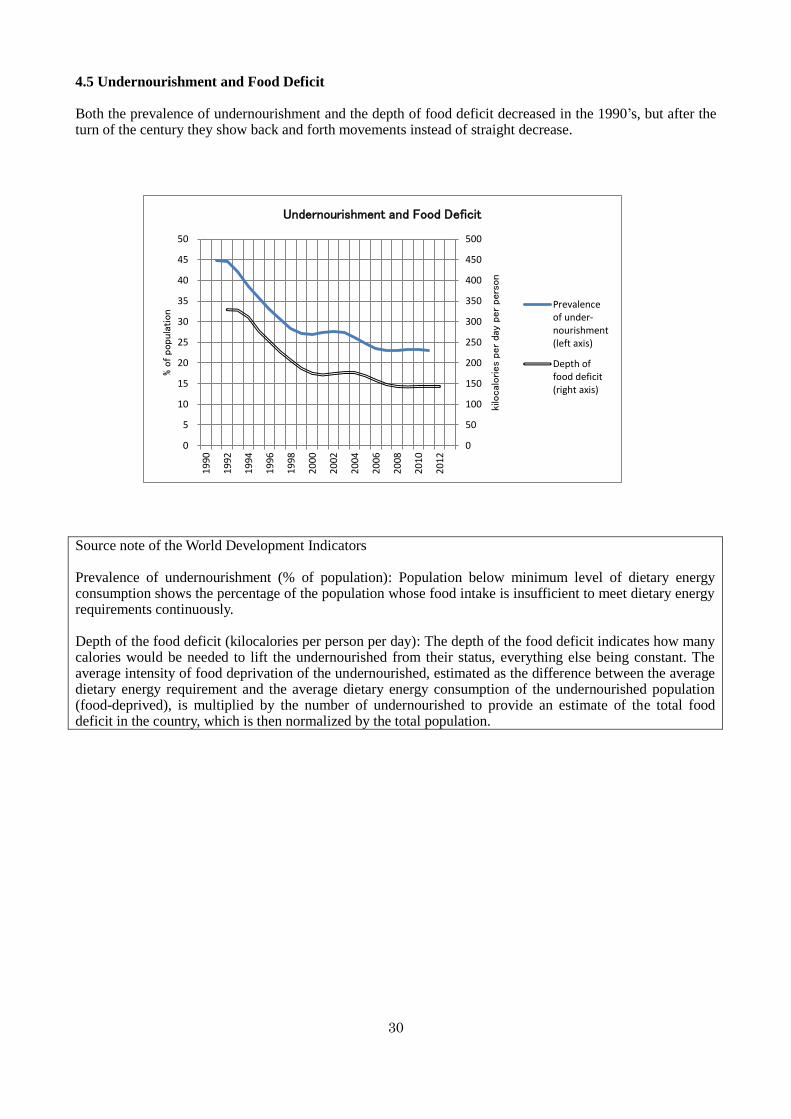
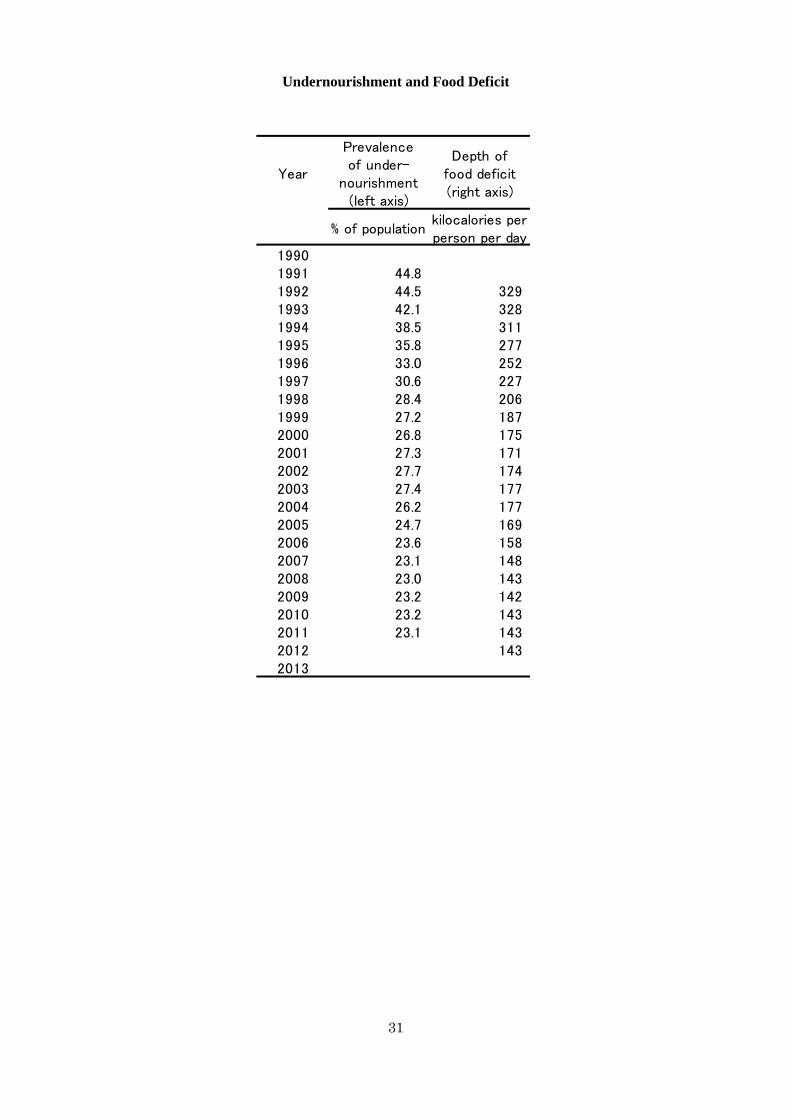
4.5 Undernourishment and Food Deficit Both the prevalence of undernourishment and the depth of food deficit decreased in the 1990’s, but after the turn of the century they show back and forth movements instead of straight decrease.
Source note of the World Development Indicators Prevalence of undernourishment (% of population): Population below minimum level of dietary energy consumption shows the percentage of the population whose food intake is insufficient to meet dietary energy requirements continuously. Depth of the food deficit (kilocalories per person per day): The depth of the food deficit indicates how many calories would be needed to lift the undernourished from their status, everything else being constant. The average intensity of food deprivation of the undernourished, estimated as the difference between the average dietary energy requirement and the average dietary energy consumption of the undernourished population (food-deprived), is multiplied by the number of undernourished to provide an estimate of the total food deficit in the country, which is then normalized by the total population.
31
Year
Prevalenceof under-
nourishment(left axis)
Depth offood deficit(right axis)
% of populationkilocalories perperson per day
19901991 44.81992 44.5 3291993 42.1 3281994 38.5 3111995 35.8 2771996 33.0 2521997 30.6 2271998 28.4 2061999 27.2 1872000 26.8 1752001 27.3 1712002 27.7 1742003 27.4 1772004 26.2 1772005 24.7 1692006 23.6 1582007 23.1 1482008 23.0 1432009 23.2 1422010 23.2 1432011 23.1 1432012 1432013
Undernourishment and Food Deficit

32
0
10
20
30
40
50
60
70
80
90
100
0
2
4
6
8
10
12
14
16
18
20
19
90
19
92
19
94
19
96
19
98
20
00
20
02
20
04
20
06
20
08
20
10
20
12
Cove
rage
%
Pre
vale
nce %
Prevalence and Therapy of HIV
Prevalenceof HIV ofpopulationaged 15-49(left axis)
Prevalenceof HIV ofpopulationaged 0-14(left axis)
Antiretroviral therapycoverage of people withadvanced HIV infection(right axis)
4.6 Prevalence and Therapy of HIV The prevalence of HIV of population aged 15 to 49 hit a peak at 16.1% in 1997 then gradually decreased to 10.8% in 2012. Among the population under 15 years of age, the prevalence has been slowly decreasing from 3.1% in 2004 to 2.5% in 2012. The antiretroviral therapy coverage has been increasing in recent years among people with advanced HIV infection.

33
Year
Prevalenceof HIV ofpopulation
aged 15-49(left axis)
Children(0-14)
living withHIV
Populationaged0-14
Prevalenceof HIV ofpopulationaged 0-14(left axis)
Antiretroviraltherapy coverage
of people withadvanced HIV
infection(right axis)
% % %
1990 11.6 43,000 4,326,435 1.01991 12.6 53,000 4,391,151 1.21992 13.5 62,000 4,406,008 1.41993 14.3 72,000 4,397,115 1.61994 14.9 83,000 4,402,140 1.91995 15.5 94,000 4,448,057 2.11996 15.9 100,000 4,544,066 2.21997 16.1 120,000 4,681,342 2.61998 16.0 130,000 4,846,978 2.71999 16.0 140,000 5,020,443 2.82000 15.8 150,000 5,186,809 2.92001 15.5 160,000 5,342,561 3.02002 15.1 160,000 5,492,908 2.92003 14.6 170,000 5,641,855 3.02004 14.0 180,000 5,796,167 3.12005 13.4 180,000 5,960,485 3.02006 12.9 180,000 6,135,774 2.92007 12.4 190,000 6,319,209 3.02008 11.9 190,000 6,507,202 2.92009 11.5 190,000 6,694,672 2.8 402010 11.2 190,000 6,878,062 2.8 472011 11.0 180,000 7,055,632 2.6 582012 10.8 180,000 7,228,657 2.5 692013
Prevalence and Therapy of HIV
34
0
10
20
30
40
50
60
70
80
90
100
0
50
100
150
200
250
300
350
400
450
500
19
90
19
92
19
94
19
96
19
98
20
00
20
02
20
04
20
06
20
08
20
10
20
12
dete
ction
rate
%
cas
es
per
100,0
00 p
eopl
e
Incidence and Detection of Tuberculosis
Incidenceoftuberculosis(left axis)
Tuberculosiscasedetectionrate(right axis)
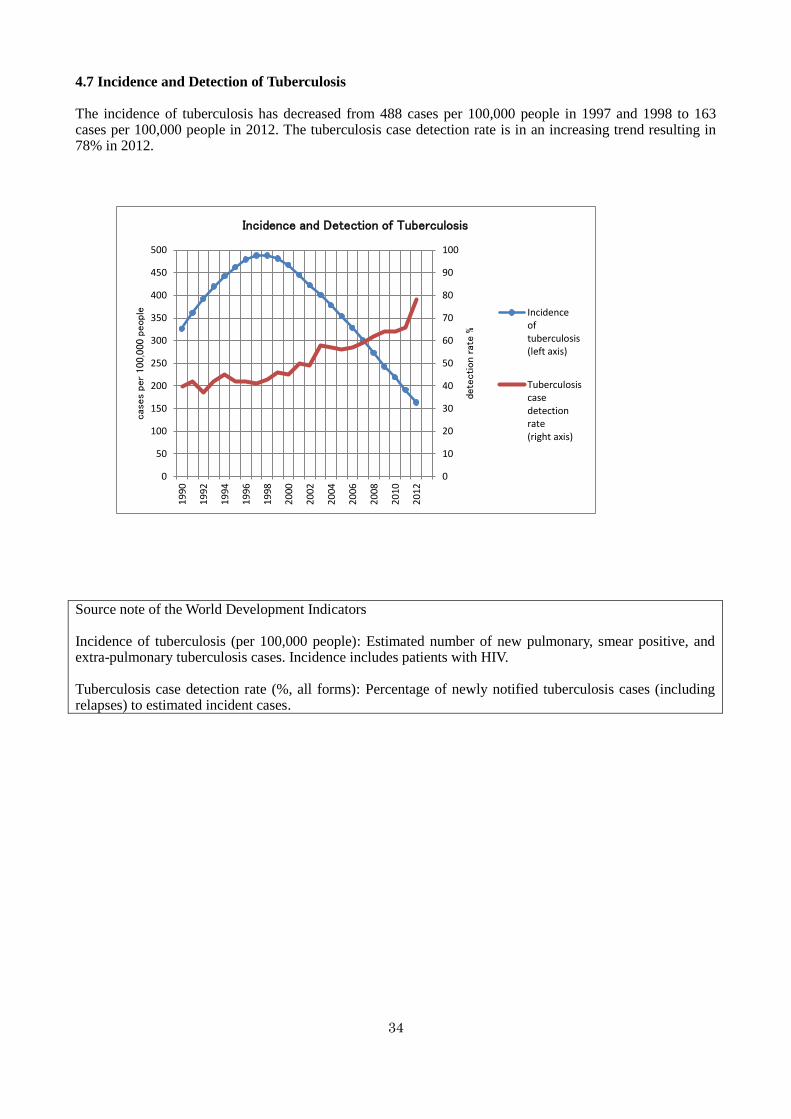
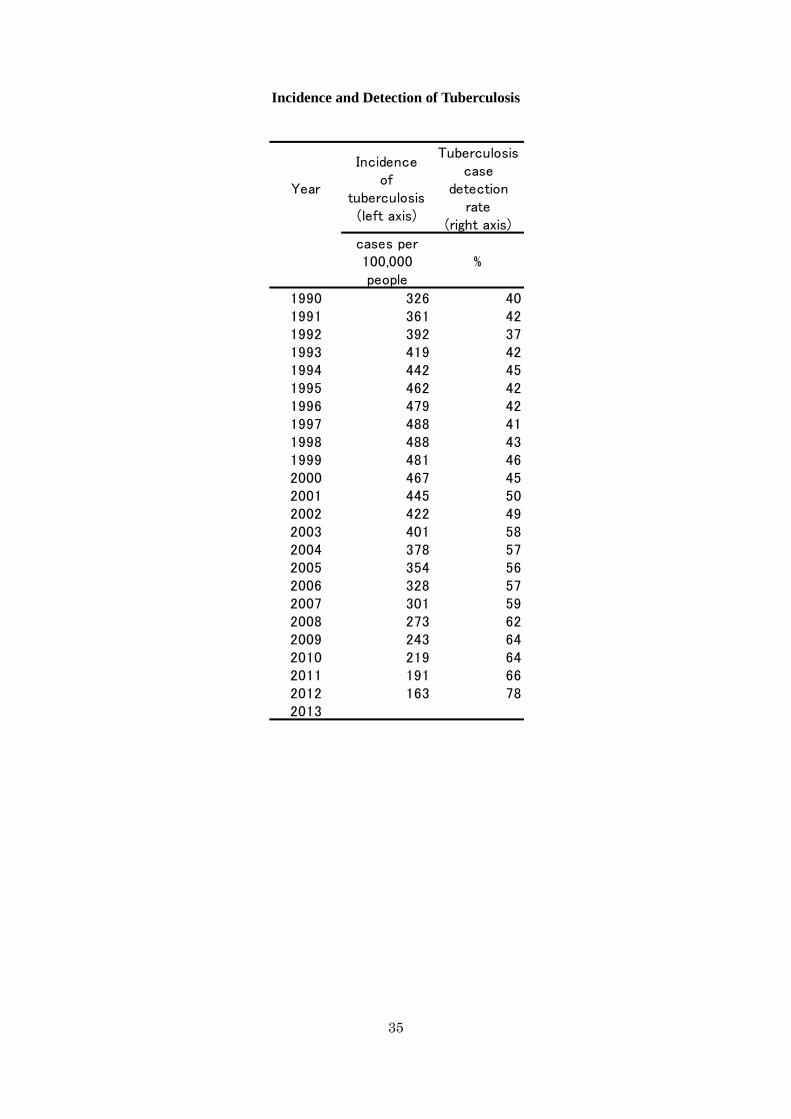
4.7 Incidence and Detection of Tuberculosis The incidence of tuberculosis has decreased from 488 cases per 100,000 people in 1997 and 1998 to 163 cases per 100,000 people in 2012. The tuberculosis case detection rate is in an increasing trend resulting in 78% in 2012.
Source note of the World Development Indicators Incidence of tuberculosis (per 100,000 people): Estimated number of new pulmonary, smear positive, and extra-pulmonary tuberculosis cases. Incidence includes patients with HIV. Tuberculosis case detection rate (%, all forms): Percentage of newly notified tuberculosis cases (including relapses) to estimated incident cases.
35
Year
Incidenceof
tuberculosis(left axis)
Tuberculosiscase
detectionrate
(right axis)
cases per100,000people
%
1990 326 401991 361 421992 392 371993 419 421994 442 451995 462 421996 479 421997 488 411998 488 431999 481 462000 467 452001 445 502002 422 492003 401 582004 378 572005 354 562006 328 572007 301 592008 273 622009 243 642010 219 642011 191 662012 163 782013
Incidence and Detection of Tuberculosis
36
0
10
20
30
40
50
60
70
80
90
100
2000 2001 2002 2003 2004 2005 2006 2007 2008 2009 2010 2011 2012 2013
%
Children Receiving Antimalarial Drugsamong Children under Age 5 with Fever
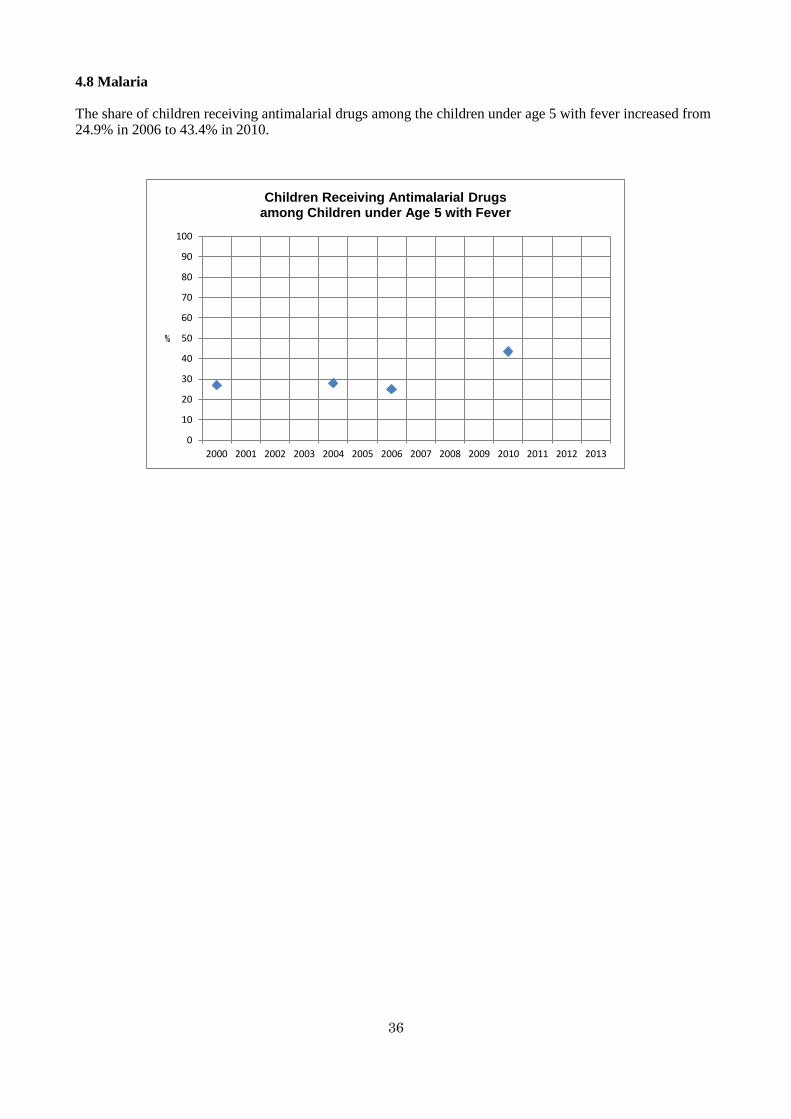
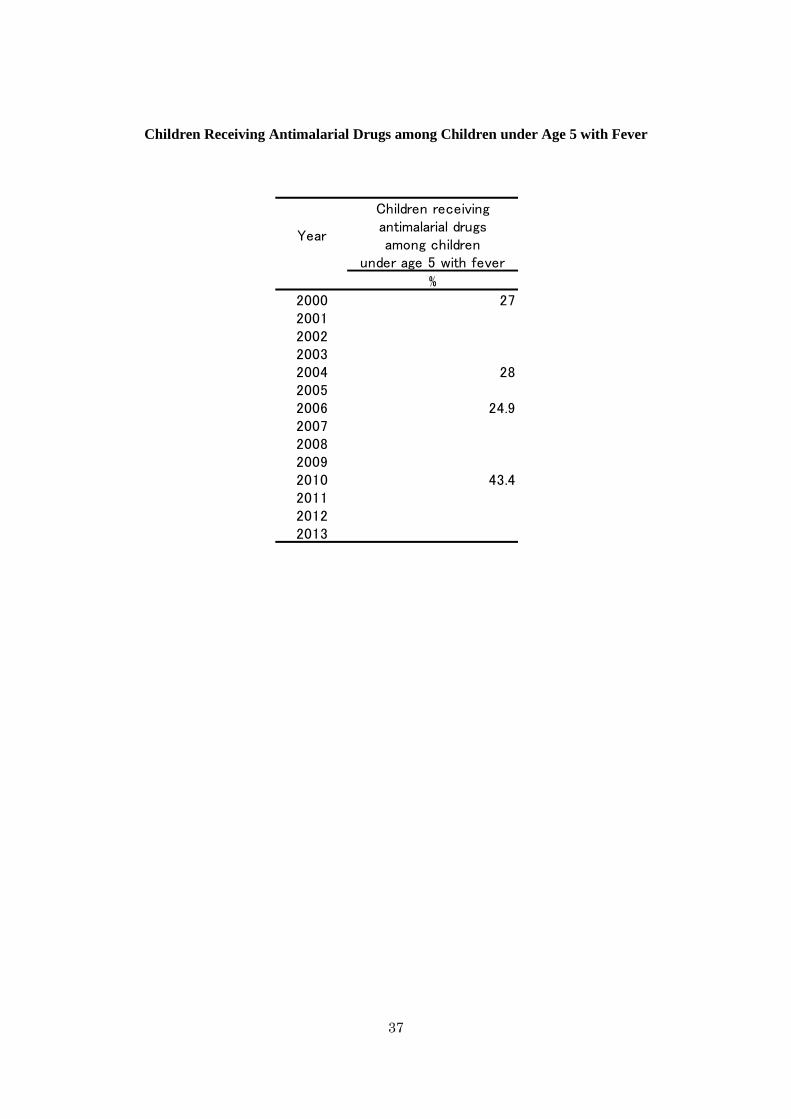
4.8 Malaria The share of children receiving antimalarial drugs among the children under age 5 with fever increased from 24.9% in 2006 to 43.4% in 2010.
37
Year
Children receivingantimalarial drugsamong children
under age 5 with fever
%
2000 272001200220032004 2820052006 24.92007200820092010 43.4201120122013
Children Receiving Antimalarial Drugs among Children under Age 5 with Fever
38
0
10
20
30
40
50
60
70
80
90
100
19
90
19
92
19
94
19
96
19
98
20
00
20
02
20
04
20
06
20
08
20
10
20
12
% o
f po
pula
tion
Poverty Headcount
Poverty headcount ratioat $2 a day (PPP)
Poverty headcount ratioat $1.25 a day (PPP)
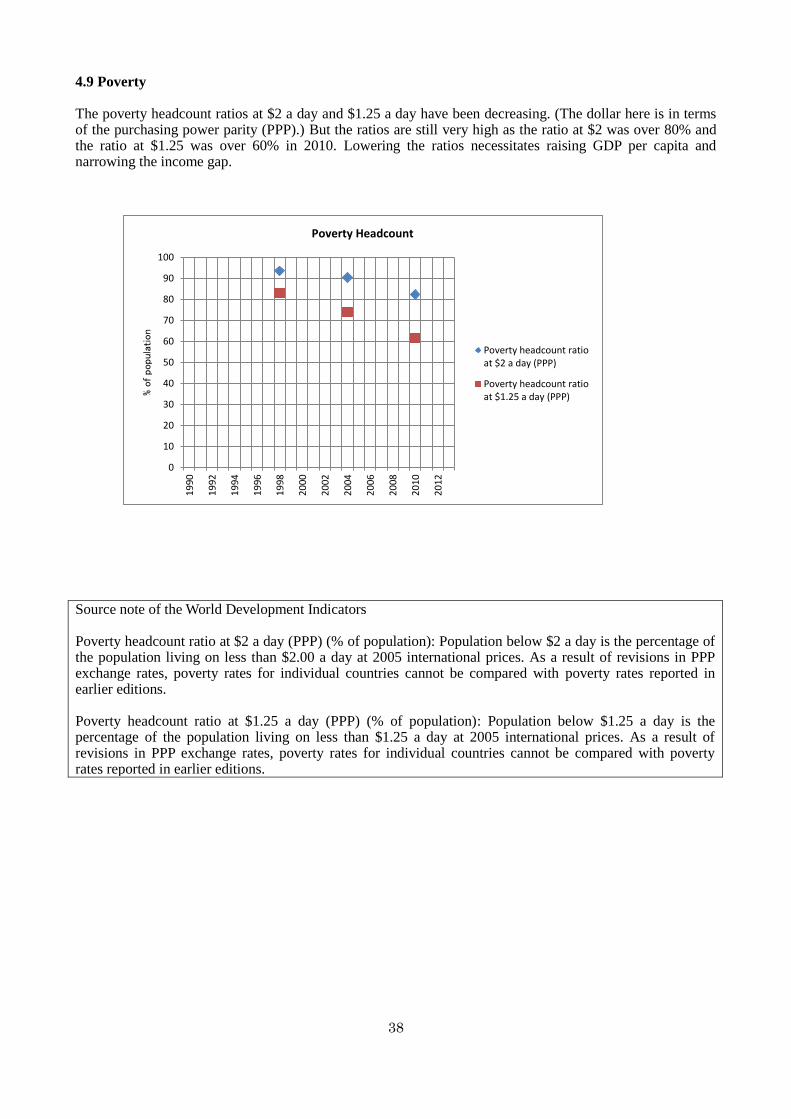
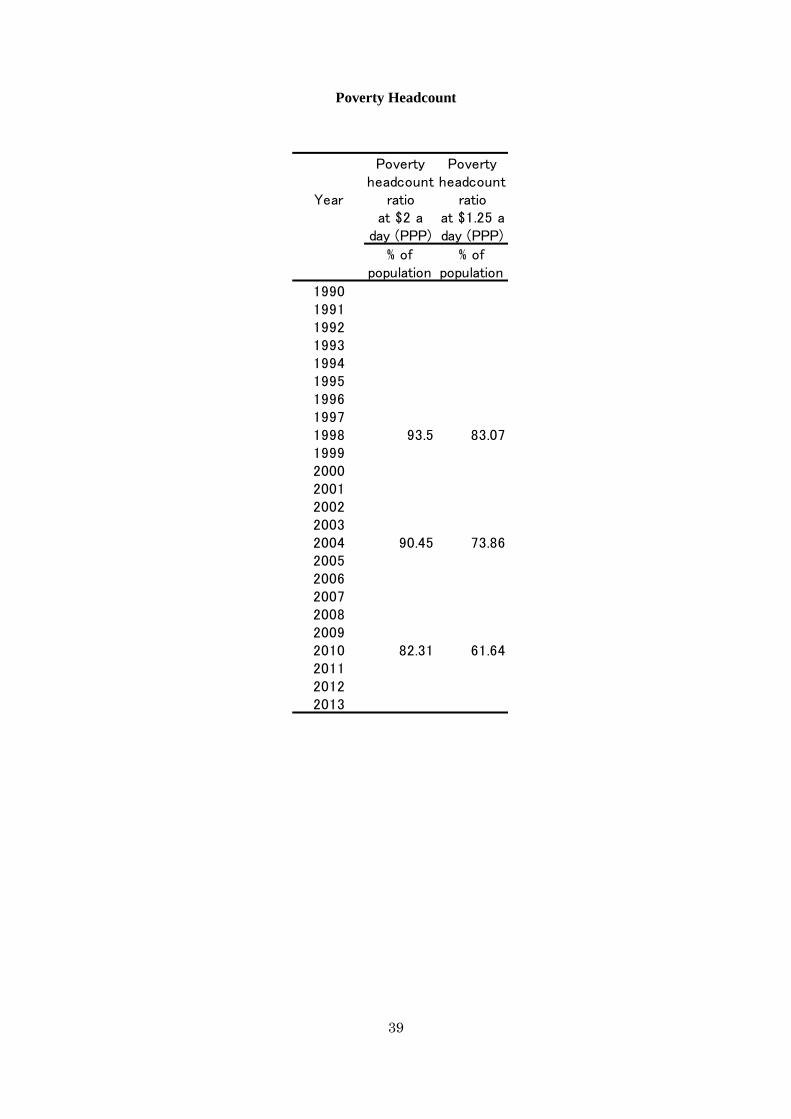
4.9 Poverty The poverty headcount ratios at $2 a day and $1.25 a day have been decreasing. (The dollar here is in terms of the purchasing power parity (PPP).) But the ratios are still very high as the ratio at $2 was over 80% and the ratio at $1.25 was over 60% in 2010. Lowering the ratios necessitates raising GDP per capita and narrowing the income gap.
Source note of the World Development Indicators Poverty headcount ratio at $2 a day (PPP) (% of population): Population below $2 a day is the percentage of the population living on less than $2.00 a day at 2005 international prices. As a result of revisions in PPP exchange rates, poverty rates for individual countries cannot be compared with poverty rates reported in earlier editions. Poverty headcount ratio at $1.25 a day (PPP) (% of population): Population below $1.25 a day is the percentage of the population living on less than $1.25 a day at 2005 international prices. As a result of revisions in PPP exchange rates, poverty rates for individual countries cannot be compared with poverty rates reported in earlier editions.
39
Year
Povertyheadcount
ratioat $2 a
day (PPP)
Povertyheadcount
ratioat $1.25 aday (PPP)
% ofpopulation
% ofpopulation
199019911992199319941995199619971998 93.5 83.07199920002001200220032004 90.45 73.86200520062007200820092010 82.31 61.64201120122013
Poverty Headcount

40
0
20
40
60
80
100
120
140
160
180
19
61
19
63
19
65
19
67
19
69
19
71
19
73
19
75
19
77
19
79
19
81
19
83
19
85
19
87
19
89
19
91
19
93
19
95
19
97
19
99
20
01
20
03
20
05
20
07
20
09
20
11
20
13
%
Gross Enrollment Ratio
Primaryschools
Secondaryschools
Tertiaryschools
0.0
0.1
0.2
0.3
0.4
0.5
0.6
0.7
0.8
0.9
1.0
19
61
19
63
19
65
19
67
19
69
19
71
19
73
19
75
19
77
19
79
19
81
19
83
19
85
19
87
19
89
19
91
19
93
19
95
19
97
19
99
20
01
20
03
20
05
20
07
20
09
20
11
20
13
%
Gross Enrollment Ratio of Tertary Schools
Tertiaryschools
5 Education 5.1 School Education The gross enrollment ratio of primary schools jumped to over 160% in 1995 after the introduction of free primary education in 1994. After this peak, the ratio has been between 120% and 140%. The gross enrollment ratio of secondary schools hit the peak at 38% in 1999, then it has remained around 30%. The gross enrollment of tertiary schools has been less than 1%, although an increasing trend is observed in recent years. In primary schools, the gross enrollment ratio of girls has been higher than that of boys since 2004. In secondary and tertiary schools, the ratio of girls is lower than the boys’ but the gap has been narrowing.
Source note of the World Development Indicators Gross enrollment ratio: Total enrollment in the education, regardless of age. The ratio can exceed 100% due to the inclusion of over-aged and under-aged students because of late or early school entrance and grade repetition.
0
20
40
60
80
100
120
140
160
180
196
1
196
3
196
5
196
7
196
9
197
1
197
3
197
5
197
7
197
9
198
1
198
3
198
5
198
7
198
9
199
1
199
3
199
5
199
7
199
9
200
1
200
3
200
5
200
7
200
9
201
1
201
3
%
Gross Enrollment Ratio of Primary Schools
male
female
0
5
10
15
20
25
30
35
40
45
50
196
1
196
3
196
5
196
7
196
9
197
1
197
3
197
5
197
7
197
9
198
1
198
3
198
5
198
7
198
9
199
1
199
3
199
5
199
7
199
9
200
1
200
3
200
5
200
7
200
9
201
1
201
3
%
Gross Enrollment Ratio of Secondary Schools
male
female
0.0
0.2
0.4
0.6
0.8
1.0
1.2
19
61
19
63
19
65
19
67
19
69
19
71
19
73
19
75
19
77
19
79
19
81
19
83
19
85
19
87
19
89
19
91
19
93
19
95
19
97
19
99
20
01
20
03
20
05
20
07
20
09
20
11
20
13
%
Gross Enrollment Ratio of Tertiary Schools
male
female

41
Year
Primaryschools
Secondaryschools
Tertiaryschools
both sexes both sexes both sexes male female male female male female
% % % % % % % % %
19611962196319641965196619671968196919701971 39.71972 46.2 10.2 58.6 34.5 14.1 6.61973 50.0 10.7 0.4 62.9 37.8 15.8 6.01974 54.9 10.2 0.4 67.8 42.71975 60.3 11.3 0.5 74.0 47.2 16.7 6.21976 61.0 11.6 0.4 73.9 48.7 17.2 6.41977 60.3 12.7 0.4 72.0 49.1 18.7 7.01978 58.9 13.4 0.4 69.5 48.8 19.9 7.31979 59.9 13.6 0.4 70.1 49.9 19.9 7.81980 63.8 15.6 0.5 74.0 53.8 22.2 9.3 0.7 0.21981 64.1 16.1 0.5 73.3 55.0 23.3 9.2 0.7 0.21982 67.6 17.0 0.5 76.5 58.9 24.2 10.0 0.7 0.21983 63.5 16.9 0.5 70.9 56.1 23.8 10.3 0.7 0.21984 58.3 17.4 0.5 64.6 51.9 24.2 10.8 0.7 0.21985 59.3 17.1 0.5 65.5 53.0 23.4 11.0 0.7 0.21986 58.5 16.9 0.5 63.7 53.2 22.7 11.3 0.7 0.21987 59.7 17.1 0.5 64.3 54.9 22.6 11.7 0.7 0.21988 59.0 16.6 0.4 63.2 54.8 21.4 11.8 0.7 0.21989 65.3 16.0 0.5 69.9 60.6 20.5 11.5 0.8 0.21990 71.0 16.1 0.5 76.1 65.9 20.4 11.8 0.8 0.31991 75.0 16.3 0.6 80.1 69.8 20.2 12.3 0.8 0.31992 91.9 18.5 0.6 98.0 85.7 0.8 0.31993 99.7 17.6 0.6 102.4 96.9 21.9 13.2 0.9 0.31994 108.4 15.8 0.6 110.4 106.4 19.1 12.5 0.9 0.31995 161.1 23.6 0.6 168.2 154.0 28.2 19.1 0.8 0.31996 156.6 25.1 0.6 163.3 150.0 30.0 20.3 0.8 0.319971998 139.6 33.31999 136.8 38.0 0.3 139.6 134.0 44.6 31.4 0.4 0.22000 137.5 32.0 0.3 139.9 135.2 36.6 27.5 0.5 0.22001 139.9 32.8 0.4 142.1 137.7 36.9 28.72002 135.4 31.5 0.4 137.4 133.3 35.4 27.5 0.6 0.22003 0.42004 128.3 28.3 0.5 126.6 130.0 31.2 25.3 0.7 0.42005 126.8 27.8 0.5 125.2 128.4 30.5 24.9 0.6 0.32006 126.7 29.3 0.5 124.5 129.0 31.8 26.8 0.7 0.32007 124.2 28.7 0.5 122.1 126.4 31.3 26.1 0.7 0.32008 131.9 30.9 130.2 133.7 33.4 28.42009 130.9 31.5 129.1 132.8 33.5 29.42010 137.7 32.7 0.7 135.2 140.2 34.2 31.1 0.9 0.52011 140.2 33.8 0.8 137.4 142.9 35.3 32.3 1.0 0.62012 141.3 34.2 138.7 143.9 36.1 32.42013
Primary schools Secondary schools Tertiary schools
School Enrollment Ratios
42
0
10
20
30
40
50
60
70
80
90
100
19
85
19
87
19
89
19
91
19
93
19
95
19
97
19
99
20
01
20
03
20
05
20
07
20
09
20
11
20
13
%
Literacy Rate of Adults Aged 15 and Above
Male
Both
Female
0
10
20
30
40
50
60
70
80
90
100
19
85
19
87
19
89
19
91
19
93
19
95
19
97
19
99
20
01
20
03
20
05
20
07
20
09
20
11
20
13
%
Literacy Rate of Youth Aged 15 to 24
Male
Both
Female
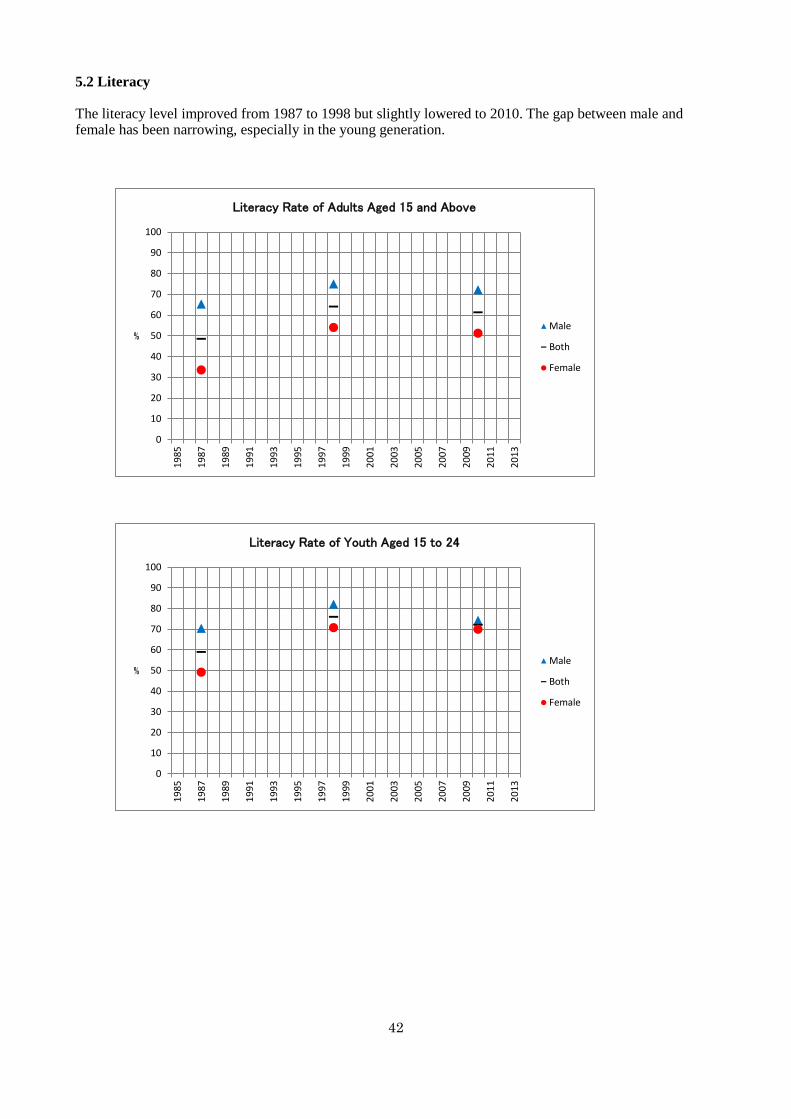
5.2 Literacy The literacy level improved from 1987 to 1998 but slightly lowered to 2010. The gap between male and female has been narrowing, especially in the young generation.

43
Year Female Male Both Female Male Both
% % % % % %
198519861987 33.5 65.3 48.5 49.1 70.4 59.019881989199019911992199319941995199619971998 54.0 74.9 64.1 70.7 82.1 76.0199920002001200220032004200520062007200820092010 51.3 72.1 61.3 70.0 74.3 72.1201120122013
Adults aged 15 and above Youth aged 15 to 24
Literacy Rate

44
0
500
1,000
1,500
2,000
2,500
3,000
3,500
4,0001
961
19
63
19
65
19
67
19
69
19
71
19
73
19
75
19
77
19
79
19
81
19
83
19
85
19
87
19
89
19
91
19
93
19
95
19
97
19
99
20
01
20
03
20
05
20
07
20
09
20
11
mill
ion U
S$ a
t const
ant
2005 pr
ices
GDP
0
50
100
150
200
250
300
19
61
19
63
19
65
19
67
19
69
19
71
19
73
19
75
19
77
19
79
19
81
19
83
19
85
19
87
19
89
19
91
19
93
19
95
19
97
19
99
20
01
20
03
20
05
20
07
20
09
20
11
20
13
Const
ant
2005 U
S$
GDP per capita
0
500
1,000
1,500
2,000
2,500
3,000
3,500
4,000
19
75
19
77
19
79
19
81
19
83
19
85
19
87
19
89
19
91
19
93
19
95
19
97
19
99
20
01
20
03
20
05
20
07
20
09
20
11
20
13
mill
ion U
S$ a
t const
ant
2005 pr
ices
Value Added of Agriculture, Manufacturing,Industry except Manufacturing, and Services Services
valueadded
IndustryexceptmanufacturingvalueaddedManufacturingvalueadded
Agriculturevalueadded
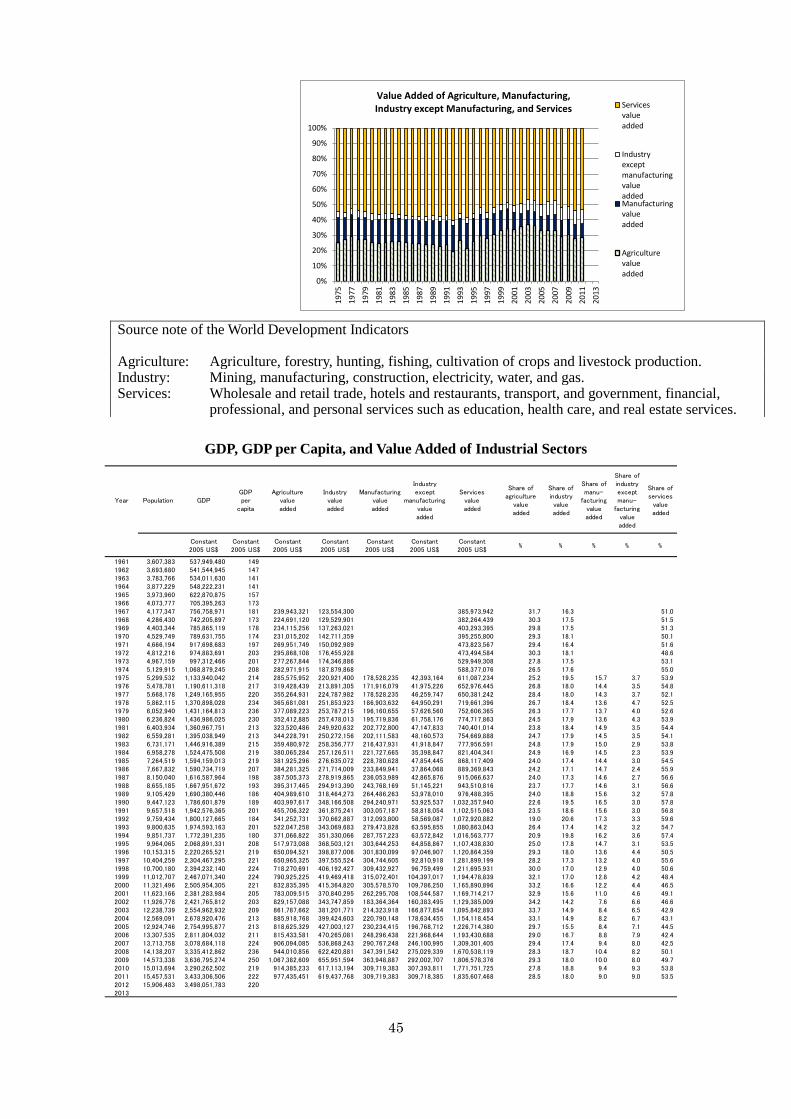
6 Economy 6.1 Gross Domestic Product (GDP) The gross domestic product (GDP) has been steadily increasing in a long run. However, the GDP per capita is not in an increasing trend because the population is also growing. The shares of the value added by sectors, namely agriculture, manufacturing, industry except manufacturing, and services, have not changed much, although the share of manufacturing has decreased.
45
Year Population GDPGDPper
capita
Agriculturevalueadded
Industryvalueadded
Manufacturingvalueadded
Industryexcept
manufacturingvalueadded
Servicesvalueadded
Share ofagriculture
valueadded
Share ofindustryvalueadded
Share ofmanu-
facturingvalueadded
Share ofindustryexceptmanu-
facturingvalueadded
Share ofservices
valueadded
Constant2005 US$
Constant2005 US$
Constant2005 US$
Constant2005 US$
Constant2005 US$
Constant2005 US$
Constant2005 US$
% % % % %
1961 3,607,383 537,949,480 1491962 3,693,680 541,544,945 1471963 3,783,766 534,011,630 1411964 3,877,229 548,222,231 1411965 3,973,960 622,870,875 1571966 4,073,777 705,395,263 1731967 4,177,347 756,758,971 181 239,943,321 123,554,300 385,973,942 31.7 16.3 51.01968 4,286,430 742,205,897 173 224,691,120 129,529,901 382,264,439 30.3 17.5 51.51969 4,403,344 785,865,119 178 234,115,256 137,263,021 403,293,395 29.8 17.5 51.31970 4,529,749 789,631,755 174 231,015,202 142,711,359 395,255,800 29.3 18.1 50.11971 4,666,194 917,698,683 197 269,951,749 150,092,989 473,823,567 29.4 16.4 51.61972 4,812,216 974,883,691 203 295,868,108 176,455,928 473,494,584 30.3 18.1 48.61973 4,967,159 997,312,466 201 277,267,844 174,346,886 529,949,308 27.8 17.5 53.11974 5,129,915 1,068,879,245 208 282,971,915 187,879,868 588,377,076 26.5 17.6 55.01975 5,299,532 1,133,940,042 214 285,575,952 220,921,400 178,528,235 42,393,164 611,087,234 25.2 19.5 15.7 3.7 53.91976 5,478,781 1,190,611,318 217 319,428,439 213,891,305 171,916,079 41,975,226 652,976,445 26.8 18.0 14.4 3.5 54.81977 5,668,178 1,249,165,955 220 355,264,931 224,787,982 178,528,235 46,259,747 650,381,242 28.4 18.0 14.3 3.7 52.11978 5,862,115 1,370,898,028 234 365,681,081 251,853,923 186,903,632 64,950,291 719,661,396 26.7 18.4 13.6 4.7 52.51979 6,052,940 1,431,164,813 236 377,089,223 253,787,215 196,160,655 57,626,560 752,606,365 26.3 17.7 13.7 4.0 52.61980 6,236,824 1,436,986,025 230 352,412,885 257,478,013 195,719,836 61,758,176 774,717,863 24.5 17.9 13.6 4.3 53.91981 6,403,934 1,360,967,751 213 323,520,486 249,920,632 202,772,800 47,147,833 740,401,014 23.8 18.4 14.9 3.5 54.41982 6,559,281 1,395,038,949 213 344,228,791 250,272,156 202,111,583 48,160,573 754,669,888 24.7 17.9 14.5 3.5 54.11983 6,731,171 1,446,916,389 215 359,480,972 258,356,777 216,437,931 41,918,847 777,956,591 24.8 17.9 15.0 2.9 53.81984 6,958,278 1,524,475,508 219 380,065,284 257,126,511 221,727,665 35,398,847 821,404,341 24.9 16.9 14.5 2.3 53.91985 7,264,519 1,594,159,013 219 381,925,296 276,635,072 228,780,628 47,854,445 868,117,409 24.0 17.4 14.4 3.0 54.51986 7,667,832 1,590,734,719 207 384,281,325 271,714,009 233,849,941 37,864,068 889,369,843 24.2 17.1 14.7 2.4 55.91987 8,150,040 1,616,587,964 198 387,505,373 278,919,865 236,053,989 42,865,876 915,066,637 24.0 17.3 14.6 2.7 56.61988 8,655,185 1,667,951,672 193 395,317,465 294,913,390 243,768,169 51,145,221 943,510,816 23.7 17.7 14.6 3.1 56.61989 9,105,429 1,690,380,446 186 404,989,610 318,464,273 264,486,263 53,978,010 976,488,395 24.0 18.8 15.6 3.2 57.81990 9,447,123 1,786,601,879 189 403,997,617 348,166,508 294,240,971 53,925,537 1,032,357,940 22.6 19.5 16.5 3.0 57.81991 9,657,518 1,942,576,365 201 455,706,322 361,875,241 303,057,187 58,818,054 1,102,515,063 23.5 18.6 15.6 3.0 56.81992 9,759,434 1,800,127,665 184 341,252,731 370,662,887 312,093,800 58,569,087 1,072,920,882 19.0 20.6 17.3 3.3 59.61993 9,800,635 1,974,593,163 201 522,047,258 343,069,683 279,473,828 63,595,855 1,080,863,043 26.4 17.4 14.2 3.2 54.71994 9,851,737 1,772,391,235 180 371,066,822 351,330,066 287,757,223 63,572,842 1,016,563,777 20.9 19.8 16.2 3.6 57.41995 9,964,065 2,068,891,331 208 517,973,088 368,503,121 303,644,253 64,858,867 1,107,438,830 25.0 17.8 14.7 3.1 53.51996 10,153,315 2,220,265,521 219 650,094,521 398,877,006 301,830,099 97,046,907 1,120,864,359 29.3 18.0 13.6 4.4 50.51997 10,404,259 2,304,467,295 221 650,965,325 397,555,524 304,744,605 92,810,918 1,281,899,199 28.2 17.3 13.2 4.0 55.61998 10,700,180 2,394,232,140 224 718,270,691 406,192,427 309,432,927 96,759,499 1,211,695,931 30.0 17.0 12.9 4.0 50.61999 11,012,707 2,467,071,340 224 790,925,225 419,469,418 315,072,401 104,397,017 1,194,478,839 32.1 17.0 12.8 4.2 48.42000 11,321,496 2,505,954,305 221 832,835,395 415,364,820 305,578,570 109,786,250 1,165,890,896 33.2 16.6 12.2 4.4 46.52001 11,623,166 2,381,283,984 205 783,009,515 370,840,295 262,295,708 108,544,587 1,169,714,217 32.9 15.6 11.0 4.6 49.12002 11,926,778 2,421,765,812 203 829,157,088 343,747,859 183,364,364 160,383,495 1,129,385,009 34.2 14.2 7.6 6.6 46.62003 12,238,739 2,554,962,932 209 861,787,662 381,201,771 214,323,918 166,877,854 1,095,842,893 33.7 14.9 8.4 6.5 42.92004 12,569,091 2,678,920,476 213 885,918,768 399,424,603 220,790,148 178,634,455 1,154,118,454 33.1 14.9 8.2 6.7 43.12005 12,924,746 2,754,995,877 213 818,625,329 427,003,127 230,234,415 196,768,712 1,226,714,380 29.7 15.5 8.4 7.1 44.52006 13,307,535 2,811,804,032 211 815,433,581 470,265,081 248,296,438 221,968,644 1,193,430,688 29.0 16.7 8.8 7.9 42.42007 13,713,758 3,078,684,118 224 906,094,085 536,868,243 290,767,248 246,100,995 1,309,301,405 29.4 17.4 9.4 8.0 42.52008 14,138,207 3,335,412,862 236 944,010,856 622,420,881 347,391,542 275,029,339 1,670,538,119 28.3 18.7 10.4 8.2 50.12009 14,573,338 3,636,795,274 250 1,067,382,609 655,951,594 363,948,887 292,002,707 1,806,578,376 29.3 18.0 10.0 8.0 49.72010 15,013,694 3,290,262,502 219 914,385,233 617,113,194 309,719,383 307,393,811 1,771,751,725 27.8 18.8 9.4 9.3 53.82011 15,457,531 3,433,306,506 222 977,435,451 619,437,768 309,719,383 309,718,385 1,835,607,468 28.5 18.0 9.0 9.0 53.52012 15,906,483 3,498,051,783 2202013
0%
10%
20%
30%
40%
50%
60%
70%
80%
90%
100%
19
75
19
77
19
79
19
81
19
83
19
85
19
87
19
89
19
91
19
93
19
95
19
97
19
99
20
01
20
03
20
05
20
07
20
09
20
11
20
13
Value Added of Agriculture, Manufacturing,Industry except Manufacturing, and Services Services
valueadded
IndustryexceptmanufacturingvalueaddedManufacturingvalueadded
Agriculturevalueadded
GDP, GDP per Capita, and Value Added of Industrial Sectors
Source note of the World Development Indicators Agriculture: Agriculture, forestry, hunting, fishing, cultivation of crops and livestock production. Industry: Mining, manufacturing, construction, electricity, water, and gas. Services: Wholesale and retail trade, hotels and restaurants, transport, and government, financial,
professional, and personal services such as education, health care, and real estate services.

46
0
50
100
150
200
250
19
61
19
63
19
65
19
67
19
69
19
71
19
73
19
75
19
77
19
79
19
81
19
83
19
85
19
87
19
89
19
91
19
93
19
95
19
97
19
99
20
01
20
03
20
05
20
07
20
09
20
11
20
13
const
ant
200
5 U
S$
Household Final Consumption Expenditure per Capita
6.2 Household Consumption The household final consumption expenditure in constant 2005 US$ is estimated by multiplying GDP by the expenditure’s percentage of GDP. The household final consumption expenditure per capita does not show an increasing trend in recent years, fluctuating between US$150 and US$200 at constant 2005 prices. This is below the level of US$1 per day. The expenditure data is consistent with the GDP per capita data, that is recently between US$200 and US$250.
Source note of the World Development Indicators Household final consumption expenditure: Value of all goods and services, including durable products purchased by households. It excludes purchases of dwellings but includes imputed rent for owner-occupied dwellings. It also includes payments and fees to governments to obtain permits and licenses.
Q: “What is the World Bank’s constant U.S. dollar methodology?” A: “Our constant U.S. dollar price series preserve the growth rates exhibited in the constant local price series. We first create an index by dividing each year of the constant local price series by its 2005 value (thus, 2005 will equal 1). Then we multiply each year's index result by the corresponding year 2005 current U.S. dollar price value. Dollar figures are converted from local currencies using year 2005 official exchange rates. For a few countries where the official exchange rates do not reflect the rate effectively applied to actual foreign exchange transactions, alternative conversion factors are used.” Source: World Bank > Data > Support > Knowledge Base

47
Year GDP
Householdfinal
consumptionexpenditure,
etc.
Householdfinal
consumptionexpenditure,
etc.
Population
Householdfinal
consumptionexpenditure,
etc.per
capita
constant2005 US$
% of GDPconstant2005 US$
constant2005 US$
1961 537,949,480 85.6 460,298,392 3,607,383 1281962 541,544,945 86.9 470,746,638 3,693,680 1271963 534,011,630 87.2 465,839,932 3,783,766 1231964 548,222,231 84.5 463,486,228 3,877,229 1201965 622,870,875 84.0 523,302,742 3,973,960 1321966 705,395,263 82.0 578,348,267 4,073,777 1421967 756,758,971 80.3 607,653,442 4,177,347 1451968 742,205,897 81.8 607,424,503 4,286,430 1421969 785,865,119 81.2 638,271,490 4,403,344 1451970 789,631,755 72.8 575,018,911 4,529,749 1271971 917,698,683 78.0 716,083,064 4,666,194 1531972 974,883,691 76.4 744,565,547 4,812,216 1551973 997,312,466 74.2 739,764,741 4,967,159 1491974 1,068,879,245 69.4 741,614,592 5,129,915 1451975 1,133,940,042 68.9 781,791,398 5,299,532 1481976 1,190,611,318 68.1 810,471,691 5,478,781 1481977 1,249,165,955 66.4 829,459,921 5,668,178 1461978 1,370,898,028 62.7 859,828,852 5,862,115 1471979 1,431,164,813 68.4 979,383,614 6,052,940 1621980 1,436,986,025 69.9 1,004,789,320 6,236,824 1611981 1,360,967,751 70.3 957,258,637 6,403,934 1491982 1,395,038,949 67.4 940,889,673 6,559,281 1431983 1,446,916,389 68.4 989,078,691 6,731,171 1471984 1,524,475,508 69.5 1,059,204,294 6,958,278 1521985 1,594,159,013 69.4 1,106,870,465 7,264,519 1521986 1,590,734,719 70.0 1,113,131,625 7,667,832 1451987 1,616,587,964 66.0 1,066,672,087 8,150,040 1311988 1,667,951,672 72.1 1,202,450,447 8,655,185 1391989 1,690,380,446 74.8 1,265,185,232 9,105,429 1391990 1,786,601,879 71.5 1,278,119,034 9,447,123 1351991 1,942,576,365 73.8 1,433,453,121 9,657,518 1481992 1,800,127,665 85.2 1,534,255,590 9,759,434 1571993 1,974,593,163 87.9 1,735,477,100 9,800,635 1771994 1,772,391,235 71.5 1,266,545,478 9,851,737 1291995 2,068,891,331 79.4 1,642,233,110 9,964,065 1651996 2,220,265,521 82.7 1,837,111,544 10,153,315 1811997 2,304,467,295 83.1 1,915,238,814 10,404,259 1841998 2,394,232,140 77.2 1,848,016,713 10,700,180 1731999 2,467,071,340 87.2 2,150,679,710 11,012,707 1952000 2,505,954,305 81.6 2,044,577,881 11,321,496 1812001 2,381,283,984 80.4 1,915,280,780 11,623,166 1652002 2,421,765,812 11,926,7782003 2,554,962,932 84.4 2,155,297,071 12,238,739 1762004 2,678,920,476 87.5 2,344,578,688 12,569,091 1872005 2,754,995,877 91.1 2,510,896,213 12,924,746 1942006 2,811,804,032 84.2 2,367,595,265 13,307,535 1782007 3,078,684,118 72.1 2,219,890,862 13,713,758 1622008 3,335,412,862 78.6 2,621,305,670 14,138,207 1852009 3,636,795,274 69.1 2,513,352,206 14,573,338 1722010 3,290,262,502 71.5 2,352,513,964 15,013,694 1572011 3,433,306,506 74.5 2,557,562,838 15,457,531 1652012 3,498,051,783 15,906,4832013
Household Final Consumption Expenditure per Capita

48
0
5
10
15
20
25
30
35
40
45
0
100
200
300
400
500
600
700
800
900
19
611
963
19
651
967
19
691
971
19
731
975
19
771
979
19
811
983
19
851
987
19
891
991
19
931
995
19
971
999
20
012
003
20
052
007
20
092
011
20
13
%
mill
ion U
S$ a
t const
ant
200
5 pr
ices
Gross Fixed Capital Formation
Grossfixedcapitalformation(left axis)
Grossfixedcapitalformation(% of GDP)(right axis)
0
10
20
30
40
50
60
70
80
19
611
963
19
651
967
19
691
971
19
731
975
19
771
979
19
811
983
19
851
987
19
891
991
19
931
995
19
971
999
20
012
003
20
052
007
20
092
011
20
13
US$ a
t const
ant
200
5 pr
ices
Gross Fixed Capital Formation per Capita
6.3 Capital Formation The gross fixed capital formation in constant 2005 US$ is estimated by multiplying GDP by the capital formation’s percentage of GDP. The gross fixed capital formation has been fluctuating but on a broad trend of increase while its ratio to GDP is not increasing. The per capita figure is not increasing also in a long run. Its peak was over US$70 in 1978 but the 2012 figure was US$30, both at constant 2005 prices. More investment is required for the economy to grow.
Source note of the World Development Indicators Gross fixed capital formation: Land improvements (fences, ditches, drains, and so on); plant, machinery, and equipment purchases; and the construction of roads, railways, and the like, including schools, offices, hospitals, private residential dwellings, and commercial and industrial buildings. Net acquisitions of valuables are also considered capital formation.
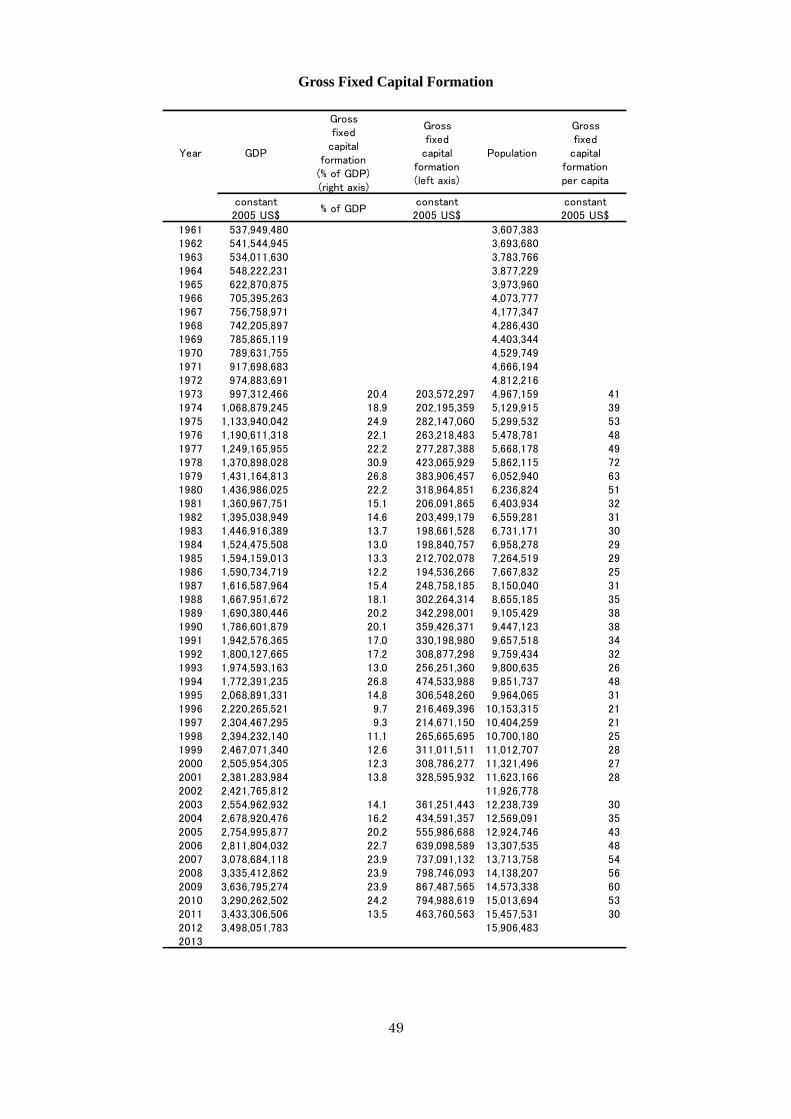
49
Year GDP
Grossfixed
capitalformation
(% of GDP)(right axis)
Grossfixed
capitalformation(left axis)
Population
Grossfixed
capitalformationper capita
constant2005 US$
% of GDPconstant2005 US$
constant2005 US$
1961 537,949,480 3,607,3831962 541,544,945 3,693,6801963 534,011,630 3,783,7661964 548,222,231 3,877,2291965 622,870,875 3,973,9601966 705,395,263 4,073,7771967 756,758,971 4,177,3471968 742,205,897 4,286,4301969 785,865,119 4,403,3441970 789,631,755 4,529,7491971 917,698,683 4,666,1941972 974,883,691 4,812,2161973 997,312,466 20.4 203,572,297 4,967,159 411974 1,068,879,245 18.9 202,195,359 5,129,915 391975 1,133,940,042 24.9 282,147,060 5,299,532 531976 1,190,611,318 22.1 263,218,483 5,478,781 481977 1,249,165,955 22.2 277,287,388 5,668,178 491978 1,370,898,028 30.9 423,065,929 5,862,115 721979 1,431,164,813 26.8 383,906,457 6,052,940 631980 1,436,986,025 22.2 318,964,851 6,236,824 511981 1,360,967,751 15.1 206,091,865 6,403,934 321982 1,395,038,949 14.6 203,499,179 6,559,281 311983 1,446,916,389 13.7 198,661,528 6,731,171 301984 1,524,475,508 13.0 198,840,757 6,958,278 291985 1,594,159,013 13.3 212,702,078 7,264,519 291986 1,590,734,719 12.2 194,536,266 7,667,832 251987 1,616,587,964 15.4 248,758,185 8,150,040 311988 1,667,951,672 18.1 302,264,314 8,655,185 351989 1,690,380,446 20.2 342,298,001 9,105,429 381990 1,786,601,879 20.1 359,426,371 9,447,123 381991 1,942,576,365 17.0 330,198,980 9,657,518 341992 1,800,127,665 17.2 308,877,298 9,759,434 321993 1,974,593,163 13.0 256,251,360 9,800,635 261994 1,772,391,235 26.8 474,533,988 9,851,737 481995 2,068,891,331 14.8 306,548,260 9,964,065 311996 2,220,265,521 9.7 216,469,396 10,153,315 211997 2,304,467,295 9.3 214,671,150 10,404,259 211998 2,394,232,140 11.1 265,665,695 10,700,180 251999 2,467,071,340 12.6 311,011,511 11,012,707 282000 2,505,954,305 12.3 308,786,277 11,321,496 272001 2,381,283,984 13.8 328,595,932 11,623,166 282002 2,421,765,812 11,926,7782003 2,554,962,932 14.1 361,251,443 12,238,739 302004 2,678,920,476 16.2 434,591,357 12,569,091 352005 2,754,995,877 20.2 555,986,688 12,924,746 432006 2,811,804,032 22.7 639,098,589 13,307,535 482007 3,078,684,118 23.9 737,091,132 13,713,758 542008 3,335,412,862 23.9 798,746,093 14,138,207 562009 3,636,795,274 23.9 867,487,565 14,573,338 602010 3,290,262,502 24.2 794,988,619 15,013,694 532011 3,433,306,506 13.5 463,760,563 15,457,531 302012 3,498,051,783 15,906,4832013
Gross Fixed Capital Formation
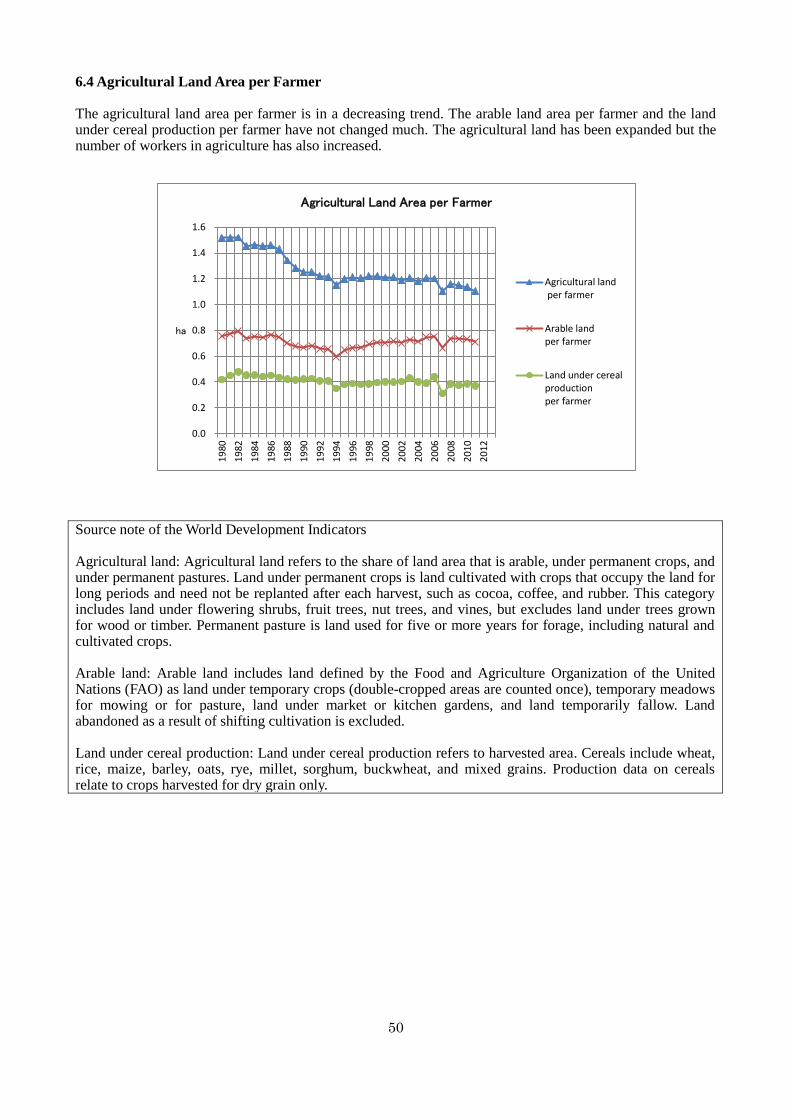
50
0.0
0.2
0.4
0.6
0.8
1.0
1.2
1.4
1.61
980
19
82
19
84
19
86
19
88
19
90
19
92
19
94
19
96
19
98
20
00
20
02
20
04
20
06
20
08
20
10
20
12
ha
Agricultural Land Area per Farmer
Agricultural land per farmer
Arable landper farmer
Land under cerealproductionper farmer
6.4 Agricultural Land Area per Farmer The agricultural land area per farmer is in a decreasing trend. The arable land area per farmer and the land under cereal production per farmer have not changed much. The agricultural land has been expanded but the number of workers in agriculture has also increased.
Source note of the World Development Indicators Agricultural land: Agricultural land refers to the share of land area that is arable, under permanent crops, and under permanent pastures. Land under permanent crops is land cultivated with crops that occupy the land for long periods and need not be replanted after each harvest, such as cocoa, coffee, and rubber. This category includes land under flowering shrubs, fruit trees, nut trees, and vines, but excludes land under trees grown for wood or timber. Permanent pasture is land used for five or more years for forage, including natural and cultivated crops. Arable land: Arable land includes land defined by the Food and Agriculture Organization of the United Nations (FAO) as land under temporary crops (double-cropped areas are counted once), temporary meadows for mowing or for pasture, land under market or kitchen gardens, and land temporarily fallow. Land abandoned as a result of shifting cultivation is excluded. Land under cereal production: Land under cereal production refers to harvested area. Cereals include wheat, rice, maize, barley, oats, rye, millet, sorghum, buckwheat, and mixed grains. Production data on cereals relate to crops harvested for dry grain only.

51
YearAgricultural
landArable land
Land undercereal
production
Agriculturevalue added
Agriculturevalue addedper worker
Number ofworkers inagriculture
Agriculturalland
per farmer
Arable landper farmer
Land undercereal
productionper farmer
km2 km2 km2 constant2005 US$
constant2005 US$
ha ha ha
1961 32,000 13,000 8,7821962 33,000 14,000 8,7611963 33,500 14,500 8,9061964 34,000 15,000 8,9811965 36,030 17,000 11,1031966 36,530 17,500 11,2861967 36,050 17,000 9,721 239,943,3211968 37,070 18,000 11,743 224,691,1201969 37,570 18,500 11,843 234,115,2561970 37,070 18,000 11,203 231,015,2021971 38,570 19,500 12,023 269,951,7491972 39,070 20,000 12,624 295,868,1081973 39,570 20,500 13,103 277,267,8441974 39,600 20,500 12,723 282,971,9151975 39,100 20,000 11,603 285,575,9521976 39,120 20,000 11,654 319,428,4391977 39,150 20,000 11,752 355,264,9311978 39,680 20,500 12,372 365,681,0811979 39,700 20,500 12,464 377,089,2231980 38,300 19,000 10,540 352,412,885 140 2,524,000 1.52 0.75 0.421981 39,300 20,000 11,656 323,520,486 125 2,591,000 1.52 0.77 0.451982 40,300 21,000 12,682 344,228,791 130 2,650,000 1.52 0.79 0.481983 39,400 20,000 12,253 359,480,972 132 2,714,000 1.45 0.74 0.451984 39,900 20,500 12,342 380,065,284 139 2,728,000 1.46 0.75 0.451985 40,050 20,500 12,172 381,925,296 138 2,759,000 1.45 0.74 0.441986 41,050 21,500 12,671 384,281,325 137 2,812,000 1.46 0.76 0.451987 41,100 21,500 12,528 387,505,373 135 2,879,000 1.43 0.75 0.441988 41,150 21,500 12,899 395,317,465 129 3,068,000 1.34 0.70 0.421989 41,650 22,000 13,464 404,989,610 125 3,241,000 1.29 0.68 0.421990 42,180 22,500 14,253 403,997,617 120 3,377,000 1.25 0.67 0.421991 43,200 23,500 14,722 455,706,322 132 3,458,000 1.25 0.68 0.431992 42,700 23,000 14,302 341,252,731 98 3,500,000 1.22 0.66 0.411993 42,700 23,000 14,355 522,047,258 148 3,519,000 1.21 0.65 0.411994 40,700 21,000 12,358 371,066,822 105 3,536,000 1.15 0.59 0.351995 42,800 23,000 13,544 517,973,088 145 3,566,000 1.20 0.64 0.381996 43,800 24,000 13,975 650,094,521 180 3,615,000 1.21 0.66 0.391997 44,300 24,500 13,987 650,965,325 177 3,677,000 1.20 0.67 0.381998 45,800 26,000 14,401 718,270,691 192 3,749,000 1.22 0.69 0.381999 46,750 27,000 15,100 790,925,225 207 3,829,000 1.22 0.71 0.392000 47,200 27,500 15,703 832,835,395 213 3,907,000 1.21 0.70 0.402001 48,200 28,500 15,872 783,009,515 197 3,982,000 1.21 0.72 0.402002 48,200 28,500 16,358 829,157,088 205 4,054,000 1.19 0.70 0.402003 49,700 30,000 17,727 861,787,662 209 4,127,000 1.20 0.73 0.432004 49,700 30,000 16,833 885,918,768 211 4,206,000 1.18 0.71 0.402005 51,700 32,000 16,745 818,625,329 191 4,294,000 1.20 0.75 0.392006 52,750 33,000 19,287 815,433,581 186 4,390,000 1.20 0.75 0.442007 49,750 30,000 13,945 906,094,085 201 4,511,000 1.10 0.67 0.312008 53,750 34,000 17,801 944,010,856 204 4,635,000 1.16 0.73 0.382009 54,800 35,000 17,926 1,067,382,609 224 4,767,000 1.15 0.73 0.382010 55,800 36,000 18,933 914,385,233 186 4,909,000 1.14 0.73 0.392011 55,800 36,000 18,741 977,435,451 193 5,060,000 1.10 0.71 0.372012 18,3642013
Agricultural Land Area per Farmer

52
0
500
1,000
1,500
2,000
2,500
3,000
3,500
4,000
4,500
19
611
963
19
651
967
19
691
971
19
731
975
19
771
979
19
811
983
19
851
987
19
891
991
19
931
995
19
971
999
20
012
003
20
052
007
20
092
011
20
13
Cereal Production
Cerealproduction(1,000metrictons)
Landundercerealproduction(1,000 ha)
Cerealyield(kg/ha)
0
2,000,000
4,000,000
6,000,000
8,000,000
10,000,000
12,000,000
14,000,000
16,000,000
18,000,000
0
500
1,000
1,500
2,000
2,500
3,000
3,500
4,000
4,500
1961
1963
1965
1967
1969
1971
1973
1975
1977
1979
1981
1983
1985
1987
1989
1991
1993
1995
1997
1999
2001
2003
2005
2007
2009
2011
2013
Num
ber o
f peo
ple
1,00
0 m
etric
tons
Cereal Production and Population
Cerealproduction(1,000metrictons)
Population
0
50
100
150
200
250
300
350
19
611
963
19
651
967
19
691
971
19
731
975
19
771
979
19
811
983
19
851
987
19
891
991
19
931
995
19
971
999
20
012
003
20
052
007
20
092
011
20
13
kg p
er
pers
on
Cereal Production per Population
Cerealproductionperpopulation
6.5 Cereal Production The cereal production has been on a growing trend with harsh fluctuations caused by the fluctuations of the cereal yield per area. Comparison between the cereal production and the growing population shows that the cereal production per capita is rather on a long-term decreasing trend with some critical years like 1992, 1994, 1997, 2002, 2004, and 2005, when the cereal production per capita was below 150kg. Considering the limited room for expansion of agricultural land, food security is a threatening challenge requiring immediate yet long-term diverse actions.

53
Year Population
Landundercereal
production
Cerealproduction
Cerealyield
Cerealproduction
perpopulation
hametrictons
kg/hakg/
person
1961 3,607,383 878,200 864,554 984 2401962 3,693,680 876,100 899,751 1,027 2441963 3,783,766 890,561 780,781 877 2061964 3,877,229 898,056 967,017 1,077 2491965 3,973,960 1,110,250 950,943 857 2391966 4,073,777 1,128,600 1,021,611 905 2511967 4,177,347 972,100 1,342,764 1,381 3211968 4,286,430 1,174,300 1,168,730 995 2731969 4,403,344 1,184,300 1,145,565 967 2601970 4,529,749 1,120,300 995,286 888 2201971 4,666,194 1,202,300 1,362,665 1,133 2921972 4,812,216 1,262,400 1,451,555 1,150 3021973 4,967,159 1,310,300 1,446,611 1,104 2911974 5,129,915 1,272,260 1,441,544 1,133 2811975 5,299,532 1,160,300 1,177,635 1,015 2221976 5,478,781 1,165,440 1,293,919 1,110 2361977 5,668,178 1,175,200 1,526,407 1,299 2691978 5,862,115 1,237,200 1,542,500 1,247 2631979 6,052,940 1,246,400 1,464,500 1,175 2421980 6,236,824 1,054,000 1,251,500 1,187 2011981 6,403,934 1,165,560 1,307,688 1,122 2041982 6,559,281 1,268,200 1,482,700 1,169 2261983 6,731,171 1,225,333 1,404,504 1,146 2091984 6,958,278 1,234,173 1,457,065 1,181 2091985 7,264,519 1,217,173 1,422,875 1,169 1961986 7,667,832 1,267,145 1,363,545 1,076 1781987 8,150,040 1,252,805 1,255,066 1,002 1541988 8,655,185 1,289,876 1,491,655 1,156 1721989 9,105,429 1,346,350 1,587,917 1,179 1741990 9,447,123 1,425,342 1,413,293 992 1501991 9,657,518 1,472,227 1,679,752 1,141 1741992 9,759,434 1,430,215 688,786 482 711993 9,800,635 1,435,514 2,137,147 1,489 2181994 9,851,737 1,235,750 1,107,716 896 1121995 9,964,065 1,354,371 1,773,119 1,309 1781996 10,153,315 1,397,520 1,943,377 1,391 1911997 10,404,259 1,398,670 1,474,809 1,054 1421998 10,700,180 1,440,111 1,904,024 1,322 1781999 11,012,707 1,510,012 2,635,519 1,745 2392000 11,321,496 1,570,308 2,631,034 1,675 2322001 11,623,166 1,587,166 1,865,675 1,175 1612002 11,926,778 1,635,836 1,710,577 1,046 1432003 12,238,739 1,772,695 2,143,179 1,209 1752004 12,569,091 1,683,258 1,717,993 1,021 1372005 12,924,746 1,674,520 1,302,379 778 1012006 13,307,535 1,928,661 2,786,281 1,445 2092007 13,713,758 1,394,461 3,440,138 2,467 2512008 14,138,207 1,780,115 2,845,840 1,599 2012009 14,573,338 1,792,559 3,807,971 2,124 2612010 15,013,694 1,893,306 3,610,283 1,907 2402011 15,457,531 1,874,110 3,924,971 2,094 2542012 15,906,483 1,836,365 3,832,659 2,087 2412013
Cereal Production

54
0
1
2
3
4
5
6
7
19
90
19
92
19
94
19
96
19
98
20
00
20
02
20
04
20
06
20
08
20
10
20
12
mill
ion
Employment
Employmentinindustryandservices
Employmentinagriculture
0
1,000
2,000
3,000
4,000
5,000
6,000
7,000
19
90
19
92
19
94
19
96
19
98
20
00
20
02
20
04
20
06
20
08
20
10
20
12
const
ant
200
5 U
S$
Workforce Productivity
Industry and servicesvalue added per worker
Gross value added atfactor cost per worker
Agriculture value addedper worker
6.6 Labor Productivity The value added per worker is estimated for the agricultural sector and the non-agricultural sector, namely industry and services, in addition to the overall gross value added per worker. Apparently, the non-agriculture has by far higher productivity than the agriculture, but the productivity of the non-agriculture has been sharply lowering. This may be because the urban areas have been attracting people from rural areas so that the number of workers for industry and services increases but the total value added of industry and services is not growing as fast as the expanding labor force. Now statistically, the limited pie is shared by more people resulting in many low income workers in urban areas including the underemployed and the unemployed. This interpretation indicates the need for generating productive job opportunities in urban areas as well as raising labor productivity in agriculture partly by further absorbing redundant labor from rural areas. Roughly speaking, the value added of the non-agriculture sector in 2011 is 1.8 times the 1990 level, while the corresponding number of workers in 2011 is 5.9 times the 1990 level, therefore the macroscopic labor productivity in 2011 is 30% of the productivity in 1990.
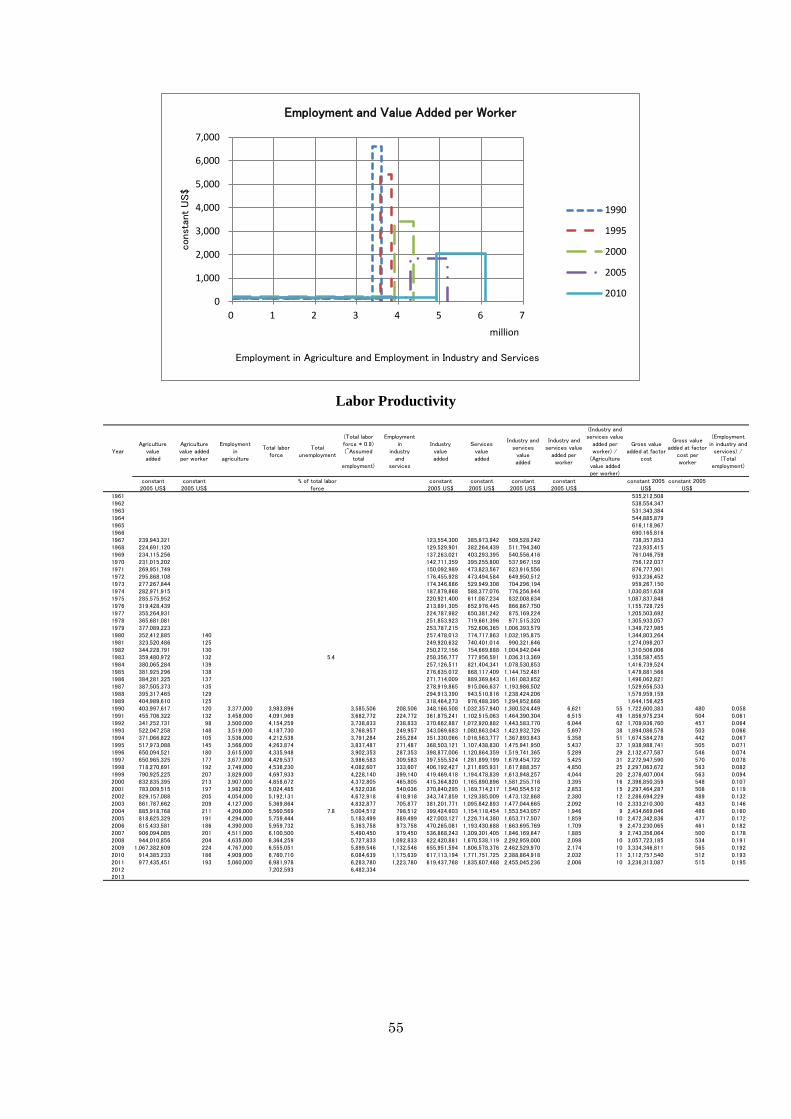
55
YearAgriculture
valueadded
Agriculturevalue addedper worker
Employmentin
agriculture
Total laborforce
Totalunemployment
(Total laborforce * 0.9)(~Assumed
totalemployment)
Employmentin
industryand
services
Industryvalueadded
Servicesvalueadded
Industry andservices
valueadded
Industry andservices value
added perworker
(Industry andservices value
added perworker) /
(Agriculturevalue addedper worker)
Gross valueadded at factor
cost
Gross valueadded at factor
cost perworker
(Employmentin industry and
services) /(Total
employment)
constant2005 US$
constant2005 US$
% of total laborforce
constant2005 US$
constant2005 US$
constant2005 US$
constant2005 US$
constant 2005US$
constant 2005US$
1961 535,212,5081962 538,554,3471963 531,343,3841964 544,885,8791965 616,118,9671966 690,165,8161967 239,943,321 123,554,300 385,973,942 509,528,242 738,357,8531968 224,691,120 129,529,901 382,264,439 511,794,340 723,935,4151969 234,115,256 137,263,021 403,293,395 540,556,416 761,046,7591970 231,015,202 142,711,359 395,255,800 537,967,159 756,122,0371971 269,951,749 150,092,989 473,823,567 623,916,556 876,777,9011972 295,868,108 176,455,928 473,494,584 649,950,512 933,236,4521973 277,267,844 174,346,886 529,949,308 704,296,194 959,267,1501974 282,971,915 187,879,868 588,377,076 776,256,944 1,030,851,6381975 285,575,952 220,921,400 611,087,234 832,008,634 1,087,837,8481976 319,428,439 213,891,305 652,976,445 866,867,750 1,155,728,7251977 355,264,931 224,787,982 650,381,242 875,169,224 1,205,503,6921978 365,681,081 251,853,923 719,661,396 971,515,320 1,305,933,0571979 377,089,223 253,787,215 752,606,365 1,006,393,579 1,349,727,9851980 352,412,885 140 257,478,013 774,717,863 1,032,195,875 1,344,803,2641981 323,520,486 125 249,920,632 740,401,014 990,321,646 1,274,098,2071982 344,228,791 130 250,272,156 754,669,888 1,004,942,044 1,310,506,0061983 359,480,972 132 5.4 258,356,777 777,956,591 1,036,313,369 1,356,587,4551984 380,065,284 139 257,126,511 821,404,341 1,078,530,853 1,416,739,5241985 381,925,296 138 276,635,072 868,117,409 1,144,752,481 1,479,881,5661986 384,281,325 137 271,714,009 889,369,843 1,161,083,852 1,496,062,8211987 387,505,373 135 278,919,865 915,066,637 1,193,986,502 1,529,656,5331988 395,317,465 129 294,913,390 943,510,816 1,238,424,206 1,579,959,1591989 404,989,610 125 318,464,273 976,488,395 1,294,952,668 1,644,156,4251990 403,997,617 120 3,377,000 3,983,896 3,585,506 208,506 348,166,508 1,032,357,940 1,380,524,449 6,621 55 1,722,600,383 480 0.0581991 455,706,322 132 3,458,000 4,091,969 3,682,772 224,772 361,875,241 1,102,515,063 1,464,390,304 6,515 49 1,856,975,234 504 0.0611992 341,252,731 98 3,500,000 4,154,259 3,738,833 238,833 370,662,887 1,072,920,882 1,443,583,770 6,044 62 1,709,936,760 457 0.0641993 522,047,258 148 3,519,000 4,187,730 3,768,957 249,957 343,069,683 1,080,863,043 1,423,932,726 5,697 38 1,894,086,578 503 0.0661994 371,066,822 105 3,536,000 4,212,538 3,791,284 255,284 351,330,066 1,016,563,777 1,367,893,843 5,358 51 1,674,584,278 442 0.0671995 517,973,088 145 3,566,000 4,263,874 3,837,487 271,487 368,503,121 1,107,438,830 1,475,941,950 5,437 37 1,938,988,741 505 0.0711996 650,094,521 180 3,615,000 4,335,948 3,902,353 287,353 398,877,006 1,120,864,359 1,519,741,365 5,289 29 2,132,477,587 546 0.0741997 650,965,325 177 3,677,000 4,429,537 3,986,583 309,583 397,555,524 1,281,899,199 1,679,454,722 5,425 31 2,272,947,590 570 0.0781998 718,270,691 192 3,749,000 4,536,230 4,082,607 333,607 406,192,427 1,211,695,931 1,617,888,357 4,850 25 2,297,063,672 563 0.0821999 790,925,225 207 3,829,000 4,697,933 4,228,140 399,140 419,469,418 1,194,478,839 1,613,948,257 4,044 20 2,378,407,004 563 0.0942000 832,835,395 213 3,907,000 4,858,672 4,372,805 465,805 415,364,820 1,165,890,896 1,581,255,716 3,395 16 2,396,850,359 548 0.1072001 783,009,515 197 3,982,000 5,024,485 4,522,036 540,036 370,840,295 1,169,714,217 1,540,554,512 2,853 15 2,297,464,287 508 0.1192002 829,157,088 205 4,054,000 5,192,131 4,672,918 618,918 343,747,859 1,129,385,009 1,473,132,868 2,380 12 2,286,694,229 489 0.1322003 861,787,662 209 4,127,000 5,369,864 4,832,877 705,877 381,201,771 1,095,842,893 1,477,044,665 2,092 10 2,333,210,300 483 0.1462004 885,918,768 211 4,206,000 5,560,569 7.8 5,004,512 798,512 399,424,603 1,154,118,454 1,553,543,057 1,946 9 2,434,669,046 486 0.1602005 818,625,329 191 4,294,000 5,759,444 5,183,499 889,499 427,003,127 1,226,714,380 1,653,717,507 1,859 10 2,472,342,836 477 0.1722006 815,433,581 186 4,390,000 5,959,732 5,363,758 973,758 470,265,081 1,193,430,688 1,663,695,769 1,709 9 2,473,230,065 461 0.1822007 906,094,085 201 4,511,000 6,100,500 5,490,450 979,450 536,868,243 1,309,301,405 1,846,169,647 1,885 9 2,743,356,064 500 0.1782008 944,010,856 204 4,635,000 6,364,259 5,727,833 1,092,833 622,420,881 1,670,538,119 2,292,959,000 2,098 10 3,057,723,185 534 0.1912009 1,067,382,609 224 4,767,000 6,555,051 5,899,546 1,132,546 655,951,594 1,806,578,376 2,462,529,970 2,174 10 3,334,346,811 565 0.1922010 914,385,233 186 4,909,000 6,760,710 6,084,639 1,175,639 617,113,194 1,771,751,725 2,388,864,918 2,032 11 3,112,757,540 512 0.1932011 977,435,451 193 5,060,000 6,981,978 6,283,780 1,223,780 619,437,768 1,835,607,468 2,455,045,236 2,006 10 3,236,313,087 515 0.1952012 7,202,593 6,482,3342013
0
1,000
2,000
3,000
4,000
5,000
6,000
7,000
0 1 2 3 4 5 6 7
const
ant
US$
Employment in Agriculture and Employment in Industry and Services
million
Employment and Value Added per Worker
1990
1995
2000
2005
2010
Labor Productivity
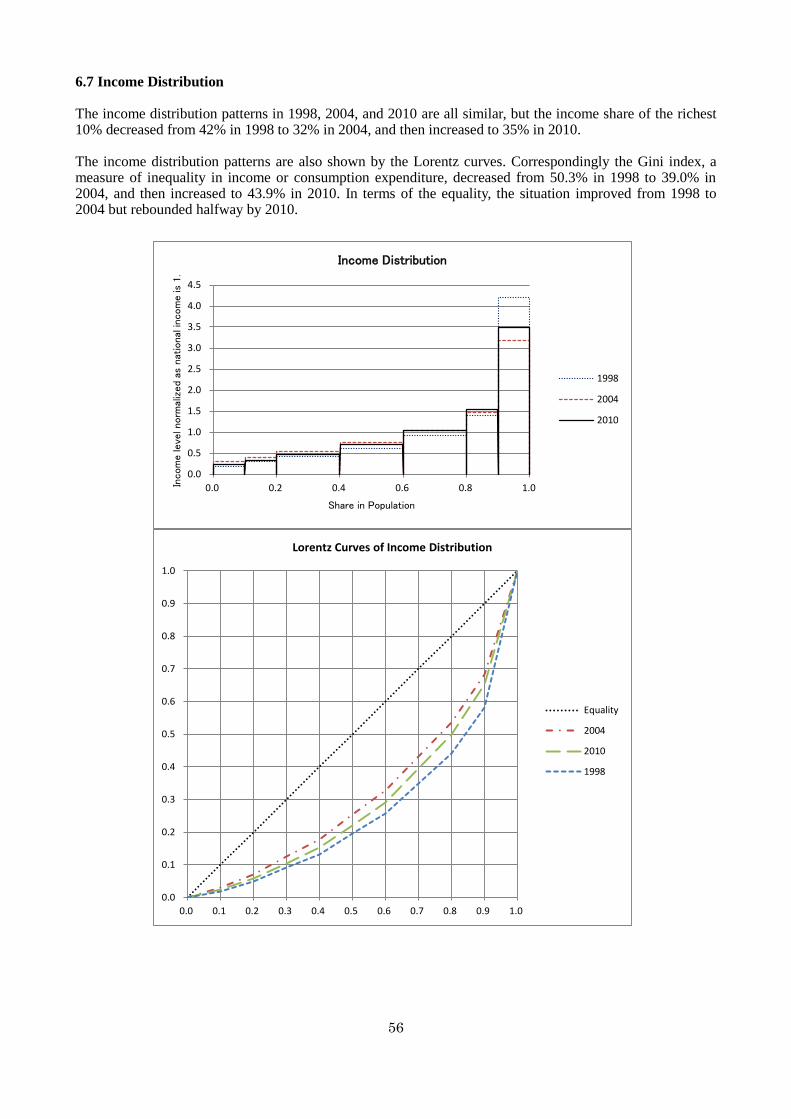
56
0.0
0.5
1.0
1.5
2.0
2.5
3.0
3.5
4.0
4.5
0.0 0.2 0.4 0.6 0.8 1.0Incom
e le
vel n
orm
aliz
ed
as n
atio
nal
incom
e is
1.
Share in Population
Income Distribution
1998
2004
2010
0.0
0.1
0.2
0.3
0.4
0.5
0.6
0.7
0.8
0.9
1.0
0.0 0.1 0.2 0.3 0.4 0.5 0.6 0.7 0.8 0.9 1.0
Lorentz Curves of Income Distribution
Equality
2004
2010
1998
6.7 Income Distribution The income distribution patterns in 1998, 2004, and 2010 are all similar, but the income share of the richest 10% decreased from 42% in 1998 to 32% in 2004, and then increased to 35% in 2010. The income distribution patterns are also shown by the Lorentz curves. Correspondingly the Gini index, a measure of inequality in income or consumption expenditure, decreased from 50.3% in 1998 to 39.0% in 2004, and then increased to 43.9% in 2010. In terms of the equality, the situation improved from 1998 to 2004 but rebounded halfway by 2010.
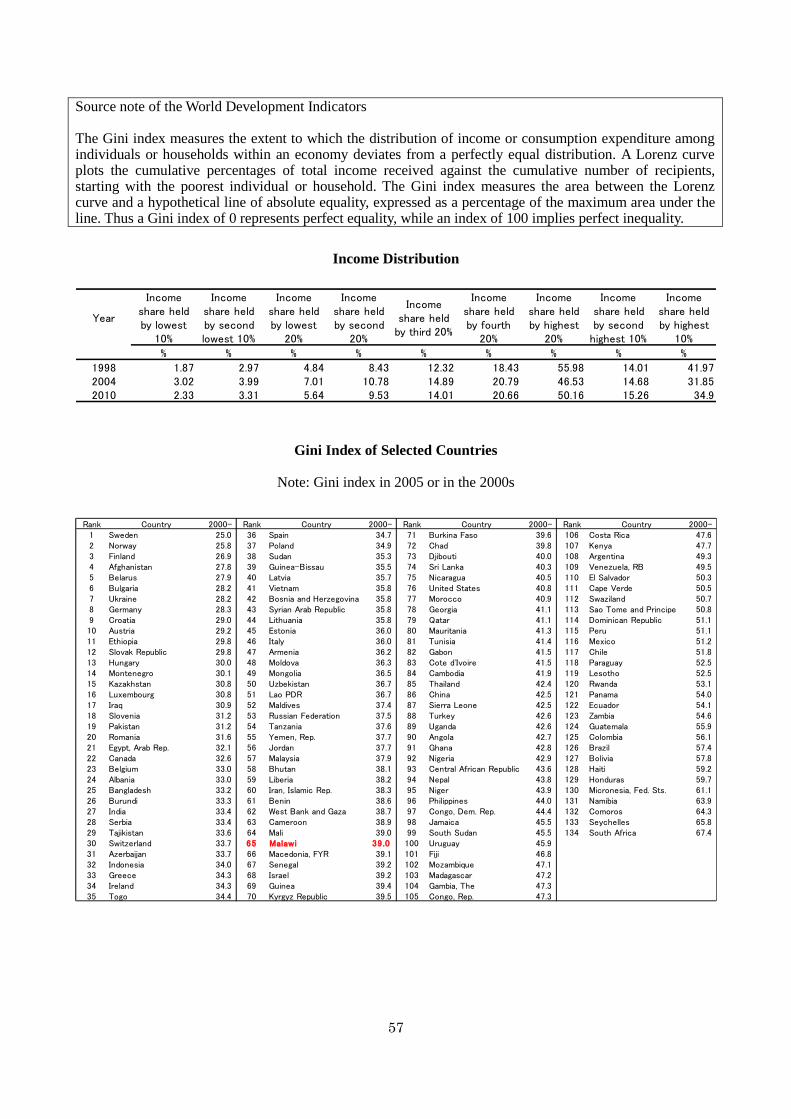
57
Rank Country 2000- Rank Country 2000- Rank Country 2000- Rank Country 2000-1 Sweden 25.0 36 Spain 34.7 71 Burkina Faso 39.6 106 Costa Rica 47.62 Norway 25.8 37 Poland 34.9 72 Chad 39.8 107 Kenya 47.73 Finland 26.9 38 Sudan 35.3 73 Djibouti 40.0 108 Argentina 49.34 Afghanistan 27.8 39 Guinea-Bissau 35.5 74 Sri Lanka 40.3 109 Venezuela, RB 49.55 Belarus 27.9 40 Latvia 35.7 75 Nicaragua 40.5 110 El Salvador 50.36 Bulgaria 28.2 41 Vietnam 35.8 76 United States 40.8 111 Cape Verde 50.57 Ukraine 28.2 42 Bosnia and Herzegovina 35.8 77 Morocco 40.9 112 Swaziland 50.78 Germany 28.3 43 Syrian Arab Republic 35.8 78 Georgia 41.1 113 Sao Tome and Principe 50.89 Croatia 29.0 44 Lithuania 35.8 79 Qatar 41.1 114 Dominican Republic 51.110 Austria 29.2 45 Estonia 36.0 80 Mauritania 41.3 115 Peru 51.111 Ethiopia 29.8 46 Italy 36.0 81 Tunisia 41.4 116 Mexico 51.212 Slovak Republic 29.8 47 Armenia 36.2 82 Gabon 41.5 117 Chile 51.813 Hungary 30.0 48 Moldova 36.3 83 Cote d'Ivoire 41.5 118 Paraguay 52.514 Montenegro 30.1 49 Mongolia 36.5 84 Cambodia 41.9 119 Lesotho 52.515 Kazakhstan 30.8 50 Uzbekistan 36.7 85 Thailand 42.4 120 Rwanda 53.116 Luxembourg 30.8 51 Lao PDR 36.7 86 China 42.5 121 Panama 54.017 Iraq 30.9 52 Maldives 37.4 87 Sierra Leone 42.5 122 Ecuador 54.118 Slovenia 31.2 53 Russian Federation 37.5 88 Turkey 42.6 123 Zambia 54.619 Pakistan 31.2 54 Tanzania 37.6 89 Uganda 42.6 124 Guatemala 55.920 Romania 31.6 55 Yemen, Rep. 37.7 90 Angola 42.7 125 Colombia 56.121 Egypt, Arab Rep. 32.1 56 Jordan 37.7 91 Ghana 42.8 126 Brazil 57.422 Canada 32.6 57 Malaysia 37.9 92 Nigeria 42.9 127 Bolivia 57.823 Belgium 33.0 58 Bhutan 38.1 93 Central African Republic 43.6 128 Haiti 59.224 Albania 33.0 59 Liberia 38.2 94 Nepal 43.8 129 Honduras 59.725 Bangladesh 33.2 60 Iran, Islamic Rep. 38.3 95 Niger 43.9 130 Micronesia, Fed. Sts. 61.126 Burundi 33.3 61 Benin 38.6 96 Philippines 44.0 131 Namibia 63.927 India 33.4 62 West Bank and Gaza 38.7 97 Congo, Dem. Rep. 44.4 132 Comoros 64.328 Serbia 33.4 63 Cameroon 38.9 98 Jamaica 45.5 133 Seychelles 65.829 Tajikistan 33.6 64 Mali 39.0 99 South Sudan 45.5 134 South Africa 67.430 Switzerland 33.7 65 Malawi 39.0 100 Uruguay 45.931 Azerbaijan 33.7 66 Macedonia, FYR 39.1 101 Fiji 46.832 Indonesia 34.0 67 Senegal 39.2 102 Mozambique 47.133 Greece 34.3 68 Israel 39.2 103 Madagascar 47.234 Ireland 34.3 69 Guinea 39.4 104 Gambia, The 47.335 Togo 34.4 70 Kyrgyz Republic 39.5 105 Congo, Rep. 47.3
Year
Incomeshare heldby lowest
10%
Incomeshare heldby secondlowest 10%
Incomeshare heldby lowest
20%
Incomeshare heldby second
20%
Incomeshare held
by third 20%
Incomeshare heldby fourth
20%
Incomeshare heldby highest
20%
Incomeshare heldby second
highest 10%
Incomeshare heldby highest
10%
% % % % % % % % %
1998 1.87 2.97 4.84 8.43 12.32 18.43 55.98 14.01 41.972004 3.02 3.99 7.01 10.78 14.89 20.79 46.53 14.68 31.852010 2.33 3.31 5.64 9.53 14.01 20.66 50.16 15.26 34.9
Source note of the World Development Indicators The Gini index measures the extent to which the distribution of income or consumption expenditure among individuals or households within an economy deviates from a perfectly equal distribution. A Lorenz curve plots the cumulative percentages of total income received against the cumulative number of recipients, starting with the poorest individual or household. The Gini index measures the area between the Lorenz curve and a hypothetical line of absolute equality, expressed as a percentage of the maximum area under the line. Thus a Gini index of 0 represents perfect equality, while an index of 100 implies perfect inequality.
Income Distribution
Gini Index of Selected Countries
Note: Gini index in 2005 or in the 2000s
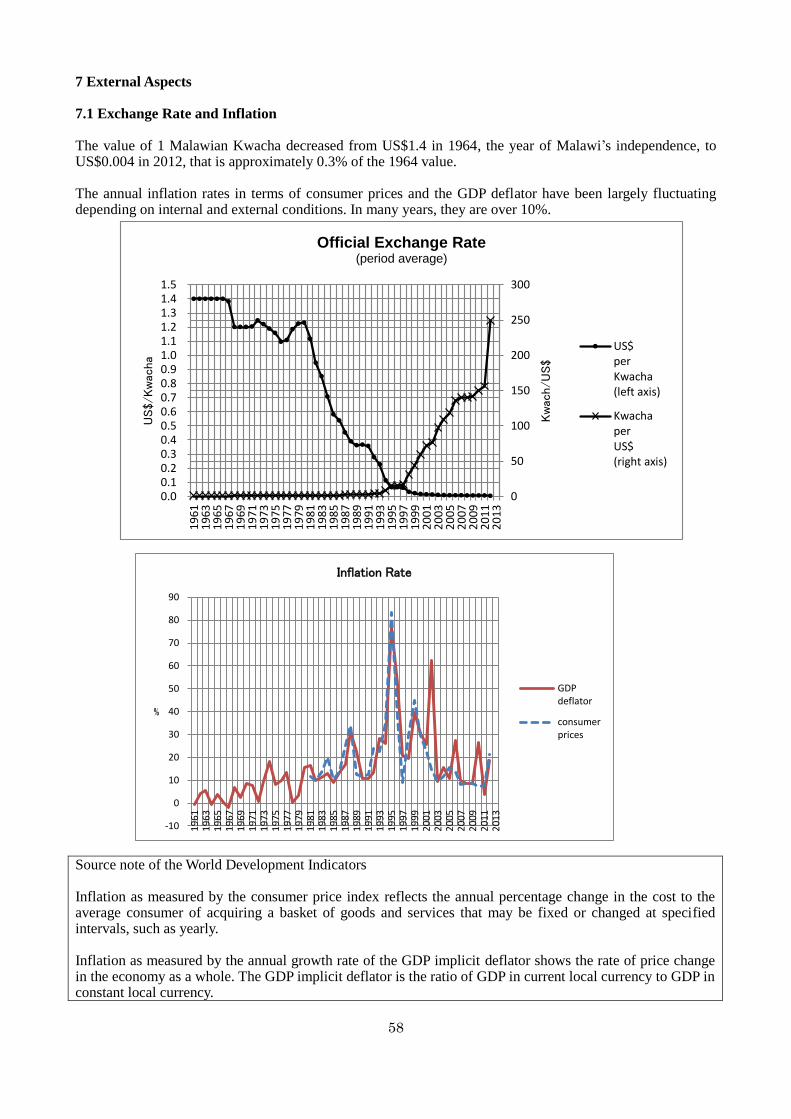
58
-10
0
10
20
30
40
50
60
70
80
90
19
611
963
19
651
967
19
691
971
19
731
975
19
771
979
19
811
983
19
851
987
19
891
991
19
931
995
19
971
999
20
012
003
20
052
007
20
092
011
20
13
%
Inflation Rate
GDPdeflator
consumerprices
0
50
100
150
200
250
300
0.00.10.20.30.40.50.60.70.80.91.01.11.21.31.41.5
19
611
963
19
651
967
19
691
971
19
731
975
19
771
979
19
811
983
19
851
987
19
891
991
19
931
995
19
971
999
20
012
003
20
052
007
20
092
011
20
13
Kw
ach/U
S$
US$/Kw
acha
Official Exchange Rate(period average)
US$perKwacha(left axis)
KwachaperUS$(right axis)
7 External Aspects 7.1 Exchange Rate and Inflation The value of 1 Malawian Kwacha decreased from US$1.4 in 1964, the year of Malawi’s independence, to US$0.004 in 2012, that is approximately 0.3% of the 1964 value. The annual inflation rates in terms of consumer prices and the GDP deflator have been largely fluctuating depending on internal and external conditions. In many years, they are over 10%.
Source note of the World Development Indicators Inflation as measured by the consumer price index reflects the annual percentage change in the cost to the average consumer of acquiring a basket of goods and services that may be fixed or changed at specified intervals, such as yearly. Inflation as measured by the annual growth rate of the GDP implicit deflator shows the rate of price change in the economy as a whole. The GDP implicit deflator is the ratio of GDP in current local currency to GDP in constant local currency.

59
Year
KwachaperUS$
(right axis)
US$per
Kwacha(left axis)
consumerprices
GDPdeflator
Kwacha/US$
US$/Kwacha
% %
1961 0.71 1.400 -0.51962 0.71 1.400 4.21963 0.71 1.400 5.71964 0.71 1.400 -0.61965 0.71 1.400 3.71966 0.71 1.400 0.21967 0.72 1.381 -2.11968 0.83 1.200 6.61969 0.83 1.200 2.41970 0.83 1.200 8.81971 0.83 1.204 7.91972 0.80 1.248 0.91973 0.82 1.221 9.31974 0.84 1.189 18.31975 0.86 1.158 8.21976 0.91 1.095 10.01977 0.90 1.108 13.41978 0.84 1.185 0.21979 0.82 1.224 3.41980 0.81 1.231 15.81981 0.90 1.117 11.8 16.41982 1.06 0.947 9.8 9.71983 1.17 0.851 13.5 11.21984 1.41 0.708 20.0 12.81985 1.72 0.582 10.5 8.91986 1.86 0.537 14.0 13.51987 2.21 0.453 25.2 16.71988 2.56 0.390 33.9 31.11989 2.76 0.362 12.4 22.51990 2.73 0.366 11.8 10.71991 2.80 0.357 12.6 10.71992 3.60 0.278 23.8 13.31993 4.40 0.227 22.8 28.21994 8.74 0.114 34.6 26.21995 15.28 0.065 83.3 77.21996 15.31 0.065 37.6 52.31997 16.44 0.061 9.1 20.81998 31.07 0.032 29.7 19.51999 44.09 0.023 44.8 39.72000 59.54 0.017 29.6 30.52001 72.20 0.014 22.7 25.62002 76.69 0.013 14.7 62.22003 97.43 0.010 9.6 9.62004 108.90 0.009 11.4 15.42005 118.42 0.008 15.4 11.02006 136.01 0.007 14.0 27.32007 139.96 0.007 8.0 10.02008 140.52 0.007 8.7 8.72009 141.17 0.007 8.4 8.42010 150.49 0.007 7.4 26.42011 156.52 0.006 7.6 3.82012 249.11 0.004 21.3 18.52013
Official exchangerate (period average)
Annual inflation rate
Exchange Rate and Inflation
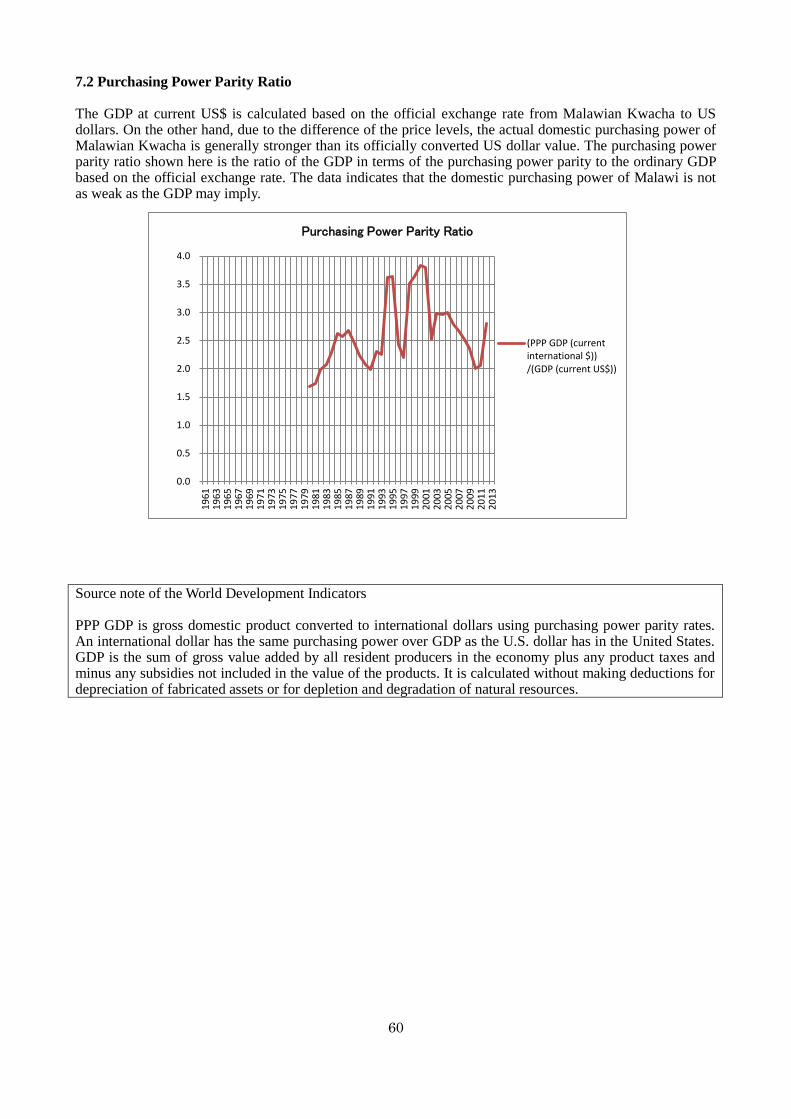
60
0.0
0.5
1.0
1.5
2.0
2.5
3.0
3.5
4.0
19
611
963
19
651
967
19
691
971
19
731
975
19
771
979
19
811
983
19
851
987
19
891
991
19
931
995
19
971
999
20
012
003
20
052
007
20
092
011
20
13
Purchasing Power Parity Ratio
(PPP GDP (currentinternational $))/(GDP (current US$))
7.2 Purchasing Power Parity Ratio The GDP at current US$ is calculated based on the official exchange rate from Malawian Kwacha to US dollars. On the other hand, due to the difference of the price levels, the actual domestic purchasing power of Malawian Kwacha is generally stronger than its officially converted US dollar value. The purchasing power parity ratio shown here is the ratio of the GDP in terms of the purchasing power parity to the ordinary GDP based on the official exchange rate. The data indicates that the domestic purchasing power of Malawi is not as weak as the GDP may imply.
Source note of the World Development Indicators PPP GDP is gross domestic product converted to international dollars using purchasing power parity rates. An international dollar has the same purchasing power over GDP as the U.S. dollar has in the United States. GDP is the sum of gross value added by all resident producers in the economy plus any product taxes and minus any subsidies not included in the value of the products. It is calculated without making deductions for depreciation of fabricated assets or for depletion and degradation of natural resources.

61
Year GDP PPP GDP(PPP GDP (current international $))
/(GDP (current US$))
current US$current
international $1961 174,580,1401962 183,120,1471963 190,820,1531964 194,740,1561965 229,460,1841966 260,400,2081967 269,812,7821968 245,160,0981969 265,800,1061970 290,520,1161971 365,389,5671972 406,084,1971973 444,302,2211974 548,618,7901975 613,196,8731976 670,309,2531977 806,265,7641978 948,983,3471979 1,058,297,6371980 1,237,662,106 2,082,784,892 1.681981 1,237,686,925 2,156,727,158 1.741982 1,180,094,061 2,347,906,659 1.991983 1,223,225,050 2,531,330,727 2.071984 1,208,026,105 2,761,685,501 2.291985 1,131,349,974 2,980,280,318 2.631986 1,183,671,771 3,033,860,147 2.561987 1,183,071,377 3,161,862,939 2.671988 1,379,923,808 3,376,539,077 2.451989 1,590,201,669 3,555,001,178 2.241990 1,880,784,193 3,896,382,879 2.071991 2,203,536,041 4,377,459,317 1.991992 1,799,529,369 4,148,965,762 2.311993 2,070,647,130 4,659,383,106 2.251994 1,181,801,915 4,271,285,190 3.611995 1,397,454,123 5,089,824,527 3.641996 2,281,039,099 5,561,990,619 2.441997 2,663,238,981 5,871,697,009 2.201998 1,750,585,205 6,166,589,182 3.521999 1,775,920,039 6,444,939,583 3.632000 1,743,506,287 6,695,267,397 3.842001 1,716,502,069 6,507,945,913 3.792002 2,665,158,943 6,720,285,387 2.522003 2,424,656,666 7,231,584,721 2.982004 2,625,127,098 7,790,287,234 2.972005 2,754,995,877 8,268,474,989 3.002006 3,116,789,658 8,698,396,124 2.792007 3,647,817,219 9,776,752,884 2.682008 4,276,769,712 10,798,940,996 2.532009 5,030,639,934 11,865,343,781 2.362010 5,398,616,985 10,864,692,910 2.012011 5,621,000,678 11,559,685,189 2.062012 4,263,794,984 11,983,585,074 2.812013
Purchasing Power Parity Ratio

62
2,500
2,000
1,500
1,000
500
0
500
1,000
1,500
2,000
19
66
19
68
19
70
19
72
19
74
19
76
19
78
19
80
19
82
19
84
19
86
19
88
19
90
19
92
19
94
19
96
19
98
20
00
20
02
20
04
20
06
20
08
20
10
20
12
million U
S$ a
t curr
ent
prices Trade of Goods and Services
Exportsexceptmerchandise
MerchandiseexportsexceptfoodFoodexports
Importsexceptmerchandise
MerchandiseimportsexceptmanufacturesManufacturesimports
Balance
2,500
2,000
1,500
1,000
500
0
500
1,000
1,500
1966
1968
1970
1972
1974
1976
1978
1980
1982
1984
1986
1988
1990
1992
1994
1996
1998
2000
2002
2004
2006
2008
2010
2012
mill
ion
US$
at c
urre
nt p
rice
s Destinations and Origins of Merchandise Tradeto Othersand unknown
to Sub-Saharan Africa
to High-incomeeconomies
from Othersand unknown
from Sub-Saharan Africa
from High-incomeeconomies
Merchandisetrade balance
7.3 External Balance on Goods and Services Both exports and imports of goods and services have expanded, although the real expansion in terms of constant prices would not be as rapid as it appears at current prices. It is thought that the expansion of trade generally contributes to the welfare of Malawians. On the other hand, the trade balance has been negative since 1961except only in 1984 and is on a worsening trend. This is one of the issues for the self-reliance of the national economy. Malawi’s exports are dominated by food including tobacco and tea, while the imports are dominated by manufactures including vehicles. The major export destinations are high income economies followed by Sub-Saharan Africa. As the origins of imports, Sub-Saharan Africa has surpassed high income economies.

63
YearExports of goods
and servicesMerchandise
exportsFood
exports
Merchandiseexportsexceptfood
Exportsexcept
merchandise
Imports of goodsand services
Merchandiseimports
Manufacturesimports
Merchandiseimportsexcept
manufactures
Importsexcept
merchandiseBalance
current US$ current US$ current US$ current US$ current US$ current US$ current US$ current US$ current US$ current US$ current US$
1961 35,980,029 26,000,000 9,980,029 -63,140,051 -40,000,000 -23,140,051 -27,160,022 1962 39,200,031 29,000,000 10,200,031 -64,120,051 -40,000,000 -24,120,051 -24,920,020 1963 41,720,033 30,000,000 11,720,033 -71,540,057 -40,000,000 -31,540,057 -29,820,024 1964 37,940,030 34,762,000 3,178,030 -55,020,044 -57,000,000 -17,080,014 1965 44,660,036 40,349,400 4,310,636 -76,300,061 -76,000,000 -300,061 -31,640,025 1966 56,000,045 48,734,000 43,767,951 4,966,049 7,266,045 -97,160,078 -70,000,000 -50,055,016 -19,944,984 -27,160,078 -41,160,033 1967 64,898,673 56,784,000 53,163,312 3,620,688 8,114,673 -94,172,117 -70,000,000 -50,970,744 -19,029,256 -24,172,117 -29,273,444 1968 58,440,023 48,052,800 44,579,118 3,473,682 10,387,223 -96,000,038 -74,000,000 -56,060,430 -17,939,570 -22,000,038 -37,560,015 1969 62,400,025 52,766,400 48,136,535 4,629,865 9,633,625 -105,240,042 -86,000,000 -65,950,180 -20,049,820 -19,240,042 -42,840,017 1970 70,440,028 59,636,400 52,605,183 7,031,217 10,803,628 -113,760,046 -109,000,000 -78,199,034 -30,800,966 -4,760,046 -43,320,017 1971 85,690,834 71,370,300 65,185,746 6,184,554 14,320,534 -129,619,422 -108,054,000 -80,358,615 -27,695,385 -21,565,422 -43,928,588 1972 94,565,844 79,831,000 73,361,239 6,469,761 14,734,844 -154,074,957 -128,874,000 -97,031,044 -31,842,956 -25,200,957 -59,509,113 1973 122,793,416 97,677,200 90,541,646 7,135,554 25,116,216 -166,979,516 -140,242,000 -102,258,457 -37,983,543 -26,737,516 -44,186,100 1974 153,708,363 120,483,000 110,087,051 10,395,949 33,225,363 -213,741,405 -187,728,000 -139,030,978 -48,697,022 -26,013,405 -60,033,042 1975 178,622,385 140,408,000 129,770,382 10,637,618 38,214,385 -281,419,973 -253,139,000 -197,101,565 -56,037,435 -28,280,973 -102,797,588 1976 204,050,023 165,824,000 156,230,870 9,593,130 38,226,023 -260,566,293 -206,449,000 -151,668,104 -54,780,896 -54,117,293 -56,516,270 1977 241,879,729 199,870,000 188,574,365 11,295,635 42,009,729 -279,202,746 -234,844,000 -178,893,435 -55,950,565 -44,358,746 -37,323,017 1978 220,090,172 185,209,000 175,747,019 9,461,981 34,881,172 -390,165,237 -338,236,000 -273,199,618 -65,036,382 -51,929,237 -170,075,065 1979 245,446,714 232,746,000 220,108,687 12,637,313 12,700,714 -432,133,117 -399,045,000 -305,873,473 -93,171,527 -33,088,117 -186,686,403 1980 307,476,090 295,000,000 268,043,663 26,956,337 12,476,090 -480,238,987 -439,000,000 -327,146,586 -111,853,414 -41,238,987 -172,762,897 1981 317,659,211 283,000,000 257,687,325 25,312,675 34,659,211 -389,813,870 -359,000,000 -249,869,045 -109,130,955 -30,813,870 -72,154,659 1982 265,464,319 239,000,000 224,357,944 14,642,056 26,464,319 -340,404,461 -304,000,000 -219,837,624 -84,162,376 -36,404,461 -74,940,142 1983 253,838,362 229,000,000 218,764,237 10,235,763 24,838,362 -346,452,761 -311,000,000 -220,261,636 -90,738,364 -35,452,761 -92,614,399 1984 342,724,533 314,000,000 301,514,389 12,485,611 28,724,533 -319,234,742 -271,000,000 -194,700,190 -76,299,810 -48,234,742 23,489,7901985 273,690,252 249,000,000 226,983,898 22,016,102 24,690,252 -338,259,066 -285,000,000 -215,791,096 -69,208,904 -53,259,066 -64,568,813 1986 271,187,594 248,000,000 233,915,621 14,084,379 23,187,594 -296,495,571 -260,000,000 -199,827,749 -60,172,251 -36,495,571 -25,307,976 1987 301,121,580 277,000,000 258,981,168 18,018,832 24,121,580 -329,010,752 -295,000,000 -220,621,061 -74,378,939 -34,010,752 -27,889,172 1988 321,828,667 288,000,000 271,639,865 16,360,135 33,828,667 -449,068,711 -406,000,000 -306,856,969 -99,143,031 -43,068,711 -127,240,044 1989 298,638,431 267,000,000 31,638,431 -548,898,991 -503,000,000 -503,000,000 -45,898,991 -250,260,560 1990 447,289,481 417,000,000 387,196,520 29,803,480 30,289,481 -628,572,499 -575,000,000 -447,620,738 -127,379,262 -53,572,499 -181,283,018 1991 512,797,731 469,000,000 438,497,449 30,502,551 43,797,731 -645,797,142 -703,000,000 -550,161,564 -152,838,436 -132,999,411 1992 417,602,840 396,000,000 21,602,840 -764,005,181 -735,000,000 -735,000,000 -29,005,181 -346,402,341 1993 334,001,636 320,000,000 14,001,636 -667,203,312 -546,000,000 -546,000,000 -121,203,312 -333,201,676 1994 350,201,259 342,000,000 294,021,424 47,978,576 8,201,259 -729,705,189 -497,000,000 -367,892,822 -129,107,178 -232,705,189 -379,503,930 1995 424,385,595 405,000,000 366,000,106 38,999,894 19,385,595 -672,013,569 -475,000,000 -348,793,898 -126,206,102 -197,013,569 -247,627,974 1996 520,664,347 481,000,000 417,523,320 63,476,680 39,664,347 -727,119,311 -624,000,000 -624,000,000 -103,119,311 -206,454,964 1997 568,774,884 537,000,000 466,395,636 70,604,364 31,774,884 -894,459,587 -781,000,000 -781,000,000 -113,459,587 -325,684,703 1998 573,669,608 431,000,000 394,558,427 36,441,573 142,669,608 -667,060,757 -515,000,000 -515,000,000 -152,060,757 -93,391,149 1999 497,653,296 453,000,000 402,779,626 50,220,374 44,653,296 -768,861,361 -673,000,000 -498,006,527 -174,993,473 -95,861,361 -271,208,065 2000 446,401,291 379,000,000 338,201,122 40,798,878 67,401,291 -616,067,651 -532,000,000 -383,733,574 -148,266,426 -84,067,651 -169,666,360 2001 480,469,979 449,000,000 390,200,972 58,799,028 31,469,979 -671,618,808 -563,000,000 -390,225,168 -172,774,832 -108,618,808 -191,148,829 2002 554,424,050 407,127,000 346,490,983 60,636,017 147,297,050 -910,260,625 -695,056,000 -440,614,698 -254,441,302 -215,204,625 -355,836,574 2003 647,303,684 525,262,000 453,135,525 72,126,475 122,041,684 -984,315,548 -785,861,000 -539,337,352 -246,523,648 -198,454,548 -337,011,864 2004 655,228,031 483,213,000 378,439,344 104,773,656 172,015,031 -1,133,910,242 -932,518,000 -638,250,424 -294,267,576 -201,392,242 -478,682,210 2005 662,490,045 508,793,278 404,687,652 104,105,626 153,696,767 -1,437,746,761 -1,165,192,000 -796,223,553 -368,968,447 -272,554,761 -775,256,716 2006 705,004,067 668,417,000 554,084,836 114,332,164 36,587,067 -1,468,317,769 -1,206,696,000 -857,736,841 -348,959,159 -261,621,769 -763,313,702 2007 1,033,381,794 868,559,000 743,244,578 125,314,422 164,822,794 -1,468,752,757 -1,377,845,000 -1,003,899,447 -373,945,553 -90,907,757 -435,370,964 2008 1,205,568,960 878,999,000 754,060,986 124,938,014 326,569,960 -2,091,637,346 -2,203,688,000 -1,692,920,609 -510,767,391 -886,068,387 2009 1,239,999,122 1,187,917,000 1,029,757,718 158,159,282 52,082,122 -1,959,764,886 -2,021,672,000 -1,505,378,621 -516,293,379 -719,765,764 2010 1,585,900,071 1,066,204,000 814,790,127 251,413,873 519,696,071 -2,426,168,103 -2,173,038,000 -1,610,861,597 -562,176,403 -253,130,103 -840,268,032 2011 1,663,007,168 1,425,289,000 1,079,379,641 345,909,359 237,718,168 -2,220,132,914 -2,427,696,000 -1,794,925,216 -632,770,784 -557,125,746 2012 1,300,000,000 -2,350,000,000 2013
External Trade of Goods and Services

64
Top 10 Exports Ranked by Value (January-June 2013)
Rank Description 1 Unmanufactured tobacco; tobacco refuse 2 Uranium or thorium ores and concentrates 3 Cane or beet sugar and chemically pure sucrose, in solid form 4 Tea, whether or not flavored 5 Ground-nuts, not roasted or otherwise cooked, whether or not shelled 6 Dried leguminous vegetables, shelled, whether or not skinned or split 7 Other nuts, fresh or dried, whether or not shelled or peeled 8 Cotton not carded or combed 9 Wood sawn or chipped lengthwise, sliced or peeled, whether or not planed
10 Articles for the conveyance or packing of goods, of plastics Source: Provisional figures of National Statistical Office
Top 10 Imports Ranked by Value (January-June 2013) Rank Description
1 Petroleum oils and oils obtained from bituminous minerals, other than crude 2 Medicaments (excluding goods of heading No. 30.02, 30.05 or 30.06) 3 Mineral or chemical fertilizers, nitrogenous 4 Wheat and meslin 5 Carboys, bottles, flasks, jars, pots, phials, ampoules and other containers 6 Unmanufactured tobacco; tobacco refuse 7 Motor cars and other motor vehicles principally designed for the transport 8 Portland cement, aluminous cement 9 Soap; organic surface-active products and preparations for use as soap
10 Motor vehicles for the transport of goods Source: Provisional figures of National Statistical Office
Top 10 Countries for Malawi’s Exports and Imports by Value (January-June 2013)
Rank Export Destination Rank Import Origin 1 Canada 1 South Africa 2 South Africa 2 Mozambique 3 United States of America 3 China 4 United Kingdom 4 India 5 Zimbabwe 5 Netherlands 6 Belgium 6 Zambia 7 United Arab Emirates 7 United Arab Emirates 8 Zambia 8 Japan 9 Portugal 9 United States of America
10 Kenya 10 United Kingdom Source: Provisional figures of National Statistical Office
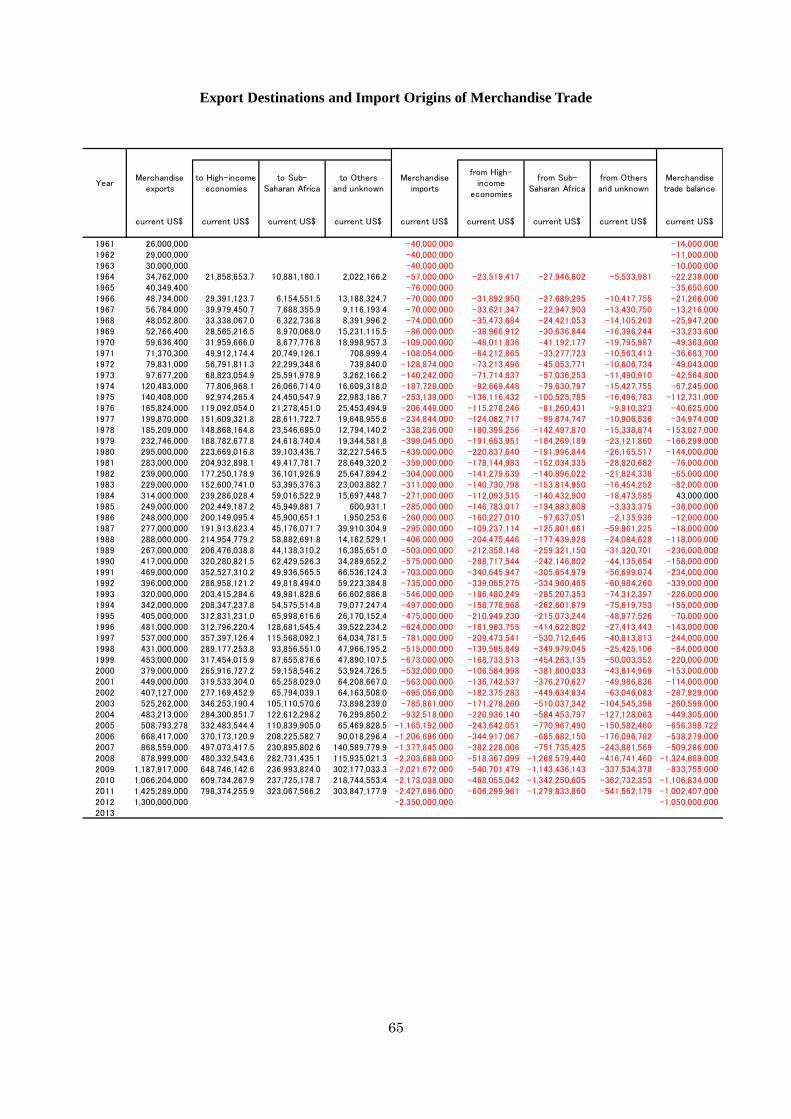
65
YearMerchandise
exportsto High-income
economiesto Sub-
Saharan Africato Others
and unknownMerchandise
imports
from High-income
economies
from Sub-Saharan Africa
from Othersand unknown
Merchandisetrade balance
current US$ current US$ current US$ current US$ current US$ current US$ current US$ current US$ current US$
1961 26,000,000 -40,000,000 -14,000,000 1962 29,000,000 -40,000,000 -11,000,000 1963 30,000,000 -40,000,000 -10,000,000 1964 34,762,000 21,858,653.7 10,881,180.1 2,022,166.2 -57,000,000 -23,519,417 -27,946,602 -5,533,981 -22,238,000 1965 40,349,400 -76,000,000 -35,650,600 1966 48,734,000 29,391,123.7 6,154,551.5 13,188,324.7 -70,000,000 -31,892,950 -27,689,295 -10,417,755 -21,266,000 1967 56,784,000 39,979,450.7 7,688,355.9 9,116,193.4 -70,000,000 -33,621,347 -22,947,903 -13,430,750 -13,216,000 1968 48,052,800 33,338,067.0 6,322,736.8 8,391,996.2 -74,000,000 -35,473,684 -24,421,053 -14,105,263 -25,947,200 1969 52,766,400 28,565,216.5 8,970,068.0 15,231,115.5 -86,000,000 -38,966,912 -30,636,844 -16,396,244 -33,233,600 1970 59,636,400 31,959,666.0 8,677,776.8 18,998,957.3 -109,000,000 -48,011,836 -41,192,177 -19,795,987 -49,363,600 1971 71,370,300 49,912,174.4 20,749,126.1 708,999.4 -108,054,000 -64,212,865 -33,277,723 -10,563,413 -36,683,700 1972 79,831,000 56,791,811.3 22,299,348.6 739,840.0 -128,874,000 -73,213,496 -45,053,771 -10,606,734 -49,043,000 1973 97,677,200 68,823,054.9 25,591,978.9 3,262,166.2 -140,242,000 -71,714,837 -57,036,253 -11,490,910 -42,564,800 1974 120,483,000 77,806,968.1 26,066,714.0 16,609,318.0 -187,728,000 -92,669,448 -79,630,797 -15,427,755 -67,245,000 1975 140,408,000 92,974,265.4 24,450,547.9 22,983,186.7 -253,139,000 -136,116,432 -100,525,785 -16,496,783 -112,731,000 1976 165,824,000 119,092,054.0 21,278,451.0 25,453,494.9 -206,449,000 -115,278,246 -81,260,431 -9,910,323 -40,625,000 1977 199,870,000 151,609,321.8 28,611,722.7 19,648,955.6 -234,844,000 -124,062,717 -99,874,747 -10,906,536 -34,974,000 1978 185,209,000 148,868,164.8 23,546,695.0 12,794,140.2 -338,236,000 -180,399,256 -142,497,870 -15,338,874 -153,027,000 1979 232,746,000 188,782,677.8 24,618,740.4 19,344,581.8 -399,045,000 -191,653,951 -184,269,189 -23,121,860 -166,299,000 1980 295,000,000 223,669,016.8 39,103,436.7 32,227,546.5 -439,000,000 -220,837,640 -191,996,844 -26,165,517 -144,000,000 1981 283,000,000 204,932,898.1 49,417,781.7 28,649,320.2 -359,000,000 -178,144,983 -152,034,335 -28,820,682 -76,000,000 1982 239,000,000 177,250,178.9 36,101,926.9 25,647,894.2 -304,000,000 -141,279,639 -140,896,022 -21,824,338 -65,000,000 1983 229,000,000 152,600,741.0 53,395,376.3 23,003,882.7 -311,000,000 -140,730,798 -153,814,950 -16,454,252 -82,000,000 1984 314,000,000 239,286,028.4 59,016,522.9 15,697,448.7 -271,000,000 -112,093,515 -140,432,900 -18,473,585 43,000,0001985 249,000,000 202,449,187.2 45,949,881.7 600,931.1 -285,000,000 -146,783,017 -134,883,608 -3,333,375 -36,000,000 1986 248,000,000 200,149,095.4 45,900,651.1 1,950,253.6 -260,000,000 -160,227,010 -97,637,051 -2,135,939 -12,000,000 1987 277,000,000 191,913,623.4 45,176,071.7 39,910,304.9 -295,000,000 -109,237,114 -125,801,661 -59,961,225 -18,000,000 1988 288,000,000 214,954,779.2 58,882,691.8 14,162,529.1 -406,000,000 -204,475,446 -177,439,926 -24,084,628 -118,000,000 1989 267,000,000 206,476,038.8 44,138,310.2 16,385,651.0 -503,000,000 -212,358,148 -259,321,150 -31,320,701 -236,000,000 1990 417,000,000 320,280,821.5 62,429,526.3 34,289,652.2 -575,000,000 -288,717,544 -242,146,802 -44,135,654 -158,000,000 1991 469,000,000 352,527,310.2 49,936,565.5 66,536,124.3 -703,000,000 -340,645,947 -305,654,979 -56,699,074 -234,000,000 1992 396,000,000 286,958,121.2 49,818,494.0 59,223,384.8 -735,000,000 -339,055,275 -334,960,465 -60,984,260 -339,000,000 1993 320,000,000 203,415,284.6 49,981,828.6 66,602,886.8 -546,000,000 -186,480,249 -285,207,353 -74,312,397 -226,000,000 1994 342,000,000 208,347,237.8 54,575,514.8 79,077,247.4 -497,000,000 -158,778,568 -262,601,679 -75,619,753 -155,000,000 1995 405,000,000 312,831,231.0 65,998,616.6 26,170,152.4 -475,000,000 -210,949,230 -215,073,244 -48,977,526 -70,000,000 1996 481,000,000 312,796,220.4 128,681,545.4 39,522,234.2 -624,000,000 -181,963,755 -414,622,802 -27,413,443 -143,000,000 1997 537,000,000 357,397,126.4 115,568,092.1 64,034,781.5 -781,000,000 -209,473,541 -530,712,646 -40,813,813 -244,000,000 1998 431,000,000 289,177,253.8 93,856,551.0 47,966,195.2 -515,000,000 -139,595,849 -349,979,045 -25,425,106 -84,000,000 1999 453,000,000 317,454,015.9 87,655,876.6 47,890,107.5 -673,000,000 -168,733,513 -454,263,135 -50,003,352 -220,000,000 2000 379,000,000 265,916,727.2 59,158,546.2 53,924,726.5 -532,000,000 -106,584,998 -381,800,033 -43,614,969 -153,000,000 2001 449,000,000 319,533,304.0 65,258,029.0 64,208,667.0 -563,000,000 -136,742,537 -376,270,627 -49,986,836 -114,000,000 2002 407,127,000 277,169,452.9 65,794,039.1 64,163,508.0 -695,056,000 -182,375,283 -449,634,634 -63,046,083 -287,929,000 2003 525,262,000 346,253,190.4 105,110,570.6 73,898,239.0 -785,861,000 -171,278,260 -510,037,342 -104,545,398 -260,599,000 2004 483,213,000 284,300,851.7 122,612,298.2 76,299,850.2 -932,518,000 -220,936,140 -584,453,797 -127,128,063 -449,305,000 2005 508,793,278 332,483,544.4 110,839,905.0 65,469,828.5 -1,165,192,000 -243,642,051 -770,967,490 -150,582,460 -656,398,722 2006 668,417,000 370,173,120.9 208,225,582.7 90,018,296.4 -1,206,696,000 -344,917,067 -685,682,150 -176,096,782 -538,279,000 2007 868,559,000 497,073,417.5 230,895,802.6 140,589,779.9 -1,377,845,000 -382,228,006 -751,735,425 -243,881,569 -509,286,000 2008 878,999,000 480,332,543.6 282,731,435.1 115,935,021.3 -2,203,688,000 -518,367,099 -1,268,579,440 -416,741,460 -1,324,689,000 2009 1,187,917,000 648,746,142.6 236,993,824.0 302,177,033.3 -2,021,672,000 -540,701,479 -1,143,436,143 -337,534,378 -833,755,000 2010 1,066,204,000 609,734,267.9 237,725,178.7 218,744,553.4 -2,173,038,000 -468,055,042 -1,342,250,605 -362,732,353 -1,106,834,000 2011 1,425,289,000 798,374,255.9 323,067,566.2 303,847,177.9 -2,427,696,000 -606,299,961 -1,279,833,860 -541,562,179 -1,002,407,000 2012 1,300,000,000 -2,350,000,000 -1,050,000,000 2013
Export Destinations and Import Origins of Merchandise Trade

66
-400
-200
0
200
400
600
800
1,000
1,200
19
611
963
19
651
967
19
691
971
19
731
975
19
771
979
19
811
983
19
851
987
19
891
991
19
931
995
19
971
999
20
012
003
20
052
007
20
092
011
20
13
mill
ion U
S$ a
t curr
ent
pric
es
Food Exports and Imports
Exports
Imports
Balance
-400
-200
0
200
400
600
800
1,000
1,200
19
611
963
19
651
967
19
691
971
19
731
975
19
771
979
19
811
983
19
851
987
19
891
991
19
931
995
19
971
999
20
012
003
20
052
007
20
092
011
20
13
mill
ion U
S$ a
t curr
ent prices
Fuel Exports and Imports
(Exports are invisibly small.)
Exports
Imports
Balance
7.4 Exports and Imports of Food and Fuel The food exports have been on an increasing trend although there are a few failed years. The imports of food have also been increasing in recent years. In most years, the balance has been positive and on an increasing trend. It should be noted that the category of food is not limited to essential foodstuffs. While the fuel exports are very small, the imports are expanding, so is the negative balance of fuel trade.
Source note of the World Development Indicators Food: food and live animals, beverages and tobacco, animal and vegetable oils and fats, oil seeds, oil nuts, and oil kernels. Fuels: mineral fuels.
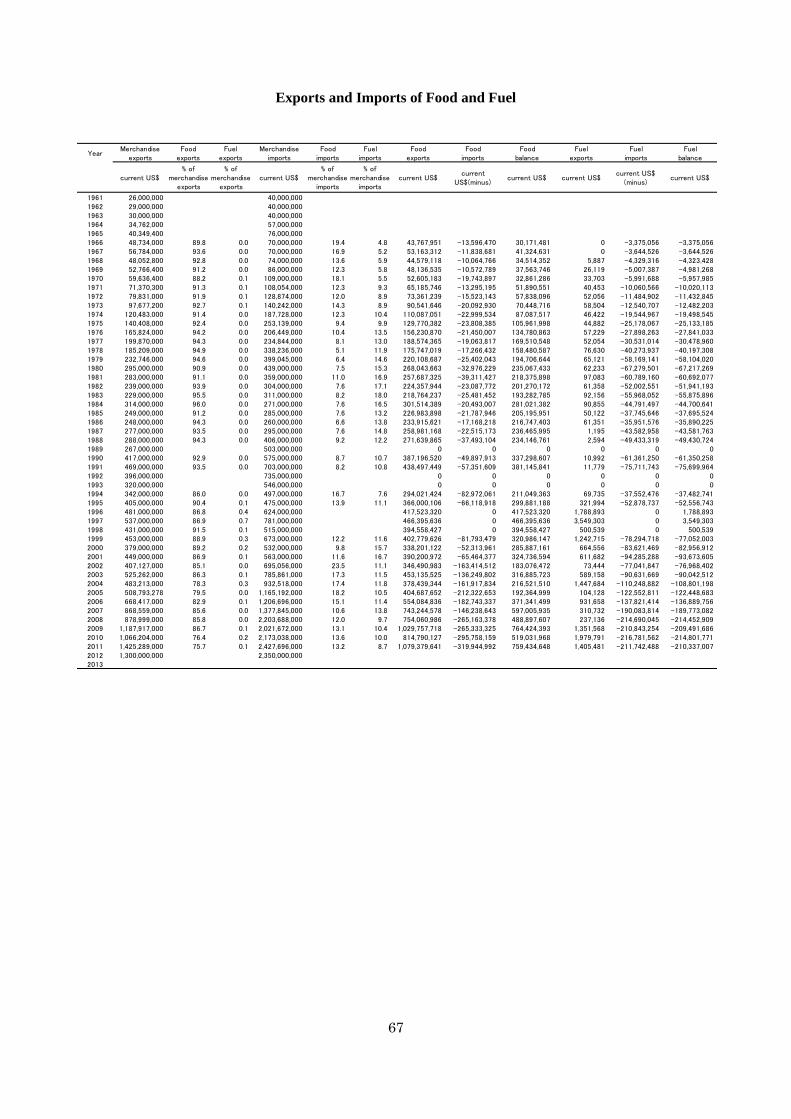
67
YearMerchandise
exportsFood
exportsFuel
exportsMerchandise
importsFood
importsFuel
importsFood
exportsFood
importsFood
balanceFuel
exportsFuel
importsFuel
balance
current US$% of
merchandiseexports
% ofmerchandise
exportscurrent US$
% ofmerchandise
imports
% ofmerchandise
importscurrent US$
currentUS$(minus)
current US$ current US$current US$
(minus)current US$
1961 26,000,000 40,000,0001962 29,000,000 40,000,0001963 30,000,000 40,000,0001964 34,762,000 57,000,0001965 40,349,400 76,000,0001966 48,734,000 89.8 0.0 70,000,000 19.4 4.8 43,767,951 -13,596,470 30,171,481 0 -3,375,056 -3,375,0561967 56,784,000 93.6 0.0 70,000,000 16.9 5.2 53,163,312 -11,838,681 41,324,631 0 -3,644,526 -3,644,5261968 48,052,800 92.8 0.0 74,000,000 13.6 5.9 44,579,118 -10,064,766 34,514,352 5,887 -4,329,316 -4,323,4281969 52,766,400 91.2 0.0 86,000,000 12.3 5.8 48,136,535 -10,572,789 37,563,746 26,119 -5,007,387 -4,981,2681970 59,636,400 88.2 0.1 109,000,000 18.1 5.5 52,605,183 -19,743,897 32,861,286 33,703 -5,991,688 -5,957,9851971 71,370,300 91.3 0.1 108,054,000 12.3 9.3 65,185,746 -13,295,195 51,890,551 40,453 -10,060,566 -10,020,1131972 79,831,000 91.9 0.1 128,874,000 12.0 8.9 73,361,239 -15,523,143 57,838,096 52,056 -11,484,902 -11,432,8451973 97,677,200 92.7 0.1 140,242,000 14.3 8.9 90,541,646 -20,092,930 70,448,716 58,504 -12,540,707 -12,482,2031974 120,483,000 91.4 0.0 187,728,000 12.3 10.4 110,087,051 -22,999,534 87,087,517 46,422 -19,544,967 -19,498,5451975 140,408,000 92.4 0.0 253,139,000 9.4 9.9 129,770,382 -23,808,385 105,961,998 44,882 -25,178,067 -25,133,1851976 165,824,000 94.2 0.0 206,449,000 10.4 13.5 156,230,870 -21,450,007 134,780,863 57,229 -27,898,263 -27,841,0331977 199,870,000 94.3 0.0 234,844,000 8.1 13.0 188,574,365 -19,063,817 169,510,548 52,054 -30,531,014 -30,478,9601978 185,209,000 94.9 0.0 338,236,000 5.1 11.9 175,747,019 -17,266,432 158,480,587 76,630 -40,273,937 -40,197,3081979 232,746,000 94.6 0.0 399,045,000 6.4 14.6 220,108,687 -25,402,043 194,706,644 65,121 -58,169,141 -58,104,0201980 295,000,000 90.9 0.0 439,000,000 7.5 15.3 268,043,663 -32,976,229 235,067,433 62,233 -67,279,501 -67,217,2691981 283,000,000 91.1 0.0 359,000,000 11.0 16.9 257,687,325 -39,311,427 218,375,898 97,083 -60,789,160 -60,692,0771982 239,000,000 93.9 0.0 304,000,000 7.6 17.1 224,357,944 -23,087,772 201,270,172 61,358 -52,002,551 -51,941,1931983 229,000,000 95.5 0.0 311,000,000 8.2 18.0 218,764,237 -25,481,452 193,282,785 92,156 -55,968,052 -55,875,8961984 314,000,000 96.0 0.0 271,000,000 7.6 16.5 301,514,389 -20,493,007 281,021,382 90,855 -44,791,497 -44,700,6411985 249,000,000 91.2 0.0 285,000,000 7.6 13.2 226,983,898 -21,787,946 205,195,951 50,122 -37,745,646 -37,695,5241986 248,000,000 94.3 0.0 260,000,000 6.6 13.8 233,915,621 -17,168,218 216,747,403 61,351 -35,951,576 -35,890,2251987 277,000,000 93.5 0.0 295,000,000 7.6 14.8 258,981,168 -22,515,173 236,465,995 1,195 -43,582,958 -43,581,7631988 288,000,000 94.3 0.0 406,000,000 9.2 12.2 271,639,865 -37,493,104 234,146,761 2,594 -49,433,319 -49,430,7241989 267,000,000 503,000,000 0 0 0 0 0 01990 417,000,000 92.9 0.0 575,000,000 8.7 10.7 387,196,520 -49,897,913 337,298,607 10,992 -61,361,250 -61,350,2581991 469,000,000 93.5 0.0 703,000,000 8.2 10.8 438,497,449 -57,351,609 381,145,841 11,779 -75,711,743 -75,699,9641992 396,000,000 735,000,000 0 0 0 0 0 01993 320,000,000 546,000,000 0 0 0 0 0 01994 342,000,000 86.0 0.0 497,000,000 16.7 7.6 294,021,424 -82,972,061 211,049,363 69,735 -37,552,476 -37,482,7411995 405,000,000 90.4 0.1 475,000,000 13.9 11.1 366,000,106 -66,118,918 299,881,188 321,994 -52,878,737 -52,556,7431996 481,000,000 86.8 0.4 624,000,000 417,523,320 0 417,523,320 1,788,893 0 1,788,8931997 537,000,000 86.9 0.7 781,000,000 466,395,636 0 466,395,636 3,549,303 0 3,549,3031998 431,000,000 91.5 0.1 515,000,000 394,558,427 0 394,558,427 500,539 0 500,5391999 453,000,000 88.9 0.3 673,000,000 12.2 11.6 402,779,626 -81,793,479 320,986,147 1,242,715 -78,294,718 -77,052,0032000 379,000,000 89.2 0.2 532,000,000 9.8 15.7 338,201,122 -52,313,961 285,887,161 664,556 -83,621,469 -82,956,9122001 449,000,000 86.9 0.1 563,000,000 11.6 16.7 390,200,972 -65,464,377 324,736,594 611,682 -94,285,288 -93,673,6052002 407,127,000 85.1 0.0 695,056,000 23.5 11.1 346,490,983 -163,414,512 183,076,472 73,444 -77,041,847 -76,968,4022003 525,262,000 86.3 0.1 785,861,000 17.3 11.5 453,135,525 -136,249,802 316,885,723 589,158 -90,631,669 -90,042,5122004 483,213,000 78.3 0.3 932,518,000 17.4 11.8 378,439,344 -161,917,834 216,521,510 1,447,684 -110,248,882 -108,801,1982005 508,793,278 79.5 0.0 1,165,192,000 18.2 10.5 404,687,652 -212,322,653 192,364,999 104,128 -122,552,811 -122,448,6832006 668,417,000 82.9 0.1 1,206,696,000 15.1 11.4 554,084,836 -182,743,337 371,341,499 931,658 -137,821,414 -136,889,7562007 868,559,000 85.6 0.0 1,377,845,000 10.6 13.8 743,244,578 -146,238,643 597,005,935 310,732 -190,083,814 -189,773,0822008 878,999,000 85.8 0.0 2,203,688,000 12.0 9.7 754,060,986 -265,163,378 488,897,607 237,136 -214,690,045 -214,452,9092009 1,187,917,000 86.7 0.1 2,021,672,000 13.1 10.4 1,029,757,718 -265,333,325 764,424,393 1,351,568 -210,843,254 -209,491,6862010 1,066,204,000 76.4 0.2 2,173,038,000 13.6 10.0 814,790,127 -295,758,159 519,031,968 1,979,791 -216,781,562 -214,801,7712011 1,425,289,000 75.7 0.1 2,427,696,000 13.2 8.7 1,079,379,641 -319,944,992 759,434,648 1,405,481 -211,742,488 -210,337,0072012 1,300,000,000 2,350,000,0002013
Exports and Imports of Food and Fuel

68
-100
-50
0
50
100
150
19
611
963
19
651
967
19
691
971
19
731
975
19
771
979
19
811
983
19
851
987
19
891
991
19
931
995
19
971
999
20
012
003
20
052
007
20
092
011
20
13
mill
ion U
S$ a
t curr
ent
pric
es
Exports and Imports of Ores and Metals
Exports
Imports
Balance
7.5 Exports and Imports of Ores and Metals Ores and metals used to have small shares in exports and imports. In 2009, however, Malawi started mining and exporting uranium. In 2010, a trade surplus of ores and metals was recorded for the first time.

69
YearMerchandise
exportsMerchandise
importsOres and metals
exportsOres and metals
importsOres and metals
exportsOres and metals
importsOres and metals
trade balance
current US$ current US$% of merchandise
exports% of merchandise
importscurrent US$
current US$(minus)
current US$
1961 26,000,000 40,000,0001962 29,000,000 40,000,0001963 30,000,000 40,000,0001964 34,762,000 57,000,0001965 40,349,400 76,000,0001966 48,734,000 70,000,000 0.2 1.4 99,109 -1,014,375 -915,2661967 56,784,000 70,000,000 0.1 1.3 63,224 -928,733 -865,5081968 48,052,800 74,000,000 0.3 1.1 125,704 -847,492 -721,7881969 52,766,400 86,000,000 0.2 1.3 117,057 -1,133,260 -1,016,2031970 59,636,400 109,000,000 0.4 1.1 226,102 -1,180,355 -954,2531971 71,370,300 108,054,000 0.2 1.3 157,527 -1,385,331 -1,227,8041972 79,831,000 128,874,000 0.1 1.4 79,788 -1,757,675 -1,677,8871973 97,677,200 140,242,000 0.1 1.8 86,066 -2,457,400 -2,371,3331974 120,483,000 187,728,000 0.1 1.9 152,329 -3,480,798 -3,328,4691975 140,408,000 253,139,000 0.1 1.3 143,456 -3,334,093 -3,190,6371976 165,824,000 206,449,000 0.0 1.5 34,768 -3,068,830 -3,034,0621977 199,870,000 234,844,000 0.0 1.7 24,524 -4,095,224 -4,070,6991978 185,209,000 338,236,000 0.0 1.3 49,466 -4,256,206 -4,206,7401979 232,746,000 399,045,000 0.0 1.4 64,150 -5,516,287 -5,452,1371980 295,000,000 439,000,000 0.0 1.4 70,361 -6,053,456 -5,983,0951981 283,000,000 359,000,000 0.0 1.4 118,174 -4,936,844 -4,818,6691982 239,000,000 304,000,000 0.0 1.4 45,443 -4,366,817 -4,321,3741983 229,000,000 311,000,000 0.0 1.2 50,941 -3,615,032 -3,564,0911984 314,000,000 271,000,000 0.0 1.6 52,661 -4,378,825 -4,326,1631985 249,000,000 285,000,000 0.0 1.6 11,635 -4,506,823 -4,495,1881986 248,000,000 260,000,000 0.0 1.3 105,110 -3,362,271 -3,257,1611987 277,000,000 295,000,000 0.0 1.6 70,875 -4,593,590 -4,522,7151988 288,000,000 406,000,000 0.0 1.5 118,803 -6,287,369 -6,168,5651989 267,000,000 503,000,0001990 417,000,000 575,000,000 0.0 1.5 126,598 -8,386,867 -8,260,2691991 469,000,000 703,000,000 0.0 1.5 104,923 -10,648,509 -10,543,5861992 396,000,000 735,000,0001993 320,000,000 546,000,0001994 342,000,000 497,000,000 0.2 1.0 671,379 -5,094,719 -4,423,3401995 405,000,000 475,000,000 0.1 0.9 513,381 -4,094,243 -3,580,8621996 481,000,000 624,000,000 0.1 301,1451997 537,000,000 781,000,000 0.1 700,9821998 431,000,000 515,000,000 0.0 125,5331999 453,000,000 673,000,000 0.1 0.9 242,279 -6,052,062 -5,809,7822000 379,000,000 532,000,000 0.2 0.7 817,403 -3,922,939 -3,105,5362001 449,000,000 563,000,000 0.2 0.5 1,089,031 -3,028,519 -1,939,4882002 407,127,000 695,056,000 0.3 0.9 1,098,204 -6,222,331 -5,124,1272003 525,262,000 785,861,000 0.1 0.9 561,241 -7,019,220 -6,457,9792004 483,213,000 932,518,000 0.3 1.1 1,556,271 -9,804,129 -8,247,8582005 508,793,278 1,165,192,000 0.2 0.8 995,331 -9,893,468 -8,898,1372006 668,417,000 1,206,696,000 0.1 0.7 691,991 -8,708,909 -8,016,9182007 868,559,000 1,377,845,000 0.0 0.7 139,584 -9,536,081 -9,396,4972008 878,999,000 2,203,688,000 0.0 0.6 190,021 -12,411,676 -12,221,6552009 1,187,917,000 2,021,672,000 0.8 1.0 9,357,989 -19,207,908 -9,849,9192010 1,066,204,000 2,173,038,000 11.1 1.0 118,080,310 -22,066,526 96,013,7832011 1,425,289,000 2,427,696,000 8.8 2.8 125,670,257 -67,478,764 58,191,4932012 1,300,000,000 2,350,000,0002013
Exports and Imports of Ores and Metals

70
0
100,000
200,000
300,000
400,000
500,000
600,000
700,000
800,000
900,000
1,000,000
-120
-100
-80
-60
-40
-20
0
20
40
60
80
19
90
19
92
19
94
19
96
19
98
20
00
20
02
20
04
20
06
20
08
20
10
20
12
No. o
f ar
riva
ls
mill
ion U
S$ a
t curr
ent
pric
es
International Tourism
Receipts(left axis)
Expenditures(left axis)
Balance(left axis)
Number ofarrivals(right axis)
0
20
40
60
80
100
120
140
160
180
200
19
90
19
91
19
92
19
93
19
94
19
95
19
96
19
97
19
98
19
99
20
00
20
01
20
02
20
03
20
04
20
05
20
06
20
07
20
08
20
09
20
10
20
11
20
12
20
13
curr
eent
US$
Receipts per International Arrival
7.6 International Tourism The receipts from international inbound visitors are less than 10% of the total exports. Similarly the expenditures of international outbound visitors are less than 10% of the total imports. It is noted that the receipts are less than the expenditures except in 2004 and that the expenditures are increasing and worsening the deficit. The statistical data of the outbound visitors might be affected properly or improperly by out-migrant Malawian workers or Malawians visiting abroad for ODA programs. After a peak in 2003 and 2004, the receipts remain low. The number of arrivals was on an increasing trend, but in recent years it stopped increasing and the receipts per arrival have been as low as US$60. Unfortunately, data of the number of departures is not available.

71
YearNumber of
arrivals(right axis)
Receipts(left axis)
Expenditures(left axis)
Balance(left axis)
Receipsper arrival
current US$current US$
(minus)current US$ current US$
199019911992199319941995 192,000 22,000,000 -53,000,000 -31,000,000 1151996 194,000 31,000,000 -64,000,000 -33,000,000 1601997 207,000 32,000,000 -81,000,000 -49,000,000 1551998 220,000 25,000,000 -49,000,000 -24,000,000 1141999 254,000 42,000,000 -52,000,000 -10,000,000 1652000 228,000 29,000,000 -53,000,000 -24,000,000 1272001 266,000 40,000,000 -52,000,000 -12,000,000 1502002 383,000 45,000,000 -86,000,000 -41,000,000 1172003 424,000 66,000,000 -70,000,000 -4,000,000 1562004 427,000 74,000,000 -70,000,000 4,000,000 1732005 438,000 48,000,000 -84,000,000 -36,000,000 1102006 638,000 45,000,000 -85,000,000 -40,000,000 712007 735,000 43,000,000 -79,000,000 -36,000,000 592008 742,000 43,000,000 -96,000,000 -53,000,000 582009 755,000 46,000,000 -100,000,000 -54,000,000 612010 746,000 45,000,000 -93,000,000 -48,000,000 602011 767,000 43,000,000 -96,000,000 -53,000,000 5620122013
Source note of the World Development Indicators Number of arrivals: Number of arrivals of inbound tourists who travel to a country. It is not the number of people traveling. A person who makes several trips to a country during a given period is counted each time as a new arrival. International tourism receipts: Expenditures in current US$ by international inbound visitors. International tourism expenditures: Expenditures in current US$ of international outbound visitors in other countries.
International Tourism

72
0
5
10
15
20
25
30
35
40
45
19
61
19
63
19
65
19
67
19
69
19
71
19
73
19
75
19
77
19
79
19
81
19
83
19
85
19
87
19
89
19
91
19
93
19
95
19
97
19
99
20
01
20
03
20
05
20
07
20
09
20
11
20
13
%
Ratio of Net Official Development Assistance Received to Gross National Income
0
10
20
30
40
50
60
70
80
90
100
19
61
19
63
19
65
19
67
19
69
19
71
19
73
19
75
19
77
19
79
19
81
19
83
19
85
19
87
19
89
19
91
19
93
19
95
19
97
19
99
20
01
20
03
20
05
20
07
20
09
20
11
20
13
consta
nt 2011 U
S$
Net Official Development Assistance Received per Capita
0
200
400
600
800
1,000
1,2001
961
19
63
19
65
19
67
19
69
19
71
19
73
19
75
19
77
19
79
19
81
19
83
19
85
19
87
19
89
19
91
19
93
19
95
19
97
19
99
20
01
20
03
20
05
20
07
20
09
20
11
20
13
mill
ion U
S$ a
t consta
nt 2011 p
rices
Net Official Development Assistance Received
7.7 Official Development Assistance (ODA) The amount of the net official development assistance (ODA) received at constant prices is on an increasing trend with the highest peak over US$1 billion (at 2011 constant prices) in 2010. In terms of the ratio to the gross national income (GNI), the highest peak was in 1994 when ODA was 41% of GNI, then the ratio has been decreasing. On the other hand, the net ODA per capita has been fluctuating neither on an increasing trend nor on a decreasing trend. For example, the ODA per capita in 2010 was US$72.6 at constant 2011 prices, being lower than the level around 1990. Effects of the increasing ODA might be diluted by the increasing population.

73
YearNet ODAreceived
Net ODAreceived
Net ODAreceived
Net ODAreceivedper capita
Net ODAreceivedper capita
current US$constant 2011
US$% of GNI
currentUS$
constant2011 US$
1961 8,230,000 74,540,000 4.8 2.3 20.71962 11,610,000 101,630,000 6.4 3.1 27.51963 16,460,000 142,850,000 8.7 4.4 37.81964 32,560,000 269,160,000 17.5 8.4 69.41965 33,910,000 264,980,000 15.2 8.5 66.71966 31,710,000 241,880,000 12.5 7.8 59.41967 30,040,000 227,310,000 11.6 7.2 54.41968 46,930,000 353,260,000 19.8 10.9 82.41969 27,500,000 211,540,000 10.6 6.2 48.01970 36,770,000 255,440,000 13.0 8.1 56.41971 31,520,000 201,610,000 8.7 6.8 43.21972 36,170,000 210,720,000 9.0 7.5 43.81973 29,610,000 160,910,000 6.6 6.0 32.41974 41,390,000 197,940,000 7.3 8.1 38.61975 62,880,000 258,430,000 10.1 11.9 48.81976 61,660,000 250,330,000 9.5 11.3 45.71977 78,910,000 293,880,000 10.1 13.9 51.81978 98,210,000 314,330,000 10.8 16.8 53.61979 141,420,000 390,830,000 14.3 23.4 64.61980 141,180,000 355,170,000 12.4 22.6 56.91981 136,640,000 358,070,000 11.8 21.3 55.91982 120,230,000 323,890,000 10.8 18.3 49.41983 115,490,000 311,100,000 10.0 17.2 46.21984 181,320,000 513,270,000 15.7 26.1 73.81985 112,460,000 321,710,000 10.4 15.5 44.31986 194,490,000 435,520,000 17.3 25.4 56.81987 275,840,000 528,310,000 24.5 33.8 64.81988 375,600,000 671,530,000 28.3 43.4 77.61989 417,300,000 770,920,000 27.1 45.8 84.71990 500,360,000 816,640,000 27.2 53.0 86.41991 549,570,000 867,630,000 25.5 56.9 89.81992 577,040,000 864,030,000 32.8 59.1 88.51993 496,340,000 757,600,000 24.5 50.6 77.31994 470,140,000 668,090,000 41.3 47.7 67.81995 434,140,000 583,240,000 32.2 43.6 58.51996 491,540,000 675,390,000 21.9 48.4 66.51997 343,940,000 509,450,000 13.1 33.1 49.01998 434,520,000 662,000,000 25.4 40.6 61.91999 446,620,000 672,260,000 25.8 40.6 61.02000 446,110,000 683,630,000 26.1 39.4 60.42001 409,430,000 675,230,000 24.3 35.2 58.12002 378,140,000 587,140,000 14.4 31.7 49.22003 518,130,000 702,810,000 21.7 42.3 57.42004 505,610,000 618,080,000 19.6 40.2 49.22005 573,350,000 691,170,000 21.1 44.4 53.52006 722,800,000 832,790,000 23.5 54.3 62.62007 743,950,000 800,350,000 20.5 54.2 58.42008 923,630,000 947,940,000 21.7 65.3 67.02009 771,390,000 835,640,000 15.6 52.9 57.32010 1,022,850,000 1,089,940,000 19.4 68.1 72.62011 804,320,000 804,320,000 14.6 52.0 52.020122013
Source note of the World Development Indicators Net official development assistance (ODA): Net ODA consists of disbursements of loans made on concessional terms (net of repayments of principal) and grants by official agencies of the members of the Development Assistance Committee (DAC), by multilateral institutions, and by non-DAC countries to promote economic development and welfare in countries and territories in the DAC list of ODA recipients. It includes loans with a grant element of at least 25 percent (calculated at a rate of discount of 10 percent).
Net Official Development Assistance (ODA) Received

74
-200
0
200
400
600
800
1,000
1,200
1961
1963
1965
1967
1969
1971
1973
1975
1977
1979
1981
1983
1985
1987
1989
1991
1993
1995
1997
1999
2001
2003
2005
2007
2009
2011
2013
milli
on U
S$ a
t cur
rent
pric
es
Net Official Development Assistance Receivedand Foreign Direct Investment, Net Inflows
NetODAreceived
FDInet inflows (BoP)
-50
0
50
100
150
200
19
61
19
63
19
65
19
67
19
69
19
71
19
73
19
75
19
77
19
79
19
81
19
83
19
85
19
87
19
89
19
91
19
93
19
95
19
97
19
99
20
01
20
03
20
05
20
07
20
09
20
11
20
13
mill
ion U
S$ a
t curr
ent
pric
es
Foreign Direct Investment, Net Inflows (BoP)
7.8 Foreign Direct Investment (FDI) The foreign direct investment (FDI) has increased in recent years. But the amount is still much lower than the ODA. The imbalance between the ODA and the FDI might support a view that the economic development is less rapid than social development in Malawi.
Source note of the World Development Indicators Foreign direct investment, net inflows (BoP, current US$): The net inflows of investment to acquire a lasting management interest (10 percent or more of voting stock) in an enterprise operating in an economy other than that of the investor. It is the sum of equity capital, reinvestment of earnings, other long-term capital, and short-term capital as shown in the balance of payments (BoP). This series shows net inflows (new investment inflows less disinvestment) in the reporting economy from foreign investors.
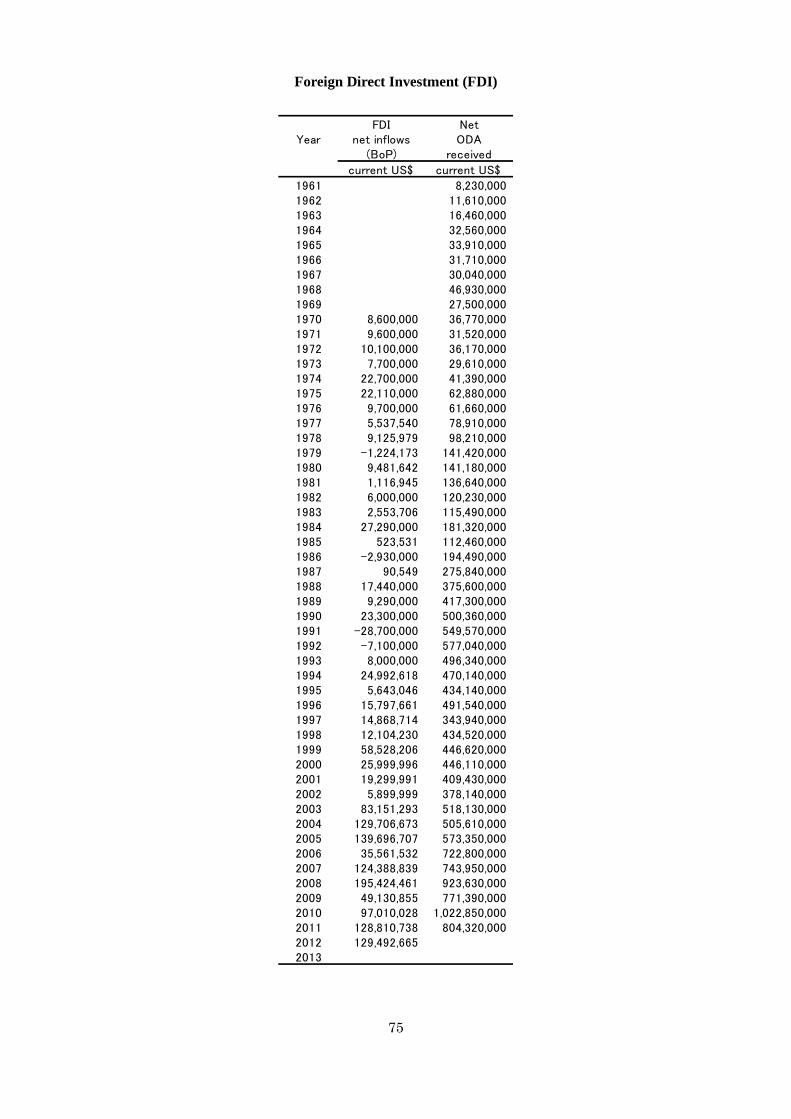
75
YearFDI
net inflows(BoP)
NetODA
received
current US$ current US$
1961 8,230,0001962 11,610,0001963 16,460,0001964 32,560,0001965 33,910,0001966 31,710,0001967 30,040,0001968 46,930,0001969 27,500,0001970 8,600,000 36,770,0001971 9,600,000 31,520,0001972 10,100,000 36,170,0001973 7,700,000 29,610,0001974 22,700,000 41,390,0001975 22,110,000 62,880,0001976 9,700,000 61,660,0001977 5,537,540 78,910,0001978 9,125,979 98,210,0001979 -1,224,173 141,420,0001980 9,481,642 141,180,0001981 1,116,945 136,640,0001982 6,000,000 120,230,0001983 2,553,706 115,490,0001984 27,290,000 181,320,0001985 523,531 112,460,0001986 -2,930,000 194,490,0001987 90,549 275,840,0001988 17,440,000 375,600,0001989 9,290,000 417,300,0001990 23,300,000 500,360,0001991 -28,700,000 549,570,0001992 -7,100,000 577,040,0001993 8,000,000 496,340,0001994 24,992,618 470,140,0001995 5,643,046 434,140,0001996 15,797,661 491,540,0001997 14,868,714 343,940,0001998 12,104,230 434,520,0001999 58,528,206 446,620,0002000 25,999,996 446,110,0002001 19,299,991 409,430,0002002 5,899,999 378,140,0002003 83,151,293 518,130,0002004 129,706,673 505,610,0002005 139,696,707 573,350,0002006 35,561,532 722,800,0002007 124,388,839 743,950,0002008 195,424,461 923,630,0002009 49,130,855 771,390,0002010 97,010,028 1,022,850,0002011 128,810,738 804,320,0002012 129,492,6652013
Foreign Direct Investment (FDI)
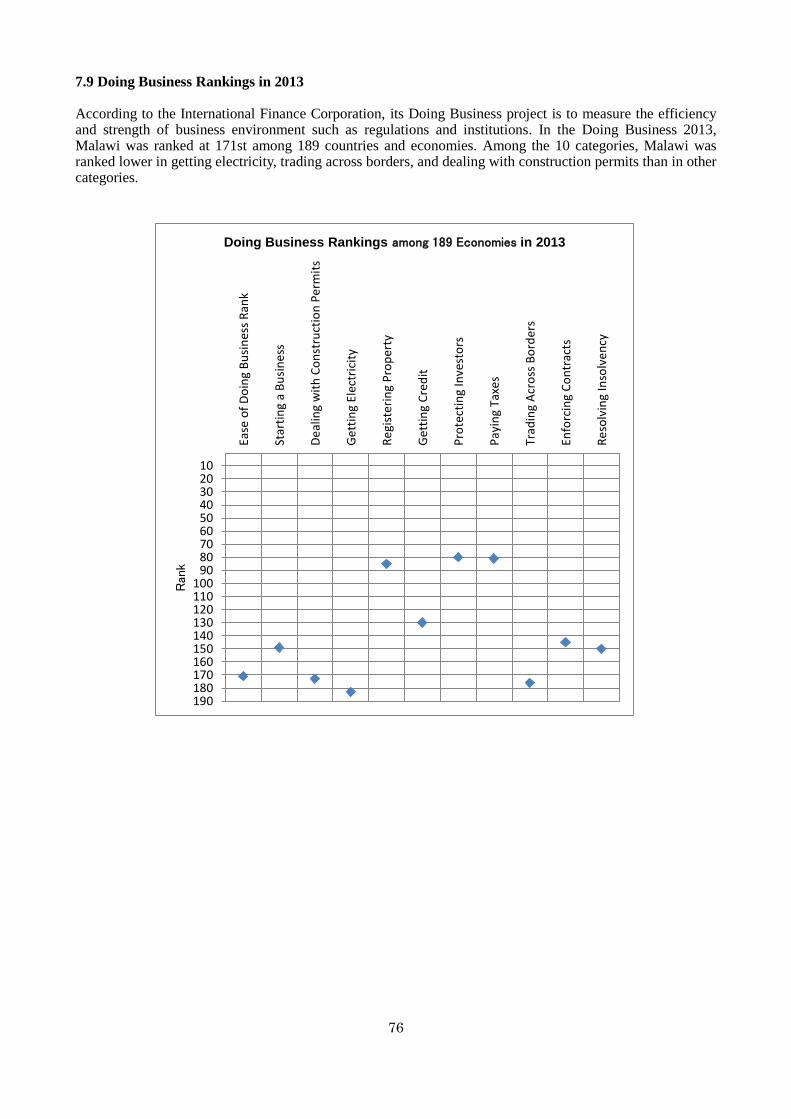
76
190180170160150140130120110100
908070605040302010
Ease
of
Do
ing
Bu
sin
ess
Ran
k
Star
tin
g a
Bu
sin
ess
De
alin
g w
ith
Co
nst
ruct
ion
Pe
rmit
s
Get
tin
g El
ectr
icit
y
Re
gist
erin
g P
rop
erty
Get
tin
g C
red
it
Pro
tect
ing
Inve
sto
rs
Pay
ing
Taxe
s
Trad
ing
Acr
oss
Bo
rder
s
Enfo
rcin
g C
on
trac
ts
Re
solv
ing
Inso
lve
ncy
Ran
k
Doing Business Rankings among 189 Economies in 2013
7.9 Doing Business Rankings in 2013 According to the International Finance Corporation, its Doing Business project is to measure the efficiency and strength of business environment such as regulations and institutions. In the Doing Business 2013, Malawi was ranked at 171st among 189 countries and economies. Among the 10 categories, Malawi was ranked lower in getting electricity, trading across borders, and dealing with construction permits than in other categories.
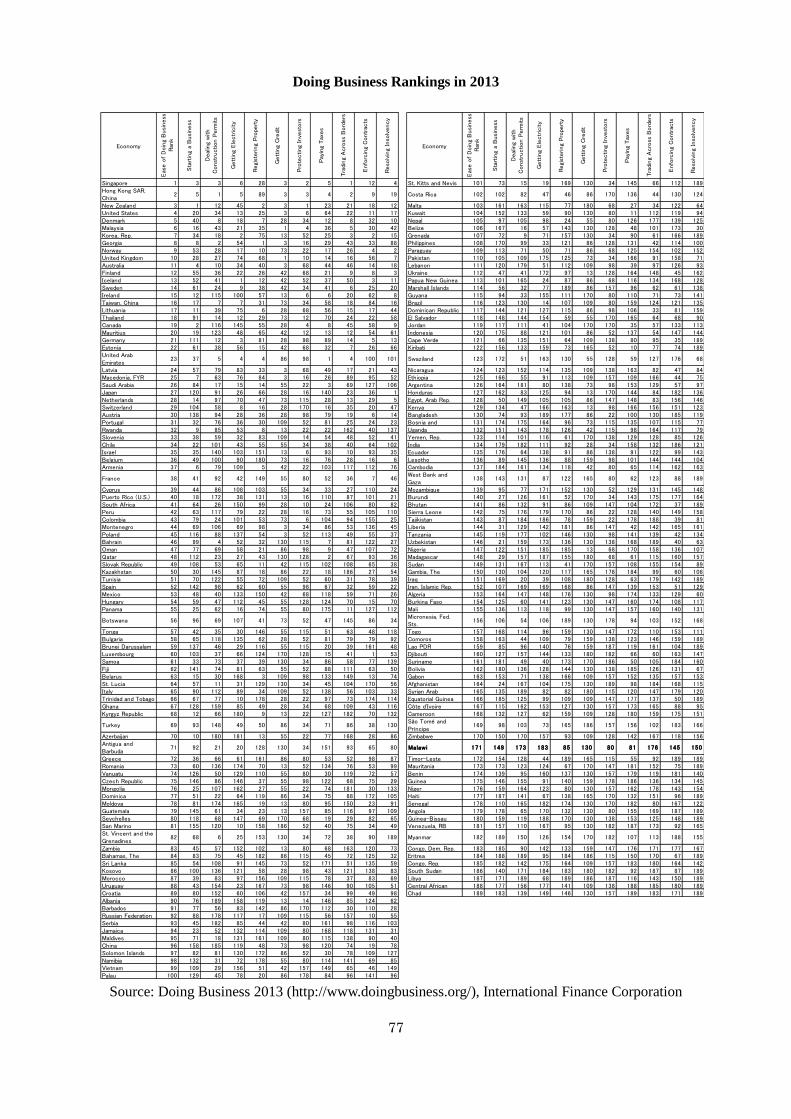
77
Economy
Eas
e o
f D
oin
g B
usi
ness
Ran
k
Sta
rtin
g a
Busi
ness
Deal
ing
with
Const
ruction P
erm
its
Gett
ing
Ele
ctr
icity
Regi
stering
Pro
pert
y
Gett
ing
Cre
dit
Pro
tecting
Inve
stors
Pay
ing
Tax
es
Tra
ding
Acro
ss B
ord
ers
Enfo
rcin
g C
ontr
acts
Reso
lvin
g In
solv
ency
Economy
Eas
e o
f D
oin
g B
usi
ness
Ran
k
Sta
rtin
g a
Busi
ness
Deal
ing
with
Const
ruction P
erm
its
Gett
ing
Ele
ctr
icity
Regi
stering
Pro
pert
y
Gett
ing
Cre
dit
Pro
tecting
Inve
stors
Pay
ing
Tax
es
Tra
ding
Acro
ss B
ord
ers
Enfo
rcin
g C
ontr
acts
Reso
lvin
g In
solv
ency
Singapore 1 3 3 6 28 3 2 5 1 12 4 St. Kitts and Nevis 101 73 15 19 169 130 34 145 66 112 189Hong Kong SAR,China
2 5 1 5 89 3 3 4 2 9 19 Costa Rica 102 102 82 47 46 86 170 136 44 130 124
New Zealand 3 1 12 45 2 3 1 23 21 18 12 Malta 103 161 163 115 77 180 68 27 34 122 64United States 4 20 34 13 25 3 6 64 22 11 17 Kuwait 104 152 133 59 90 130 80 11 112 119 94Denmark 5 40 8 18 7 28 34 12 8 32 10 Nepal 105 97 105 98 24 55 80 126 177 139 125Malaysia 6 16 43 21 35 1 4 36 5 30 42 Belize 106 167 16 57 143 130 128 48 101 173 30Korea, Rep. 7 34 18 2 75 13 52 25 3 2 15 Grenada 107 72 9 71 157 130 34 90 61 166 189Georgia 8 8 2 54 1 3 16 29 43 33 88 Philippines 108 170 99 33 121 86 128 131 42 114 100Norway 9 53 28 17 10 73 22 17 26 4 2 Paraguay 109 113 71 50 71 86 68 125 154 102 152United Kingdom 10 28 27 74 68 1 10 14 16 56 7 Pakistan 110 105 109 175 125 73 34 166 91 158 71Australia 11 4 10 34 40 3 68 44 46 14 18 Lebanon 111 120 179 51 112 109 98 39 97 126 93Finland 12 55 36 22 26 42 68 21 9 8 3 Ukraine 112 47 41 172 97 13 128 164 148 45 162Iceland 13 52 41 1 12 42 52 37 50 3 11 Papua New Guinea 113 101 165 24 87 86 68 116 134 168 128Sweden 14 61 24 9 38 42 34 41 6 25 20 Marshall Islands 114 56 32 77 189 86 157 96 62 61 138Ireland 15 12 115 100 57 13 6 6 20 62 8 Guyana 115 94 33 155 111 170 80 110 71 73 141Taiwan, China 16 17 7 7 31 73 34 58 18 84 16 Brazil 116 123 130 14 107 109 80 159 124 121 135Lithuania 17 11 39 75 6 28 68 56 15 17 44 Dominican Republic 117 144 121 127 115 86 98 106 33 81 159Thailand 18 91 14 12 29 73 12 70 24 22 58 El Salvador 118 148 144 154 59 55 170 165 64 68 90Canada 19 2 116 145 55 28 4 8 45 58 9 Jordan 119 117 111 41 104 170 170 35 57 133 113Mauritius 20 19 123 48 65 42 12 13 12 54 61 Indonesia 120 175 88 121 101 86 52 137 54 147 144Germany 21 111 12 3 81 28 98 89 14 5 13 Cape Verde 121 66 135 151 64 109 138 80 95 35 189Estonia 22 61 38 56 15 42 68 32 7 26 66 Kiribati 122 156 133 159 73 165 52 10 77 74 189United ArabEmirates
23 37 5 4 4 86 98 1 4 100 101 Swaziland 123 172 51 163 130 55 128 59 127 176 68
Latvia 24 57 79 83 33 3 68 49 17 21 43 Nicaragua 124 123 152 114 135 109 138 163 82 47 84Macedonia, FYR 25 7 63 76 84 3 16 26 89 95 52 Ethiopia 125 166 55 91 113 109 157 109 166 44 75Saudi Arabia 26 84 17 15 14 55 22 3 69 127 106 Argentina 126 164 181 80 138 73 98 153 129 57 97Japan 27 120 91 26 66 28 16 140 23 36 1 Honduras 127 162 83 125 94 13 170 144 84 182 136Netherlands 28 14 97 70 47 73 115 28 13 29 5 Egypt, Arab Rep. 128 50 149 105 105 86 147 148 83 156 146Switzerland 29 104 58 8 16 28 170 16 35 20 47 Kenya 129 134 47 166 163 13 98 166 156 151 123Austria 30 138 94 28 36 28 98 79 19 6 14 Bangladesh 130 74 93 189 177 86 22 100 130 185 119Portugal 31 32 76 36 30 109 52 81 25 24 23 Bosnia and 131 174 175 164 96 73 115 135 107 115 77Rwanda 32 9 85 53 8 13 22 22 162 40 137 Uganda 132 151 143 178 126 42 115 98 164 117 79Slovenia 33 38 59 32 83 109 14 54 48 52 41 Yemen, Rep. 133 114 101 116 61 170 138 129 128 85 126Chile 34 22 101 43 55 55 34 38 40 64 102 India 134 179 182 111 92 28 34 158 132 186 121Israel 35 35 140 103 151 13 6 93 10 93 35 Ecuador 135 176 64 138 91 86 138 91 122 99 143Belgium 36 49 100 90 180 73 16 76 28 16 6 Lesotho 136 89 145 136 88 159 98 101 144 144 104Armenia 37 6 79 109 5 42 22 103 117 112 76 Cambodia 137 184 161 134 118 42 80 65 114 162 163
France 38 41 92 42 149 55 80 52 36 7 46West Bank andGaza
138 143 131 87 122 165 80 62 123 88 189
Cyprus 39 44 86 108 103 55 34 33 27 110 24 Mozambique 139 95 77 171 152 130 52 129 131 145 148Puerto Rico (U.S.) 40 18 172 38 131 13 16 110 87 101 21 Burundi 140 27 126 161 52 170 34 143 175 177 164South Africa 41 64 26 150 99 28 10 24 106 80 82 Bhutan 141 86 132 91 86 109 147 104 172 37 189Peru 42 63 117 79 22 28 16 73 55 105 110 Sierra Leone 142 75 176 179 170 86 22 128 140 149 158Colombia 43 79 24 101 53 73 6 104 94 155 25 Tajikistan 143 87 184 186 78 159 22 178 188 39 81Montenegro 44 69 106 69 98 3 34 86 53 136 45 Liberia 144 31 129 142 181 86 147 42 142 165 161Poland 45 116 88 137 54 3 52 113 49 55 37 Tanzania 145 119 177 102 146 130 98 141 139 42 134Bahrain 46 99 4 52 32 130 115 7 81 122 27 Uzbekistan 146 21 159 173 136 130 138 168 189 40 63Oman 47 77 69 58 21 86 98 9 47 107 72 Nigeria 147 122 151 185 185 13 68 170 158 136 107Qatar 48 112 23 27 43 130 128 2 67 93 36 Madagascar 148 29 157 187 155 180 68 61 115 160 157Slovak Republic 49 108 53 65 11 42 115 102 108 65 38 Sudan 149 131 167 113 41 170 157 108 155 154 89Kazakhstan 50 30 145 87 18 86 22 18 186 27 54 Gambia, The 150 130 104 120 117 165 178 184 99 60 108Tunisia 51 70 122 55 72 109 52 60 31 78 39 Iraq 151 169 20 39 108 180 128 63 179 142 189Spain 52 142 98 62 60 55 98 67 32 59 22 Iran, Islamic Rep. 152 107 169 169 168 86 147 139 153 51 129Mexico 53 48 40 133 150 42 68 118 59 71 26 Algeria 153 164 147 148 176 130 98 174 133 129 60Hungary 54 59 47 112 45 55 128 124 70 15 70 Burkina Faso 154 125 60 141 123 130 147 160 174 108 117Panama 55 25 62 16 74 55 80 175 11 127 112 Mali 155 136 113 118 99 130 147 157 160 140 131
Botswana 56 96 69 107 41 73 52 47 145 86 34Micronesia, Fed.Sts.
156 106 54 106 189 130 178 94 103 152 168
Tonga 57 42 35 30 146 55 115 51 63 48 118 Togo 157 168 114 96 159 130 147 172 110 153 111Bulgaria 58 65 118 135 62 28 52 81 79 79 92 Comoros 158 163 44 109 79 159 138 123 146 159 189Brunei Darussalam 59 137 46 29 116 55 115 20 39 161 48 Lao PDR 159 85 96 140 76 159 187 119 161 104 189Luxembourg 60 103 37 66 124 170 128 15 41 1 53 Djibouti 160 127 157 144 133 180 182 66 60 163 147Samoa 61 33 73 37 39 130 34 86 58 77 139 Suriname 161 181 49 40 173 170 186 50 105 184 160Fiji 62 141 74 81 63 55 52 88 111 63 50 Bolivia 162 180 136 128 144 130 138 185 126 131 67Belarus 63 15 30 168 3 109 98 133 149 13 74 Gabon 163 153 71 138 166 109 157 152 135 157 153St. Lucia 64 57 11 31 129 130 34 45 104 170 56 Afghanistan 164 24 167 104 175 130 189 98 184 168 115Italy 65 90 112 89 34 109 52 138 56 103 33 Syrian Arab 165 135 189 82 82 180 115 120 147 179 120Trinidad and Tobago 66 67 77 10 178 28 22 97 73 174 114 Equatorial Guinea 166 185 125 99 109 109 147 177 137 50 189Ghana 67 128 159 85 49 28 34 68 109 43 116 Côte d'Ivoire 167 115 162 153 127 130 157 173 165 88 95Kyrgyz Republic 68 12 66 180 9 13 22 127 182 70 132 Cameroon 168 132 127 62 159 109 128 180 159 175 151
Turkey 69 93 148 49 50 86 34 71 86 38 130São Tomé andPríncipe
169 98 103 73 165 186 157 156 102 183 166
Azerbaijan 70 10 180 181 13 55 22 77 168 28 86 Zimbabwe 170 150 170 157 93 109 128 142 167 118 156Antigua andBarbuda
71 92 21 20 128 130 34 151 93 65 80 Malawi 171 149 173 183 85 130 80 81 176 145 150
Greece 72 36 66 61 161 86 80 53 52 98 87 Timor-Leste 172 154 128 44 189 165 115 55 92 189 189Romania 73 60 136 174 70 13 52 134 76 53 99 Mauritania 173 173 123 124 67 170 147 181 152 75 189Vanuatu 74 126 50 129 110 55 80 30 119 72 57 Benin 174 139 95 160 137 130 157 179 119 181 140Czech Republic 75 146 86 146 37 55 98 122 68 75 29 Guinea 175 146 155 91 140 159 178 186 136 134 145Mongolia 76 25 107 162 27 55 22 74 181 30 133 Niger 176 159 164 123 80 130 157 162 178 143 154Dominica 77 51 22 64 119 86 34 75 88 172 105 Haiti 177 187 141 67 138 165 170 132 151 96 189Moldova 78 81 174 165 19 13 80 95 150 23 91 Senegal 178 110 165 182 174 130 170 182 80 167 122Guatemala 79 145 61 34 23 13 157 85 116 97 109 Angola 179 178 65 170 132 130 80 155 169 187 189Seychelles 80 118 68 147 69 170 68 19 29 82 65 Guinea-Bissau 180 159 119 188 170 130 138 153 125 148 189San Marino 81 155 120 10 158 186 52 40 75 34 49 Venezuela, RB 181 157 110 167 95 130 182 187 173 92 165St. Vincent and theGrenadines
82 68 6 25 153 130 34 72 38 90 189 Myanmar 182 189 150 126 154 170 182 107 113 188 155
Zambia 83 45 57 152 102 13 80 68 163 120 73 Congo, Dem. Rep. 183 185 90 142 133 159 147 176 171 177 167Bahamas, The 84 83 75 45 182 86 115 45 72 125 32 Eritrea 184 188 189 95 184 186 115 150 170 67 189Sri Lanka 85 54 108 91 145 73 52 171 51 135 59 Congo, Rep. 185 182 142 175 164 109 157 183 180 164 142Kosovo 86 100 136 121 58 28 98 43 121 138 83 South Sudan 186 140 171 184 183 180 182 92 187 87 189Morocco 87 39 83 97 156 109 115 78 37 83 69 Libya 187 171 189 68 189 186 187 116 143 150 189Uruguay 88 43 154 23 167 73 98 146 90 105 51 Central African 188 177 156 177 141 109 138 188 185 180 189Croatia 89 80 152 60 106 42 157 34 99 49 98 Chad 189 183 139 149 146 130 157 189 183 171 189Albania 90 76 189 158 119 13 14 146 85 124 62Barbados 91 77 56 83 142 86 170 112 30 110 28Russian Federation 92 88 178 117 17 109 115 56 157 10 55Serbia 93 45 182 85 44 42 80 161 98 116 103Jamaica 94 23 52 132 114 109 80 168 118 131 31Maldives 95 71 18 131 161 109 80 115 138 90 40China 96 158 185 119 48 73 98 120 74 19 78Solomon Islands 97 82 81 130 172 86 52 30 78 109 127Namibia 98 132 31 72 178 55 80 114 141 69 85Vietnam 99 109 29 156 51 42 157 149 65 46 149Palau 100 129 45 78 20 86 178 84 96 141 96
Doing Business Rankings in 2013
Source: Doing Business 2013 (http://www.doingbusiness.org/), International Finance Corporation
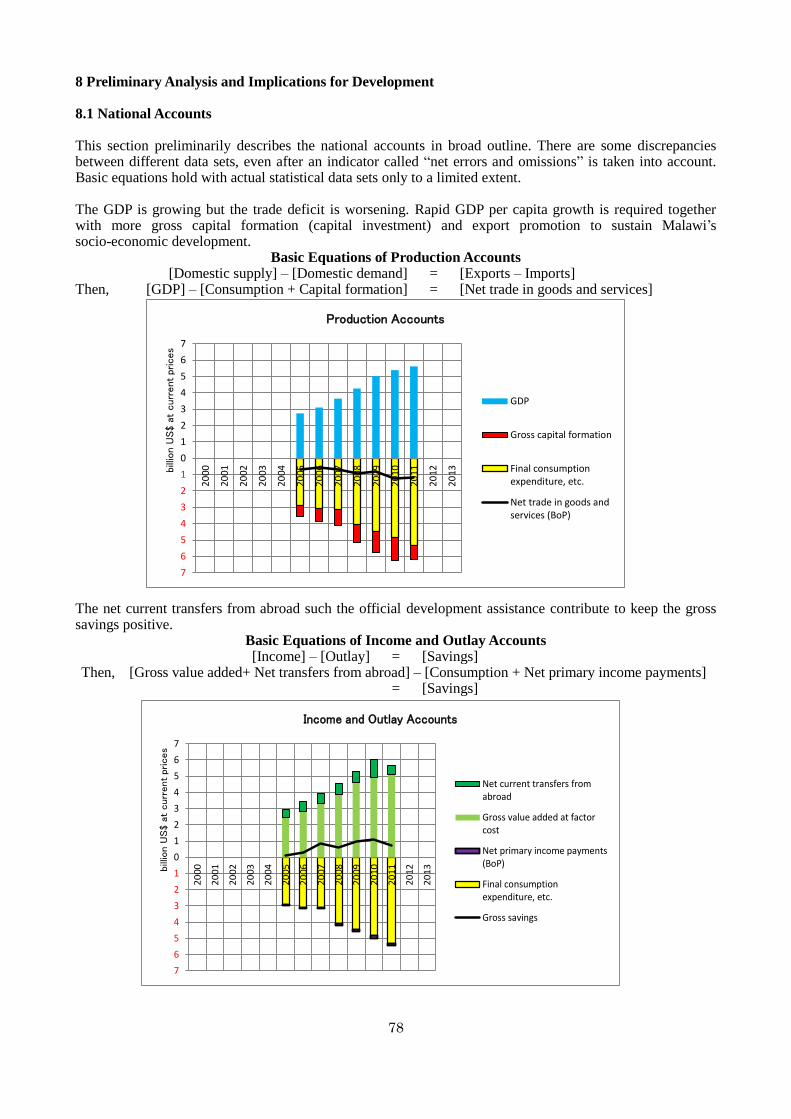
78
7
6
5
4
3
2
1
0
1
2
3
4
5
6
7
20
00
20
01
20
02
20
03
20
04
20
05
20
06
20
07
20
08
20
09
20
10
20
11
20
12
20
13billi
on U
S$ a
t curr
ent
pric
es
Production Accounts
GDP
Gross capital formation
Final consumptionexpenditure, etc.
Net trade in goods andservices (BoP)
7
6
5
4
3
2
1
0
1
2
3
4
5
6
7
20
00
20
01
20
02
20
03
20
04
20
05
20
06
20
07
20
08
20
09
20
10
20
11
20
12
20
13bill
ion U
S$ a
t curr
ent
prices
Income and Outlay Accounts
Net current transfers fromabroad
Gross value added at factorcost
Net primary income payments(BoP)
Final consumptionexpenditure, etc.
Gross savings
8 Preliminary Analysis and Implications for Development 8.1 National Accounts This section preliminarily describes the national accounts in broad outline. There are some discrepancies between different data sets, even after an indicator called “net errors and omissions” is taken into account. Basic equations hold with actual statistical data sets only to a limited extent. The GDP is growing but the trade deficit is worsening. Rapid GDP per capita growth is required together with more gross capital formation (capital investment) and export promotion to sustain Malawi’s socio-economic development.
Basic Equations of Production Accounts [Domestic supply] – [Domestic demand] = [Exports – Imports]
Then, [GDP] – [Consumption + Capital formation] = [Net trade in goods and services] The net current transfers from abroad such the official development assistance contribute to keep the gross savings positive.
Basic Equations of Income and Outlay Accounts [Income] – [Outlay] = [Savings]
Then, [Gross value added+ Net transfers from abroad] – [Consumption + Net primary income payments] = [Savings]

79
Year GDPFinal consumptionexpenditure, etc.
Gross capitalformation
Net trade in goodsand services (BoP)
current US$ current US$ current US$ current US$
200020012002200320042005 2,754,995,877 -2,905,286,696 -624,965,896 -700,644,7092006 3,116,789,658 -3,079,938,180 -800,165,180 -534,389,0622007 3,647,817,219 -3,117,620,551 -965,567,631 -660,717,2722008 4,276,769,712 -4,064,983,052 -1,097,855,047 -953,165,3972009 5,030,639,934 -4,463,879,981 -1,286,525,717 -827,999,7692010 5,398,616,985 -4,835,943,105 -1,402,941,912 -1,236,234,9182011 5,621,000,678 -5,306,393,640 -871,732,784 -1,178,287,93020122013
YearGross value added
at factor cost
Net currenttransfers from
abroad
Final consumptionexpenditure, etc.
Net primary incomepayments (BoP)
Gross savings
current US$ current US$ current US$ current US$ current US$
200020012002200320042005 2,472,342,836 453,450,059 -2,905,286,696 -80,039,577 81,966,6652006 2,835,154,465 592,390,993 -3,079,938,180 -73,061,090 299,141,0042007 3,324,318,296 632,204,200 -3,117,620,551 -72,719,810 830,368,1932008 3,897,299,556 655,987,602 -4,064,983,052 -148,117,282 625,927,2402009 4,584,060,332 725,750,802 -4,463,879,981 -122,173,416 963,676,9842010 4,919,255,365 1,103,574,515 -4,835,943,105 -190,489,760 1,077,378,1162011 5,103,400,407 588,197,104 -5,306,393,640 -106,720,303 705,422,37720122013
Production Accounts Note: From 2005 to 2011, the average annual growth rate of GDP at current prices was 12.6% and the growth rates of consumption and capital formation were lower. On the other hand, the GDP growth rate at constant prices was 3.7%, while the average annual growth rate of population was 3.0%. Therefore, the GDP per capita grew only at 0.7% per annum, indicating that more rapid GDP per capita growth is wanted for more consumption, more capital formation and more exports.
Income and Outlay Accounts

80
7
6
5
4
3
2
1
0
1
2
3
4
5
6
7
20
00
20
01
20
02
20
03
20
04
20
05
20
06
20
07
20
08
20
09
20
10
20
11
20
12
20
13billi
on U
S$ a
t curr
ent
pric
es
Balance of Payments
Net capital account (BoP)
Net current transfers fromabroad
Net primary incomepayments (BoP)
Net trade in goods andservices (BoP)
Net financial account (BoP)
7
6
5
4
3
2
1
0
1
2
3
4
5
6
72
000
20
01
20
02
20
03
20
04
20
05
20
06
20
07
20
08
20
09
20
10
20
11
20
12
20
13billi
on U
S$ a
t curr
ent
pric
es
Accumulation Accounts
Net capital account (BoP)
Gross savings
Gross capital formation
Net financial account (BoP)
In spite of the considerable share of the net capital account, the net financial account is often negative. For more investment, more savings are required.
Basic Equations of Accumulation Accounts [Savings and capital inflows] – [Capital formation and outflows] = [Financial account]
Then, [Savings + Net capital account] – [Capital formation] = [Financial account] The deficit of the trade in goods and services is filled by the net capital receipts and the net current transfers from abroad. But the net financial account is still often negative. Export promotion is one way to break through this trap.
Basic Equations of Balance of Payments [Financial inflows – Financial outflows] = [Financial account]
Then, [Net trade – Net primary income payments + Net transfers from abroad + Net capital account] = [Financial account]

81
Year Gross savingsNet capital account
(BoP)Gross capital
formationNet errors and
omissions (BoP)Net financial account
(BoP)
current US$ current US$ current US$ current US$ current US$
200020012002200320042005 81,966,665 363,347,407 -624,965,896 33,829,802 -109,534,0152006 299,141,004 2,480,834,155 -800,165,180 11,403,387 2,185,668,1152007 830,368,193 190,814,043 -965,567,631 65,301,539 -161,912,6782008 625,927,240 438,749,925 -1,097,855,047 -194,340,719 -419,714,3532009 963,676,984 408,676,600 -1,286,525,717 -165,271,551 -238,174,2652010 1,077,378,116 710,047,478 -1,402,941,912 69,295,096 -6,300,8182011 705,422,377 458,304,414 -871,732,784 -168,522,906 -476,379,18120122013
YearNet trade in goodsand services (BoP)
Net primary incomepayments (BoP)
Net currenttransfers from
abroad
Net capital account(BoP)
Net errors andomissions (BoP)
Net financialaccount (BoP)
current US$ current US$ current US$ current US$ current US$ current US$
200020012002200320042005 -700,644,709 -80,039,577 453,450,059 363,347,407 33,829,802 -109,534,0152006 -534,389,062 -73,061,090 592,390,993 2,480,834,155 11,403,387 2,185,668,1152007 -660,717,272 -72,719,810 632,204,200 190,814,043 65,301,539 -161,912,6782008 -953,165,397 -148,117,282 655,987,602 438,749,925 -194,340,719 -419,714,3532009 -827,999,769 -122,173,416 725,750,802 408,676,600 -165,271,551 -238,174,2652010 -1,236,234,918 -190,489,760 1,103,574,515 710,047,478 69,295,096 -6,300,8182011 -1,178,287,930 -106,720,303 588,197,104 458,304,414 -168,522,906 -476,379,18120122013
Accumulation Accounts
Balance of Payments
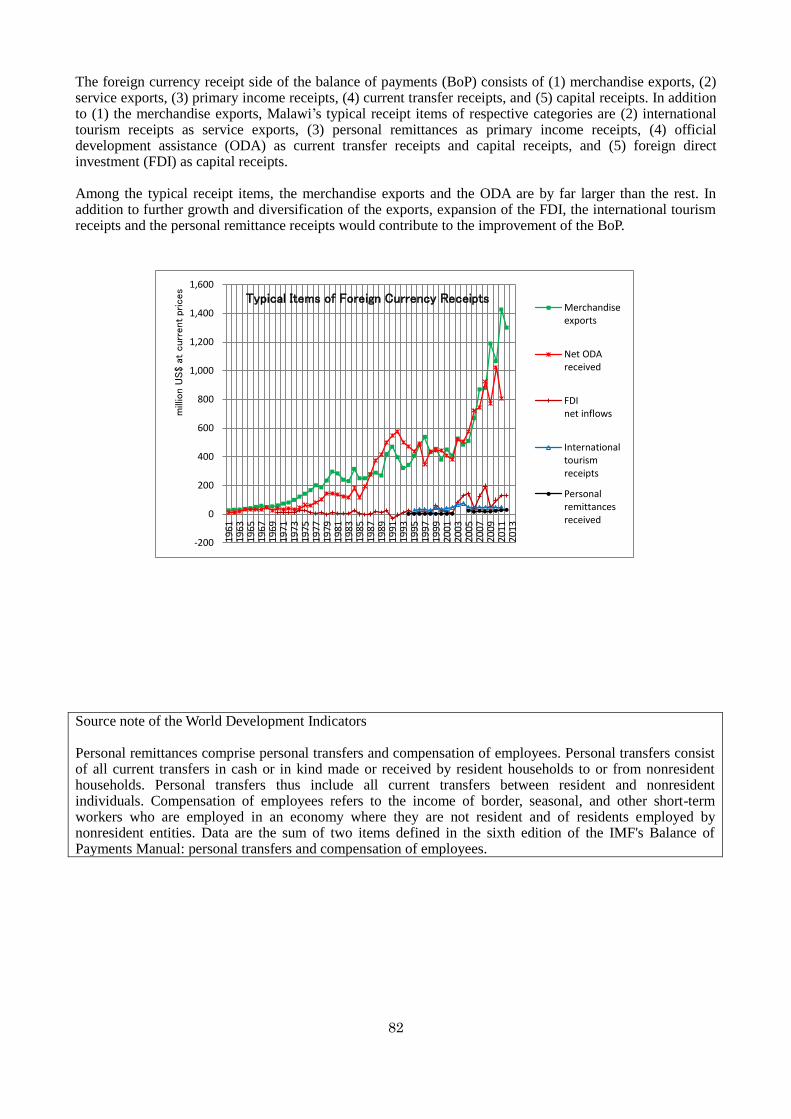
82
-200
0
200
400
600
800
1,000
1,200
1,400
1,600
19
611
963
19
651
967
19
691
971
19
731
975
19
771
979
19
811
983
19
851
987
19
891
991
19
931
995
19
971
999
20
012
003
20
052
007
20
092
011
20
13
mill
ion U
S$ a
t curr
ent
pric
es
Typical Items of Foreign Currency ReceiptsMerchandiseexports
Net ODAreceived
FDInet inflows
Internationaltourismreceipts
Personalremittancesreceived
The foreign currency receipt side of the balance of payments (BoP) consists of (1) merchandise exports, (2) service exports, (3) primary income receipts, (4) current transfer receipts, and (5) capital receipts. In addition to (1) the merchandise exports, Malawi’s typical receipt items of respective categories are (2) international tourism receipts as service exports, (3) personal remittances as primary income receipts, (4) official development assistance (ODA) as current transfer receipts and capital receipts, and (5) foreign direct investment (FDI) as capital receipts. Among the typical receipt items, the merchandise exports and the ODA are by far larger than the rest. In addition to further growth and diversification of the exports, expansion of the FDI, the international tourism receipts and the personal remittance receipts would contribute to the improvement of the BoP.
Source note of the World Development Indicators Personal remittances comprise personal transfers and compensation of employees. Personal transfers consist of all current transfers in cash or in kind made or received by resident households to or from nonresident households. Personal transfers thus include all current transfers between resident and nonresident individuals. Compensation of employees refers to the income of border, seasonal, and other short-term workers who are employed in an economy where they are not resident and of residents employed by nonresident entities. Data are the sum of two items defined in the sixth edition of the IMF's Balance of Payments Manual: personal transfers and compensation of employees.
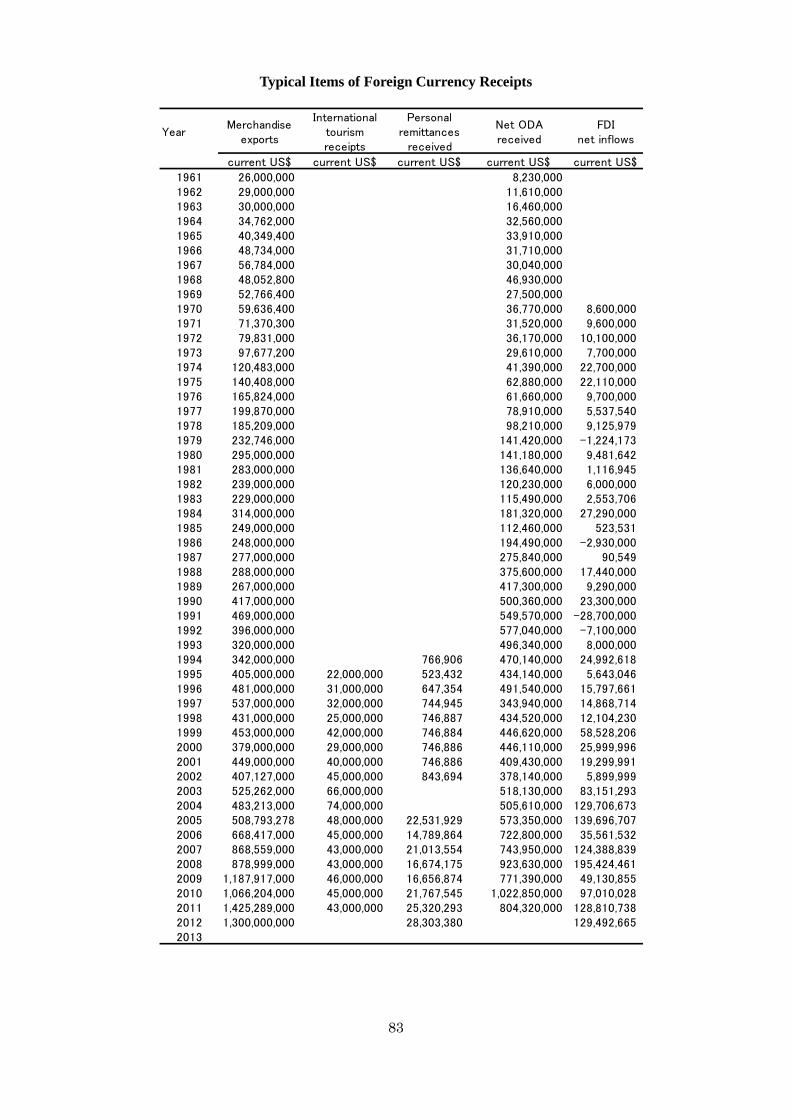
83
YearMerchandise
exports
Internationaltourismreceipts
Personalremittances
received
Net ODAreceived
FDInet inflows
current US$ current US$ current US$ current US$ current US$
1961 26,000,000 8,230,0001962 29,000,000 11,610,0001963 30,000,000 16,460,0001964 34,762,000 32,560,0001965 40,349,400 33,910,0001966 48,734,000 31,710,0001967 56,784,000 30,040,0001968 48,052,800 46,930,0001969 52,766,400 27,500,0001970 59,636,400 36,770,000 8,600,0001971 71,370,300 31,520,000 9,600,0001972 79,831,000 36,170,000 10,100,0001973 97,677,200 29,610,000 7,700,0001974 120,483,000 41,390,000 22,700,0001975 140,408,000 62,880,000 22,110,0001976 165,824,000 61,660,000 9,700,0001977 199,870,000 78,910,000 5,537,5401978 185,209,000 98,210,000 9,125,9791979 232,746,000 141,420,000 -1,224,1731980 295,000,000 141,180,000 9,481,6421981 283,000,000 136,640,000 1,116,9451982 239,000,000 120,230,000 6,000,0001983 229,000,000 115,490,000 2,553,7061984 314,000,000 181,320,000 27,290,0001985 249,000,000 112,460,000 523,5311986 248,000,000 194,490,000 -2,930,0001987 277,000,000 275,840,000 90,5491988 288,000,000 375,600,000 17,440,0001989 267,000,000 417,300,000 9,290,0001990 417,000,000 500,360,000 23,300,0001991 469,000,000 549,570,000 -28,700,0001992 396,000,000 577,040,000 -7,100,0001993 320,000,000 496,340,000 8,000,0001994 342,000,000 766,906 470,140,000 24,992,6181995 405,000,000 22,000,000 523,432 434,140,000 5,643,0461996 481,000,000 31,000,000 647,354 491,540,000 15,797,6611997 537,000,000 32,000,000 744,945 343,940,000 14,868,7141998 431,000,000 25,000,000 746,887 434,520,000 12,104,2301999 453,000,000 42,000,000 746,884 446,620,000 58,528,2062000 379,000,000 29,000,000 746,886 446,110,000 25,999,9962001 449,000,000 40,000,000 746,886 409,430,000 19,299,9912002 407,127,000 45,000,000 843,694 378,140,000 5,899,9992003 525,262,000 66,000,000 518,130,000 83,151,2932004 483,213,000 74,000,000 505,610,000 129,706,6732005 508,793,278 48,000,000 22,531,929 573,350,000 139,696,7072006 668,417,000 45,000,000 14,789,864 722,800,000 35,561,5322007 868,559,000 43,000,000 21,013,554 743,950,000 124,388,8392008 878,999,000 43,000,000 16,674,175 923,630,000 195,424,4612009 1,187,917,000 46,000,000 16,656,874 771,390,000 49,130,8552010 1,066,204,000 45,000,000 21,767,545 1,022,850,000 97,010,0282011 1,425,289,000 43,000,000 25,320,293 804,320,000 128,810,7382012 1,300,000,000 28,303,380 129,492,6652013
Typical Items of Foreign Currency Receipts
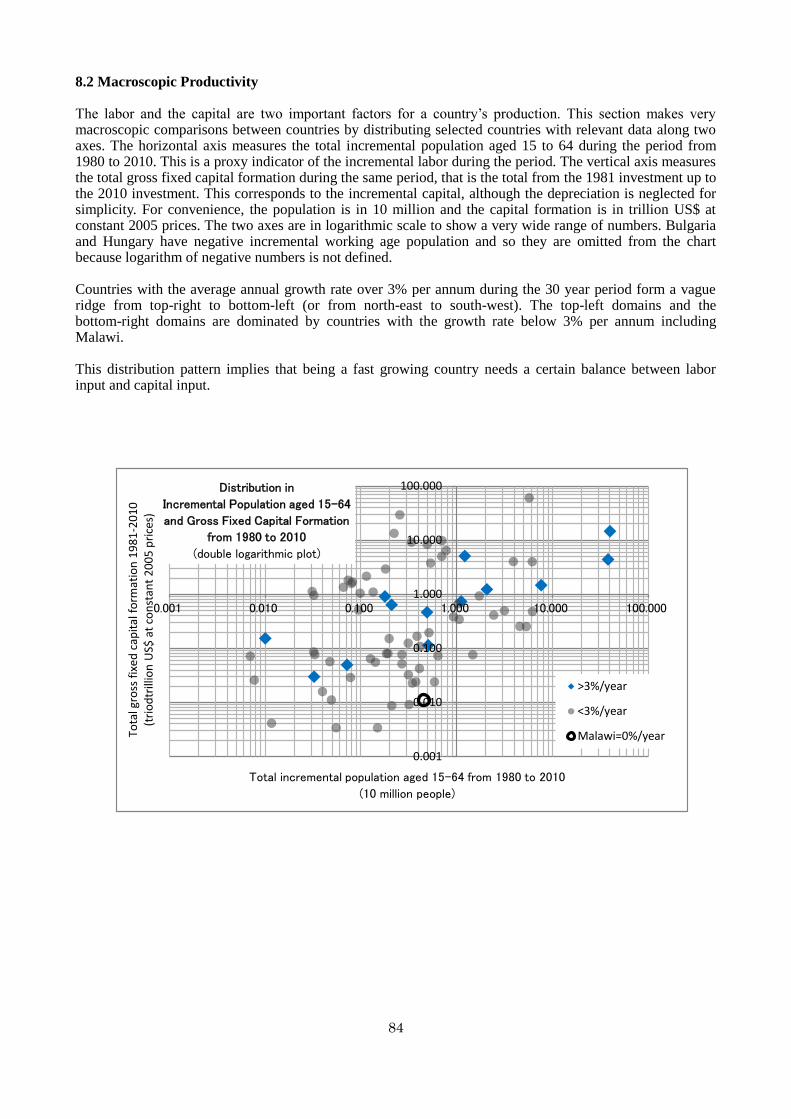
84
0.001
0.010
0.100
1.000
10.000
100.000
0.001 0.010 0.100 1.000 10.000 100.000
Tota
l gro
ss f
ixed
cap
ital
fo
rmat
ion
19
81
-20
10
(tri
od
trill
ion
US$
at
con
stan
t 2
00
5 p
rice
s)
Total incremental population aged 15-64 from 1980 to 2010
(10 million people)
Distribution in
Incremental Population aged 15-64
and Gross Fixed Capital Formation
from 1980 to 2010
(double logarithmic plot)
>3%/year
<3%/year
Malawi=0%/year
8.2 Macroscopic Productivity The labor and the capital are two important factors for a country’s production. This section makes very macroscopic comparisons between countries by distributing selected countries with relevant data along two axes. The horizontal axis measures the total incremental population aged 15 to 64 during the period from 1980 to 2010. This is a proxy indicator of the incremental labor during the period. The vertical axis measures the total gross fixed capital formation during the same period, that is the total from the 1981 investment up to the 2010 investment. This corresponds to the incremental capital, although the depreciation is neglected for simplicity. For convenience, the population is in 10 million and the capital formation is in trillion US$ at constant 2005 prices. The two axes are in logarithmic scale to show a very wide range of numbers. Bulgaria and Hungary have negative incremental working age population and so they are omitted from the chart because logarithm of negative numbers is not defined. Countries with the average annual growth rate over 3% per annum during the 30 year period form a vague ridge from top-right to bottom-left (or from north-east to south-west). The top-left domains and the bottom-right domains are dominated by countries with the growth rate below 3% per annum including Malawi. This distribution pattern implies that being a fast growing country needs a certain balance between labor input and capital input.

85
Country (Economy)Populationin 1995
Total incrementalpopulation
aged 15-64from 1980to 2010
(TIP15-64)
Total gross fixedcapital formation
from 1981inclusiveto 2010inclusive(TGFCF)
GDPper capitain 1980
GDPper capitain 2010
Average annualgrowth rate ofGDP per capita
from 1980to 2010
(TGFCF)/(TIP15-64)
10 milliontrillion US$at constant2005 prices
constant2005 US$
constant2005 US$
China 1,204,855,000 39.924 14.665 220 2,869 1.089 0.367Korea, Rep. 45,093,000 1.219 5.075 4,270 20,625 1.054 4.163Thailand 58,983,954 2.073 1.228 882 3,164 1.044 0.592India 955,804,355 38.180 4.392 292 1,034 1.043 0.115Singapore 3,524,500 0.209 0.637 9,645 33,381 1.042 3.043Botswana 1,583,453 0.072 0.049 1,843 6,153 1.041 0.687Mauritius 1,122,457 0.032 0.030 1,855 6,110 1.041 0.923Hong Kong SAR, China 6,156,100 0.179 0.913 10,325 31,336 1.038 5.113Sri Lanka 18,136,000 0.505 0.114 543 1,610 1.037 0.225Indonesia 194,112,556 7.632 1.467 556 1,570 1.035 0.192Malaysia 20,725,374 1.114 0.738 2,318 6,319 1.034 0.662Chile 14,440,103 0.491 0.466 3,362 8,610 1.032 0.948Luxembourg 408,625 0.010 0.152 32,733 80,276 1.030 15.180Egypt, Arab Rep. 61,168,397 2.439 0.410 647 1,550 1.030 0.168Cyprus 855,389 0.033 0.076 10,345 23,157 1.027 2.314Dominican Republic 7,977,966 0.313 0.124 2,152 4,777 1.027 0.398Bangladesh 119,869,585 5.341 0.253 244 539 1.027 0.047Malta 370,433 0.008 0.026 7,350 15,992 1.026 3.342Tunisia 8,957,500 0.385 0.167 1,802 3,807 1.025 0.433Swaziland 963,428 0.040 0.016 1,190 2,445 1.024 0.400Lesotho 1,753,824 0.049 0.011 430 879 1.024 0.226Belize 206,962 0.012 0.004 2,065 4,140 1.023 0.355Bulgaria 8,406,067 -0.070 0.154 2,218 4,379 1.023 -2.215 Pakistan 126,689,577 6.193 0.482 396 748 1.021 0.078United Kingdom 58,019,030 0.493 8.344 20,165 37,899 1.021 16.926Panama 2,757,004 0.126 0.064 3,353 6,287 1.021 0.509Cuba 10,932,013 0.197 0.151 2,627 4,914 1.021 0.767Mozambique 15,981,571 0.587 0.024 206 381 1.021 0.041Morocco 26,833,093 1.067 0.344 1,270 2,349 1.021 0.322Portugal 10,030,376 0.098 1.044 10,220 18,535 1.020 10.601Norway 4,359,184 0.066 1.342 36,187 64,590 1.019 20.425Finland 5,107,790 0.032 0.958 21,702 38,065 1.019 29.701Spain 39,387,017 0.778 6.456 14,619 25,596 1.019 8.300Australia 18,072,000 0.535 3.772 20,691 36,203 1.019 7.050Japan 125,439,000 0.255 29.510 20,963 36,473 1.019 115.765Austria 7,948,278 0.082 1.683 22,833 38,803 1.018 20.644United States 266,278,000 5.733 60.724 26,086 43,952 1.018 10.593Sweden 8,826,939 0.079 1.583 25,721 42,826 1.017 19.923Netherlands 15,459,006 0.181 2.940 24,821 41,110 1.017 16.257Costa Rica 3,478,197 0.185 0.080 3,261 5,357 1.017 0.433Uruguay 3,224,383 0.032 0.086 4,234 6,818 1.016 2.674Germany 81,678,051 0.222 13.422 22,489 36,127 1.016 60.505Belgium 10,136,811 0.074 1.819 23,262 36,742 1.015 24.722Denmark 5,233,373 0.031 1.129 29,780 46,380 1.015 36.418Canada 29,354,000 0.699 4.996 23,106 35,277 1.014 7.147Iceland 267,468 0.007 0.072 34,368 51,528 1.014 10.236Hungary 10,328,965 -0.004 0.540 7,311 10,926 1.013 -150.035 France 59,540,711 0.702 9.825 23,244 33,898 1.013 14.003New Zealand 3,673,400 0.094 0.511 18,871 27,257 1.012 5.425Italy 56,844,303 0.337 9.245 20,277 29,163 1.012 27.438Greece 10,634,385 0.134 1.099 15,134 21,310 1.011 8.184Peru 23,939,261 0.930 0.381 2,737 3,835 1.011 0.410El Salvador 5,748,013 0.142 0.055 2,164 2,950 1.010 0.389Mali 8,988,853 0.345 0.023 367 498 1.010 0.066Jordan 4,195,000 0.268 0.077 2,109 2,817 1.010 0.287Brazil 161,890,816 6.166 3.976 4,217 5,618 1.010 0.645Switzerland 7,040,687 0.114 2.160 41,096 54,643 1.010 18.922Rwanda 5,663,838 0.319 0.009 271 352 1.009 0.029Philippines 69,606,539 3.156 0.494 1,109 1,403 1.008 0.156Honduras 5,591,935 0.268 0.051 1,207 1,515 1.008 0.192Ecuador 11,315,800 0.515 0.195 2,622 3,251 1.007 0.378Namibia 1,654,214 0.078 0.029 3,306 4,086 1.007 0.374Mexico 95,392,647 3.919 4.039 6,705 8,117 1.006 1.031Nigeria 108,424,827 4.580 0.254 841 996 1.006 0.055Bolivia 7,635,362 0.313 0.032 1,043 1,177 1.004 0.103Senegal 8,711,528 0.408 0.042 712 800 1.004 0.104Guatemala 9,983,861 0.414 0.109 2,051 2,270 1.003 0.263South Africa 39,120,000 1.726 0.936 5,335 5,794 1.003 0.542Kenya 27,418,077 1.478 0.076 537 575 1.002 0.052Gambia, The 1,065,746 0.055 0.003 452 467 1.001 0.061Cameroon 13,929,575 0.639 0.073 974 931 0.999 0.114Malawi 9 ,964,065 0.454 0.011 230 219 0.998 0.024Venezuela, RB 22,092,144 1.039 0.666 6,371 6,010 0.998 0.641Nicaragua 4,659,458 0.192 0.080 1,368 1,252 0.997 0.419Zambia 8,841,338 0.375 0.024 819 741 0.997 0.064Sierra Leone 3,927,105 0.149 0.003 426 370 0.995 0.023Gabon 1,080,477 0.047 0.057 7,763 6,223 0.993 1.199Togo 4,284,497 0.210 0.009 534 393 0.990 0.041
World 5,698,124,597 191.115 233.442 5,045 7,519 1.013 1.221
Incremental Population aged 15-64, Gross Fixed Capital Formation and Growth Rate of GDP per Capita of Selected Countries (Economies)
Note: Malawi’s gross fixed capital formation in constant 2005 US$ is estimated by multiplying its GDP by the capital formation’s percentage of the GDP.
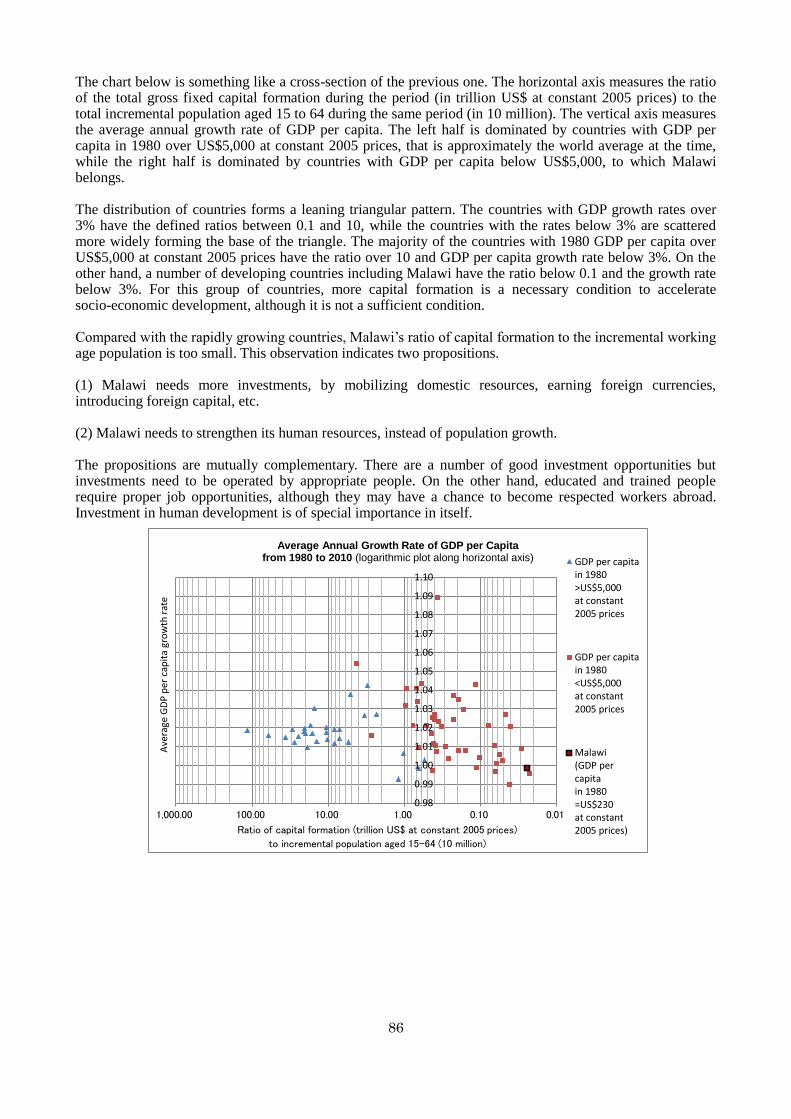
86
0.98
0.99
1.00
1.01
1.02
1.03
1.04
1.05
1.06
1.07
1.08
1.09
1.10
0.010.101.0010.00100.001,000.00
Ave
rage
GD
P p
er c
apit
a gr
ow
th r
ate
Ratio of capital formation (trillion US$ at constant 2005 prices)
to incremental population aged 15-64 (10 million)
Average Annual Growth Rate of GDP per Capitafrom 1980 to 2010 (logarithmic plot along horizontal axis) GDP per capita
in 1980>US$5,000at constant2005 prices
GDP per capitain 1980<US$5,000at constant2005 prices
Malawi(GDP percapitain 1980=US$230at constant2005 prices)
The chart below is something like a cross-section of the previous one. The horizontal axis measures the ratio of the total gross fixed capital formation during the period (in trillion US$ at constant 2005 prices) to the total incremental population aged 15 to 64 during the same period (in 10 million). The vertical axis measures the average annual growth rate of GDP per capita. The left half is dominated by countries with GDP per capita in 1980 over US$5,000 at constant 2005 prices, that is approximately the world average at the time, while the right half is dominated by countries with GDP per capita below US$5,000, to which Malawi belongs. The distribution of countries forms a leaning triangular pattern. The countries with GDP growth rates over 3% have the defined ratios between 0.1 and 10, while the countries with the rates below 3% are scattered more widely forming the base of the triangle. The majority of the countries with 1980 GDP per capita over US$5,000 at constant 2005 prices have the ratio over 10 and GDP per capita growth rate below 3%. On the other hand, a number of developing countries including Malawi have the ratio below 0.1 and the growth rate below 3%. For this group of countries, more capital formation is a necessary condition to accelerate socio-economic development, although it is not a sufficient condition. Compared with the rapidly growing countries, Malawi’s ratio of capital formation to the incremental working age population is too small. This observation indicates two propositions. (1) Malawi needs more investments, by mobilizing domestic resources, earning foreign currencies, introducing foreign capital, etc. (2) Malawi needs to strengthen its human resources, instead of population growth. The propositions are mutually complementary. There are a number of good investment opportunities but investments need to be operated by appropriate people. On the other hand, educated and trained people require proper job opportunities, although they may have a chance to become respected workers abroad. Investment in human development is of special importance in itself.

87
-2 -1 0 1 2 3 4 5 6 7 8 9 10
SwitzerlandNorwayIceland
LuxembourgDenmark
United StatesSweden
NetherlandsBelgium
FranceCanadaAustria
GermanyFinland
JapanAustralia
ItalyUnited Kingdom
New ZealandGreece
SpainCyprus
Hong Kong SAR, ChinaPortugal
SingaporeGabonMalta
HungaryMexico
Venezuela, RBSouth AfricaKorea, Rep.
UruguayBrazilChile
PanamaNamibia
Costa RicaPeruCuba
EcuadorMalaysiaBulgaria
El SalvadorDominican Republic
JordanBelize
GuatemalaMauritiusBotswana
TunisiaNicaraguaMorocco
HondurasSwaziland
PhilippinesBolivia
CameroonThailand
NigeriaZambiaSenegal
Egypt, Arab Rep.IndonesiaSri Lanka
KenyaTogo
Gambia, TheLesotho
Sierra LeonePakistan
MaliIndia
RwandaBangladesh
MalawiChina
MozambiqueWorld
%
Average Annual Growth Rate of GDP per Capita from 1980 to 2010(Selected Countries (Economies) arranged according to
1980 GDP per Capita in constant 2005 US$)
High income countries are not likely to be fast growing. A number of once low income countries are more rapidly growing.

88
8.3 Population Density, Distribution and Industrial Development In this section, industrial development or advancement means development or advancement of activities to produce goods or services including agriculture and services sectors. Population density, distribution and industrial development are interrelated. In general, agricultural production varies with farm area in addition to other various factors such as labor and other inputs. Farmers need sufficient area of farm land. In other words, high population density is a push factor and lower density is a pull factor for agriculture. On the other hand, a number of non-agricultural activities need agglomeration of clients and suppliers. In other words, people seeking non-agricultural businesses or employment tend to be pushed from low density locations and pulled by higher density locations, thus generating urbanization. This section observes these phenomena in Malawi, although the observation is quite rough because the unit area is a whole district or a whole city, which is far from having uniform land use. A total of 5 charts present population distribution to different density levels in the census years of 1966, 1977, 1987, 1998, and 2008. Between these are 4 charts locating the districts and cities according to the horizontal axis measuring population density in each base year and the vertical axis measuring the annual population growth rates of districts and cities minus the national average rate in the following decade. The differences from the national average roughly correspond to population increase or decrease caused by in-migration or out-migration. In order to see the broad trend, the distribution is smoothed out by 5-location (district or city) moving averages weighted with the base year population. The smoothed-out distribution in broken line forms a V-shape pattern, indicating that both low density districts and high density cities and districts tend to attract population, while districts with less low or less high density are experiencing out-migration. These phenomena in Malawi seem to represent the above general dynamics.
What are the prospects and policy implications?
Agricultural sector Non-agricultural sector Past trend Certain people are moving to lower
density districts (eg Nkhotakota, Kasungu). Less room is left now than in the past.
A number of people are moving to the high density cities, although population of Blantyre City and Zomba City is decelerating.
Negative future scenario without improvement or industrial advancement
As more people try to occupy farm land, the total of which is limited, farm area per farmer tends to become equally small and the productivity may lower. Some may move to disadvantageous locations, eg vulnerable to natural disasters.
Due to a limited number of productive jobs and insufficient urban services, migrants to existing or newly forming urban areas may become unemployed, under-employed or working poor so that the gross productivity may lower and slums may expand.
Positive future scenario with improvement and industrial advancement by private and public partnership
Land productivity and labor productivity need to be raised by infrastructure such as irrigation, other inputs, technologies, marketing, and organizational set-up, as well as decelerating the number of farmers and fostering innovative farmers. Stronger rural-urban linkages are expected to contribute to narrowing the socio-economic gap between the two regions.
In-migration can be an opportunity for developing non-agricultural businesses with a sufficient number of productive jobs generated through providing infrastructure, promoting investment, developing domestic and export markets, as well as developing proper living environment. On the labor supply side, educated or skilled workforce needs to be fostered, while decelerating population growth. (Domestic investments need domestic savings.)
Regional and urban development scenario
Rural development
Development of local centers as hubs to support rural areas.
Urban development
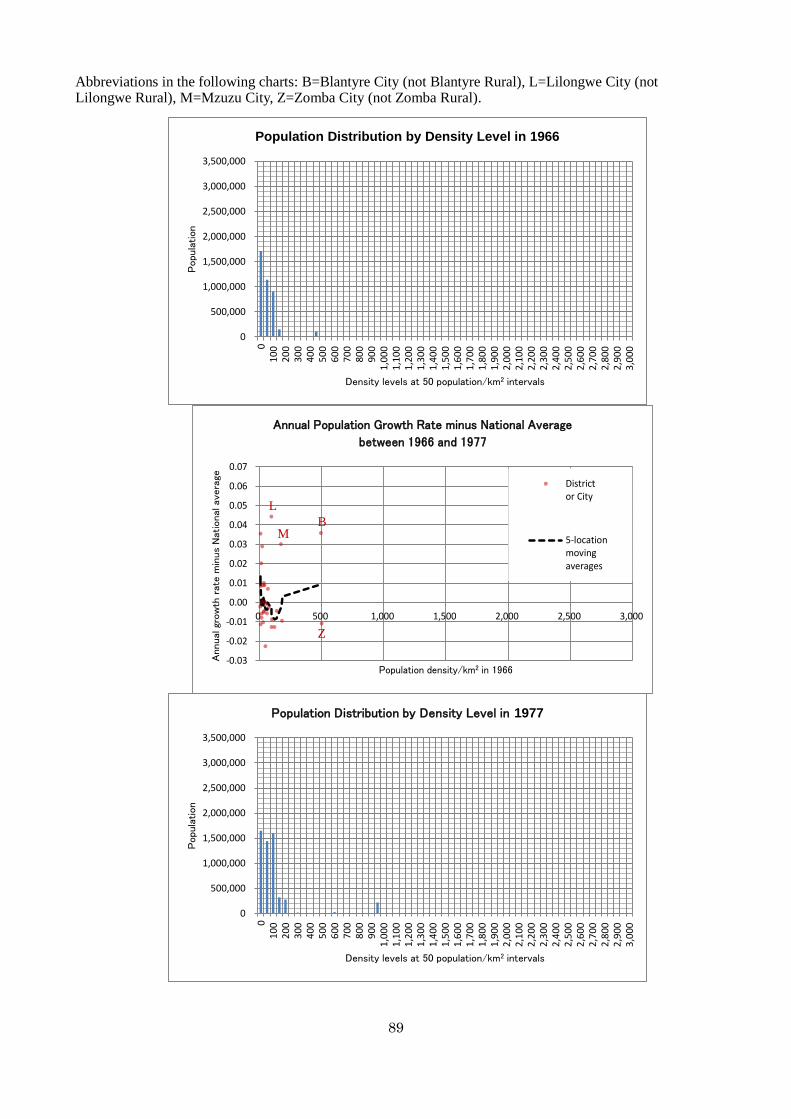
89
0
500,000
1,000,000
1,500,000
2,000,000
2,500,000
3,000,000
3,500,000
01
00
20
03
00
40
05
00
60
07
00
80
09
00
1,0
00
1,1
00
1,2
00
1,3
00
1,4
00
1,5
00
1,6
00
1,7
00
1,8
00
1,9
00
2,0
00
2,1
00
2,2
00
2,3
00
2,4
00
2,5
00
2,6
00
2,7
00
2,8
00
2,9
00
3,0
00
Popu
lation
Density levels at 50 population/km2 intervals
Population Distribution by Density Level in 1977
0
500,000
1,000,000
1,500,000
2,000,000
2,500,000
3,000,000
3,500,000
01
00
20
03
00
40
05
00
60
07
00
80
09
00
1,0
00
1,1
00
1,2
00
1,3
00
1,4
00
1,5
00
1,6
00
1,7
00
1,8
00
1,9
00
2,0
00
2,1
00
2,2
00
2,3
00
2,4
00
2,5
00
2,6
00
2,7
00
2,8
00
2,9
00
3,0
00
Popu
lation
Density levels at 50 population/km2 intervals
Population Distribution by Density Level in 1966
Abbreviations in the following charts: B=Blantyre City (not Blantyre Rural), L=Lilongwe City (not Lilongwe Rural), M=Mzuzu City, Z=Zomba City (not Zomba Rural).
-0.03
-0.02
-0.01
0.00
0.01
0.02
0.03
0.04
0.05
0.06
0.07
0 500 1,000 1,500 2,000 2,500 3,000
Annual
gro
wth
rat
e m
inus
Nat
ional
ave
rage
Population density/km2 in 1966
Annual Population Growth Rate minus National Average
between 1966 and 1977
Districtor City
5-locationmovingaverages
M
Z
B
L

90
0
500,000
1,000,000
1,500,000
2,000,000
2,500,000
3,000,000
3,500,000
010
020
030
040
050
060
070
080
090
01,
000
1,10
01,
200
1,30
01,
400
1,50
01,
600
1,70
01,
800
1,90
02,
000
2,10
02,
200
2,30
02,
400
2,50
02,
600
2,70
02,
800
2,90
03,
000
Pop
ulat
ion
Density levels at 50 population/km2 intervals
Population Distribution by Density Level in 1987
-0.03
-0.02
-0.01
0.00
0.01
0.02
0.03
0.04
0.05
0.06
0.07
0 500 1,000 1,500 2,000 2,500 3,000
Annual
gro
wth
rat
e m
inus
Nat
ional
ave
rage
Population density/km2 in 1987
Annual Population Growth Rate minus National Average
between 1987 and 1998
Districtor City
5-locationmovingaverages
L
B Z
M
-0.03
-0.02
-0.01
0.00
0.01
0.02
0.03
0.04
0.05
0.06
0.07
0 500 1,000 1,500 2,000 2,500 3,000
Annual
gro
wth
rat
e m
inus
Nat
ional
ave
rage
Population density/km2 in 1977
Annual Population Growth Rate minus National Average
between 1977 and 1987
Districtor City
5-locationmovingaverages
L
B
Z
M
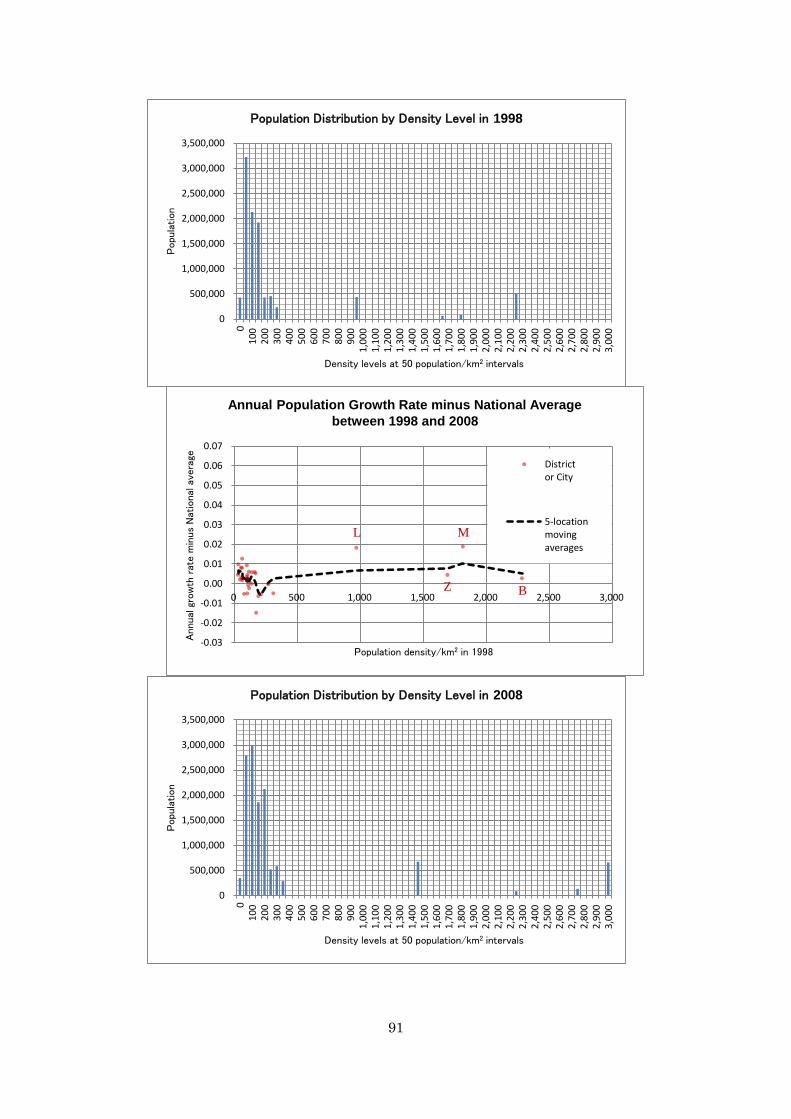
91
0
500,000
1,000,000
1,500,000
2,000,000
2,500,000
3,000,000
3,500,000
01
00
20
03
00
40
05
00
60
07
00
80
09
00
1,0
00
1,1
00
1,2
00
1,3
00
1,4
00
1,5
00
1,6
00
1,7
00
1,8
00
1,9
00
2,0
00
2,1
00
2,2
00
2,3
00
2,4
00
2,5
00
2,6
00
2,7
00
2,8
00
2,9
00
3,0
00
Popu
lation
Density levels at 50 population/km2 intervals
Population Distribution by Density Level in 1998
0
500,000
1,000,000
1,500,000
2,000,000
2,500,000
3,000,000
3,500,000
01
00
20
03
00
40
05
00
60
07
00
80
09
00
1,0
00
1,1
00
1,2
00
1,3
00
1,4
00
1,5
00
1,6
00
1,7
00
1,8
00
1,9
00
2,0
00
2,1
00
2,2
00
2,3
00
2,4
00
2,5
00
2,6
00
2,7
00
2,8
00
2,9
00
3,0
00
Popu
lation
Density levels at 50 population/km2 intervals
Population Distribution by Density Level in 2008
-0.03
-0.02
-0.01
0.00
0.01
0.02
0.03
0.04
0.05
0.06
0.07
0 500 1,000 1,500 2,000 2,500 3,000
Annual
gro
wth
rat
e m
inus
Nat
ional
ave
rage
Population density/km2 in 1998
Annual Population Growth Rate minus National Average
between 1998 and 2008
Districtor City
5-locationmovingaverages
M L
Z B
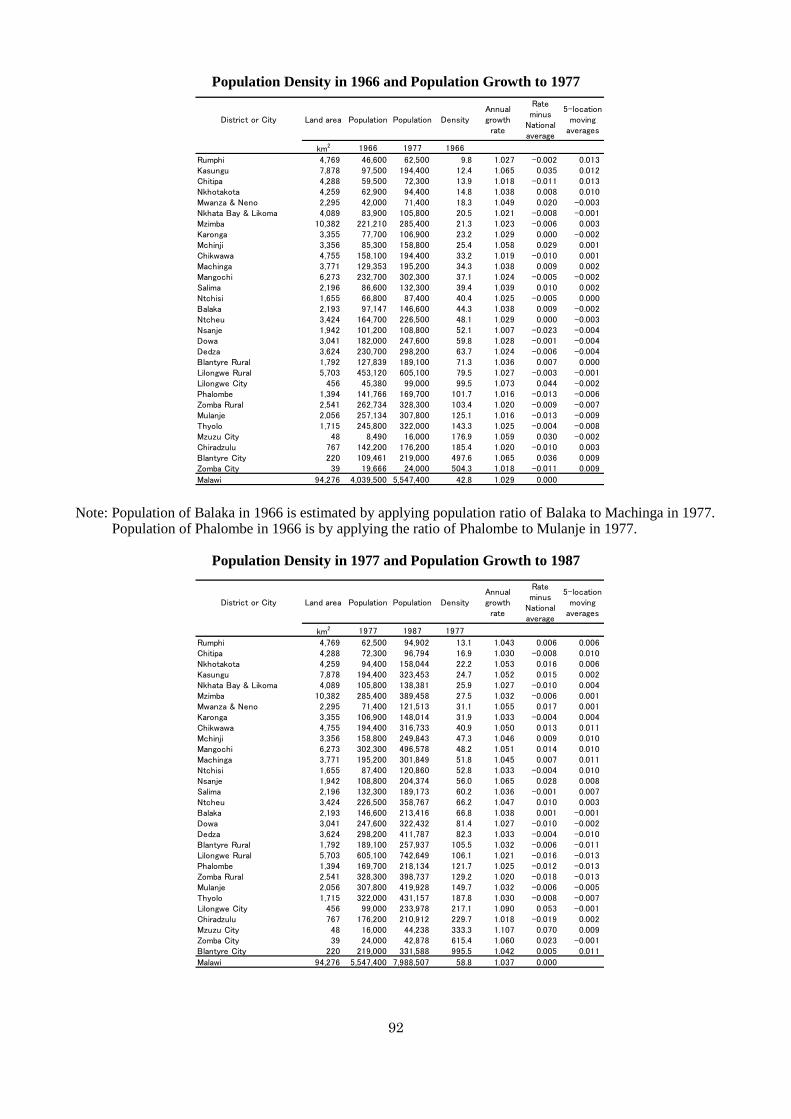
92
District or City Land area Population Population DensityAnnualgrowthrate
Rateminus
Nationalaverage
5-locationmoving
averages
km2 1966 1977 1966
Rumphi 4,769 46,600 62,500 9.8 1.027 -0.002 0.013Kasungu 7,878 97,500 194,400 12.4 1.065 0.035 0.012Chitipa 4,288 59,500 72,300 13.9 1.018 -0.011 0.013Nkhotakota 4,259 62,900 94,400 14.8 1.038 0.008 0.010Mwanza & Neno 2,295 42,000 71,400 18.3 1.049 0.020 -0.003Nkhata Bay & Likoma 4,089 83,900 105,800 20.5 1.021 -0.008 -0.001Mzimba 10,382 221,210 285,400 21.3 1.023 -0.006 0.003Karonga 3,355 77,700 106,900 23.2 1.029 0.000 -0.002Mchinji 3,356 85,300 158,800 25.4 1.058 0.029 0.001Chikwawa 4,755 158,100 194,400 33.2 1.019 -0.010 0.001Machinga 3,771 129,353 195,200 34.3 1.038 0.009 0.002Mangochi 6,273 232,700 302,300 37.1 1.024 -0.005 -0.002Salima 2,196 86,600 132,300 39.4 1.039 0.010 0.002Ntchisi 1,655 66,800 87,400 40.4 1.025 -0.005 0.000Balaka 2,193 97,147 146,600 44.3 1.038 0.009 -0.002Ntcheu 3,424 164,700 226,500 48.1 1.029 0.000 -0.003Nsanje 1,942 101,200 108,800 52.1 1.007 -0.023 -0.004Dowa 3,041 182,000 247,600 59.8 1.028 -0.001 -0.004Dedza 3,624 230,700 298,200 63.7 1.024 -0.006 -0.004Blantyre Rural 1,792 127,839 189,100 71.3 1.036 0.007 0.000Lilongwe Rural 5,703 453,120 605,100 79.5 1.027 -0.003 -0.001Lilongwe City 456 45,380 99,000 99.5 1.073 0.044 -0.002Phalombe 1,394 141,766 169,700 101.7 1.016 -0.013 -0.006Zomba Rural 2,541 262,734 328,300 103.4 1.020 -0.009 -0.007Mulanje 2,056 257,134 307,800 125.1 1.016 -0.013 -0.009Thyolo 1,715 245,800 322,000 143.3 1.025 -0.004 -0.008Mzuzu City 48 8,490 16,000 176.9 1.059 0.030 -0.002Chiradzulu 767 142,200 176,200 185.4 1.020 -0.010 0.003Blantyre City 220 109,461 219,000 497.6 1.065 0.036 0.009Zomba City 39 19,666 24,000 504.3 1.018 -0.011 0.009
Malawi 94,276 4,039,500 5,547,400 42.8 1.029 0.000
District or City Land area Population Population DensityAnnualgrowthrate
Rateminus
Nationalaverage
5-locationmoving
averages
km2 1977 1987 1977
Rumphi 4,769 62,500 94,902 13.1 1.043 0.006 0.006Chitipa 4,288 72,300 96,794 16.9 1.030 -0.008 0.010Nkhotakota 4,259 94,400 158,044 22.2 1.053 0.016 0.006Kasungu 7,878 194,400 323,453 24.7 1.052 0.015 0.002Nkhata Bay & Likoma 4,089 105,800 138,381 25.9 1.027 -0.010 0.004Mzimba 10,382 285,400 389,458 27.5 1.032 -0.006 0.001Mwanza & Neno 2,295 71,400 121,513 31.1 1.055 0.017 0.001Karonga 3,355 106,900 148,014 31.9 1.033 -0.004 0.004Chikwawa 4,755 194,400 316,733 40.9 1.050 0.013 0.011Mchinji 3,356 158,800 249,843 47.3 1.046 0.009 0.010Mangochi 6,273 302,300 496,578 48.2 1.051 0.014 0.010Machinga 3,771 195,200 301,849 51.8 1.045 0.007 0.011Ntchisi 1,655 87,400 120,860 52.8 1.033 -0.004 0.010Nsanje 1,942 108,800 204,374 56.0 1.065 0.028 0.008Salima 2,196 132,300 189,173 60.2 1.036 -0.001 0.007Ntcheu 3,424 226,500 358,767 66.2 1.047 0.010 0.003Balaka 2,193 146,600 213,416 66.8 1.038 0.001 -0.001Dowa 3,041 247,600 322,432 81.4 1.027 -0.010 -0.002Dedza 3,624 298,200 411,787 82.3 1.033 -0.004 -0.010Blantyre Rural 1,792 189,100 257,937 105.5 1.032 -0.006 -0.011Lilongwe Rural 5,703 605,100 742,649 106.1 1.021 -0.016 -0.013Phalombe 1,394 169,700 218,134 121.7 1.025 -0.012 -0.013Zomba Rural 2,541 328,300 398,737 129.2 1.020 -0.018 -0.013Mulanje 2,056 307,800 419,928 149.7 1.032 -0.006 -0.005Thyolo 1,715 322,000 431,157 187.8 1.030 -0.008 -0.007Lilongwe City 456 99,000 233,978 217.1 1.090 0.053 -0.001Chiradzulu 767 176,200 210,912 229.7 1.018 -0.019 0.002Mzuzu City 48 16,000 44,238 333.3 1.107 0.070 0.009Zomba City 39 24,000 42,878 615.4 1.060 0.023 -0.001Blantyre City 220 219,000 331,588 995.5 1.042 0.005 0.011
Malawi 94,276 5,547,400 7,988,507 58.8 1.037 0.000
Population Density in 1966 and Population Growth to 1977 Note: Population of Balaka in 1966 is estimated by applying population ratio of Balaka to Machinga in 1977.
Population of Phalombe in 1966 is by applying the ratio of Phalombe to Mulanje in 1977.
Population Density in 1977 and Population Growth to 1987

93
District or City Land area Population Population DensityAnnualgrowthrate
Rateminus
Nationalaverage
5-locationmoving
averages
km2 1987 1998 1987
Rumphi 4,769 94,902 128,360 19.9 1.028 0.008 0.004Chitipa 4,288 96,794 126,799 22.6 1.025 0.005 0.007Nkhata Bay & Likoma 4,089 138,381 172,835 33.8 1.020 0.000 0.007Nkhotakota 4,259 158,044 229,460 37.1 1.034 0.014 0.010Mzimba 10,382 389,458 524,014 37.5 1.027 0.007 0.010Kasungu 7,878 323,453 480,659 41.1 1.037 0.017 0.009Karonga 3,355 148,014 194,572 44.1 1.025 0.005 0.004Mwanza & Neno 2,295 121,513 138,015 52.9 1.012 -0.008 0.003Chikwawa 4,755 316,733 356,682 66.6 1.011 -0.009 -0.001Ntchisi 1,655 120,860 167,880 73.0 1.030 0.010 -0.002Mchinji 3,356 249,843 324,941 74.4 1.024 0.004 -0.001Mangochi 6,273 496,578 610,239 79.2 1.019 -0.001 0.002Machinga 3,771 301,849 369,614 80.0 1.019 -0.001 0.000Salima 2,196 189,173 248,214 86.1 1.025 0.005 -0.005Balaka 2,193 213,416 253,098 97.3 1.016 -0.004 -0.009Ntcheu 3,424 358,767 370,757 104.8 1.003 -0.017 -0.008Nsanje 1,942 204,374 194,924 105.2 0.996 -0.024 -0.009Dowa 3,041 322,432 411,387 106.0 1.022 0.002 -0.007Dedza 3,624 411,787 486,682 113.6 1.015 -0.005 -0.004Lilongwe Rural 5,703 742,649 905,889 130.2 1.018 -0.002 -0.003Blantyre Rural 1,792 257,937 307,344 143.9 1.016 -0.004 -0.004Phalombe 1,394 218,134 231,990 156.5 1.006 -0.014 -0.007Zomba Rural 2,541 398,737 480,746 156.9 1.017 -0.003 -0.011Mulanje 2,056 419,928 428,322 204.2 1.002 -0.018 -0.012Thyolo 1,715 431,157 458,976 251.4 1.006 -0.014 -0.005Chiradzulu 767 210,912 236,050 275.0 1.010 -0.010 -0.004Lilongwe City 456 233,978 440,471 513.1 1.059 0.039 0.004Mzuzu City 48 44,238 86,980 921.6 1.063 0.043 0.019Zomba City 39 42,878 65,915 1,099.4 1.040 0.020 0.028Blantyre City 220 331,588 502,053 1,507.2 1.038 0.018 0.021
Malawi 94,276 7,988,507 9,933,868 84.7 1.020 0.000
District or City Land area Population Population DensityAnnualgrowthrate
Rateminus
Nationalaverage
5-locationmoving
averages
km2 1998 2008 1998
Rumphi 4,769 128,360 172,034 26.9 1.030 0.004 0.005Chitipa 4,288 126,799 178,904 29.6 1.035 0.010 0.007Nkhata Bay & Likoma 4,089 172,835 226,203 42.3 1.027 0.002 0.006Mzimba 10,382 524,014 727,931 50.5 1.033 0.008 0.006Nkhotakota 4,259 229,460 303,659 53.9 1.028 0.003 0.007Karonga 3,355 194,572 269,890 58.0 1.033 0.008 0.006Mwanza & Neno 2,295 138,015 200,264 60.1 1.038 0.013 0.002Kasungu 7,878 480,659 627,467 61.0 1.027 0.002 0.003Chikwawa 4,755 356,682 434,648 75.0 1.020 -0.005 0.002Mchinji 3,356 324,941 456,516 96.8 1.035 0.009 0.002Mangochi 6,273 610,239 797,061 97.3 1.027 0.002 0.001Machinga 3,771 369,614 490,579 98.0 1.029 0.003 0.003Nsanje 1,942 194,924 238,103 100.4 1.020 -0.005 0.001Ntchisi 1,655 167,880 224,872 101.4 1.030 0.004 0.002Ntcheu 3,424 370,757 471,589 108.3 1.024 -0.001 0.000Salima 2,196 248,214 337,895 113.0 1.031 0.006 0.001Balaka 2,193 253,098 317,324 115.4 1.023 -0.002 0.002Dedza 3,624 486,682 624,445 134.3 1.025 0.000 0.004Dowa 3,041 411,387 558,470 135.3 1.031 0.006 0.004Lilongwe Rural 5,703 905,889 1,230,834 158.8 1.031 0.006 0.002Phalombe 1,394 231,990 313,129 166.4 1.030 0.005 0.000Blantyre Rural 1,792 307,344 340,728 171.5 1.010 -0.015 -0.002Zomba Rural 2,541 480,746 579,639 189.2 1.019 -0.006 -0.005Mulanje 2,056 428,322 521,391 208.3 1.020 -0.005 -0.006Thyolo 1,715 458,976 587,053 267.6 1.025 0.000 0.001Chiradzulu 767 236,050 288,546 307.8 1.020 -0.005 0.003Lilongwe City 456 440,471 674,448 965.9 1.044 0.018 0.007Zomba City 39 65,915 88,314 1,690.1 1.030 0.004 0.008Mzuzu City 48 86,980 133,968 1,812.1 1.044 0.019 0.010Blantyre City 220 502,053 661,256 2,282.1 1.028 0.003 0.005
Malawi 94,276 9,933,868 13,077,160 105.4 1.025 0.000
Population Density in 1987 and Population Growth to 1998
Population Density in 1998 and Population Growth to 2008
Source: Population and Housing Censuses, National Statistical Office and the Study Team

94
Industry and
services value
added in 2010
(Industry and
services value
added in 2010)
* 50% increase
Agriculture
value added
in 2010
(Agriculture
value added
in 2010) * 50%
Workers share
of agriculture
in 2010
Workers share
of industry and
services
in 2010(Workers share
of industry and
services
in 2010) * 50%
8.4 Industrial Development Framework In this section, industrial development means development of activities to produce goods or services including agriculture and services sectors. The future framework of industrial development can be worked out based on the estimated number of workers and their average value added (labor productivity) of the agricultural sector (including forestry, hunting, fishing, cultivation of crops and livestock production) and the non-agricultural sector (industry and services) in 2010. The overall value added per worker in the year is approximately US$543 (at constant 2005 prices). It corresponds to US$220 per population. Suppose both the ratio of the number of workers to the population and the ratio of the number of non-agricultural workers to that of agricultural workers are unchanged. If the labor productivity of both sectors is raised by 50%, then the GDP per population is raised of course by 50% and becomes US$330. Then if the non-agricultural workers share is also increased by 50%, from around 20% to around 30%, the GDP per population becomes around US$440 or double the 2010 level. This scenario can be achieved in 10 years by an average annual growth at 4.1% in the labor productivity of both agricultural and non-agricultural sectors and the share of non-agricultural workers, simply because 1.041
10=1.5.
The scenario is to equally grow the two sectors but not to reduce the gap. Reduction of the gap requires further practical considerations. In addition, the above discussion is based on rather traditional views. The global limits to natural resources and environment and the globalization of economy may also require additional considerations. In any case, in order to power up Malawi, Malawians need to power up themselves through education, work practice, cooperation and competition with the world.
Industrial Development Framework
Source note of the World Development Indicators Agriculture: Agriculture, forestry, hunting, fishing, cultivation of crops and livestock production. Industry: Mining, manufacturing, construction, electricity, water, and gas. Services: Wholesale and retail trade, hotels and restaurants, transport, and government, financial,
professional, and personal services such as education, health care, and real estate services.
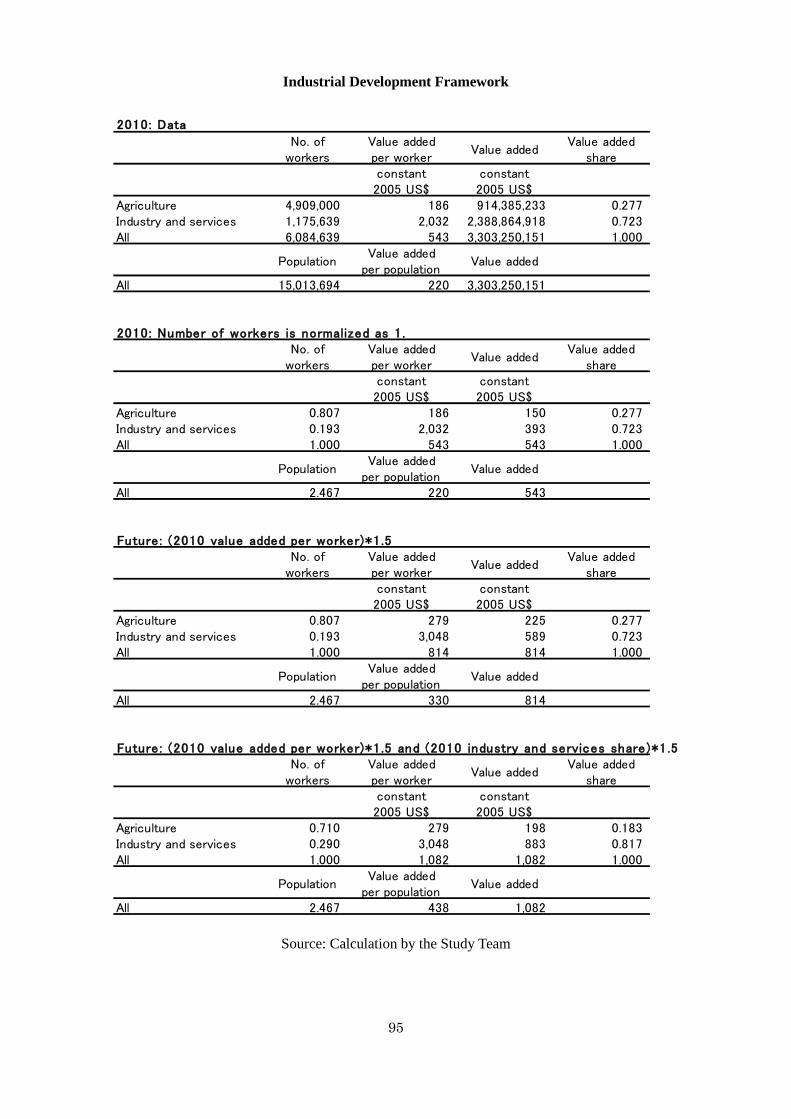
95
2010: Data
No. ofworkers
Value addedper worker
Value addedValue added
shareconstant2005 US$
constant2005 US$
Agriculture 4,909,000 186 914,385,233 0.277Industry and services 1,175,639 2,032 2,388,864,918 0.723All 6,084,639 543 3,303,250,151 1.000
PopulationValue added
per populationValue added
All 15,013,694 220 3,303,250,151
2010: Number of workers is normalized as 1 .No. of
workersValue addedper worker
Value addedValue added
shareconstant2005 US$
constant2005 US$
Agriculture 0.807 186 150 0.277Industry and services 0.193 2,032 393 0.723All 1.000 543 543 1.000
PopulationValue added
per populationValue added
All 2.467 220 543
Future : (2010 value added per worker)*1.5No. of
workersValue addedper worker
Value addedValue added
shareconstant2005 US$
constant2005 US$
Agriculture 0.807 279 225 0.277Industry and services 0.193 3,048 589 0.723All 1.000 814 814 1.000
PopulationValue added
per populationValue added
All 2.467 330 814
Future : (2010 value added per worker)*1.5 and (2010 industry and services share)*1.5No. of
workersValue addedper worker
Value addedValue added
shareconstant2005 US$
constant2005 US$
Agriculture 0.710 279 198 0.183Industry and services 0.290 3,048 883 0.817All 1.000 1,082 1,082 1.000
PopulationValue added
per populationValue added
All 2.467 438 1,082
Industrial Development Framework
Source: Calculation by the Study Team