52 david sutton pictures the petrous temporal bone
TRANSCRIPT

52THE PETROUS TEMPORAL BONE
DAVID SUTTON

DAVID SUTTON PICTURES
DR. Muhammad Bin Zulfiqar PGR-FCPS III SIMS/SHL

• Fig. 52.1 Stenver's view of the petro mastoid with an extended electrode array in the first and second coils of the cochlea. v = vestibule; s = superior semicircular canal; i = internal auditory meatus.

• Fig. 52.2 Perorbital view showing an electrode array in the basal cochlear coil. There is extensive pneumatisation to the petrous apex. v = vestibule; i = internal auditory meatus.

• Fig. 52.3 The sections for a routine axial CT examination of the temporal bone shown on a sagittal scout view.

• Fig. 52.4 The four most important sections in the study of the petrous temporal bone by CT: the cochlear and vestibular cuts in both corona! And axial planes. (A) The position of these cuts is shown on a cast of the labyrinth of the inner ear viewed from the lateral aspect. (B) Axial plane. (C) Corona! plane. The internal auditory meatus and oval window are well shown in both planes.

• Fig. 52.4 The four most important sections in the study of the petrous temporal bone by CT: the cochlear and vestibular cuts in both corona! And axial planes. (A) The position of these cuts is shown on a cast of the labyrinth of the inner ear viewed from the lateral aspect. (B) Axial plane. (C) Corona! plane. The internal auditory meatus and oval window are well shown in both planes.

• Fig. 52.4 The four most important sections in the study of the petrous temporal bone by CT: the cochlear and vestibular cuts in both corona! And axial planes. (A) The position of these cuts is shown on a cast of the labyrinth of the inner ear viewed from the lateral aspect. (B) Axial plane. (C) Corona! plane. The internal auditory meatus and oval window are well shown in both planes.
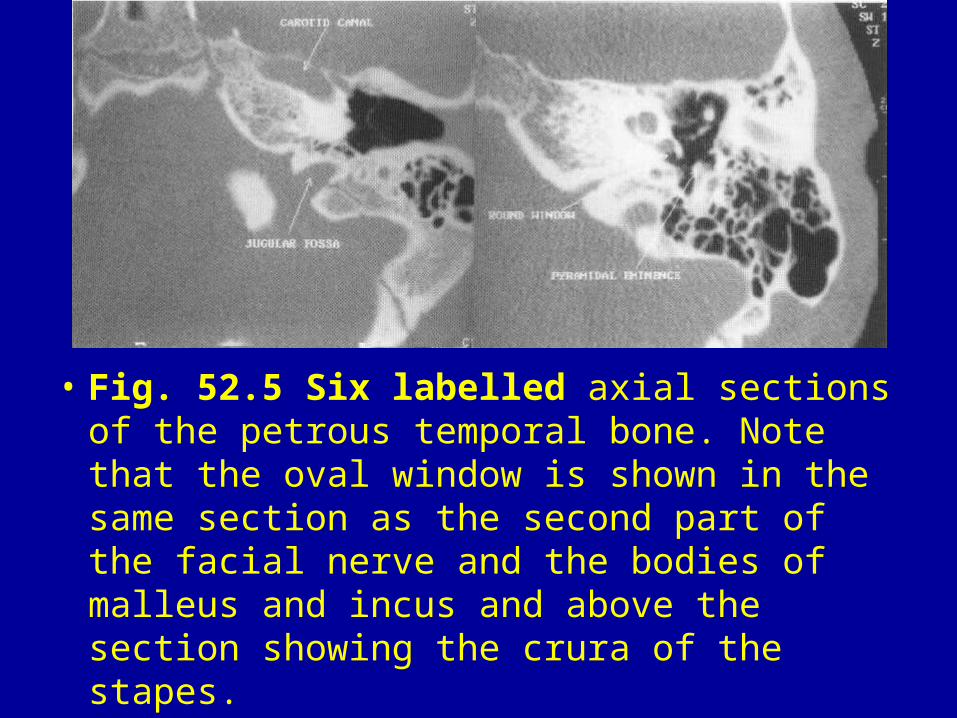
• Fig. 52.5 Six labelled axial sections of the petrous temporal bone. Note that the oval window is shown in the same section as the second part of the facial nerve and the bodies of malleus and incus and above the section showing the crura of the stapes.

• Fig. 52.5 Six labelled axial sections of the petrous temporal bone. Note that the oval window is shown in the same section as the second part of the facial nerve and the bodies of malleus and incus and above the section showing the crura of the stapes.

• Fig. 52.5 Six labelled axial sections of the petrous temporal bone. Note that the oval window is shown in the same section as the second part of the facial nerve and the bodies of malleus and incus and above the section showing the crura of the stapes.

• Fig. 52.6 Six labelled coronal sections.

• Fig. 52.6 Six labelled coronal sections.

• Fig. 52.6 Six labelled coronal sections.

• Fig. 52.7 An axial CT section showing a large vestibular aqueduct with a line depicting the plane of reformatting, enabling a measurement to be made in the midportion of the descending limb (labelled 1 and measuring 2.0 mm in diameter).
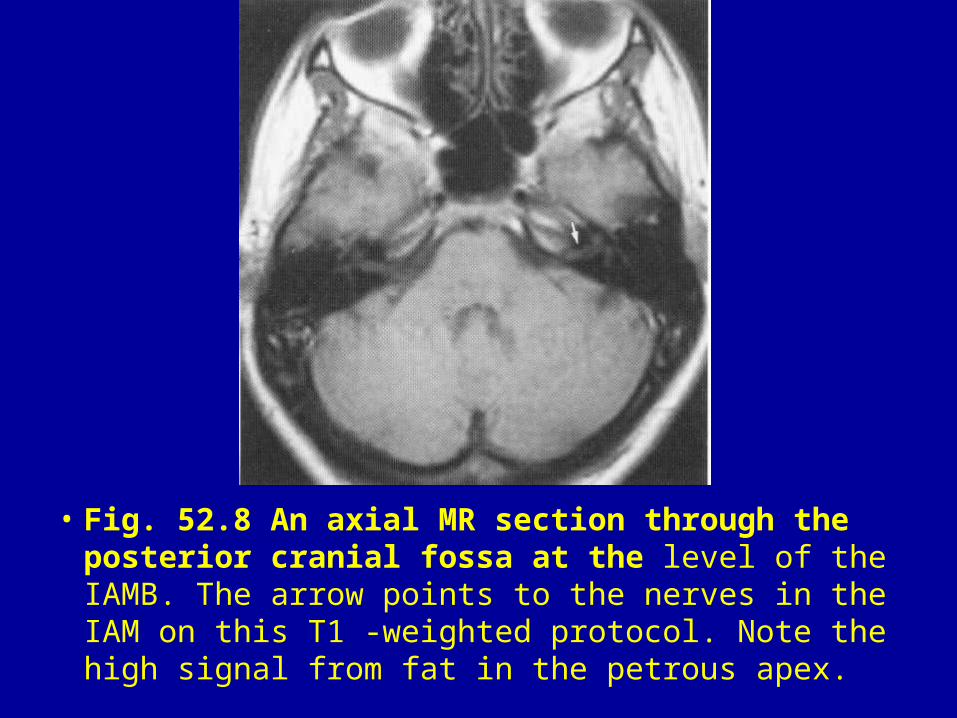
• Fig. 52.8 An axial MR section through the posterior cranial fossa at the level of the IAMB. The arrow points to the nerves in the IAM on this T1 -weighted protocol. Note the high signal from fat in the petrous apex.

• Fig. 52.9 (A) A similar section to that in Figure 52.8 but T2 weighted using a fast spin-echo sequence, giving greatly improved spatial resolution. The open arrow points to the basilar artery, the small arrow to the spiral ganglion of the cochlear nerve. (B) Tiny presumed acoustic neuroma on the superior vestibular nerve (arrow) in another patient.

• Fig. 52.10 (AM) Sagittal MR sections T2-weighted showing a grossly dilated endolymphatic sac (asterisk) in a typical case of Pendred's syndrome. Note also the sac in place of the distal 1.5 coils of the cochlea, i.e. a typical Mondini deformity (arrow).

• Fig. 52.11 Axial T 1 -weighted image at the level of the IAMB but after contrast enhancement. The arrow points to the second part of the facial nerve.

• Fig. 52.12 (A) Coronal CT section showing high jugular fossa on one side with diverticulum. The arrow points to the thin bone separating the jugular bulb from the hypotympanum of the middle ear. (B) MRA shows the large jugular bulb (arrow).

• Fig. 52.13 Line drawings based on axial CT sections of the types of labyrinthine deformity. (From Phelps & Stansbie 1993, with permission.)

• Fig. 52.13 Line drawings based on axial CT sections of the types of labyrinthine deformity. (From Phelps & Stansbie 1993, with permission.)

• Fig. 52.13 Line drawings based on axial CT sections of the types of labyrinthine deformity. (From Phelps & Stansbie 1993, with permission.)

• Fig. 52.14 Two basal CT sections showing a normal basal turn of cochlea (A) and distal sac (B), i.e. a true Mondini deformity. Some hearing was present and the normal basal turn suggests no risk of fistula or meningitis.

• Fig. 52.15 Congenital malformations of the middle and external ears, based on corona! section tomograms. (A) Normal. (B) Sloping external meatus. (C) Pneumatised atretic plate with ossicular mass fixed to it. (D) Thin atretic plate. (E) Small middle ear cavity, spidery ossicles, and facial nerve canal exits through the atretic plate (arrow). (F) Depressed tegmen (arrow), lower part of middle ear only present, and anterior position of the facial nerve (crossed arrow). (From Phelps et al 1977.)

• Fig. 52.15 Congenital malformations of the middle and external ears, based on corona! section tomograms. (A) Normal. (B) Sloping external meatus. (C) Pneumatised atretic plate with ossicular mass fixed to it. (D) Thin atretic plate. (E) Small middle ear cavity, spidery ossicles, and facial nerve canal exits through the atretic plate (arrow). (F) Depressed tegmen (arrow), lower part of middle ear only present, and anterior position of the facial nerve (crossed arrow). (From Phelps et al 1977.)

• Fig. 52.15 Congenital malformations of the middle and external ears, based on corona! section tomograms. (A) Normal. (B) Sloping external meatus. (C) Pneumatised atretic plate with ossicular mass fixed to it. (D) Thin atretic plate. (E) Small middle ear cavity, spidery ossicles, and facial nerve canal exits through the atretic plate (arrow). (F) Depressed tegmen (arrow), lower part of middle ear only present, and anterior position of the facial nerve (crossed arrow). (From Phelps et al 1977.)

• Fig. 52.16 Coronal CT section at the level of the cochlea showing typical appearances of hemifacial microsomia on the left with depression of the floor of the middle cranial fossa (open arrow), anterior descending portion of the facial nerve (black arrow), and deformity of the left temporomandibular joint.

• Fig. 52.17 Bilateral metal atresia shown by two coronal CT sections. There are small middle ear cavities, and some hypoplastic ossicles can be identified (black arrow). The tegmen is depressed unilaterally and the descending facial canal (white arrow) is at the level of the oval window.
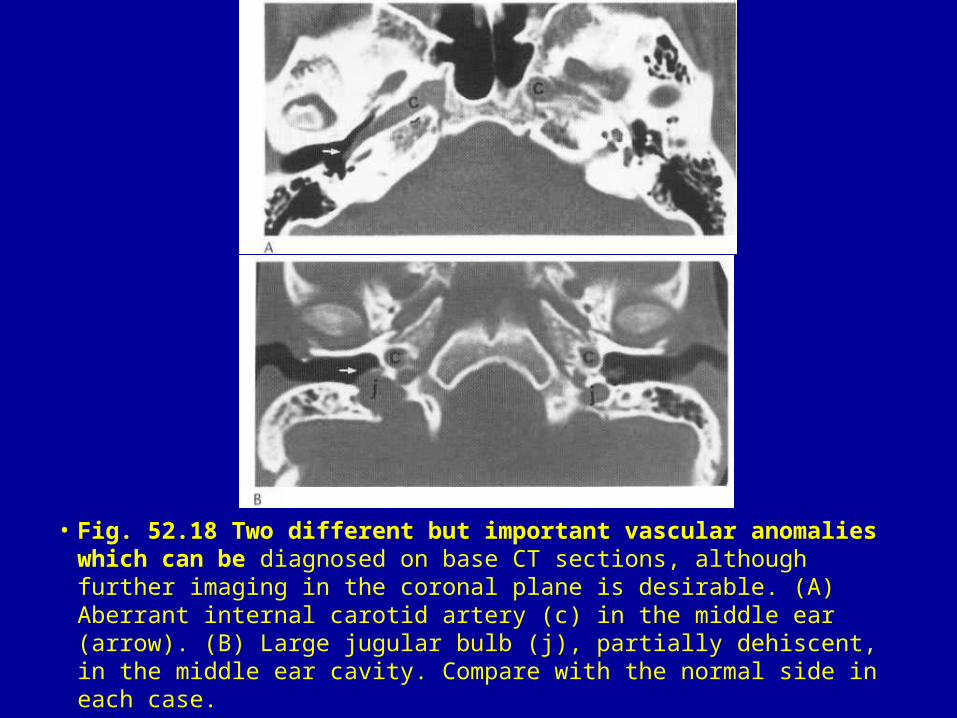
• Fig. 52.18 Two different but important vascular anomalies which can be diagnosed on base CT sections, although further imaging in the coronal plane is desirable. (A) Aberrant internal carotid artery (c) in the middle ear (arrow). (B) Large jugular bulb (j), partially dehiscent, in the middle ear cavity. Compare with the normal side in each case.

• Fig. 52.19 Longitudinal fracture of the petrous temporal bone with a depressed fragment of squamous temporal. The fracture line runs along the roof of the external meatus and middle ear with a small fragment of bone in the region of the genicular ganglion (white arrow). The fracture passed through the sphenoid sinuses which are filled (asterisk). On the left side the black arrow indicates the malleus in normal position; the incus was displaced. Axial CT scan.

• Fig. 52.20 (A) Transverse fracture of the pyramid passing through the vestibule (arrow). Note the air in the cranial cavity and the CSF level in the middle ear. (B) Plain Stenver's view showing the fracture line (arrow).

• Fig. 52.21 Coronal CT scan showing massive incus displacement following a road traffic accident. The images of the ossicles are completely separate and the incus is lying inverted in the attic (arrow).

• Fig. 52.22 Axial CT scan showing fluid in the mastoid cell system on the left (arrow), with cell wall breakdown.

• Fig. 52.23 Axial CT scan through the basal turn of the cochlea. On one side a single channel cochlear implant has been inserted in the round window (large arrow); on the other side there is labyrinthitis obliterans with only the hook of the basal turn readily apparent (small arrow).

• Fig. 52.24 Axial T2 -weighted MR section of the inner ear in a patient for cochlear implantation. The basal coil of the cochlea on the right shows high signal from the medial part but low signal laterally, presumably due to fibrosis (arrow) so insertion of the electrode was unsuccessful. The basal turn on the left shows uniform high signal and was subsequently implanted without difficulty.

• Fig. 52.25 (A) Axial CT section showing an expansile lesion in the petrous apex (asterisk). This was a presumed cholesterol granuloma following trauma. Note the good pneumatisation of the petrous apex on the other side. (B) High signal on both T 1 - and T2 -weighted MR protocols confirmed that this was a cholesterol granuloma.

• Fig. 52.26 Corona! CT section at the level of the vestibule showing a typical acquired cholesteatoma which has eroded both the outer attic wall (arrow) and the apex of the lateral semicircular canal (open arrow) to give a positive fistula sign clinically.
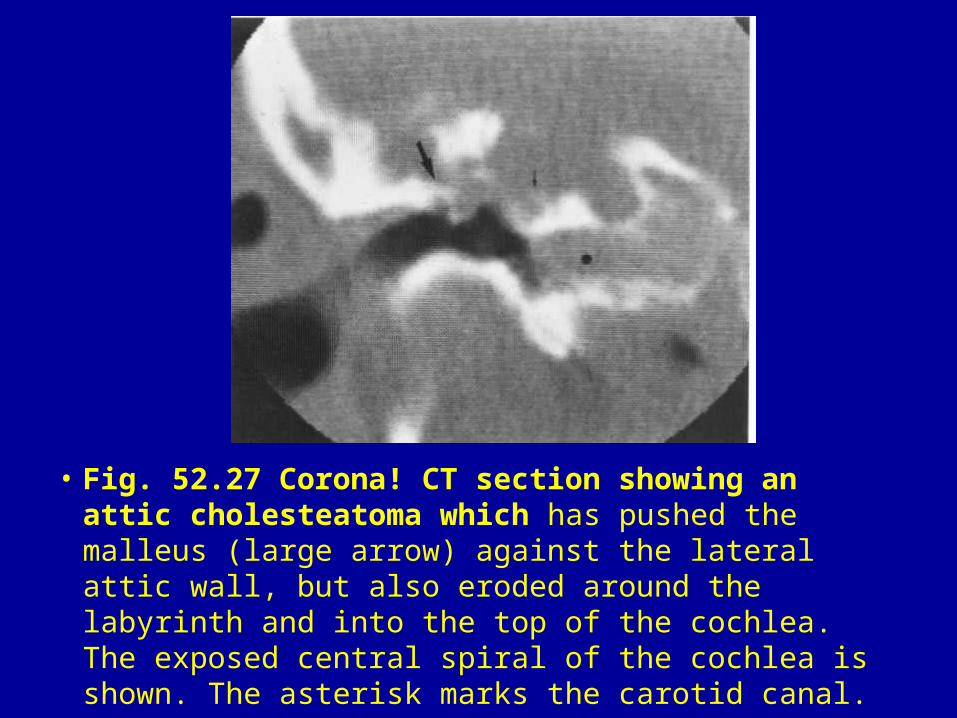
• Fig. 52.27 Corona! CT section showing an attic cholesteatoma which has pushed the malleus (large arrow) against the lateral attic wall, but also eroded around the labyrinth and into the top of the cochlea. The exposed central spiral of the cochlea is shown. The asterisk marks the carotid canal.

• Fig. 52.28 A small osteoma of the middle ear arising from the posterior aspect of the promontory close to the round window. (A) Coronal tomogram shows the osteoma just below the incudostapedial joint. (B) Axial CT also shows the relation to the basal turn of the cochlea.

• Fig. 52.29 (A) Base CT at the level of jugular fossa (j) and horizontal carotid canal (a). On the right the crest of bone between them is apparent. On the left this part of the jugular fossa is eroded by a glomus jugulare tumour (arrow), which has also extended into the middle ear. (B) Base Gd-MR scan at the same level, showing the tumour surrounding the carotid artery and quite distinct from the fluid in the mastoid.

• Fig. 52.30 Sagittal Gd-MR scan showing a large glomus jugulare tumour and its upper and lower limits in the posterior cranial fossa and neck (arrows). The black streaks representing blood vessels are characteristic. Gadolinium enhancement, although giving improved differentiation in the mastoid and cranial cavity, is not such an advantage in the neck, where adjacent fat also gives a bright signal on a T 1 -weighted image. The open arrow points to the IAM.

• Fig. 52.31 (A) Coronal CT showing a small glomus tympanicum in the lower middle ear cavity (arrow). J = jugular bulb. (B) An equivalent MR section confirms that this is quite separate from flowing blood in the jugular bulb (J). Note the confusing proximity of marrow fat (M).

• Fig. 52.32 (A) Axial CT section through the IAM showing expansion of the first part of the facial nerve canal (arrow). Note the calcification which should have suggested that this was a haemangioma rather than a neuroma. (B) Axial MR section, T 1 -weighted with gadolinium enhancement, shows the mass (arrow).

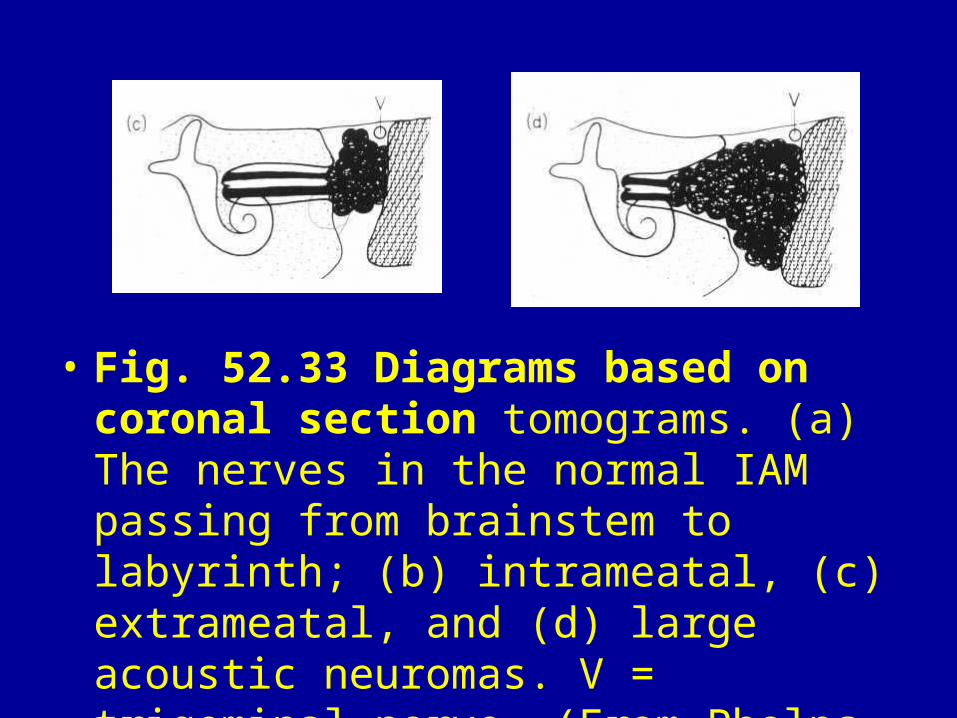
• Fig. 52.33 Diagrams based on coronal section tomograms. (a) The nerves in the normal IAM passing from brainstem to labyrinth; (b) intrameatal, (c) extrameatal, and (d) large acoustic neuromas. V = trigeminal nerve. (From Phelps & Lloyd 1983.)
• Fig. 52.33 Diagrams based on coronal section tomograms. (a) The nerves in the normal IAM passing from brainstem to labyrinth; (b) intrameatal, (c) extrameatal, and (d) large acoustic neuromas. V = trigeminal nerve. (From Phelps & Lloyd 1983.)

• Fig. 52.34 Large acoustic neuroma in the left cerebellopontine angle (asterisk). (A) Fast spin-echo T2 axial section. (B) Equivalent T 1 section after gadolinium enhancement.

• Fig. 52.35 Corona! Gd-MRI showing bilateral intrameatal acoustic neuromas (small arrows) and a trigeminal neuroma (large arrow) in a patient with neurofibromatosis (NF2).

• Fig. 52.36 (A) Axial FSE section showing a small acoustic neuroma in the right IAM just protruding into the cerebellopontine angle. Note the normal nerves in the left IAM. (B) Equivalent corona! T 1 section after gadolinium enhancement.

• Fig. 52.37 (A) Axial Gd-MRI showing a large acoustic neuroma in the cerebellopontine angle and medial part of the IAM. (B) The bulk of the tumour has been removed but a small segment adherent to the facial nerve has been left deliberately (arrow) to preserve facial nerve function and will be monitored for growth on subsequent scans. Note the 'hole' in the posterior cranial fossa.

• Fig. 52.38 (A,B) Coronal T 1 -weighted MR with gadolinium enhancement showing a meningioma of the posterior cranial fossa extending into the IAM and jugular fossa as well as onto the superior surface of the petrous pyramid and into the tentorium (arrows).

• Fig. 52.39 Ragged erosion of the right mastoid region by a carcinoma shown on this axial CT section.

• Fig. 52.40 Malignant otitis externa. Bone destruction in the region of the mastoid (arrow) around the internal carotid artery (a) and temporomandibular joint (T) as well as sclerosis of the basisphenoid (s) are shown on this axial CT scan.

• Fig. 52.41 Axial CT with densitometry, showing otospongiosis as a ring of rarefaction around the cochlear coils. The densitometry readings are mostly around 1200 HU. The normal range is 1800-2400 HU.

• Fig. 52.42 Fibrous dysplasia, also affecting the right mandible, is narrowing the right IAM and external meatus. Such expansion of abnormal bone may lead to cholesteatoma formation behind the obstruction as here, but unlike Paget's disease the otic capsule does not appear to be affected by fibrous dysplasia.
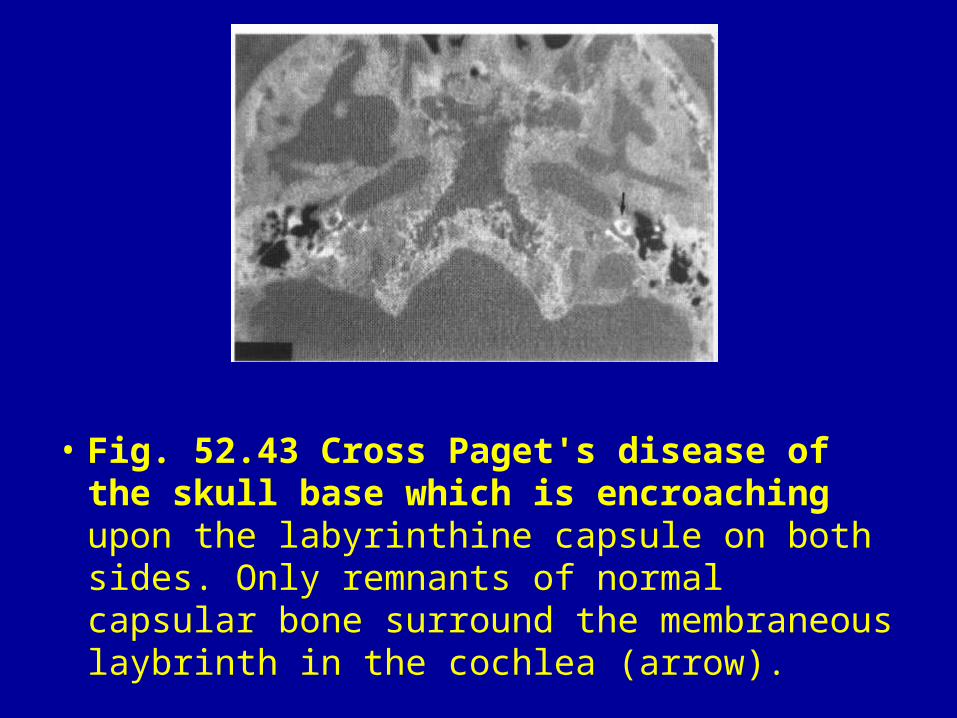
• Fig. 52.43 Cross Paget's disease of the skull base which is encroaching upon the labyrinthine capsule on both sides. Only remnants of normal capsular bone surround the membraneous laybrinth in the cochlea (arrow).
