6. discussion of findings - home | federal highway ... · 6. discussion of findings ... the use of...
TRANSCRIPT

451
6. DISCUSSION OF FINDINGS
The following sections discuss the findings of this study. The discussion is presented in five
primary sections. First, the findings from the State-of-the-Practice Survey will be discussed.
The findings from the Routine Inspection tasks will follow. Next, the findings from the In-Depth
Inspection tasks will be discussed. Comparisons between portions of the Routine and In-Depth
Inspection findings are then presented. Finally, the findings from the State-dependent tasks will
be discussed.
6.1. STATE-OF-THE-PRACTICE SURVEY
A survey was conducted to determine the state of the practice for bridge inspection. Participant
groups that were targeted included State DOTs, county DOTs from Iowa, and bridge inspection
contractors. Responses were received from 42 State DOTs, 72 counties, and 6 inspection
contractors. Components of the survey included questions focusing on bridge inspection team
composition and administrative requirements (both specifically in terms of Visual Inspection
[VI]), and the general use of NDE.
Typical questions asked about the composition of inspection teams included: who performs
bridge inspections, the types of inspections for which contractors are used, time and manpower
budgets for a given inspection situation, PE presence during inspections and why, and experience
levels for team members. Contractors were found to be used by a large percentage of States and
counties, and may be used for a wide variety of inspection situations. State respondents
indicated that PEs were typically not present on site for inspections. Almost 50 percent of State
respondents indicated that a PE was present for less than 20 percent of their inspections.
Contractors were most likely to have a PE on site during inspections.
Typical questions asked about administrative issues related to VI included: the size of the
inspection units, required inspector training, procedure/policy improvements, vision testing, use
of old inspection reports, the number of bridges inspected each year, and quality measures.
Increased use of NDE, increased personnel, and increased equipment were frequently listed
targets for additional bridge inspection resources. The Bridge Inspector’s Training Course was
452
found to be the most frequently required training course by States, counties, and contractors for
team leaders and other team members. Bridge management systems, training, and other
operational areas were all topics that respondents suggested could be improved. Vision testing
for inspectors was found to be almost non-existent; any vision tests (i.e., driver’s license vision
tests) were usually administered to satisfy other job requirements. The top QC response was
review of inspection reports, and the top QA response was field re-inspection programs to spot-
check inspection reports.
Typical questions asked about general NDE techniques included: the use of ASNT Level III
inspectors, inspector certifications, NDE techniques currently used, NDE technique used most
frequently, any discontinuation of NDE techniques for any reason, and applications for future
research. A compilation of currently used NDE techniques was determined, with VI being cited
most frequently. Some novel NDE techniques were also listed, such as acoustic emission, radar,
and thermography. Concrete deck research and prestressed concrete superstructure research
were the most frequently requested areas by State and county respondents for future NDE
research.
6.2. ROUTINE INSPECTION
Aside from the State-dependent tasks, inspectors were asked to complete six Routine Inspection
tasks. The following subsections discuss the findings from these tasks, focusing on inspection
procedure, accuracy of inspection results, and factors influencing Condition Rating assignment.
6.2.1. Inspection Procedure
Inspection procedure includes three broad topics. First, the inspector’s ability to identify
structural attributes and probable structural deterioration modes was examined. This was done
through a series of questions posed prior to each task that asked the inspectors to describe the
bridge and to identify expected deterioration modes. The inspectors were generally able to
identify the overall structure type. However, most inspectors did not indicate the existence of
important structural attributes that may influence how each bridge should be inspected (e.g.,
skew, support conditions, etc.). In addition, most inspectors indicated that they expected to find

453
some type of concrete and/or steel deterioration. However, there was less consensus on how the
deterioration would be manifested.
The second inspection procedure topic focused on the inspector’s methods for completing the
inspection. In general, most inspectors visually examined each of the primary bridge
components. Inspection tool use was minimal and, as a result, few detailed examinations were
completed (e.g., sounding, measurement, etc.). Although typically used by less than 50 percent
of the inspectors, the most common inspection tools used during the Routine Inspection tasks
included a masonry hammer, flashlight, tape measure, and binoculars.
The final inspection procedure topic focused on the differences between an inspector’s normal
practices and those used during these performance trials. Although the inspection tasks were
completed in a somewhat artificial manner (e.g., under observation, within prescribed time
limits, etc.), the participating inspectors indicated that the tasks were administered and completed
in a manner similar to normal Routine Inspections. Furthermore, the inspectors generally
indicated that they were about as thorough as usual and that they exerted a typical amount of
effort to complete the tasks.
6.2.2. Accuracy of Inspection Results
Accuracy of inspection results includes three broad topics. First is the accuracy with which
Condition Ratings were assigned to the primary bridge elements. On average, there were
between four and five different Condition Rating values assigned to each primary element. In
addition, even if one does not know what the correct Condition Rating is, it has been shown that
at least 48 percent of the individual Condition Ratings for the primary elements were assigned
incorrectly, and if the NDEVC reference Condition Ratings are correct, then 58 percent of the
individual ratings were assigned incorrectly. When considered as a group, at least 56 percent of
the sample average Condition Ratings for the primary elements were incorrect with a 95 percent
probability, and if the NDEVC reference Condition Ratings were correct, then 78 percent of the
sample average ratings were incorrect with a 95 percent probability. The distribution of assigned
primary element Condition Ratings was normal, and as a result, it is predicted that 95 percent of
the primary element Condition Ratings for the entire bridge inspector population will vary within

454
approximately two rating points from the average. It is also predicted that only 68 percent of the
population would vary within approximately one rating point from the average. Thus, it appears
that inspectors may have difficulty defining the level of deterioration in terms of the verbiage
used in the Condition Rating system. The assignment of Condition Ratings to the secondary
elements was completed with less consensus than for the primary elements. This is probably
attributable to the fact that inspectors may not normally assign Condition Ratings to these types
of elements.
The second topic within accuracy of inspection results focused on relationships between
individual Condition Ratings. Overall, “better” condition primary bridge elements were rated
lower than the reference Condition Ratings and “poorer” condition primary elements were rated
higher than the reference Condition Ratings. In addition, the greatest dispersion in inspection
results was from assessments of the substructures and “poorer” condition elements. Generally,
inspectors who rated one primary element type higher than the reference also tended to do so for
the other element types. A similar relationship exists between Condition Rating assignment on
“poorer” and “better” condition primary elements. Finally, it appears that as the severity of the
deficiencies rises, so does the difficulty in assessing the severity. This difficulty is most
prevalent in the assessment of bridge decks.
The final topic within accuracy of inspection results focused on inspection documentation.
Recall that during Task D, inspectors were provided with a camera with which they could
photographically document their observations. The use of photographic documentation varied
significantly. The most common photographs were of joint deterioration, deterioration of the
parapet, an overall elevation view, and a general approach view. All other photographs were
taken by less than half of the inspectors. However, providing photographic documentation did
not appear to influence the assignment of the Task D Condition Ratings. Inspector
documentation was also studied in terms of the specific field notes inspectors recorded during
these six Routine Inspection tasks. Of the 20 investigated field notes describing moderate to
severe deficiencies, most were taken by more than half of the inspectors. In general, the
following inspector factors showed the strongest relationship with note-taking proficiency: Fear
of Traffic, Perception of Bridge Inspection Importance to Public Safety, Quality of Relationship

455
With Supervisor, Estimated Additional Years as a Bridge Inspector, Comparison to Other
Inspectors, General Education Level, and Formal Bridge Inspection Training. On a task-by-task
basis, similar to the photographic documentation, note-taking appears to have no influence on the
assignment of Condition Ratings. However, when the task results are combined, inspectors who
took a greater number of total notes tended to give Condition Ratings that were higher than the
reference ratings and that contained less dispersion overall. The converse was also found to be
true.
6.2.3. Factors Influencing Condition Rating Assignment
Multivariate equations that model the inspector and inspection factors have been developed to
predict the sample primary element Condition Rating results. The most frequently recurring
inspector factors in these equations include: Reported Fear of Traffic, Near Visual Acuity, Color
Vision, and Formal Bridge Inspection Training. Similarly, the most frequently recurring
inspection factors include: Light Intensity, Reported Structure Maintenance Level, Reported
Structure Accessibility Level, Reported Structure Complexity Level, Inspector Rushed Level,
and Wind Speed. An interaction between the inspector and the inspection factors does exist, and
when these factors were considered jointly, the predictability of the sample primary element
Condition Rating results is improved.
There were a number of factors that one might logically think could influence Condition Rating
assignment that were found to have minimal correlation. Specifically, these include such items
as being a registered PE, general education level, and bridge inspection experience.
6.3. IN-DEPTH INSPECTION
Aside from the State-dependent tasks, inspectors were asked to complete two In-Depth
Inspections. The following discusses the findings of these tasks, focusing on the accuracy of the
inspection results and on the factors that tend to relate to the inspection results.
6.3.1. Accuracy of Inspection Results
Detailed results of the In-Depth Inspections were presented in Chapter 5. Within both Task F
and Task H, deficiencies considered to warrant notation in an inspection report were selected as

456
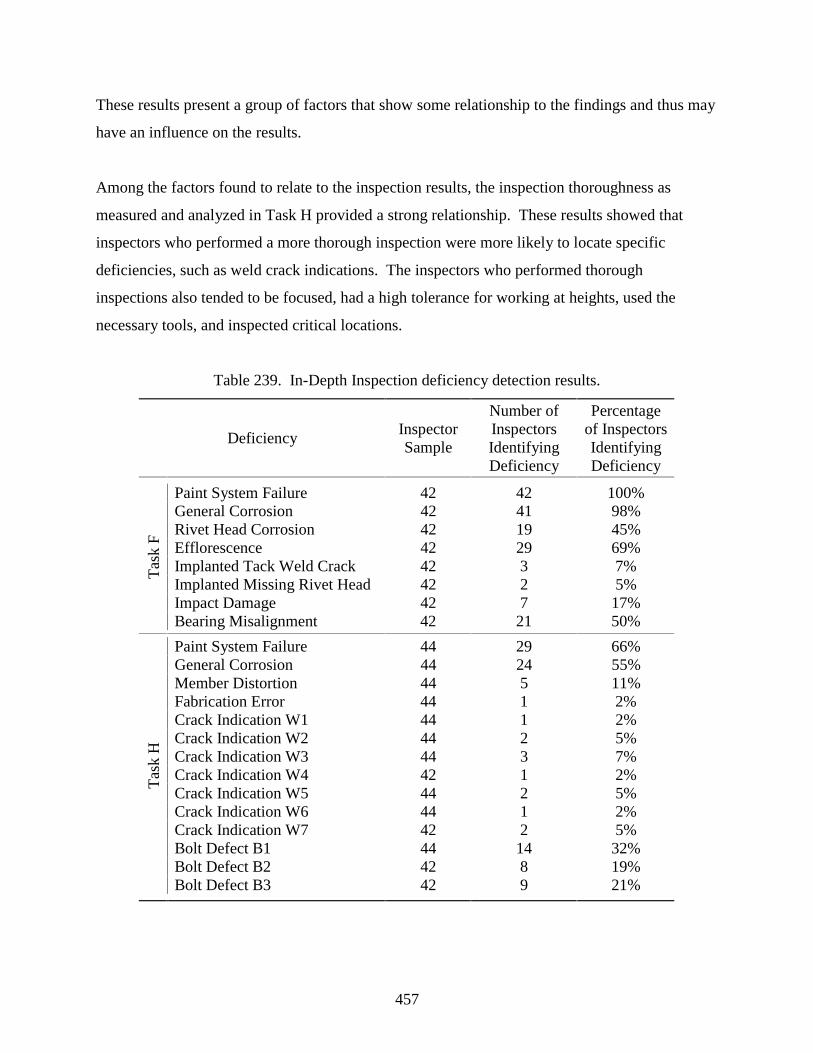
the expected defects that inspectors should have noted during their inspections. Table 232
presents a summary of the deficiency detection results for these items. The table includes the
number of inspectors who performed the specific portion of the task necessary to have located
the defect, and the number and percentage of inspectors who correctly located the defect.
There are a few clear trends evident in the information contained in Table 239. First, general
coating defects in a steel superstructure will probably be noted during an In-Depth Inspection.
As would be expected, it is also evident that a superstructure with a greater level of deterioration
(i.e., Task F) will be more likely to be indicated as having deficiencies.
With regard to more localized, specific defects, the results show that it is unlikely that an
inspector will note the types of deficiencies examined in this study. In every case, less than 8
percent of the inspectors noted either of the implanted defects in Task F or any of the weld crack
indications in Task H. The results from the weld crack indications in Task H show that, for the
types of indications present in this task, the overall accuracy rate for identifying these defects is
3.9 percent. Finally, with regard to the bolt defects in Task H, the results show that, in general,
only approximately 25 percent of the inspectors will note this type of deficiency.
6.3.2. Factors Correlating With Inspection Results
The factors that show some correlation with the inspection results from the In-Depth Inspections
were presented in Chapter 5. Within this group of factors, there are 11 specific factors that show
stronger relationships to the inspection results. The following combines the results from Tasks F
and H and presents a discussion of these factors and factor categories. The discussion includes
factors related to inspection thoroughness, inspection time, inspector comfort during inspection,
structure complexity, structure accessibility, inspector viewing of welds, flashlight use, and
number of annual bridge inspections.
In general, the factors mentioned above correlate to some portion of the inspector subsets.
However, correlation does not necessarily indicate causation. Since this was only a univariate
analysis that compared one factor to a set of results, it may not be correct to conclude that an
inspector who rates favorably on one factor scale will automatically perform a better inspection.
457
These results present a group of factors that show some relationship to the findings and thus may
have an influence on the results.
Among the factors found to relate to the inspection results, the inspection thoroughness as
measured and analyzed in Task H provided a strong relationship. These results showed that
inspectors who performed a more thorough inspection were more likely to locate specific
deficiencies, such as weld crack indications. The inspectors who performed thorough
inspections also tended to be focused, had a high tolerance for working at heights, used the
necessary tools, and inspected critical locations.
Table 239. In-Depth Inspection deficiency detection results.
Deficiency Inspector Sample
Number of Inspectors Identifying Deficiency
Percentage of Inspectors Identifying Deficiency
Paint System Failure 42 42 100% General Corrosion 42 41 98% Rivet Head Corrosion 42 19 45% Efflorescence 42 29 69% Implanted Tack Weld Crack 42 3 7% Implanted Missing Rivet Head 42 2 5% Impact Damage 42 7 17%
Tas
k F
Bearing Misalignment 42 21 50%
Paint System Failure 44 29 66% General Corrosion 44 24 55% Member Distortion 44 5 11% Fabrication Error 44 1 2% Crack Indication W1 44 1 2% Crack Indication W2 44 2 5% Crack Indication W3 44 3 7% Crack Indication W4 42 1 2% Crack Indication W5 44 2 5% Crack Indication W6 44 1 2% Crack Indication W7 42 2 5% Bolt Defect B1 44 14 32% Bolt Defect B2 42 8 19%
Tas
k H
Bolt Defect B3 42 9 21%

458
Actual Time to Complete Inspection is a factor that showed some correlation with the results.
The results from both tasks show a tendency for inspectors who located defects to have spent
more time on their inspection. The results also show that the inspectors who indicated that there
were no defects tended to spend less time on their inspections. Furthermore, the results from
Task H show that inspectors who correctly located multiple relatively minute detail defects, such
as a weld crack indication or bolt defects, tended to take significantly more time to complete the
task. With regard to Estimated Time to Complete Inspection, the inspectors who noted defects
tended to spend more time on the inspection than they had anticipated spending, while the
inspectors who noted no deficiencies spent significantly less time than they had anticipated.
These results seem to indicate that the inspectors who worked more slowly found more defects.
However, these results also allow for the possibility that the detection of a defect would tend to
slow the inspector, forcing a longer, more thorough examination of the bridge.
There are three factors that focus on the comfort of the inspector while performing an inspection
at heights. All three of these factors tended to correlate with the results from Task H. This is
probably due to the task being performed from a boom lift more than 15.2 m (50 ft) above
ground level. These three factors — Fear of Heights, Observed Inspector Comfort With Heights,
and Observed Inspector Comfort With Lift — will all be discussed together due to their close
relationship. The first tendency is for the inspectors who noted no deficiencies in Task H to also
receive a relatively low rating for Comfort With Lift and Comfort With Heights, and for them to
report that they had a greater than average fear of heights. Conversely, the inspectors who noted
a weld crack indication or the distortion defect tended to receive greater than average ratings for
Comfort With Heights and Comfort With Lift. The inspectors who noted a weld crack indication
also reported that they had less fear of heights than average. Clearly, inspectors who were more
comfortable working at heights were more likely to correctly locate defects, while those who
were uncomfortable tended to locate no defects.
Inspector-Reported Structure Accessibility and Inspector-Reported Structure Complexity are
both factors that were found to relate to certain subsets of inspectors, and thus with the detection
of certain types of defects. This is probably due to two reasons. First, both factors tend to affect
the way an inspection is performed, possibly causing the inspector to not gain the access that

459
may be necessary to fully inspect certain details. Second, they also describe the inspector’s
overall view of the structure, providing an indication of the types of defects that are being looked
for. With regard to complexity, the inspectors who noted an implanted defect in Task F and the
inspectors who noted a weld crack indication in Task H rated the respective structures as more
complex. The inspectors who noted a weld crack indication in Task H also rated the
accessibility of that structure as being lower than average. Alternatively, the inspectors who
noted the distortion defect in Task H, as compared to the average inspector, felt that the bridge
was more accessible and less complex. These results seem to indicate that the inspectors who
tend to find smaller defects, such as a weld crack indication, are more likely to feel that the
structure is more difficult to inspect than average. Also, inspectors who locate larger defects,
such as overall flange distortions, seem more likely to indicate that the structure is easier to
inspect than average. Note, however, that the converse of both of these statements may also be
true, with the perception of complexity and accessibility possibly causing the inspector to find
certain defects.
The physical action of inspecting welds during Task H leads to two more factors that tend to
relate to the inspection results from that task. The Observed Variation in Viewing Angle and the
Observed Distance to Weld Inspected are both factors that clearly demonstrate that the inspectors
who located certain types of defects did so because they were specifically looking for that type of
defect. Inspectors who noted a weld crack indication were significantly more likely to be
observed varying their viewing angle when inspecting welded connections. These inspectors
were also observed to be much closer than average to the welds that they were inspecting.
Alternatively, the inspectors who did not note any defects in Task H were observed to vary their
viewing angle less frequently and to be much farther away from the welds that they were
inspecting than the average inspector. It seems clear that some inspectors were looking for
certain types of defects, while others were not.
Along similar lines, the use of a flashlight is another factor that relates to certain inspectors.
Compared to the average, a higher percentage of the inspectors who located the implanted defect
in Task F, the impact damage in Task F, or a weld defect in Task H tended to use a flashlight.
Since it is unlikely that the act of detecting a weld crack indication would cause the inspector to

460
use the flashlight, it seems clear that the use of the flashlight aided the inspector in the location
of these defects.
Finally, the Number of Annual Bridge Inspections also tended to relate to the results from Task
H. These results show that inspectors who correctly located one or multiple weld crack
indications tend to inspect significantly fewer bridges per year than average. Alternatively, the
inspectors who indicated that there were no deficiencies in Task H tended to inspect significantly
more bridges per year than average. This may indicate that inspectors who inspect more bridges
per year either become more rushed and thus perform a less thorough inspection or are less
familiar with performing In-Depth Inspections and thus do not know what deficiencies to look
for. Inspectors who perform fewer inspections per year than average may be more familiar with
In-Depth Inspections and thus may have performed better inspections.
6.4. COMPARISON OF ROUTINE AND IN-DEPTH INSPECTION SUBSETS
Comparisons can be made between various subsets of inspectors, as defined through the results
that were obtained in the Routine and In-Depth Inspection portions of this study. The following
section discusses comparisons between these subsets of inspectors.
6.4.1. Routine Inspection Subset Comparison
In Chapter 5, the Routine Inspection results were analyzed in a number of different ways. From
these analyses, the inspectors can be grouped into subsets based on their individual performance.
The subsets are based on six general measurements: (1) overall Condition Rating accuracy, (2)
superstructure Condition Rating accuracy, (3) overall Condition Rating precision, (4)
superstructure Condition Rating precision, (5) photographic documentation, and (6) field
inspection notes. The inspectors were grouped into “high” and “low” performance groups of
these subsets based on the data in Chapter 5, thereby creating 12 subsets. Note that for these
analyses, inspectors not in either the high or low performance groups were not included. The
criteria used to determine which inspectors were classified into each subset are shown in table
240. This table also shows how many inspectors were in each subset. Also note that the high
and low superstructure Condition Rating accuracy groups are primarily included here for

461
completeness, as they are used in later comparisons between Routine and In-Depth Inspection
inspector subsets.
Table 240. Routine Inspection subset classification.
Performance Criteria High Low Inspector Subset Types N Criteria N Criteria Accuracy (Overall) 14 DFR<0.20 6 DFR>0.75 Accuracy (Superstructure) 20 DFR<0.20 9 DFR>0.75 Precision (Overall) 14 σ<0.72 7 σ>1.00 Precision (Superstructure) 15 σ<0.60 10 σ>1.00 Photographs 11 Percentage of total > 50% 13 Percentage of total < 30% Notes 11 Total number of notes > 16 16 Total number of notes < 14
The following analysis focuses on whether inspectors who may have been grouped into one of
the Routine Inspection subsets also tended to fall into another of these subsets. Table 241
presents the results of these comparisons. The rows of this table present the inspector subsets,
along with the results of the overall set of inspectors. These subsets are the inspectors who are
being analyzed. The columns show the associated subsets. For example, the table shows that 50
percent of the inspectors who had high overall accuracy also had high accuracy in assessing the
superstructures. This result could be compared to the overall inspector sample result, which
indicates that 41 percent of the overall inspector sample had high accuracy in assessing the
superstructures.
There are a number of specific subset comparisons that deserve to be mentioned. First note that
100 percent of the low overall accuracy inspectors also had low accuracy for the superstructures,
as compared to 18 percent overall. Also note that 57 percent of the high overall precision
inspectors also had high precision for the superstructures, as compared to 31 percent overall.
Similarly, 43 percent of the inspectors with low overall precision also had low precision on the
superstructures, as compared to 20 percent overall. Finally, note that none of the inspectors that
took a large number of photographs also took a large number of notes, as compared to 33 percent
overall. Based on these data, it appears that the inspector subsets analyzed here tend to produce

462
certain types of inspection results. Specifically, these inspectors are generally consistent in their
Condition Rating assignment accuracy and precision.
Table 241. Comparison of Routine Inspection subsets.
�
Hig
h A
ccur
acy
(Ove
rall)
Low
Acc
urac
y (O
vera
ll)
Hig
h A
ccur
acy
(Sup
erst
ruct
ure)
Low
Acc
urac
y (S
uper
stru
ctur
e)
Hig
h Pr
ecis
ion
(Ove
rall)
Low
Pre
cisi
on (
Ove
rall)
Hig
h Pr
ecis
ion
(Sup
erst
ruct
ure)
Low
Pre
cisi
on (
Supe
rstr
uctu
re)
Lar
ge N
umbe
r of
Pho
tos
Tak
en
Smal
l Num
ber
of P
hoto
s T
aken
Lar
ge N
umbe
r of
Not
es T
aken
Smal
l Num
ber
of N
otes
Tak
en
Overall
29% 12% 41% 18% 29% 14% 31% 20% 22% 27% 22% 33%
High Accuracy (Overall)
100% 0% 50% 0% 29% 0% 29% 7% 21% 21% 21% 29%
Low Accuracy (Overall)
0% 100% 0% 100% 0% 50% 0% 50% 0% 33% 50% 50%
High Accuracy (Superstructure)
35% 0% 100% 0% 35% 10% 25% 15% 30% 30% 25% 40%
Low Accuracy (Superstructure)
0% 67% 0% 100% 11% 44% 11% 44% 11% 22% 33% 56%
High Precision (Overall)
29% 0% 50% 7% 100% 0% 57% 0% 21% 36% 14% 50%
Low Precision (Overall)
0% 43% 29% 57% 0% 100% 0% 43% 29% 29% 43% 29%
High Precision (Superstructure)
27% 0% 33% 7% 53% 0% 100% 0% 27% 13% 27% 33%
Low Precision (Superstructure)
10% 30% 30% 40% 0% 30% 0% 100% 30% 10% 20% 40%
Large Number of Photos Taken
27% 0% 55% 9% 27% 18% 36% 27% 100% 0% 0% 36%
Small Number of Photos Taken
23% 15% 46% 15% 38% 15% 15% 8% 0% 100% 15% 31%
Large Number of Notes Taken
27% 27% 45% 27% 18% 27% 36% 18% 0% 18% 100% 0%
Small Number of Notes Taken
25% 19% 50% 31% 44% 13% 31% 25% 25% 25% 0% 100%

463
6.4.2. In-Depth Inspection Subset Comparison
In Chapter 5, a number of subsets of inspectors were defined for both Task F and for Task H.
This section focuses on whether inspectors, who may have been grouped into one of these In-
Depth Inspection subsets, also tended to fall into another of these subsets. Ten of the 12
inspector subsets defined for Tasks F and H will be used here. The subsets of inspectors who
identified multiple weld crack indications and multiple bolt defects will not be discussed.
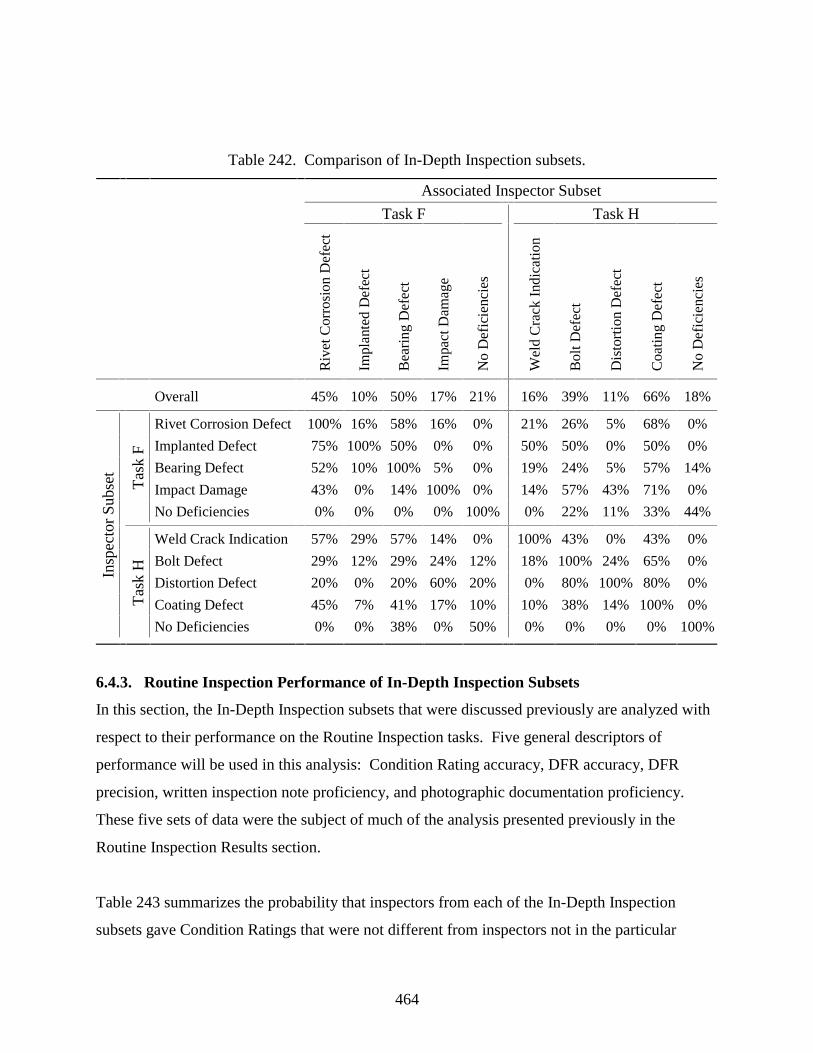
Table 242 presents the results of these comparisons. The rows of this table present the 10
inspector subsets, along with the results from the overall set of inspectors. These subsets are the
inspectors who are being analyzed to determine if they tended to fall into other subset categories.
The columns show the associated subsets. These are the deficiencies (or non-deficiencies) with
which the primary inspector subsets are being compared.
There are a number of specific subset comparisons that deserve to be mentioned. First, note that
50 percent of the inspectors who noted a Task F implanted defect also noted a Task H weld crack
indication, as compared to only 16 percent overall. Also note that 60 percent of the inspectors
who noted the Task H distortion defect also noted the Task F impact damage, as compared to 17
percent overall. Eighty percent of the inspectors who noted the Task H distortion defect also
noted a Task H bolt defect, however, none of those inspectors noted a weld crack indication.
Finally, note that 50 percent of the inspectors who indicated that there were no deficiencies in
Task H also indicated no deficiencies in Task F, as compared to 21 percent of the inspectors
overall.
These findings indicate that certain types of inspectors tend to produce certain types of
inspection results. Specifically, inspectors who find small, detailed defects (such as a weld crack
indication) will tend to do so regardless of the bridge. Inspectors who find gross dimensional
defects (such as distortions or impact damage) will also tend to do so regardless of the bridge.
Finally, those inspectors who find fewer than average defects in one bridge will probably do the
same for another bridge.
464
Table 242. Comparison of In-Depth Inspection subsets.
Associated Inspector Subset
Task F Task H � � �
Riv
et C
orro
sion
Def
ect
Impl
ante
d D
efec
t
Bea
ring
Def
ect
Impa
ct D
amag
e
No
Def
icie
ncie
s
Wel
d C
rack
Ind
icat
ion
Bol
t Def
ect
Dis
tort
ion
Def
ect
Coa
ting
Def
ect
No
Def
icie
ncie
s
Overall 45% 10% 50% 17% 21% 16% 39% 11% 66% 18%
Rivet Corrosion Defect 100% 16% 58% 16% 0% 21% 26% 5% 68% 0%
Implanted Defect 75% 100% 50% 0% 0% 50% 50% 0% 50% 0% Bearing Defect 52% 10% 100% 5% 0% 19% 24% 5% 57% 14%
Impact Damage 43% 0% 14% 100% 0% 14% 57% 43% 71% 0%
Tas
k F
No Deficiencies 0% 0% 0% 0% 100% 0% 22% 11% 33% 44%
Weld Crack Indication 57% 29% 57% 14% 0% 100% 43% 0% 43% 0% Bolt Defect 29% 12% 29% 24% 12% 18% 100% 24% 65% 0% Distortion Defect 20% 0% 20% 60% 20% 0% 80% 100% 80% 0% Coating Defect 45% 7% 41% 17% 10% 10% 38% 14% 100% 0%
Insp
ecto
r Su
bset
Tas
k H
No Deficiencies 0% 0% 38% 0% 50% 0% 0% 0% 0% 100%
6.4.3. Routine Inspection Performance of In-Depth Inspection Subsets
In this section, the In-Depth Inspection subsets that were discussed previously are analyzed with
respect to their performance on the Routine Inspection tasks. Five general descriptors of
performance will be used in this analysis: Condition Rating accuracy, DFR accuracy, DFR
precision, written inspection note proficiency, and photographic documentation proficiency.
These five sets of data were the subject of much of the analysis presented previously in the
Routine Inspection Results section.
Table 243 summarizes the probability that inspectors from each of the In-Depth Inspection
subsets gave Condition Ratings that were not different from inspectors not in the particular

465
inspector subset. The probabilities shown in table 243 vary from 0 percent to 100 percent,
indicating a wide range of potential relationships.
Table 243. In-Depth inspector subset relationship with Routine Inspection Condition Ratings.
Deck Inspector Subset Task A Task B Task C Task D Task E Task G Rivet Corrosion Defect 25% 31% 81% 57% 60% 54% Implanted Defect 93% 68% 79% 27% 79% 100% Bearing Defect 58% 16% 63% 80% 55% 54% Impact Damage 45% 47% 22% 65% 79% 41% No Deficiencies (Task F) 67% 47% 45% 45% 57% 45% Weld Crack Indication 23% 41% 8% 93% 94% 36% Bolt Defect 19% 37% 37% 84% 94% 24% Coating Defect 99% 70% 36% 0% 90% 62% Distortion Defect 72% 28% 5% 12% 33% 68% No Deficiencies (Task H) 52% 24% 47% 9% 61% 17%
Superstructure Inspector Subset Task A Task B Task C Task D Task E Task G Rivet Corrosion Defect 14% 10% 15% 97% 83% 76% Implanted Defect 71% 97% 37% 16% 85% 65% Bearing Defect 5% 84% 85% 45% 89% 52% Impact Damage 11% 13% 93% 1% 59% 1% No Deficiencies (Task F) 20% 86% 53% 38% 69% 38% Weld Crack Indication 73% 96% 86% 61% 41% 82% Bolt Defect 85% 3% 25% 14% 91% 15% Coating Defect 73% 42% 48% 34% 86% 37% Distortion Defect 79% 97% 97% 47% 43% 15% No Deficiencies (Task H) 89% 69% 90% 16% 85% 33%
Substructure Inspector Subset Task A Task B Task C Task D Task E Task G Rivet Corrosion Defect 29% 59% 9% 93% 38% 7% Implanted Defect 83% 46% 24% 73% 71% 65% Bearing Defect 36% 13% 89% 12% 51% 1% Impact Damage 56% 31% 86% 3% 77% 90% No Deficiencies (Task F) 50% 79% 47% 67% 18% 0% Weld Crack Indication 37% 84% 31% 12% 17% 58% Bolt Defect 11% 13% 46% 3% 85% 54% Coating Defect 96% 67% 60% 11% 36% 94% Distortion Defect 91% 72% 55% 55% 100% 67% No Deficiencies (Task H) 82% 53% 83% 79% 47% 75%

466
Table 243 provides the following results. Note that the results pertaining to the Routine
Inspection superstructure are of the most interest due to their closer relationship to the In-Depth
Inspection results, which focus solely on superstructure inspections. It appears that inspectors
who identified the impact damage may have generally given statistically different Condition
Ratings for four of the six superstructures. Furthermore, a review of the Task A superstructure
data reveals three findings. First, there was a difference between inspectors noting the rivet
corrosion defect and those not noting this defect. This is expected given the fact that the Task A
bridge was also a riveted structure. Second, the bearing defect subset also appears to have
assigned statistically different Condition Ratings from those not noting the bearing defect. This
is again expected since the Task F and Task A bridges had similar bearing types. Third, the
Condition Ratings assigned by the impact damage subset differed from those inspectors who did
not identify this defect. Again, the Task A bridge also had impact damage and could have
contributed to the differences. On the other hand, there were no significant differences in the
Condition Ratings assigned by any of the subsets for Task E (i.e., the Routine Inspection of the
same bridge inspected in Task F).
Similar to the data presented in table 243, table 244 summarizes the probability that inspectors
from each of the In-Depth Inspection inspector subsets gave DFRs that were not different from
inspectors not in each of the inspector subsets. Two of the inspector subsets appear to have a
strong correlation with the DFR data: Impact Damage and Bolt Defect. Both of these subsets
had very low probabilities of not being different (2 and 3 percent, respectively) for the
superstructure DFR and relatively low probability for the general DFR (i.e., all elements). As
was discussed in the In-Depth Inspection Results section, the inspectors who identified the
impact damage defect were inspectors who, overall, tended to identify a larger than average
percentage of the general structural deficiencies. This type of inspection finding is very similar
to the findings that would normally be made during a Routine Inspection, thus possibly
accounting for the low probability. The identification of loose bolts, such as those identified by
the bolt defect group, is relatively straightforward and is another type of defect that might be
found during a Routine Inspection. In light of this, it appears logical that the inspectors
identifying the bolt defect could have assigned statistically different Condition Ratings for the
superstructures.

467
Table 244. In-Depth inspector subset relationship with Routine Inspection DFR.
Inspector Subset Deck Superstructure Substructure All Elements Rivet Corrosion Defect 86% 15% 90% 49% Implanted Defect 89% 65% 83% 93% Bearing Defect 69% 26% 37% 43% Impact Damage 18% 2% 29% 9% No Deficiencies (Task F) 48% 78% 97% 88% Weld Crack Indication 44% 100% 15% 41% Bolt Defect 18% 3% 10% 7% Coating Defect 29% 71% 91% 65% Distortion Defect 44% 19% 88% 44% No Deficiencies (Task H) 58% 72% 88% 85%
A review of the inspector DFR data, with respect to the precision of their assessments is given in
table 245. As in the previous discussion, the inspectors identifying the impact damage again
showed statistical differences in the dispersion data. The inspectors identifying the bearing
defect showed differences in their dispersion for the substructure. This may indicate that the
evaluation of bearings and substructures may be completed in a similar manner or may require
similar skills. Also, inspectors identifying a weld crack indication had a statistically different
precision in the evaluation of the decks. Inspectors identifying the coating defect tended to have
a statistically different precision when all element types were combined. This is probably
attributable to the fact that the coating defect was manifested in a number of different ways and
required the inspector to possess a number of different inspection skills. In a similar manner, a
number of different skills would be needed to evaluate all of the element types.
Table 245. In-Depth inspector subset relationship with dispersion on Routine Inspection DFR.
Inspector Subset Deck Superstructure Substructure All Elements Rivet Corrosion Defect 82% 41% 91% 52% Implanted Defect 45% 85% 62% 92% Bearing Defect 24% 44% 0% 1% Impact Damage 9% 19% 9% 15% No Deficiencies (Task F) 71% 24% 32% 18% Weld Crack Indication 8% 67% 97% 68% Bolt Defect 43% 27% 38% 62% Coating Defect 59% 86% 30% 8% Distortion Defect 60% 29% 97% 94% No Deficiencies (Task H) 100% 50% 97% 84%

468
The data in table 246 summarizes the relationship between the In-Depth Inspection subsets and
their Routine Inspection notes and photographic documentation performance. The table shows
that a number of subsets gave a statistically different number of inspection notes than those
inspectors not in those subsets. As expected, inspectors in the rivet corrosion defect subset and
the implanted defect subset took an overall larger number of notes, whereas those inspectors not
noting any deficiencies during the In-Depth Inspections took a statistically smaller number of
notes during the Routine Inspections. The only subset to show any differences in the
photographic documentation provided was the rivet corrosion defect subset. For reasons still
unclear, inspectors in this subset provided a statistically smaller number of photographs than
inspectors not in this subset.
Table 246. In-Depth inspector subset relationship with Routine Inspection documentation.
Inspector Subset Inspection Notes Photographic Documentation
Rivet Corrosion Defect 0% 6% Implanted Defect 6% 45% Bearing Defect 37% 72% Impact Damage 78% 87% T
ask
F
No Deficiencies 3% 52%
Weld Crack Indication 31% 31% Bolt Defect 36% 60% Coating Defect 89% 47% Distortion Defect 47% 30% T
ask
H
No Deficiencies 5% 56%
6.4.4. In-Depth Inspection Defect Assessment of Routine Inspection Subsets
This section examines any relationships that may be present between the Routine Inspection
subsets and their ability to correctly identify In-Depth Inspection deficiencies. The same 12
Routine Inspection subsets as presented previously in this chapter are used here. The In-Depth
Inspection subsets are also the same as previously discussed.
Table 247 presents the percentage of each Routine Inspection subset that falls into the In-Depth
Inspection subset. The Routine Inspection subsets are presented in the rows and the In-Depth

469
Inspection subsets are presented in the columns. For comparison, this table provides a row that
contains the percentage of the overall sample that are in each In-Depth Inspection subset.
Table 247. Comparison of Routine Inspection subsets with In-Depth Inspection results.
� Task F Task H
�
Riv
et C
orro
sion
Def
ect
Impl
ante
d D
efec
t
Bea
ring
Def
ect
Impa
ct D
amag
e
No
Def
icie
ncie
s
Wel
d C
rack
Ind
icat
ion
Bol
t Def
ect
Dis
tort
ion
Def
ect
Coa
ting
Def
ect
No
Def
icie
ncie
s
Overall 45% 10% 50% 17% 21% 16% 39% 11% 66% 18%
High Accuracy (Overall) 43% 14% 43% 14% 14% 14% 36% 7% 43% 29%
Low Accuracy (Overall) 50% 0% 83% 0% 0% 0% 33% 0% 83% 17%
High Accuracy (Superstructure) 35% 10% 30% 20% 30% 20% 30% 10% 45% 25%
Low Accuracy (Superstructure) 33% 0% 56% 11% 22% 0% 44% 11% 67% 22%
High Precision (Overall) 14% 7% 21% 14% 36% 7% 29% 21% 57% 21%
Low Precision (Overall) 29% 14% 86% 0% 14% 29% 29% 0% 43% 29%
High Precision (Superstructure)
40% 7% 33% 0% 27% 13% 20% 7% 53% 13%
Low Precision (Superstructure) 60% 0% 50% 20% 10% 10% 30% 10% 70% 10%
Large Number of Photos Taken 23% 8% 38% 15% 23% 0% 54% 8% 77% 23%
Small Number of Photos Taken 55% 9% 27% 9% 18% 36% 27% 9% 27% 18%
Large Number of Notes Taken 64% 18% 64% 18% 0% 18% 9% 9% 64% 18%
Small Number of Notes Taken 13% 0% 38% 13% 44% 0% 25% 6% 38% 38%
There are relatively few overall trends evident within these results. In general, there does not
seem to be a strong relationship between these Routine Inspection subsets and the In-Depth
Inspection subsets. However, two of the Routine Inspection attributes tend to show some slight
correlation. First, table 247 shows that the inspectors that exhibited high precision, both overall
and specifically with regard to the superstructure, tended to correctly identify slightly fewer of
the In-Depth Inspection deficiencies. Second, there is a relatively strong correlation with the
inspectors who took a small number of notes. These inspectors tended to locate significantly
fewer of the In-Depth Inspection deficiencies than the overall inspector sample. This result was

470
not unexpected given the reliance of In-Depth Inspection on handwritten, defect-specific
inspector’s notes.
6.5. STATE-DEPENDENT TASKS
Many of the results from the Routine and In-Depth Inspection tasks have been presented in terms
of the accuracy of the inspection and the factors affecting the inspection. Since the primary goal
of the State-dependent tasks was different from the goals of the Routine and In-Depth Inspection
tasks, these tasks will be discussed in a different manner. The State-dependent tasks will be
discussed primarily in terms of procedural and reporting differences between States, with
comments about inspection accuracy as appropriate.
6.5.1. State-Dependent Routine Inspection Task
Task I, the Routine Inspection of the Van Buren Road Bridge, was performed in a similar
manner by each of the inspection teams. The majority of the differences can be classified as
either procedural differences or reporting differences.
6.5.1.1. PROCEDURAL DIFFERENCES
Observing differences in the procedural methods used by different States to complete this task
was one of the goals of this study. Interaction between team members was one area where
differences existed. About half of the teams that participated were assembled specifically for
this study, while others were regular partners. It was observed that most of the assembled teams
worked as equals, while most of the pre-existing teams had a clear leader in charge of the
inspection. Assembled teams were also observed to fall into two of the three division of labor
categories, either to work together or to work independently. No clear trend was observed for
the division of labor for the pre-existing teams. The markedly different styles between the
assembled teams and the pre-existing teams may imply that the assembled teams might have
performed an inspection different from their regular State procedures. Regardless, neither the
relationship aspect nor the division of labor aspect were found to influence the Condition Ratings
assigned to the bridge.

471
The level of preparation prior to arrival at the bridge site was another procedural aspect that was
studied. Teams were classified into one of three groups based on the preparation apparent in the
work product submitted. The categories were No Preparation Observed, Some Preparation
Observed, and Indeterminate Preparation. The members of the Indeterminate Preparation group
all submitted computer-generated reports without any intermediate work products. Only a
quarter of the teams showed evidence of preparation in the work products submitted. Although
one element of one group showed a statistical difference from the teams not in that group, no
clear trend was observed that showed that any of these methods of preparation affected the
Condition Ratings assigned.
Finally, nine teams performed a deck delamination survey as part of their regular Routine
Inspection. Another seven teams indicated that deck delamination surveys are either handled by
a different organization or that all bridges in their State have an asphalt overlay. The remaining
eight teams performed some sounding, but did not perform enough sounding to determine the
extent of the deterioration.
6.5.1.2. REPORTING DIFFERENCES
One of the other primary aspects of the State-dependent tasks was to investigate reporting
differences between the various States. Differences were observed in the presentation of the
reports and in some of the element-level data that were presented; however, most of the reporting
differences were minor. Some of the more significant differences are discussed below.
The reports themselves varied quite drastically in appearance and length. However, examination
of the reports showed that nearly all of the same information is present in each report. Final
reports were submitted that were either written in the field or generated on computer (either in
the field or in the office). Also, some teams only submitted an intermediate report. These
reports contained all of the data necessary for a complete report, but in a less complete form than
normal. An analysis showed that there was no statistical difference in the Condition Ratings
assigned by teams using different reporting styles.

472
Photographic documentation was another component of the submitted reports. Fourteen teams
either submitted photographs or submitted a log of the photographs that would have been taken
had they had a camera available. Results were similar to those obtained from Task D. Overall
photographs of the elevation and of the approach (including the deck) were taken by about two-
thirds of the teams. Photographs showing details were not taken as frequently, with girder and
railing photographs being the most common local condition photographs taken.
More than half of the teams submitted element-level data. Most, but not all, of the teams that
submitted element-level data used a format compatible with the Pontis system. Major CoRe
elements were used fairly consistently and, in general, correctly. Some deviations were observed
with the units used and in the manner in which some of the Condition States were apparently
defined. The most common difference was the substitution of area units for the deck elements.
Of greater concern was the splitting of the deck quantity over multiple Condition States. It has
not been determined whether the Condition States have been redefined by those States, or
whether it was a mistake on the part of the individual inspectors. The other primary elements
were used with much more variation, specifically the multiple joint and railing elements that
were selected. However, given the condition of the joints and the constraints imposed on the
inspectors, the joint inconsistencies may not be significant. Inconsistencies in railing element
selection are more difficult to explain. Although the CoRe element guide very clearly indicates
that railing of multiple materials should be listed as a combination railing, many teams tracked
the railing with the other elements. It is unclear whether some of the States have redefined
railing elements or whether inspector error caused the inconsistencies. Sub-elements were used
by some of the teams, allowing tracking of additional information. These sub-elements appeared
to have been used properly. Many teams also used non-CoRe elements, and since these elements
are not defined nationally, it was expected that they would vary from State to State. Finally,
“smart flags” were used by several teams.
6.5.2. State-Dependent In-Depth Inspection Task
An In-Depth Inspection of the deck of the Van Buren Road Bridge was the other State-dependent
task. Teams were asked to perform a delamination survey on the southern two spans.

473
6.5.2.1. PROCEDURAL DIFFERENCES
The various teams performed this task using basically similar methods. Almost all of the teams
used the chain to survey the deck. About half of the teams used a sounding hammer to refine the
shape of the areas found by the chain. Generally, one inspector chained while the other took
notes, and typically, both inspectors took turns performing the sounding.
Another procedural difference observed was the philosophy of how to find the delaminations.
Some teams only tried to “box in” every delamination they found with a rectangular shape, thus
not attempting to identify the exact outline of the delaminations. Others spent a considerable
amount of time attempting to identify the actual outline of the delaminated areas. As can be
expected by these two philosophies, the delamination percentages indicated by the actual outline
group tended to be much smaller than those assigned by the rectangular outline group.
6.5.2.2. ACCURACY OF THE IN-DEPTH INSPECTION
The results of this In-Depth Inspection show that only a small percentage of the inspection teams
provided an accurate measurement of the level of deck deterioration. The NDEVC determined
that the deck was approximately 19 percent delaminated. If an allowance of ± 5 percentage
points is permitted as reasonable error (between 14 and 24 percent delaminated), only 5 of the 22
teams had estimates falling within this range. However, two limitations were discovered in the
course of the administration of this inspection task that may have affected the results. To
preserve the deck in the same condition for all participating inspectors, a prohibition was placed
on marking the surface of the deck. This may have led to inaccuracies in the recording of
delamination size and position. In addition, data sheets were provided on unlined paper,
showing only a scaled drawing of the outline of the deck spans. The use of graph paper may
have increased positioning accuracy.
Some of the possible reporting accuracy problems can be addressed in the analysis. Additive
overlays of the delamination maps can be created and unique and low-frequency delamination
calls can be filtered out. Although the overall average delamination percentage indicated by the
teams was 13 percent, the amount of deck area covered by the union of all the delamination areas
was 69 percent. This number can be reduced to 40 percent by filtering out areas with only one or

474
two delamination calls, or further reduced to 21 percent by filtering out areas with four or fewer
delamination calls. The areas of the deck with at least five delamination calls had relatively
good correlation in quantity and location with the delamination map determined by the NDEVC.
In addition, only about 0.4 m2 of the deck had at least 15 layers of common delamination calls.
475
7. CONCLUSIONS AND RECOMMENDATIONS
7.1. GENERAL
The Visual Inspection (VI) method is, by far, the predominant nondestructive evaluation
technique used in bridge inspections. However, since implementation of the National Bridge
Inspection Standards in 1971, a comprehensive study of the reliability of VI as it relates to bridge
inspections had not been undertaken. Given these facts and the understanding that VI may have
limitations that affect its reliability, the FHWA Nondestructive Evaluation Validation Center
(NDEVC) initiated a comprehensive study to examine the reliability of the VI method as it is
currently practiced in the United States.
The general goal of this study was to examine the reliability of VI of highway bridges. As such,
the reliability was studied within the context of its normal application. This study focused on the
two most commonly completed inspections: Routine and In-Depth Inspections. In order to
ensure that this study would be applicable, the inspection results were studied in the forms in
which they are normally manifested. Specifically, for the Routine Inspections, Condition
Ratings for the deck, superstructure, and substructure, as defined in the Bridge Inspector’s
Training Manual 90, were used. The Condition Rating system requires that inspectors assign a
rating from 0 to 9 that reflects the structural capacity of a bridge and describes any structural
deficiencies and the degree to which they are distributed. For the In-Depth Inspections, the
inspection results were evaluated based solely on the inspector’s field notes. These field notes
were a reflection of the specific deficiencies that were identified.
To accomplish the study goals, the investigation consisted of a literature review, a survey of
bridge inspection agencies, and a series of performance trials using State department of
transportation bridge inspectors. The performance trials were completed by 49 State bridge
inspectors who completed 6 Routine Inspections, 2 In-Depth Inspections, and 2 inspections
following their respective State procedures. Extensive information was collected about the
inspectors and the environments in which they worked. This information was then used to study
their relationship with the inspection results.
476
7.2. CONCLUSIONS
The following conclusions are based on the research presented in this report:
1. Professional Engineers are typically not present on site for inspections. In the results
of the State-of-the-Practice Survey, 60 percent of the State respondents indicated that a
Professional Engineer was on site for less than 40 percent of the inspections.
2. Vision testing for inspectors is almost non-existent, with any employment-related
vision tests (i.e., driver’s license vision tests) being administered to satisfy other job
requirements. In the State-of-the-Practice Survey, only two State respondents indicated
that their inspectors had their vision tested.
3. Visual Inspection is the most frequently used nondestructive evaluation technique
for concrete, steel, and timber bridges. In addition, some novel nondestructive
evaluation techniques, such as acoustic emission, radar, and thermography, are
being used by State departments of transportation. These conclusions refer to the
State-of-the-Practice Survey that asked questions regarding nondestructive evaluation
technique use and those techniques that are used most frequently.
4. State departments of transportation and Iowa county departments of transportation
feel that concrete deck research and prestressed concrete superstructure research
have the most pressing need for future research. From the results of the State-of-the-
Practice Survey, prestressed concrete superstructures were the top research response
among the States. Concrete decks were the top research response among the Iowa
counties, as well as nearly half of the State respondents.
5. When asked, many inspectors did not indicate, and may not have identified, the
presence of important structural aspects of the bridge that they were inspecting.
These would include such things as support conditions, skew, and the identification of
fracture-critical members. Specifically, on average, less than 25 percent of the inspectors
correctly indicated the support conditions. Also, less than 10 percent of the inspectors
correctly indicated the presence of skew when it existed. Finally, less than half of the
inspectors indicated that a particular fracture-critical bridge was indeed fracture-critical.
Knowledge of these aspects may be essential for the full completion of an inspection.
6. There is significant variability in the amount of time inspectors predicted that they
would need to perform a bridge inspection, as well as in the time inspectors actually

477
took to complete the inspection. Predicted inspection times for both Routine and In-
Depth Inspections ranged from a few minutes to a number of hours. Actual inspection
times ranged from a small fraction of the times allotted for the inspections up to the full
times.
7. Routine Inspections are completed with significant variability. The variability is
most prominent in the assignment of Condition Ratings, but is also present in inspection
documentation. As evidence, recall that, on average, between four and five different
Condition Rating values were assigned to each primary element, with a maximum of six.
In addition, although, on average, the inspectors provided just over seven photographs,
there were only four photographs that were taken by more than half of the inspectors.
There is also significant variability in the frequency with which field notes are taken.
8. Ninety-five percent of the primary element Condition Ratings for individual bridges
will vary within two rating points of the average. Similarly, only 68 percent of these
ratings will vary within one rating point. Recall that the distribution of the sample
Condition Ratings was found to be normal. This finding allows the sample results to be
extrapolated to the general population of bridge inspectors. This analysis takes into
account the natural variations in the sample and extends them to the population, resulting
in a predicted range of Condition Rating results.
9. Inspectors are hesitant to assign “low” or “high” Condition Ratings and, as a result,
tend to be grouped toward the middle of the Condition Rating scale. Recall that
inspectors tended to rate lower than the reference Condition Rating for better condition
elements and higher than the reference Condition Rating for poorer condition elements.
This resulted in a significant portion of the ratings being clustered between a 5 and a 7
Condition Rating, inclusive.
10. The National Bridge Inspection Standards Condition Rating system definitions may
not be refined enough to allow for reliable Routine Inspection results. In addition,
with the exception of some bridge management software, Condition Rating values
are generally not assigned through the use of a rational approach. This general
conclusion is based on the inconsistencies found to exist in the Condition Rating
assignment, as well as the fact that the inaccuracies were greatest over a discrete range of
Condition Ratings. Furthermore, it was observed by the NDEVC staff that most

478
inspectors did not approach the condition assessments with a formulated, systematic
approach.
11. A number of factors appear to correlate with the Routine Inspection results. In this
study, they include factors related to Reported Fear of Traffic, Near Visual Acuity, Color
Vision, Formal Bridge Inspection Training, Light Intensity, Reported Structure
Maintenance Level, Reported Structure Accessibility Level, Reported Structure
Complexity Level, Inspector Rushed Level, and Wind Speed.
12. In-Depth Inspections are not likely to detect and identify the specific types of defects
for which this inspection is sometimes prescribed. For example, in Task H, more than
300 inspections were performed on details containing small, weld crack indications. Only
12 correct indication identifications resulted from these inspections. These 12 calls were
made by a total of 7 inspectors, while the remaining 37 inspectors who completed the
task did not make any correct calls. Also, within Task F, only 3 of the 42 inspectors who
completed the task identified the implanted tack weld crack indication.
13. A significant proportion of the In-Depth Inspections will not reveal deficiencies
beyond those that could be noted during a Routine Inspection. Detailed observations
of the methods inspectors used to complete Task H show that approximately 40 percent
of the inspectors performed cursory inspections of many of the critical welded
connections.
14. A number of factors appear to relate to In-Depth Inspection results. The overall
thoroughness with which inspectors completed Task H tended to have an effect on the
likelihood of an inspector detecting weld crack indications. In addition, factors related to
time to complete inspection, inspector comfort with access equipment and heights,
structure complexity and accessibility, inspector viewing of welds, flashlight use, and
number of annual bridge inspections provided some relationship to the In-Depth
Inspection results.
15. There appears to be some correlation between subsets of inspectors who note certain
In-Depth Inspection deficiencies. Specifically, inspectors who find small, detailed
defects are more likely to do so regardless of the bridge. Also, inspectors who find gross
dimensional defects (such as distortions or impact damage) are more likely to do so on
other bridges as well. Finally, inspectors who find fewer than the average number of

479
defects found on one bridge are likely to do so on other bridges. All of these findings are
based on comparisons between the various subsets of inspectors who provided certain
findings in Tasks F and H.
16. The detail of documentation of the findings that an inspector provides for one
inspection, including notes and photographs, is likely to be similar to that provided
for another inspection. Inspectors who take relatively few notes during Routine
Inspections tend to indicate the presence of fewer deficiencies during In-Depth
Inspections. Also, individual inspectors tend to rely more heavily on either written or
photographic documentation, but not both.
17. Most States follow similar inspection procedures and provide the same general
information in their inspection reports. Similar levels of inspection were observed
from the teams performing the State-dependent Routine and In-Depth Inspections. The
presentation of the inspection reports varied considerably, but the same basic data were
present within each report.
18. Use of the element-level inspection elements was generally consistent with the
AASHTO Guide for Commonly Recognized (CoRe) Structural Elements, with several
notable exceptions. Element-level data for the State-dependent Routine Inspection were
presented by about two-thirds of the States in this study. Use of the major deck,
substructure, and superstructure elements is fairly consistent, with some possible
inconsistencies. Inconsistencies observed in this study included the use of units, the
division of quantities, and the definitions of the Condition States. Some of these
inconsistencies may be due to re-definitions of the elements by the individual States to
suit their needs. Element-level data for the other primary elements are also typically
provided. However, these elements may be used much less consistently. Inspectors
appear to have some problems with the coding of the other primary elements.
19. Few bridge inspection teams perform an in-depth-level delamination survey as part
of their Routine Inspection. As an example, in this study, only 39 percent of the teams
performed the delamination survey of the Van Buren Road Bridge deck as part of their
Routine Inspection. However, many departments of transportation may have other
divisions within their States that are responsible for delamination surveys.

480
20. There are inaccuracies in in-depth-level delamination survey assessments. As an
example, in this study, only 5 of the 22 teams that performed Task J provided deck
delamination estimates that fell within 5 percentage points of that determined by the
Nondestructive Evaluation Validation Center. Some limitations from the task itself may
have contributed to this poor performance. Eliminating delaminated areas indicated by
less than a quarter of the sample produced a delamination map fairly consistent with that
determined by the Nondestructive Evaluation Validation Center.
7.3. RECOMMENDATIONS
The research conducted for this study and the conclusions presented above suggest a number of
recommendations:
1. The accuracy and reliability of Routine Inspections may be greatly increased by revising
the Condition Rating system. Additional work is needed to clearly define the source(s) of
the inaccuracies.
2. The accuracy and reliability of In-Depth Inspections could be increased through
increased training of inspectors in the types of defects that should be identified and the
methods that would frequently allow this identification to be possible. Clearly, there is
some need for an increased inspector knowledge base with regard to the types of defects
that frequently occur and the methods recommended to aid in the identification of these
defects. In addition, more clearly defined inspection procedures that outline systematic
search criteria and methods may increase inspection accuracy.
3. The accuracy and reliability of both Routine and In-Depth Inspections could be further
increased by considering the identified factors in the selection and training of inspectors.
Furthermore, bridge design practices should put a greater emphasis on the ease with
which the bridge could be inspected (i.e., accessibility, complexity, etc). Additional
research into each of these factors is needed to establish useful guidelines.
4. More research should be performed to determine whether ensuring minimum vision
standards (with corrective lenses, if necessary) through vision testing programs would
benefit bridge inspection.
5. Further examination of the types and sizes of specific defects that are likely to be
identified during an In-Depth Inspection is warranted. Specifically, a study of the various

481
types of defects that could occur in concrete superstructures, as well as the various
different sizes of defects that could occur in steel superstructures, is warranted.
6. More research should be performed to determine the accuracy with which the CoRe
elements are used in the field. This could determine which parts of the element use
variations are attributable to State re-definitions and which parts are due to lack of proper
training of the inspectors.
7. Further study of deck delamination surveys should be performed. This research should
investigate both team and individual detection abilities, as well as difficulties inherent in
the reporting process. In addition, this research could compare mechanical sounding
delamination detection techniques to many other nondestructive evaluation techniques.


483
REFERENCES
1. Code of Federal Regulations, National Bridge Inspection Standards – 23CFR650. U.S. Government Printing Office via GPO Access, revised April 1, 1998, pp. 238-240.
2. Phares, B.M., G.A. Washer, and M.E. Moore. “The FHWA’s NDE Validation Center: A
National Resource,” Transportation Research Record 1680. Transportation Research Board, Washington, DC.
3. Manual for Condition Evaluation of Bridges, 1994. American Association of State
Highway and Transportation Officials, Washington, DC, 1994. 4. Bridge Inspector’s Training Manual 90. Federal Highway Administration, McLean, VA,
1995. 5. AASHTO Guide for Commonly Recognized (CoRe) Structural Elements. American
Association of State Highway and Transportation Officials, Washington, DC, 1997. 6. Caltrans Unpublished Data. 7. The American Society for Nondestructive Testing, Recommended Practice No. SNT-TC-1A,
1996. The American Society for Nondestructive Testing, Columbus, OH, 1996. 8. Rens, K.L., T.J. Wipf, F.W. Klaiber. “Review of Nondestructive Evaluation Techniques of
Civil Infrastructure,” Journal of Performance of Constructed Facilities, Vol. 11, No. 4, November 1997, pp. 152-160.
9. Rens, K.L. and D.J. Transue. “Recent Trends in Nondestructive Inspections in State
Highway Agencies,” Journal of Performance of Constructed Facilities, Vol. 12, No. 2, May 1998, pp. 94-96.
10. Purvis, R.L. “Inspection of Fracture-Critical Bridge Members,” Transportation Research
Record 1184. Transportation Research Board, Washington, DC. 11. Estes, A.C. “A System Reliability Approach to the Lifetime Optimization of Inspection and
Repair of Highway Bridges.” Thesis, University of Colorado, 1997. 12. Purvis, R.L. “Bridge Safety Inspection Quality Assurance,” Transportation Research
Record 1290. Transportation Research Board, Washington, DC. 13. Purvis, R.L. and H.P. Koretzky. “Bridge Safety Inspection Quality Assurance:
Pennsylvania Department of Transportation,” Transportation Research Record 1290. Transportation Research Board, Washington, DC.

484
14. Smith, C. and P.L. Walter. “Revisiting the Aging Aircraft Nondestructive Inspection Validation Center – A Resource for the FAA and Industry,” Materials Evaluation, Vol. 53, No. 8, August 1995, pp. 900-902.
15. Spencer, F.W. Visual Inspection Research Project Report on Benchmark Inspections. U.S.
Department of Transportation, Federal Aviation Administration, Washington, DC, 1996.
16. Endoh, S., H. Tomita, H. Asada, and T. Sotozaki. “Practical Evaluation of Crack Detection Capability for Visual Inspection in Japan,” Durability and Structural Integrity of Airframes: Proceedings of the 17th Symposium of the International Committee on Aeronautical Fatigue, June 9-11, 1993.
17. Schoonard, J.W., J.D. Gould, and L.A. Miller. “Studies of Visual Inspection,” Ergonomics,
Vol. 16, No. 4, 1973, pp. 365-379. 18. Jamieson, G.H. “Inspection in the Telecommunications Industry: A Field Study of Age and
Other Performance Variables,” Ergonomics, Vol. 9, No. 4, 1966, pp. 297-303. 19. Spencer, F.W. and D. Schurman. Reliability Assessment at Airline Inspection Facilities,
Volume III: Results of an Eddy Current Inspection Reliability Experiment. Department of Transportation, Federal Aviation Administration, Washington, DC, 1995.
20. Rummel, G. and G. Matzkahnin. NDE Capabilities Data Book, 3rd Edition. Nondestructive
Testing Information Analysis Center, NTIAC-DB-97-02, 1997. 21. Megaw, E.D. “Factors Affecting Visual Inspection Accuracy,” Applied Ergonomics, March
1979, pp. 27-32. 22. Johnston, D.M. “Search Performance as a Function of Peripheral Acuity,” Human Factors,
December 1965, pp. 527-535. 23. Erickson, R.A. “Relationship Between Visual Search Time and Peripheral Visual Acuity,”
Human Factors, April 1964, pp. 165-177. 24. Ohtani, A. “An Analysis of Eye Movements During a Visual Task,” Ergonomics, Vol. 14,
No. 1, 1971, pp. 167-174. 25. Fox, J.G. “Background Music and Industrial Efficiency – A Review,” Applied Ergonomics,
June 1971, pp. 70-73. 26. Poulton, E.C. “Arousing Stresses Increase Vigilance.” NATO Conference Series: III,
Human Factors, Vol. 3, 1977, pp. 423-459. 27. Colquhoun, W.P. The Effect of Short Rest-Pause on Inspection Efficiency. Medical
Research Council, Applied Psychology Research Unit, Cambridge.

485
28. Deaton, M., J.S. Tobias, and R.T. Wilkinson. “The Effect of Sleep Deprivation on Signal Detection Parameters,” Quarterly Journal of Experimental Psychology, Vol. 23, pp. 449-452.
29. Lintern, G. “Field Independence, Intelligence, and Target Detection,” Human Factors, Vol.
18, No. 3, 1976, pp. 293-298. 30. Pond, D.J., D.T. Donohoo, and R.V. Harris, Jr. An Evaluation of Human Factors Research
for Ultrasonic Inservice Inspection. Division of Engineering Technology, Office of Nuclear Regulatory Research, Washington, D.C., 1998.
31. Mitten, L.G. “Research Team Approach to an Inspection Operation,” Introduction to
Operations Research – Chapter 3. 32. Gallwey, T.J. and C.G. Drury. “Task Complexity in Visual Inspection,” Human Factors,
Vol. 28, No. 5, 1986, pp. 595-606. 33. Faulkner, T.W. and T.J. Murphy. “Lighting for Difficult Visual Tasks,” Human Factors,
Vol. 15, No. 2, 1973, pp. 149-162. 34. Mackworth, N.H. “Visual Noise Causes Tunnel Vision,” Psychonomic Science, Vol. 3,
1965, pp. 67-68. 35. Sheehan, J.J. and C.G. Drury. “The Analysis of Industrial Inspection,” Applied Ergonomics,
June 1971, pp. 74-78. 36. Noro, K. “Analysis of Visual and Tactile Search in Industrial Inspection,” Ergonomics,
Vol. 27, No. 7, 1984, pp. 733-743. 37. Thomas, L.F. and A.E.M. Seaborne. “The Socio-Technical Context of Industrial
Inspection.” 38. Lion, J.S., E. Richardson, D. Weightman, and R.C. Browne. “The Influence of the Visual
Arrangement on Material, and of Working Singly or in Pairs, Upon Performance at Simulated Industrial Inspection,” Ergonomics, Vol. 18, No. 2, 1975, pp. 295-304.
39. Gallwey, T.J. “Selection Tests for Visual Inspection on a Multiple Fault Type Task,”
Ergonomics, Vol. 25, No. 11, 1982, pp. 1077-1092. 40. Tiffin, J. and H.B. Rogers. “The Selection and Training of Inspectors,” Personnel, Vol. 18,
1941. 41. Riley, J.N., E.P. Papadakis, and S.J. Gorton, “Availability of Training in Visual Inspection
for the Air Transport Industry,” Materials Evaluation, 1996, pp. 1368-1375.

486
42. Chaney, F.B. and K.S. Teel. “Improving Inspector Performance Through Training and Visual Aids,” Journal of Applied Psychology, Vol. 51, No. 4, 1967, pp. 311-315.
43. Phares, B.M. “A Design Methodology for a Low-Volume Road Bridge Alternative: Steel
Beam Precast Units.” Dissertation, Iowa State University, 1998.