6 sigma on golf course
DESCRIPTION
golfTRANSCRIPT

Page 1
6-Sigma Program& Concepts Overview
Presenters:
P. Pfaff
H. Myrie
K. Barker
Project Phases:
Measure
Analyze
Improve
Control
6

Page 2
6
Meet Larry.Larry is a golfer.
His play is,shall we say,
erratic?
He wants to playmore consistently.

Page 3
6-Sigma Example - Measure Phase
What is the output of Larry’s game?
Specification: Larry wants to shoot between 80 and 100 this season, with a target average score of 90.
Larry’s Golf Game
Run Chart of Larry's Scores
60
70
80
90
100
110
120
1/15 2/5
2/10
2/24
2/26 3/3
3/23
4/13
4/20
4/27
5/13
5/19
5/27 6/2
6/7
Date
Sco
re
Date Score1/15 1022/5 108
2/10 1032/24 922/26 943/3 91
3/23 934/13 924/20 1064/27 1005/13 1065/19 1075/27 1116/2 1086/7 104

Page 4
6-Sigma Example - Measure Phase
What is his process
capability?
How does this relate to his ZLT (Long Term) and ZST (Short Term)?
ZLT = (Cpk x 3) = -0.15 Process
ZST = (Cp x 3) = 5.64 Process**(Best Process Cp - Sources of Variation Eliminated)
Goal: Reduce the variation and move the average in Larry’s game.
12011511010510095908580
Upper SpecLower Spec
Score
s
Mean-3s
Mean+3s
Mean
n
k
LSL
USL
Targ
Cpm
Ppk
PPL
PPU
Pp
0
1158
600000
564887
0.00
0.12
60.00
56.49
Obs
PPM<LSL Exp
Obs
PPM>USL Exp
Obs
%<LSL Exp
Obs
%>USL Exp
6.937
80.322
121.945
101.133
15.000
1.113
80.000
100.000
*
*
-0.05
1.02
-0.05
0.48
Larry's Long Term Capability
100.097.595.092.590.087.585.082.580.0
Upper SpecLower Spec
ShrtTrm
s
Mean-3s
Mean+3s
Mean
n
k
LSL
USL
Targ
Cpm
Cpk
CPL
CPU
Cp
0
0
0
9
0.00
0.00
0.00
0.00
Obs
PPM<LSL Exp
Obs
PPM>USL Exp
Obs
%<LSL Exp
Obs
%>USL Exp
1.7730
87.0809
97.7191
92.4000
5.00
0.24
80.00
100.00
*
*
1.43
2.33
1.43
1.88
Larry's Short Term Capability
Cpk = -0.05 !!!
Cp = 1.88

Page 5
6-Sigma Example - Measure Phase
How do we determine the opportunity for improvement for Larry’s Game?
6.03.00
0
1.5
3.0
Con
trol
(Z
shif
t)
Technology/Skills (ZST)
ZST = 5.64ZLT = -0.15
ZSHIFT = 5.79
(ZSHIFT = ZST - ZLT)
Goal
Larry is Here
This means: Just by improving his control, Larry can achieve a 5.5 sigma game. If he wants a 6 sigma game he will also have to improve his skills.
This means: Just by improving his control, Larry can achieve a 5.5 sigma game. If he wants a 6 sigma game he will also have to improve his skills.
ImproveControl
ImproveSkills

Page 6
6-Sigma Example - Measure Phase
Let’s analyze his game by breaking down his score.Where is the biggest opportunity in his overall game?
Let’s analyze his game by breaking down his score.Where is the biggest opportunity in his overall game?
LongSho rt
47077737.762.3
100.0 62.3
1000
500
0
100
80
40
20
0
Shot Type
CountPercentCum %
Cou
n t
Larry’s Golf Game
He takes more shotsin his short game (62.3%).
He takes more shotsin his short game (62.3%).

Page 7
6-Sigma Example - Measure Phase
Let’s continue analyzing his game by breaking it down further.Where is the biggest opportunity in his short game?
Let’s continue analyzing his game by breaking it down further.Where is the biggest opportunity in his short game?
C h ipsPu tts
25752033.166.9
100.0 66.9
800
700
600
500
400
300
200
100
0
100
80
40
20
0
Shot Type
CountPercentCum %
Co
un t
Larry’s Short Game
He takes more shotsin his putting game (66.9%).
He takes more shotsin his putting game (66.9%).

Page 8
6-Sigma Example - Measure Phase
Material Larry
Environment Methods Machine
Putting Score
Cause & Effect Diagram - Larry’s Putting Game
Measurement
What are the causes of variation in Larry’s Putting Game? What are the causes of variation in Larry’s Putting Game?

Page 9
6-Sigma Program& Concepts Overview
Project Phases:
Measure
Analyze
Improve
Control
6
Presenters:
P. Pfaff
H. Myrie
K. Barker

Page 10
6-Sigma Example - Analyze Phase
Material Larry
Environment Methods Machine
Putting Score
Cause & Effect Diagram - Larry’s Putting Game
Measurement
What are the causes of variation in Larry’s Putting Game? What are the causes of variation in Larry’s Putting Game?
> Golf Course> Green Condition
> Time of Day> Weather
> Playing Partners> Betting of Hole
>Number of Drinks > Eye Glasses Prescription Updated
> Properly Rested
> Grass Type>Cheat at Counting> Can’t Remember
> Pencil has an eraser
> Putting Style- Stance
-Grip- Swing
> Reading the Green
>Putter Type> Ball Type
> Shoes> Glove

Page 11
6-Sigma Example - Analyze Phase
Is putting really a significant source of variation in the overall golf score? Is putting really a significant source of variation in the overall golf score?
50454035
130
120
110
100
90
Putts
Sco
re
Y = 33.1284 + 1.67546X
R-Squared = 0.906
The R-Squared value saysthat 90.6% of the variationin the Overall Score isdirectly related to theputting game.
The R-Squared value saysthat 90.6% of the variationin the Overall Score isdirectly related to theputting game.
Yes!!!
ScatterPlot/Fitted Line Regression

Page 12
6-Sigma Example - Analyze Phase
Let’s figure out what is causing the variation in his putting game. . . Let’s figure out what is causing the variation in his putting game. . .
Run Chart of Larry's Scores
60
70
80
90
100
110
120
1/1
5
2/5
2/1
0
2/2
4
2/2
6
3/3
3/2
3
4/1
3
4/2
0
4/2
7
5/1
3
5/1
9
5/2
7
6/2
6/7
Date
Sco
re
What did Larry dodifferently duringthis time frame?
What did Larry dodifferently duringthis time frame?

Page 13
6-Sigma Example - Analyze Phase
6543210
54
44
34
Drinks
Pu t
ts
Y =
If he gave up drinking, does the number of drinks directly affect his putting?If he gave up drinking, does the number of drinks directly affect his putting?
R-Squared = 0.872
The R-Squared value saysthat 87.2% of the variationin Putting is directly related to the number of drinks he had.
The R-Squared value saysthat 87.2% of the variationin Putting is directly related to the number of drinks he had.
Yes!!!
ScatterPlot/Fitted Line Regression
36.25 + 2X

Page 14
6-Sigma Example - Analyze Phase
Conclusions
• Larry should putt, or drink, but not both!
• If Larry gives up drinking while golfing he will have addressed 87.2% of the variation in his putting game.
• By bringing his putting game under control he will achieve a 5-sigma game.
• To achieve a 6-sigma game we will have to do further investigations.

Page 15
6-Sigma Program& Concepts Overview
Project Phases:
Measure
Analyze
Improve
Control
6
Presenters:
P. Pfaff
H. Myrie
K. Barker

Page 16
6-Sigma Example - Improve Phase
Material Larry
Environment Methods Machine
Putting Score
Cause & Effect Diagram - Larry’s Putting Game
Measurement
Last time we determined drinks was a significant X. What other sources also drive the Putting Score?
Last time we determined drinks was a significant X. What other sources also drive the Putting Score?
> Golf Course> Green Condition
> Time of Day> Weather
> Playing Partners> Betting of Hole
>NUMBER OF DRINKS > Eye Glasses Prescription Updated
> Properly Rested
> Grass Type
> Putting Style- Stance
-Grip- Swing
> Reading the Green
>Putter Type> Ball Type
> Shoes> Glove
>Cheat at Counting> Can’t Remember
> Pencil has an eraser

Page 17
6-Sigma Example - Improve Phase
In order to improve his game above the 5-sigma level he has to improve his skills.
In order to improve his game above the 5-sigma level he has to improve his skills.
• What skills does he need to improve? After talking with Larry and the Golf Pro we
have concluded that there are three areasthat would most likely improve his putting game. They are the putter type, stance and grip during putting.
The Golf Pro wants to sell him the latest high tech/high $$ putter (Big Bubba).
• What does Larry have to do?

Page 18
6-Sigma Example - Improve Phase
Larry was not sure, so he consulted with his trustworthy Black Belt, who uses data to help make decisions.
They then set up a Designed Set of Experiments with the following settings:
Factor Low (-1) High (+1)Putter Type Old Reliable Big Bubba
Stance Closed OpenGrip Open Interlocked

Page 19
6-Sigma Example - Improve Phase
This is the Experiment Matrix that they decided to run!This is the Experiment Matrix that they decided to run!
Putter Type Stance GripOld Reliable Closed OpenBig Bubba Closed Open
Old Reliable Open OpenBig Bubba Open Open
Old Reliable Closed InterlockedBig Bubba Closed Interlocked
Old Reliable Open InterlockedBig Bubba Open Interlocked
This is a 23 DOE, which has eight conditions to test.This is a 23 DOE, which has eight conditions to test.

Page 20
6-Sigma Example - Improve Phase
This is the Experiment Matrix after we randomizedthe order that they will run!
This is the Experiment Matrix after we randomizedthe order that they will run!
Randomization is done to detectthe effect of other non-controlled variables.
Randomization is done to detectthe effect of other non-controlled variables.
Run # Putter Type Stance Grip1 Old Reliable Closed Open2 Old Reliable Open Open3 Big Bubba Closed Open4 Old Reliable Closed Interlocked5 Big Bubba Open Interlocked6 Big Bubba Open Open7 Old Reliable Open Interlocked8 Big Bubba Closed Interlocked

Page 21
6-Sigma Example - Improve Phase
We ran the experiments and these are the results.We ran the experiments and these are the results.
1
1
-1
-1
1 1
-1
-1 1 1
-1-1
1
1
Main Effects Plot for Putting Score
Stance
Clo
se
Ope
n
PutterType
Old
Re
liab
le
Big
Bu
bba
Grip
Ope
n
Inte
rlo
ck
40
38
36
34
32
Stance
Grip
Ope
n
Inte
rlo
ck
PutterTypeO
ld R
elia
ble
Big
Bu
bba
Interaction Plots for Putting Score
Close Stance
Open Stance
Put
ting
Sco
re 40
38
36
34
32
40
38
36
34
32
Open Stance
Close Stance
Old Reliable
Big Bubba
The Closed Stance with the Interlocked Grip gives Larry
the Lowest Score!(Verified statistically.)
The Closed Stance with the Interlocked Grip gives Larry
the Lowest Score!(Verified statistically.)
Stance and Grip are significant factors.
(Verified statistically.)
Stance and Grip are significant factors.
(Verified statistically.)
p = .026 p = .037p = .873
p = .003

Page 22
6-Sigma Example - Improve Phase
DOE Conclusions
• The high $$ putter made no difference!!
• The interaction between Closed Stance and Interlocked Grip gives Larry the lowest score!
• Just using the interlocked grip or closed stance by themselves will not achieve the lowest putting score.

Page 23
6-Sigma Example - Improve Phase
So, What is Larry’s Improvement Plan?
• Give up drinking . . . on the golf course!!
• Continue to use “Old Reliable” putter, since the DOE showed that the “Big Bubba” made no difference.
• Always use an interlocking grip and a closed stance when he putts.
• Implement these improvements and collect some data! Play some golf!

Page 24
6-Sigma Example - Improve Phase
Larry's Run Chart of Scores
60
70
80
90
100
110
12015-J
an
10-F
eb
26-F
eb
23-M
ar
20-A
pr
13-M
ay
27-M
ay
7-J
un
14-J
un
25-J
un
4-J
ul
29-J
ul
6-A
ug
14-A
ug
6-S
ep
Measure Improve
Yes! How much?
100.097.595.092.590.087.585.082.580.0
Upper SpecLower Spec
ImpScore
s
Mean-3s
Mean+3s
Mean
n
k
LSL
USL
Targ
Cpm
Ppk
PPL
PPU
Pp
0
9
0
11
0.00
0.00
0.00
0.00
Obs
PPM<LSL Exp
Obs
PPM>USL Exp
Obs
%<LSL Exp
Obs
%>USL Exp
2.3442
83.0341
97.0992
90.0667
15.000
0.007
80.000
100.000
*
*
1.41
1.43
1.41
1.42
Process Capability Analysis
From Measure:Zlt = -0.15 DPMO = 820,000Zst = 5.64
From Improve:Zlt = 4.23 DPMO = 12
From Measure:Zlt = -0.15 DPMO = 820,000Zst = 5.64
From Improve:Zlt = 4.23 DPMO = 12
Has Larry improved?USL
LSL

Page 25
6-Sigma Program& Concepts Overview
Project Phases:
Measure
Analyze
Improve
Control
6
Presenters:
P. Pfaff
H. Myrie
K. Barker

Page 26
6-Sigma Example - Improve Review
• Give up drinking . . . on the golf course!!
• Use “Old Reliable” putter!!
• Always use an interlocking grip and a closed stance when he putts!!
Remember Larry’s Improve “Plan” . . .
. . . and the ResultsFrom Measure:Zlt = -0.15 DPMO = 820,000Zst = 5.64
From Improve:Zlt = 4.23 DPMO = 12
From Measure:Zlt = -0.15 DPMO = 820,000Zst = 5.64
From Improve:Zlt = 4.23 DPMO = 12

Page 27
6-Sigma Example - Control Phase
Larry Needs a Control Plan
• What’s a good plan to insure that Larry sustains the improvements he has made?
• Are there risks that could cause Larry to lose his improvement?
• If so, how should Larry address those risks associated with changing his golf game?
• Can Larry come up with a realistic drinking objective and maintain his improvement?

Page 28
6-Sigma Example - Control Phase
So, What is Larry’s Control Plan?• Alternate drinking plan
• Leave wallet in car - only take enough $ for 1 beer
• Lock and key on partners’ beer coolers
• Unlimited supply of “Near Beer” in Red Dog bottles (shhh - Don’t tell Larry)
• Put a Label on “Old Reliable” putter where he always sees it when putting
• “Interlock grip, close stance”
Mistake - proofing

Page 29
6-Sigma Example - Control Phase
• SPC Control Chart
• Use the mean +/- 3 sigma limits as calculated from the Improve Phase data
• Continue Data Collection on Vital X’s
• Larry to track drinks per round
More of Larry’s Control Plan
Okay, he’s got a plan.Is there any risk associated with it?

Page 30
6-Sigma Example - Control Phase
Identify the risk elements (schedule, cost, technical)
Assign ratings (high (3), med(2), low(1))
Prioritize elements (probability & impact)
Identify Risk Abatement plans
Incorporate into Larry’s Control plan
Risk Assessment
Giving up drinking is a risk!
Need an Abatement Plan
Giving up drinking is a risk!
Need an Abatement Plan
RISK PROB. IMPACT TOTALTeam doesn’t invite non-drinkers 2 3 6“old Reliable” craps out 1 3 3Cannot use interlocking grip 1 3 3Something else goes wrong in game 2 2 4Quit golf - no fun without drinking 3 3 9Might "find" more drinks on the course 2 2 4

Page 31
6-Sigma Example - Control Phase
6543210
54
44
34
Drinks
Pu t
ts
Y =
R-Squared = 0.872
The Linear Regression predicts that 1 - 2 drinks will add only a
few putts.
The Linear Regression predicts that 1 - 2 drinks will add only a
few putts.
ScatterPlot/Fitted Line Regression
36.25 + 2X
RealisticTolerance
ExpectedOutcome
If he drinks moderately, can he maintain an improvement?
If he drinks moderately, can he maintain an improvement?
Abatement Planning

Page 32
6-Sigma Example - Control Phase
Monitoring the SPC Chart
UCL = 96.91
LCL = 83.23
What happened here?Let’s look at the data!
99! Out of Control!

Page 33
6-Sigma Example - Control Phase
Does Larry’s Control Plan Work?
Score Drinks89 191 188 190 299 491 288 089 190 293 291 1
• How did Larry get four drinks?
• Was this risk in the Risk Assessment / Abatement Plan?
• Yes!
• Is there an Abatement Plan?
• Yes!
• Then implement the Abatement Plan immediately.
“Stuff” happens - so we doRisk Assessment / Abatement!!

Page 34
6-Sigma Example - Control Phase
Did the Abatement Work?
UCL
LCL
100.097.595.092.590.087.585.082.580.0
Upper SpecLower Spec
Post
s
Mean-3s
Mean+3s
Mean
n
k
LSL
USL
Targ
Cpm
Ppk
PPL
PPU
Pp
0
0
0
0
0.00
0.00
0.00
0.00
Obs
PPM<LSL Exp
Obs
PPM>USL Exp
Obs
%<LSL Exp
Obs
%>USL Exp
1.7215
85.0173
95.3464
90.1818
11.000
0.018
80.000
100.000
*
*
1.90
1.97
1.90
1.94
Process Capability Analysis
Control Chart says Yes!
Capability Analysis says Yes!
He has reached Zlt = 5.7 Sigma!(Zst at Measure was 5.64)
Success!
Page 35
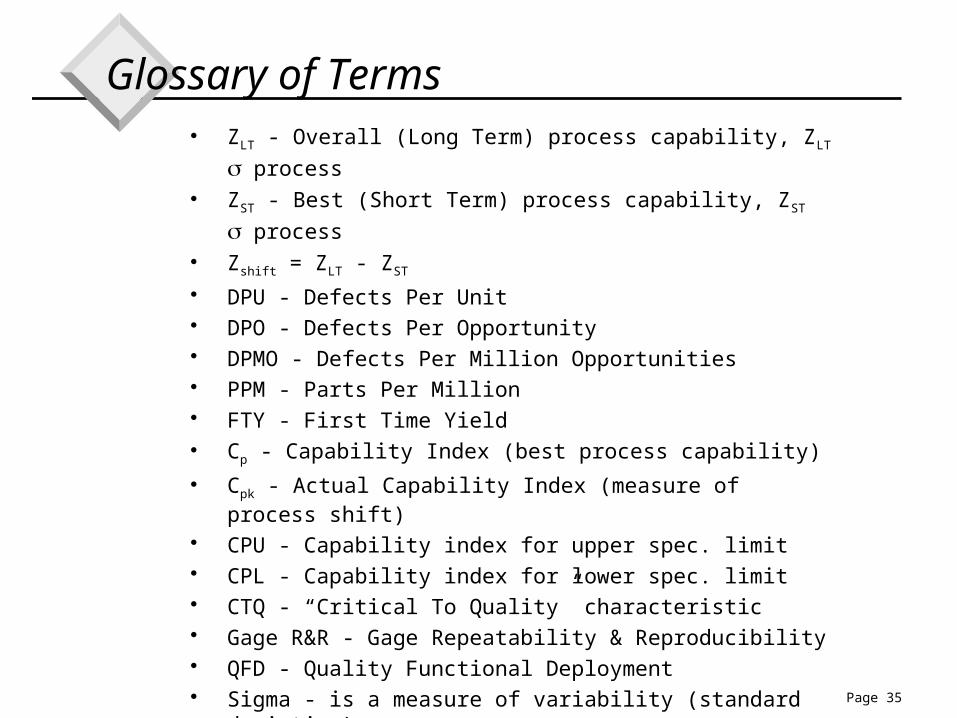
Glossary of Terms ZLT - Overall (Long Term) process capability, ZLT process
ZST - Best (Short Term) process capability, ZST process
Zshift = ZLT - ZST
DPU - Defects Per Unit DPO - Defects Per Opportunity DPMO - Defects Per Million Opportunities PPM - Parts Per Million FTY - First Time Yield Cp - Capability Index (best process capability)
Cpk - Actual Capability Index (measure of process shift) CPU - Capability index for upper spec. limit CPL - Capability index for lower spec. limit CTQ - “Critical To Quality” characteristic Gage R&R - Gage Repeatability & Reproducibility QFD - Quality Functional Deployment Sigma - is a measure of variability (standard deviation) NPI/EDC - New Process Introduction/Engine Development Cycle