6.s897 machine learning for healthcare, lecture 13
TRANSCRIPT

Agenda
‣ Interpreting Mammograms
- Cancer Detection and Triage
‣ Assessing Breast Cancer Risk
‣ How to Mess Up
‣ How to Deploy
1

Triaging Mammograms
… 1. Routine Screening
1000 Patients
2. Called back for Additional Imaging
100 Patients
3. Biopsy
20 Patients
4. Diagnosis
6 Patients
2

Triaging Mammograms • >99% of patients are cancer-free
• Can we use a cancer model to automatically triage patients as cancer-free?
• Reduce False positives, improve efficiency.
• Overall Idea:
• Train a cancer detection model and pick a cancer-free threshold
• chosen by min probability of a caught-cancer on the dev set
• Radiologists can skip reading mammograms bellow threshold
3
Triaging Mammograms
• The plan
• Dataset Collection
• Modeling
• Analysis
4

Dataset Collection • Consecutive Screening Mammograms
• 2009-2016
• Outcomes from Radiology EHR, andPartners
5 Hospital Registry
• No exclusions based on race, implants etc.
• Split into Train/Dev/Test by Patient
5

Triaging Mammograms • The plan
• Dataset Collection
• Modeling
• General challenges in working with mammograms
• Specific methods for this project
• Analysis
6

Modeling: Is this just like ImageNet?
[Image of mammogram,
removed for patientprivacy]
7

Modeling: Is this just like ImageNet?
[Image of mammogram,
removed for patientprivacy]
8
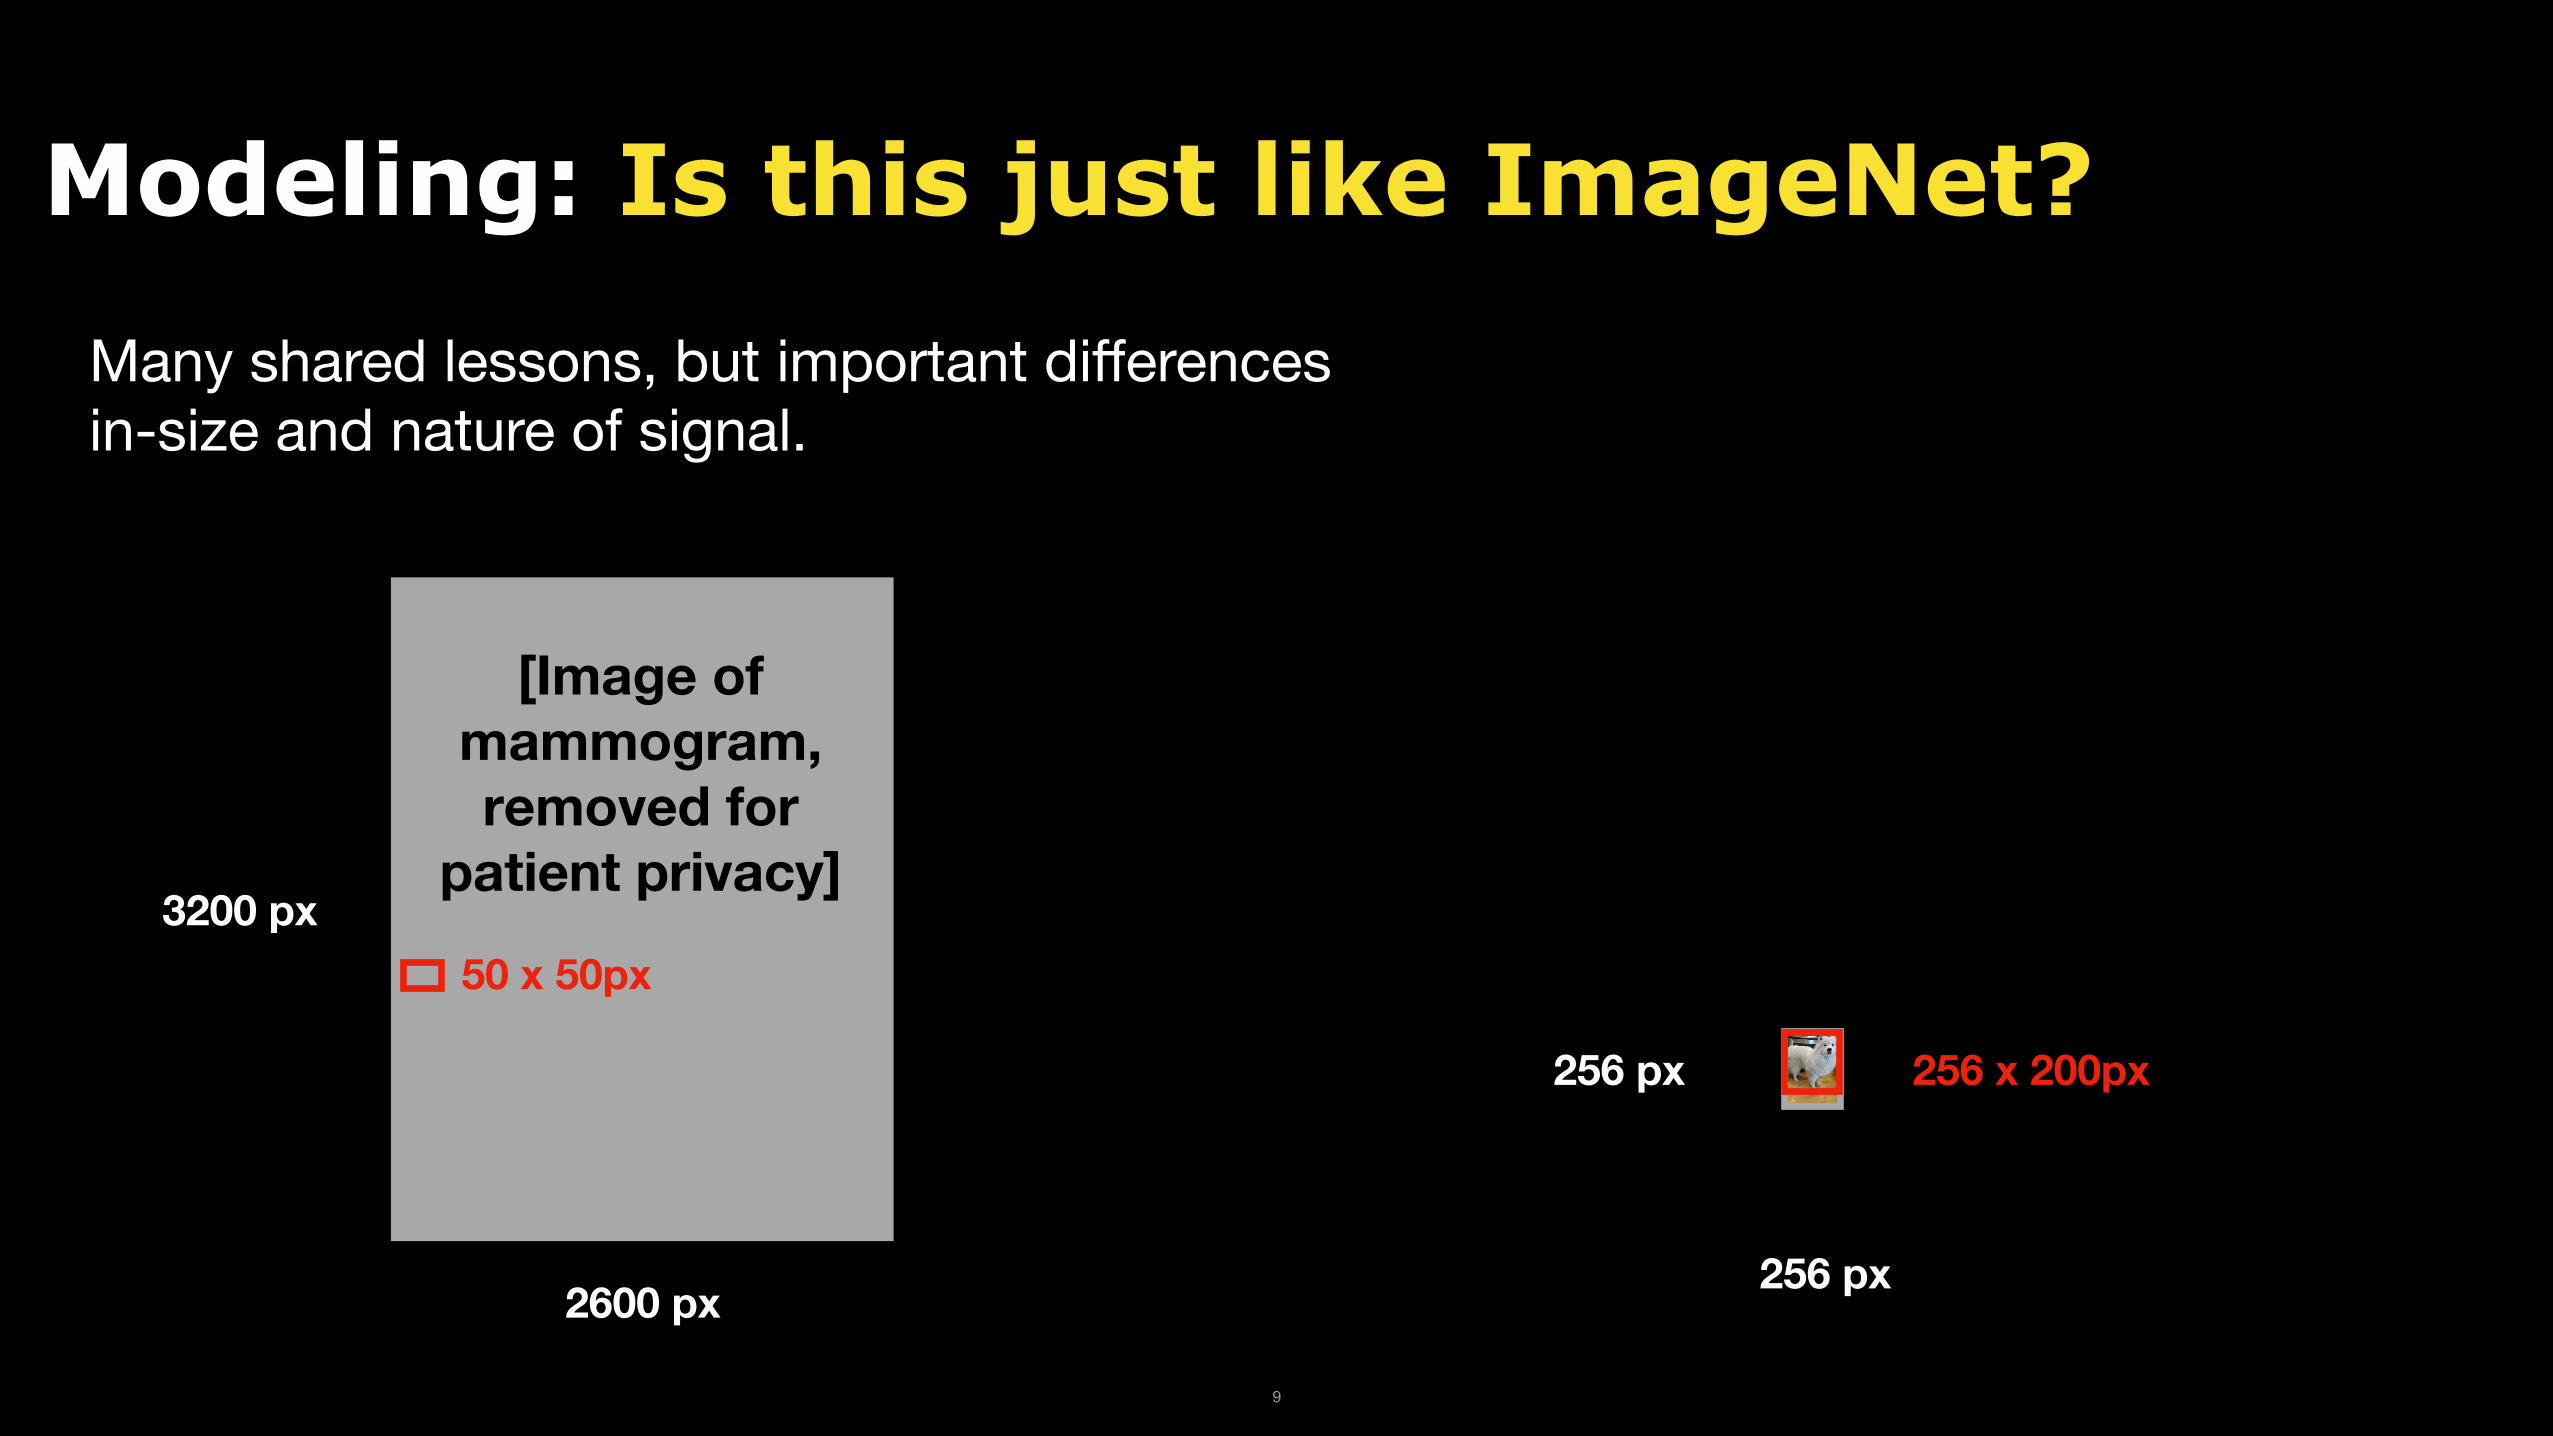
Modeling: Is this just like ImageNet?
Many shared lessons, but important differences in-size and nature of signal.
3200 px 50 x 50px
[Image of mammogram,removed for
patient privacy]
256 px 256 x 200px
256 px2600 px
9

Modeling: Is this just like ImageNet?
Many shared lessons, but important di
2600 px
50 x 50px
[Image of mammogram,removed for
patient privacy]
fferences in-size and nature of signal.
Context-dependent Cancer Context-independent Dog
3200 px
50 x 50px 256 px 256 x 200px
256 px
REDACTED
10

Modeling: Challenges • Size of Object / Size of Image:
• Mammo: ~1%
• Class Balance:
• Mammo: 0.7% Positive
• 220,000 Exams, <2,000 Cancers
• Images per GPU:
• 3 Images (< 1 Mammogram)
• 128 ImageNet Images
• Dataset Size
• 12+ TB
The data is too big!
The data is too small!
11

Modeling: Key Choices • How do we make the model actually learn?
• Initialization
• Optimization / Architecture Choice
• How to use the model?
• Aggregation across images
• Triage Threshold
• Calibration
12

Modeling: Actual Choices • How do we make the model learn?
• Initialization
• ImageNet Init
• Optimization
• Batch size: 24
• 2 steps on 4 GPUs for each optimizer step
• Sample balanced batches
• Architecture Choice
• ResNet-1813

Modeling: Key Choices • How do we make the model actually learn?
• Initialization
• Optimization / Architecture Choice
• How to use the model?
• Aggregation across images
• Triage Threshold
• Calibration
14

Modeling: Initialization ImageNet-Init Random-Init
0
2.5
5
7.5
10
Train Loss
0 5 10 15 20 25 15

Modeling: Initialization Empirical Observations
• ImageNet initialization learns immediately.
• Transfer of particular filters?
• Hard edges / shapes not shared
• Transfer of BatchNorm Statistics
• Random initialization doesn’t fit for many epochs untilsudden cliff.
ImageNet-InitRandom-Init
10 7.5
5 2.5
0 0 5 10 15 20 25
RE
• Unsteady BatchNorm statistics (3 per GPU)
16
Modeling: Key Choices • How do we make the model actually learn?
• Initialization
• Optimization / Architecture Choice
• How to use the model?
• Aggregation across images
• Triage Threshold
• Calibration
17

Modeling: Common Approaches • Core problem:
• Low signal-to-noise ratio
• Common Approach:
• Pre-Train at Patch level
• High batch-size > 32
• Fine-tune on full images © Yaroslav Nikulin / Therapixel. All rights reserved. This content is excluded from our Creative• Low batch-size < 6 Commons license. For more information, see https://ocw.mit.edu/help/faq-fair-use/.
© source unknown. All rights reserved. This content is excluded from our Creative Commons license. For more information, see https://ocw.mit.edu/help/faq-fair-use/.
18

Modeling: Base Architecture
• Many valid options:
• VGG, ResNet, Wide-ResNet, DenseNet…
• Fully convolutional variants (like ResNet) are theeasiest to transfer across resolutions.
• Use ResNet-18 as base for speed/performancetrade-off.
19

Modeling: Building Batches
• Build Balanced Batches:
• Avoid model forgetting
• Bigger batches means less noisy stochasticgradients
• Makes 2-stage training unnecessary.
• Trade-off: the bigger the batches, the slower thetraining
Old Experiments on Film Mammography Dataset
20

Modeling: Key Choices • How do we make the model actually learn?
• Initialization
• Optimization / Architecture Choice
• How to use the model?
• Aggregation across images
• Triage Threshold
• Calibration
21

Modeling: Actual Choices • How do we make the model learn?
• Initialization
• ImageNet Init
• Optimization
• Batch size: 24
• 2 steps on 4 GPUs for each optimizer step
• Sample balanced batches with data augmentation
• Architecture Choice
• ResNet-18 22
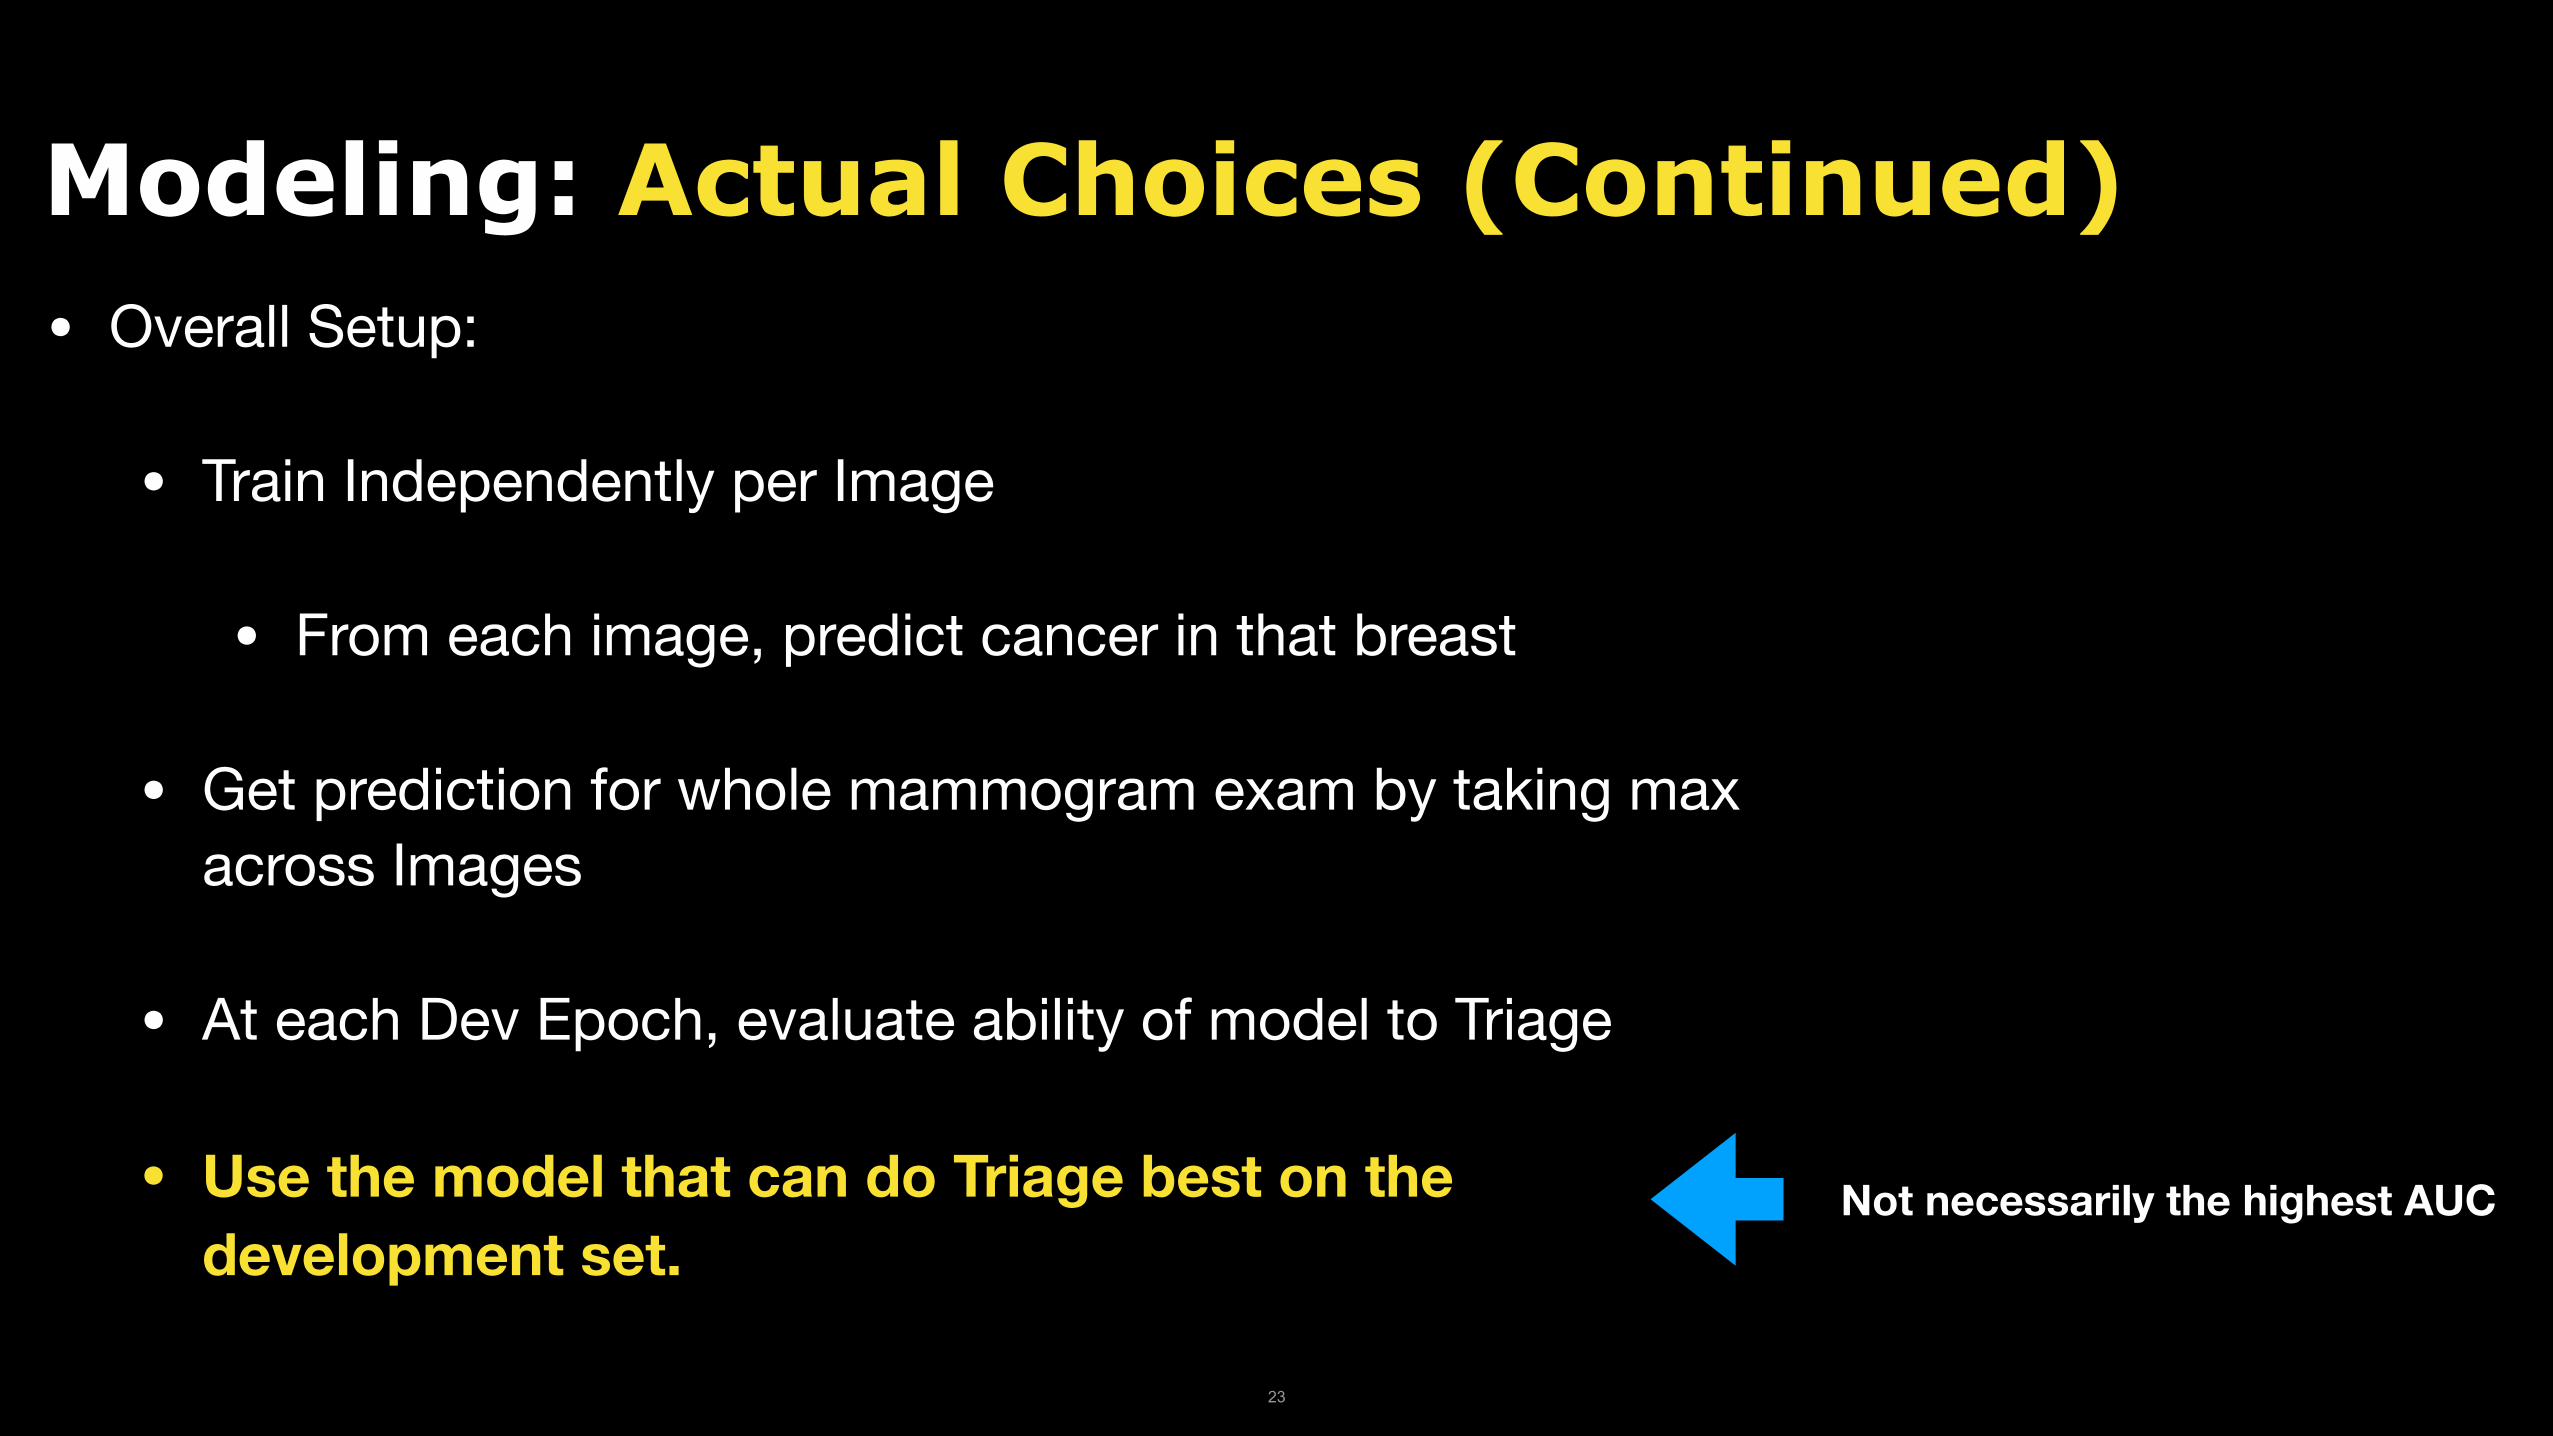
Modeling: Actual Choices (Continued) • Overall Setup:
• Train Independently per Image
• From each image, predict cancer in that breast
• Get prediction for whole mammogram exam by taking maxacross Images
• At each Dev Epoch, evaluate ability of model to Triage
• Use the model that can do Triage best on the Not necessarily the highest AUCdevelopment set.
23

Modeling: How to actually Triage?
• Goal:
• Don’t miss a single cancer the radiologist would have caught.
• Solution:
• Rank radiologist true positives by model-assigned probability
• Return min probability of radiologist true positive in development set.
24

Modeling: How to calibrate? • Goal:
• Want model assigned probabilities to correspond to real probability of cancer.
• Why is this a problem?
• Model trained artificial incidence of 50% for optimization reasons.
• Solution:
• Platt’s Method:
• Learn sigmoid to scale and shift probabilities to real incidence on the development set.
25

Triaging Mammograms
• The plan
• Dataset Collection
• Modeling
• Analysis
26

Analysis: Objectives
• Is the model discriminative across all populations?
• Subgroup Analysis by Race, Age, Density
• How does model relate to radiologist assessments?
• Simulate actual use of Triage on the Test Set
27

Analysis: Model AUC
Overall AUC: 0.82 (95%CI .80, .85 )
40s 50s 60s 70s 80+ 0.5
0.59
0.68
0.77
0.86
Analysis by Age 28

Analysis: Model AUC
Overall AUC: 0.82 (95%CI .80, .85 )
White African American Asian Other 0.5
0.59
0.68
0.77
0.86
Analysis by Race 29

Analysis: Model AUC
0.5
0.6
0.7
0.8
Overall AUC: 0.82 (95%CI .80, .85 )
0.9
Fatty Scattered Heterogenous Dense
Analysis by Density
30
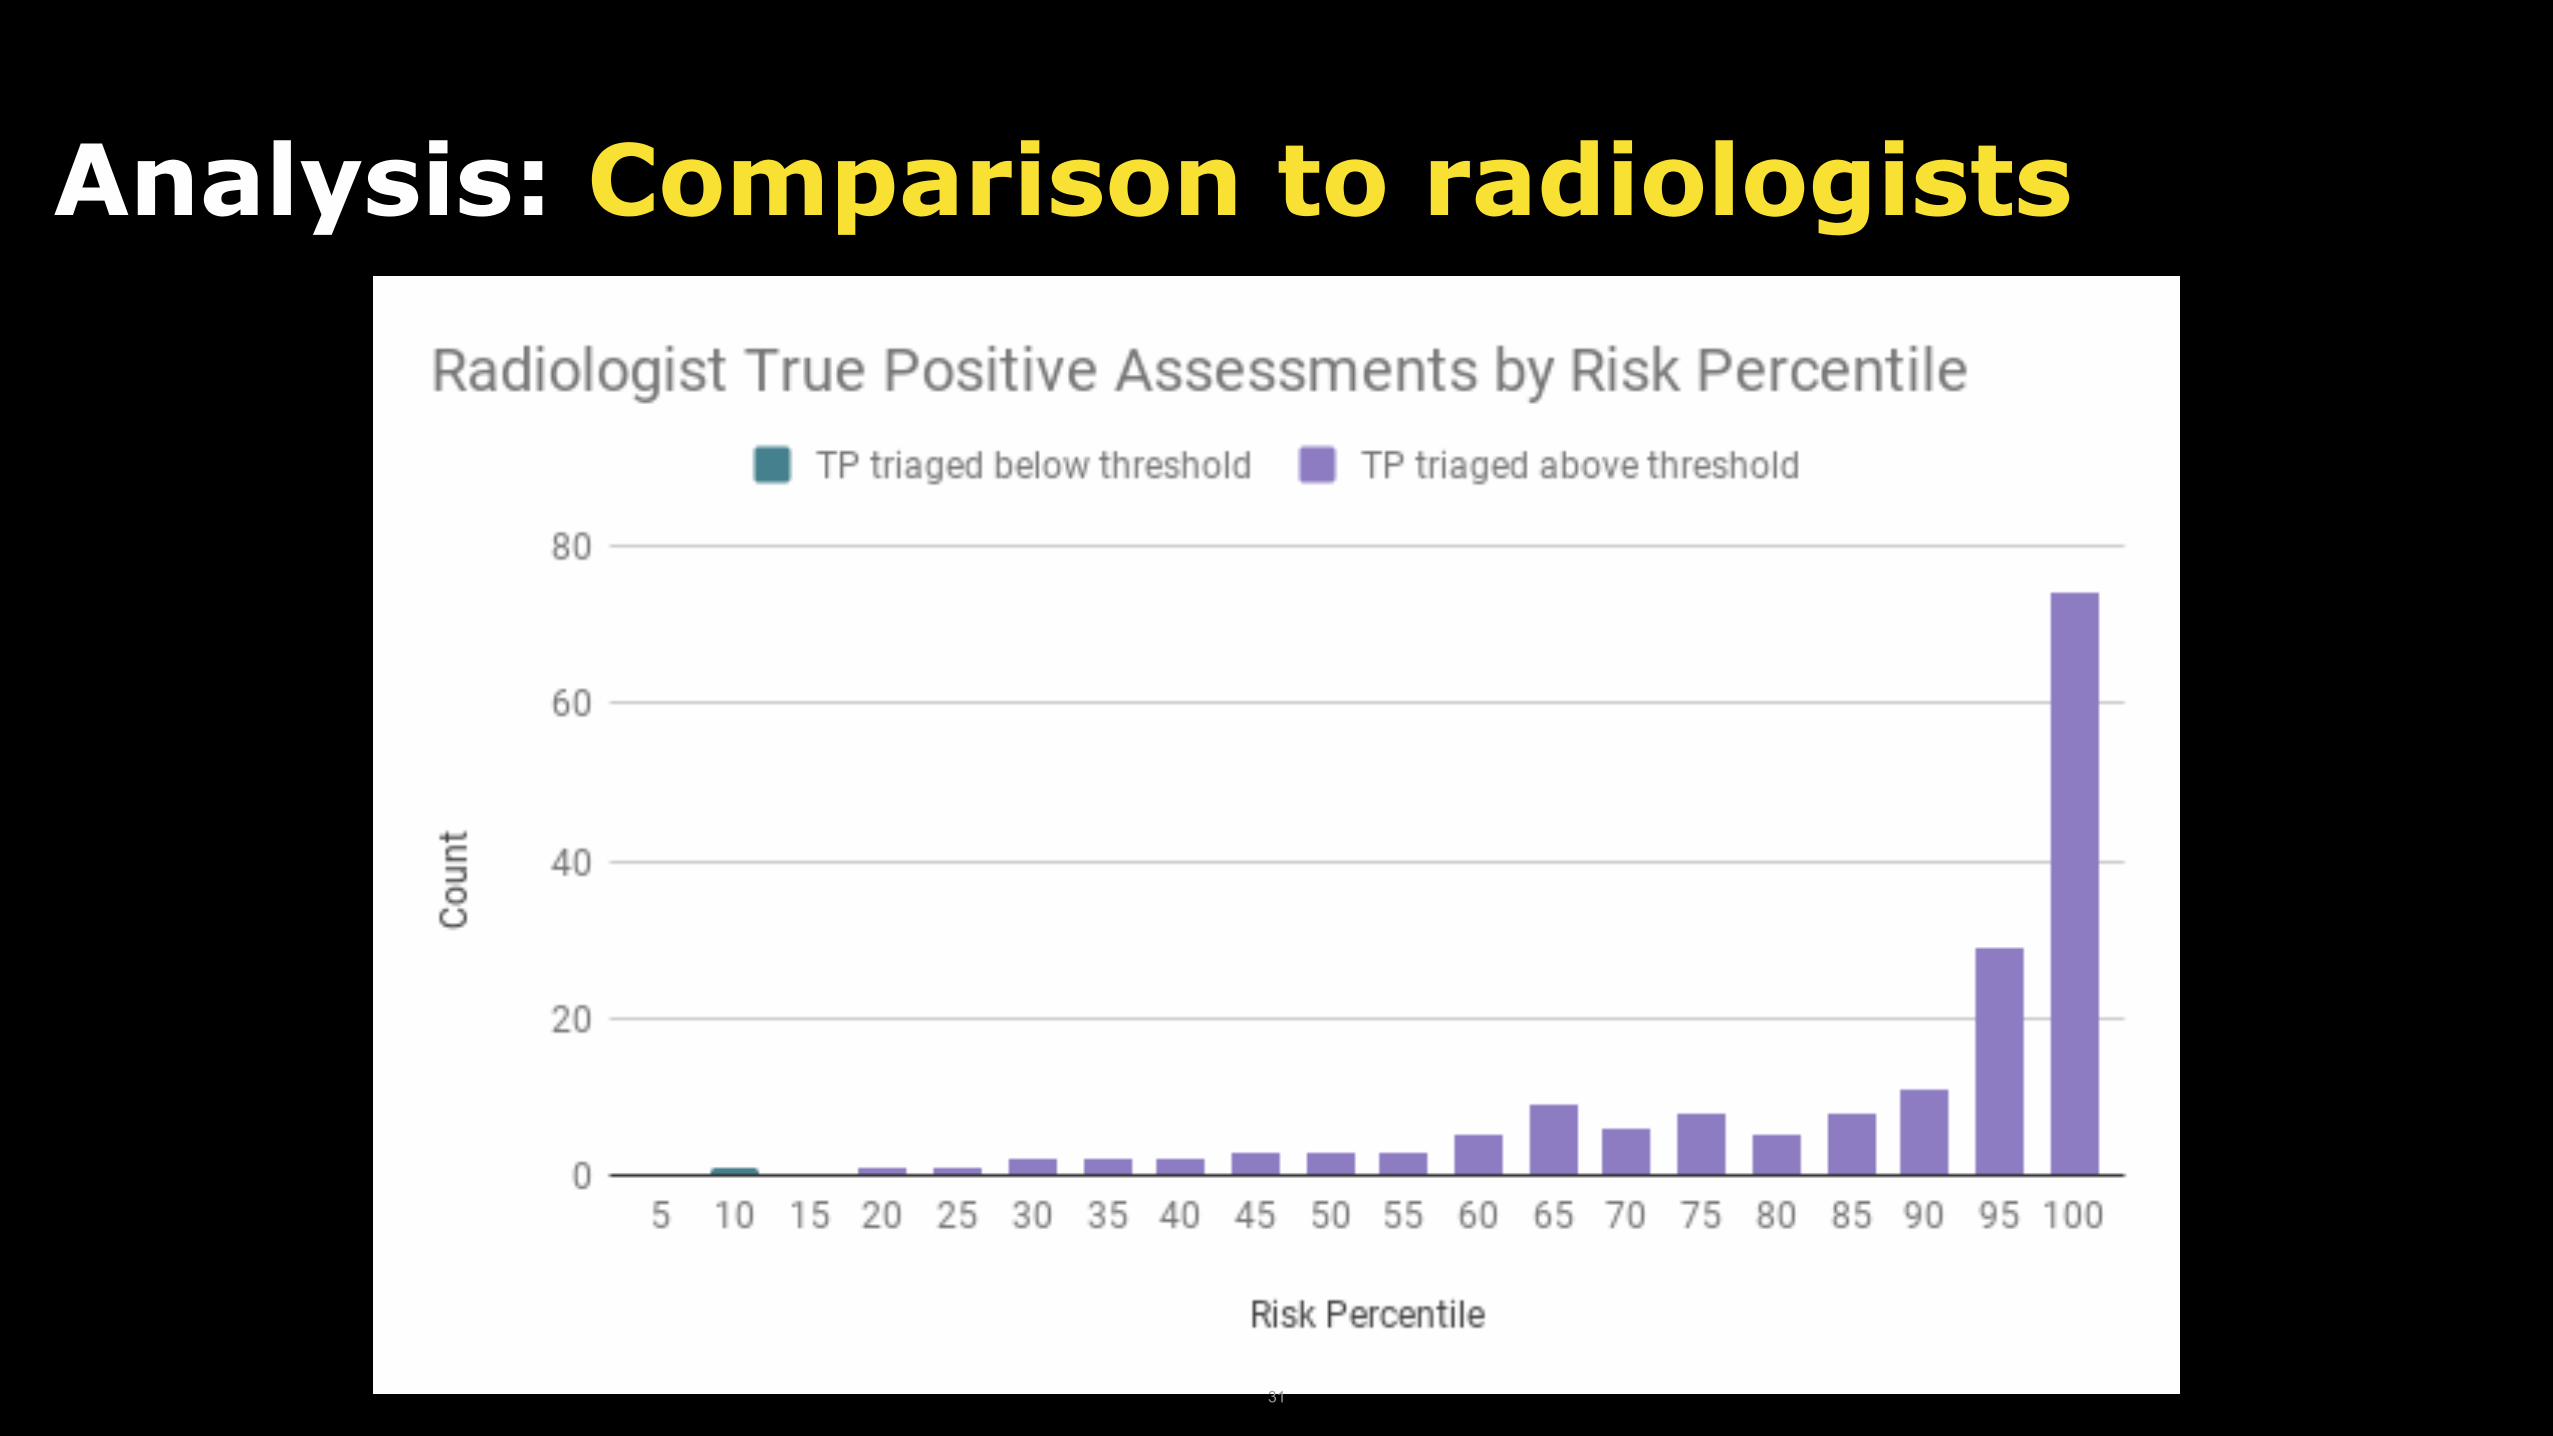
Analysis: Comparison to radiologists
31

Analysis: Comparison to radiologists
32

Analysis: Comparison to radiologists
33
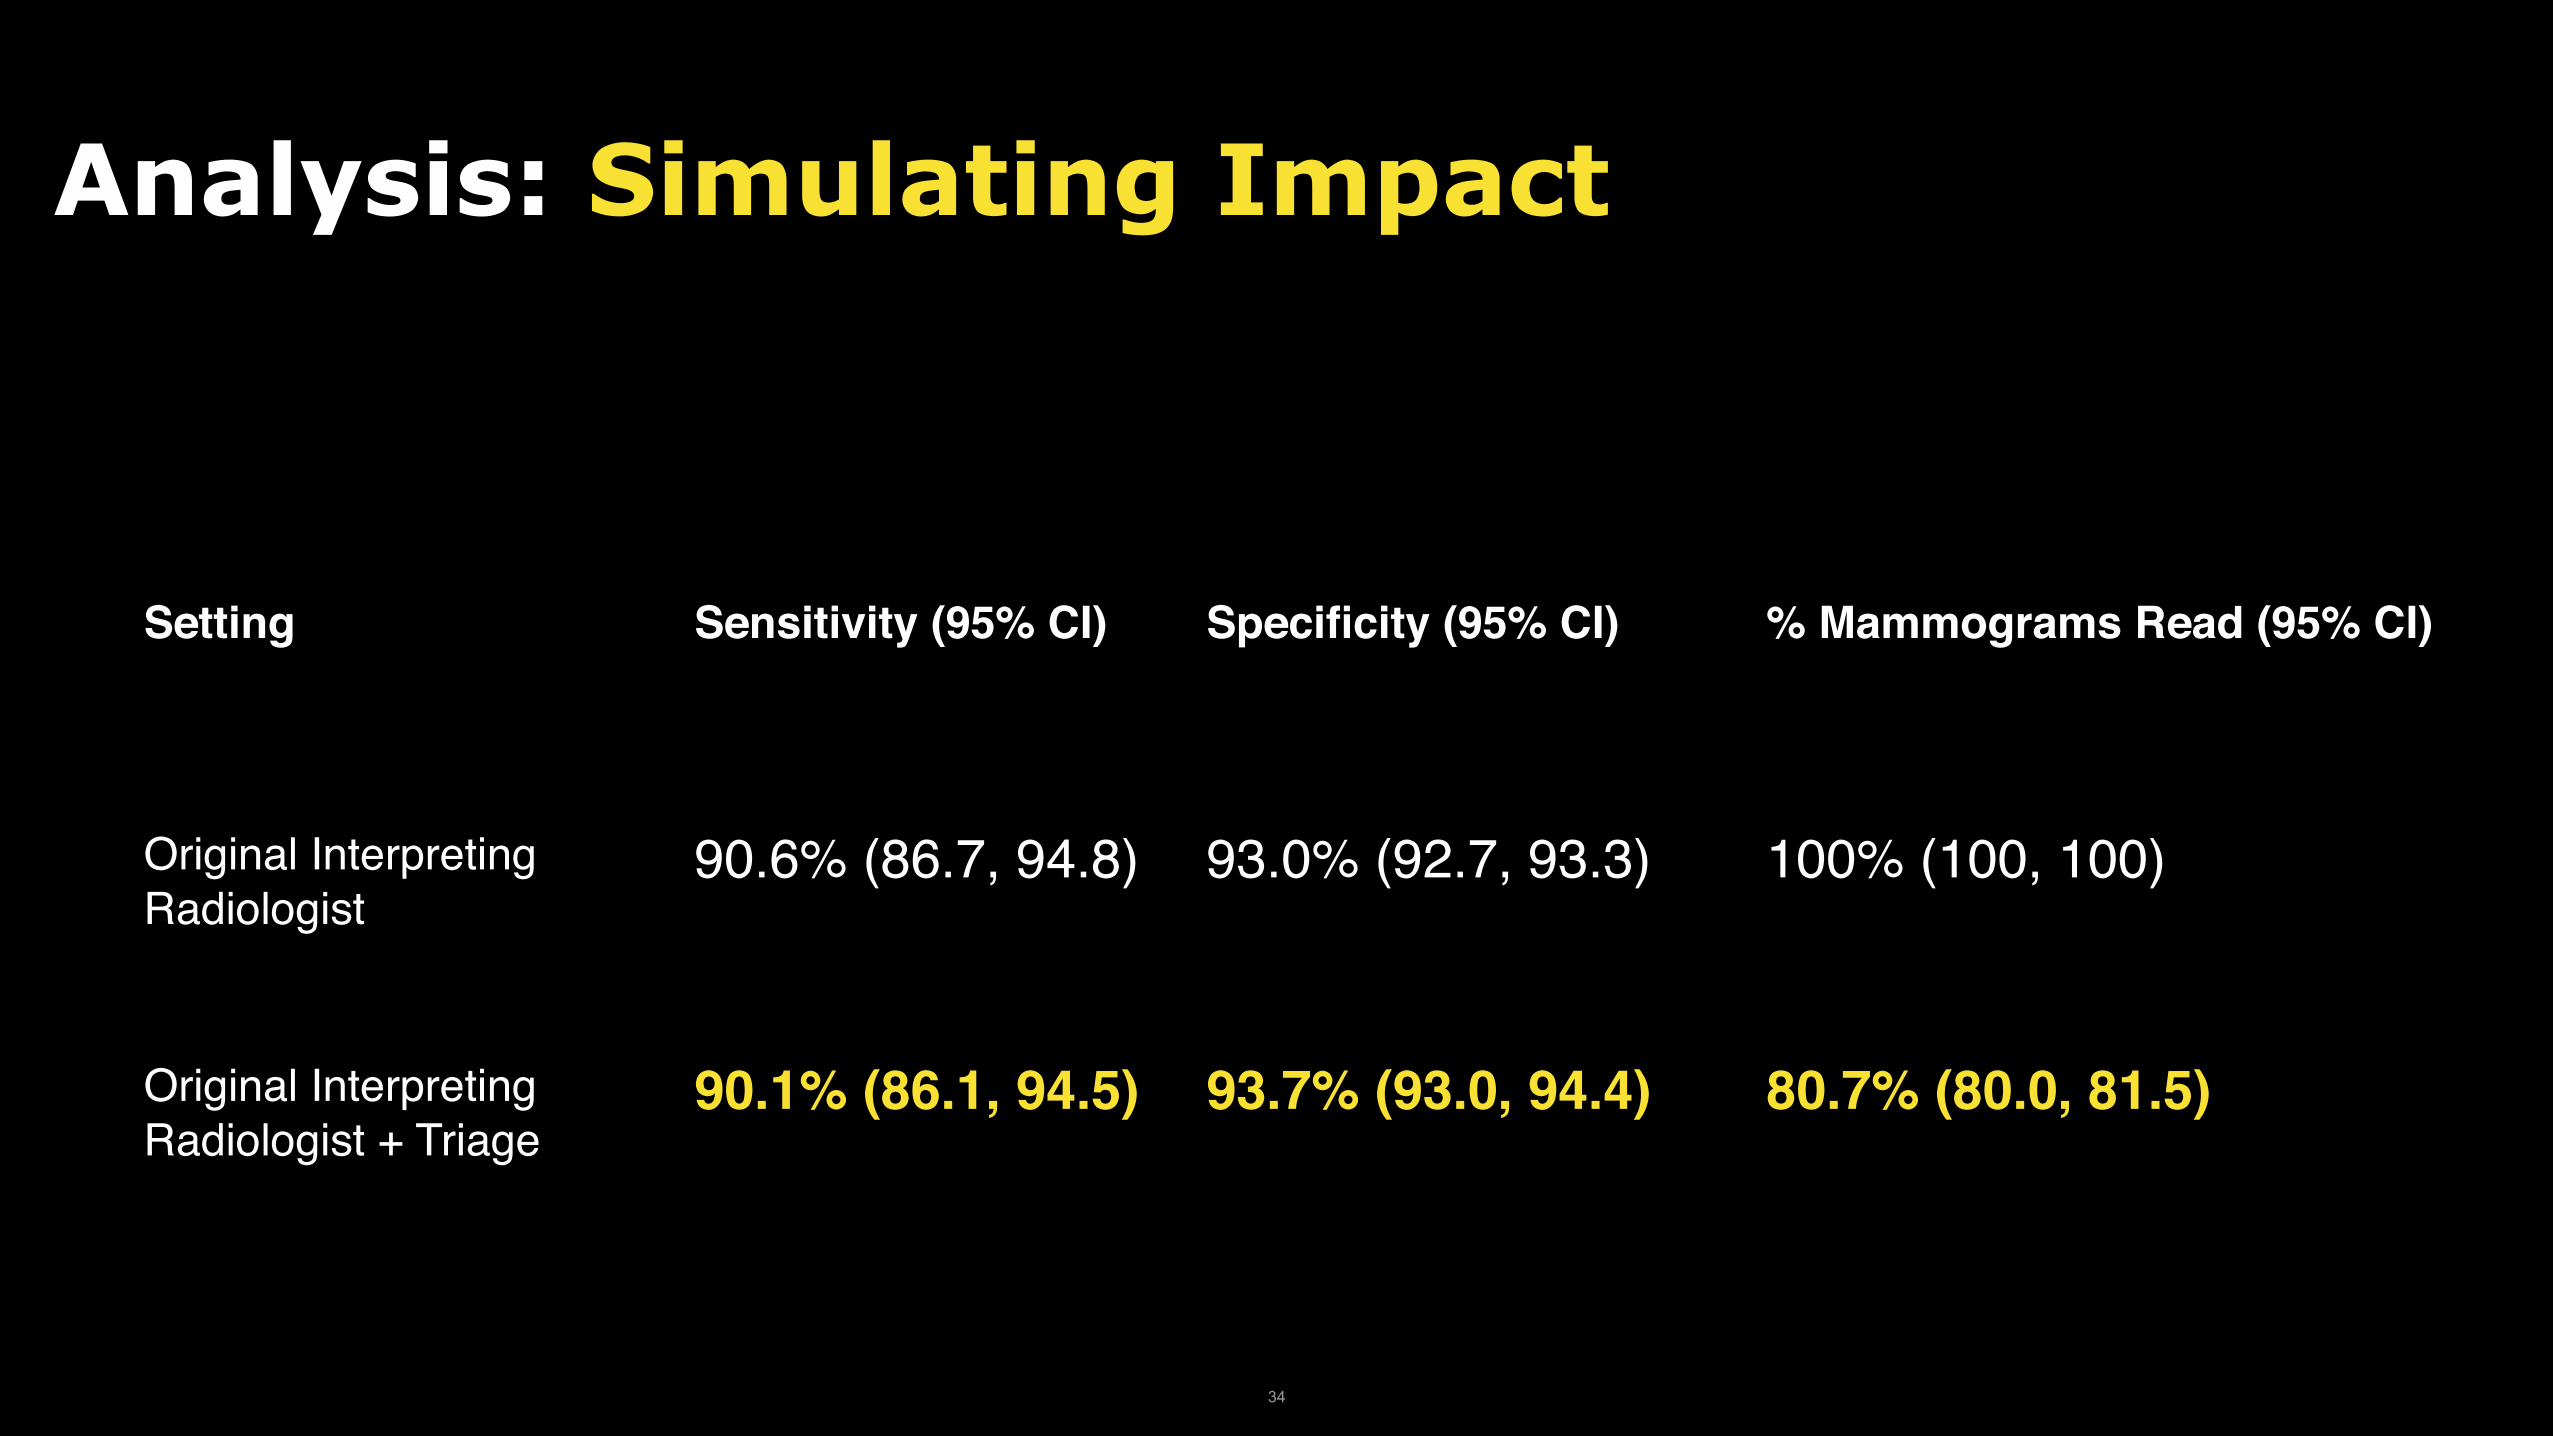
Analysis: Simulating Impact
Setting Sensitivity (95% CI) Specificity (95% CI) % Mammograms Read (95% CI)
Original InterpretingRadiologist
90.6% (86.7, 94.8) 93.0% (92.7, 93.3) 100% (100, 100)
Original InterpretingRadiologist + Triage
90.1% (86.1, 94.5) 93.7% (93.0, 94.4) 80.7% (80.0, 81.5)
34
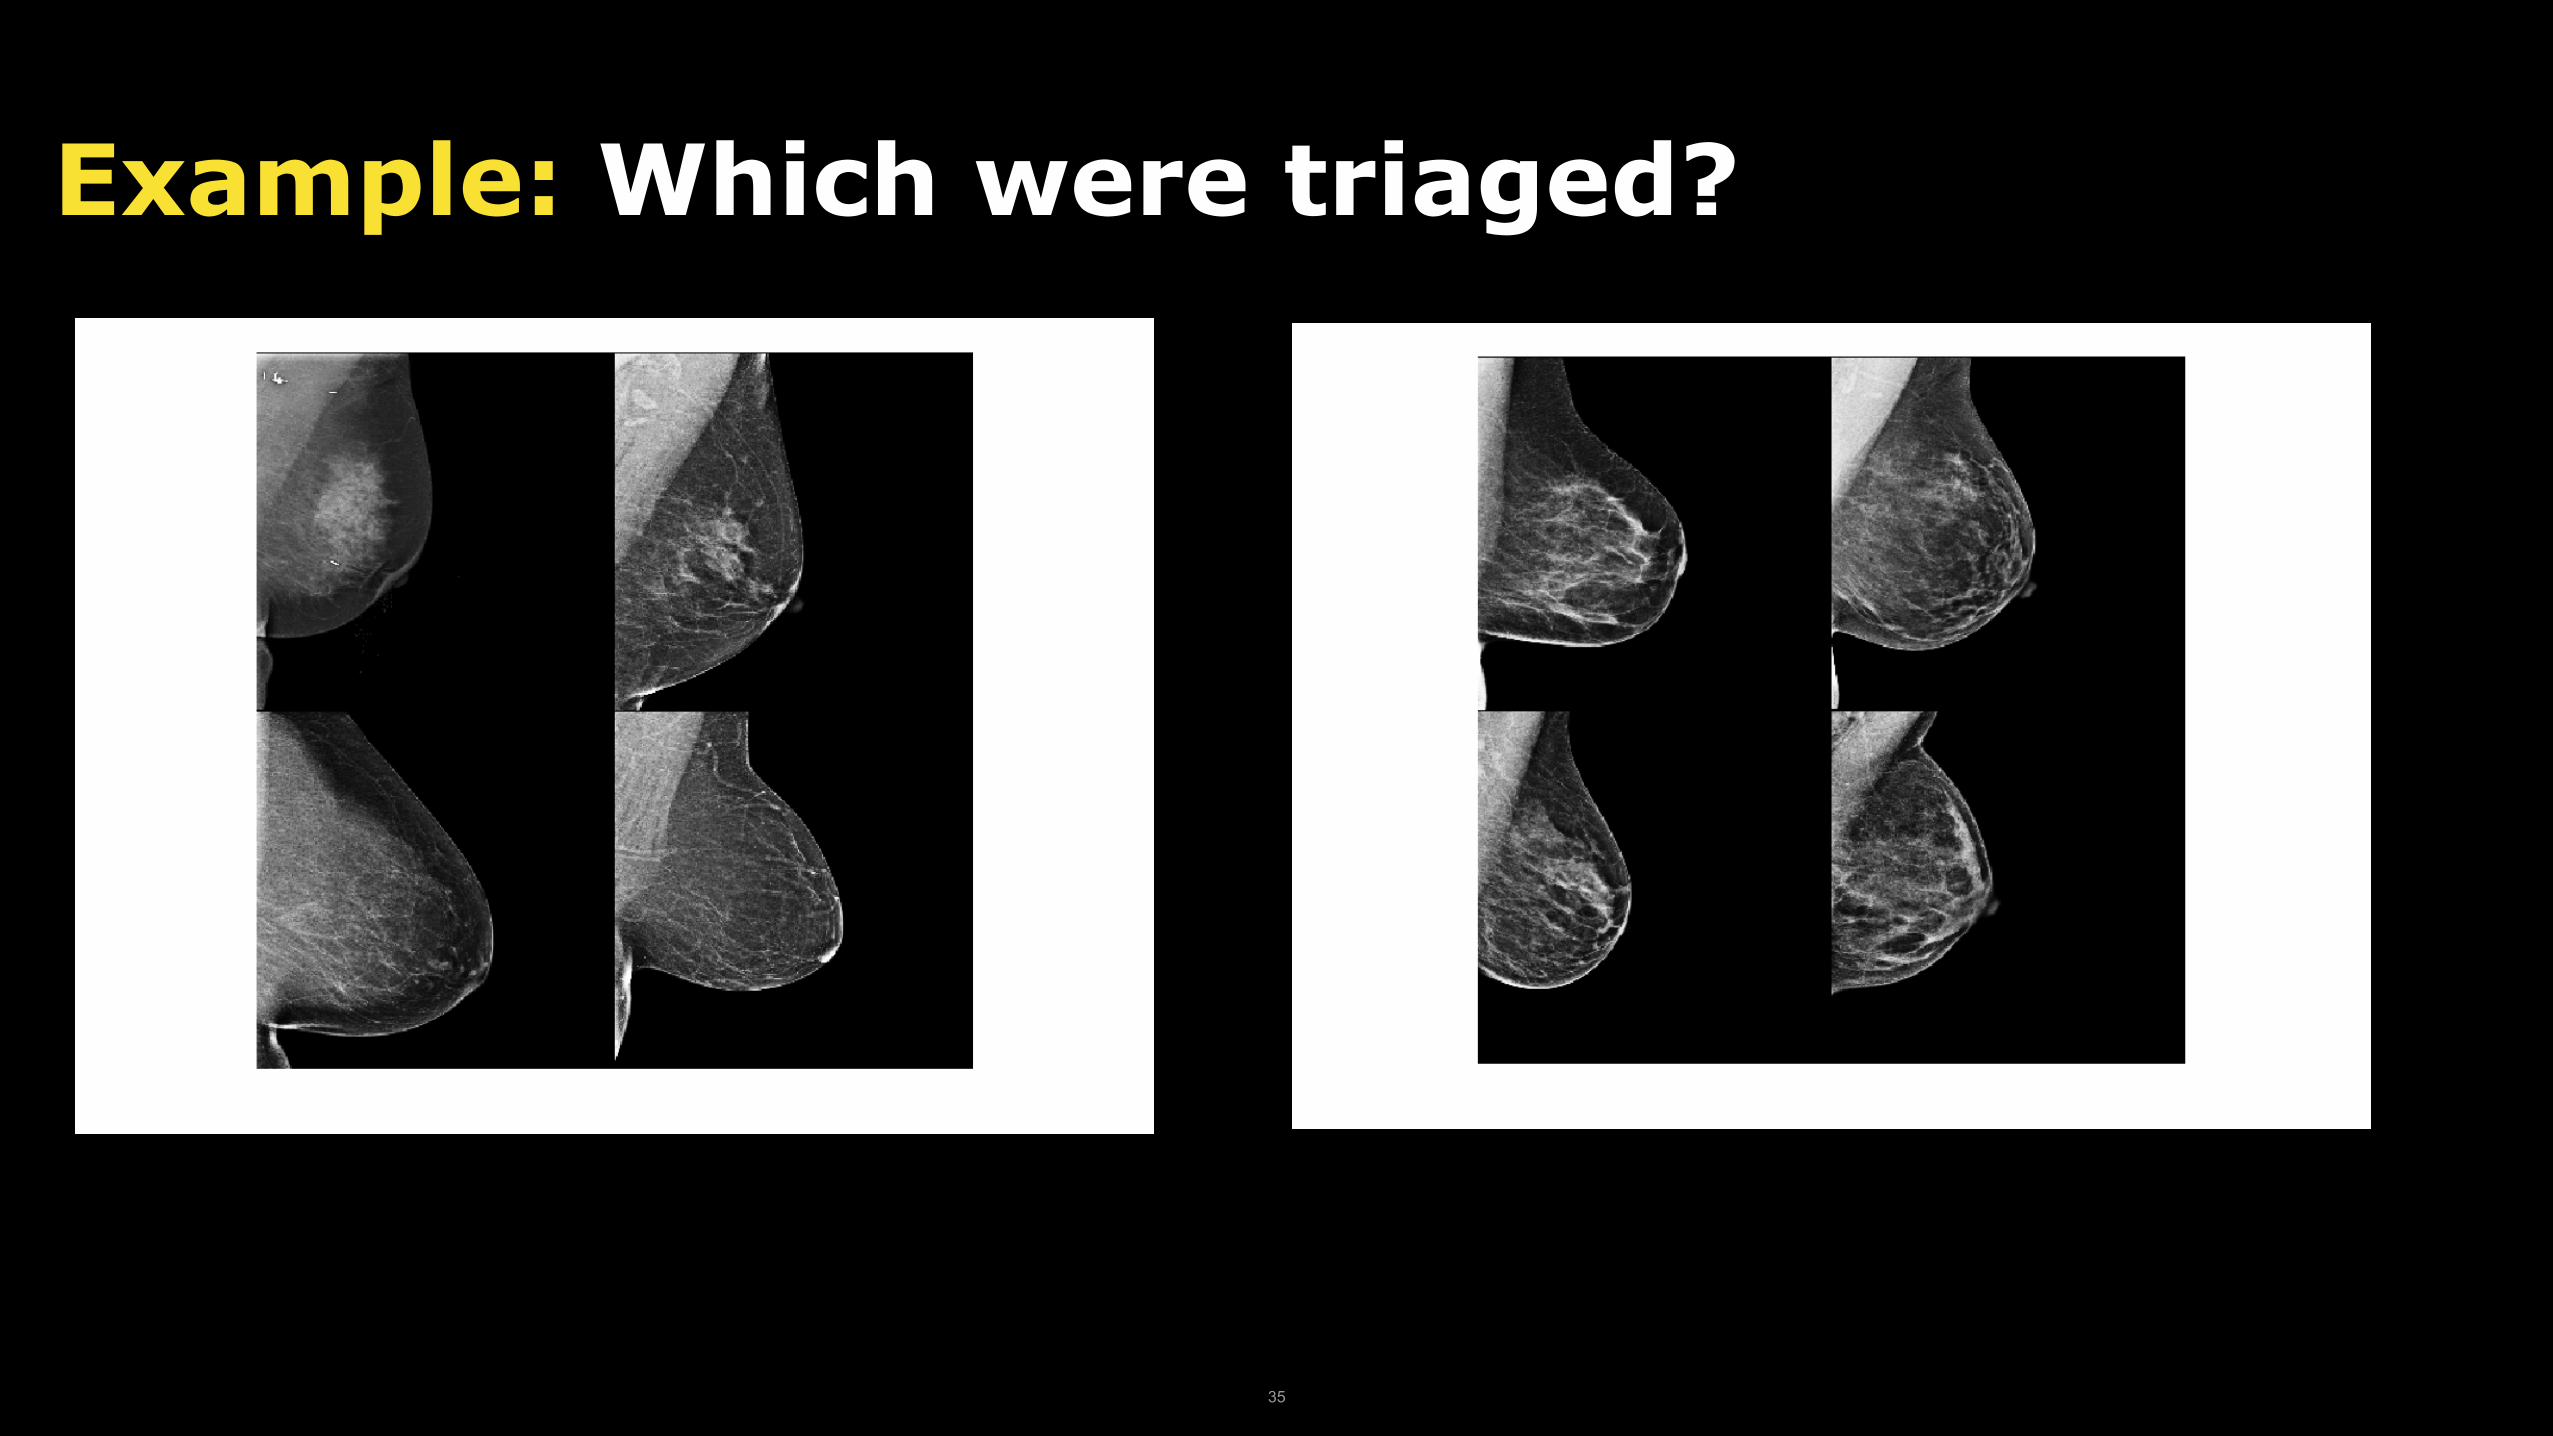
Example: Which were triaged?
35

Example: Which were triaged as cancer-free?
36
Next Step: Clinical Implementation
37

Agenda
‣ Interpreting Mammograms
- Cancer Detection and Triage
‣ Assessing Breast Cancer Risk
‣ How to Mess up
‣ How to Deploy
38

Classical Risk Models: BCSC
Age Family History
RiskPrior Breast Procedure
Breast Density
AUC: 0.631 AUC: 0.607 without Density
William E. Barlow, Emily White, Rachel Ballard-Barbash, Pamela M. Vacek, Linda Titus-Ernstoff, Patricia A. Carney, Jeffrey A. Tice, Diana S. M. Buist, Berta M. Geller, Robert Rosenberg, Bonnie C. Yankaskas, Karla Kerlikowske, “Prospective Breast Cancer Risk Prediction Model for Women Undergoing Screening Mammography,” Journal of the National Cancer Institute, Vol. 98, No. 17, September 6, 2006. pp. 1204-14.
39
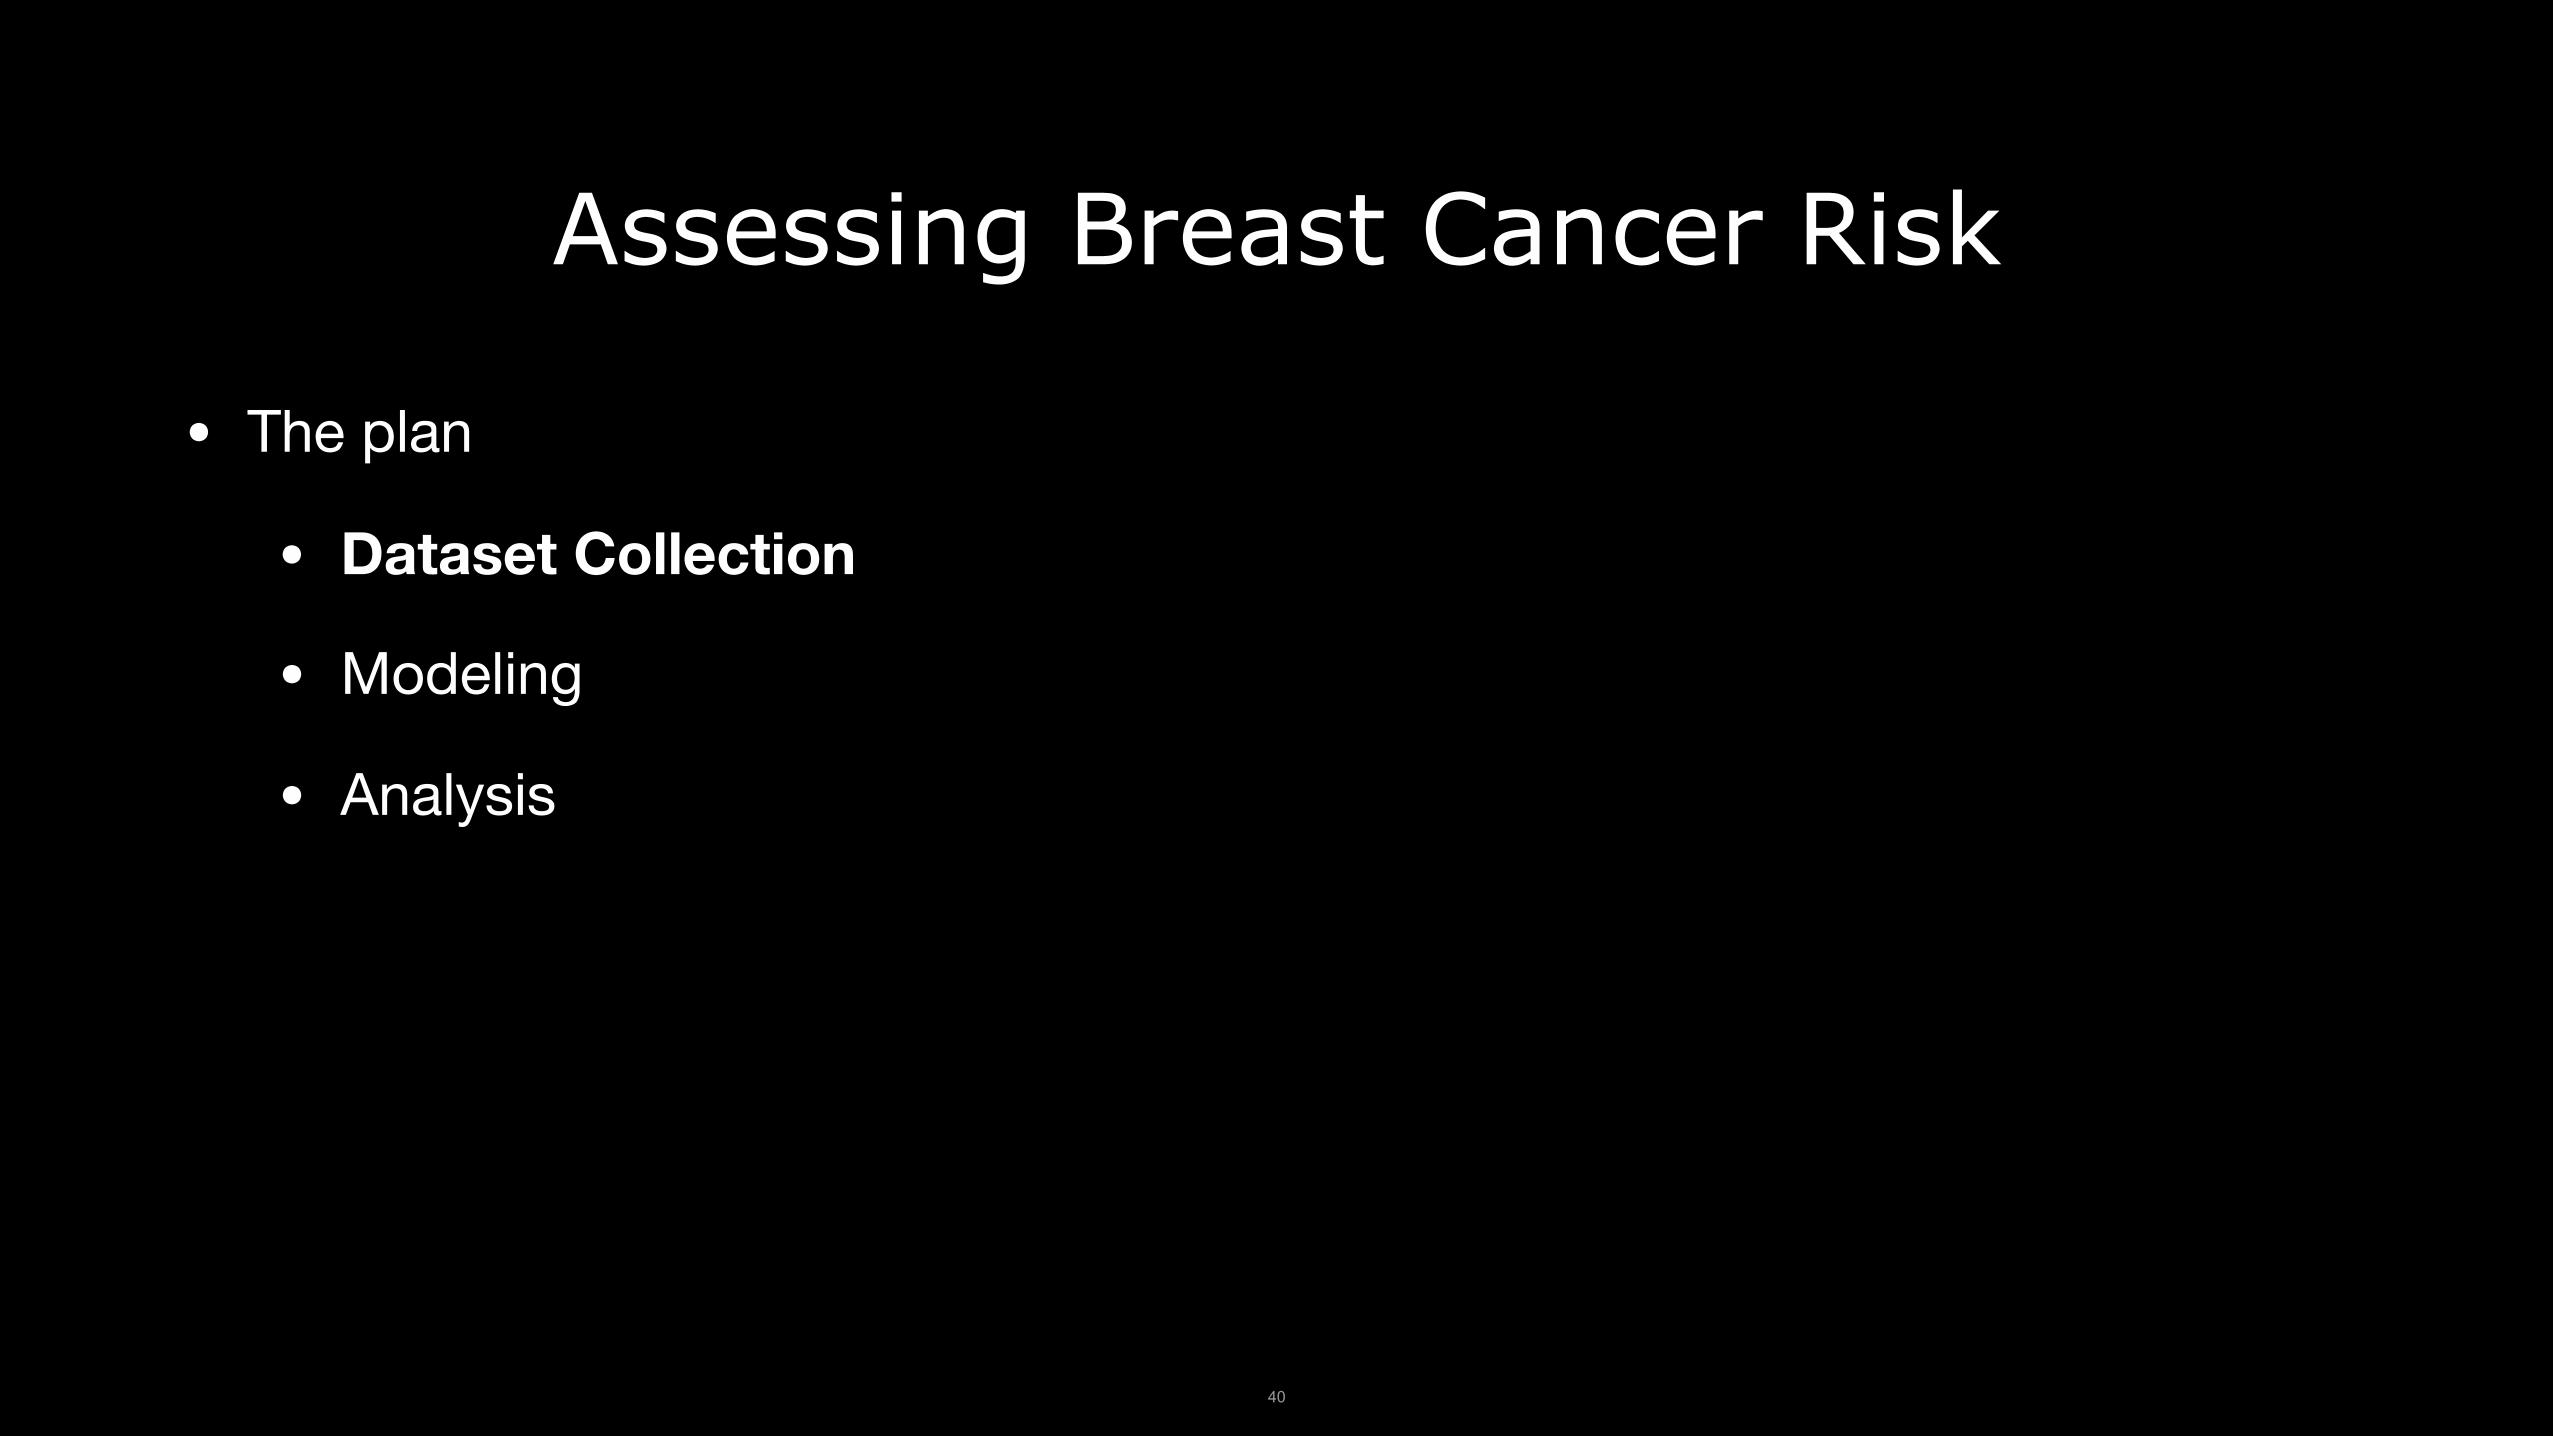
Assessing Breast Cancer Risk
• The plan
• Dataset Collection
• Modeling
• Analysis
40

Dataset Collection • Consecutive Screening Mammograms
• 2009-2012
• Outcomes from Radiology EHR, andPartners
5 Hospital Registry
• No exclusions based on race, implants etc.
• Exclude for followup for negatives
• Split into Train/Dev/Test by Patient flow chart © Radiological Society of North America. All rights reserved. This content is excluded from our Creative Commons license. For more information, see https://ocw.mit.edu/help/faq-fair-use/. 41
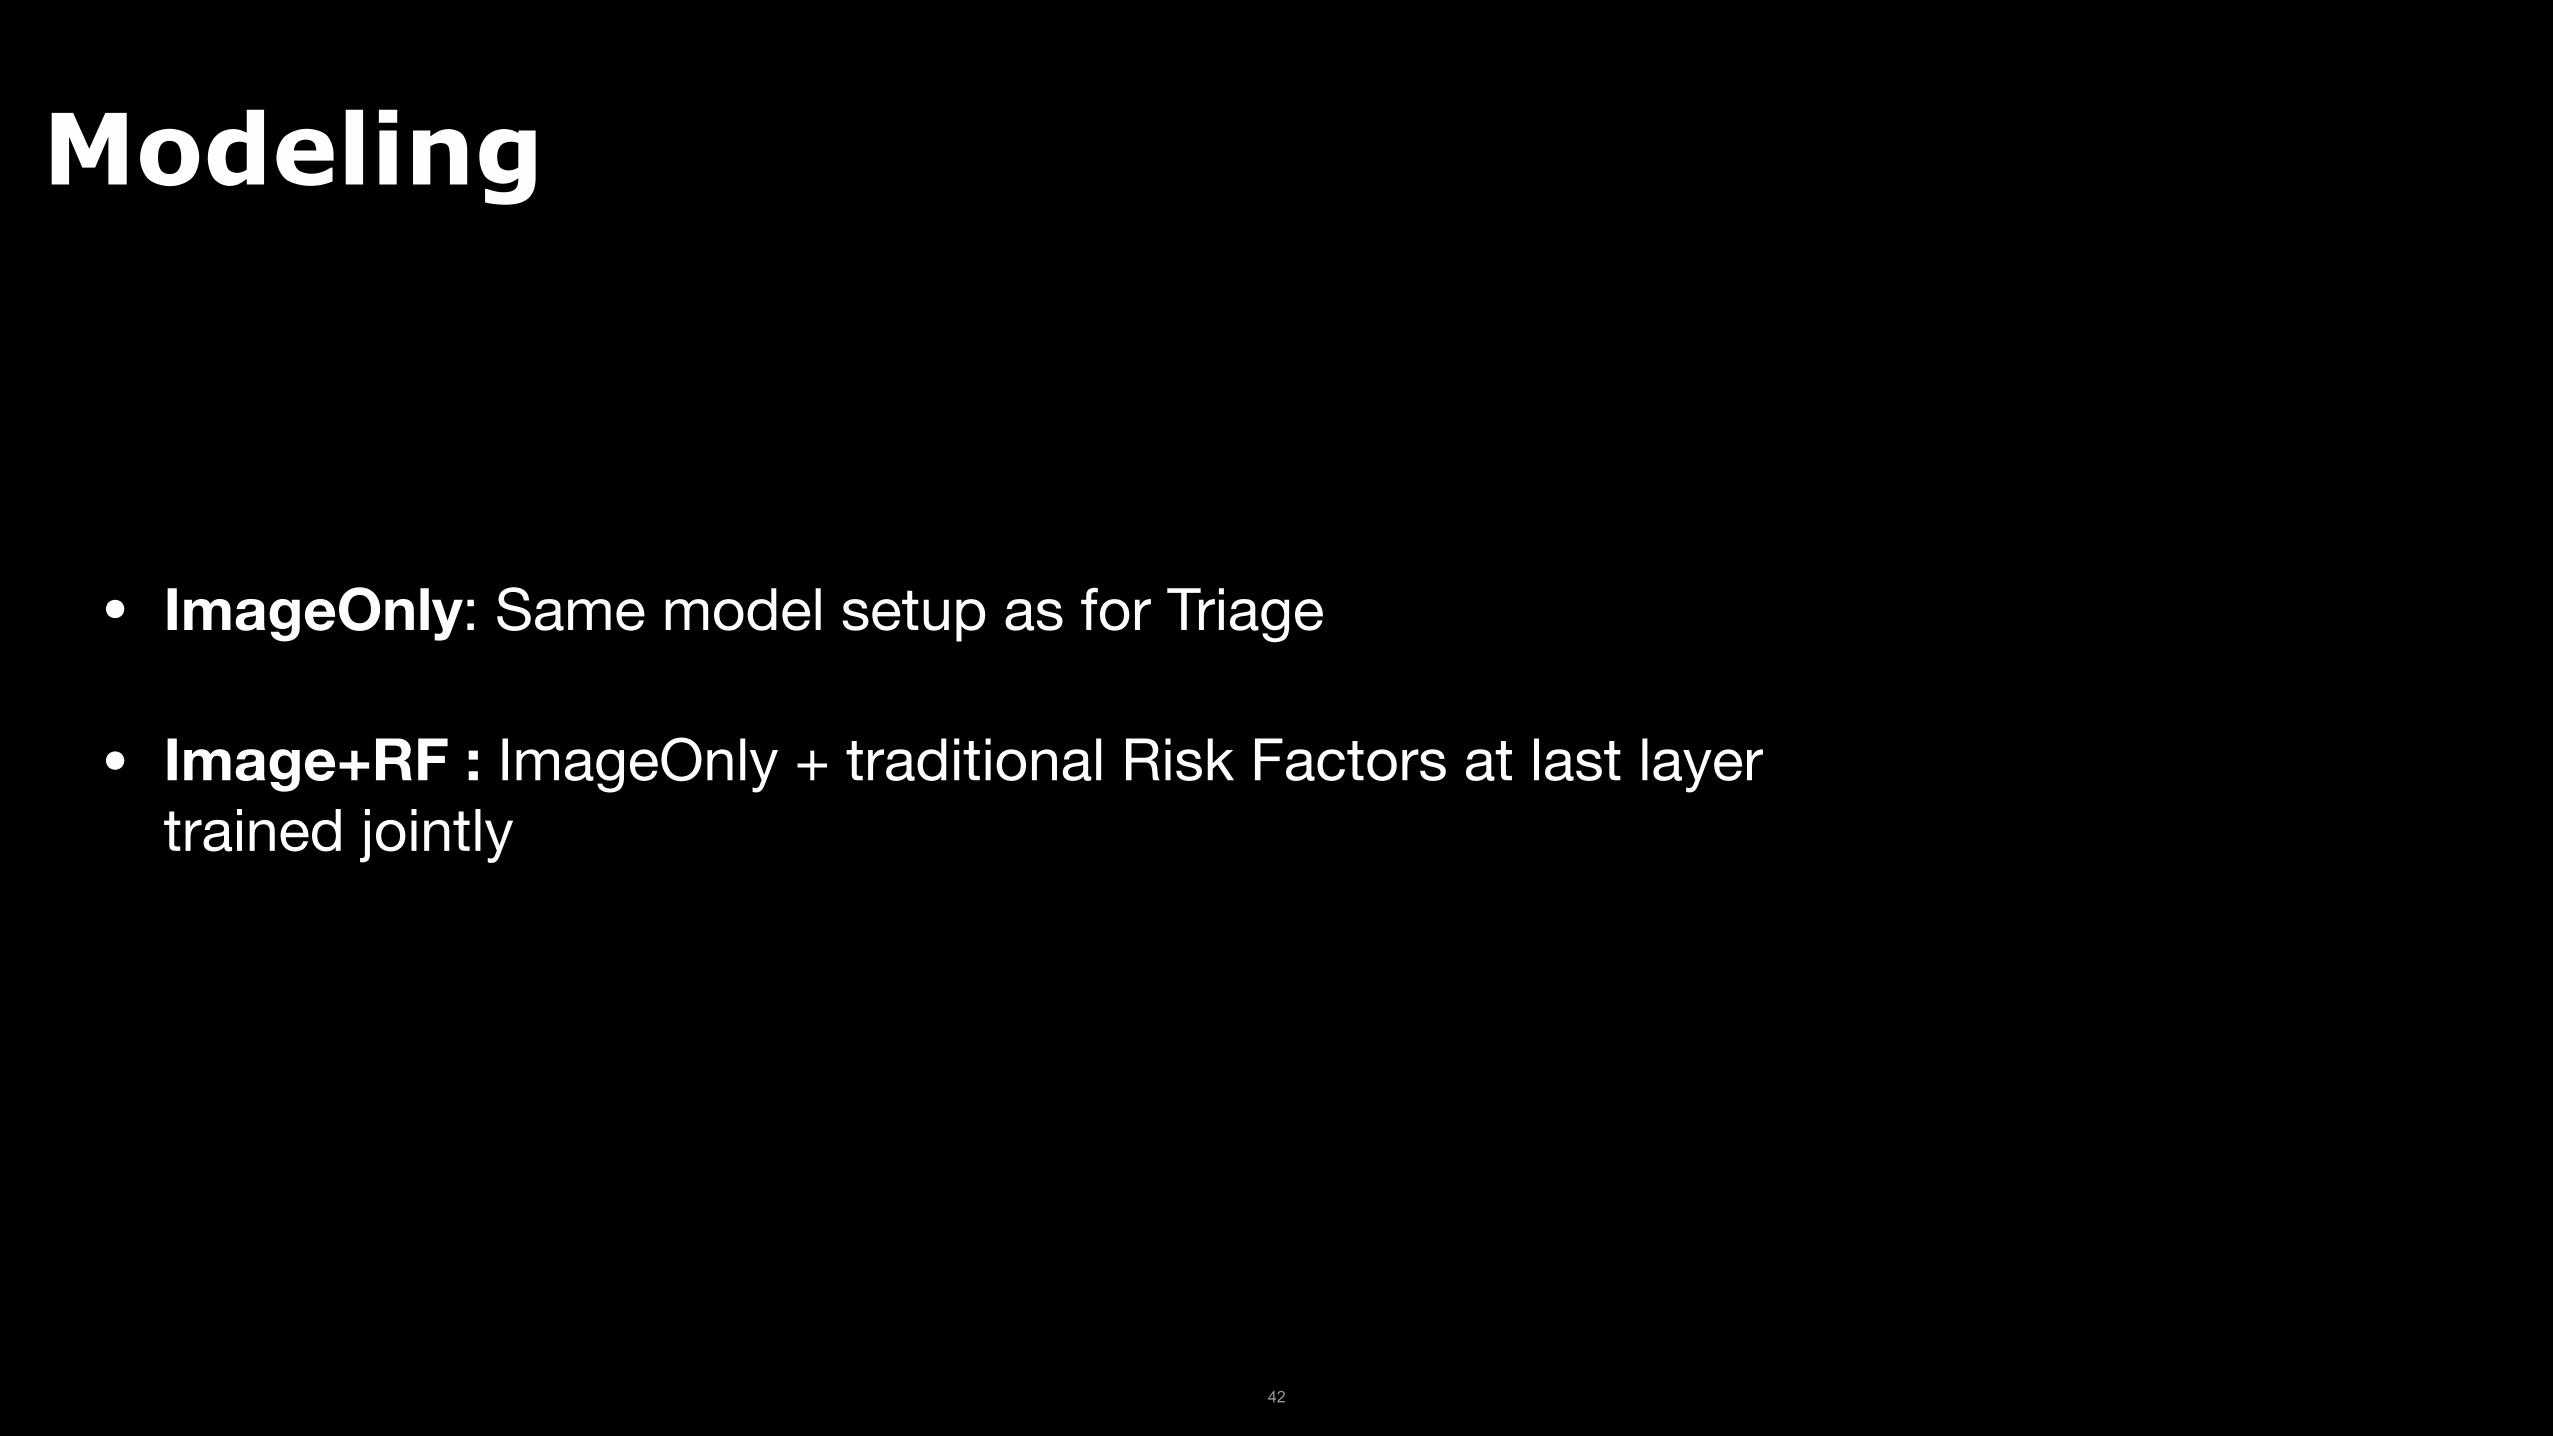
Modeling
• ImageOnly: Same model setup as for Triage
• Image+RF : ImageOnly + traditional Risk Factors at last layertrained jointly
42
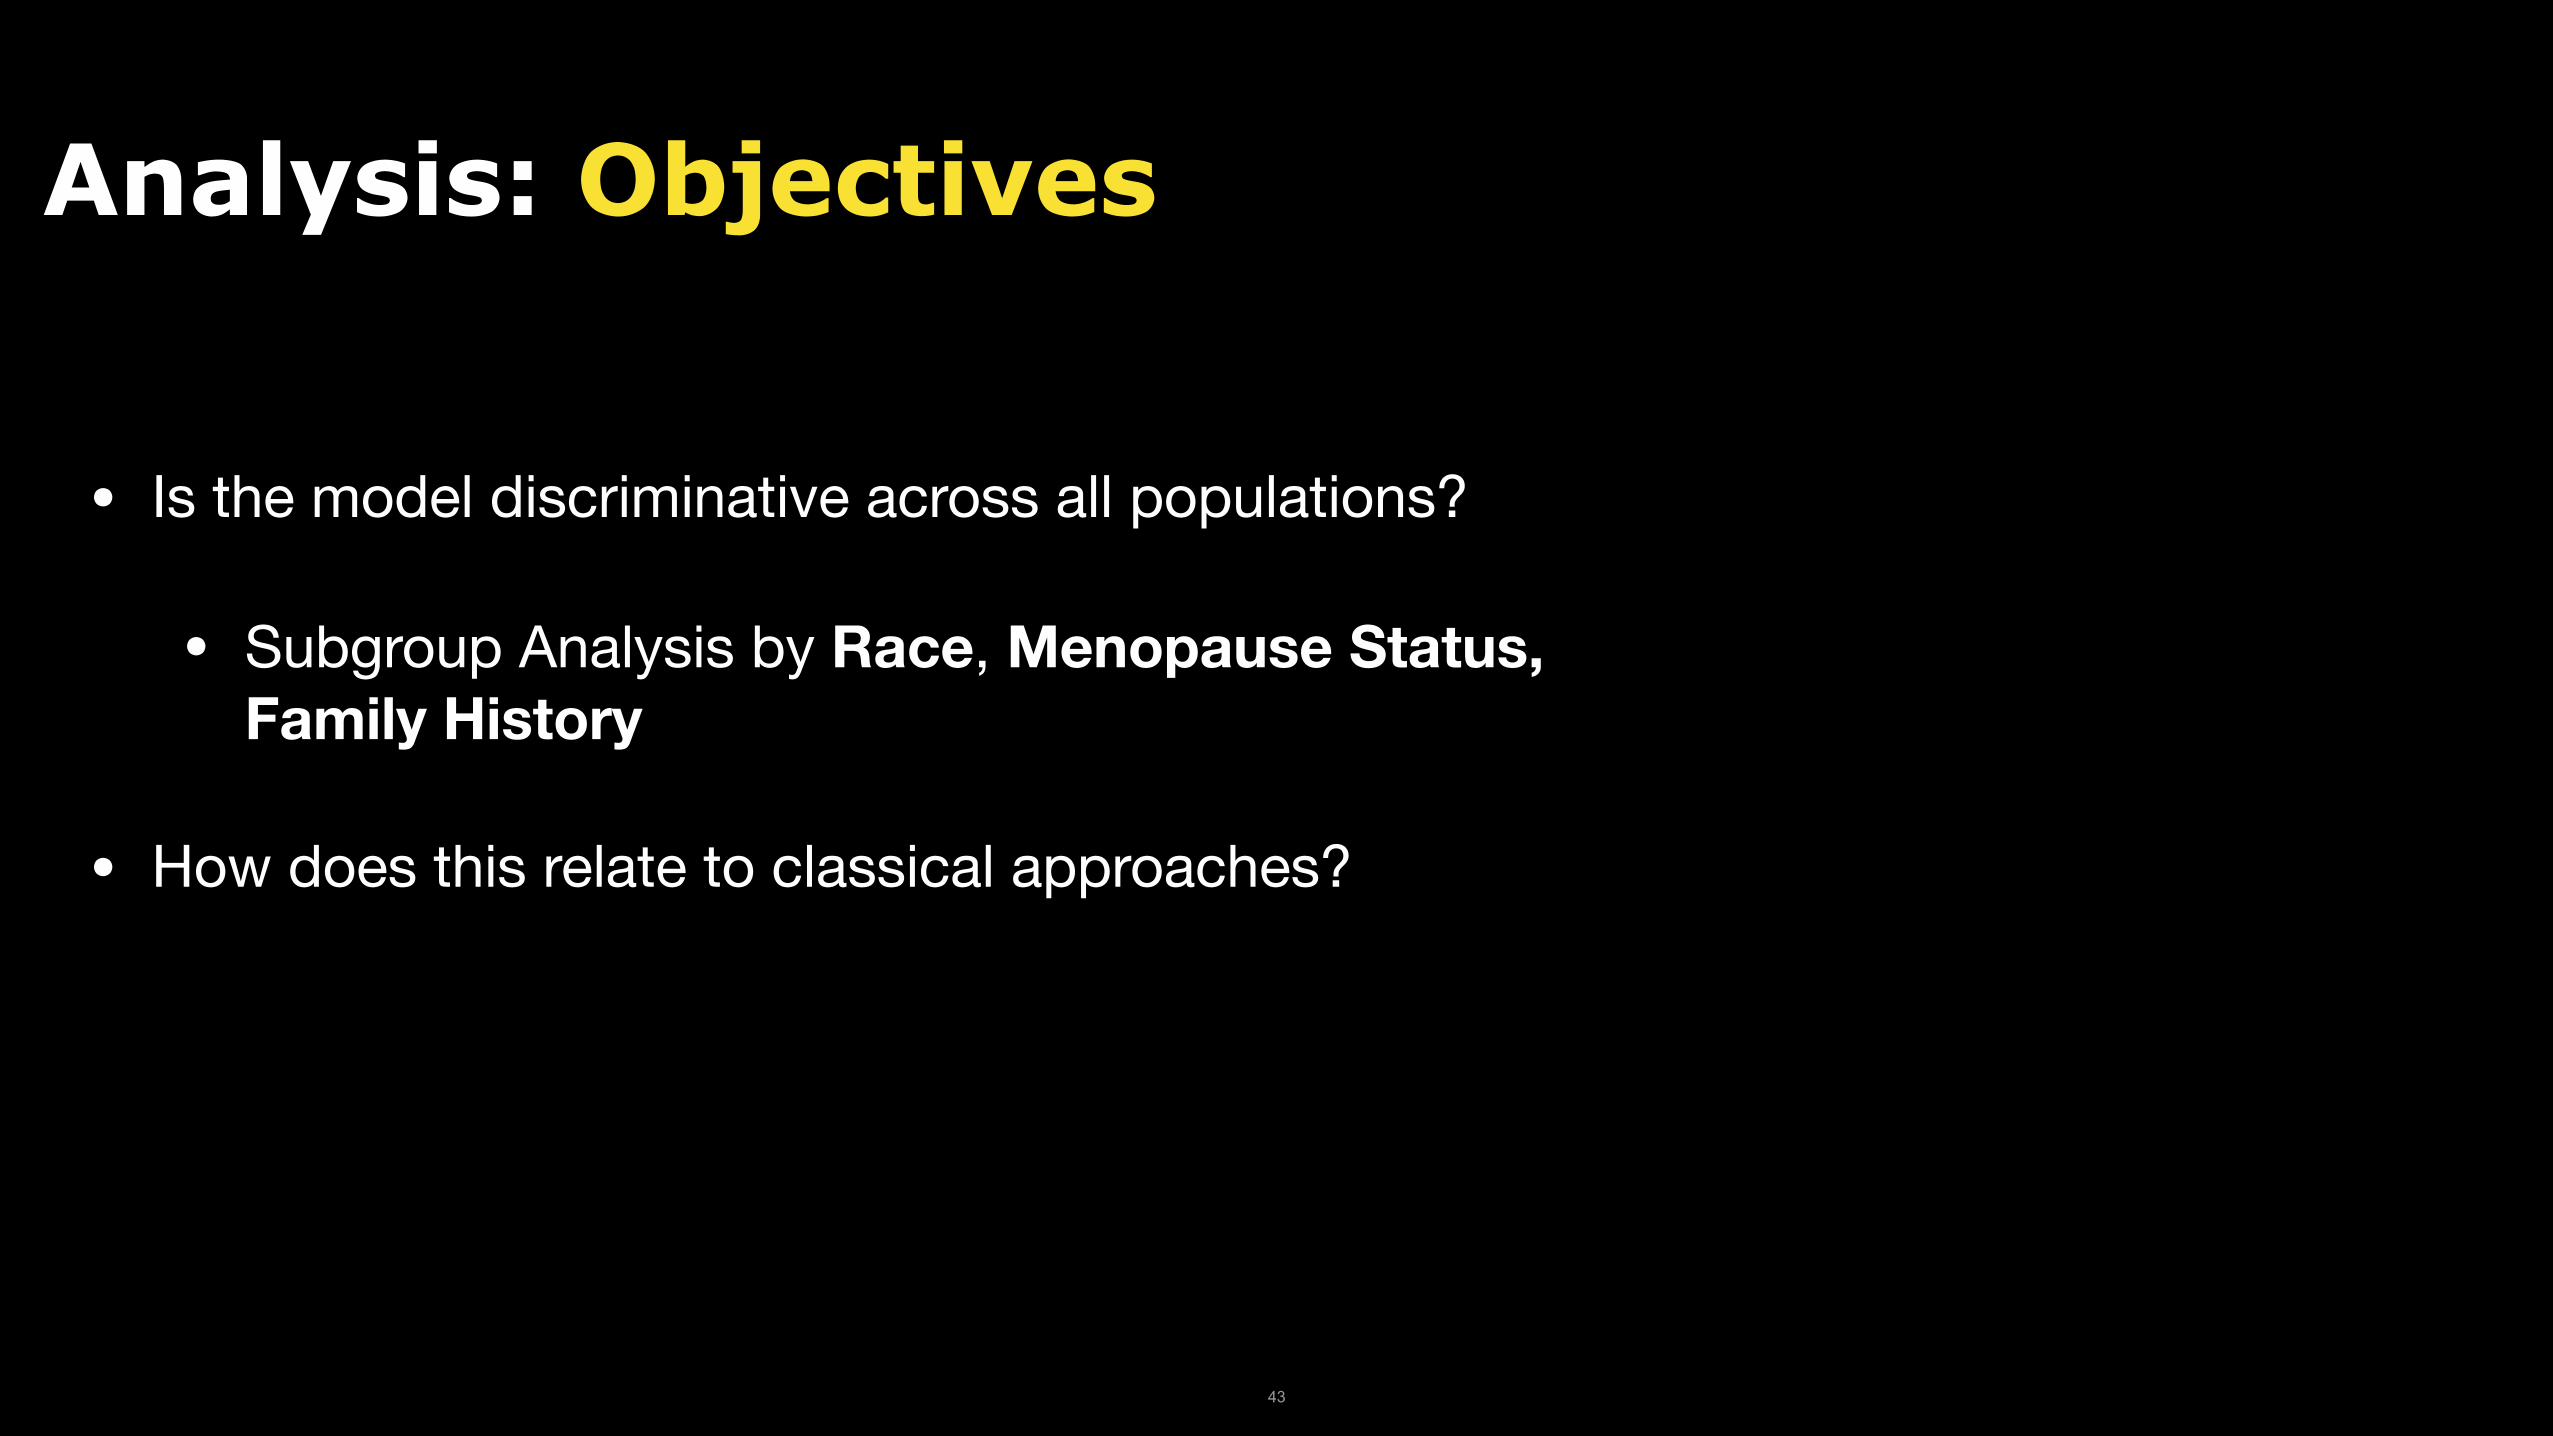
Analysis: Objectives
• Is the model discriminative across all populations?
• Subgroup Analysis by Race, Menopause Status,Family History
• How does this relate to classical approaches?
43

5 Year Breast Cancer Risk
Testing Set: Training Set: Patients: 3,937Patients: 30,790 Exams: 8,751Exams: 71,689
Exclude Cancers within 1 Year of No Exclusions mammogram
44
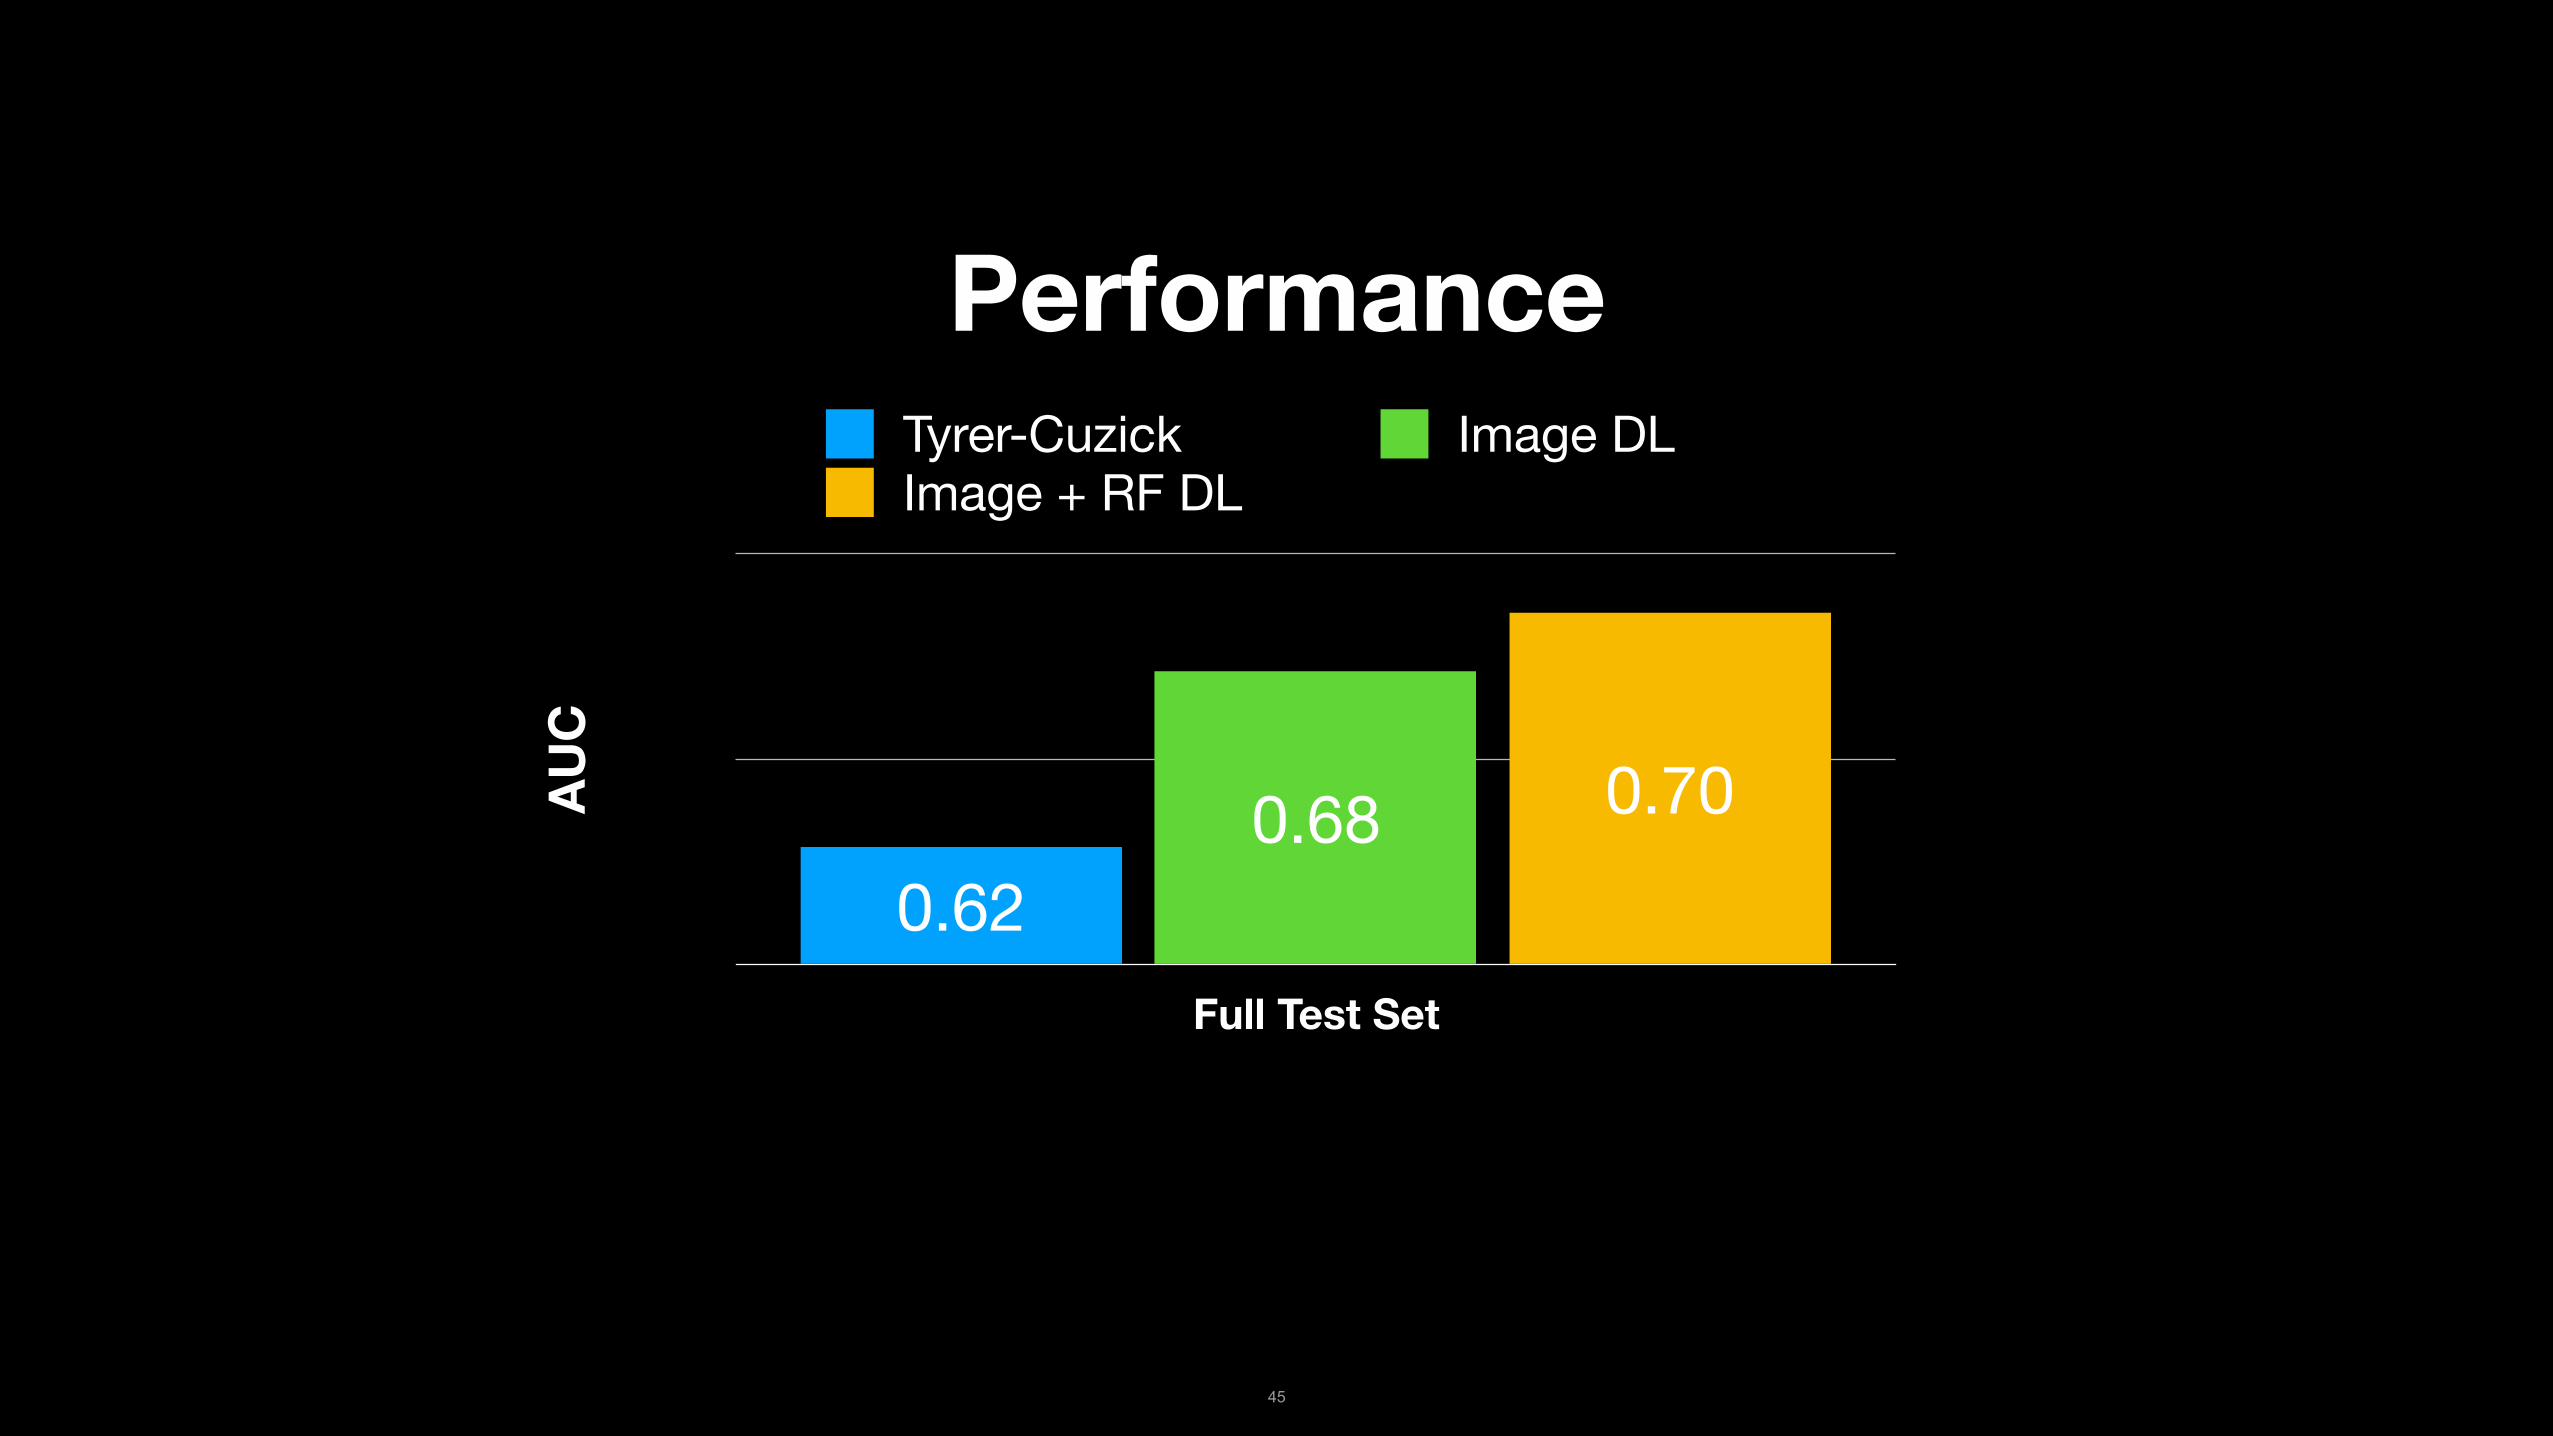
Performance Tyrer-Cuzick Image DLImage + RF DL
0.72 AU
C
0.65 0.700.680.62
Full Test Set
45

Performance Tyrer-Cuzick Image DLImage + RF DL
% o
f all
Can
cers
13
27
40
31.20
3.00
21.6
3.7
18.2
4.8
Bottom 10% Risk Top 10% Risk
46

Performance Tyrer-Cuzick Image DLImage + RF DL
AUC
0.56
0.72
0.710.71 0.690.69
0.450.62
White Women African American Women
47

e-Men
opause
Post-Men
opause
With Fam
ily H
istory
Without F
amily
Hist
ory
Pr
Performance Tyrer-Cuzick Image + RF DL
AUC
1
1
1
1
0.710.700.700.79
0.660.590.58
0.73
Category Axis 48

Performance
49
© Radiological Society of North America. All rights reserved. This content is excluded from our Creative Commons license. For more information, see https://ocw.mit.edu/help/faq-fair-use/.

Performance
© Radiological Society of North America. All rights reserved. This content is excluded from our Creative Commons license. For more information, see https://ocw.mit.edu/help/faq-fair-use/.
50

Next Step: Clinical Implementation
51

Agenda
‣ Interpreting Mammograms
- Cancer Detection and Triage
- Assessing Breast Density
‣ Assessing Breast Cancer Risk
‣ How to Mess Up
‣ How to Deploy
52

How to Mess Up
• The many ways this can go wrong:
• Dataset Collection
• Modeling
• Analysis
53

How to Mess Up: Dataset Collection • Enriched Datasets contain nasty biases
• Story: Emotional Rollercoaster in Shanghai
• Dataset with all Cancers collected first.
• Negatives collected consecutively from 2009-2016
• Use old images (Film mammography) or datasets with huge tumors.
• Use a dataset without tumor registry linking.
• Is your dataset reflective of your actual use-case?
54

How to Mess Up: Modeling
• Assume the model will be Mammography Machine invariant
• Now exploring conditional-adversarial training…
55

How to Mess Up: Analysis
• Only Test your model on White women and exclude inconvenient cases
• Common standard in classical risk models; can’t assume model will transfer.
• Assume reader study = clinical implementation
56

Agenda
‣ Interpreting Mammograms
- Cancer Detection and Triage
- Assessing Breast Density
‣ Assessing Breast Cancer Risk
‣ How to Mess up
‣ How to Deploy
57

How to Deploy?
2 3
Docker Container
Flask Webapp
Model
Dicom Tool HTTP POST
IT Application SQL Store
EHR
1 Fetch DCM
PACs
58

MIT OpenCourseWare https://ocw.mit.edu
6.S897 / HST.956 Machine Learning for HealthcareSpring 2019
For information about citing these materials or our Terms of Use, visit: https://ocw.mit.edu/terms
59