7. mass balance model calibration
TRANSCRIPT

Limno-Tech, Inc. 124
7. MASS BALANCE MODEL CALIBRATION
7.1 OVERVIEW
Chapter 5 presented development of the Hudson River Toxic Chemical Model (HUDTOX) which included the conceptual framework, governing equations and spatial-temporal scales. Chapter 6 presented the organization and analysis of available data to specify the required model forcing functions, initial conditions, rate coefficients and state variables. This chapter presents results from calibration of the HUDTOX model to site-specific data for solids and PCB state variables. It also includes results from sensitivity analyses for important model inputs and process mechanisms. The calibration results in this chapter provide the foundation for use of the HUDTOX model in conducting forecast simulations to estimate long-term responses to continued No Action and impacts due to a 100-year peak flow in Chapter 8.
The principal model application was a long-term historical calibration for Tri+ for a 21-year period from 1977 to 1997. The historical calibration was tested through short-term hindcast applications for total PCBs and five individual congeners from 1991 to 1997. Consistent with the Reassessment questions, emphasis was placed on calibration to long-term trends in sediment and water column PCB concentrations. Additional, independent model validation is described in Chapter 9.
The following major sections are included in Chapter 7:
7.2 Calibration Strategy
7.3 Solids Dynamics
7.4 Historical Tri+ Calibration
7.5 Sensitivity Analyses
7.6 1991-1997 Hindcast Applications
7.7 Calibration Findings and Conclusions
The model was successful in its primary objective, representation of long-term trends in PCB behavior in the Upper Hudson River. This was best demonstrated by comparison to 21-year trends in surface sediment Tri+ concentrations and in-river solids and Tri+ mass transport. Tests of model performance conducted for the 1991-1997 data-intensive period were also successful in demonstrating model reliability. Localized and transient discrepancies between the model and data were viewed as having minimal significance to the model’s reliability for long-term forecasting as required for the Reassessment. Many different metrics were used to demonstrate model reliability and they should be used collectively in a “weight of evidence” approach.
7.2 CALIBRATION STRATEGY
The calibration strategy can be described as minimal and conservative. It was minimal in the sense that external inputs and internal model parameters were determined independently to the

Limno-Tech, Inc. 125
fullest extent possible from site-specific data (as presented in Chapter 6), and only a minimal number of parameters were determined through model calibration. It was conservative in the sense that parameters determined through model calibration were held spatially and temporally constant unless there was supporting information to the contrary.
A 21-year historical calibration was the principal development vehicle for the model. The calibration focused on representing long-term Tri+ trends in water and sediment. The Tri+ form was the principal focus of the calibration because comparable measurements were available in all calibration datasets. Tri+ is the sum of the tri and higher chlorinated PCB congeners. Details of selection of Tri+ as the principal state variable are presented in Chapter 6. Also presented in Chapter 6 is the development of all inputs for model flows and loadings for the calibration period.
The following factors were the most important in controlling long-term trends in sediment and water column Tri+ concentrations in the Upper Hudson River:
• Hydrology;
• External solids loads;
• External Tri+ loads;
• Tri+ partitioning;
• Sediment-water mass transfer under non-scouring flow conditions;
• Solids burial rates; and,
• Particle mixing depth in the sediments.
The first three of these factors are external inputs largely defined by data, and the last four are internal processes within the river defined by data, scientific literature and calibration. Long-term solids burial rates were the principal factor controlling long-term Tri+ trends in the river. Partitioning controls the distribution of Tri+ mass between sorbed and dissolved phases, thus influencing sediment-water and water-air mass transfer, and bioavailability to fish. Sediment-water mass transfer under non-scouring flow conditions was found to be the principal source of Tri+ inputs to the water column. Particle mixing depth strongly influenced long-term responses and the vertical distribution of Tri+ in the sediments. With the exception of solids burial rates and particle mixed depth, all model inputs and parameter values were determined using site-specific data and were not adjusted during the model calibration.
The principal datasets used in calibration of HUDTOX were the following:
• Tri+ surface sediment concentration trends;
• Measured solids burial rates from dated sediment cores;

Limno-Tech, Inc. 126
• Computed solids burial rates from a sediment transport model;
• In-river solids and Tri+ mass transport at high and low flows; and,
• Solids and Tri+ water column concentrations.
The historical calibration was conducted simultaneously for solids and Tri+. Operationally, the approach consisted of adjusting four model parameters: gross settling velocities into cohesive and non-cohesive sediment areas; resuspension rates from non-cohesive sediment areas; depth of particle mixing in the sediment bed; and, magnitude of sediment particle mixing.
Based on the flow balance and solids loads developed in Chapter 6, solids and Tri+ dynamics in HUDTOX were calibrated to achieve long-term results consistent with the calibration datasets listed above. In the simultaneous solids and Tri+ calibration, primary emphasis was placed on representing long-term historical rates of decline for Tri+ in the water column and surface sediments from 1977 to 1997. The calibration sought to describe mean high and low flow solids and Tri+ dynamics in the river. Calibration to short-term event dynamics was not emphasized because detailed representation of short-term event impacts was not necessary to answer the principal Reassessment questions.
The model calibration was tested with a short-term 1991-1997 hindcast application for total PCBs and five congeners (BZ#4, BZ#28, BZ#52, BZ#[90+101] and BZ#138). The physical-chemical properties of the five congeners span a wide range of partitioning and volatilization behavior. These important differences in environmental behaviors provided opportunity to test the rigor of the Tri+ calibration, especially sediment-water and air-water exchange processes. For example, model results for a highly volatile congener may be more sensitive to errors in sediment-water exchange than a less volatile congener. Likewise, model results for a strongly partitioning congener may be more sensitive to errors in particle-based PCB processes such as settling than a weaker partitioning congener.
7.3 SOLIDS DYNAMICS
7.3.1 Calibration Approach
Solids dynamics in the Upper Hudson River are strongly driven by hydrology and external solids loads. Hydrology and external solids loads were developed in Chapter 6 using data-based balances for tributary and mainstem flows and solids mass transport. Internal processes of settling and resuspension largely determine the long-term PCB fate in the sediment bed. Long-term sediment burial or erosion rates are determined by the net effect of deposition and resuspension processes. The calibration approach for solids dynamics in HUDTOX consisted of adjusting constant gross settling velocities for cohesive and non-cohesive sediment areas, and resuspension rates from non-cohesive sediment areas. Flow-driven resuspension from cohesive sediment areas was computed internally in the model using algorithms based on the Depth of Scour Model.
Solids burial rates were determined by model calibration using the following principal constraints:

Limno-Tech, Inc. 127
• Measured burial rates from dated sediment cores;
• Computed burial rates from a sediment transport model;
• Tri+ surface sediment concentration trends; and,
• In-river solids and Tri+ mass transport at high and low flows.
The first two constraints are described below.
Information on solids burial rates was available from two sources: first, measurements from eight high resolution sediment cores (USEPA, 1997); and second, results from SEDZL, a coupled hydrodynamic-sediment transport model for the Upper Hudson River (Quantitative Environmental Analysis, 1999). There are limitations to the high-resolution sediment cores that preclude direct use of these data as calibration inputs. The cores are few in number and are not considered representative of average solids burial rates on the spatial scale of the HUDTOX model. Furthermore, measurements from these cores represent burial rates only in cohesive sediment areas. Therefore these data were used as upper bounds on burial rates and as only one of four sources of calibration guidance.
The calibration of solids dynamics in the model was also guided by computed solids burial rates from SEDZL, a coupled hydrodynamic-sediment transport model for the Upper Hudson River developed by General Electric Company contractors (QEA, 1999). Flow and solids load inputs to the SEDZL model were developed using essentially the same methods and data as development of flow and load inputs to HUDTOX and hence, results are transferable. The SEDZL results were in general agreement with estimated burial rates from the USEPA high-resolution sediment cores (QEA, 1999). SEDZL results were within a factor of two of measured burial rates from all but one of the high-resolution sediment cores. Agreement was within a factor of five for the remaining sediment core. The SEDZL model results contain uncertainty, however, due to limited data and large uncertainty in model inputs (especially solids loads downstream of Thompson Island Pool). These uncertainties affect long-term solids burial rates in both cohesive and non-cohesive sediment areas. These limitations notwithstanding, results from the SEDZL model were considered reasonable and the best available estimates of solids burial rates on a reach-average basis.
Ultimately, solids burial rates were determined through model calibration using available site specific information for the four principal constraints listed above. The model calibration led to additional upward adjustment of low flow solids loadings between Schuylerville and Waterford, beyond the estimates presented in Chapter 6. This adjustment was considered to be within the large range of uncertainty in tributary loadings estimated from the sparse available data for the major tributaries downstream of the Thompson Island Dam.
7.3.2 Solids Calibration Results
Values for all solids calibration input parameters are presented in Tables 7-1 and 7.2. The calibration of the solids dynamics is demonstrated for:

Limno-Tech, Inc. 128
• Long-term solids burial rates;
• In-river solids mass transport at low and high flow;
• Water column solids concentration time series from 1977 to 1997;
• Solids mass balances for the Spring 1994 high-flow event;
• Water column solids concentrations during several high flow periods; and,
• Scatter plots and cumulative probability distributions of solids concentrations at low and high flow.
Each is discussed below.
7.3.2.1 Burial Rates
Model calibration results for long-term, reach-average burial rates in cohesive and non-cohesive sediment areas are presented in Figure 7-1. Over the calibration period, the HUDTOX model represents the Upper Hudson River as a whole to be net depositional, based on the assumption underlying development of tributary solids loads in Chapter 6. Computed solids burial rates are generally an order of magnitude larger in cohesive sediments (0.24 to 1.50 cm/yr) than in non-cohesive sediments (0.04 to 0.10 cm/yr). No results for cohesive sediments are reported for the Federal Dam reach because this reach consists almost exclusively of non-cohesive sediment areas and it was represented as completely non-cohesive in the HUDTOX model.
Reach average results for cohesive and non-cohesive sediment areas were compared to the SEDZL model results, one of four primary calibration constraints. Model burial rates were generally consistent with SEDZL results except where differences were necessary to achieve simultaneous agreement with Tri+ surface sediment concentrations and solids dynamics. This resulted in somewhat lower burial rates for Thompson Island Pool than those computed by the SEDZL model. In Thompson Island Pool, solids burial rates for cohesive and non-cohesive sediment areas in the HUDTOX calibration were 0.65 and 0.07 cm/yr, respectively. In the SEDZL calibration, the corresponding solids burial rates were 0.81 and 0.03 cm/yr (QEA, 1999).
7.3.2.2 High and Low-flow Solids Loads
In addition to achieving agreement with solids burial rates and long-term surface sediment Tri+ trends, another important calibration test was comparison to estimated high and low flow solids mass transport in the river. These mass transport values can be viewed as in-river solids loads. Results were stratified using a river flow of 10,000 cfs at Fort Edward to represent the approximate cutpoint above which flow-dependent resuspension is observed (See Figure 6-12). Flows below and above 10,000 cfs are referred to as “low flow” and “high flow”, respectively, throughout this report. Use of a single flow cutpoint is a simple and convenient way to evaluate model behavior under resuspension and non-resuspension conditions, however, recognize that no single flow cutpoint completely separates these conditions at all locations in the River.

Limno-Tech, Inc. 129
There is good agreement between model and data-based estimates of the solids loads at Stillwater and Waterford for both high and low flows (Figure 7-2). This suggests the model is representing average high and low flow behavior for the historical calibration period. Estimated solids loads were based on the rating curves presented in Chapter 6, which were not developed for Thompson Island Dam. There was not a strong relationship between solids concentration and flow in the available data at this location. At Stillwater and Waterford, differences are less than four percent for both low and high flow. In-river solids loads are split almost equally between high and low flow conditions, consistent with observations presented in Section 6.5.
It must be noted that initial calibration efforts were not successful in reconciling estimated tributary solids loads with solids and Tri+ water column concentrations and in-river solids loads below Thompson Island Pool at low flow. Calibration analyses indicated that decreasing gross solids settling velocities or increasing solids resuspension velocities produced results that were not in good agreement with Tri+ surface sediment concentrations or water column concentrations. Upward adjustment of low flow tributary solids loads downstream of Thompson Island Pool provided better agreement with both Tri+ and solids concentrations, and also improved model agreement with long term sediment Tri+ concentrations. Solids loads were adjusted by adding a total constant additional load of 40 MT/day to the Schuylerville-Stillwater and Stillwater-Waterford reaches. These adjustments represent increases of 26 and 17 percent, respectively to the total tributary loads for these two reaches. The magnitude of this adjustment was considered to be within the large range of uncertainty in estimation of tributary solids loads below TIP.
7.3.2.3 Water Column Solids Concentrations
The model calibration was evaluated by comparing computed water column suspended solids concentrations to long-term data over the 21-year calibration period and short-term intensive data during four high-flow events. Each is described below.
The calibrated model results for water column solids over the 21-year calibration period show reasonable fit at both high and low flow observations across the entire period at Thompson Island Dam, Schuylerville, Stillwater and Waterford (Figure 7-3 a and b). Results shown for the first model segment downstream of Fort Edward represent solids loading inputs at the upstream boundary and are shown only for reference. Note that data are only available for Thompson Island Dam from 1991 to 1997. The solids concentrations throughout the year, and especially during high flow events were found to be strongly driven by hydrology and external solids loads. Solids concentrations are much higher in reaches below Thompson Island Pool and reflect the much higher external solids loads to this portion of the river (Section 6.5). Both computed and observed peak concentrations generally range between 50 and 100 mg/l at TID and Schuylerville, and between 100 and 400 mg/l at Stillwater and Waterford.
Although the calibration strategy focused on accurate representation of long-term Tri+ trends and mean high and low flow solids dynamics, it is of interest to assess model performance for high flow events when flow-dependent resuspension is important. Suspended solids results for the spring high flow periods during 1983, 1993, 1994 and 1997 are shown in Figures 7-4 through 7-7. These four events are among the most extensively sampled events in the calibration period. Results are of particular interest in 1993 and 1994 because sampling frequencies were higher than in 1983 or 1997.

Limno-Tech, Inc. 130
In general, timing of computed and observed concentration peaks is in fair agreement. This is largely because water column solids concentrations are strongly driven by hydrology and external solids loads, especially during high flows. The computed peak concentrations at times tend to be lower than observed peak concentrations. This is especially evident at Stillwater. This is not unexpected considering the model calibration strategy of capturing mean high flow solids dynamics. There is good agreement between computed and observed concentrations at Thompson Island Dam during spring 1994, a period during which daily measurements were available.
The model calibration to peak concentrations at Stillwater appears weakest, but may be partially explained by errors in estimated tributary flow, especially for Batten Kill. While solids concentrations were measured for Batten Kill over much of the 1994 event, Batten Kill flows were estimated based on Kayaderosseras Creek flows, which drain a much smaller watershed and thus are expected to exhibit a more “flashy” response to precipitation or snowmelt (See Section 6.4). Closer agreement occurs at Thompson Island Dam, shown for the 1994 and 1997 events.
7.3.2.4 Spring 1994 High Flow Event Solids Mass Balance
The model calibration was also evaluated by comparing model-estimated and data-estimated solids mass balances for Thompson Island Pool during the spring 1994 high flow event. This is the only reach in the Upper Hudson River for which there exists a well-constrained solid mass balance for mainstem and tributary solids loads. For the 33-day period (March 29 to April 30) encompassing this event, measurements were available for flows and water column concentrations for the two major tributaries and upstream inputs. This permitted development of an input-output solids mass balance for this event. The model-based estimate of 400 MT net erosion during this event agrees within three percent of the data-based estimate of 411 MT.
7.3.2.5 Further Model-Data Comparisons
To provide insights into model behavior and the limits of model capability, calibration results are also shown by comparison of computed and observed water column solids concentrations using scatter plots and cumulative probability functions for model results and data stratified by flow. Presentation of results in this manner shows the model performance in describing individual data. However, it must be recognized that the model calibration approach was not aimed at describing the full range of observed event-scale behavior. The solids calibration sought to describe mean low and high flow behavior. Considering this, model agreement with mean or median concentration results is of more interest than a good fit across the range of observed behavior. In fact, the model may be expected to show offsetting errors at the high and low end of each flow range.
Scatter plot results for Thompson Island Dam, Stillwater and Waterford are shown in Figures 7-8 and 7-9 for low and high flows, respectively. The model and data mean values are shown on these figures by the horizontal and vertical crossed lines, as is the 1:1 correspondence line. Even on log-log scale, the high variability in agreement between model and data is evident. Inspection of these plots shows that the model tends to over compute low concentrations and under compute high concentrations in each flow range, an expected result of the model because it is calibrated to mean low and high flow behavior. Note that the model and data means intersect at the 1:1 line (meaning they are nearly identical) for both high and low flows. Agreement is best for Stillwater and

Limno-Tech, Inc. 131
Waterford. At Thompson Island Dam, the model appears to be biased slightly low under low flow conditions and slightly high at high flow conditions.
Probability distributions provide similar insights as the scatter plots. Computed and observed cumulative probability distributions for solids concentrations at Thompson Island Dam, Stillwater and Waterford are presented in Figures 7-10 and 7-11 for low and high flows, respectively. The same observations regarding model behavior can be made in these figures as the scatter plots. At Stillwater and Waterford, the computed and observed median values tend to agree, which was the intent of the calibration, while the model shows offsetting biases at low and high concentrations of each flow range. At Thompson Island Dam, the model results are good at low flow, however, show considerably higher concentrations than were observed at high flow.
While the model agreement with data at high flow for Thompson Island Dam is not ideal, the overall significance of this to use of the model for the Reassessment is small. Fish PCB levels do not respond at any significant level to short-term event concentrations. The model was successfully calibrated to estimates of long-term solids burial rates and sediment Tri+ concentrations. The water column Tri+ concentrations that affect fish levels are determined largely by sediment-water transfer mechanisms that are not flow driven, and by upstream Tri+ loadings at Fort Edward. Therefore, additional model calibration to high flow dynamics was deemed unnecessary for the Reassessment.
7.3.3 Components Analysis for Solids
Over the 21-year calibration period, the HUDTOX model represents the Upper Hudson River as a whole to be net depositional, based on the assumption underlying development of tributary solids loads. The computed average bed elevation change in Thompson Island Pool over the 21-year calibration period is approximately 4.5 cm (Figure 7-12). Computed annual average burial rates in cohesive and non-cohesive sediment areas from Fort Edward to Federal Dam are shown over specific river mile intervals in Figure 7-13. Burial rates in cohesive sediments range from 0.24 to 1.49 cm/yr while burial rates in non-cohesive sediments do not exceed 0.10 cm/yr. Computed burial rates in cohesive sediment areas are approximately an order of magnitude greater than those computed in non-cohesive sediment areas.
A 21-year solids mass balance components analysis from the calibrated model is shown in Figure 7-14 for the four major reaches in the Upper Hudson River. These four reaches represent the river from Fort Edward to Thompson Island Dam, Thompson Island Dam to Schuylerville, Schuylerville to Stillwater, and Stillwater to Waterford. All four reaches are computed to be depositional over the 21-year calibration period. There is a computed net load gain to the water column of 3,043 x 103 MT (497 percent) between Fort Edward and Waterford. Contributions to solids load gain are dominated by tributary loads. Gross sediment resuspension accounts for only 21 percent of the total solids inputs to the water column. Tributary loads (including Fort Edward) and sediment resuspension contribute 4,183 x 103 MT (79 percent) and 1,128 x 103 MT (21 percent), respectively, between these locations.
It is noteworthy that approximately 80 percent of computed solids inputs to the water column are due to external sources and only approximately 20 percent are due to sediment resuspension. Furthermore, these proportions change only slightly when solids mass balance components
Limno-Tech, Inc. 132
analyses are conducted separately for high and low flows. It can be concluded that although sediment resuspension is important, water column solids concentrations and in-river solids loads are driven primarily by hydraulics and solids loads from upstream and tributary sources, even under high flow conditions.
7.3.4 Solids Calibration Summary
The calibration approach for solids dynamics in the historical calibration consisted of adjusting constant gross settling velocities into cohesive and non-cohesive sediment areas, and resuspension rates from non-cohesive sediment areas. These parameters were adjusted to meet the simultaneous constraints of long-term Tri+ concentrations in the surface sediments, solids burial rates, in-river solids loads, water column solids concentrations, and long-term water column Tri+ concentrations. The HUDTOX model represents the Upper Hudson River as a whole to be net depositional from 1977 to 1997, based on the assumption underlying development of tributary solids loads. Computed solids burial rates in cohesive sediment areas are approximately an order of magnitude greater than those computed in non-cohesive sediment areas. Computed in-river solids loads are split almost equally between high and low flow conditions.
There is a computed net solids load gain to the water column of 497 percent between Fort Edward and Waterford over the 21-year historical calibration. Contributions to solids load gain are dominated by tributary loadings. Computed tributary loadings (including Fort Edward) and gross sediment resuspension contribute 79 and 21 percent, respectively to total solids inputs between these locations. Although sediment resuspension is important, water column solids concentrations and in-river solids loadings are driven primarily by hydraulics and solids loadings from upstream and tributary sources, even under high flow conditions.
The model calibration was demonstrated as successful for purposes of simulating general solids behavior in the Upper Hudson River. Model performance was deemed satisfactory based on:
• Model computed solids burial rates;
• Model computed high and low flow solids loads;
• Representation of the intensely-sampled spring 1994 high flow event; and,
• Statistical comparisons of model mean performance.
Additionally, it must be recognized that the HUDTOX calibration was conducted simultaneously for solids and Tri+ and hence, further support of the calibration is evidenced in the next section describing Tri+ results.
7.4 HISTORICAL TRI+ CALIBRATION
7.4.1 Calibration Approach
Although the solids and Tri+ calibrations were conducted simultaneously, the Tri+ model calibration results are presented separately and involved some considerations that did not affect the solids model. For example, sediment mixed layer depths and mixing rates do not affect water column suspended solids concentrations, however, these parameters have important impacts on
Limno-Tech, Inc. 133
long-term surface sediment Tri+ concentrations. Mixing rates, however, are somewhat less influential than long-term solids burial rates.
In addition to simultaneous use of the calibration datasets for solids dynamics, the additional principal constraints for Tri+ in the historical calibration were:
• Tri+ surface sediment concentrations;
• Solids burial rates;
• In-river Tri+ mass transport at high and low flows; and,
• Tri+ water column concentrations.
As discussed in Section 7.3, the application of simultaneous, mutual constraints on solids and Tri+ ensured consistency between the solids and Tri+ mass balances in the model. However, greater emphasis was placed on trends in sediment and water column Tri+ concentrations, because these were the primary objectives of the model calibration.
The historical calibration was conducted on a reach-average spatial scale. Operationally, the calibration approach consisted of adjusting only four model parameters: gross settling velocities into cohesive and non-cohesive sediment areas; resuspension rates from non-cohesive sediment areas; depth of particle mixing in the sediment bed; and, magnitude of sediment particle mixing. No chemical-specific parameters were adjusted during the Tri+ calibration. External loads, partitioning, sediment-water mass transfer and air-water mass transfer rates were determined solely by Tri+ physical-chemical properties and site-specific data, as described in Chapter 6.
Specification of Tri+ partitioning behavior has significant influence on the model calibration. The model uses three-phase equilibrium partitioning equations that require specification of organic carbon concentrations. Values for site-specific organic carbon input parameters to the model (determined in Chapter 6) are summarized in Table 7-3. Input values for Tri+ process coefficients and state variable properties are presented in Table 7-4. Values for all solids calibration input parameters were presented previously in Tables 7-1 and 7.2.
7.4.2 Tri+ Calibration Results
Results for the Tri+ calibration are presented in a series of comparisons between computed and observed values which include:
• Long-term surface sediment Tri+ concentrations;
• Longitudinal and vertical profiles for Tri+ sediment concentrations;
• Water column Tri+ concentration time series from 1977 to 1997;
• In-river Tri+ loads at low and high flow;
• Scatter plots of water column Tri+ concentrations at low and high flow;

Limno-Tech, Inc. 134
• Cumulative probability distributions of Tri+ concentrations at low and high flow; and,
• Water column Tri+ concentrations during several high flow periods.
7.4.2.1 Long-Term Sediment Tri+ Concentrations
The principal calibration metric was comparison of computed and observed long-term Tri+ concentration trajectories in surface sediments (as shown in Figures 7-15 a-e). These figures show reach-wide average concentrations for five river reaches. Model results are shown for surface sediments, which correspond to the first two sediment layers (0-2 and 2-4 cm). Computed results for deeper sediments are also shown as average concentrations over depth intervals corresponding to the respective sediment datasets.
In addition to the 1977 initial condition data, sediment data were collected in 1991 (for the entire Upper Hudson) and 1998 (mainly for Thompson Island Pool). The vertical resolution of these data (0-5 cm surface layers) permits direct comparison with HUDTOX results for the top two sediment layers in the model. Other sediment data were also collected by USEPA and NYSDEC, but these data did not resolve the 0-5 cm surface layer. As a result, model comparisons to sediment data collected by NYSDEC in 1984 (average depth of approximately 25 cm, TIP only) and by USEPA in 1994 (average depth of approximately 23 cm) are displayed as concentrations averaged over deeper layers.
Computed and observed concentrations in each reach are expressed in terms of area-weighted averages for cohesive and non-cohesive sediments. Data are presented as mean values plus and minus two standard errors (2 SE) which corresponds to the 95 percent confidence interval about the mean. The model trajectories in Figures 7-15a through 7-15e represent Tri+ concentrations for the surface layer. Symbols denote model output averaged over layers corresponding to the average depths of the 1984 and 1994 data.
Model results show very good agreement between computed and observed surface sediment Tri+ concentrations in TIP for both cohesive and non-cohesive sediment areas (Figure 7-15a). Computed concentrations in surface sediments decline by 89 and 80 percent, respectively, in these sediment areas over the historical period from 1977 to 1997. These declines correspond to annual first-order loss rates of approximately 11 and 8 percent, respectively. Declines in surface sediment Tri+ concentrations occur due to burial to deeper sediment layers and sediment-water transfer processes. Agreement with depth-averaged concentrations in 1984 and 1994 is also good, although the vertical scales are coarse and data variability is high. This suggests that the model is accurately accounting for changes in the Tri+ mass reservoir in the sediments of Thompson Island Pool.
There is also generally good agreement between computed and observed surface sediment Tri+ concentrations and deeper concentrations below Thompson Island Dam (Figures 7-15b through 7-15e). A notable exception is for non-cohesive sediments in the Schuylerville reach in 1991 (Figure 7-15b) where data are higher than the model. It is speculated that either the sampling and/or compositing processes used for these data may have incorporated high measured concentrations that were not representative of reach-average conditions. The 1991 non-cohesive

Limno-Tech, Inc. 135
sediment data for this reach appear unrepresentative when compared to the 1994 data and the overall declining trend observed at other locations in the river. Hence this discrepancy was viewed as a likely data anomaly and not a model deficiency.
Computed concentrations in surface sediments in reaches downstream of Thompson Island Pool decline by 91 to 97 percent in cohesive sediment areas and by 82 to 93 percent in non-cohesive sediment areas. These declines correspond to annual first-order loss rates of 11 to 14 percent in cohesive sediment areas and 8 to 12 percent in non-cohesive sediment areas.
7.4.2.2 Longitudinal and Vertical Sediment Profiles
Another way to compare computed and observed sediment concentrations is to assess results at smaller spatial scales along the longitudinal axis of the river and in the vertical. Figure 7-16 contains comparisons of computed and observed depth-averaged (0 to 25 cm) Tri+ concentrations for 1984 in Thompson Island Pool in the longitudinal direction. Because the HUDTOX model represents three lateral spatial segments in Thompson Island Pool, multiple results for computed and observed values are shown at some locations. The model captures changes in Tri+ concentrations at depth along the length of TIP in both cohesive and non-cohesive sediments. This demonstrates that model is representing the approximate magnitude of changes in the sediment Tri+ mass reservoir in TIP.
Figures 7-17 through 7-19 contain comparisons of computed and observed depth-averaged Tri+ concentrations in 1991 (0 to 5 cm, 5 to 10 cm and 10 to 23 cm) from Fort Edward to Federal Dam. The two upper reaches (Thompson Island Pool and Schuylerville) between river miles 193 and 183 are more heavily contaminated than the three lower reaches (Stillwater, Waterford and Federal Dam) between river miles 183 and 153. Computed values cluster well around most of the data values for the 0-5 cm layer in both the upper and lower reaches. Model results are generally good for the 5-10 cm layer with the exception of a high bias (approximately a factor of two) in the very lower reaches between river miles 163 and 153. Model results are not as good for the 10-26 cm layer, especially in the lower reaches. Results for this layer reflect the fact that grab samples do not represent this depth interval and hence there are fewer data with which to estimate reach-average concentrations.
7.4.2.3 Water Column Tri+ Concentrations
Figure 7-20 (a and b) shows comparisons between computed and observed Tri+ concentrations in the water column at Thompson Island Dam, Schuylerville, Stillwater and Waterford for the full historical period from 1977 to 1997. Figure 7-20c shows an expanded view of results at Thompson Island Dam where flows, solids and Tri+ can all be balanced with the most confidence. Again, results at Fort Edward represent Tri+ loading inputs at the upstream boundary and are shown only as a reference. Note that Tri+ detect limits changed in the mid 1980s, showing an apparent sudden drop in minimum concentrations in the river. Comparisons between computed and observed results are confounded by inconsistent temporal coverage among stations, changes in detection limits, datasets acquired by different organizations, a bias-correction applied to data from the west shore of Thompson Island Dam, and revised estimates of Tri+ concentrations applied to post-1986 USGS data. These factors are discussed in detail in Chapter 6.

Limno-Tech, Inc. 136
Long-term declining trends in observed Tri+ concentrations are captured by the model. Magnitudes and seasonal trends at Thompson Island Dam are well represented by the model, however, data are available only between 1991 and 1997. In general, model results tend to be higher than observations during the mid-1980s at Schuylerville, Stillwater and Waterford, and again during the mid-1990s at Stillwater and Waterford. There appears to be better agreement between computed and observed values for the GE data, especially at Thompson Island Dam from 1991 to 1997 and at Schuylerville for 1991 and 1992.
Achieving consistency between computed and observed values at Thompson Island Dam and downstream locations was a particular concern of the calibration, as the model was often higher than the USGS data at Stillwater and Waterford. Sensitivity analyses on volatilization, sediment-water mass transfer rates and gross settling velocities did not achieve sufficient reductions in water column Tri+ concentrations. Increasing settling velocity and decreasing sediment-water mass transfer rates resulted in over-estimating surface sediment Tri+ concentrations.
This prompted consideration of potential differences between USGS and GE datasets for Tri+. Potential bias between the USGS and GE data could perhaps explain why the model is well calibrated to GE data at Thompson Island Dam, but over-estimating relative to USGS data downstream. Figure 7-21 shows same-day comparisons between USGS and GE data for Tri+ at Fort Edward, Stillwater and Waterford. These results suggest that the GE measurements may be biased high relative to the USGS measurements; however, these results are not conclusive.
7.4.2.4 High and Low-flow Tri+ Loads
The ability of the model to distinguish between low and high flow contributions to overall Tri+ mass transport was assessed in similar manner as done in the solids calibration. Results of comparisons for model-estimated and data-estimated in-river Tri+ loads at Thompson Island Dam, Schuylerville, Stillwater and Waterford are contained in Figure 7-22. The cumulative Tri+ load estimates are provided, although these estimates are uncertain due to data limitations. Perhaps of more interest is the relative contributions of low and high flow to overall transport, shown in the bottom panel of the figure. Note that data for Thompson Island Dam are limited to the period from 1991 to 1997 and that there are no data for Schuylerville after 1993 (see Figure 7-20a). Consequently, the Tri+ mass loads in the top panel of Figure 7-30 correspond to 1991-1997 for Thompson Island Dam, 1977-1992 for Schuylerville and 1977-1997 for Stillwater and Waterford.
Results show that the model accurately computes the relative high and low flow Tri+ loads at all locations, and in addition shows good agreement with the estimated cumulative loadings. The maximum difference in fractional distribution of Tri+ load between high and low flow strata is less than seven percent in all cases. It is of interest to note that 70 to 80 percent of in-river Tri+ loads at TID and 60 to 70 percent of Tri+ loads below TIP occur during low flow conditions. This is in contrast to in-river solids loads which are split almost equally between high and low flow conditions (Figure 7-2).
Model performance is also illustrated through comparisons of computed and observed values over the course of several high flow events. Although the model was not developed specifically as an event scale model, it does include cohesive resuspension formulations based on site-specific measurements of resuspension behavior (See Chapters 4 and 5). Resuspension of cohesive

Limno-Tech, Inc. 137
sediment has higher potential to impact water column concentrations because of the much higher Tri+ concentrations relative to non-cohesive sediments. The ability of the model to represent water column Tri+ concentrations over high-flow events is observed by inspection of results for spring high flow periods during 1983, 1993, 1994 and 1997 (Figures 7-23 through 7-26). These results for Tri+ correspond to the results for solids concentrations in Figures 7-4 through 7-7.
It is more difficult to compare computed and observed Tri+ concentrations during high flow periods than solids concentrations because no high-frequency sampling was conducted for Tri+ concentrations during high flows. Nonetheless, results show that the model does generally represent the temporal event-scale variability shown in the Tri+ concentration data. Both model and data exhibit nearly order-of-magnitude increases in water column concentrations in response to flow impacts.
7.4.2.5 Further Model-Data Comparisons
As was done for the solids calibration, scatter plots and cumulative probability distributions are presented to provide insights into model behavior and the limits of model capability. Again it should be recognized that the model calibration approach was not aimed at describing the full range of observed event-scale behavior. The Tri+ calibration sought to describe long-term Tri+ concentrations in surface sediments and mean low and high flow behavior in the water column. Considering this, model agreement with mean or median concentration results is of more interest than a good fit across the range of observed behavior. Given the high variability in measured Tri+ concentrations, even within a given year, comparison of computed and observed values on a point-by-point basis is of marginal value in assessing the calibration. A number of other factors also preclude use of such comparisons in assessing model accuracy, including changes in analytical methods and detection limits, a bias-correction applied to data from the west shore of Thompson Island Dam, and revised estimates of Tri+ concentrations applied to post-1986 USGS data. These factors are discussed in detail in Chapter 6.
Comparisons between computed and observed Tri+ concentrations using scatter plots stratified by river flow are shown in Figures 7-27 and 7-28. The model and data mean values are shown on these figures by the horizontal and vertical crossed lines, as is the 1:1 correspondence line. A river flow of 10,000 cfs at Fort Edward is used to represent the cutpoint between low and high flow, with the rationale explained in the previous section. Results are good at Thompson Island Dam, showing reasonable agreement between model and data mean values, and close correspondence across the range of observed values. A similar behavior as for solids was observed for the Tri+ concentration scatter plots at Schuylerville, Stillwater and Waterford. This is due in small part to the solids calibration approach, however, these results are also affected by the above-mentioned high bias in the calibration results compared to measured Tri+ concentrations downstream of Thompson Island Dam.
Comparisons between computed and observed probability distributions for Tri+ concentrations over the entire calibration period stratified by river flow (Figures 7-29 and 7-30) show similar results as the scatter plots, but are also affected by the complicating factors mentioned above. At Thompson Island Dam, the model computes observed PCB concentrations with good accuracy over the full range of observed concentrations. Similar to observations from the time series results

Limno-Tech, Inc. 138
and scatter plots, results for Stillwater and Waterford also indicate that the model is weaker at Stillwater and Waterford.
7.4.3 Components Analysis for Tri+
A Tri+ mass balance components analysis from the calibrated model is shown in Figure 7-31 for the four major reaches in the Upper Hudson River. These are the same four reaches for which the solids mass balance components analysis was conducted (Figure 7-14). Over the 21-year historical period there is a computed Tri+ net load gain to the water column of 9,141 kg (39 percent) between Fort Edward and Waterford. Most of this load gain (74 percent) occurs in the first two reaches, TIP and Schuylerville.
Contributions to Tri+ load gain are dominated by non-flow-dependent sediment-water mass transfer. Computed total inputs of Tri+ to the water column from 1977 to 1997 were 26,597 kilograms. External loads (99 percent from Fort Edward) contributed 6,657 kg (25 percent), flow-dependent sediment resuspension contributed 6,722 kg (25 percent) and non-flow-dependent sediment-water mass transfer contributed 13,218 kg (50 percent) of the Tri+ inputs between Fort Edward and Waterford. Total losses of Tri+ from the water column were 10,759 kg. These losses consisted of 9,496 kg (88 percent) from gross settling and 1,263 kg (12 percent) from volatilization.
It is noteworthy that 75 percent of computed Tri+ inputs to the water column are due to internal sources and not external loads. This is in sharp contrast to results for solids in which approximately 80 percent of computed sources to the water column was due to external loads. Results from Tri+ mass balances conducted separately for high and low flows indicate that internal sources are responsible for at least 70 percent of computed inputs to the water column. The principal difference between low and high flow Tri+ mass balances is the relative importance of non-flow-dependent sediment-water mass transfer versus flow-driven resuspension. At low flow, non-flow-dependent sediment-water mass transfer is responsible for 61 percent of computed Tri+ inputs to the water column and flow-dependent resuspension is responsible for 14 percent. At high flow, this relationship is reversed and the computed contributions are 12 percent and 60 percent, respectively.
Computed cumulative Tri+ mass load gains between mainstem stations from 1991 to 1997 are shown in Figure 7-32. This period represents recent historical conditions and conditions in the river for the early portion of the forecast simulations for No Action. Gains in Tri+ mass are computed between all four mainstem stations. During 1992 and 1993, load gains are reduced in the two upper reaches due to large increases in upstream Tri+ loads from failure of the Allen Mill gate structure in September 1991. In the lower two reaches Tri+ mass is lost from the water column during 1992 and 1993. After 1993, upstream Tri+ loads decline and the influence of sediment-water mass transfer begins to control Tri+ mass load gains between stations. These load gains appear to increase with time as upstream Tri+ loads continue to decline through the mid-1990s.

Limno-Tech, Inc. 139
7.4.4 Comparison to Low Resolution Sediment Coring Report (LRC) Results
As part of the Reassessment, USEPA (1998a) conducted an investigation of the change in sediment PCB inventories in Thompson Island Pool between 1984 and 1994. This investigation involved a comparison of results from the extensive 1984 NYSDEC survey with results from a series of matched sediment cores collected by USEPA in 1994. Inventories from a set of 60 sampling locations in Thompson Island Pool were compared on a point-to-point basis to provide a quantitative indication of the direction and magnitude of change in the sediment PCB inventory. This analysis was subsequently revised to include comparisons based on localized sediment areas as opposed to point-to-point comparisons (USEPA, 1999a and b). Results from the revised analysis indicated that the best unbiased mean estimate of mass loss of Tri+ from the sediments within historic hotspot areas was 45 percent, with an uncertainty range from 4 to 59 percent. It was estimated that dechlorination was responsible for approximately 5 percent of the mean mass loss. The remaining loss was interpreted as a loss of the Tri+ hotspot inventory either to the overlying water column or through redistribution of contaminated sediments within TIP. Another conclusion from this LRC analysis was that there was no evidence of extensive widespread burial of historically contaminated sediments in the Pool.
Although HUDTOX and LRC findings are in general agreement, a direct comparison of results is not possible due to the different assumptions and spatial scales between these two approaches. The LRC analysis included only cohesive sediment areas that were historically known to be more contaminated than average Thompson Island Pool sediments, whereas the HUDTOX model includes both cohesive and non-cohesive sediment areas over the full range of sediment inventories estimated to reside in the Pool. The LRC analysis does not account for Tri+ mass loss that would be transported downstream of Thompson Island Pool or redeposited in non-cohesive sediment areas, or in less contaminated cohesive sediment areas. The HUDTOX model accounts for the full mass balance cycle including transport and fate downstream of Thompson Island Pool, and redeposition in the Pool.
An approximate comparison of results suggests consistency among the HUDTOX, DEIR and LRC analyses. A components analysis of the Tri+ historical calibration indicated that 1,288 kg of Tri+ was lost from the Thompson Island Pool sediment inventory between 1984 and 1994. Most of this loss was due to Tri+ mass transport across Thompson Island Dam and a small portion was due to volatilization. If the Tri+ inventory in 1984 is taken to be approximately 14,500 kg (USEPA, 1997), then this mass loss out of the pool corresponds to approximately 9 percent. This value is within the range of the 4 to 59 percent estimate of mass loss from historical hotspots in the LRC analysis. As an independent check on both of these approaches, the annual rate of net export of Tri+ from the Pool was estimated to range between 0.36 and 0.82 kg/day over the period April 1991 to October 1995 (USEPA, 1997). Assuming a value of 0.59 kg/day, the net export of Tri+ from the Pool sediments between 1984 and 1994 would be 2,153 kg which corresponds to a mass loss of 15 percent of the 1984 inventory. Because of its focus on hotspots, the LRC does not distinguish between loss over Thompson Island Dam and redistribution to less contaminated areas within the pool. When coupled with the LRC findings, HUDTOX and the DEIR also suggest that there has also been a significant amount of redistribution of Tri+ mass within Thompson Island Pool from historical hotspots.

Limno-Tech, Inc. 140
With respect to lack of extensive widespread burial of historically contaminated sediments in TIP, the HUDTOX model results are again consistent with results from the LRC analysis. Results in Figure 7-12 indicate that the increase in sediment bed elevation in Thompson Island Pool between 1984 and 1994 computed by the HUDTOX model is approximately 2.0 cm. This is a poolwide result and it should be understood that there are differences between cohesive and non-cohesive sediment areas within the Pool (Figure 7-13). From results in Figure 7-1 the computed increase in bed elevation for cohesive sediments in Thompson Island Pool over 10 years is approximately 6.5 centimeters. Furthermore, it should be understood that in the actual river there is variability within the individual model spatial segments and that certain areas can be erosional and not depositional. Nonetheless, a net sedimentation rate of 6.5 cm over 10 years is small compared to the surface layer depth of 23 cm (9 in) in the LRC sediment cores. Considering the differences in spatial and temporal scales of the two approaches, it can be concluded that the HUDTOX model and the LRC are in qualitative agreement with respect to the question of widespread burial of historically contaminated sediments in Thompson Island Pool.
7.4.5 Tri+ Calibration Summary
Summarizing to this point, the calibration approach for Tri+ in the historical calibration consisted of adjusting only four model parameters: gross settling velocities into cohesive and non-cohesive sediment areas; resuspension rates from non-cohesive sediment areas; depth of particle mixing in the sediment bed; and, magnitude of sediment particle mixing.
Computed Tri+ concentrations in surface sediments declined by 89 and 80 percent, respectively, in the cohesive and non-cohesive sediment areas of Thompson Island Pool between 1977 and 1997. These declines correspond to annual first-order loss rates of approximately 11 and 8 percent, respectively. Computed surface sediment concentrations in reaches downstream of Thompson Island Pool decline by 91 to 97 percent in cohesive sediment areas and by 82 to 93 percent in non-cohesive sediment areas over this period. These declines correspond to annual first-order loss rates of 11 to 14 percent in cohesive sediment areas and 8 to 12 percent in non-cohesive sediment areas. Declines in surface sediment Tri+ concentrations occur due to burial to deeper sediment layers and sediment-water transfer processes.
Computed results indicate that 70 to 80 percent of in-river Tri+ loads at Thompson Island Dam and 60 to 70 percent of in-river Tri+ loads below TIP occur during low flow conditions. This is in contrast to in-river solids loads which are split almost equally between low and high flow conditions. This finding supports the calibration strategy of focusing on long-term average behavior and not on short-term dynamics associated with high flow events.
There is a computed Tri+ net load gain to the water column of 139 percent between Fort Edward and Waterford between 1977 and 1997. Most of this load gain occurs in the Thompson Island Pool and Schuylerville reaches. Contributions to Tri+ load gain are dominated by non-flow-dependent sediment-water mass transfer. Computed external loads (99 percent from Fort Edward), flow-dependent sediment resuspension, and non-flow-dependent sediment-water mass transfer contribute 25, 25 and 50 percent, respectively, to total Tri+ inputs to the water column. Gross settling and volatilization accounted for 88 and 12 percent, respectively, of the total computed losses from the water column. It is noteworthy that 75 percent of computed Tri+ inputs to the water column are due to internal sources and not external loads. This is in sharp contrast to

Limno-Tech, Inc. 141
results for solids in which 80 percent of computed sources to the water column was due to external loads.
7.5 SENSITIVITY ANALYSES
Sensitivity analyses were conducted with the calibrated HUDTOX model to evaluate model responses due to uncertainties in important model inputs and calibration parameters. The analysis elucidates model behavior and identifies parameters which are important in determining Tri+ exposure concentrations. The approach was to change a particular model input or calibration parameter, and then re-run the model for the 21-year historical calibration period. Results were evaluated in terms of changes in long-term Tri+ concentrations in surface sediments and the water column, relative to base calibration values, and changes in Tri+ mass loadings at mainstem stations and Federal Dam. The sensitivity analyses were designed to assess perturbations to the base calibration and they do not represent attempts to re-calibrate the model with different model inputs or calibration parameters.
Sensitivity analyses were conducted for the following model inputs and calibration parameters:
• Solids loads at Fort Edward and tributary solids loads;
• Tri + partition coefficients;
• Tri+ sediment-water mass transfer coefficients;
• Solids burial rates via variation of gross settling velocity in cohesive sediment areas;
• Particle mixing in sediments;
• Sediment initial conditions for Tri+; and,
• Henry’s Law Constant affecting volatilization of Tri+.
Table 7-5 contains an inventory of all sensitivity analyses conducted, and results for Tri+ mass loads at mainstem stations and Federal Dam.
Model calibration results are sensitive to uncertainties in sediment particle mixing depth in non-cohesive sediments, Tri+ partitioning, solids burial rates, non-flow-dependent sediment-water mass transfer rates, tributary solids loads and sediment initial conditions. The calibration was not especially sensitive to differences in solids loadings at Fort Edward computed by time-stratified versus non-time-stratified loading methods, or to changes in Henry’s Law Constant.
7.5.1 Solids loadings
During calibration of the HUDTOX model a key forcing function driving Tri+ exposure concentrations was external solids loads to the system. Hence, upstream solids loads at Fort Edward and the tributary solids loads were varied separately and results discussed below.
Limno-Tech, Inc. 142
7.5.1.1 Solids loads at Fort Edward
Solids loadings at the upstream boundary at Fort Edward were developed in Section 6.5. A time-stratified regression approach was used to develop these loadings for the model calibration because a significant difference in solids-flow relationships was observed pre- and post-1990. A sensitivity analysis was conducted for solids loadings at Fort Edward that was determined using a non-time-stratified regression approach. Both of these approaches were conducted using the same solids concentration and flow data. Although the two approaches used the same data, they produced solids loadings that were distributed differently in time. The non-stratified approach produced solids loadings that were lower than the stratified approach early in the historical period (1977 to 1990) but higher in the latter part of the period (1990 to 1997).
Results in Figures 7-33 and 7-34 indicate that sediments are responsive only in TIP and not at Waterford, and that only the trajectory in the cohesive sediment area of TIP is responsive. Two reasons for these results are that solids burial rates in cohesive sediment areas are higher than those in non-cohesive areas, and that most of the solids loadings downstream of TIP are from tributaries and not Fort Edward. The response of cohesive sediments in TIP is consistent with the lower solids loadings produced by the non-stratified approach early in the historical calibration period. With increasing time, the two trajectories converge and arrive at approximately the same Tri+ concentrations at the end of the calibration period. Water column concentrations were not sensitive to changes in solids loadings due to application of the non-stratified regression approach and graphical results are not shown. Results in Table 7-5 indicate that changes in-river Tri+ loadings and loadings over Federal Dam are small (approximately 3 percent).
7.5.1.2 External Tributary Solids Loads
Approximately 80 percent of the solids loadings to the Upper Hudson River between Fort Edward and Federal Dam are delivered by tributaries. To assess the sensitivity of model calibration these external solids loads were incremented and decremented by 50 percent and compared to the base calibration. Figures 7-35 and 7-36 show the results of this analysis for surface sediment Tri+ concentrations in Thompson Island Pool and the reach from Schuylerville to Waterford. Results in TIP are not particularly sensitive to changes in tributary solids loads because the loadings at Fort Edward are the principal loads for that reach (see section 7.5.1.1).
The results downstream of TIP however, show a significant sensitivity to these load changes. Concentrations in cohesive areas show widely different sediment trajectories throughout the simulation period. Due to lower net settling velocities in the non-cohesive areas the trajectories are not far apart in the earlier part of the historical simulation. However, for the case where tributary loads were 50 percent smaller several segments in the non-cohesive areas become net erosional and consequently expose buried Tri+ concentrations in the latter part of the simulation. This behavior also occurs in the forecast simulations (run with base tributary loads) and is discussed at length in Chapter 8. Figure 7-37 shows the water column Tri+ concentrations at Thompson Island Dam and at Waterford for these sensitivity runs. As expected, concentrations at TID are insensitive to changes in tributary solids. Concentrations at Waterford are much higher when tributary loads are reduced by 50 percent and slightly lower when the loads are increased by 50 percent.

Limno-Tech, Inc. 143
7.5.1.3 Tributary Solids Loads Based on the Original Rating Curves
The details of the methods and data used to compute the external solids loads to the system are discussed in detail in Chapter 6 of this report. Since the original rating curves for the tributary solids loads were adjusted to determine the final calibration tributary loads a sensitivity analysis was conducted with the original unadjusted rating curves. Figure 7-38 and 7-39 show the results for this sensitivity run compared with base calibration results. Again results in TIP are insensitive to changes in tributary solids loads. Downstream of TID in general higher sediment Tri+ concentrations would be observed if the original rating curves were employed. In particular note that several non-cohesive segments tend to be erosional and expose buried Tri+ concentrations for this sensitivity run. The resultant Tri+ concentrations in the non-cohesive areas are inconsistent with the observed concentrations. Figure 7-40 shows that the water column concentrations are also significantly higher downstream of TIP.
7.5.2 Partition Coefficients
A value of log KPOC = 5.845 was used as the partition coefficient for Tri+ in the historical calibration (Table 7-4). An analysis by Butcher et al. (1998b) indicated that the range of observed partition coefficients in the Upper Hudson River was approximately 5.4 to 6.6. Sensitivity analyses were conducted using these two values of log KPOC for Tri+.
Results in Figures 7-41 and 7-42 indicate that sediment response trajectories are very sensitive to these variations in partitioning. The response trajectories for both of these variations violate the principal sediment calibration constraints (reach average cohesive and non-cohesive Tri+ concentrations in 1991 and 1998) in TIP for cohesive and non-cohesive sediments. Response trajectories at Waterford for higher partitioning are in better agreement with observations than base calibration results. Water column concentrations (Figure 7-43) are also sensitive, however, the sensitivity of these responses declines with time.
Sediment water exchange processes in the model were parameterized as a mass transfer rate from the dissolved and DOC phases in the sediment porewater. Thus, any changes to the partition coefficient directly changes the porewater concentrations and thus affects the flux out of the sediments. In addition, the larger the concentration, the greater the proportional flux out of the sediments. Hence, for example the behavior observed in Figure 7-43. In the early part of the historical simulation for the case of the lowered partition coefficients, the flux out of the sediments is very large and results in water column exposure much greater than the base case. However, this large flux depletes surficial sediment reservoirs and in the latter part of the historical simulation the concentrations are closer to the base case (and in some locations even smaller). For the higher partition coefficient the reverse is true. Hence, Figure 7-43 shows the sensitivity results crossing each other in the water column.
It is noted here that the empirically determined mass transfer coefficient was dependent on the choice of the partition coefficient. A change in the partition coefficient would necessitate re-computation of this parameter to achieve the same net flux out of the sediments. Hence, though the numerical value of the mass transfer parameter is dependent on the choice of the partition coefficient, the base calibration result in TIP would not be any different were a different value of the partition coefficient utilized.

Limno-Tech, Inc. 144
7.5.3 Sediment-Water Mass Transfer Rates
To assess the sensitivity of historical calibration results to this important mechanism two approaches were undertaken: first, variation of the seasonally dependent rate between upper and lower bounds; and second, specification of different rates between the cohesive and non-cohesive sediment areas.
7.5.3.1 Variation of Sediment-water Transfer Rate
Figure 7-44 contains the time series used in the model calibration for non-flow-dependent sediment-water mass transfer rates. This time series was determined using data-based, site-specific mass balances (Section 6.13) and was not adjusted during the model calibration. The estimated range of uncertainty in this time series is shown in Figure 7-44 and corresponds to approximately plus and minus 50 percent. Sensitivity analyses were conducted for this range of values about the base time series.
Results in Figures 7-45 and 7-46 indicate that sediment responses are sensitive to these variations in sediment-water mass transfer. The Tri+ surface sediment responses violate the principal calibration constraints in non-cohesive sediments in TIP, and remain within approximately two standard errors of the constraints in the cohesive sediments. The response trajectory for non-cohesive sediments at Waterford for the lower sediment-water mass transfer rate is in better agreement with observations than base calibration results. Water column concentrations (Figure 7-47) are also sensitive, however, the sensitivity of these responses declines with time. Results in Table 7-5 indicate that in-river Tri+ mass loadings and loadings over Federal Dam are sensitive to changes in sediment-water mass transfer. Loadings over Federal Dam change by approximately 10 percent in response to variations in sediment-water mass transfer rates.
The data to determine the mass transfer rates is confined primarily to TIP. It is uncertain if the same rates are operative throughout the Upper Hudson River. Thus, water column exposure concentrations downstream of TID and the export of PCBs over Federal Dam to the Lower Hudson River contain uncertainties due to this assumption in the historical calibration.
7.5.3.2 Differences in Sediment Water Transfer between Cohesive and Non-Cohesive Areas
The base HUDTOX model calibration assumes that the sediment-water exchange processes are identical for cohesive and non-cohesive sediment areas. Even though the exact mechanisms which govern these processes are unclear, a hypothesis with some merit is to consider the possibility of higher exchange in cohesive sediment areas as compared to the non-cohesive sediment areas. The reasons are discussed in Chapter 6 and include, for example the observation of greater benthic activity and mixing in cohesive areas as compared to non-cohesive areas.
A sensitivity run was conducted by assuming that the mass transfer rate is twice as large in the cohesive sediment areas as compared to the non-cohesive sediment areas. However, the overall net flux from the entire sediment bed was constrained as previously by the data-based Tri+ mass balance. The results are shown in Figures 7-48 and 7-49 and are compared to the base model calibration. As expected the surface sediment Tri+ trajectories are shifted below the base case in the cohesive areas and shifted higher in the non-cohesive areas. Thus, if this hypothesis were to be

Limno-Tech, Inc. 145
incorporated into the model calibration it would require revisions to the base model parameter choices. Water column results as expected show no effect since the same net flux out of the sediments was maintained.
7.5.4 Burial Rates in Cohesive Sediments
The gross settling velocity into cohesive sediments in the model calibration was 4.15 m/day (Table 7-1). This parameter was adjusted during the model calibration and its value was determined by the principal calibration constraints. Sensitivity analyses were conducted in which gross settling velocity was varied so as to produce plus and minus 50 percent changes in solids burial rates in TIP cohesive sediment areas. Although these sensitivity analyses were conducted by varying gross settling velocity, the effect of this variation is the same as if external solids loadings were varied. The reason is that there is a direct relationship between external solids loadings and solids burial rates in the river.
Results in Figures 7-50 and 7-51 show responses of solids burial rates to the sensitivity analyses conducted. Although only the gross settling rate into cohesive sediment areas was varied, burial rates respond in both cohesive and non-cohesive areas because solids are redistributed due to the dynamics of settling and resuspension. Solids burial rates respond in opposite directions, increasing in cohesive sediment areas and decreasing in non-cohesive sediment areas because external solids loadings were not changed.
Results in Figures 7-52 and 7-53 indicate that sediment Tri+ trajectories are sensitive to these variations in solids burial rates. The principal model calibration constraints are violated in the cohesive sediment areas of TIP, however, responses for lower settling velocities are in better agreement with observations in cohesive sediments at Waterford than in the base calibration. Water column concentrations are more responsive at Waterford than in TIP (Figure 7-54). Results in Table 7-5 indicate that in-river Tri+ mass loadings and loadings over Federal Dam are sensitive to changes in solids burial rates. Loadings over Federal Dam change by approximately 10 to 15 percent in response to these variations in solids burial rates.
7.5.5 Particle Mixing in Sediments
Sediment particle mixing in the model was determined on the basis of observed sediment core depth profiles, judgments on distributions of biological activity and model calibration to long-term Tri+ concentration trajectories in the sediments. Table 7-1 presents model calibration values for particle mixing depths and mixing rates. Particle mixing depths were 10 cm in cohesive sediments in all reaches, 6 cm in the non-cohesive sediments in TIP and 4 cm in the non-cohesive sediments downstream of TID. The most uncertain of these values is mixing depth in non-cohesive sediment areas in reaches downstream of TID. Some reaches achieved calibration constraints better with 4 cm depth of mixing while other areas were better at 6 cm depth of mixing. To avoid use of differing parameters in the calibration the choice of 4 cm was selected for all reaches downstream of TID. This sensitivity analysis presents results for the case of non-cohesive sediments mixed to a depth of 6 cm for all reaches downstream of TID.
Results in Figures 7-55 through 7-58 indicate that sediment trajectories are sensitive to these changes. The deeper mixing depths and higher mixing rates contribute additional Tri+ mass to the

Limno-Tech, Inc. 146
surficial sediment layer by upward mixing from deeper contaminated layers. Modeled historical trajectories are more consistent with this choice of mixing depth in the reaches at Stillwater and Waterford. The calibration choice of 4 cm yields better results than a mixing depth of 6 cm in the non-cohesive sediments in the Federal Dam reach. Based on this sensitivity analysis a choice of 6 cm mixing in the non-cohesive sediments downstream of TID appears reasonable and may represent an alternate choice for the historical calibration.
7.5.6 Sediment Initial Conditions
There is large uncertainty in the 1977 data used to specify sediment initial concentrations for Tri+ in the historical calibration. Figure 6-32, 6-33, and 6-34 show the variability in the available historical data for 1977. In many locations concentrations measured in 1977 can vary by an order of magnitude or more. Hence, sensitivity analyses were conducted for variations of plus and minus one standard error about mean values for Tri+ concentrations in cohesive and non-cohesive surface sediments in the 1977 data.
Results in Figures 7-59 and 7-60 indicate that sediment trajectories are sensitive to these variations in initial conditions, especially early in the historical calibration period. With increasing time the sensitivity response trajectories converge closely to the base model calibration trajectories. At the end of the calibration period, differences are small between the sensitivity results and the base calibration. Both sensitivity trajectories agree reasonably well with the model calibration targets in 1998 in TIP. Water column responses (Figure 7-61) follow the same trends as sediment responses. Results in Table 7-5 indicate that in-river Tri+ mass loadings and loadings over Federal Dam are sensitive to changes in initial conditions. Loadings over Federal Dam change by approximately 20 percent in response to variations in sediment initial conditions.
7.5.7 Henry’s Law Constant
Among the parameters which affect volatilization of Tri+ there is some uncertainty associated with the choice if the Henry’s Law constant. The historical calibration used a value of 1.69E-04 atm m3/mole. A sensitivity analysis was conducted to assess the sensitivity of the model to choices of 1.93E-04 and 0.68E-04 atm m3/mole. This range was established based on published literature. Water column results at Thompson Island Dam and at Waterford are shown in Figure 7-62. Results show that the modeled exposure concentrations are insensitive to the choice of this parameter.
7.6 1991-1997 HINDCAST APPLICATIONS
7.6.1 Overview
Following successful calibration of the HUDTOX model to Tri+ over the 21-year historical calibration period, the model calibration was tested with short-term hindcast applications for the period 1991 to 1997 to five congeners and total PCB. The five congeners chosen for these applications (BZ#4, BZ#28, BZ#52, BZ#[90+101] and BZ#138) have different physical-chemical properties, spanning a wide range of partitioning and volatilization behavior. The primary objective of the individual congener applications was to strengthen and support the long-term Tri+

Limno-Tech, Inc. 147
historical calibration, and thereby, the use of the model in addressing the principal questions of the Reassessment.
The differences in environmental behavior among the five congeners provides an opportunity to test the rigor of the Tri+ calibration, especially sediment-water and air-water exchange processes. For example, model results for a highly volatile congener may be more sensitive to errors in sediment-water exchange than a less volatile, strongly partitioning congener. Conversely, model results for a strongly partitioning congener may be more sensitive to errors in particle-based PCB processes such as settling and resuspension than a weaker partitioning congener.
Overall, the short-term hindcast applications to congeners demonstrate that the Tri+ historical calibration is technically sound and appropriate for use in the Reassessment. The Tri+ historical calibration was confirmed in that the two congeners whose physical-chemical properties most closely resemble Tri+ (BZ#28 and BZ#52) were accurately represented using the same model parameters as the Tri+ historical calibration. While changes to the model (discussed below) may permit better simultaneous representation of all five PCB congeners, these changes do not enhance model performance for Tri+. Therefore, the Tri+ historical calibration was judged technically sound based on the calibration results presented above and on the confirmatory results presented below for BZ#28 and BZ#52.
7.6.2 Approach
The approach to the congener hindcast applications was to use the same flow and solids mass balances as in the Tri+ historical calibration, along with input loads for total PCBs and the individual congeners. Total PCB and congener loads were developed in Chapter 6, in addition to sediment initial conditions based on the 1991 GE composite data. All of the same model parameters used for the Tri+ historical calibration were used initially for the total PCB and congener applications, with the exception of those that were chemical-specific. These chemical-specific parameters include only Henry’s Law constant, molecular weight and partition coefficients (Table 7-4). Partition coefficients for total PCBs and the five congeners were developed in Section 6.9.
Initial 1991 to 1997 results showed that the empirical sediment-water mass transfer coefficient developed for Tri+ (Chapter 6) was not applicable to BZ#4. The Tri+ sediment-water mass transfer coefficient produced unreasonably high sediment-water transfer of BZ#4. An analysis of apparent sediment-water mass transfer rates for all congeners revealed large differences, seemingly related to differences in sediment-water partitioning. This led to estimation of separate particle-based and porewater sediment-water mass transfer coefficients, which allowed a reasonable simultaneous representation of sediment-water mass transfer for all congeners. Details of the development of these coefficients is presented in Chapter 6.
7.6.3 Results
Model testing through the short-term hindcast applications was accomplished by comparison of computed congener and total PCB concentrations to water column observations. As discussed above, initial simulations used the same empirical sediment-water mass transfer coefficient developed for Tri+ (Chapter 6). Results of these initial simulations, shown for BZ#4, BZ#28, and

Limno-Tech, Inc. 148
BZ#52 from 1991 to 1992 at Thompson Island Dam, revealed that while the model performed well for BZ#28 and BZ#52, the BZ#4 sediment-water mass transfer was too high (Figure 7-63). Water column BZ#4 concentrations were significantly higher than the data for the first two years of the forecast. This is due to rapid loss of BZ#4 from the sediments, evidenced by a comparison of the BZ#4, BZ#28, and BZ#52 sediment concentration trends for these three congeners (Figure 7-64).
To determine whether potential differences between measured water column and sediment partition coefficients was contributing to the over-prediction of BZ#4, simulations using partition coefficients from the 1991 sediment data were conducted. Sediment partition coefficients were used as computed from the GE 1991 sediment core composite data (USEPA, 1997), however, they were considered less reliable than the estimates from the Phase 2 water column data. This is because the GE 1991 samples were frozen and composited prior to analysis, likely altering PCBs in porewater measurements. Results showed that use of the sediment partition coefficients may improve model fit to BZ#4. This indicated sediment-water transfer for this congener is over-computed using the Tri+ mass transfer coefficient.
This led to incorporation of the separate particle and porewater-based sediment-water mass transfer coefficients, as described in Chapter 6, which generally improved model for BZ#4 and total PCB while also showing reasonable results for the other congeners. Results are demonstrated several ways:
• Model versus data concentration time series at several locations for 1992 to 1997;
• Comparison to congener concentrations and congener ratios to BZ#52 in the GE 1996 and 1997 float study surveys which measured down-river profiles in Thompson Island Pool; and,
• Comparison of down-river congener ratios to BZ#52 from Fort Edward to Waterford.
These are each discussed below.
Computed water column concentrations for each congener are compared to observations at Thompson Island Dam for the period 1991 through 1997 (Figure 7-66). Results are shown in Figure 7-67 (a to f) for Schuylerville, Stillwater and Waterford for the period 1991 through 1993. Very little data are available below Thompson Island Dam after 1993. The model shows very good comparison to observed concentrations of BZ#28 and BZ#52, the two congeners with environmental behavior most similar to Tri+. Results are also good for total PCB and BZ#4, although summer time concentrations are slightly below observed values. Performance for BZ#[101+90] and BZ#138 is very good at Schuylerville, however, the model under-computes at Stillwater and Waterford. This may be due to differential settling losses of these congeners as a result of their stronger partitioning behavior.
Overall, based on the specification of separate particulate and porewater mass transfer pathways, the model does reasonably well for simulating BZ#28, BZ#52, BZ#4 and total PCB. Performance is weaker for BZ[101+90] and BZ#138, however, the best agreement with BZ#28 and BZ#52 is a

Limno-Tech, Inc. 149
confirmation of the historical calibration because these congeners have the most similar environmental behavior to Tri+.
A unique series of datasets was collected by GE in the summer of 1996 and 1997 that provide a useful evaluation of the model performance on a small spatial scale. These data were collected from boats at a large number of sequential locations, floating down through Thompson Island Pool. The down-river profile of PCB concentrations in these data show the highest PCB load gains over high sediment concentration areas and consequent changes in the congener pattern. Model results were compared to observed concentrations and the ratio of congener concentrations to BZ#52 concentrations. BZ#52 was chosen as a normalizing congener for evaluating the congener pattern because it is consistently present in higher concentrations and is a stable congener. Results are shown BZ#4, BZ#28 and BZ#[90+101] in Figure 7-68 (a to d). The model describes the shift in congener ratios across the Pool reasonably well, representing both the down-river concentration profiles and the observed higher release of BZ#4 relative to the other congeners.
In addition to evaluation of the down-river profile comparisons in Thompson Island Pool using the above float study data, comparisons were also made to the down-river profile of the BZ#28 to BZ#52 ratio using data for Fort Edward, Thompson Island Dam, Schuylerville, Stillwater and Waterford. The ratios were evaluated for summer and non-summer conditions (Figure 7-69), as well as high and low flow conditions (Figure 7-70). These results show that the model captures the BZ#28/BZ#52 ratio reasonably well for the entire Upper Hudson River over these seasonal and flow conditions.
To assess the significance of the alternative parameterization of sediment-water mass transfer rates on the historical calibration, the calibration simulation was run with these rates. That is, the historical calibration was re-run with non-flow-dependent sediment-water mass transfer decomposed into separate particle-based and porewater-based pathways. Results showed that this did not alter the performance of Tri+ in the historical calibration. Cohesive sediment concentrations were insensitive to use of the separate porewater and particulate transfer pathways, however, the rate of decline in non-cohesive sediment concentrations was slowed, resulting in concentrations somewhat higher than the observed values in 1991.
7.6.4 Hindcast Applications Summary
The short-term hindcast applications confirmed the Tri+ historical calibration because use of the exact same parameter set used for the historical calibration resulted in very good predictions of observed BZ#28 and BZ#52 concentrations. The hindcast applications revealed that alternate specification of the sediment-water mass transfer coefficient was required to allow simultaneous simulation of all congeners; however, these changes resulted in somewhat poorer calibration to non-cohesive sediment concentration trends in the historical Tri+ calibration. While investigations conducted in the hindcast applications to individual congeners provided insights into sediment-water mass transfer behavior, no changes to the Tri+ historical calibration were supported. Model performance in the hindcast applications was strongest for BZ#28 and BZ#52, the congeners whose environmental behavior most closely resembles that of Tri+. Testing of the historical calibration through short-term hindcast applications to individual congeners strongly supported the technical soundness of the Tri+ historical calibration and use of the calibrated HUDTOX model in the Reassessment.

Limno-Tech, Inc. 150
7.7 CALIBRATION FINDINGS AND CONCLUSIONS
The HUDTOX 21-year historical calibration to Tri+ served as the main development vehicle for the PCB fate and transport model to be used this Reassessment. This calibration was successful in reproducing observed long-term trends in water and sediment PCB concentrations over the 21-year period. This was primarily demonstrated through comparisons between model results and available data for the following parameters:
• Long-term solids burial rates;
• Long-term Tri+ surface sediment concentrations;
• In-river solids and Tri+ mass transport at low and high flows;
• Water column solids and Tri+ concentrations;
• Solids mass balance for the Spring 1994 high flow event; and,
• Testing of the historical calibration through short-term hindcast applications to individual congeners.
Many different metrics were used to demonstrate model reliability and they were used collectively in a “weight of evidence” approach.
The following factors were found to be the most important in controlling long-term trends in Tri+ responses in the Upper Hudson River:
• Hydrology;
• External solids loads;
• External Tri+ loads;
• Tri+ partitioning;
• Sediment-water mass transfer under non-scouring flow conditions;
• Solids burial rates; and,
• Particle mixing depth in the sediments.
The first three of these factors are external inputs largely determined by site-specific data, and the last four are internal processes within the river.
The principal findings and conclusions from the calibration analyses are the following:
Limno-Tech, Inc. 151
• The HUDTOX model represents the Upper Hudson River as a whole to be net depositional from 1977 to 1997, based on the assumptions underlying development of tributary solids loads. Computed solids burial rates in cohesive sediment areas are approximately an order of magnitude greater than those computed in non-cohesive sediment areas;
• Computed in-river solids mass loads are split almost equally between high and low flow conditions;
• There is a computed net solids load gain to the water column of 497 percent between Fort Edward and Waterford over the 21-year historical calibration; computed tributary loadings (including Fort Edward) and gross sediment resuspension contribute 79 and 21 percent, respectively, to total solids inputs between these locations;
• Although sediment resuspension is important, water column solids concentrations and in-river solids loads are driven primarily by hydraulics and solids loads from upstream and tributary sources, even under high flow conditions;
• Computed Tri+ concentrations in surface sediments declined by 89 and 80 percent, respectively, in the cohesive and non-cohesive sediment areas of Thompson Island Pool between 1977 and 1997. These declines correspond to annual first-order loss rates of approximately 11 and 8 percent, respectively;
• Computed Tri+ concentrations in surface sediments in reaches downstream of Thompson Island Pool decline by 91 to 97 percent in cohesive sediment areas and by 82 to 93 percent in non-cohesive sediment areas. These declines correspond to annual first-order loss rates of 11 to 14 percent in cohesive sediment areas and 8 to 12 percent in non-cohesive sediment areas;
• Computed results indicate that 70 to 80 percent of in-river Tri+ loads at Thompson Island Dam and 60 to 70 percent of in-river Tri+ loads below Thompson Island Pool occur during low flow conditions;
• There is a computed Tri+ net load gain to the water column of 139 percent between Fort Edward and Waterford over the 21-year historical calibration; most of this Tri+ load gain occurs in the Thompson Island Pool and Schuylerville reaches;
• Computed external loads (99 percent from Fort Edward), flow-dependent sediment resuspension, and non-flow-dependent sediment-water mass transfer contributed 25, 25 and 50 percent, respectively, to total Tri+ inputs to the water column during the 21-year historical calibration;
Limno-Tech, Inc. 152
• Gross settling and volatilization accounted for 88 and 12 percent, respectively, of the total computed losses of Tri+ from the water column;
• Testing of the 21-year historical calibration for Tri+ through short-term hindcast applications to individual congeners strongly supported the technical soundness of the historical calibration, and use of the calibrated HUDTOX model in the Reassessment;
• Model calibration results are sensitive to uncertainties in solids burial rates, Tri+ partitioning, non-flow-dependent sediment-water mass transfer rates, tributary solids loads, sediment particle mixing depth, and sediment initial conditions; and,
• Model calibration results were not especially sensitive to uncertainties in solids loadings at Fort Edward or to volatilization, as influenced by uncertainties in Henry’s Law Constant.
Based on the above tests of model performance and reliability, the HUDTOX model is considered adequately calibrated for predicting long-term PCB responses in the Upper Hudson River, which is the primary use of the model in the Reassessment.

Parameter Definition Units Value Comments
vS (cohesive) Gross solids settling velocity m/day 4.15 Determined by calibration
vS (non-cohesive) Gross solids settling velocity m/day 1.5 Determined by calibration
qcutFlow threshold for non-cohesive resuspension cfs 7,042 - 31,635 Based on TSS rating curves by reach
vr High flow solids resuspension velocity mm/yr 3.6 - 16.4 See Table 7-3 for coefficients used to control resuspension and sediment armoring during events in cohesive sediments
wij Particle mixing rate between sediment layer i and j (cohesive sediments) : TIP m2/day
1.0E-05 (layers 1-2; 2-3; 3-4)
Based on core depth profiles, expected biological activity, and calibration of sediment temporal trajectories.
wij
Particle mixing rate between sediment layer i and j (non-cohesive sediments) : TIP
m2/day 1.0E-05
(layers 1-2; 2-3)Based on core depth profiles, expected biological activity, and calibration of sediment temporal trajectories.
wij
Particle mixing rate between sediment layer i and j (cohesive sediments) : TID to Fed. Dam
m2/day 1.0E-05 (layer1-2); 1.0E-06 (layer 2-3); 1.0E-07 (layer 3-4)
Based on core depth profiles, expected biological activity, and calibration of sediment temporal trajectories.
wij
Particle mixing rate between sediment layer i and j (non-cohesive sediments) : TID to Fed. Dam
m2/day 1.0E-05 (layer1-2); Based on core depth profiles, expected biological
activity, and calibration of sediment temporal trajectories.
DL Longitudinal dispersion m2/sec18.8 - 37.2;
0.0 at dam interfacesEstimates based on USGS dye survey results (USGS, 1969)
CS Sediment solids bulk density (dry) g/cm3 0.84 (cohesive) 1.38 (non-cohesive) Estimated using Phase 2 and NYSDEC 1984 data
� Solid density g/cm3 2.65 -
Table 7-1. HUDTOX Solids Model Calibration Parameter Values.
Limno-Tech, Inc.
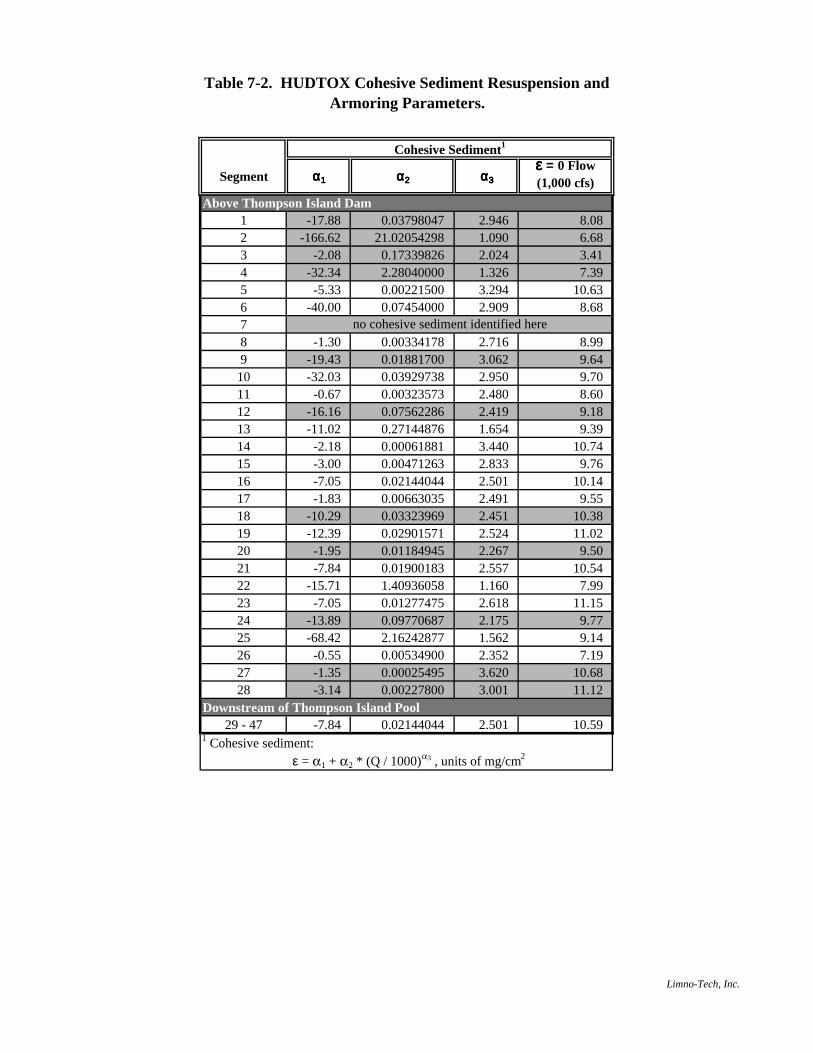
Segment αααα1111 αααα2222 αααα3333εεεε=== 0 Flow (1,000 cfs)
Above Thompson Island Dam1 -17.88 0.03798047 2.946 8.08 2 -166.62 21.02054298 1.090 6.68 3 -2.08 0.17339826 2.024 3.41 4 -32.34 2.28040000 1.326 7.39 5 -5.33 0.00221500 3.294 10.63 6 -40.00 0.07454000 2.909 8.68 78 -1.30 0.00334178 2.716 8.99 9 -19.43 0.01881700 3.062 9.64
10 -32.03 0.03929738 2.950 9.70 11 -0.67 0.00323573 2.480 8.60 12 -16.16 0.07562286 2.419 9.18 13 -11.02 0.27144876 1.654 9.39 14 -2.18 0.00061881 3.440 10.74 15 -3.00 0.00471263 2.833 9.76 16 -7.05 0.02144044 2.501 10.14 17 -1.83 0.00663035 2.491 9.55 18 -10.29 0.03323969 2.451 10.38 19 -12.39 0.02901571 2.524 11.02 20 -1.95 0.01184945 2.267 9.50 21 -7.84 0.01900183 2.557 10.54 22 -15.71 1.40936058 1.160 7.99 23 -7.05 0.01277475 2.618 11.15 24 -13.89 0.09770687 2.175 9.77 25 -68.42 2.16242877 1.562 9.14 26 -0.55 0.00534900 2.352 7.19 27 -1.35 0.00025495 3.620 10.68 28 -3.14 0.00227800 3.001 11.12
Downstream of Thompson Island Pool29 - 47 -7.84 0.02144044 2.501 10.59
1 Cohesive sediment: ε = �1 + �2 * (Q / 1000)�3 , units of mg/cm2
no cohesive sediment identified here
Cohesive Sediment1
Table 7-2. HUDTOX Cohesive Sediment Resuspension and Armoring Parameters.
Limno-Tech, Inc.

Table 7-3. HUDTOX Fraction Organic Carbon and Dissolved Organic Carbon Parameterization by Reach.
HUDTOX fOC 1 DOC (mg/L) 2
Upper Hudson Upper Hudson River Water Water 1a) Cohesive Non-cohesive Cohesive Non-cohesiveRiver Miles Reach Description Segment(s) a b Sediment Sediment Water Sediment Sediment
194.7 - 188.5 Fort Edward - TID 1 - 28 17.5% -0.3687 1.7 to 3.7% 0.8 to 1.3% 4.32 31.5 31.5
188.5 - 182.3 TID - Batten Kill 29 - 32 17.5% -0.3687 2.8% 0.8% 4.28 49.4 49.4
182.3 - 181.4 Batten Kill - Fish Creek 33 17.5% -0.3687 1.6% 1.3% 4.28 49.4 49.4
181.4 - 178.1 Fish Creek - Flately Brook 34 - 35 17.5% -0.3687 1.6% 1.3% to 1% 4.63 49.4 49.4
178.1 - 168.2 Flately Brook - Hoosic River 36 - 39 17.5% -0.3687 1.6 to 2.1% 0.7 to 1.0% 4.63 49.4 49.4
168.2 - 166.0 Hoosic River - Anthony Kill 40 - 41 17.5% -0.3687 2.1% 0.8% 4.01 61.5 61.5
166.0 - 163.5 Anthony Kill - Deep Kill 42 - 43 17.5% -0.3687 2.1% 0.8% 4.01 61.5 61.5
163.5 - 156.4 Deep Kill - Waterford 44 - 46 17.5% -0.3687 2.1% 0.8% 4.01 61.5 61.5
156.4 - 153.9 Waterford - Federal Dam 47 17.5% -0.3687 2.1% 0.8% 4.01 61.5 61.51 Fraction organic carbon on particulates were developed for:
a) Water, based on a relationship developed from the Phase2 water column data (TAMS et al., 1997 ), where foc = a Qn b and Qn = normalized flow (see Section 6.9.2).
b) Sediment, using the Phase2 low-resolution core data and the 1991 GE composite sediment sampling data (O'Brien and Gere, 1993b).2 Dissolved organic carbon (DOC) concentrations were developed for:
a) Water, using data from Vaughn, 1996.
b) Sediment, based on the 1991 GE composite sediment sampling data (O'Brien and Gere, 1993b).
Limno-Tech, Inc.
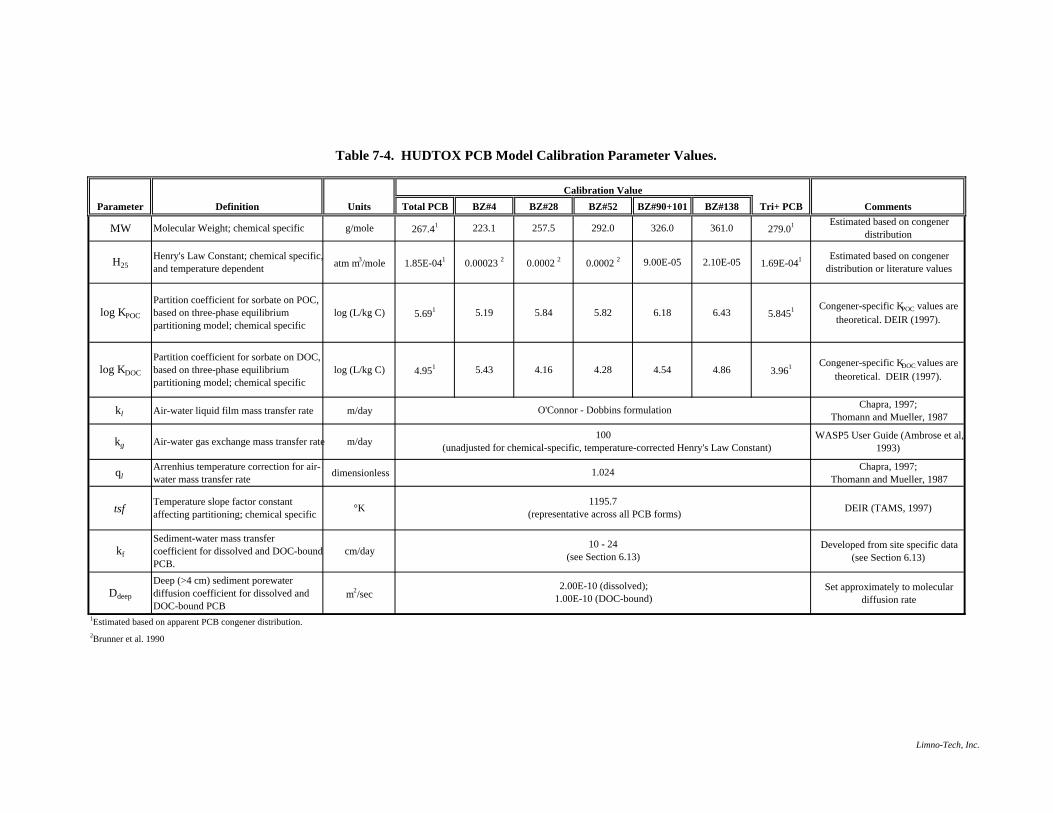
Parameter Definition Units Total PCB BZ#4 BZ#28 BZ#52 BZ#90+101 BZ#138 Tri+ PCB Comments
MW Molecular Weight; chemical specific g/mole 267.41 223.1 257.5 292.0 326.0 361.0 279.01 Estimated based on congener distribution
H25Henry's Law Constant; chemical specific, and temperature dependent atm m3/mole 1.85E-041 0.00023 2 0.0002 2 0.0002 2 9.00E-05 2.10E-05 1.69E-041 Estimated based on congener
distribution or literature values
log KPOC
Partition coefficient for sorbate on POC, based on three-phase equilibrium partitioning model; chemical specific
log (L/kg C) 5.691 5.19 5.84 5.82 6.18 6.43 5.8451 Congener-specific KPOC values are theoretical. DEIR (1997).
log KDOC
Partition coefficient for sorbate on DOC, based on three-phase equilibrium partitioning model; chemical specific
log (L/kg C) 4.951 5.43 4.16 4.28 4.54 4.86 3.961 Congener-specific KDOC values are theoretical. DEIR (1997).
kl Air-water liquid film mass transfer rate m/day Chapra, 1997;Thomann and Mueller, 1987
kg Air-water gas exchange mass transfer rate m/day WASP5 User Guide (Ambrose et al, 1993)
qlArrenhius temperature correction for air-water mass transfer rate dimensionless Chapra, 1997;
Thomann and Mueller, 1987
tsf Temperature slope factor constant affecting partitioning; chemical specific °K DEIR (TAMS, 1997)
kf
Sediment-water mass transfer coefficient for dissolved and DOC-bound PCB.
cm/day Developed from site specific data (see Section 6.13)
Ddeep
Deep (>4 cm) sediment porewater diffusion coefficient for dissolved and DOC-bound PCB
m2/secSet approximately to molecular
diffusion rate
1Estimated based on apparent PCB congener distribution.2Brunner et al. 1990
1195.7(representative across all PCB forms)
10 - 24(see Section 6.13)
2.00E-10 (dissolved);1.00E-10 (DOC-bound)
Table 7-4. HUDTOX PCB Model Calibration Parameter Values.
O'Connor - Dobbins formulation
100(unadjusted for chemical-specific, temperature-corrected Henry's Law Constant)
1.024
Calibration Value
Limno-Tech, Inc.

Table 7-5. Tri+ Mass Loads (1977-1997) at Mainstem Stations for Sensitivity Analyses.
Model Run Description
Load at Thompson Island Dam
(kg Tri+)
Load at Schuylerville
(kg Tri+)
Load at Stillwater (kg Tri+)
Load at Waterford (kg Tri+)
Load at Federal
Dam (kg Tri+)
Percent Change in
Load at Federal
DamBase HUDTOX Calibration 10,638 13,374 13,649 15,730 16,367 0TSS : Fort Edward Solids Loads with Single Stratum Regression 10,855 13,831 14,112 16,190 16,829 3TSS : All external Tributary solids loads 50 % higher 10,711 13,521 13,289 14,792 15,261 -7TSS : All external Tributary solids loads 50 % lower 10,711 13,663 14,800 18,194 19,226 17TSS : All external Tributary Loads computed using Original Rating Curve 10,643 13,494 15,203 18,815 19,483 19Partitioning : Lower Tri+ Partition Coefficient 12,080 15,251 16,287 18,376 19,071 17Partitioning : Higher Tri+ Partition Coefficient 8,856 11,003 10,645 12,716 13,287 -19Sediment-water Exchange: Lower Sediment-Water Mass Transfer Coefficient 9,522 11,895 11,967 13,980 14,561 -11Sediment-water exchange: HigherSediment-Water Mass Transfer Coefficient 11,307 14,240 14,708 16,830 17,501 7Sediment-water exchange : Cohesive rate twice non-cohesive rate 10,756 13,620 14,011 16,066 16,690 2Burial Rate: Higher Gross Settling Velocity into Cohesive Sediments 10,225 12,334 12,216 14,037 14,675 -10Burial Rate: Lower Gross Settling Velocity into Cohesive Sediments 11,254 14,702 15,570 18,171 18,801 15Sediment Mixing: Mixed Depth of 6 cm in Non-cohesive Sediments below TID 10,638 13,701 14,476 17,566 18,522 13
(Page 1 of 2) Limno-Tech, Inc.

Table 7-5. Tri+ Mass Loads (1977-1997) at Mainstem Stations for Sensitivity Analyses.
Model Run Description
Load at Thompson Island Dam
(kg Tri+)
Load at Schuylerville
(kg Tri+)
Load at Stillwater (kg Tri+)
Load at Waterford (kg Tri+)
Load at Federal
Dam (kg Tri+)
Percent Change in
Load at Federal
DamInitial Conditions: 1977 Sediment Initial Conditions Minus 1 Sstanard Error 9,226 11,295 11,141 12,346 12,724 -22Initial Conditions: 1977 Sediment Initial Conditions Plus 1 Standard Error 12,051 15,454 16,156 19,113 20,009 22Volatilization : Higher Henry's Law Constant 10,623 13,345 13,603 15,665 16,300 0Volatilization : Lower Henry's Law Constant 10,732 13,551 13,937 16,145 16,796 3
(Page 2 of 2) Limno-Tech, Inc.

Figure 7-1. Computed Annual Average Burial Rates, 1977-1997.
0.00
0.20
0.40
0.60
0.80
1.00
1.20
1.40
1.60
Thompson Island Dam Schuylerville Stillwater Waterford Federal Dam
Bur
ial R
ate
(cm
/yea
r)
Non-cohesive
Cohesive
Limno-Tech, Inc.

Figure 7-2. Comparison Between Model Estimated and Data Estimated In-River Solids Loadings Stratified by Fort Edward Flow at 10,000 cfs (1/1/77-9/30/97).
0.00E+00
5.00E+08
1.00E+09
1.50E+09
2.00E+09
2.50E+09
<10,000Stillwater
>10,000Stillwater
<10,000Waterford
>10,000Waterford
Solid
s M
ass
Load
(kg)
Model
Data
0.00
0.10
0.20
0.30
0.40
0.50
0.60
0.70
<10,000Stillwater
>10,000Stillwater
<10,000Waterford
>10,000Waterford
Location
Frac
tion
of S
olid
s Lo
ad
Limno-Tech, Inc.

Figure 7-3a. Comparison Between Computed and Observed Solids Concentrations at Mainstem Sampling Stations.
Fort Edward
0.1
1
10
10019
77
1978
1979
1980
1981
1982
1983
1984
1985
1986
1987
1988
1989
1990
1991
1992
1993
1994
1995
1996
1997
Solid
s C
once
ntra
tion
(mg/
L)Model GE_data P2_data USGS_data
Thompson Island Dam
1
10
100
1977
1978
1979
1980
1981
1982
1983
1984
1985
1986
1987
1988
1989
1990
1991
1992
1993
1994
1995
1996
1997
Solid
s C
once
ntra
tion
(mg/
L)
Schuylerville
1
10
100
1977
1978
1979
1980
1981
1982
1983
1984
1985
1986
1987
1988
1989
1990
1991
1992
1993
1994
1995
1996
1997
Year
Solid
s C
once
ntra
tion
(mg/
L)
Limno-Tech, Inc.

Figure 7-3b. Comparison Between Computed and Observed Solids Concentrations at Mainstem Stations.
Stillwater
1
10
100
100019
77
1978
1979
1980
1981
1982
1983
1984
1985
1986
1987
1988
1989
1990
1991
1992
1993
1994
1995
1996
1997
Solid
s C
once
ntra
tion
(mg/
L)
Model GE_data P2_data USGS_data
Waterford
1
10
100
1000
1977
1978
1979
1980
1981
1982
1983
1984
1985
1986
1987
1988
1989
1990
1991
1992
1993
1994
1995
1996
1997
Year
Solid
s C
once
ntra
tion
(mg/
L)
Limno-Tech, Inc.

Figure 7-4. Comparison Between Computed and Observed Total Suspended Solids Concentrations (TSS) for the Spring 1983 High Flow Event.
Thompson Island Dam
0
10
20
30
40
50
4/8/83 4/13/83 4/18/83 4/23/83 4/28/83 5/3/83 5/8/83Date
TSS
(mg/
L)Model GE_data P2_data USGS_data
Schuylerville
0
50
100
150
200
4/8/83 4/13/83 4/18/83 4/23/83 4/28/83 5/3/83 5/8/83Date
TSS
(mg/
L)
Model GE_data P2_data USGS_data
Stillwater
0255075
100125150175
4/8/83 4/13/83 4/18/83 4/23/83 4/28/83 5/3/83 5/8/83Date
TSS
(mg/
L)
Model GE_data P2_data USGS_data
Waterford
0
50
100
150
200
250
4/8/83 4/13/83 4/18/83 4/23/83 4/28/83 5/3/83 5/8/83Date
TSS
(mg/
L)
Model GE_data P2_data USGS_data
Limno-Tech, Inc.

Figure 7-5. Comparison Between Computed and Observed Total Suspended Solids Concentrations (TSS) for the Spring 1993 High Flow Event.
Thompson Island Dam
0
20
40
60
80
100
3/25/93 3/30/93 4/4/93 4/9/93 4/14/93 4/19/93 4/24/93Date
TSS
(mg/
L)Model GE_data P2_data USGS_data
Schuylerville
020406080
100120140160180
3/25/93 3/30/93 4/4/93 4/9/93 4/14/93 4/19/93 4/24/93Date
TSS
(mg/
L)
Model GE_data P2_data USGS_data
Stillwater
0255075
100125150175200
3/25/93 3/30/93 4/4/93 4/9/93 4/14/93 4/19/93 4/24/93Date
TSS
(mg/
L)
Model GE_data P2_data USGS_data
Waterford
050
100150200250300350400450500
3/25/93 3/30/93 4/4/93 4/9/93 4/14/93 4/19/93 4/24/93Date
TSS
(mg/
L)
Model GE_data P2_data USGS_data
Limno-Tech, Inc.

Figure 7-6. Comparison Between Computed and Observed Total Suspended Solids Concentrations (TSS) for the Spring 1994 High Flow Event.
Thompson Island Dam
010203040506070
3/29/94 4/3/94 4/8/94 4/13/94 4/18/94 4/23/94 4/28/94Date
TSS
(mg/
L)Model GE_data P2_data USGS_data
Schuylerville
0
20
40
60
80
100
3/29/94 4/3/94 4/8/94 4/13/94 4/18/94 4/23/94 4/28/94Date
TSS
(mg/
L)
Model GE data P2 data USGS data
Stillwater
0255075
100125150175200
3/29/94 4/3/94 4/8/94 4/13/94 4/18/94 4/23/94 4/28/94Date
TSS
(mg/
L)
Model GE_data P2_data USGS_data
Waterford
020406080
100120140
3/29/94 4/3/94 4/8/94 4/13/94 4/18/94 4/23/94 4/28/94
Date
TSS
(mg/
L)
Model GE_data P2_data USGS_data
Limno-Tech, Inc.

Figure 7-7. Comparison Between Computed and Observed Total Suspended Solids Concentrations (TSS) for the Spring 1997 High Flow Event.
Thompson Island Dam
05
10152025303540
3/24/97 3/29/97 4/3/97 4/8/97 4/13/97 4/18/97 4/23/97Date
TSS
(mg/
L)Model GE_data P2_data USGS_data
Schuylerville
0
20
40
60
80
100
3/24/97 3/29/97 4/3/97 4/8/97 4/13/97 4/18/97 4/23/97Date
TSS
(mg/
L)
Model GE_data P2_data USGS_data
Stillwater
0
25
50
75
3/24/97 3/29/97 4/3/97 4/8/97 4/13/97 4/18/97 4/23/97Date
TSS
(mg/
L)
Model GE_data P2_data USGS_data
Waterford
0102030405060708090
100
3/24/97 3/29/97 4/3/97 4/8/97 4/13/97 4/18/97 4/23/97Date
TSS
(mg/
L)
Model GE_data P2_data USGS_data
Limno-Tech, Inc.

Figure 7-8. Comparison Between Computed and Observed Suspended Solids Concentrations for Fort Edward Flows Less Than 10,000 cfs.
1
10
100
1 10 100Data
Mod
elThompson Island Dam
1991-1997
ModelMean
Dat
aM
ean
1
10
100
1000
1 10 100 1000Data
Mod
el
Stillwater1977-1997
Dat
aM
ean
ModelMean
1
10
100
1000
1 10 100 1000Data
Mod
el
Waterford1977-1997
Dat
aM
ean
ModelMean
Limno-Tech, Inc.

Figure 7-9. Comparison Between Computed and Observed Suspended Solids Concentrations for Fort Edward Flows Greater Than 10,000 cfs.
1
10
100
1 10 100
Data
Mod
elThompson Island Dam
1991-1997 Dat
aM
ean
ModelMean
1
10
100
1000
1 10 100 1000Data
Mod
el
Stillwater1977-1997 D
ata
Mea
n
ModelMean
1
10
100
1000
1 10 100 1000Data
Mod
el
Waterford1977-1997 D
ata
Mea
n
ModelMean
Limno-Tech, Inc.

Figure 7-10. Comparison Between Computed and Observed Probability Distributions for Total Suspended Solids (TSS) for Fort Edward Flows Less Than 10,000 cfs.
0%
25%
50%
75%
100%
0.1 1 10 100 1000TSS Concentration (mg/L)
Perc
ent L
ess
Than
DataModel
Thompson Island Dam1991-1997
0%
25%
50%
75%
100%
0.1 1 10 100 1000TSS Concentration (mg/L)
Perc
ent L
ess
Than
DataModel
Stillwater1977-1997
0%
25%
50%
75%
100%
0.1 1 10 100 1000
TSS Concentration (mg/L)
Perc
ent L
ess
Than
DataModel
Waterford1977-1997
Limno-Tech, Inc.

Figure 7-11. Comparison Between Computed and Observed Probability Distributions for Total Suspended Solids (TSS) for Fort Edward Flows Greater Than 10,000 cfs.
0%
25%
50%
75%
100%
0.1 1 10 100 1000TSS Concentration (mg/L)
Perc
ent L
ess
Than
DataModel
Thompson Island Dam1991-1997
0%
25%
50%
75%
100%
0.1 1 10 100 1000TSS Concentration (mg/L)
Perc
ent L
ess
Than
DataModel
Stillwater1977-1997
0%
25%
50%
75%
100%
0.1 1 10 100 1000TSS Concentration (mg/L)
Perc
ent L
ess
Than
DataModel
Waterford1977-1997
Limno-Tech, Inc.

Figure 7-12. Computed Cumulative Sediment Bed Elevation Change in Thompson Island Pool, 1977-1997.
0.0
0.5
1.0
1.5
2.0
2.5
3.0
3.5
4.0
4.5
1977
1978
1979
1980
1981
1982
1983
1984
1985
1986
1987
1988
1989
1990
1991
1992
1993
1994
1995
1996
1997
1998
Year
Cum
ulat
ive
Bed
Ele
vatio
n C
hang
e (c
m)
Limno-Tech, Inc.
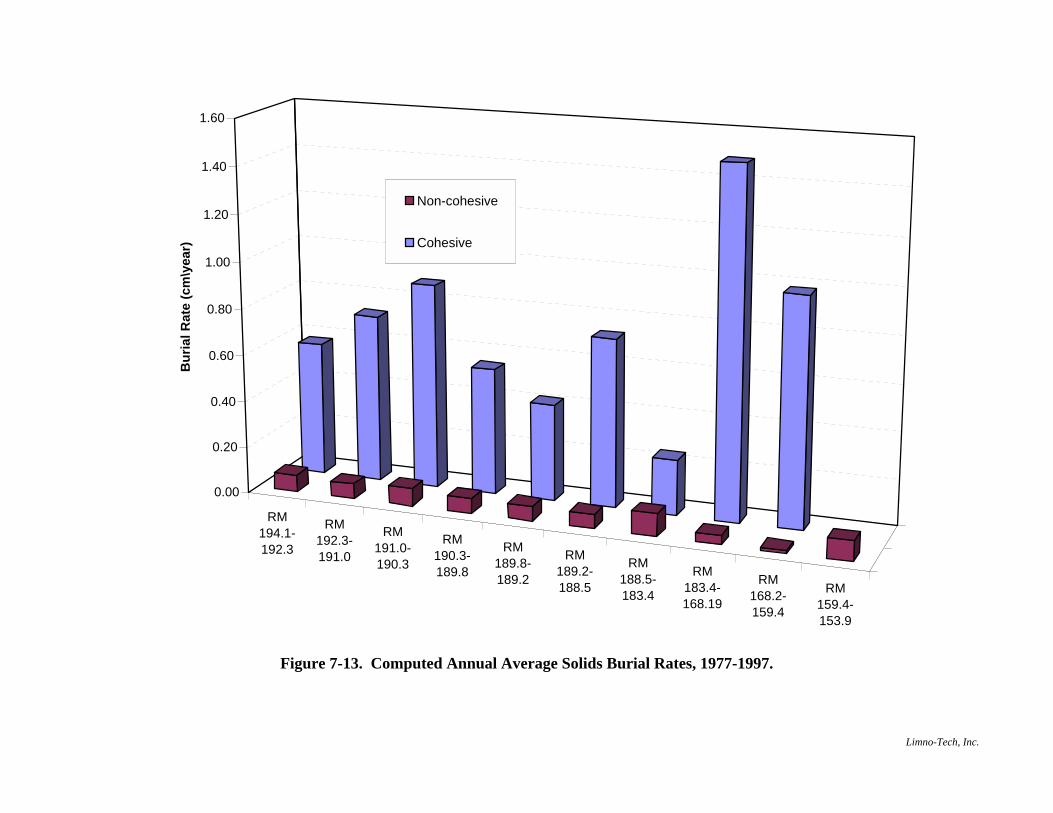
Figure 7-13. Computed Annual Average Solids Burial Rates, 1977-1997.
RM194.1-192.3
RM192.3-191.0
RM191.0-190.3
RM190.3-189.8
RM189.8-189.2
RM189.2-188.5
RM188.5-183.4
RM183.4-168.19
RM168.2-159.4
RM159.4-153.9
0.00
0.20
0.40
0.60
0.80
1.00
1.20
1.40
1.60
Bur
ial R
ate
(cm
\yea
r)Non-cohesive
Cohesive
Limno-Tech, Inc.
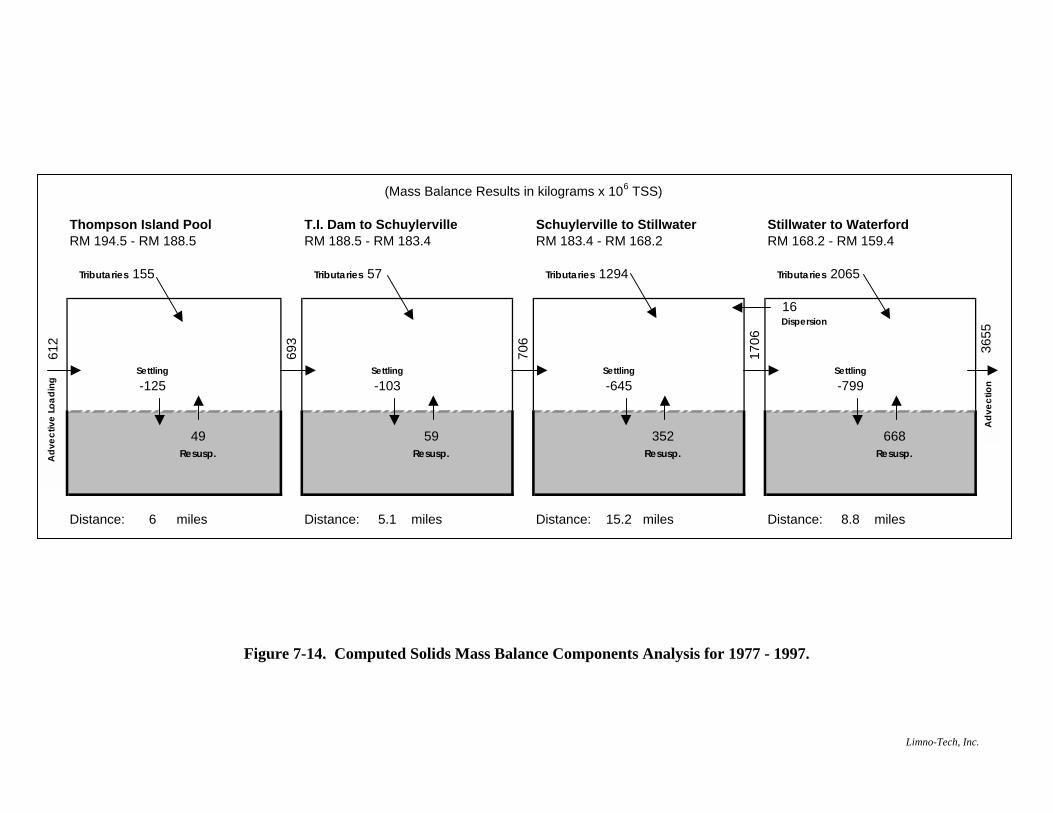
(Mass Balance Results in kilograms x 106 TSS)
Thompson Island Pool T.I. Dam to Schuylerville Schuylerville to Stillwater Stillwater to WaterfordRM 194.5 - RM 188.5 RM 188.5 - RM 183.4 RM 183.4 - RM 168.2 RM 168.2 - RM 159.4
Tributaries 155 Tributaries 57 Tributaries 1294 Tributaries 2065
16
612
693
706
1706
Dispersion
3655
Settling Settling Settling Settling-125 -103 -645 -799
49 59 352 668Resusp. Resusp. Resusp. Resusp.
Distance: 6 miles Distance: 5.1 miles Distance: 15.2 miles Distance: 8.8 miles
Figure 7-14. Computed Solids Mass Balance Components Analysis for 1977 - 1997.
Adv
ectiv
e Lo
adin
g
Adv
ectio
n
Limno-Tech, Inc.
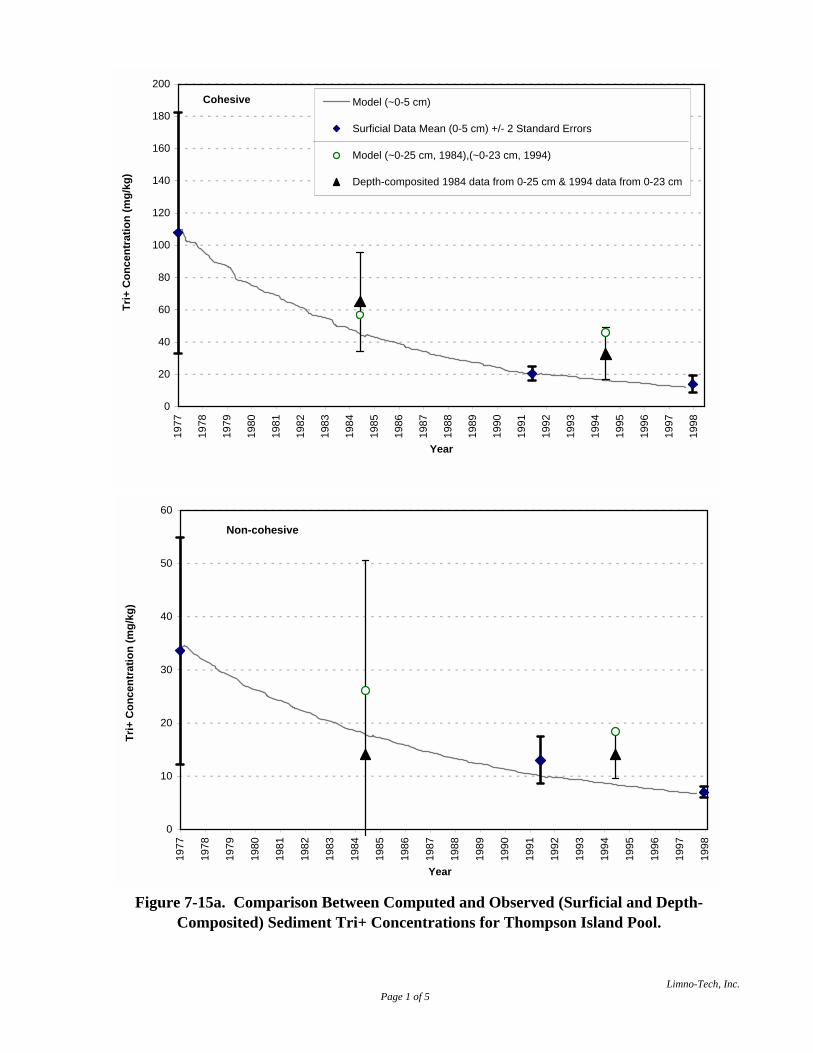
Figure 7-15a. Comparison Between Computed and Observed (Surficial and Depth-Composited) Sediment Tri+ Concentrations for Thompson Island Pool.
0
20
40
60
80
100
120
140
160
180
200
1977
1978
1979
1980
1981
1982
1983
1984
1985
1986
1987
1988
1989
1990
1991
1992
1993
1994
1995
1996
1997
1998
Year
Tri+
Con
cent
ratio
n (m
g/kg
)
Model (~0-5 cm)
Surficial Data Mean (0-5 cm) +/- 2 Standard Errors
Model (~0-25 cm, 1984),(~0-23 cm, 1994)
Depth-composited 1984 data from 0-25 cm & 1994 data from 0-23 cm
Cohesive
0
10
20
30
40
50
60
1977
1978
1979
1980
1981
1982
1983
1984
1985
1986
1987
1988
1989
1990
1991
1992
1993
1994
1995
1996
1997
1998
Year
Tri+
Con
cent
ratio
n (m
g/kg
)
Non-cohesive
Page 1 of 5Limno-Tech, Inc.

Figure 7-15b. Comparison Between Computed and Observed (Surficial and Depth-Composited) Sediment Tri+ Concentrations for Schuylerville Reach.
0
20
40
60
80
100
120
140
160
180
200
1977
1978
1979
1980
1981
1982
1983
1984
1985
1986
1987
1988
1989
1990
1991
1992
1993
1994
1995
1996
1997
Year
Tri+
Con
cent
ratio
n (m
g/kg
)
Model (~0-5 cm)
Surficial Data Mean (0-5 cm) +/- 2 Standard Errors
Model (~0-23 cm, 1994)
Depth-composited 1994 data from 0-23 cm
Cohesive
0
10
20
30
40
50
60
1977
1978
1979
1980
1981
1982
1983
1984
1985
1986
1987
1988
1989
1990
1991
1992
1993
1994
1995
1996
1997
Year
Tri+
Con
cent
ratio
n (m
g/kg
)
Non-cohesive
Page 2 of 5Limno-Tech, Inc.

Figure 7-15c. Comparison Between Computed and Observed (Surficial and Depth-Composited) Sediment Tri+ Concentrations for Stillwater Reach.
0
10
20
30
40
50
60
70
1977
1978
1979
1980
1981
1982
1983
1984
1985
1986
1987
1988
1989
1990
1991
1992
1993
1994
1995
1996
1997
Year
Tri+
Con
cent
ratio
n (m
g/kg
)
Model (~0-5 cm)
Surficial Data Mean (0-5 cm) +/- 2 Standard Errors
Model (~0-23 cm, 1994)
Depth-composited 1994 data from 0-23 cm
0
2
4
6
8
10
12
14
16
18
1977
1978
1979
1980
1981
1982
1983
1984
1985
1986
1987
1988
1989
1990
1991
1992
1993
1994
1995
1996
1997
Year
Tri-
Con
cent
ratio
n (m
g/kg
)
Non-cohesive
CohesiveCohesive
Page 3 of 5Limno-Tech, Inc.

Figure 7-15d. Comparison Between Computed and Observed (Surficial and Depth-Composited) Sediment Tri+ Concentrations for Waterford Reach.
0
10
20
30
40
50
60
70
1977
1978
1979
1980
1981
1982
1983
1984
1985
1986
1987
1988
1989
1990
1991
1992
1993
1994
1995
1996
1997
Year
Tri+
con
cent
ratio
n (m
g/kg
)
Model (~0-5 cm)
Surficial Data Mean (0-5 cm) +/- 2 Standard Errors
Model (~0-23 cm, 1994)
Depth-composited 1994 data from 0-23 cm
Cohesive
0
2
4
6
8
10
12
14
16
18
1977
1978
1979
1980
1981
1982
1983
1984
1985
1986
1987
1988
1989
1990
1991
1992
1993
1994
1995
1996
1997
Year
Tri+
Con
cent
ratio
n (m
g/kg
)
Non-cohesive
Page 4 of 5Limno-Tech, Inc.

Figure 7-15e. Comparison Between Computed and Observed (Surficial and Depth-Composited) Sediment Tri+ Concentrations for Federal Dam Reach.
0
2
4
6
8
10
12
14
16
18
1977
1978
1979
1980
1981
1982
1983
1984
1985
1986
1987
1988
1989
1990
1991
1992
1993
1994
1995
1996
1997
Year
Tri+
Con
cent
ratio
n (m
g/kg
)
Model (~0-5 cm)
Surficial Data Mean (0-5 cm) +/- 2 Standard Errors
Non-cohesive
Page 5 of 5Limno-Tech, Inc.

Figure 7-16. Comparison Between Computed and Observed Depth-Averaged Sediment Tri+ Concentrations in Thompson Island Pool in 1984.
1
10
100
1000
188189190191192193194
River Mile
Tri+
Con
cent
ratio
n (m
g/kg
)
Data Mean +/- 2 SEModel
Non-cohesive1984
1
10
100
1000
188189190191192193194
River Mile
Tri+
Con
cent
ratio
n (m
g/kg
)Data Mean +/- 2 SEModel
Cohesive1984
Limno-Tech, Inc.

Figure 7-17. Comparison Between Computed and Observed Depth-Averaged (0-5 cm) Sediment Tri+ Concentrations From Fort Edward to Federal Dam in 1991.
1
10
100
153158163168173178183188193
River Mile
Tri+
Con
cent
ratio
n (m
g/kg
)
Data Mean +/- 2 SEModel
Non-cohesive1991
0-5 cm
1
10
100
153158163168173178183188193
River Mile
Tri+
Con
cent
ratio
n (m
g/kg
)
Data Mean +/- 2 SEModel
Cohesive1991
0-5 cm
Limno-Tech, Inc.

Figure 7-18. Comparison Between Computed and Observed Depth-Averaged (5-10 cm) Sediment Tri+ Concentrations From Fort Edward to Federal Dam in 1991.
1
10
100
153158163168173178183188193
River Mile
Tri+
Con
cent
ratio
n (m
g/kg
)
Data Mean +/- 2 SEModel
Non-cohesive1991
5-10 cm
1
10
100
153158163168173178183188193
River Mile
Tri+
Con
cent
ratio
n (m
g/kg
)
Data Mean +/- 2 SEModel
Cohesive1991
5-10 cm
Limno-Tech, Inc.

Figure 7-19. Comparison Between Computed and Observed Depth-Averaged (10-26 cm) Sediment Tri+ Concentrations From Fort Edward to Federal Dam in 1991.
0.1
1
10
100
1000
153158163168173178183188193
River Mile
Tri+
Con
cent
ratio
n (m
g/kg
)
Data Mean +/- 2 SEModelNon-cohesive
199110-26 cm
1
10
100
1000
153158163168173178183188193
River Mile
Tri+
Con
cent
ratio
n (m
g/kg
)
Data Mean +/- 2 SEModel
Cohesive1991
10-26 cm
Limno-Tech, Inc.
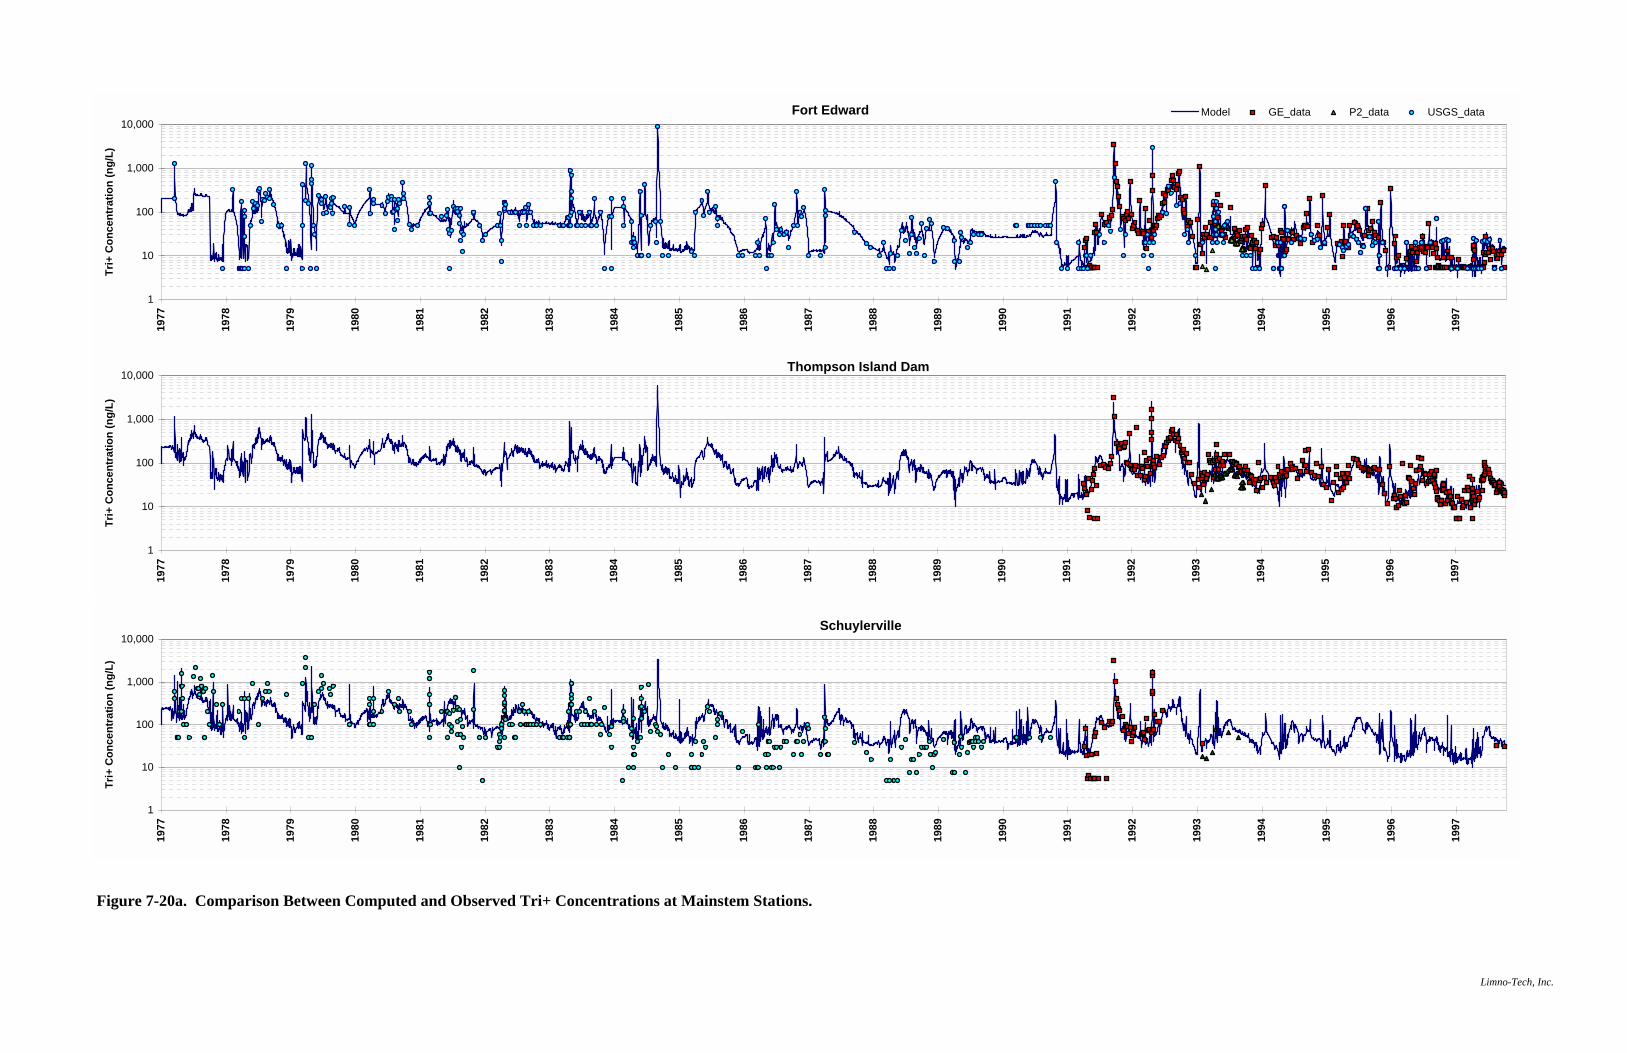
Figure 7-20a. Comparison Between Computed and Observed Tri+ Concentrations at Mainstem Stations.
Fort Edward
1
10
100
1,000
10,000
1977
1978
1979
1980
1981
1982
1983
1984
1985
1986
1987
1988
1989
1990
1991
1992
1993
1994
1995
1996
1997
Tri+
Con
cent
ratio
n (n
g/L)
Model GE_data P2_data USGS_data
Thompson Island Dam
1
10
100
1,000
10,000
1977
1978
1979
1980
1981
1982
1983
1984
1985
1986
1987
1988
1989
1990
1991
1992
1993
1994
1995
1996
1997
Tri+
Con
cent
ratio
n (n
g/L)
Schuylerville
1
10
100
1,000
10,000
1977
1978
1979
1980
1981
1982
1983
1984
1985
1986
1987
1988
1989
1990
1991
1992
1993
1994
1995
1996
1997
Tri+
Con
cent
ratio
n (n
g/L)
Limno-Tech, Inc.

Figure 7-20b. Comparison Between Computed and Observed Tri+ Concentrations at Mainstem Stations.
Stillwater
1
10
100
1,000
10,000
1977
1978
1979
1980
1981
1982
1983
1984
1985
1986
1987
1988
1989
1990
1991
1992
1993
1994
1995
1996
1997
Tri+
Con
cent
ratio
n (n
g/L)
Model GE_data P2_data USGS_data
Waterford
1
10
100
1,000
10,000
1977
1978
1979
1980
1981
1982
1983
1984
1985
1986
1987
1988
1989
1990
1991
1992
1993
1994
1995
1996
1997
Tri+
Con
cent
ratio
n (n
g/L)
Limno-Tech, Inc.

Figure 7-20c. Comparison Between Computed and Observed Tri+ Concentrations at Thompson Island Dam, 1991-1997.
Thompson Island Dam
1
10
100
1,000
10,000
1/1/
91
1/1/
92
12/3
1/92
1/1/
94
1/1/
95
1/1/
96
1/1/
97
Date
Tri+
Con
cent
ratio
n (n
g/L)
Model GE Data USEPA Phase 2 Data USGS Data
Limno-Tech, Inc.

Figure 7-21. Comparisons of Same Day Tri+ Concentration Data by Source at Fort Edward, Stillwater and Waterford.
Fort Edward
0.001
0.01
0.1
1
0.001 0.01 0.1 1
USGS Tri+ (ug/L)
GE
Tri+
(ug/
L)
Stillwater
0.001
0.01
0.1
1
0.001 0.01 0.1 1
USGS Tri+ (ug/L)
GE
Tri+
(ug/
L)
Waterford
0.001
0.01
0.1
1
0.001 0.01 0.1 1
USGS Tri+ (ug/L)
GE
Tri+
(ug/
L)
Limno-Tech, Inc.

Figure 7-22. Comparisons Between Model Estimated and Data Estimated In-River Tri+ Loadings from 1977-1997 Stratified by Fort Edward Flow at 10,000 cfs.
0
2000
4000
6000
8000
10000
12000
<10,000TI Dam (1)
>10,000TI Dam (1)
<10,000Schuy (2)
>10,000Schuy (2)
<10,000Still
>10,000Still
<10,000Water
>10,000Water
Location
Tri+
Mas
s Lo
ad (k
g)
ModelData
(1) TI Dam was evaluated over the period of 1/1/91 - 9/30/97.(2) Schuylerville was evaluated over the period 1/1/77-12/31/92.
0%
10%
20%
30%
40%
50%
60%
70%
80%
90%
<10,000TI Dam (1)
>10,000TI Dam (1)
<10,000Schuy (2)
>10,000Schuy (2)
<10,000Still
>10,000Still
<10,000Water
>10,000Water
Location
Frac
tion
of T
ri+ M
ass
Load
ModelData
(1) TI Dam was evaluated over the period of 1/1/91 - 9/30/97.(2) Schuylerville was evaluated over the period 1/1/77-12/31/92.
Limno-Tech, Inc.

Figure 7-23. Comparison Between Computed and Observed Tri+ Concentrations for the Spring 1983 High Flow Event.
Thompson Island Dam
10
100
1000
10000
4/8/83 4/13/83 4/18/83 4/23/83 4/28/83 5/3/83 5/8/83Date
Tri+
Con
cent
ratio
n (n
g/L)
Model GE_data P2_data USGS_data
Schuylerville
10
100
1000
10000
4/8/83 4/13/83 4/18/83 4/23/83 4/28/83 5/3/83 5/8/83Date
Tri+
Con
cent
ratio
n (n
g/L)
Model GE_data P2_data USGS_data
Stillwater
10
100
1000
10000
4/8/83 4/13/83 4/18/83 4/23/83 4/28/83 5/3/83 5/8/83Date
Tri+
Con
cent
ratio
n (n
g/L)
Model GE_data P2_data USGS_data
Waterford
10
100
1000
10000
4/8/83 4/13/83 4/18/83 4/23/83 4/28/83 5/3/83 5/8/83Date
Tri+
Con
cent
ratio
n (n
g/L)
Model GE_data P2_data USGS_data
Limno-Tech, Inc.
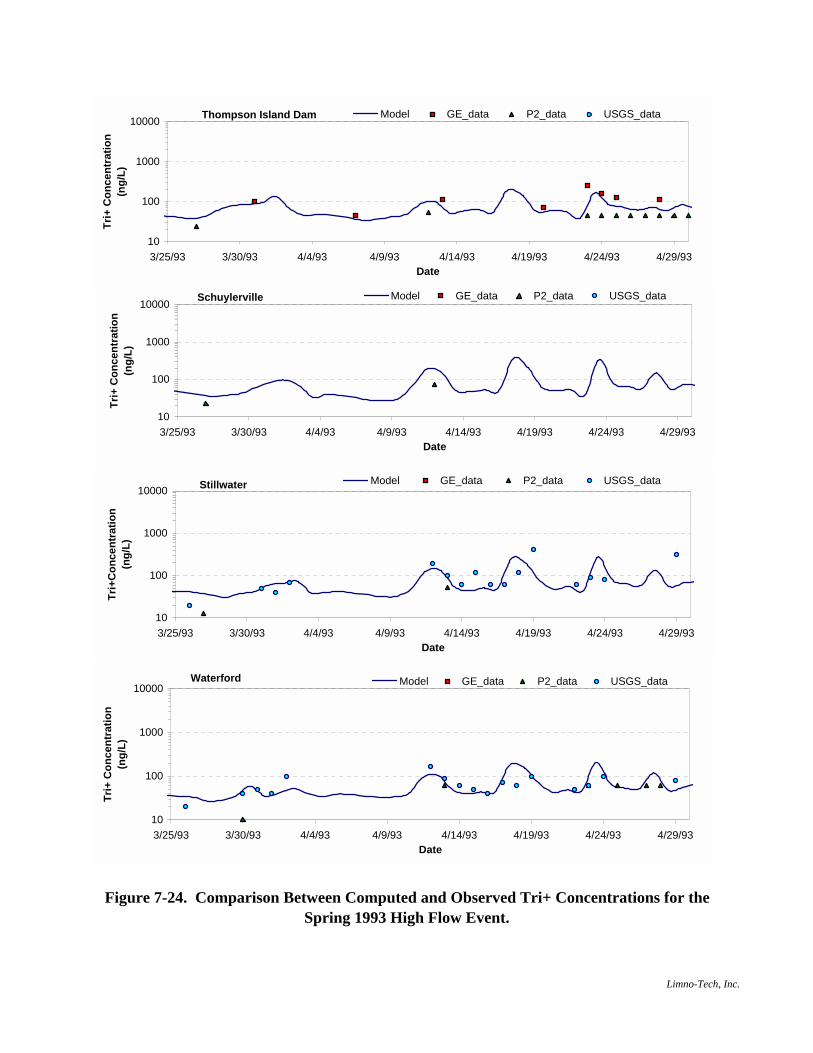
Figure 7-24. Comparison Between Computed and Observed Tri+ Concentrations for the Spring 1993 High Flow Event.
Thompson Island Dam
10
100
1000
10000
3/25/93 3/30/93 4/4/93 4/9/93 4/14/93 4/19/93 4/24/93 4/29/93Date
Tri+
Con
cent
ratio
n (n
g/L)
Model GE_data P2_data USGS_data
Schuylerville
10
100
1000
10000
3/25/93 3/30/93 4/4/93 4/9/93 4/14/93 4/19/93 4/24/93 4/29/93Date
Tri+
Con
cent
ratio
n (n
g/L)
Model GE_data P2_data USGS_data
Stillwater
10
100
1000
10000
3/25/93 3/30/93 4/4/93 4/9/93 4/14/93 4/19/93 4/24/93 4/29/93Date
Tri+
Con
cent
ratio
n (n
g/L)
Model GE_data P2_data USGS_data
Waterford
10
100
1000
10000
3/25/93 3/30/93 4/4/93 4/9/93 4/14/93 4/19/93 4/24/93 4/29/93Date
Tri+
Con
cent
ratio
n (n
g/L)
Model GE_data P2_data USGS_data
Limno-Tech, Inc.
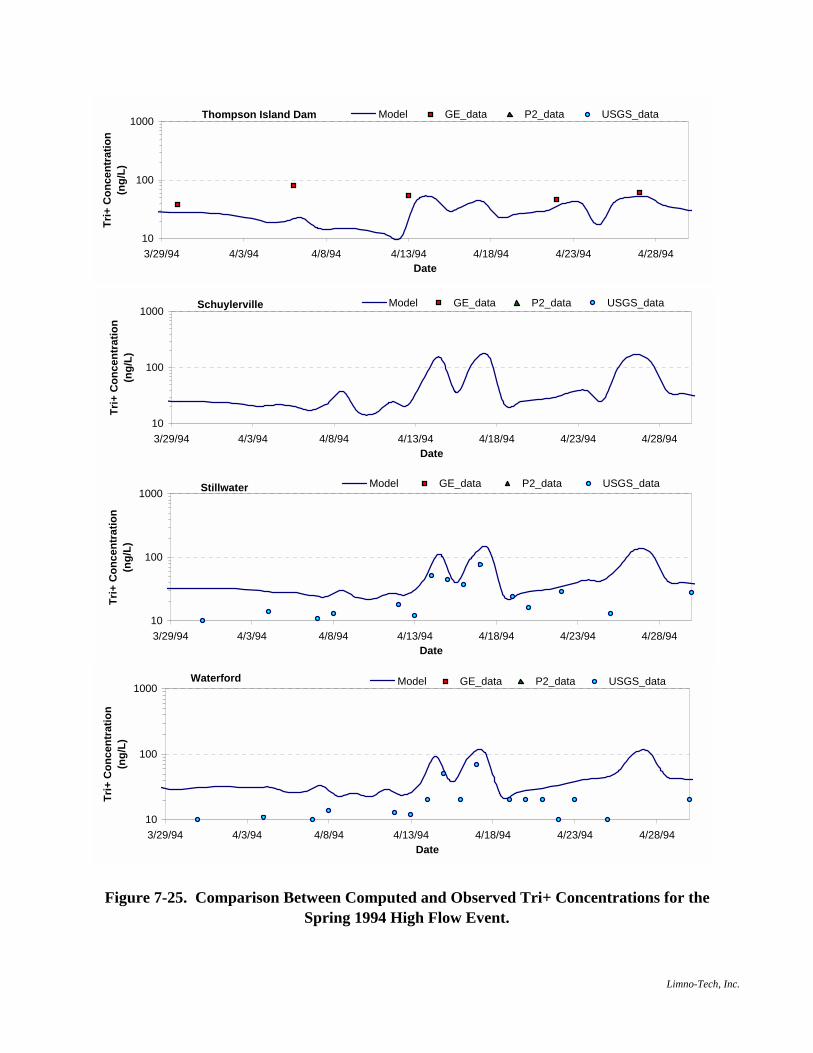
Figure 7-25. Comparison Between Computed and Observed Tri+ Concentrations for the Spring 1994 High Flow Event.
Thompson Island Dam
10
100
1000
3/29/94 4/3/94 4/8/94 4/13/94 4/18/94 4/23/94 4/28/94Date
Tri+
Con
cent
ratio
n (n
g/L)
Model GE_data P2_data USGS_data
Schuylerville
10
100
1000
3/29/94 4/3/94 4/8/94 4/13/94 4/18/94 4/23/94 4/28/94Date
Tri+
Con
cent
ratio
n (n
g/L)
Model GE_data P2_data USGS_data
Stillwater
10
100
1000
3/29/94 4/3/94 4/8/94 4/13/94 4/18/94 4/23/94 4/28/94Date
Tri+
Con
cent
ratio
n (n
g/L)
Model GE_data P2_data USGS_data
Waterford
10
100
1000
3/29/94 4/3/94 4/8/94 4/13/94 4/18/94 4/23/94 4/28/94Date
Tri+
Con
cent
ratio
n (n
g/L)
Model GE_data P2_data USGS_data
Limno-Tech, Inc.
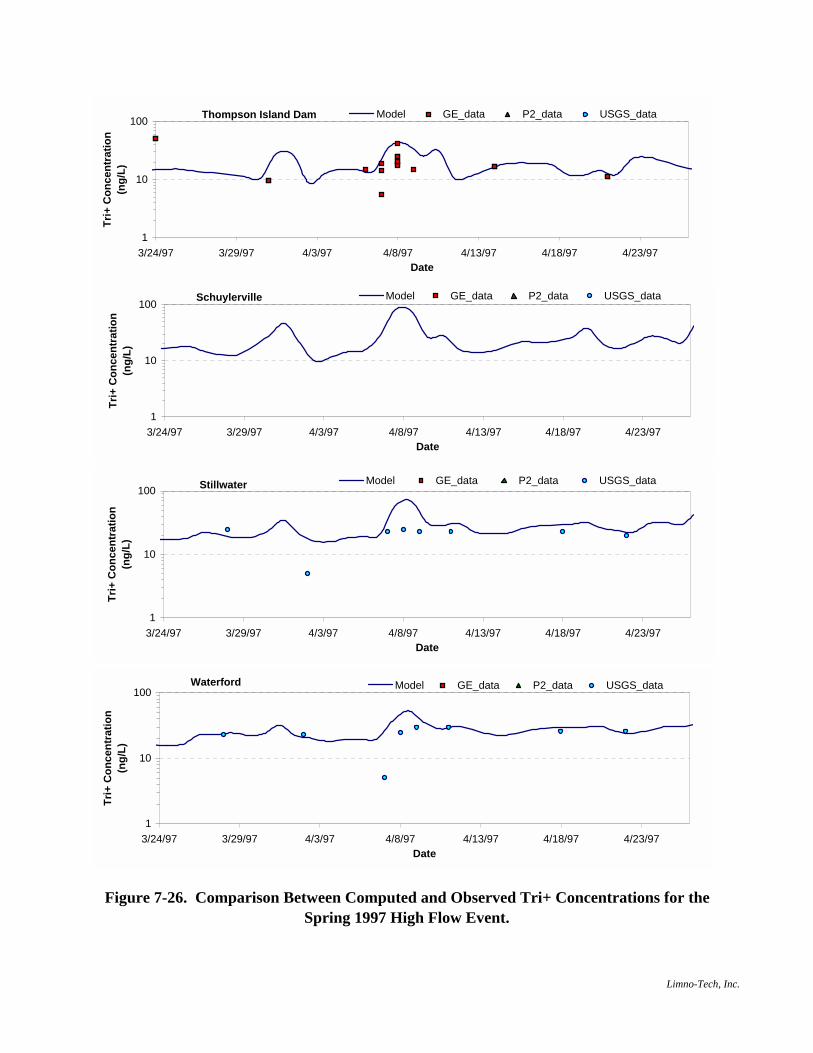
Figure 7-26. Comparison Between Computed and Observed Tri+ Concentrations for the Spring 1997 High Flow Event.
Thompson Island Dam
1
10
100
3/24/97 3/29/97 4/3/97 4/8/97 4/13/97 4/18/97 4/23/97Date
Tri+
Con
cent
ratio
n (n
g/L)
Model GE_data P2_data USGS_data
Schuylerville
1
10
100
3/24/97 3/29/97 4/3/97 4/8/97 4/13/97 4/18/97 4/23/97Date
Tri+
Con
cent
ratio
n (n
g/L)
Model GE_data P2_data USGS_data
Stillwater
1
10
100
3/24/97 3/29/97 4/3/97 4/8/97 4/13/97 4/18/97 4/23/97Date
Tri+
Con
cent
ratio
n (n
g/L)
Model GE_data P2_data USGS_data
Waterford
1
10
100
3/24/97 3/29/97 4/3/97 4/8/97 4/13/97 4/18/97 4/23/97Date
Tri+
Con
cent
ratio
n (n
g/L)
Model GE_data P2_data USGS_data
Limno-Tech, Inc.

Figure 7-27. Comparison Between Computed and Observed Tri+ Concentrations for Fort Edward Flow Less Than 10,000 cfs.
1
10
100
1000
10000
1 10 100 1000 10000Data
Mod
el
Thompson Island Dam1991-1997 D
ata
Mea
n
ModelMean
1
10
100
1000
10000
1 10 100 1000 10000
Data
Mod
el
Schuylerville1977-1997 D
ata
Mea
n
ModelMean
1
10
100
1000
10000
1 10 100 1000 10000Data
Mod
el
Stillwater1977-1997
Dat
aM
ean
ModelMean
1
10
100
1000
10000
1 10 100 1000 10000
Data
Mod
el
Waterford1977-1997
Dat
aM
ean
ModelMean
Limno-Tech, Inc.

Figure 7-28. Comparison Between Computed and Observed Tri+ Concentrations for Fort Edward Flow Greater Than 10,000 cfs.
1
10
100
1000
10000
1 10 100 1000 10000Data
Mod
el
Thompson Island Dam1991-1997 D
ata
Mea
n
ModelMean
1
10
100
1000
10000
1 10 100 1000 10000
Data
Mod
el
Schuylerville1977-1997 D
ata
Mea
n
ModelMean
1
10
100
1000
10000
1 10 100 1000 10000Data
Mod
el
Stillwater1977-1997 D
ata
Mea
n
ModelMean
1
10
100
1000
10000
1 10 100 1000 10000
Data
Mod
el
Waterford1977-1997 D
ata
Mea
n
ModelMean
Limno-Tech, Inc.
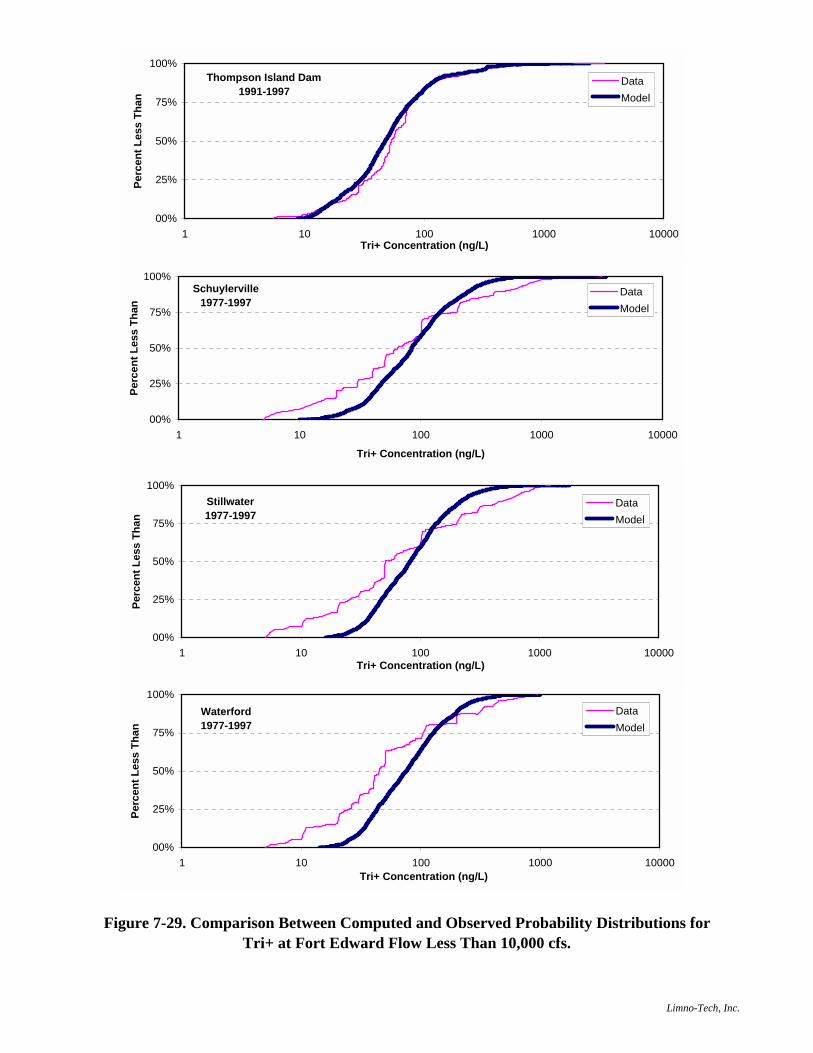
Figure 7-29. Comparison Between Computed and Observed Probability Distributions for Tri+ at Fort Edward Flow Less Than 10,000 cfs.
00%
25%
50%
75%
100%
1 10 100 1000 10000Tri+ Concentration (ng/L)
Perc
ent L
ess
Than
DataModel
Thompson Island Dam1991-1997
00%
25%
50%
75%
100%
1 10 100 1000 10000
Tri+ Concentration (ng/L)
Perc
ent L
ess
Than
DataModel
Schuylerville1977-1997
00%
25%
50%
75%
100%
1 10 100 1000 10000Tri+ Concentration (ng/L)
Perc
ent L
ess
Than
DataModel
Stillwater1977-1997
00%
25%
50%
75%
100%
1 10 100 1000 10000Tri+ Concentration (ng/L)
Perc
ent L
ess
Than
DataModel
Waterford1977-1997
Limno-Tech, Inc.

Figure 7-30. Comparison Between Computed and Observed Probability Distributions for Tri+ at Fort Edward Flow Greater Than 10,000 cfs.
00%
25%
50%
75%
100%
1 10 100 1000 10000
Tri+ Concentration (ng/L)
Perc
ent L
ess
Than
DataModel
Thompson Island Dam1991-1997
00%
25%
50%
75%
100%
1 10 100 1000 10000
Tri+ Concentration (ng/L)
Perc
ent L
ess
Than
DataModel
Schuylerville1977-1997
00%
25%
50%
75%
100%
1 10 100 1000 10000
Tri+ Concentration (ng/L)
Perc
ent L
ess
Than
DataModel
Stillwater1977-1997
00%
25%
50%
75%
100%
1 10 100 1000 10000Tri+ Concentration (ng/L)
Perc
ent L
ess
Than
DataModel
Waterford1977-1997
Limno-Tech, Inc.
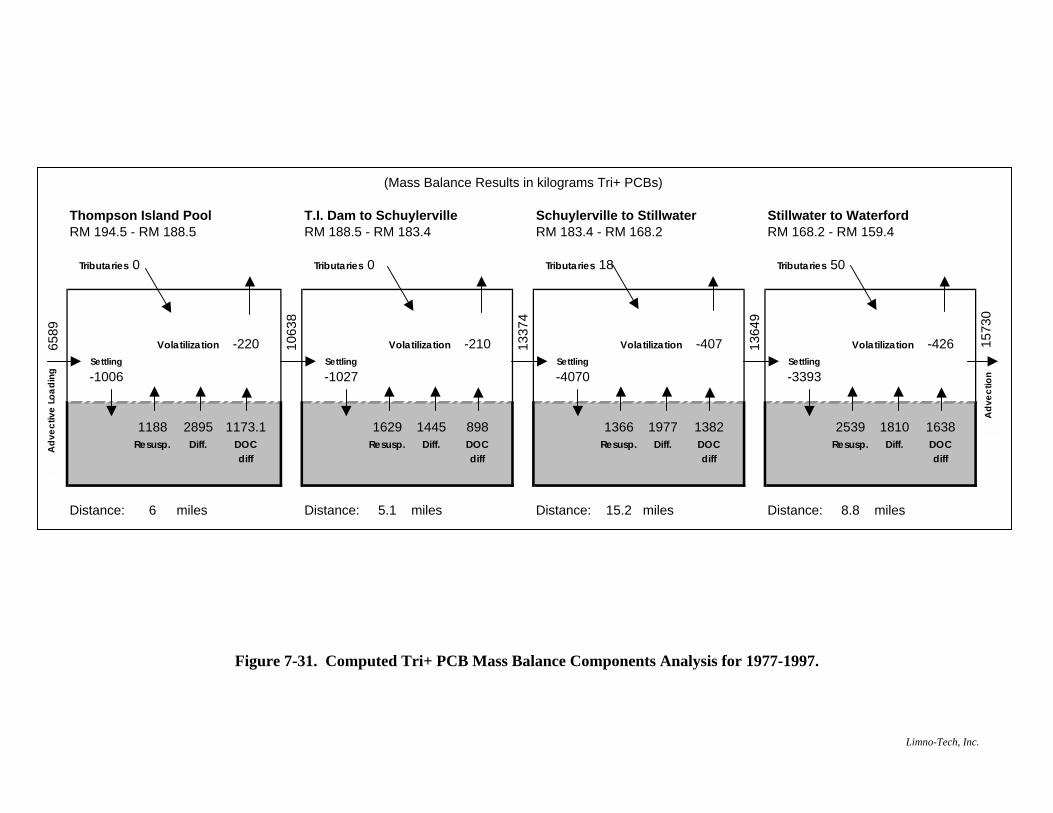
(Mass Balance Results in kilograms Tri+ PCBs)
Thompson Island Pool T.I. Dam to Schuylerville Schuylerville to Stillwater Stillwater to WaterfordRM 194.5 - RM 188.5 RM 188.5 - RM 183.4 RM 183.4 - RM 168.2 RM 168.2 - RM 159.4
Tributaries 0 Tributaries 0 Tributaries 18 Tributaries 50
6589
Volatilization -220 1063
8
Volatilization -210 1337
4
Volatilization -407 1364
9
Volatilization -426 1573
0
Settling Settling Settling Settling-1006 -1027 -4070 -3393
1188 2895 1173.1 1629 1445 898 1366 1977 1382 2539 1810 1638Resusp. Diff. DOC Resusp. Diff. DOC Resusp. Diff. DOC Resusp. Diff. DOC
diff diff diff diff
Distance: 6 miles Distance: 5.1 miles Distance: 15.2 miles Distance: 8.8 miles
Figure 7-31. Computed Tri+ PCB Mass Balance Components Analysis for 1977-1997.
Adv
ectiv
e Lo
adin
g
Adv
ectio
n
Limno-Tech, Inc.

Figure 7-32. Computed Cumulative Contribution Tri+ Load Gain Between Mainstem Hudson River Sampling Stations from 1991 to 1997.
-200
-100
0
100
200
300
400
500
600
700
1-A
pr-9
1
1-Ju
l-91
30-S
ep-9
1
30-D
ec-9
1
31-M
ar-9
2
30-J
un-9
2
29-S
ep-9
2
29-D
ec-9
2
31-M
ar-9
3
30-J
un-9
3
29-S
ep-9
3
29-D
ec-9
3
31-M
ar-9
4
30-J
un-9
4
29-S
ep-9
4
29-D
ec-9
4
31-M
ar-9
5
30-J
un-9
5
29-S
ep-9
5
29-D
ec-9
5
30-M
ar-9
6
29-J
un-9
6
28-S
ep-9
6
28-D
ec-9
6
30-M
ar-9
7
29-J
un-9
7
28-S
ep-9
7
Date
Cum
ulat
ive
Tri+
Mas
s Lo
ad G
ain*
(kg)
Fort Edward to TID
TID to Schuylerville
Schuylerville to Stillwater
Stillwater to Waterford
*Load gain by reach computed as: (upstream load + tributary load) - load out - volatilization loss
Limno-Tech, Inc.

Figure 7-33. Sediment Responses in Thompson Island Pool to Alternate Solids Loads at Fort Edward.
Cohesive1977-1997
0
20
40
60
80
100
120
140
160
180
20019
77
1978
1979
1980
1981
1982
1983
1984
1985
1986
1987
1988
1989
1990
1991
1992
1993
1994
1995
1996
1997
1998
Date
Tri+
Sed
imen
t Con
cent
ratio
n (m
g/kg
)
Non-cohesive1977-1997
0
10
20
30
40
50
60
1977
1978
1979
1980
1981
1982
1983
1984
1985
1986
1987
1988
1989
1990
1991
1992
1993
1994
1995
1996
1997
1998
Date
Tri+
Sed
imen
t Con
cent
ratio
n (m
g/kg
)
Base Calibration Higher TSS at Fort Edward
Limno-Tech, Inc.

Figure 7-34. Sediment Responses in Waterford to Alternative Solids Loads at Fort Edward.
Cohesvie1977-1997
0
10
20
30
40
50
60
7019
77
1978
1979
1980
1981
1982
1983
1984
1985
1986
1987
1988
1989
1990
1991
1992
1993
1994
1995
1996
1997
1998
Date
Tri+
Sed
imen
t Con
cent
ratio
n (m
g/kg
)
Non-cohesive1977-1997
0
1
2
3
4
5
6
7
8
9
10
1977
1978
1979
1980
1981
1982
1983
1984
1985
1986
1987
1988
1989
1990
1991
1992
1993
1994
1995
1996
1997
1998
Date
Tri+
Sed
imen
t Con
cent
ratio
n (m
g/kg
)
Base Calibration Higher TSS at Fort Edward
Limno-Tech, Inc.

Figure 7-35. Sediment Responses in Thompson Island Pool to Changes in Tributary Solids Loadings.
Cohesive1977 - 1997
0
20
40
60
80
100
120
140
160
180
20019
77
1978
1979
1980
1981
1982
1983
1984
1985
1986
1987
1988
1989
1990
1991
1992
1993
1994
1995
1996
1997
1998
Date
Tri+
Sed
imen
t Con
cent
ratio
n (m
g/kg
)
Non-Cohesive1977 - 1997
0
10
20
30
40
50
60
1977
1978
1979
1980
1981
1982
1983
1984
1985
1986
1987
1988
1989
1990
1991
1992
1993
1994
1995
1996
1997
1998
Date
Tri+
Sed
imen
t Con
cent
ratio
n (m
g/kg
)
Base Calibration Trib Solids +50% Trib Solids -50%
Limno-Tech, Inc.

Figure 7-36. Sediment Responses at Waterford to Changes in Tributary Solids Loadings.
Cohesive1977 - 1997
0
10
20
30
40
50
60
70
1977
1978
1979
1980
1981
1982
1983
1984
1985
1986
1987
1988
1989
1990
1991
1992
1993
1994
1995
1996
1997
Date
Tri+
Sed
imen
t Con
cent
ratio
n (m
g/kg
)
Non-Cohesive1977 - 1997
0
1
2
3
4
5
6
7
8
9
10
1977
1978
1979
1980
1981
1982
1983
1984
1985
1986
1987
1988
1989
1990
1991
1992
1993
1994
1995
1996
1997
Date
Tri+
Sed
imen
t Con
cent
ratio
n (m
g/kg
)
Base Calibration Trib Solids +50% Trib Solids -50%
Limno-Tech, Inc.

Figure 7-37. Water Column Responses to Changes in Tributary Solids Loadings.
Thompson Island Pool
0
50
100
150
200
250
1977
1978
1979
1980
1981
1982
1983
1984
1985
1986
1987
1988
1989
1990
1991
1992
1993
1994
1995
1996
1997
Year
Ave
rage
Ann
ual T
ri+ C
once
ntra
tion
(ng/
L)
Waterford
0
50
100
150
200
250
300
350
1977
1978
1979
1980
1981
1982
1983
1984
1985
1986
1987
1988
1989
1990
1991
1992
1993
1994
1995
1996
1997
Year
Ave
rage
Ann
ual T
ri+ C
once
ntra
tion
(ng/
L)
Base Calibration Trib Solids -50% Trib Solids +50%
Limno-Tech, Inc.

Figure 7-38. Sediment Responses in Thompson Island Pool to Changes in Tributary Solids Loads Due to Specification of Rating Curves.
Cohesive1977 - 1997
0
20
40
60
80
100
120
140
160
180
20019
77
1978
1979
1980
1981
1982
1983
1984
1985
1986
1987
1988
1989
1990
1991
1992
1993
1994
1995
1996
1997
1998
Date
Tri+
Sed
imen
t Con
cent
ratio
n (m
g/kg
)
Non-Cohesive1977 - 1997
0
10
20
30
40
50
60
1977
1978
1979
1980
1981
1982
1983
1984
1985
1986
1987
1988
1989
1990
1991
1992
1993
1994
1995
1996
1997
1998
Date
Tri+
Sed
imen
t Con
cent
ratio
n (m
g/kg
)
Base Calibration Trib Solids Using Original Rating Curve
Limno-Tech, Inc.

Figure 7-39. Sediment Responses at Waterford to Changes in Tributary Solids Loadings Due to Specification of Rating Curves.
Cohesive1977 - 1997
0
10
20
30
40
50
60
7019
77
1978
1979
1980
1981
1982
1983
1984
1985
1986
1987
1988
1989
1990
1991
1992
1993
1994
1995
1996
1997
Date
Tri+
Sed
imen
t Con
cent
ratio
n (m
g/kg
)
Non-Cohesive1977 - 1997
0
1
2
3
4
5
6
7
8
9
10
1977
1978
1979
1980
1981
1982
1983
1984
1985
1986
1987
1988
1989
1990
1991
1992
1993
1994
1995
1996
1997
Date
Tri+
Sed
imen
t Con
cent
ratio
n (m
g/kg
)
Base Calibration Trib Solids Using Original Rating Curve
Limno-Tech, Inc.

Figure 7-40. Water Column Responses to Changes in Tributary Solids Loadings Due to Specification of Rating Curve.
Thompson Island Pool
0
50
100
150
200
250
1977
1978
1979
1980
1981
1982
1983
1984
1985
1986
1987
1988
1989
1990
1991
1992
1993
1994
1995
1996
1997
Year
Ave
rage
Ann
ual T
ri+ C
once
ntra
tion
(ng/
L)
Waterford
0
50
100
150
200
250
300
350
1977
1978
1979
1980
1981
1982
1983
1984
1985
1986
1987
1988
1989
1990
1991
1992
1993
1994
1995
1996
1997
Year
Ave
rage
Ann
ual T
ri+ C
once
ntra
tion
(ng/
L)
Base Calibration Trib Solids Using Original Rating Curve
Limno-Tech, Inc.

Figure 7-41. Sediment Responses in Thompson Island Pool to Changes in Partitioning.
Cohesive1977 - 1997
0
20
40
60
80
100
120
140
160
180
20019
77
1978
1979
1980
1981
1982
1983
1984
1985
1986
1987
1988
1989
1990
1991
1992
1993
1994
1995
1996
1997
1998
Date
Tri+
Sed
imen
t Con
cent
ratio
n (m
g/kg
)
Non-Cohesive1977 - 1997
0
10
20
30
40
50
60
1977
1978
1979
1980
1981
1982
1983
1984
1985
1986
1987
1988
1989
1990
1991
1992
1993
1994
1995
1996
1997
1998
Date
Tri+
Sed
imen
t Con
cent
ratio
n (m
g/kg
)
Base Calibration Kpoc Low Kpoc High
Limno-Tech, Inc.

Figure 7-42. Sediment Responses in Waterford Reach to Changes in Partitioning.
Cohesive1977 - 1997
0
10
20
30
40
50
60
70
1977
1978
1979
1980
1981
1982
1983
1984
1985
1986
1987
1988
1989
1990
1991
1992
1993
1994
1995
1996
1997
Date
Tri+
Sed
imen
t Con
cent
ratio
n (m
g/kg
)
Non-Cohesive1977 - 1997
0
1
2
3
4
5
6
7
8
9
10
1977
1978
1979
1980
1981
1982
1983
1984
1985
1986
1987
1988
1989
1990
1991
1992
1993
1994
1995
1996
1997
Date
Tri+
Sed
imen
t Con
cent
ratio
n (m
g/kg
)
Base Calibration Kpoc Low Kpoc High
Limno-Tech, Inc.
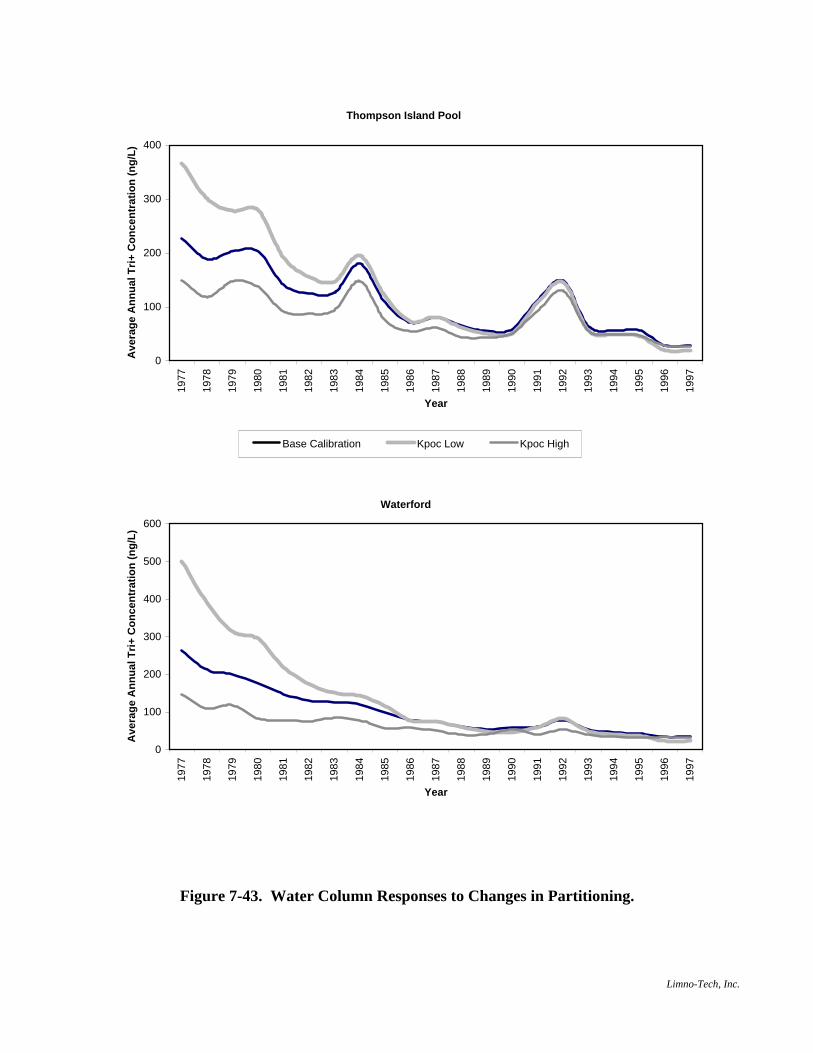
Figure 7-43. Water Column Responses to Changes in Partitioning.
Thompson Island Pool
0
100
200
300
400
1977
1978
1979
1980
1981
1982
1983
1984
1985
1986
1987
1988
1989
1990
1991
1992
1993
1994
1995
1996
1997
Year
Ave
rage
Ann
ual T
ri+ C
once
ntra
tion
(ng/
L)
Waterford
0
100
200
300
400
500
600
1977
1978
1979
1980
1981
1982
1983
1984
1985
1986
1987
1988
1989
1990
1991
1992
1993
1994
1995
1996
1997
Year
Ave
rage
Ann
ual T
ri+ C
once
ntra
tion
(ng/
L)
Base Calibration Kpoc Low Kpoc High
Limno-Tech, Inc.

Figure 7-44. Time Series for Effective Mass Transfer Rate in HUDTOX.
0
10
20
30
40
50
60
70
0 30 61 91 121 152 182 212 243 273 304 334 364 Day of Year
k f (c
m/d
ay)
Base Lower Bound Upper Bound
Note: Days when FE Q > 10,000 cfs or TSS at FE or TID > 10 mg/L were not used. 1991 and 1992 data were not used. Values of kf < 0 were not used.
Limno-Tech, Inc.

Figure 7-45. Sediment Responses in Thompson Island Pool to Changes in Sediment-Water Mass Transfer Rate.
Cohesive1977 - 1997
0
20
40
60
80
100
120
140
160
180
20019
77
1978
1979
1980
1981
1982
1983
1984
1985
1986
1987
1988
1989
1990
1991
1992
1993
1994
1995
1996
1997
Date
Tri+
Sed
imen
t Con
cent
ratio
n (m
g/kg
)
Non-Cohesive1977 - 1997
0
10
20
30
40
50
60
1977
1978
1979
1980
1981
1982
1983
1984
1985
1986
1987
1988
1989
1990
1991
1992
1993
1994
1995
1996
1997
Date
Tri+
Sed
imen
t Con
cent
ratio
n (m
g/kg
)
Base Calibration Kf Low Kf High
Limno-Tech, Inc.

Figure 7-46. Sediment Responses in Waterford Reach to Changes in Sediment-Water Mass Transfer Rate.
Cohesive1977 - 1997
0
10
20
30
40
50
60
7019
77
1978
1979
1980
1981
1982
1983
1984
1985
1986
1987
1988
1989
1990
1991
1992
1993
1994
1995
1996
1997
Date
Tri+
Sed
imen
t Con
cent
ratio
n (m
g/kg
)
Non-Cohesive1977 - 1997
0
1
2
3
4
5
6
7
8
9
10
1977
1978
1979
1980
1981
1982
1983
1984
1985
1986
1987
1988
1989
1990
1991
1992
1993
1994
1995
1996
1997
Date
Tri+
Sed
imen
t Con
cent
ratio
n (m
g/kg
)
Base Calibration Kf Low Kf High
Limno-Tech, Inc.
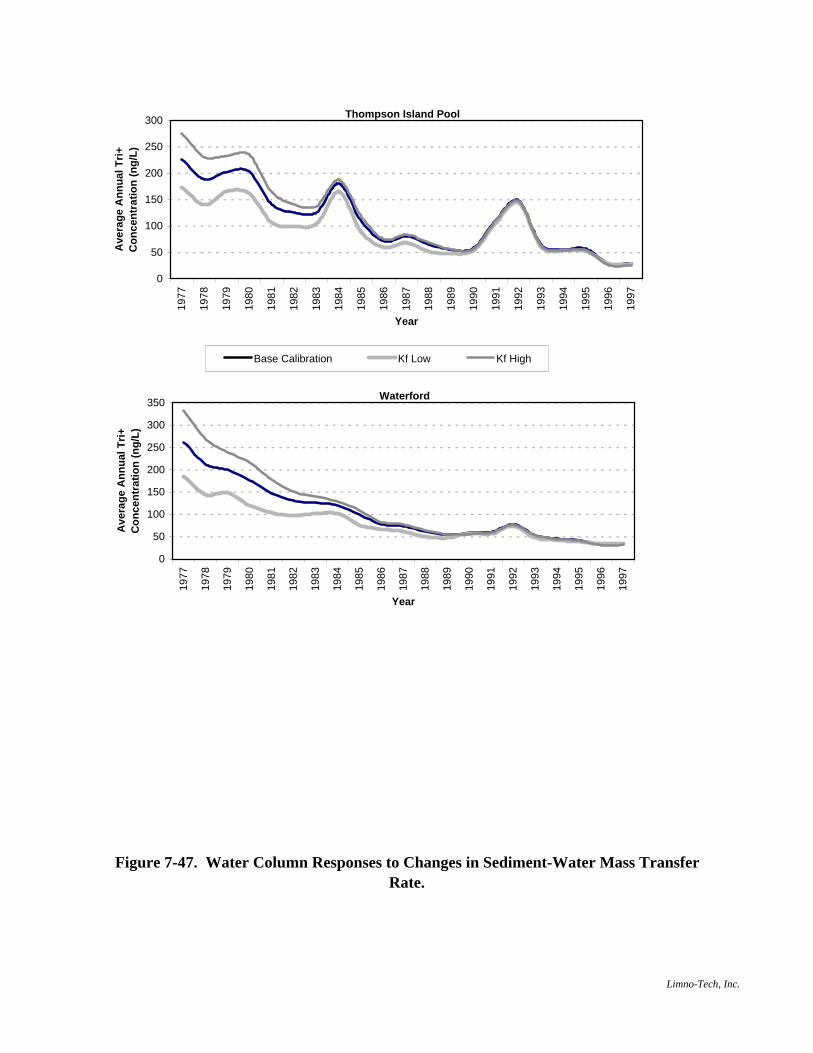
Figure 7-47. Water Column Responses to Changes in Sediment-Water Mass Transfer Rate.
Thompson Island Pool
0
50
100
150
200
250
300
1977
1978
1979
1980
1981
1982
1983
1984
1985
1986
1987
1988
1989
1990
1991
1992
1993
1994
1995
1996
1997
Year
Ave
rage
Ann
ual T
ri+
Con
cent
ratio
n (n
g/L)
Waterford
0
50
100
150
200
250
300
350
1977
1978
1979
1980
1981
1982
1983
1984
1985
1986
1987
1988
1989
1990
1991
1992
1993
1994
1995
1996
1997
Year
Ave
rage
Ann
ual T
ri+
Con
cent
ratio
n (n
g/L)
Base Calibration Kf Low Kf High
Limno-Tech, Inc.
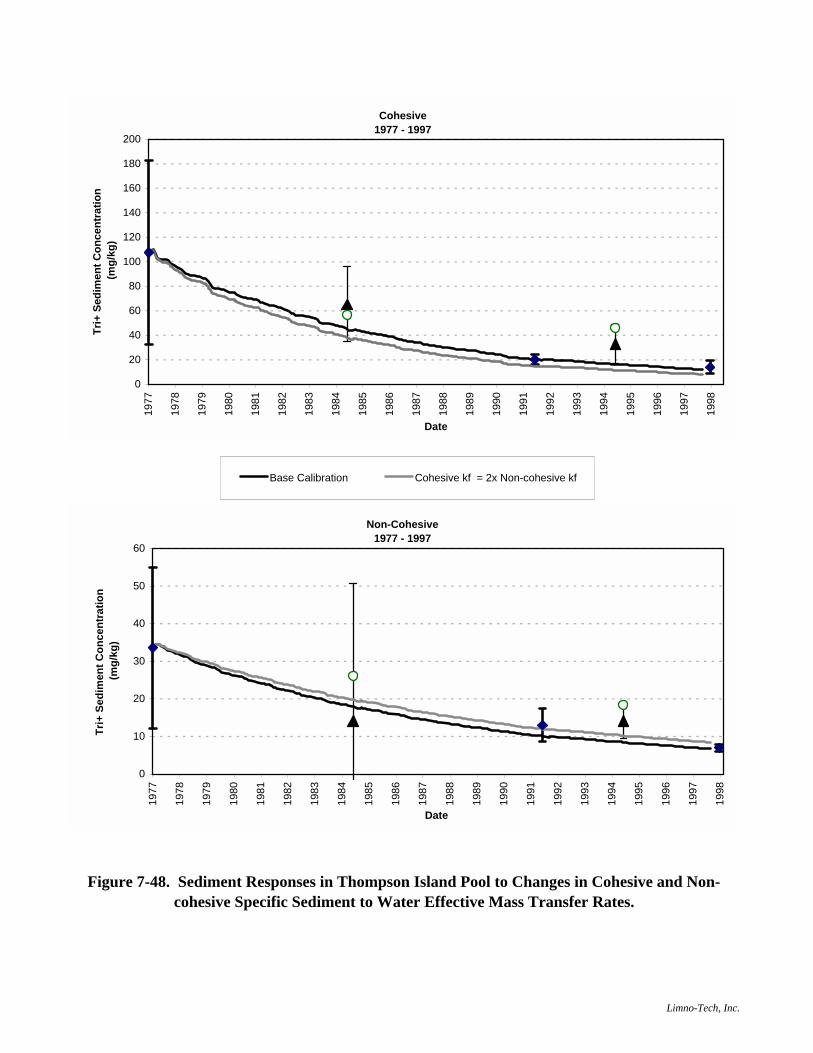
Figure 7-48. Sediment Responses in Thompson Island Pool to Changes in Cohesive and Non-cohesive Specific Sediment to Water Effective Mass Transfer Rates.
Cohesive1977 - 1997
0
20
40
60
80
100
120
140
160
180
20019
77
1978
1979
1980
1981
1982
1983
1984
1985
1986
1987
1988
1989
1990
1991
1992
1993
1994
1995
1996
1997
1998
Date
Tri+
Sed
imen
t Con
cent
ratio
n (m
g/kg
)
Non-Cohesive1977 - 1997
0
10
20
30
40
50
60
1977
1978
1979
1980
1981
1982
1983
1984
1985
1986
1987
1988
1989
1990
1991
1992
1993
1994
1995
1996
1997
1998
Date
Tri+
Sed
imen
t Con
cent
ratio
n (m
g/kg
)
Base Calibration Cohesive kf = 2x Non-cohesive kf
Limno-Tech, Inc.

Figure 7-49. Sediment Responses in Waterford to Changes in Cohesive and Non-cohesive Specific Sediment to Water Effective Mass Transfer Rates.
Cohesive1977 - 1997
0
10
20
30
40
50
60
7019
77
1978
1979
1980
1981
1982
1983
1984
1985
1986
1987
1988
1989
1990
1991
1992
1993
1994
1995
1996
1997
Date
Tri+
Sed
imen
t Con
cent
ratio
n (m
g/kg
)
Non-Cohesive1977 - 1997
0
1
2
3
4
5
6
7
8
9
10
1977
1978
1979
1980
1981
1982
1983
1984
1985
1986
1987
1988
1989
1990
1991
1992
1993
1994
1995
1996
1997
Date
Tri+
Sed
imen
t Con
cent
ratio
n (m
g/kg
)
Base Calibration Cohesive kf = 2x Non-cohesive kf
Limno-Tech, Inc.

Figure 7-50. Responses of Burial Rates in Cohesive Sediments to Changes in Gross Settling Velocities.
-0.5
0
0.5
1
1.5
2
2.5
Thompson Island Dam Schuylerville Stillwater Waterford
Reach
Bur
ial R
ate
(cm
/yea
r)
Lower vs Baseline Higher vs
Limno-Tech, Inc.

Figure 7-51. Responses of Burial Rates in Non-Cohesive Sediments to Changes in Gross Settling Velocities.
0
0.02
0.04
0.06
0.08
0.1
0.12
Thompson Island Dam Schuylerville Stillwater Waterford Federal Dam
Reach
Bur
ial R
ate
(cm
/yea
r)
Higher vs Baseline Lower vs
Limno-Tech, Inc.
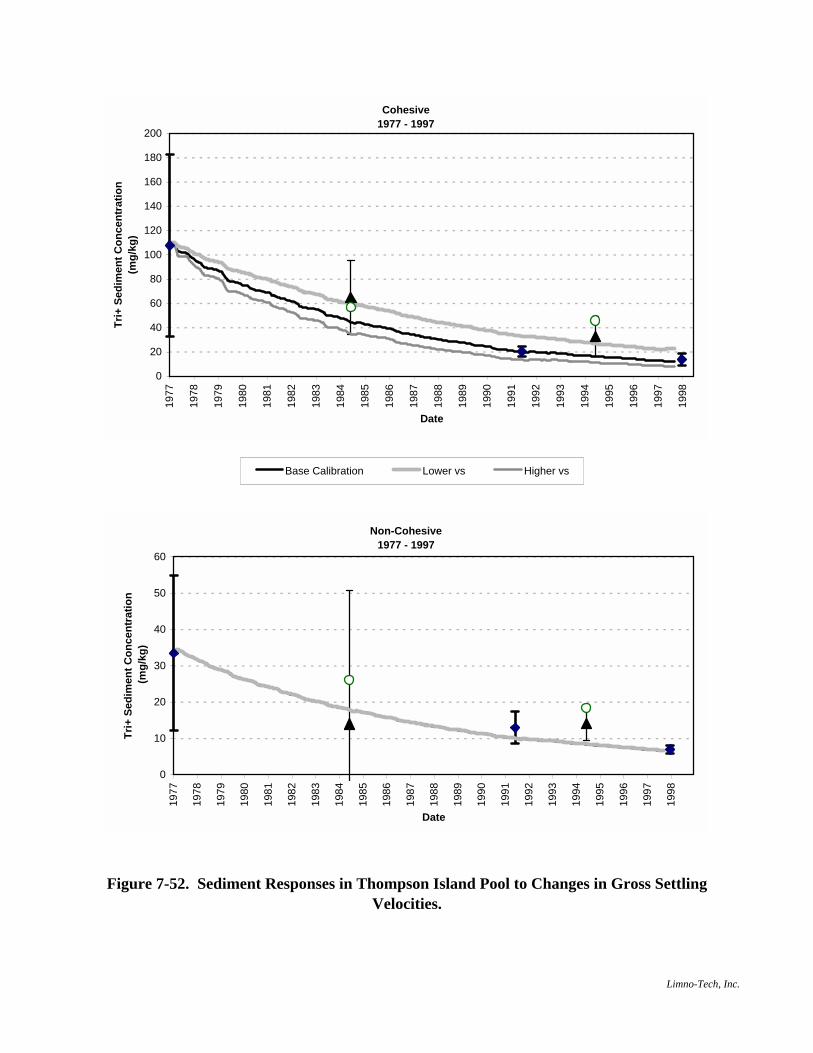
Figure 7-52. Sediment Responses in Thompson Island Pool to Changes in Gross Settling Velocities.
Cohesive1977 - 1997
0
20
40
60
80
100
120
140
160
180
200
1977
1978
1979
1980
1981
1982
1983
1984
1985
1986
1987
1988
1989
1990
1991
1992
1993
1994
1995
1996
1997
1998
Date
Tri+
Sed
imen
t Con
cent
ratio
n (m
g/kg
)
Non-Cohesive1977 - 1997
0
10
20
30
40
50
60
1977
1978
1979
1980
1981
1982
1983
1984
1985
1986
1987
1988
1989
1990
1991
1992
1993
1994
1995
1996
1997
1998
Date
Tri+
Sed
imen
t Con
cent
ratio
n (m
g/kg
)
Base Calibration Lower vs Higher vs
Limno-Tech, Inc.

Figure 7-53. Sediment Responses in Waterford Reach to Changes in Gross Settling Velocities.
Cohesive1977 - 1997
0
10
20
30
40
50
60
70
1977
1978
1979
1980
1981
1982
1983
1984
1985
1986
1987
1988
1989
1990
1991
1992
1993
1994
1995
1996
1997
1998
Date
Tri+
Sed
imen
t Con
cent
ratio
n (m
g/kg
)
Non-Cohesive1977 - 1997
0
1
2
3
4
5
6
7
8
9
10
1977
1978
1979
1980
1981
1982
1983
1984
1985
1986
1987
1988
1989
1990
1991
1992
1993
1994
1995
1996
1997
1998
Date
Tri+
Sed
imen
t Con
cent
ratio
n (m
g/kg
)
Base Calibration Lower vs Higher vs
Limno-Tech, Inc.

Figure 7-54. Water Column Responses to Changes in Gross Settling Velocities.
Thompson Island Pool
0
50
100
150
200
250
1977
1978
1979
1980
1981
1982
1983
1984
1985
1986
1987
1988
1989
1990
1991
1992
1993
1994
1995
1996
1997
Year
Ave
rage
Ann
ual T
ri+ C
once
ntra
tion
(ng/
L)
Waterford
0
50
100
150
200
250
300
1977
1978
1979
1980
1981
1982
1983
1984
1985
1986
1987
1988
1989
1990
1991
1992
1993
1994
1995
1996
1997
Year
Ave
rage
Ann
ual T
ri+ C
once
ntra
tion
(ng/
L)
Base Calibration Lower vs Higher vs
Limno-Tech, Inc.

Figure 7-55. Sediment Responses in Schuylerville Reach to Enhanced Mixing (top 6 cm) in Non-cohesive Sediments.
Cohesive1977 - 1997
0
20
40
60
80
100
120
140
160
18019
77
1978
1979
1980
1981
1982
1983
1984
1985
1986
1987
1988
1989
1990
1991
1992
1993
1994
1995
1996
1997
1998
Date
Tri+
Sed
imen
t Con
cent
ratio
n (m
g/kg
)
Non-Cohesive1977 - 1997
0
10
20
30
40
50
60
1977
1978
1979
1980
1981
1982
1983
1984
1985
1986
1987
1988
1989
1990
1991
1992
1993
1994
1995
1996
1997
1998
Date
Tri+
Sed
imen
t Con
cent
ratio
n (m
g/kg
)
Base Calibration Non-cohesive Mixing to 6 cm
Limno-Tech, Inc.

Figure 7-56. Sediment Responses in Stillwater Reach to Enhanced Mixing (top 6 cm) in Non-cohesive Sediments.
Cohesive1977 - 1997
0
10
20
30
40
50
6019
77
1978
1979
1980
1981
1982
1983
1984
1985
1986
1987
1988
1989
1990
1991
1992
1993
1994
1995
1996
1997
Date
Tri+
Sed
imen
t Con
cent
ratio
n (m
g/kg
)
Non-Cohesive1977 - 1997
0
1
2
3
4
5
6
7
8
9
10
1977
1978
1979
1980
1981
1982
1983
1984
1985
1986
1987
1988
1989
1990
1991
1992
1993
1994
1995
1996
1997
Date
Tri+
Sed
imen
t Con
cent
ratio
n (m
g/kg
)
Base Calibration Non-cohesive Mixing to 6 cm
Limno-Tech, Inc.

Figure 7-57. Sediment Responses at Waterford to Enhanced Mixing (top 6 cm) in Non-cohesive Sediments.
Cohesive1977 - 1997
0
10
20
30
40
50
60
7019
77
1978
1979
1980
1981
1982
1983
1984
1985
1986
1987
1988
1989
1990
1991
1992
1993
1994
1995
1996
1997
Date
Tri+
Sed
imen
t Con
cent
ratio
n (m
g/kg
)
Non-Cohesive1977 - 1997
0
1
2
3
4
5
6
7
8
9
10
1977
1978
1979
1980
1981
1982
1983
1984
1985
1986
1987
1988
1989
1990
1991
1992
1993
1994
1995
1996
1997
Date
Tri+
Sed
imen
t Con
cent
ratio
n (m
g/kg
)
Base Calibration Non-cohesive Mixing to 6 cm
Limno-Tech, Inc.

Figure 7-58. Sediment Responses in Federal Dam Reach to Enhanced Mixing (top 6 cm) in Non-cohesive Sediments.
Non-Cohesive1977 - 1997
0
1
2
3
4
5
6
7
8
9
1019
77
1978
1979
1980
1981
1982
1983
1984
1985
1986
1987
1988
1989
1990
1991
1992
1993
1994
1995
1996
1997
1998
Date
Tri+
Sed
imen
t Con
cent
ratio
n (m
g/kg
)
Base Calibration Non-cohesive Mixing to 6 cm
Limno-Tech, Inc.

Figure 7-59. Sediment Responses in Thompson Island Pool to Changes in Sediment Initial Conditions.
Cohesive1977-1997
0
20
40
60
80
100
120
140
160
180
20019
77
1978
1979
1980
1981
1982
1983
1984
1985
1986
1987
1988
1989
1990
1991
1992
1993
1994
1995
1996
1997
Date
Tri+
Sed
imen
t Con
cent
ratio
n (m
g/kg
)
Non-cohesive1977-1997
0
10
20
30
40
50
60
1977
1978
1979
1980
1981
1982
1983
1984
1985
1986
1987
1988
1989
1990
1991
1992
1993
1994
1995
1996
1997
Date
Tri+
Sed
imen
t Con
cent
ratio
n (m
g/kg
)
Base Calibration ICs Low ICs High
Limno-Tech, Inc.

Figure 7-60. Sediment Responses in Waterford to Changes in Sediment Initial Conditions.
Cohesive1977-1997
0
10
20
30
40
50
60
70
1977
1978
1979
1980
1981
1982
1983
1984
1985
1986
1987
1988
1989
1990
1991
1992
1993
1994
1995
1996
1997
Date
Tri+
Sed
imen
t Con
cent
ratio
n (m
g/kg
)
Non-cohesive1977-1997
0
2
4
6
8
10
12
14
1977
1978
1979
1980
1981
1982
1983
1984
1985
1986
1987
1988
1989
1990
1991
1992
1993
1994
1995
1996
1997
Date
Tri+
Sed
imen
t Con
cent
ratio
n (m
g/kg
)
Base Calibration ICs Low ICs High
Limno-Tech, Inc.

Figure 7-61. Water Column Responses to Changes in Sediment Initial Conditions.
Thompson Island Pool
0
50
100
150
200
250
300
1977
1978
1979
1980
1981
1982
1983
1984
1985
1986
1987
1988
1989
1990
1991
1992
1993
1994
1995
1996
1997
Year
Ave
rage
Ann
ual T
ri+ C
once
ntra
tion
(ng/
L)
Waterford
0
50
100
150
200
250
300
350
400
1977
1978
1979
1980
1981
1982
1983
1984
1985
1986
1987
1988
1989
1990
1991
1992
1993
1994
1995
1996
1997
Year
Ave
rage
Ann
ual T
ri+ C
once
ntra
tion
(ng/
L)
Base Calibration ICs Low ICs High
Limno-Tech, Inc.

Figure 7-62. Water Column Responses to Changes in Henry's Law Constant.
Thompson Island Pool
0
50
100
150
200
250
1977
1978
1979
1980
1981
1982
1983
1984
1985
1986
1987
1988
1989
1990
1991
1992
1993
1994
1995
1996
1997
Year
Ave
rage
Ann
ual T
ri+ C
once
ntra
tion
(ng/
L)
Waterford
0
50
100
150
200
250
300
1977
1978
1979
1980
1981
1982
1983
1984
1985
1986
1987
1988
1989
1990
1991
1992
1993
1994
1995
1996
1997
Year
Ave
rage
Ann
ual T
ri+ C
once
ntra
tion
(ng/
L)
Base Calibration Henry's Constant =1.93E-04 Henry's Constant = 0.69E-04
Limno-Tech, Inc.

Figure 7-63. Predicted versus Observed BZ#4, BZ#28 and BZ#52 Concentrations Using Historical Calibration Model Parameters.
Thompson Island Dam-BZ#28
0.1
1
10
100
10001-
Jan-
91
1-Ja
n-92
31-D
ec-9
2
1-Ja
n-94
1-Ja
n-95
1-Ja
n-96
1-Ja
n-97
1-Ja
n-98
[BZ#
28] n
g/L
GE, TID GE, TID-E GE, TID-W USEPA,TID-W Model
Thompson Island Dam-BZ#52
0.1
1
10
100
1000
1-Ja
n-91
1-Ja
n-92
31-D
ec-9
2
1-Ja
n-94
1-Ja
n-95
1-Ja
n-96
1-Ja
n-97
1-Ja
n-98
[BZ#
52] n
g/L
Thompson Island Dam-BZ#4
0.1
1
10
100
1000
1-Ja
n-91
1-Ja
n-92
31-D
ec-9
2
1-Ja
n-94
1-Ja
n-95
1-Ja
n-96
1-Ja
n-97
1-Ja
n-98
Date
[BZ#
4] n
g/L
Limno-Tech, Inc.

Figure 7-64. Comparison Between Computed Surficial Sediment Tri+, BZ#28, BZ#52 and BZ#4 Concentrations for Thompson Island Pool.
0
0.2
0.4
0.6
0.8
1
1.2
Jan-
91
Jan-
92
Dec
-92
Jan-
94
Jan-
95
Jan-
96
Jan-
97
Jan-
98
Year
Tri+
Con
cent
ratio
n (m
g/kg
)Tri+BZ#28BZ#52BZ#4
Cohesive
0
0.2
0.4
0.6
0.8
1
1.2
Jan-
91
Jan-
92
Dec
-92
Jan-
94
Jan-
95
Jan-
96
Jan-
97
Jan-
98
Year
Tri+
Con
cent
ratio
n (m
g/kg
)
Non-cohesive
Limno-Tech, Inc.

Figure 7-65. Predicted versus Observed BZ#4, BZ#28 and BZ#52 Concentrations Using Sediment-Specific Partitioning (from GE Data).
Thompson Island Dam-BZ#28
0.1
1
10
100
10001-
Jan-
91
1-Ja
n-92
31-D
ec-9
2
1-Ja
n-94
1-Ja
n-95
1-Ja
n-96
1-Ja
n-97
1-Ja
n-98
[BZ#
28] n
g/L
GE, TID GE, TID-E GE, TID-W USEPA,TID-W Model
Thompson Island Dam-BZ#52
0.1
1
10
100
1000
1-Ja
n-91
1-Ja
n-92
31-D
ec-9
2
1-Ja
n-94
1-Ja
n-95
1-Ja
n-96
1-Ja
n-97
1-Ja
n-98
[BZ#
52] n
g/L
Thompson Island Dam-BZ#4
0.1
1
10
100
1000
1-Ja
n-91
1-Ja
n-92
31-D
ec-9
2
1-Ja
n-94
1-Ja
n-95
1-Ja
n-96
1-Ja
n-97
1-Ja
n-98
Date
[BZ#
4] n
g/L
Limno-Tech, Inc.

Figure 7-66a. Predicted versus Observed BZ#4, BZ#28 and BZ#52 Concentrations Using Sediment-Specific Partitioning (from GE Data) and Particulate and Porewater Sediment-Water Mass Transfer Pathways.
Thompson Island Dam-BZ#28
0.1
1
10
100
10001-
Jan-
91
1-Ja
n-92
31-D
ec-9
2
1-Ja
n-94
1-Ja
n-95
1-Ja
n-96
1-Ja
n-97
1-Ja
n-98
[BZ#
28] n
g/L
GE, TID GE, TID-E GE, TID-W USEPA,TID-W Model
Thompson Island Dam-BZ#52
0.1
1
10
100
1000
1-Ja
n-91
1-Ja
n-92
31-D
ec-9
2
1-Ja
n-94
1-Ja
n-95
1-Ja
n-96
1-Ja
n-97
1-Ja
n-98
[BZ#
52] n
g/L
GE, TID GE, TID-E GE, TID-W USEPA,TID-W Model
Thompson Island Dam-BZ#4
0.1
1
10
100
1000
1-Ja
n-91
1-Ja
n-92
31-D
ec-9
2
1-Ja
n-94
1-Ja
n-95
1-Ja
n-96
1-Ja
n-97
1-Ja
n-98
Date
[BZ#
4] n
g/L
GE, TID GE, TID-E GE, TID-W USEPA,TID-W Model
Limno-Tech, Inc.

Figure 7-66b. Predicted versus Observed BZ[#90+101], BZ#138 and and Total PCB Concentrations Using Sediment-Specific Partitioning (from GE Data) and Particulate and Dissolved Sediment-Water Mass Transfer Pathways.
Thompson Island Dam-BZ#[90+101]
0.1
1
10
1001-
Jan-
91
1-Ja
n-92
31-D
ec-9
2
1-Ja
n-94
1-Ja
n-95
1-Ja
n-96
1-Ja
n-97
1-Ja
n-98
[BZ#
90+1
01] n
g/L
GE, TID GE, TID-E GE, TID-W USEPA,TID-W Model
Thompson Island Dam-BZ#138
0.01
0.1
1
10
100
1-Ja
n-91
1-Ja
n-92
31-D
ec-9
2
1-Ja
n-94
1-Ja
n-95
1-Ja
n-96
1-Ja
n-97
1-Ja
n-98
[BZ#
138]
ng/
L
Thompson Island Dam-Total PCB
0.1
1
10
100
1000
10000
1-Ja
n-91
1-Ja
n-92
31-D
ec-9
2
1-Ja
n-94
1-Ja
n-95
1-Ja
n-96
1-Ja
n-97
1-Ja
n-98
Date
[Tot
al P
CB
] ng/
L
Limno-Tech, Inc.

Figure 7-67a. Predicted versus Observed BZ#4 Concentrations Below Thompson Island Dam, 1991-1993.
Schuylerville - BZ#4
0.1
1
10
100
1000Ja
n-91
Apr-9
1
Jul-9
1
Oct
-91
Jan-
92
Apr-9
2
Jul-9
2
Oct
-92
Dec
-92
Apr-9
3
Jul-9
3
Oct
-93
[BZ#
4] n
g/L
Model GE Data USEPA Phase 2 Data
Stillwater - BZ#4
0.1
1
10
100
1000
Jan-
91
Apr-9
1
Jul-9
1
Oct
-91
Jan-
92
Apr-9
2
Jul-9
2
Oct
-92
Dec
-92
Apr-9
3
Jul-9
3
Oct
-93
[BZ#
4] n
g/L
Model GE Data USEPA Phase 2 Data
Waterford - BZ#4
0.1
1
10
100
1000
Jan-
91
Apr-9
1
Jul-9
1
Oct
-91
Jan-
92
Apr-9
2
Jul-9
2
Oct
-92
Dec
-92
Apr-9
3
Jul-9
3
Oct
-93
[BZ#
4] n
g/L
Model GE Data USEPA Phase 2 Data
Limno-Tech, Inc.

Figure 7-67b. Predicted versus Observed BZ#28 Concentrations Below Thompson Island Dam, 1991-1993.
Schuylerville - BZ#28
0.1
1
10
100
1000Ja
n-91
Apr-9
1
Jul-9
1
Oct
-91
Jan-
92
Apr-9
2
Jul-9
2
Oct
-92
Dec
-92
Apr-9
3
Jul-9
3
Oct
-93
[BZ#
28] n
g/L
Model GE Data USEPA Phase 2 Data
Stillwater - BZ#28
0.1
1
10
100
1000
Jan-
91
Apr-9
1
Jul-9
1
Oct
-91
Jan-
92
Apr-9
2
Jul-9
2
Oct
-92
Dec
-92
Apr-9
3
Jul-9
3
Oct
-93
[BZ#
28] n
g/L
Model GE Data USEPA Phase 2 Data
Waterford - BZ#28
0.1
1
10
100
1000
Jan-
91
Apr-9
1
Jul-9
1
Oct
-91
Jan-
92
Apr-9
2
Jul-9
2
Oct
-92
Dec
-92
Apr-9
3
Jul-9
3
Oct
-93
[BZ#
28] n
g/L
Model GE Data USEPA Phase 2 Data
Limno-Tech, Inc.

Figure 7-67c. Predicted versus Observed BZ#52 Concentrations Below Thompson Island Dam, 1991-1993.
Schuylerville - BZ#52
0.1
1
10
100
1000Ja
n-91
Apr-9
1
Jul-9
1
Oct
-91
Jan-
92
Apr-9
2
Jul-9
2
Oct
-92
Dec
-92
Apr-9
3
Jul-9
3
Oct
-93
[BZ#
52] n
g/L
Model GE Data USEPA Phase 2 Data
Stillwater - BZ#52
0.1
1
10
100
1000
Jan-
91
Apr-9
1
Jul-9
1
Oct
-91
Jan-
92
Apr-9
2
Jul-9
2
Oct
-92
Dec
-92
Apr-9
3
Jul-9
3
Oct
-93
[BZ#
52] n
g/L
Model GE Data USEPA Phase 2 Data
Waterford - BZ#52
0.1
1
10
100
1000
Jan-
91
Apr-9
1
Jul-9
1
Oct
-91
Jan-
92
Apr-9
2
Jul-9
2
Oct
-92
Dec
-92
Apr-9
3
Jul-9
3
Oct
-93
[BZ#
52] n
g/L
Model GE Data USEPA Phase 2 Data
Limno-Tech, Inc.

Figure 7-67d. Predicted versus Observed BZ#[90+101] Concentrations Below Thompson Island Dam, 1991-1993.
Schuylerville - BZ#90+101
0.1
1
10
100Ja
n-91
Apr-9
1
Jul-9
1
Oct
-91
Jan-
92
Apr-9
2
Jul-9
2
Oct
-92
Dec
-92
Apr-9
3
Jul-9
3
Oct
-93
[BZ#
90+1
01] n
g/LModel GE Data USEPA Phase 2 Data
Stillwater - BZ#90+101
0.1
1
10
100
Jan-
91
Apr-9
1
Jul-9
1
Oct
-91
Jan-
92
Apr-9
2
Jul-9
2
Oct
-92
Dec
-92
Apr-9
3
Jul-9
3
Oct
-93
[BZ#
90+1
01] n
g/L
Model GE Data USEPA Phase 2 Data
Waterford - BZ#90+101
0.1
1
10
100
Jan-
91
Apr-9
1
Jul-9
1
Oct
-91
Jan-
92
Apr-9
2
Jul-9
2
Oct
-92
Dec
-92
Apr-9
3
Jul-9
3
Oct
-93
[BZ#
90+1
01] n
g/L
Model GE Data USEPA Phase 2 Data
Limno-Tech, Inc.

Figure 7-67e. Predicted versus Observed BZ#138 Concentrations Below Thompson Island Dam, 1991-1993.
Schuylerville - BZ#138
0.01
0.1
1
10
100Ja
n-91
Apr-9
1
Jul-9
1
Oct
-91
Jan-
92
Apr-9
2
Jul-9
2
Oct
-92
Dec
-92
Apr-9
3
Jul-9
3
Oct
-93
[BZ#
138]
ng/
LModel GE Data USEPA Phase 2 Data
Stillwater - BZ#138
0.01
0.1
1
10
100
Jan-
91
Apr-9
1
Jul-9
1
Oct
-91
Jan-
92
Apr-9
2
Jul-9
2
Oct
-92
Dec
-92
Apr-9
3
Jul-9
3
Oct
-93
[BZ#
138]
ng/
L
Model GE Data USEPA Phase 2 Data
Waterford - BZ#138
0.01
0.1
1
10
100
Jan-
91
Apr-9
1
Jul-9
1
Oct
-91
Jan-
92
Apr-9
2
Jul-9
2
Oct
-92
Dec
-92
Apr-9
3
Jul-9
3
Oct
-93
[BZ#
138]
ng/
L
Model GE Data USEPA Phase 2 Data
Limno-Tech, Inc.

Figure 7-67f. Predicted versus Observed Total PCB Concentrations Below Thompson Island Dam, 1991-1993.
Schuylerville - Total PCB
10
100
1000
10000
Jan-
91
Apr-9
1
Jul-9
1
Oct
-91
Jan-
92
Apr-9
2
Jul-9
2
Oct
-92
Dec
-92
Apr-9
3
Jul-9
3
Oct
-93
[Tot
al P
CB
] ng/
LModel GE Data USEPA Phase 2 Data
Stillwater - Total PCB
10
100
1000
10000
Jan-
91
Apr-9
1
Jul-9
1
Oct
-91
Jan-
92
Apr-9
2
Jul-9
2
Oct
-92
Dec
-92
Apr-9
3
Jul-9
3
Oct
-93
[Tot
al P
CB
] ng/
L
Model GE Data USEPA Phase 2 Data
Waterford - Total PCB
10
100
1000
10000
Jan-
91
Apr-9
1
Jul-9
1
Oct
-91
Jan-
92
Apr-9
2
Jul-9
2
Oct
-92
Dec
-92
Apr-9
3
Jul-9
3
Oct
-93
[Tot
al P
CB
] ng/
L
Model GE Data USEPA Phase 2 Data
Limno-Tech, Inc.

Figure 7-68a. Comparison of Model versus Observed Congener Concentration Ratios: Thompson Island Pool, September 25, 1996 Float Study.
[BZ#4]/[BZ#52]
0.0
5.0
10.0
15.0
20.0
25.0
188.5189.5190.5191.5192.5193.5194.5River Mile
Rat
io [B
Z#4]
/[BZ#
52]
[BZ#28]/[BZ#52]
0.00.20.40.60.81.01.21.41.61.82.0
188.5189.5190.5191.5192.5193.5194.5River Mile
Rat
io[B
Z#28
]/[B
Z#52
]
[BZ#101&90]/[BZ#52]
0.0
0.5
1.0
1.5
2.0
2.5
3.0
188.5189.5190.5191.5192.5193.5194.5River Mile
Rat
io[B
Z#10
1&90
]/[B
Z#52
]
West Center East Model Center Channel
Limno-Tech, Inc.

Figure 7-68b. Comparison of Model versus Observed Congener Concentration Ratios: Thompson Island Pool, September 26, 1996 Float Study.
[BZ#4]/[BZ#52]
0.0
5.0
10.0
15.0
20.0
25.0
188.5189.5190.5191.5192.5193.5194.5River Mile
Rat
io [B
Z#4]
/[BZ#
52]
[BZ#28]/[BZ#52]
0.00.20.40.60.81.01.21.41.61.82.0
188.5189.5190.5191.5192.5193.5194.5River Mile
Rat
io [B
Z#28
]/[B
Z#52
]
[BZ#101&90]/[BZ#52]
0.0
0.5
1.0
1.5
2.0
2.5
3.0
188.5189.5190.5191.5192.5193.5194.5River Mile
Rat
io[B
Z#10
1&90
]/[B
Z#52
]
West Center East Model Center Channel
Limno-Tech, Inc.

Figure 7-68c. Comparison of Model versus Observed Congener Concentration Ratios: Thompson Island Pool, June 4, 1997 Float Study.
[BZ#4]/[BZ#52]
0.0
5.0
10.0
15.0
20.0
25.0
188.5189.5190.5191.5192.5193.5194.5River Mile
Rat
io [B
Z#4]
/[BZ#
52]
[BZ#28]/[BZ#52]
0.00.20.40.60.81.01.21.41.61.82.0
188.5189.5190.5191.5192.5193.5194.5
River Mile
Rat
io [B
Z#28
]/[B
Z#52
]
[BZ#101&90]/[BZ#52]
0.0
0.5
1.0
1.5
2.0
2.5
3.0
188.5189.5190.5191.5192.5193.5194.5River Mile
Rat
io[B
Z#10
1&90
]/[B
Z#52
]
West Center East Model Center Channel
Limno-Tech, Inc.

Figure 7-68d. Comparison of Model versus Observed Congener Concentration Ratios: Thompson Island Pool, June 17, 1997 Float Study.
[BZ#4]/[BZ#52]
0.0
5.0
10.0
15.0
20.0
25.0
188.5189.5190.5191.5192.5193.5194.5River Mile
Rat
io [B
Z#4]
/[BZ#
52]
[BZ#28]/[BZ#52]
0.00.20.40.60.81.01.21.41.61.82.0
188.5189.5190.5191.5192.5193.5194.5River Mile
Rat
io [B
Z#28
]/[B
Z#52
]
[BZ#101&90]/[BZ#52]
0.0
0.5
1.0
1.5
2.0
2.5
3.0
188.5189.5190.5191.5192.5193.5194.5River Mile
Rat
io[B
Z#10
1&90
]/[B
Z#52
]
West Center East Model Center Channel
Limno-Tech, Inc.

Figure 7-69. Model versus Observed Down-river [BZ#28]/[BZ#52] Ratios by Season, 1991-1997.
[BZ#28]/[BZ#52] - Non-summer
0.0
0.2
0.4
0.6
0.8
1.0
1.2
1.4
1.6
1.8
2.0
155159163167171175179183187191195River Mile
[BZ#
28]/[
BZ#
52]
[BZ#28]/[BZ#52] - Summer
0.0
0.2
0.4
0.6
0.8
1.0
1.2
1.4
1.6
1.8
2.0
155159163167171175179183187191195River Mile
[BZ#
28]/[
BZ#
52]
Limno-Tech, Inc.

Figure 7-70. Model versus Observed Down-river [BZ#28]/[BZ#52] Ratios Stratified by Fort Edward Flow (< 10,000 cfs and > 10,000 cfs), 1991-1997.
[BZ#28]/[BZ#52] FE Flow < 10,000 cfs
0.0
0.2
0.4
0.6
0.8
1.0
1.2
1.4
1.6
1.8
2.0
155159163167171175179183187191195River Mile
[BZ#
28]/[
BZ#
52]
[BZ#28]/[BZ#52]FE Flow > 10,000 cfs
0.0
0.2
0.4
0.6
0.8
1.0
1.2
1.4
1.6
1.8
2.0
155159163167171175179183187191195River Mile
[BZ#
28]/[
BZ#
52]
Limno-Tech, Inc.