715-01 part a - d · eeoc form u.s. equal employment opportunity commission federal agency annual...
TRANSCRIPT

EEOC FORM
U.S. Equal Employment Opportunity Commission
FEDERAL AGENCY ANNUAL EEO PROGRAM STATUS REPORT
Headquarters Department of the Army Page 1 of 98
715-01 Part A - D
For period covering October 1, 2009, to September 30, 2010.
PART A Department or Agency Identifying Information
1. Agency Headquarters United States Army
1.a. 2nd level reporting component
1.b. 3rd level reporting component
1.c. 4th level reporting component
2. Address 1225 S. Clark St., Suite 200
3. City, State, Zip Code Arlington VA 22202 VA 22202
4. CPDF Code 5. FIPS Code ARSA 8840
PART B Total
Employment
1. Enter total number of permanent full-time and part-time employees 260,547
2. Enter total number of temporary employees 5,711
3. Enter total number employees paid from non-appropriated funds 29,879
4. TOTAL EMPLOYMENT [add lines B 1 through 3] 296,137
PART C Agency
Official(s) Responsible
For Oversight of EEO
Program(s)
1. Head of Agency Official Title Hon. John McHugh, Secretary of the Army
2. Agency Head Designee Hon. Thomas Lamont, ASA Manpower & Reserve Affairs
3. Principal EEO Director/Official Official Title/series/grade
Larry Stubblefield. DASA D&L ASA Manpower and Reserve Affairs
4. Title VII Affirmative EEO Program Official
Mr. Michael Gautier, Director MD 715
5. Section 501 Affirmative Action Program Official
Ms. Yolanda Maldonado, Acting IWD Director
6. Complaint Processing Program Manager
Mr. Spurgeon Moore, Director, Equal Employment Opportunity Complaints Compliance and Review
7. Other Responsible EEO Staff
PART D List of
Subordinate Components Covered in This Report
Subordinate Component and Location (City/State) CPDF and FIPS Codes
United States Army Special Operations Command ARSP 2560
United States Army Test and Evaluation Command ARAT 8840

EEOC FORM
U.S. Equal Employment Opportunity Commission
FEDERAL AGENCY ANNUAL EEO PROGRAM STATUS REPORT
Headquarters Department of the Army Page 2 of 98
United States Military Academy ARMA 36071
United States Army Information Security Command ARAS 8840
Joint and DoD Activities ARJA 8840
United States Army Human Resources Command ARMP 8840
United States Army Joint Activities ARJA 8840
United States Army SHAPE ARJ1 8840
United States Army Pacific Command ARP1 3320
United States Army Military District of Washington ARMW 8840
United States Army Recruiting Command ARRC 5135
Field Operating Agencies of HQ DA and Secretary of the Army ARSB 8840
Staff Support Agencies, HQDA ARSS 8840
Joint and DoD Activities ARSJ 8840
United States Army South ARSO 7240
United States Army Training and Doctrine Command ARTC 5135
United States Army Corps of Engineers ARCE 8840
United States Army Materiel Command ARX1 3440
United States Army Network Enterprise Technology Command ARG6 6200
US Army DoD Agencies ARDF 8840
Office of the Chief of Staff of the Army ARCS 8840
United States Army Central Command ARCT 8280
United States Army Over Strength Command ARDM 8840
United States Army Office of the Secretary of the Army ARSA 8840
United States Army Criminal Investigation Command ARCB 8840
United States Army National Guard Bureau ARNG 8840
United States Army North AR5A 7240
US Army Europe and 7th Army ARE1 8840
US Military Entrance Processing Command ARAP 1600

EEOC FORM
U.S. Equal Employment Opportunity Commission
FEDERAL AGENCY ANNUAL EEO PROGRAM STATUS REPORT
Headquarters Department of the Army Page 3 of 98
US Army Medical Command ARMC 7240
US Army Acquisition Support Center ARAE 8840
US Army Forces Command ARFC 2752
US Army Accession Command ARAA 5135
U.S. Army Space And Missile Defense Command ARSC 3440
Eighth US Army ARP8 8840
United States Army Installation Management Command ARBA
8840
EEO FORMS and Documents Included With This Report
*Executive Summary [FORM 715-01 PART E], that includes:
*Optional Annual Self-Assessment Checklist Against Essential Elements [FORM 715-01PART G]
x
Brief paragraph describing the agency's mission and mission-related functions
x
*EEO Plan To Attain the Essential Elements of a Model EEO Program [FORM 715-01PART H] for each programmatic essential
x
Summary of results of agency's annual self-assessment against MD-715 "Essential Elements"
x
*EEO Plan To Eliminate Identified Barrier [FORM 715-01 PART I] for each identified barrier
x
Summary of Analysis of Work Force Profiles including net change analysis and comparison to RCLF
x
*Special Program Plan for the Recruitment, Hiring, and Advancement of Individuals With Targeted Disabilities for agencies with 1,000 or more employees [FORM 715-01 PART J]
x
Summary of EEO Plan objectives planned to eliminate identified barriers or correct program deficiencies
x
*Copy of Workforce Data Tables as necessary to support Executive Summary and/or EEO Plans
x
Summary of EEO Plan action items implemented or accomplished
x
*Copy of data from 462 Report as necessary to support action items related to Complaint Processing Program deficiencies, ADR effectiveness, or other compliance issues.
x
*Statement of Establishment of Continuing Equal Employment Opportunity Programs[FORM 715-01 PART F]
x *Copy of Facility Accessibility Survey results as necessary to support EEO Action Plan for building renovation projects
*Copies of relevant EEO Policy Statement(s) and/or excerpts from revisions made to EEO Policy Statements
*Organizational Chart x

EEOC FORM
U.S. Equal Employment Opportunity Commission
FEDERAL AGENCY ANNUAL EEO PROGRAM STATUS REPORT
Headquarters Department of the Army Page 4 of 98
715-01 Part E
EXECUTIVE SUMMARY
The Department of the Army (DA) is a component within the Department of
Defense. Army civilian employees work in a wide variety of positions and pay grades
around the world as part of the mission of the United States Army, as described in the Army
web site www.army.mil.
The Army’s Equal Employment Opportunity (EEO) program administers and
manages the Army’s civilian employment EEO and Civil Rights Program. The
mission/function of EEO practitioners and staff members is uniform throughout the
worldwide organization except in scope. The operating and tactical offices on installations
and U.S. Army Corps of Engineers (USACE) District EEO offices provide programmatic
support and services to Army activities and tenants. Major Army Commands (ACOMs),
Army Service Component Commands (ASCCs), and Direct Reporting Units (DRUs), EEO
staff provides strategic advice, technical support and oversight of the Commander’s EEO
program. Civilian personnel advisory services are provided on a regional basis as detailed
at http://www.cpocma.army.mil/.
During the reporting period, the position of the Deputy Assistant Secretary of the
Army for EEO and Civil Rights became the Deputy Assistant Secretary of the Army for
Diversity and Leadership. EEO Program Policy and Compliance remained intact, while
serving as a foundation for developing diversity and inclusion strategies, initiatives and
civilian workforce transformation.
All civilian employees, except for foreign local national employees, are included in
this report which covers the reporting period ending September 30, 2010. The data
provided in this report represents the workforce demographics of the Army civilian
workforce. Although the national Civilian Labor Force statistic is used for comparisons,
the Federal Information Processing Standards (FIPS) code used in this report is 8840
(Washington DC, Northern Virginia, Maryland and Eastern West Virginia) because there is
no “national” FIPS. Furthermore, most of the Army Headquarters’ staffs and leadership are
located in this FIPS area.
Due to the size and complexity of the Army, its broad scope, mission and
organization, the report summarizes the Army EEO program in general terms. The
information provided in this report is an aggregated summary of the entire Department of
the Army. The individual recruitment actions and EEO program operations at the garrisons

EEOC FORM
U.S. Equal Employment Opportunity Commission
FEDERAL AGENCY ANNUAL EEO PROGRAM STATUS REPORT
Headquarters Department of the Army Page 5 of 98
or Corps of Engineers district offices have more direct impact on shaping the demographic
profiles of the Army, than the broader agency level report. Due to the broad scope of the
Army, the report contains comparisons to the National Civilian Labor Force. FY 2010
applicant pool data, extracted from the Resumix application system, as well as data from
the Army’s version of the Defense Civilian Personnel Data System (DCPDS) was used to
develop the data analyzed in this report. Although the applicant pool data contained a
number of data anomalies and null values within certain categories, the data is sufficiently
valid to form the basis of generalized conclusions. Applicant data on selections to the
Senior Executive Service (SES) is not part of the Resumix system and the data on SES
applications is not included.
The Headquarters’ Army Diversity and Leadership Office includes three divisions;
Diversity, Leadership and Compliance. While organizing and aligning functions to
complement mission, efficiencies and effectiveness, the Secretary of the Army has
approved a “Diversity Roadmap”. The Roadmap provides a strategic methodology to
integrate portions of the model EEO program essential elements into a transformational
process that impacts the Army’s corporate values regarding the strategic and effective
management of human capital. A key component of the diversity roadmap is the training,
education and awareness efforts needed to ensure diversity and inclusion principles,
objectives and strategies are integral parts of all Army operations as shown at
http://www.armydiversity.army.mil/adoGoals/index.html
The Diversity Roadmap outlines the Army’s unique approach to an enterprise-wide
diversity initiative over the next five years. Five goals provide a roadmap for moving
forward in key areas that are essential to a successful diversity initiative: leader
commitment; comprehensive talent management processes; structure and resources;
education and training; and sustainment through institutionalized inclusive practices.
These five diversity goals will ultimately be accomplished through action planning. The
development, implementation, monitoring and assessment of objectives and tasks will be
integrated into the planning process, together with periodic evaluations of progress toward
achieving the Army Diversity Vision. These Diversity Roadmap goals are linked to five of
the six essential elements of a model EEO programs.
WORK FORCE ANALYSIS
The Army workforce is diverse and includes more than 527 occupational series of
the 638 occupational series in DOD; 83% of the occupational series in DOD include Army

EEOC FORM
U.S. Equal Employment Opportunity Commission
FEDERAL AGENCY ANNUAL EEO PROGRAM STATUS REPORT
Headquarters Department of the Army Page 6 of 98
employees. Geographically, Army employees work in more than 2,065 General Services
Administration Geographic locations worldwide.
Based on the EEOC classifications, the Army’s total appropriated fund reportable
employee population is displayed in Figure 1. The factors that directly impacted the
population change shown for the larger employee groups that were classified by race and
ethnicity1 cannot be directly discerned from global Army data, but action items have been
created to ask subordinate reporting activities to identify EEO-related issues related to
demographic changes; the analysis of that data is ongoing.
An examination of Figure 1 illustrates the Army appropriated and non appropriated
civilian employee population change based on race and ethnicity indicators (ERI) and
Gender 1. White men, followed by White women, constitute the largest racial group in the
Army, followed by African American men and women. In addition, all EEO group
populations experienced net growth with the exception of Hispanic or Latino men and
women who experienced a net population decrease since the last annual report.
EEO Groups FY 09 FY 10 Change
White Men 110,206 117,344 7,138
White Women 58,249 61,600 3,351
Black Men 20,600 21,930 1,330
Black Women 23,118 24,125 1,007
Hispanic or Latino Men 9,079 9,045 -34
Hispanic or Latino Women
5,014 5,006 -8
Asian Men 5,351 5,717 366
Asian Women 4,479 4,687 208
Native Hawaiian or Other Pacific Islander Men
608 719 111
Native Hawaiian or Other Pacific Islander Women
554 635 81
American Indian or Alaska Native Men
1,478 1,524 46
American Indian or Alaska Native Women
926 962 36
Multiracial Men 3,081 4,140 1,059
Multiracial Women 2,417 3,113 696
Total Population 245,160 260,547 15,387
Figure 1
1 http://www.whitehouse.gov/omb/fedreg_1997standards

EEOC FORM
U.S. Equal Employment Opportunity Commission
FEDERAL AGENCY ANNUAL EEO PROGRAM STATUS REPORT
Headquarters Department of the Army Page 7 of 98
The percentage of appropriated fund employees relative to the general national Civilian
Labor Force (CLF) is shown in figure 2. The percentage of White women, Hispanic or
Latino men and women are below the CLF; the representation of other EEO groups is
generally consistent with the CLF. Although the overall population has increased, the ratio
of change has not been extreme with the exception of the decrease of Hispanic or Latino
men and women. This overall evaluation does not take the place of more detailed
evaluations by occupational series and grades which may change the evaluation or the
impact of geographic dispersion of work centers.
EEO Groups FY 09 FY 10 General CLF
Change
White Men 44.95% 45.04% 39.00% 0.19%
White Women 23.76% 23.64% 33.70% -0.49%
Black Men 8.40% 8.42% 4.80% 0.17%
Black Women 9.43% 9.26% 5.70% -1.84%
Hispanic or Latino Men 3.70% 3.47% 6.20% -6.68%
Hispanic or Latino Women
2.05% 1.92% 4.50% -6.45%
Asian Men 2.18% 2.19% 1.90% 0.53%
Asian Women 1.83% 1.80% 1.70% -1.56%
Native Hawaiian or Other Pacific Islander Men
0.25% 0.28% 0.10% 10.13%
Native Hawaiian or Other Pacific Islander Women
0.23% 0.24% 0.10% 7.28%
American Indian or Alaska Native Men
0.60% 0.58% 0.30% -3.07%
American Indian or Alaska Native Women
0.38% 0.37% 0.30% -2.30%
Multiracial Men 1.26% 1.59% 0.80% 20.91%
Multiracial Women 0.99% 1.19% 0.80% 17.48%
Total Population 100.00% 100.00% 99.90% 34.30%
Figure 2
MODEL EEO PROGRAM SUMMARY
Element A. Demonstrated commitment from agency leadership:
Strength: Policy development, training and strategic communication of the Army’s
Diversity Strategy and the execution of a plan linked with the model EEO Program six
essential elements for broader application of diversity.
Element B. Integration of EEO into the agency's strategic mission
Strengths: The Headquarters, Department of the Army EEO program is aligned in
accordance with 29 CFR Part 1614. The EEO Director, the Assistant Secretary of the Army

EEOC FORM
U.S. Equal Employment Opportunity Commission
FEDERAL AGENCY ANNUAL EEO PROGRAM STATUS REPORT
Headquarters Department of the Army Page 8 of 98
(Manpower & Reserve Affairs) (ASA (M&RA), reports directly to the head of the Agency
(Secretary of the Army). The EEO program operates under the direct and personal
supervision of the ASA (M&RA), as depicted in Figure 3.
The participation of the HQ EEO staff in decision points aids in the integration of
EEO Program principles, objectives and requirements into standardized organizational
models/systems. This provides a foundation for resource analysis and determination that
becomes part of the permanent command and leadership structure as standardized or
institutionalized resources.
In August 2010 a Deputy Assistant Secretary of the Army (DASA) for Diversity and
Leadership was appointed by the Secretary of the Army. This appointment is an elevation
in the status, visibility, agility and capability of the EEO Program, provides greater
authority to implement comprehensive action plans, policies and practice.
Organization Chart (As of 17 August, 2010)
Figure 3

EEOC FORM
U.S. Equal Employment Opportunity Commission
FEDERAL AGENCY ANNUAL EEO PROGRAM STATUS REPORT
Headquarters Department of the Army Page 9 of 98
Element C. Management and program accountability
Strengths:
Selection to the SES and awards issued to SES and senior leaders require review by Office of the General Counsel, the Office of The Judge Advocate General, the Inspector General and the Office of the Assistant Secretary of the Army for Manpower and Reserve Affairs. Because of EEO program modernization, the HQ EEO staff in the Diversity and Leadership Office is able to make rapid qualitative and quantitative assessments of the Army program. Using the MD 715 Reporter and iComplaints, the HQ EEO staff is able to centrally perform detailed program evaluations and this capability is replicated at the command levels. This has reduced the cost of program evaluations. The implementation of the first Army wide on-line training module for the Notification and Federal Employee Antidiscrimination and Retaliation (No FEAR) Act training is completed and future online EEO training modules are planned. To date 112, 321 have taken NO FEAR training as compared to 11, 763 civilian employees who took the training in FY 10. That represents an increase of over 100,000 employees receiving the training in FY 2010. In FY 2011, the Army will deploy the Equal Employment Opportunity Self Assessment Tool (EEOSAT), which will provide a customer relations management focus on the analysis tools currently provided by EEOC. The advantage of EEOSAT is that it analyzes the EEO program from the customer perspective to measure the impact of the delivery of EEO services. This application will be exported to the EEOC for use by other federal agencies and become part of the EEOC evaluation system. Managers and supervisors are rated on their support of the EEO program. The automated performance evaluation system includes specific objectives that measure individual managers’ support of EEO initiatives. Future initiatives are planned that will further standardize leadership support reporting.
Deficiency:
The review of disability accommodation decisions/actions is conducted locally; there is no capability of collecting data on reasonable accommodations requests Army wide. There is no agency-wide automated tracking system in place to bring visibility to these requests or to analyze the information. However, Army policy on Reasonable Accommodation was published in 2009 and this area is being addressed. Multiple entries for disability codes into DCPDS have not been completed. Employees with more than one disability cannot have more than one disability coded in DCPDS.

EEOC FORM
U.S. Equal Employment Opportunity Commission
FEDERAL AGENCY ANNUAL EEO PROGRAM STATUS REPORT
Headquarters Department of the Army Page 10 of 98
Element D. Proactive prevention of unlawful discrimination
Strength:
Agency policies and practices support program operations. The program infrastructure, as
expressed in Army regulations and policies, provides visibility to EEO programs and
practices. Redress methods are taught at New Employee Orientations for both civilian and
military personnel who include military and civilian supervisors and managers.
Element E. Efficiency
Strength:
The centralization of EEO systems using iComplaints and the MD 715 Reporter provides
global oversight of program operations by integrating metrics, data, and local information,
while supporting local context and knowledge sharing.
The Army’s ability to modernize its EEO program provides flexibility in the effort to achieve
the model EEO program. The usage rate of EEO systems by EEO users approaches 90% of
the more than 400 EEO careerists.
MD 715 metrics are integrated into overall command metric systems such as the Army
wide installation status reporting and resource modeling systems.
Access to HR data is provided through standard access procedures and EEO specific data
elements are integrated into DCPDS.
Employee training is monitored and the move to more standardized online modules
assures consistency and legal compliance. The movement away from the dependency on
collateral duty to full time support provides more substantial assets to the EEO process.
Deficiency:
The Army's complaint processing program generally operates at a high level of efficiency
and compliance with EEOC guidelines and procedures, however meeting processing
timelines for investigations continue to be a challenge.

EEOC FORM
U.S. Equal Employment Opportunity Commission
FEDERAL AGENCY ANNUAL EEO PROGRAM STATUS REPORT
Headquarters Department of the Army Page 11 of 98
Element F. Responsiveness and Legal Compliance
Strengths:
EEO, HR, and Legal review of Army senior executive leaders’ performance awards with
recommendations to the Secretary of the Army for approval or denial.
Army’s EEO complaints are managed at each command’s programmatic level. The agency
authority for final agency decisions rests with the Office of the ASA(M&RA). The
operational report is included in the complaints analysis of this report.
FY 2010 462 REPORT ANALYSIS The number of informal and formal complaints filed against the Department of the
Army increased slightly during Fiscal Year 2010. 2,367 informal complaints were filed in
FY 2010, compared with 2,308 informal complaints in FY 2009; there were 1,320 formal
filings in FY 2010 as compared to 1,207 formal complaints filed in FY 2009.
Informal closures also increased, from 2,342 informal complaints closed during FY
2009 to 2,416 in FY 2010. The vast majority of Army pre-complaints continue to be closed
with the issuance of a Notice of Right to File a Formal Complaint; in FY 2010 only 12.3% of
informal complaints were settled as compared to 87.7% that closed with a Notice of Right
to File. The overall percentage of informal complaints which resulted in the filing of a
formal complaint remained around the 50% level, as it has for several years.
The top two issues raised in formal complaints process in FY 2010, as shown in
Figure 4, were harassment (non-sexual) and promotion/non-selection, the same as in the
previous two fiscal years.
Top 5 Issues Total Complaints
Total Complainants
% of Total Complaints
Harassment (Non-Sexual) 516 503 39.1% Promotion/Non-Selection 240 237 18.2% Disciplinary Actions (all) 217 211 16.4% Evaluation/Appraisal 157 151 11.9% Termination 138 138 10.5%
EEOC FORM
U.S. Equal Employment Opportunity Commission
FEDERAL AGENCY ANNUAL EEO PROGRAM STATUS REPORT
Headquarters Department of the Army Page 12 of 98
Figure 4
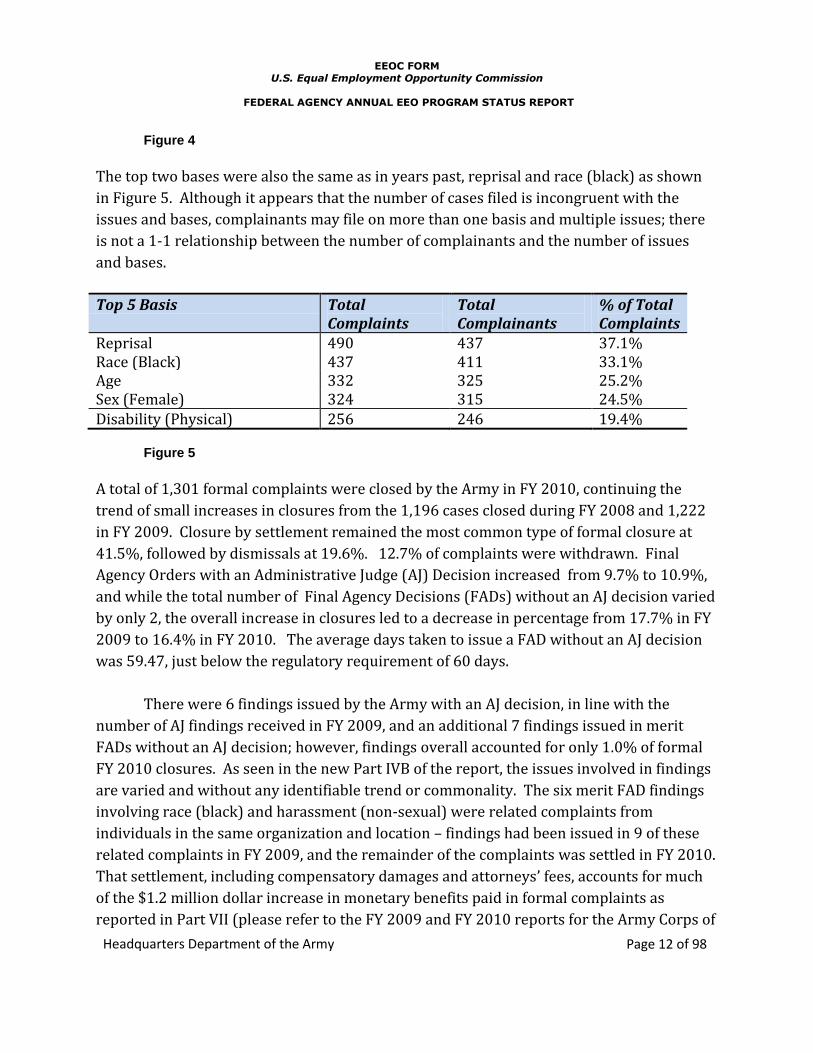
The top two bases were also the same as in years past, reprisal and race (black) as shown
in Figure 5. Although it appears that the number of cases filed is incongruent with the
issues and bases, complainants may file on more than one basis and multiple issues; there
is not a 1-1 relationship between the number of complainants and the number of issues
and bases.
Top 5 Basis Total Complaints
Total Complainants
% of Total Complaints
Reprisal 490 437 37.1% Race (Black) 437 411 33.1% Age 332 325 25.2% Sex (Female) 324 315 24.5% Disability (Physical) 256 246 19.4%
Figure 5
A total of 1,301 formal complaints were closed by the Army in FY 2010, continuing the
trend of small increases in closures from the 1,196 cases closed during FY 2008 and 1,222
in FY 2009. Closure by settlement remained the most common type of formal closure at
41.5%, followed by dismissals at 19.6%. 12.7% of complaints were withdrawn. Final
Agency Orders with an Administrative Judge (AJ) Decision increased from 9.7% to 10.9%,
and while the total number of Final Agency Decisions (FADs) without an AJ decision varied
by only 2, the overall increase in closures led to a decrease in percentage from 17.7% in FY
2009 to 16.4% in FY 2010. The average days taken to issue a FAD without an AJ decision
was 59.47, just below the regulatory requirement of 60 days.
There were 6 findings issued by the Army with an AJ decision, in line with the
number of AJ findings received in FY 2009, and an additional 7 findings issued in merit
FADs without an AJ decision; however, findings overall accounted for only 1.0% of formal
FY 2010 closures. As seen in the new Part IVB of the report, the issues involved in findings
are varied and without any identifiable trend or commonality. The six merit FAD findings
involving race (black) and harassment (non-sexual) were related complaints from
individuals in the same organization and location – findings had been issued in 9 of these
related complaints in FY 2009, and the remainder of the complaints was settled in FY 2010.
That settlement, including compensatory damages and attorneys’ fees, accounts for much
of the $1.2 million dollar increase in monetary benefits paid in formal complaints as
reported in Part VII (please refer to the FY 2009 and FY 2010 reports for the Army Corps of

EEOC FORM
U.S. Equal Employment Opportunity Commission
FEDERAL AGENCY ANNUAL EEO PROGRAM STATUS REPORT
Headquarters Department of the Army Page 13 of 98
Engineers subcomponent). Setting those related findings aside, reprisal remained the most
common basis for a finding, followed closely by disability (physical) and race (black).
A total of 1,066 formal complaints were still open at the close of FY 2010. Nearly all
were either pending investigation (522) or pending a hearing before an Administrative
Judge (425). Of the 100 cases reported as pending the complainant’s post-investigative
election or a Final Agency Decision/Action the Army’s complaint tracking database
indicated that 49 complaints were pending the complainant’s election and 51 were pending
final action.
The Army completed 546 investigations in FY 2010, nearly 100 more than in FY
2009 (457 investigations), and in a reduced timeframe of 202.53 days on average as
compared to 213.67 days in the previous year. The percentage of Army investigations
considered timely also increased from 44.4% in FY 2009 to 52.7% in FY 2010. Notably,
those investigations which were completed in 180 days or less were actually concluded in
an average of 151.33 days, almost a full month below the regulatory requirement. Army
plans to analyze the data from these cases for trends or commonalities which may
contribute to the success of the investigative process. Best practices will be identified and
shared with other Army activities to reduce investigative timeframes in FY 2011.
The acceptance rate for ADR in pre-complaints increased slightly for the third
consecutive year, increasing from 50.5% in FY 2009 to 53.3% in FY 2010. This also
increased the ADR participation rate, though it remains very low with only 25.4% of all
closed informal complaints having entered the ADR process. ADR settlements also
increased slightly in FY 2010, with 223 pre-complaints in which ADR was accepted closing
with a settlement for an ADR resolution rate of 36.4% - identical to the resolution rate in
the previous fiscal year. In spite of these mild improvements ADR settlements totaled only
9.2% of all FY 2010 pre-complaint closures. ADR was offered in only 299 complaints in the
formal stage during FY 2010, and accepted in 194, for an acceptance rate of 64.9% and a
participation rate of 23% of all formal complaints filed2, which meant that 146 of those
2 These numbers were calculated out of Army’s own complaint tracking database, looking at all formal
complaints in which ADR was offered during FY 2010, regardless of their status at the end of the fiscal year. As of the FY 2006 462 reports, Part XI “Formal ADR Activities” only gives ADR participation data for those complaints which closed during the fiscal year. As this excludes all ADR activity during FY 2010 in complaints which did not close during the fiscal year, and includes ADR activity which took place in previous fiscal years in complaints which happened to close in FY 2010, most likely not as a result of any FY 2010 ADR activity, Army does not believe that Part XI as it is now composed accurately reflects the work of Army’s ADR programs in the formal stage during the course of FY 2010. Therefore, in order to evaluate the performance of Army’s ADR programs during FY 2010 for this MD 715 report, Army has relied on its

EEOC FORM
U.S. Equal Employment Opportunity Commission
FEDERAL AGENCY ANNUAL EEO PROGRAM STATUS REPORT
Headquarters Department of the Army Page 14 of 98
complaints, or 75.3%, were closed with a settlement, maintaining Army’s historically high
resolution rate for formal ADR but accounting for only 11.2% of all FY 2010 formal
closures. The Army continues to be concerned with the low number of complaints in which
ADR is offered and the high number of complainants rejecting offers of ADR, particularly in
the pre-complaint stage, and is currently working to finalize and implement an ADR policy
to encourage greater understanding and utilization of ADR in EEO complaints.
Overall, the Department of the Army’s complaints processing in FY 2010 showed
significant improvement in several key areas; the investigative process and the issuance of
merit FADs without an AJ decision. We are continuing to work to maintain this progress in
FY 2011.
In response to the growing need to resolve workplace disputes throughout Army,
the Army Alternative Dispute Resolution (ADR) Program Office, located in the Office of the
Army General Counsel, was established in 2008 to promote and encourage the use of ADR
techniques in Army workplace and contract disputes, through training and other initiatives.
During FY 10 the ADR Program Office conducted a variety of ADR/mediation training and
education programs to promote the use of early conflict resolution in workplace disputes,
including EEO complaints. Eight 40-hour Basic Mediation Courses were conducted at the
installation level to develop local collateral duty Army mediators and local ADR programs
to assist in workplace matters. The audiences for these courses included EEO and Human
Resource professionals, labor counselors, union officials and managers and employees
representing many career fields across the Army. Briefings for Garrison Commanders and
Leaders on the strategic use of ADR methods in workplace disputes to promote primary
mission accomplishment were also conducted at these installations.
During FY 10, the Army ADR Office developed and delivered ADR education
programs tailored to a variety of Army audiences to promote ADR utilization. The ADR
Program Office conducted four ADR briefings at the Judge Advocate General’s Legal Center
and School for Army attorneys to promote the use of ADR methods in workplace disputes.
Five ADR briefings were conducted at the Army Civilian Human Resources Agency to
educate Army Human Resource professionals on the benefits of ADR and how to access
Army ADR resources for early dispute resolution. An ADR and negotiation course was
conducted at Army War College for Army Leaders to promote the strategic use of early
conflict resolution tools in EEO and other types of workplace disputes. The ADR Program
own database and calculations for the participation and resolution rates, and is not utilizing any of the data from Part XI of the FY 2010 462 report.

EEOC FORM
U.S. Equal Employment Opportunity Commission
FEDERAL AGENCY ANNUAL EEO PROGRAM STATUS REPORT
Headquarters Department of the Army Page 15 of 98
Office website (www.adr.army.mil) also provides guidance and education on the use of
ADR techniques in EEO and other types of workplace disputes.
Program Evaluation Summary
The Army’s path to the model EEO program is measured in a number of ways. The
EEOC MD 715 self assessment requirements are provided on MD 715 Form G and
summarized in Table 1. The scores are the aggregation of all reporting Army offices and is
based on the six essentials for a Model EEO Program. Army EEO offices rate themselves and
scores are aggregated through the EEO reporting hierarchy. Overall, the scores indicate
that the Army is 94% compliant with MD 715 requirements; this assessment does not
account for command and local circumstances.
Army Wide Form G Scores By Essential Element
Office Fiscal
Year
A B C D E F Percent
Yes
ARMY 2009 95% 94% 90% 90% 91% 100% 93%
2010 92% 94% 90% 100% 91% 100% 94%
Median
94% 94% 90% 95% 91% 100% 94%
% Chg -3% 0% 0% 10% 0% 0% 93%
Table 1
Each year’s score is compared to previous years to determine the net difference expressed
as the median score between years. This quantifies the progress made between reporting
years. The six essential elements are listed followed by a discussion of the Army scores.
A. Demonstrated commitment from agency leadership B. Integration of EEO into the agency's strategic mission C. Management and program accountability D. Proactive prevention of unlawful discrimination E. Efficiency; and F. Responsiveness and legal compliance.
The scores vary by command, but the Army wide scores indicate that the Army’s failure to publish and distribute an agency policy and provide a state of the agency briefing lowered the Army score by 3% for Essential Element A, Demonstrated Commitment From Agency Leadership. Improvements in the management of the data collection and complaints processing raised the score on Element D, Proactive Prevention of Unlawful

EEOC FORM
U.S. Equal Employment Opportunity Commission
FEDERAL AGENCY ANNUAL EEO PROGRAM STATUS REPORT
Headquarters Department of the Army Page 16 of 98
Discrimination, by 11%. Of all the essential elements, 58% of all deficiencies centered in Elements B, within the compliance indicator concerning sufficient budget support and Element E’s compliance indicator concerning staffing.
TRIGGERS
Within the statistical profiles of major EEO groups, the participation rate of White and African American men and women meets most statistical expectations compared to the CLF except where noted. With the exception of senior positions in the intelligence community, the participation rate of African American men in the senior executive service is at parity with the CLF. The workforce analysis that follows identified three major triggers:
1. The impact of the selection process on African American men in officials and
managers and professionals pay grade GS 12-15 to determine if there is
statistical significance between the referral and selection rates.
2. The lower than expected participation rates for Hispanic or Latinos based
upon the CLF in pay grades GS 12-15 and the senior executive service and the
impact of the senior executive service developmental process on Hispanic or
Latinos’ participation rates.
3. The lower than expected participation rates of women within individual EEO
groups based upon the CLF, in grades GS 12-15 and the senior executive
service.

EEOC FORM
U.S. Equal Employment Opportunity Commission
FEDERAL AGENCY ANNUAL EEO PROGRAM STATUS REPORT
Headquarters Department of the Army Page 17 of 98
STRATEGY FOR FY 2011
The overarching strategy for FY 2011 will focus on the continuation of strategic
interactions with the Army staff, commands and total Army community. To that end, three
strategic objectives will be used to strengthen staff and command relationships that result
in continued progress in the implementation of a “Model EEO program”.
Continue to strategically communicate, market, train and educate Army
personnel on the Army Diversity Road Map as a management tool for senior
leaders, commanders, and the Army staff.
Improve goal oriented relationships with functional career program
managers, senior leader developers and other human capital officials to align
the Army’s human capital implementation guidelines in ways that strengthen
the value system to embed diversity into policy and practice.
Reinforce the professional development of diversity professionals to meet the transformation challenges identified.

EEOC FORM
U.S. Equal Employment Opportunity Commission
FEDERAL AGENCY ANNUAL EEO PROGRAM STATUS REPORT
Headquarters Department of the Army Page 18 of 98

EEOC FORM
U.S. Equal Employment Opportunity Commission
FEDERAL AGENCY ANNUAL EEO PROGRAM STATUS REPORT
Headquarters Department of the Army Page 19 of 98
715-01 PART G
AGENCY SELF-ASSESSMENT CHECKLIST MEASURING ESSENTIAL ELEMENTS
Essential Element A: DEMONSTRATED COMMITMENT FROM AGENCY LEADERSHIP Requires the agency head to issue written policy statements ensuring a workplace free of discriminatory
harassment and a commitment to equal employment opportunity.
Compliance Indicator
EEO policy statements are up-to-date.
Measure has been
met
For all unmet measures, provide a brief explanation in the space below or
complete and attach an EEOC FORM 715-01 PART H to the agency’s status
report Measures Yes No
Was the EEO policy Statement issued within 6-9 months of the installation of the Agency Head? If no, provide an explanation. The Agency Head was installed on 9/29/2009. The EEO policy statement was not issued.
X
Policy letters are being coordinated with appropriate Army staff organizations.
During the current Agency Head's tenure, has the EEO policy Statement been re-issued annually? If no, provide and explanation.
X Policy letters are being coordinated with appropriate Army staff organizations.
Are new employees provided a copy of the EEO policy statement during orientation?
X
When an employee is promoted into the supervisory ranks, is s/he provided a copy of the EEO policy statement?
X
Compliance Indicator
EEO policy statements have been communicated to all employees.
Measure has been
met
For all unmet measures, provide a brief explanation in the space below or
complete and attach an EEOC FORM 715-01 PART H to the agency’s status
report Measures Yes No
Have the heads of subordinate reporting components communicated support of all agency EEO policies through the ranks?
X
Has the agency made written materials available to all employees and applicants, informing them of the variety of EEO programs and administrative and judicial remedial procedures available to them?
X
Has the agency prominently posted such written materials in all personnel offices, EEO offices, and on the agency's internal website? [see 29 CFR 1614.102(b)(5)]
X
Compliance Indicator Agency EEO policy is vigorously
enforced by agency management.
Measure has been
met
For all unmet measures, provide a brief explanation in the space below or
complete and attach an EEOC FORM 715-01 PART H to the agency’s status
report Measures Yes No
Are managers and supervisors evaluated on their commitment to agency EEO policies and principles, including their efforts to:
X
resolve problems/disagreements and other conflicts in their respective work environments as they arise?
X

EEOC FORM
U.S. Equal Employment Opportunity Commission
FEDERAL AGENCY ANNUAL EEO PROGRAM STATUS REPORT
Headquarters Department of the Army Page 20 of 98
address concerns, whether perceived or real, raised by employees and following-up with appropriate action to correct or eliminate tension in the workplace?
X
support the agency's EEO program through allocation of mission personnel to participate in community out-reach and recruitment programs with private employers, public schools and universities?
X
ensure full cooperation of employees under his/her supervision with EEO office officials such as EEO Counselors, EEO Investigators, etc.?
X
ensure a workplace that is free from all forms of discrimination, harassment and retaliation?
X
ensure that subordinate supervisors have effective managerial, communication and interpersonal skills in order to supervise most effectively in a workplace with diverse employees and avoid disputes arising from ineffective communications ?
X
ensure the provision of requested religious accommodations when such accommodations do not cause an undue hardship?
X
ensure the provision of requested disability accommodations to qualified individuals with disabilities when such accommodations do not cause an undue hardship?
X
Have all employees been informed about what behaviors are inappropriate in the workplace and that this behavior may result in disciplinary actions? Describe what means were utilized by the agency to so inform its workforce about the penalties for unacceptable behavior.
X
Have the procedures for reasonable accommodation for individuals with disabilities been made readily available/accessible to all employees by disseminating such procedures during orientation of new employees and by making such procedures available on the World Wide Web or Internet?
X
Have managers and supervisor been trained on their responsibilities under the procedures for reasonable accommodation?
X
Essential Element B: INTEGRATION OF EEO INTO THE AGENCY'S STRATEGIC MISSION Requires that the agency's EEO programs be organized and structured to maintain a workplace that is free
from discrimination in any of the agency's policies, procedures or practices and supports the agency's strategic mission.
Compliance Indicator
The reporting structure for the EEO Program provides the Principal EEO Official with appropriate authority and resources to effectively carry out a successful EEO Program.
Measure has been met
For all unmet measures, provide a brief explanation in the space below or complete and attach an EEOC FORM 715-01 PART H to the agency’s status report
Measures Yes No
Is the EEO Director under the direct supervision of the agency head? [see 29 CFR §1614.102(b)(4)]
X
Are the duties and responsibilities of EEO officials clearly defined?
X

EEOC FORM
U.S. Equal Employment Opportunity Commission
FEDERAL AGENCY ANNUAL EEO PROGRAM STATUS REPORT
Headquarters Department of the Army Page 21 of 98
Do the EEO officials have the knowledge, skills, and abilities to carry out the duties and responsibilities of their positions?
X
If the agency has 2nd level reporting components, are there organizational charts that clearly define the reporting structure for EEO programs?
X
If the agency has 2nd level reporting components, does the agency-wide EEO Director have authority for the EEO programs within the subordinate reporting components? If not, please describe how EEO program authority is delegated to subordinate reporting components.
X
Compliance Indicator
The EEO Director and other EEO professional staff responsible for EEO programs have regular and effective means of informing the
agency head and senior management officials of the
status of EEO programs and are involved in, and consulted on,
management/personnel actions.
Measure has been
met For all unmet measures, provide a brief explanation in the space below or
complete and attach an EEOC FORM 715-01 PART H to the agency’s status
report
Measures
Yes No
Does the EEO Director/Officer have a regular and effective means of informing the agency head and other top management officials of the effectiveness, efficiency and legal compliance of the agency's EEO program?
X
Following the submission of the immediately preceding FORM 715-01, did the EEO Director/Officer present to the head of the agency and other senior officials the "State of the Agency" briefing covering all components of the EEO report, including an assessment of the performance of the agency in each of the six elements of the Model EEO Program and a report on the progress of the agency in completing its barrier analysis including any barriers it identified and/or eliminated or reduced the impact of?
X
Briefings for the ASA M&RA and Secretary the Army are being planned.
Are EEO program officials present during agency deliberations prior to decisions regarding recruitment strategies, vacancy projections, succession planning, selections for training/career development opportunities, and other workforce changes?
X
Does the agency consider whether any group of employees or applicants might be negatively impacted prior to making human resource decisions such as re-organizations and re-alignments?
X
Are management/personnel policies, procedures and practices examined at regular intervals to assess whether there are hidden impediments to the realization of equality of opportunity for any group(s) of employees or applicants? [see 29 CFR. Â 1614.102(b)(3)]
X
Is the EEO Director included in the agency's strategic planning, especially the agency's human capital plan, regarding succession planning, training, etc., to ensure that EEO concerns are integrated into the agency's strategic mission?
X
Compliance Indicator
The agency has committed sufficient human resources and
budget allocations to its EEO
Measure has been
met
For all unmet measures, provide a brief explanation in the space below or
complete and attach an EEOC FORM

EEOC FORM
U.S. Equal Employment Opportunity Commission
FEDERAL AGENCY ANNUAL EEO PROGRAM STATUS REPORT
Headquarters Department of the Army Page 22 of 98
Measures programs to ensure successful operation.
Yes No 715-01 PART H to the agency’s status
report
Does the EEO Director have the authority and funding to ensure implementation of agency EEO action plans to improve EEO program efficiency and/or eliminate identified barriers to the realization of equality of opportunity?
X
Are sufficient personnel resources allocated to the EEO Program to ensure that agency self-assessments and self-analyses prescribed by EEO MD-715 are conducted annually and to maintain an effective complaint processing system?
X
Army will conduct resource management study to ensure resource management levels meet anticipated mission requirements
Are statutory/regulatory EEO related Special Emphasis Programs sufficiently staffed?
Federal Women's Program - 5 U.S.C. 7201; 38 U.S.C. 4214; Title 5 CFR, Subpart B, 720.204
X
Hispanic or Latino Employment Program - Title 5 CFR, Subpart B, 720.204
X
People With Disabilities Program Manager; Selective Placement Program for Individuals With Disabilities - Section 501 of the Rehabilitation Act; Title 5 U.S.C. Subpart B, Chapter 31, Subchapter I-3102; 5 CFR 213.3102(t) and (u); 5 CFR 315.709
X
Are other agency special emphasis programs monitored by the EEO Office for coordination and compliance with EEO guidelines and principles, such as FEORP - 5 CFR 720; Veterans Employment Programs; and Black/African American; American Indian/Alaska Native, Asian American/Native Hawaiian or Other Pacific Islander programs?
X
Compliance Indicator The agency has committed
sufficient budget to support the success of its EEO Programs.
Measure has been
met
For all unmet measures, provide a brief explanation in the space below or
complete and attach an EEOC FORM 715-01 PART H to the agency’s status
report Measures Yes No
Are there sufficient resources to enable the agency to conduct a thorough barrier analysis of its workforce, including the provision of adequate data collection and tracking systems
X
Is there sufficient budget allocated to all employees to utilize, when desired, all EEO programs, including the complaint processing program and ADR, and to make a request for reasonable accommodation? (Including subordinate level reporting components?)
X
Has funding been secured for publication and distribution of EEO materials (e.g. harassment policies, EEO posters, reasonable accommodations procedures, etc.)?
X
Is there a central fund or other mechanism for funding supplies, equipment and services necessary to provide disability accommodations?
X
Does the agency fund major renovation projects to ensure timely compliance with Uniform Federal Accessibility Standards?
X

EEOC FORM
U.S. Equal Employment Opportunity Commission
FEDERAL AGENCY ANNUAL EEO PROGRAM STATUS REPORT
Headquarters Department of the Army Page 23 of 98
Is the EEO Program allocated sufficient resources to train all employees on EEO Programs, including administrative and judicial remedial procedures available to employees?
X
Is there sufficient funding to ensure the prominent posting of written materials in all personnel and EEO offices? [see 29 C.F.R. § 1614.102(b)(5)]
X
Is there sufficient funding to ensure that all employees have access to this training and information?
X
Is there sufficient funding to provide all managers and supervisors with training and periodic up-dates on their EEO responsibilities:
X
for ensuring a workplace that is free from all forms of discrimination, including harassment and retaliation?
X
to provide religious accommodations? X
to provide disability accommodations in accordance with the agency's written procedures?
X
in the EEO discrimination complaint process? X
to participate in ADR? X
Essential Element C: MANAGEMENT AND PROGRAM ACCOUNTABILITY This element requires the Agency Head to hold all managers, supervisors, and EEO Officials responsible for
the effective implementation of the agency's EEO Program and Plan.
Compliance Indicator
EEO program officials advise and provide appropriate assistance to managers/supervisors about the status of EEO programs within each managers or supervisor's area or responsibility.
Measure has been met
For all unmet measures, provide a brief explanation in the space below or complete and attach an EEOC FORM 715-01 PART H to the agency’s status report
Measures Yes No
Are regular (monthly/quarterly/semi-annually) EEO updates provided to management/supervisory officials by EEO program officials?
X
Do EEO program officials coordinate the development and implementation of EEO Plans with all appropriate agency managers to include Agency Counsel, Human Resource Officials, Finance, and the Chief information Officer?
X
Compliance Indicator
The Human Resources Director and the EEO Director meet
regularly to assess whether personnel programs, policies,
and procedures are in conformity with instructions contained in EEOC management directives.
[see 29 CFR Â 1614.102(b)(3)]
Measure has been
met For all unmet measures, provide a
brief explanation in the space below or complete and attach an EEOC FORM
715-01 PART H to the agency’s status report
Measures
Yes No
Have time-tables or schedules been established for the agency to review its Merit Promotion Program Policy and Procedures for systemic barriers that may be impeding full participation in promotion opportunities by all groups?
X

EEOC FORM
U.S. Equal Employment Opportunity Commission
FEDERAL AGENCY ANNUAL EEO PROGRAM STATUS REPORT
Headquarters Department of the Army Page 24 of 98
Have time-tables or schedules been established for the agency to review its Employee Recognition Awards Program and Procedures for systemic barriers that may be impeding full participation in the program by all groups?
X
Have time-tables or schedules been established for the agency to review its Employee Development/Training Programs for systemic barriers that may be impeding full participation in training opportunities by all groups?
X
Compliance Indicator When findings of discrimination
are made, the agency explores whether or not disciplinary
actions should be taken.
Measure has been
met
For all unmet measures, provide a brief explanation in the space below or
complete and attach an EEOC FORM 715-01 PART H to the agency’s status
report Measures Yes No
Does the agency have a disciplinary policy and/or a table of penalties that covers employees found to have committed discrimination?
X
Have all employees, supervisors, and managers been informed as to the penalties for being found to perpetrate discriminatory behavior or for taking personnel actions based upon a prohibited basis?
X
Has the agency, when appropriate, disciplined or sanctioned managers/supervisors or employees found to have discriminated over the past two years? If so, cite number found to have discriminated and list penalty/disciplinary action for each type of violation.
X
Does the agency promptly (within the established time frame) comply with EEOC, Merit Systems Protection Board, Federal Labor Relations Authority, labor arbitrators, and District Court orders?
X
Does the agency review disability accommodation decisions/actions to ensure compliance with its written procedures and analyze the information tracked for trends, problems, etc.?
X
Essential Element D: PROACTIVE PREVENTION Requires that the agency head makes early efforts to prevent discriminatory actions and eliminate barriers to
equal employment opportunity in the workplace.
Compliance Indicator Analyses to identify and remove
unnecessary barriers to employment are conducted throughout the year.
Measure has been met
For all unmet measures, provide a brief explanation in the space below or complete and attach an EEOC FORM 715-01 PART H to the agency’s status report Measures Yes No
Do senior managers meet with and assist the EEO Director and/or other EEO Program Officials in the identification of barriers that may be impeding the realization of equal employment opportunity?
X
When barriers are identified, do senior managers develop and implement, with the assistance of the agency EEO office, agency EEO Action Plans to eliminate said barriers?
X
Do senior managers successfully implement EEO Action Plans and incorporate the EEO Action Plan Objectives into agency strategic plans?
X

EEOC FORM
U.S. Equal Employment Opportunity Commission
FEDERAL AGENCY ANNUAL EEO PROGRAM STATUS REPORT
Headquarters Department of the Army Page 25 of 98
Are trend analyses of workforce profiles conducted by race, national origin, sex and disability?
X
Are trend analyses of the workforce's major occupations conducted by race, national origin, sex and disability?
X
Are trends analyses of the workforce's grade level distribution conducted by race, national origin, sex and disability?
X
Are trend analyses of the workforce's compensation and reward system conducted by race, national origin, sex and disability?
X
Are trend analyses of the effects of management/personnel policies, procedures and practices conducted by race, national origin, sex and disability?
X
Compliance Indicator The use of Alternative Dispute
Resolution (ADR) is encouraged by senior management.
Measure has been
met
For all unmet measures, provide a brief explanation in the space below or
complete and attach an EEOC FORM 715-01 PART H to the agency’s status
report Measures Yes No
Are all employees encouraged to use ADR? X
Is the participation of supervisors and managers in the ADR process required?
X
Essential Element E: EFFICIENCY Requires that the agency head ensure that there are effective systems in place for evaluating the impact and
effectiveness of the agency's EEO Programs as well as an efficient and fair dispute resolution process.
Compliance Indicator The agency has sufficient
staffing, funding, and authority to achieve the elimination of identified barriers.
Measure has been met
For all unmet measures, provide a brief explanation in the space below or complete and attach an EEOC FORM 715-01 PART H to the agency’s status report Measures Yes No
Does the EEO Office employ personnel with adequate training and experience to conduct the analyses required by MD-715 and these instructions?
X
Has the agency implemented an adequate data collection and analysis systems that permit tracking of the information required by MD-715 and these instructions?
X
Have sufficient resources been provided to conduct effective audits of field facilities' efforts to achieve a model EEO program and eliminate discrimination under Title VII and the Rehabilitation Act?
X
Is there a designated agency official or other mechanism in place to coordinate or assist with processing requests for disability accommodations in all major components of the agency?
X
Are 90% of accommodation requests processed within the time frame set forth in the agency procedures for reasonable accommodation?
X
Compliance Indicator
The agency has an effective complaint tracking and
monitoring system in place to
Measure has been
met
For all unmet measures, provide a brief explanation in the space below or
complete and attach an EEOC FORM

EEOC FORM
U.S. Equal Employment Opportunity Commission
FEDERAL AGENCY ANNUAL EEO PROGRAM STATUS REPORT
Headquarters Department of the Army Page 26 of 98
Measures increase the effectiveness of the agency's EEO Programs.
Yes No 715-01 PART H to the agency’s status
report
Does the agency use a complaint tracking and monitoring system that allows identification of the location and status of complaints and length of time elapsed at each stage of the agency's complaint resolution process?
X
Does the agency's tracking system identify the issues and bases of the complaints, the aggrieved individuals/complainants, the involved management officials and other information to analyze complaint activity and trends?
X
Does the agency hold contractors accountable for delay in counseling and investigation processing times? If yes, briefly describe how:
X Contractors are held accountable through the statement of work by each contracting office
Does the agency monitor and ensure that new investigators, counselors, including contract and collateral duty investigators, receive the 32 hours of training required in accordance with EEO Management Directive MD-110?
X
Does the agency monitor and ensure that experienced counselors, investigators, including contract and collateral duty investigators, receive the 8 hours of refresher training required on an annual basis in accordance with EEO Management Directive MD-110?
X
Compliance Indicator
The agency has sufficient staffing, funding and authority to comply with the time frames in accordance with the EEOC (29
C.F.R. Part 1614) regulations for processing EEO complaints of employment discrimination.
Measure has been
met For all unmet measures, provide a
brief explanation in the space below or complete and attach an EEOC FORM
715-01 PART H to the agency’s status report
Measures Yes No
Are benchmarks in place that compares the agency's discrimination complaint processes with 29 C.F.R. Part 1614?
X
Does the agency provide timely EEO counseling within 30 days of the initial request or within an agreed upon extension in writing, up to 60 days?
X
Does the agency provide an aggrieved person with written notification of his/her rights and responsibilities in the EEO process in a timely fashion?
X
Does the agency complete the investigations within the applicable prescribed time frame?
X See form H
When a complainant requests a final agency decision, does the agency issue the decision within 60 days of the request?
X
When a complainant requests a hearing, does the agency immediately upon receipt of the request from the EEOC AJ forward the investigative file to the EEOC Hearing Office?
X
When a settlement agreement is entered into, does the agency timely complete any obligations provided for in such agreements?
X

EEOC FORM
U.S. Equal Employment Opportunity Commission
FEDERAL AGENCY ANNUAL EEO PROGRAM STATUS REPORT
Headquarters Department of the Army Page 27 of 98
Does the agency ensure timely compliance with EEOC AJ decisions which are not the subject of an appeal by the agency?
X
Compliance Indicator
There is an efficient and fair dispute resolution process and
effective systems for evaluating the impact and effectiveness of
the agency's EEO complaint processing program.
Measure has been
met
For all unmet measures, provide a brief explanation in the space below or
complete and attach an EEOC FORM 715-01 PART H to the agency’s status
report Measures
Yes No
In accordance with 29 C.F.R. §1614.102(b), has the agency established an ADR Program during the pre-complaint and formal complaint stages of the EEO process?
X
Does the agency require all managers and supervisors to receive ADR training in accordance with EEOC (29 C.F.R. Part 1614) regulations, with emphasis on the federal government's interest in encouraging mutual resolution of disputes and the benefits associated with utilizing ADR?
X
After the agency has offered ADR and the complainant has elected to participate in ADR, are the managers required to participate?
X
Does the responsible management official directly involved in the dispute have settlement authority?
X
Compliance Indicator
The agency has effective systems in place for maintaining and evaluating the impact and
effectiveness of its EEO programs.
Measure has been
met
For all unmet measures, provide a brief explanation in the space below or
complete and attach an EEOC FORM 715-01 PART H to the agency’s status
report Measures Yes No
Does the agency have a system of management controls in place to ensure the timely, accurate, complete and consistent reporting of EEO complaint data to the EEOC?
X
Does the agency provide reasonable resources for the EEO complaint process to ensure efficient and successful operation in accordance with 29 C.F.R. § 1614.102(a)(1)?
X
Does the agency EEO office have management controls in place to monitor and ensure that the data received from Human Resources is accurate, timely received, and contains all the required data elements for submitting annual reports to the EEOC?
X
Do the agency's EEO programs address all of the laws enforced by the EEOC?
X
Does the agency identify and monitor significant trends in complaint processing to determine whether the agency is meeting its obligations under Title VII and the Rehabilitation Act?
X
Does the agency track recruitment efforts and analyze efforts to identify potential barriers in accordance with MD-715 standards?
X
Does the agency consult with other agencies of similar size on the effectiveness of their EEO programs to identify best practices and share ideas?
X

EEOC FORM
U.S. Equal Employment Opportunity Commission
FEDERAL AGENCY ANNUAL EEO PROGRAM STATUS REPORT
Headquarters Department of the Army Page 28 of 98
Compliance Indicator
The agency ensures that the investigation and adjudication
function of its complaint resolution process are separate
from its legal defense arm of agency or other offices with
conflicting or competing interests.
Measure has been
met For all unmet measures, provide a
brief explanation in the space below or complete and attach an EEOC FORM
715-01 PART H to the agency’s status report
Measures
Yes No
Are legal sufficiency reviews of EEO matters handled by a functional unit that is separate and apart from the unit which handles agency representation in EEO complaints?
X
Does the agency discrimination complaint process ensure a neutral adjudication function?
X
If applicable, are processing time frames incorporated for the legal counsel's sufficiency review for timely processing of complaints?
X
Essential Element F: RESPONSIVENESS AND LEGAL COMPLIANCE This element requires that federal agencies are in full compliance with EEO statutes and EEOC regulations,
policy guidance, and other written instructions.
Compliance Indicator Agency personnel are
accountable for timely compliance with orders issued by EEOC Administrative Judges.
Measure has been met
For all unmet measures, provide a brief explanation in the space below or complete and attach an EEOC FORM 715-01 PART H to the agency’s status report Measures Yes No
Does the agency have a system of management control to ensure that agency officials timely comply with any orders or directives issued by EEOC Administrative Judges?
X
Compliance Indicator
The agency's system of management controls ensures
that the agency timely completes all ordered corrective action and submits its compliance report to
EEOC within 30 days of such completion.
Measure has been
met For all unmet measures, provide a
brief explanation in the space below or complete and attach an EEOC FORM
715-01 PART H to the agency’s status report
Measures Yes No
Does the agency have control over the payroll processing function of the agency?
The Defense Finance and Accounting Service is the proponent for issuing compensation.
Are there steps in place to guarantee responsive, timely, and predictable processing of ordered monetary relief?
X
Are procedures in place to promptly process other forms of ordered relief?
X
Compliance Indicator Agency personnel are
accountable for the timely completion of actions required to
comply with orders of EEOC.
Measure has been
met
For all unmet measures, provide a brief explanation in the space below or
complete and attach an EEOC FORM 715-01 PART H to the agency’s status
report Measures Yes No
Is compliance with EEOC orders encompassed in the performance standards of any agency employees? If so, please identify the employees by title in the comments section, and state how performance is measured.
X
The authority for enforcement of EEOC
orders resided with the ASA M&RA under
10 USC 3016.

EEOC FORM
U.S. Equal Employment Opportunity Commission
FEDERAL AGENCY ANNUAL EEO PROGRAM STATUS REPORT
Headquarters Department of the Army Page 29 of 98
Is the unit charged with the responsibility for compliance with EEOC orders located in the EEO office? If not, please identify the unit in which it is located, the number of employees in the unit, and their grade levels in the comments section.
X
Have the involved employees received any formal training in EEO compliance?
X
Does the agency promptly provide to the EEOC the following documentation for completing compliance:
Attorney Fees: Copy of check issued for attorney fees and /or a narrative statement by an appropriate agency official, or agency payment order dating the dollar amount of attorney fees paid?
X
Awards: A narrative statement by an appropriate agency official stating the dollar amount and the criteria used to calculate the award?
X
Back Pay and Interest: Computer print-outs or payroll documents outlining gross back pay and interest, copy of any checks issued narrative statement by an appropriate agency official of total monies paid?
X
Compensatory Damages: The final agency decision and evidence of payment, if made?
X
Training: Attendance roster at training session(s) or a narrative statement by an appropriate agency official confirming that specific persons or groups of persons attended training on a date certain?
X
Personnel Actions (e.g., Reinstatement, Promotion, Hiring, Reassignment): Copies of SF-50s
X
Posting of Notice of Violation: Original signed and dated notice reflecting the dates that the notice was posted. A copy of the notice will suffice if the original is not available.
X
Supplemental Investigation: 1. Copy of letter to complainant acknowledging receipt from EEOC of remanded case. 2. Copy of letter to complainant transmitting the Report of Investigation (not the ROI itself unless specified). 3. Copy of request for a hearing (complainant's request or agency's transmittal letter).
X
Final Agency Decision (FAD): FAD or copy of the complainant's request for a hearing.
X
Restoration of Leave: Print-out or statement identifying the amount of leave restored, if applicable. If not, an explanation or statement.
X
Civil Actions: A complete copy of the civil action complaint demonstrating same issues raised as in compliance matter.
X
Settlement Agreements: Signed and dated agreement with specific dollar amounts, if applicable. Also, appropriate documentation of relief is provided.
X

EEOC FORM
U.S. Equal Employment Opportunity Commission
FEDERAL AGENCY ANNUAL EEO PROGRAM STATUS REPORT
Headquarters Department of the Army Page 30 of 98
715-01 PART H
EEO Plan To Attain the Essential Elements of a Model EEO Program
FY 2010 ESSENTIAL ELEMENT E - EFFICIENCY AR
STATEMENT of MODEL PROGRAM ESSENTIAL ELEMENT DEFICIENCY:
Requires that the agency head ensure that there are effective systems in place for evaluating the impact and effectiveness of the agency's EEO Programs as well as an efficient and fair dispute resolution process.: Deficiency: Department of the Army regulations require completion of investigations of formal complaints of discrimination within 180 days of the date the formal complaint was filed; the Army average in FY 2010 was 202.53 days.
OBJECTIVE: To average less than 180 days for the completion of an investigation
RESPONSIBLE OFFICIAL: Director, EEO Compliance and Complaints Review
DATE OBJECTIVE INITIATED: 12/1/2010
TARGET DATE FOR COMPLETION OF OBJECTIVE:
12/1/2011
PLANNED ACTIVITIES TOWARD COMPLETION OF OBJECTIVE: TARGET DATE (Must be specific)
Revision of the Army regulation governing complaints processing, incorporating improved processes and best practices which resulted in reductions in processing time.
12/1/2011
REPORT OF ACCOMPLISHMENTS and MODIFICATIONS TO OBJECTIVE: TARGET DATE (Must be specific)
Army’s average investigation processing time decreased from 213.67 days in FY 2009 to 202.53 in FY 2010. Notably, the 43% of Army investigations which were completed in less than 180 days were actually concluded in an average of 151.33 days, nearly a full month below the regulatory requirement. Army is currently evaluating the data behind this statistic for best practices which could be expanded Army-wide. Staffing shortages at the Department of Defense, Investigations and Resolutions Division continue to negatively impact the timely availability of investigators. Also, the revised regulation has been delayed by additional Army organizational changes. As both situations are remedied, we hope to gradually increase the use of successful procedures and complete the revisions to the regulation.
12/6/2010

EEOC FORM
U.S. Equal Employment Opportunity Commission
FEDERAL AGENCY ANNUAL EEO PROGRAM STATUS REPORT
Headquarters Department of the Army Page 31 of 98
715-01 PART I
EEO Plan To Eliminate Identified Barrier
FY 2010, AR
STATEMENT OF CONDITION THAT WAS A TRIGGER FOR A POTENTIAL BARRIER:
The relationship between African-American men being referred for selection and their selection rate, the less than expected application rate of white women based upon the CLF, and the lower than expected number of Hispanic or Latino men and women based upon the CLF not only in the specific job categories, but in the applicant pool
BARRIER ANALYSIS The selection rate for African American men is lower than for groups that had a lower rate of applications and referrals. In addition, the application rate for Hispanic or Latino men and women is less than expected based upon the CLF
STATEMENT OF IDENTIFIED BARRIER:
Barrier not identified until analysis of selection rates have been conducted at the operational level
OBJECTIVE: Determine if there is significance in the selection rate between EEO groups in pay grades 12-15 overall.
RESPONSIBLE OFFICIAL:
DASA D&L
DATE OBJECTIVE INITIATED:
10/1/2010
TARGET DATE FOR COMPLETION OF OBJECTIVE:
9/30/2011
PLANNED ACTIVITIES TOWARD COMPLETION OF OBJECTIVE: TARGET DATE (Must be specific)
Operational offices will use the applicant pool data and the form I worksheet to determine if there are significant differences in selection rate of EEO groups in grades GS 12-15
5/26/2011
Brief FCRs on proposed action items to address barriers identified. 8/30/2011
Develop Army strategy to address barriers identified. 10/7/2011
REPORT OF ACCOMPLISHMENTS and MODIFICATIONS TO OBJECTIVE: TARGET DATE (Must be specific)

EEOC FORM
U.S. Equal Employment Opportunity Commission
FEDERAL AGENCY ANNUAL EEO PROGRAM STATUS REPORT
Headquarters Department of the Army Page 32 of 98
715-01 PART I
EEO Plan To Eliminate Identified Barrier
FY 2010, AR
STATEMENT OF CONDITION THAT WAS A TRIGGER FOR A POTENTIAL BARRIER:
The population data indicates that while pay plan ES shows a more diverse demographic, that the intelligence play plans do not reflect the same diversity shown in the ES pay plan.
BARRIER ANALYSIS Although ES positions comprise the largest group of senior executives, and dominated by non minority men, with the exception of Native Hawaiian or Other Pacific Islander men and women, every EEO group is represented. However, The senior positions in the intelligence community (IE and IP) have seven White women and one Hispanic or Latino man within its 47 positions; the majority of positions are held by non minority men. As figure 38 indicates, that 73% of the positions in pay plan ES are held by non minority men, that 82% of the positions in IE are held by non minority men.
STATEMENT OF IDENTIFIED BARRIER:
Barriers specifically not identified.
OBJECTIVE: To examine the senior level appointment process to include a range of policies that impact the feeder group developmental process to determine the barriers to a greater degree of senior level diversification
RESPONSIBLE OFFICIAL: DASA D&L, CLSMO, HR G1
DATE OBJECTIVE INITIATED:
10/1/2010
TARGET DATE FOR COMPLETION OF OBJECTIVE:
8/30/2011
PLANNED ACTIVITIES TOWARD COMPLETION OF OBJECTIVE: TARGET DATE (Must be specific)
Review the senior leader development process to determine the impact that the current policies have on the selection process.
08/30/2011
REPORT OF ACCOMPLISHMENTS and MODIFICATIONS TO OBJECTIVE: TARGET DATE (Must be specific)

EEOC FORM
U.S. Equal Employment Opportunity Commission
FEDERAL AGENCY ANNUAL EEO PROGRAM STATUS REPORT
Headquarters Department of the Army Page 33 of 98
715-01 PART I
EEO Plan To Eliminate Identified Barrier
FY 2010, AR
STATEMENT OF CONDITION THAT WAS A TRIGGER FOR A POTENTIAL BARRIER:
The selection rate for African American men is lower than for groups that had a lower rate of applications and referrals. In addition, the application rate for Hispanic or Latino men and women is less than expected based upon the CLF which will require analysis of the outreach process to identify barriers within the application process.
BARRIER ANALYSIS The number of application submissions from Hispanic or Latino men is 107,752 less than expected based upon the CLF while the number of application submissions from Hispanic or Latino women was 89,410 less than expected. The number of application submissions from Asian men as 11,505 more than expected based upon the CLF, while the number of applications from Asian women was 16, 566 less than expected. The number of applications submitted by American Indian or Alaska Native men and women was 2,497 and 4,719 less than expected based upon the CLF.
STATEMENT OF IDENTIFIED BARRIER:
Barrier not identified
OBJECTIVE: Increase the number of applications received from women and Hispanic or Latinos. Ensure selection process is fair for all applicants.
RESPONSIBLE OFFICIAL:
DASA D&L, CHRA
DATE OBJECTIVE INITIATED:
10/5/2011
TARGET DATE FOR COMPLETION OF OBJECTIVE:
10/5/2011
PLANNED ACTIVITIES TOWARD COMPLETION OF OBJECTIVE: TARGET DATE (Must be specific)
Operational EEO offices examine applicant data to determine if there are selection process issues impacting EEO groups.
5/30/2011
Use midterm reports to develop strategies to address global issues discovered. 7/30/2011
REPORT OF ACCOMPLISHMENTS and MODIFICATIONS TO OBJECTIVE: TARGET DATE (Must be specific)

EEOC FORM
U.S. Equal Employment Opportunity Commission
FEDERAL AGENCY ANNUAL EEO PROGRAM STATUS REPORT
Headquarters Department of the Army Page 34 of 98
715-01 PART J
Special Program Plan for the Recruitment, Hiring, and Advancement of Individuals
With Targeted Disabilities
Part I
Department of Agency Information
1. Agency 1. Headquarters United States Army
1.a. 2nd Level Component 1.a.
1.b. 3rd Level or lower 1.b.
Part II Employment Trend and
Special Recruitment
for Individuals
With Targeted
Disabilities
Enter Actual Number at the ...
... beginning of FY. ... end of FY. Net Change
Number % Number % Number %
Total Work Force 250,942 100.00% 266,183 100.00% 15,241 6.07%
Reportable Disability 20,357 8.11% 21,633 8.12% 1,276 6.26%
Targeted Disability* 1,764 0.70% 1,811 0.68% 47 2.66%
* If the rate of change for persons with targeted disabilities is not equal to or greater than the rate of change for the total workforce, a barrier analysis should be conducted (see below).
1. Total Number of Applications Received From Persons With Targeted Disabilities during the reporting period.
12,085
* If the rate of change for persons with targeted disabilities is not equal to or greater than the rate of change for the total workforce, a barrier analysis should be conducted (see below).
2. Total Number of Selections of Individuals with Targeted Disabilities during the reporting period.
109
Part III Participation Rates In Agency Employment Programs
Other
Employment/Personnel Programs
TOTAL Reportable
Disability Targeted Disability
Not Identified No Disability
# % # % # % # %
3. Competitive Promotions
23,165 1,648 7.11% 129 0.55% 382 1.64% 21,129 91.21%

EEOC FORM
U.S. Equal Employment Opportunity Commission
FEDERAL AGENCY ANNUAL EEO PROGRAM STATUS REPORT
Headquarters Department of the Army Page 35 of 98
4. Non-Competitive Promotions
0 0 0.00% 0 0.00% 0 0.00% 0 0.00%
5. Employee Career Development Programs
111,107
8,599 7.73% 660 0.59% 2,094 1.88% 100,37
4 90.33%
5.a. Grades 5 - 12 177,85
5 15,641 8.79% 1,316 0.73% 3,359 1.88%
158,801
89.28%
5.b.Grades 13 - 14 33,861 2,551 7.53% 178 0.52% 706 2.08% 30,586 90.32%
5.c. Grade 15/SES 3,085 230 7.45% 6 0.19% 52 1.68% 2,803 90.85%
6. Employee Recognition and Awards
0 0 0.00% 0 0.00% 0 0.00% 0 0.00%
6.a. Time-Off Awards (Total hrs awarded)
24,350 2,429 9.97% 195 0.80% 530 2.17% 21,382 87.81%
6.b. Cash Awards (total $$$ awarded)
69,126 5,650 8.17% 597 0.86% 1,174 1.69% 62,282 90.09%
6.c. Quality-Step Increase 0 0 0.00% 0 0.00% 0 0.00% 0 0.00%
EEOC FORM 715-01 Part J
Special Program Plan for the Recruitment, Hiring, and Advancement of Individuals With Targeted Disabilities
Part IV Identification and Elimination
of Barriers
Army has not met goals for individuals with targeted disabilities. Training, education and awareness of hiring authorities and outreach programs continues as a major programmatic activity.
Part V Goals for Targeted
Disabilities
Develop Plan IAW Executive Order 13548 and execute. Continue to train, educate and inform officials regarding opportunities to address hiring challenges and how to utilize designated hiring authorities and outreach programs. Focus on the integration of support for transitioning wounded service members from active duty to civilian employment. Assess how to capture, annotate and report successful accommodations in the transition process along with identifying active duty members who can stay on active duty as a result of accommodations and technology.

EEOC FORM
U.S. Equal Employment Opportunity Commission
FEDERAL AGENCY ANNUAL EEO PROGRAM STATUS REPORT
Headquarters Department of the Army Page 36 of 98
Appendix A
Definitions
The following definitions apply to Management Directive 715:
Applicant: A person who applies for employment.
Applicant Flow Data: Information reflecting characteristics of the pool of individuals
applying for an employment opportunity.
Barrier: An agency policy, principle, practice or condition that limits or tends to limit
employment opportunities for members of a particular gender, race or ethnic background
or for an individual (or individuals) based on disability status.
Disability: For the purpose of statistics, recruitment, and targeted goals, the number of
employees in the workforce who have indicated having a disability on a Office of
Personnel Management Standard Form (SF) 256. For all other purposes, the definition
contained in 29 C.F.R. § 1630.2 applies.
Civilian Labor Force (CLF): Persons 16 years of age and over, except those in the
armed forces, who are employed or are unemployed and seeking work.
EEO Groups: Members of groups protected under Title VII of the Civil Rights Act and
other Federal guidelines. Includes: White Men, White Women, Black Men, Black Women,
Hispanic or Latino Men, Hispanic or Latino Women, Asian Men, Asian Women, American
Indian or Alaska Native Men, American Indian or Alaska Native Women, and Persons with
Disabilities.
Employees: Members of the agency's permanent or temporary work force, whether full
or part-time and whether in competitive or excepted service positions.
Employment Decision: Any decision affecting the terms and conditions of an
individual's employment, including but not limited to hiring, promotion, demotion,
disciplinary action and termination.
Feeder Group or Pool: Occupational group(s) from which selections to a particular job
are typically made.
Federal Categories (Fed9):
The nine job category titles are:
- Officials and Managers - Occupations requiring administrative and managerial
personnel who set broad policies, exercise overall responsibility for execution of these
policies, and direct individual offices, programs, divisions or other units or special
phases of an agency's operations. In the federal sector, this category is further
broken out into four sub-categories: (1) Executive/Senior-Level,(2)Mid-Level,(3)
First-Level and (4)Other . When an employee is classified as a supervisor or
manager, that employee should be placed in the Officials and Managers category
rather than in the category in the crosswalk that they would otherwise be placed in

EEOC FORM
U.S. Equal Employment Opportunity Commission
FEDERAL AGENCY ANNUAL EEO PROGRAM STATUS REPORT
Headquarters Department of the Army Page 37 of 98
based on their OPM occupational code. Those employees classified as supervisors or
managers who are at the GS-12 level or below should be placed in the First-Level
sub-category of Officials and Managers, those at the GS-13 or 14 should be in the
Mid-Level sub-category and those at GS-15 or in the SES should be in the
Executive/Senior-Level sub-category. An agency may also choose to place
employees who have significant policy-making responsibilities, but do not supervise
other employees, in these three sub-categories. The fourth sub-category, called
"Other” contains employees in a number of different occupations which are primarily
business, financial and administrative in nature, and do not have supervisory or
significant policy responsibilities. For example, Administrative Officers (OPM Code
0341) are appropriately placed in the "Other” sub-category.
- Professionals - Occupations requiring either college graduation or experience of
such kind and amount as to provide a comparable background. Includes: accountants
and auditors, airplane pilots and navigators, architects, artists, chemists, designers,
dietitians, editors, engineers, lawyers, librarians, mathematicians, natural scientists,
registered professional nurses, personnel and labor relations specialists, physical
scientists, physicians, social scientists, teachers, surveyors and kindred workers.
- Technicians - Occupations requiring a combination of basic scientific knowledge and
manual skill which can be obtained through two years of post high school education,
such as is offered in many technical institutes and junior colleges, or through
equivalent on-the-job training. Includes: computer programmers, drafters,
engineering aides, junior engineers, mathematical aides, licensed, practical or
vocational nurses, photographers, radio operators, scientific assistants, technical
illustrators, technicians (medical, dental, electronic, physical science), and kindred
workers.
- Sales - Occupations engaging wholly or primarily in direct selling. Includes:
advertising agents and sales workers, insurance agents and brokers, real estate
agents and brokers, stock and bond sales workers, demonstrators, sales workers and
sales clerks, grocery clerks, and cashiers/checkers, and kindred workers.
- Administrative Support Workers - Includes all clerical-type work regardless of
level of difficulty, where the activities are predominantly non-manual though some
manual work not directly involved with altering or transporting the products is
included. Includes: bookkeepers, collectors (bills and accounts), messengers and
office helpers, office machine operators (including computer), shipping and receiving
clerks, stenographers, typists and secretaries, telegraph and telephone operators,
legal assistants, and kindred workers.
- Craft Workers (skilled) - Manual workers of relatively high skill level having a
thorough and comprehensive knowledge of the processes involved in their work.
Exercise considerable independent judgment and usually receive an extensive period
of training. Includes: the building trades, hourly paid supervisors and lead operators
who are not members of management, mechanics and repairers, skilled machining
occupations, compositors and typesetters, electricians, engravers, painters
(construction and maintenance), motion picture projectionists, pattern and model
makers, stationary engineers, tailors, arts occupations, hand painters, coaters,
bakers, decorating occupations, and kindred workers.
- Operatives (semiskilled) - Workers who operate machine or processing equipment or

EEOC FORM
U.S. Equal Employment Opportunity Commission
FEDERAL AGENCY ANNUAL EEO PROGRAM STATUS REPORT
Headquarters Department of the Army Page 38 of 98
perform other factory-type duties of intermediate skill level which can be mastered in
a few weeks and require only limited training. Includes: apprentices (auto mechanics,
plumbers, bricklayers, carpenters, electricians, machinists, mechanics, building
trades, metalworking trades, printing trades, etc.), operatives, attendants (auto
service and parking), blasters, chauffeurs, delivery workers, sewers and stitchers,
dryers, furnace workers, heaters, laundry and dry cleaning operatives, milliners, mine
operatives and laborers, motor operators, oilers and greasers (except auto), painters
(manufactured articles), photographic process workers, truck and tractor drivers,
knitting, looping, taping and weaving machine operators, welders and flame cutters,
electrical and electronic equipment assemblers, butchers and meat cutters,
inspectors, testers and graders, hand packers and packagers, and kindred workers.
- Laborers (unskilled) - Workers in manual occupations which generally require no
special training who perform elementary duties that may be learned in a few days
and require the application of little or no independent judgment. Includes: garage
laborers, car washers and greasers, grounds keepers and gardeners, farm workers,
stevedores, wood choppers, laborers performing lifting, digging, mixing, loading and
pulling operations, and kindred workers.
- Service workers - Workers in both protective and non-protective service
occupations. Includes: attendants (hospital and other institutions, professional and
personal service, including nurses aides, and orderlies), barbers, char workers and
cleaners, cooks, counter and fountain workers, elevator operators, firefighters and
fire protection, guards, door-keepers, stewards, janitors, police officers and
detectives, porters, waiters and waitresses, amusement and recreation facilities
attendants, guides, ushers, public transportation attendants, and kindred workers.
Fiscal Year: The period from October 1 of one year to September 30 of the following
year.
Goal: Under the Rehabilitation Act, an identifiable objective set by an agency to address
or eliminate barriers to equal employment opportunity or to address the lingering effects
of past discrimination.
Major Occupations: Agency occupations that are mission related and heavily populated,
relative to other occupations within the agency.
Onsite Program Review: Visit by EEOC representatives to an agency to evaluate the
agency's compliance with the terms of this Directive and/or to provide technical
assistance.
Reasonable Accommodation: Generally, any modification or adjustment to the work
environment, or to the manner or circumstances under which work is customarily
performed, that enables an individual with a disability to perform the essential functions
of a position or enjoy equal benefits and privileges of employment as are enjoyed by
similarly situated individuals without a disability. For a more complete definition, see 29
C.F.R. § 1630.2(o). See also, EEOC's Enforcement Guidance on Reasonable
Accommodation and Undue Hardship under the Americans with Disabilities Act, No.
915.002 (October 17, 2002).
Relevant Labor Force: The source from which an agency draws or recruits applicants
for employment or an internal selection such as a promotion.

EEOC FORM
U.S. Equal Employment Opportunity Commission
FEDERAL AGENCY ANNUAL EEO PROGRAM STATUS REPORT
Headquarters Department of the Army Page 39 of 98
Section 501 Program: The affirmative program plan that each agency is required to
maintain under Section 501 of the Rehabilitation Act to provide individuals with
disabilities adequate hiring, placement, and advancement opportunities.
Section 717 Program: The affirmative program of equal employment opportunity that
each agency is required to maintain for all employees and applicants for employment
under Section 717 of Title VII.
Selection Procedure: Any employment policy or practice that is used as a basis for an
employment decision.
Special Recruitment Program: A program designed to monitor recruitment of, and
track applications from, persons with targeted disabilities.
Targeted Disabilities: Disabilities that the federal government, as a matter of policy,
has identified for special emphasis in affirmative action programs. They are: 1) deafness;
2) blindness; 3) missing extremities; 4) partial paralysis; 5) complete paralysis; 6)
convulsive disorders; 7) mental retardation; 8) mental illness; and 9) distortion of limb
and/or spine.
Technical Assistance: Training, assistance or guidance provided by the EEOC in writing,
over the telephone or in person.
DATABASE NOTES
1. The data for this report reflects the organization as of 1 October 2010. The HR database
of record, the Defense Civilian Personnel Data System (DCPDS), was used to obtain the
data. It is recognized that the HR database contains anomalies that affect data reporting.
The variance didn't appear severe enough to affect the calculations.
2. Grade designations are the same ones used in DCPDS based on federal guidelines. Senior
individuals are defined as those members of the Senior Executive Service or equivalent,
such as all pay plans that start with an “E”, or “I”, pay plan “ST” and some positions in
the “AD” category. Data for Pay plan “EX” are excluded.
3. Some of the data codes used by EEOC vary from those in the HR data system. Many of
the “B” series data tables will not sum to the “A” series data tables. In addition, many of
the tables that capture data on RNO groups, because of the variety of pay plans used in
Army do not fit into the aspects of “GS” or “Wage Grade” equivalents.

EEOC FORM
U.S. Equal Employment Opportunity Commission
FEDERAL AGENCY ANNUAL EEO PROGRAM STATUS REPORT
Headquarters Department of the Army Page 40 of 98
Appendix B
STATE OF THE AGENCY BRIEFING

EEOC FORM
U.S. Equal Employment Opportunity Commission
FEDERAL AGENCY ANNUAL EEO PROGRAM STATUS REPORT
Headquarters Department of the Army Page 41 of 98

EEOC FORM
U.S. Equal Employment Opportunity Commission
FEDERAL AGENCY ANNUAL EEO PROGRAM STATUS REPORT
Headquarters Department of the Army Page 42 of 98
Appendix C
Supporting Documents
1. Diversity Roadmap - FINAL.pdf

EEOC FORM
U.S. Equal Employment Opportunity Commission
FEDERAL AGENCY ANNUAL EEO PROGRAM STATUS REPORT
Headquarters Department of the Army Page 43 of 98
Appendix D
ANALYSIS OF ARMY MID LEVEL AND SENIOR LEVEL
POSITIONS
This section provides the detailed workforce analysis on the major EEOC employee
categories and contains the data points used to identify the programmatic triggers and
form the basis for future barrier analysis. As previously mentioned, the scope of the Army’s
operations in the United States and overseas is impacted the conduct of two major wars
and other conflicts. The fluctuation in the civilian population is driven in large part by the
requirement to support specific national defense goals and changing requirements.
The Army workforce is socially diverse and includes more than 527 occupational
series of the 638 occupational series in DOD; 83% of the occupational series in DOD include
Army employees. Geographically, Army employees work in more than 2,065 GSA locations
worldwide. The number of employees working in the EEOC categories is shown below in
figure 6.
FED9 Description FED9 Count of Employees
Percentage
Officials and Managers 1 55,489 24.00%
Professionals 2 73,788 31.92%
Technicians 3 15,518 6.71%
Sales Workers 4 87 0.04%
Administrative Support Workers
5 37,080 16.04%
Craft Workers 6 25,587 11.07%
Operatives 7 11,448 4.95%
Laborers and Helpers 8 2,515 1.09%
Service Workers 9 9,633 4.17%
Not Detected 26 0.01%
231,171 100.00%
Figure 6
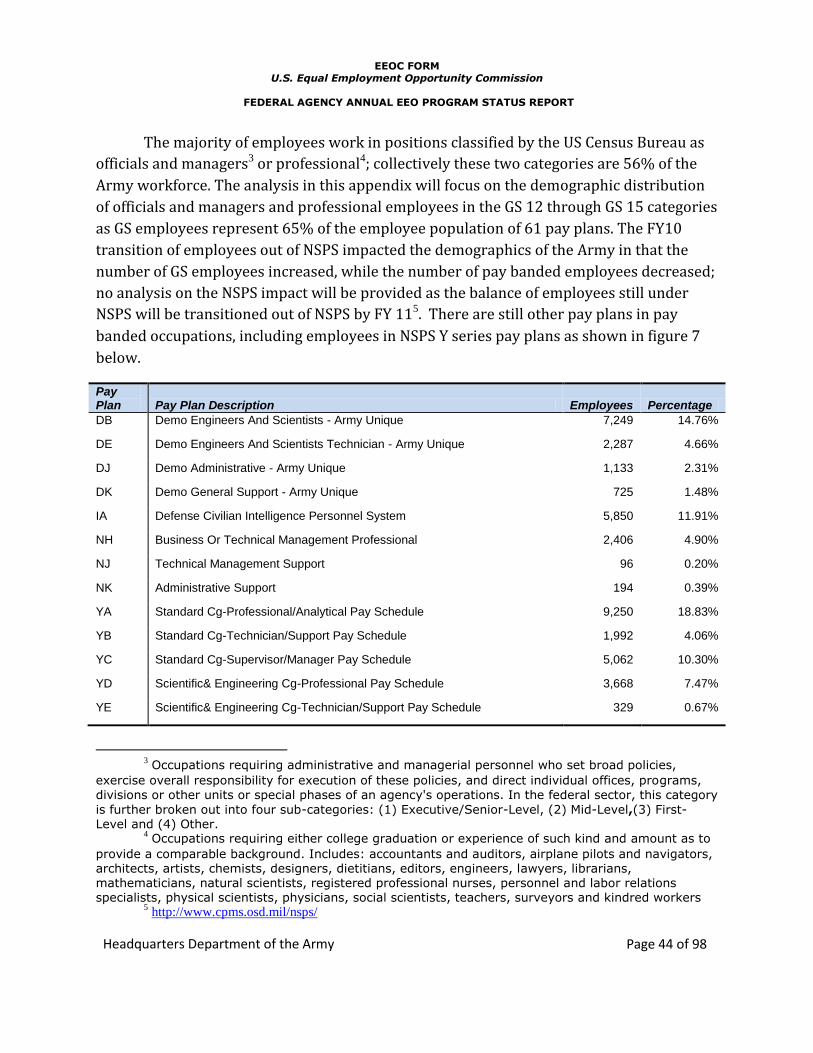
EEOC FORM
U.S. Equal Employment Opportunity Commission
FEDERAL AGENCY ANNUAL EEO PROGRAM STATUS REPORT
Headquarters Department of the Army Page 44 of 98
The majority of employees work in positions classified by the US Census Bureau as
officials and managers3 or professional4; collectively these two categories are 56% of the
Army workforce. The analysis in this appendix will focus on the demographic distribution
of officials and managers and professional employees in the GS 12 through GS 15 categories
as GS employees represent 65% of the employee population of 61 pay plans. The FY10
transition of employees out of NSPS impacted the demographics of the Army in that the
number of GS employees increased, while the number of pay banded employees decreased;
no analysis on the NSPS impact will be provided as the balance of employees still under
NSPS will be transitioned out of NSPS by FY 115. There are still other pay plans in pay
banded occupations, including employees in NSPS Y series pay plans as shown in figure 7
below.
Pay Plan Pay Plan Description Employees Percentage
DB Demo Engineers And Scientists - Army Unique 7,249 14.76%
DE Demo Engineers And Scientists Technician - Army Unique 2,287 4.66%
DJ Demo Administrative - Army Unique 1,133 2.31%
DK Demo General Support - Army Unique 725 1.48%
IA Defense Civilian Intelligence Personnel System 5,850 11.91%
NH Business Or Technical Management Professional 2,406 4.90%
NJ Technical Management Support 96 0.20%
NK Administrative Support 194 0.39%
YA Standard Cg-Professional/Analytical Pay Schedule 9,250 18.83%
YB Standard Cg-Technician/Support Pay Schedule 1,992 4.06%
YC Standard Cg-Supervisor/Manager Pay Schedule 5,062 10.30%
YD Scientific& Engineering Cg-Professional Pay Schedule 3,668 7.47%
YE Scientific& Engineering Cg-Technician/Support Pay Schedule 329 0.67%
3 Occupations requiring administrative and managerial personnel who set broad policies,
exercise overall responsibility for execution of these policies, and direct individual offices, programs,
divisions or other units or special phases of an agency's operations. In the federal sector, this category
is further broken out into four sub-categories: (1) Executive/Senior-Level, (2) Mid-Level,(3) First-Level and (4) Other.
4 Occupations requiring either college graduation or experience of such kind and amount as to
provide a comparable background. Includes: accountants and auditors, airplane pilots and navigators, architects, artists, chemists, designers, dietitians, editors, engineers, lawyers, librarians, mathematicians, natural scientists, registered professional nurses, personnel and labor relations specialists, physical scientists, physicians, social scientists, teachers, surveyors and kindred workers
5 http://www.cpms.osd.mil/nsps/

EEOC FORM
U.S. Equal Employment Opportunity Commission
FEDERAL AGENCY ANNUAL EEO PROGRAM STATUS REPORT
Headquarters Department of the Army Page 45 of 98
Pay Plan Pay Plan Description Employees Percentage
YF Scientific& Engineering Cg -Supervisor/Manager Pay Schedule 1,436 2.92%
YG Medical Cg-Physician/Dentist Pay Schedule 746 1.52%
YH Medical Cg-Professional Pay Schedule 3,326 6.77%
YI Medical Cg-Technician/Support Pay Schedule 709 1.44%
YJ Medical Cg-Supervisor/Manager Pay Schedule 821 1.67%
YK Investigative & Protective Services Cg-Investigative Pay Schedule 43 0.09%
YL Investigative & Protective Services Cg-Fire Protection Pay Schedule 37 0.08%
YM Investigative & Protective Services Cg-Police/Security Guard Pay Schedule 182 0.37%
YN Investigative & Protective Services Cg-Supervisor/Manager Pay Schedule 952 1.94%
YP Standard Cg-Student Educational Employment Program (Seep) 629 1.28%
Sum: 49,122
Figure 7
The demographic analysis of this report will be focus on employees in the
appropriated fund general schedule or equivalent pay groups. The demarcation between
temporary and permanent employees, while set in policy, is transparent in today’s civilian
workforce. The implementation of policy and programs is such that regardless of an
employee’s career status, all members of the civilian workforce are affected by the
implementation of civil rights policy and therefore will have access to EEO services.
GENERAL ANALYSIS OF THE APPLICANT POOL
The number of job applications received was approximately 4,917,802 and
delineated by Race and Ethnicity Indicators as shown in figure 8 below. The majority of
applications were submitted by white men and women followed by African American men
and women and Hispanic or Latino men and women. The number referred followed this
pattern.
Group - FY 10 Applicants Referred Selected
White Men 1,743,475 300,523 10,324
White Women 856,147 124,880 5,719
African American Men 358,810 79,851 2,021
African American Women 437,199 84,618 2,358
Hispanic or Latino Men 197,152 32,322 543

EEOC FORM
U.S. Equal Employment Opportunity Commission
FEDERAL AGENCY ANNUAL EEO PROGRAM STATUS REPORT
Headquarters Department of the Army Page 46 of 98
Group - FY 10 Applicants Referred Selected
Hispanic or Latino Women 131,891 17,642 808
Asian Men 104,943 19,297 404
Asian Women 67,037 11,103 367 Native Hawaiian or Other Pacific Islander Men 6,943 1,829 90 Native Hawaiian or Other Pacific Islander Women 7,746 1,548 59 American Indian or Alaska Native Men 12,256 3,217 142 American Indian or Alaska Native Women 10,034 2,261 88
Multiracial Men 522,108 72,991 1,027
Multiracial Women 462,061 47,469 682
Total Population 4,917,802 799,551 24,632 Figure 8
The comparison of the percentage of employees and percentage of application
submission and referral rate to the general CLF, as shown in figure 9, indicates that with
the exception of Hispanic or Latino men and women, most of the members of the other EEO
groups submit job applications at a rate less than their corresponding CLF. The selection
rate is more closely aligned to the employee population percentage even though the
difference between the application rate and referral rate for the largest EEO groups is
approximately 2%.
Group - FY 10 CLF Employees Applicants Referred Selected
White Men 39.00% 45.04% 35.45% 37.59% 41.91%
White Women 33.70% 23.64% 17.41% 15.62% 23.22%
African American Men 4.80% 8.42% 7.30% 9.99% 8.20%
African American Women 5.70% 9.26% 8.89% 10.58% 9.57%
Hispanic or Latino Men 6.20% 3.47% 4.01% 4.04% 2.20%
Hispanic or Latino Women 4.50% 1.92% 2.68% 2.21% 3.28%
Asian Men 1.90% 2.19% 2.13% 2.41% 1.64%
Asian Women 1.70% 1.80% 1.36% 1.39% 1.49%
Native Hawaiian or Other Pacific Islander Men
0.10% 0.28% 0.14% 0.23% 0.37%
Native Hawaiian or Other Pacific Islander Women
0.10% 0.24% 0.16% 0.19% 0.24%
American Indian or Alaska Native Men
0.30% 0.58% 0.25% 0.40% 0.58%
American Indian or Alaska Native Women
0.30% 0.37% 0.20% 0.28% 0.36%

EEOC FORM
U.S. Equal Employment Opportunity Commission
FEDERAL AGENCY ANNUAL EEO PROGRAM STATUS REPORT
Headquarters Department of the Army Page 47 of 98
Group - FY 10 CLF Employees Applicants Referred Selected
Multiracial Men 0.80% 1.59% 10.62% 9.13% 4.17%
Multiracial Women 0.80% 1.19% 9.40% 5.94% 2.77%
Total Population 100.00% 100.00% 100.00% 100.00%
Figure 9
When the number of applications submitted is compared to the CLF to determine the
number of applications and referrals expected from each EEO group, the number of
submissions from white men is slightly less than expected at 174, 468 while the number of
application submissions from white women is 801,152 less than expected. The data in
figure 10 shows that the number of submissions from African American men and women
surpasses expectations compared to the CLF. The number of application submissions from
Hispanic or Latino men is 107, 752 less than expected while the number of application
submissions from Hispanic or Latino women was 89, 410 less than expected. The number
of application submissions from Asian men as 11,505 more than expected, while the
number of applications from Asian women was 16, 566 less than expected. The number of
application submissions from Native Hawaiian or Other Pacific Islander men and women
was 2,000 applications more than expected, while the number of applications submitted by
American Indian or Alaska Native men and women was 2,497 and 4,719 less than expected.
Selection rates were not subjected to the comparison with the CLF as selection rates are
outside of the definition of the CLF and in addition should represent a randomized process.
Group - FY 10 Applicants Referred Selected Expected to Apply
Expected to be Referred
White Men 1,743,475 300,523 10,324 1,917,943 311,825
White Women 856,147 124,880 5,719 1,657,299 269,449
African American Men 358,810 79,851 2,021 236,054 38,378
African American Women 437,199 84,618 2,358 280,315 45,574
Hispanic or Latino Men 197,152 32,322 543 304,904 49,572
Hispanic or Latino Women 131,891 17,642 808 221,301 35,980
Asian Men 104,943 19,297 404 93,438 15,191
Asian Women 67,037 11,103 367 83,603 13,592
Native Hawaiian or Other Pacific Islander Men
6,943 1,829 90 4,918 800
Native Hawaiian or Other Pacific Islander Women
7,746 1,548 59 4,918 800
American Indian or Alaska Native Men
12,256 3,217 142 14,753 2,399
American Indian or Alaska 10,034 2,261 88 14,753 2,399

EEOC FORM
U.S. Equal Employment Opportunity Commission
FEDERAL AGENCY ANNUAL EEO PROGRAM STATUS REPORT
Headquarters Department of the Army Page 48 of 98
Group - FY 10 Applicants Referred Selected Expected to Apply
Expected to be Referred
Native Women
Multiracial Men 522,108 72,991 1,027 39,342 6,396
Multiracial Women 462,061 47,469 682 39,342 6,396
Total Population 4,917,802 799,551 24,632
Figure 10
The analysis of data indicating the percentage of those applications that were
referred shows that overall the median percentage of the applications submitted that were
referred for selection was 17.81%. Comparatively, 17.24 % of applications submitted by
white men were referred for selection, while 14.59% of the applications submitted by
White women were referred for selection. Of the EEO groups with large populations,
African American men and women had the highest rate of applications submitted that were
referred with 22.25% and 19.35% respectively. The submission to referral rate for
Hispanic or Latino men and women were below the median rate of 17.81%.
The overall median percentage rate that applications that were referred resulted in
selection was 0.20%. The percentage of those who applied for positions and were referred,
as shown in figure 11, indicates that of the EEO groups with the larger populations, that
African American men and women who applied for positions were referred at a higher rate
than members of the other large EEO groups. The data shows that 22.25% of the
applications received from African American men and 19.35% of African American women
were referred for selection when compared to the overall median rate of 17.81%.
Comparatively, women in larger EEO groups that applied were referred at a rate less than
men within the same EEO group.
Group - FY 10 Applied - Referred
Referred - Selected
White Men 17.24% 3.44%
White Women 14.59% 1.90%
African American Men 22.25% 0.67%
African American Women 19.35% 0.78%
Hispanic or Latino Men 16.39% 0.18%
Hispanic or Latino Women 13.38% 0.27%
Asian Men 18.39% 0.13%
Asian Women 16.56% 0.12%
Native Hawaiian or Other
Pacific Islander Men
26.34% 0.03%

EEOC FORM
U.S. Equal Employment Opportunity Commission
FEDERAL AGENCY ANNUAL EEO PROGRAM STATUS REPORT
Headquarters Department of the Army Page 49 of 98
Group - FY 10 Applied - Referred
Referred - Selected
Native Hawaiian or Other
Pacific Islander Women
19.98% 0.02%
American Indian or Alaska
Native Men
26.25% 0.05%
American Indian or Alaska
Native Women
22.53% 0.03%
Multiracial Men 13.98% 0.34%
Multiracial Women 10.27% 0.23%
Total Population
Figure 11
The median rate of applications that were referred to the selection process was
0.20%. The percentage of applications referred to the selection process from white men
was 3.44% as figure 11 indicates, followed by white women. Even though 22.5% of
applications from African American Men and women were the highest of any of the large
EEO groups, the applications referred for selection were 0.67% and 0.78% respectively.
The difference in the rates between White men and African American men was 2.76% and
1.12% between White women and African American women. The difference was greater
for other members of the larger EEO groups and White men and women even though the
average rate among the larger EEO groups was 1.05%.
Summary
The general applicant pool data infers that if the percentage of applications received
from EEO groups is within or greater than the expected parameters of the CLF, then the
overall Army population will begin to reflect the CLF. Adverse impact analysis was not
performed because the context within which the selection process occurred is controlled
by local not Army wide circumstances. There appears to be no barriers to the general
applicant data except that the selection rate data requires greater data mining in order to
find out if there are any underlying issues.
GS 12-15 POPULATION ANALYSIS
The GS 12 – 15 data analysis is provided because this grade group constitutes the
primary professional path for movement into the primary leadership population. The
analysis will include an analysis of the GS 12-15 population and associated data groups to
include applicant pool data, supervisory levels to determine global issues if they are
present. Following the general analysis, a more specific analysis will be provided for GS 12-

EEOC FORM
U.S. Equal Employment Opportunity Commission
FEDERAL AGENCY ANNUAL EEO PROGRAM STATUS REPORT
Headquarters Department of the Army Page 50 of 98
15 for the officials and managers and professionals categories respectively, since the
population in these categories are the largest.
The percentage of employees in pay grades GS 12-15 are shown in figure 12. The
largest EEO groups in this category in grades GS 12-15 are White men and women,
followed by African Americans and Hispanic or Latino men and women.
Group - FY 10 12 13 14 15 CLF White Men 49% 55% 58% 63% 39.00%
White Women 23% 21% 20% 19% 33.70%
African American Men 7% 7% 6% 5% 4.80%
African American Women 7% 6% 5% 4% 5.70%
Hispanic or Latino Men 3% 2% 2% 2% 6.20%
Hispanic or Latino Women 2% 1% 1% 1% 4.50%
Asian Men 3% 3% 3% 3% 1.90%
Asian Women 2% 1% 1% 1% 1.70%
Native Hawaiian or Other Pacific Islander Men
1% 0% 0% 0% 0.10%
Native Hawaiian or Other Pacific Islander Women
0% 0% 0% 0% 0.10%
American Indian or Alaska Native Men
1% 1% 0% 0% 0.30%
American Indian or Alaska Native Women
0% 0% 0% 0% 0.30%
Multiracial Men 2% 2% 1% 1% 0.80%
Multiracial Women 1% 1% 1% 0% 0.80%
Total Population 100% 100% 100% 100%
Figure 12
When compared to the CLF, figure 13 shows how each EEO group compares with
the CLF by grade. At grade 12, the population of White women, Hispanic or Latino men and
women are less than expected, while the population the other EEO groups in pay grade 13
are as expected. From grade 13 to grade 15, the evaluation of the populations by grade and
compared to the CLF changes, except for White men; that population remains as expected
while the population expectations of other EEO groups change depending on the pay grade.

EEOC FORM
U.S. Equal Employment Opportunity Commission
FEDERAL AGENCY ANNUAL EEO PROGRAM STATUS REPORT
Headquarters Department of the Army Page 51 of 98
CLF Evaluation
Group - FY 10 12 13 14 15
White Men As Expected As Expected As Expected
As Expected
White Women Less Than Expected
Less Than Expected
Less Than Expected
Less Than Expected
African American Men As Expected As Expected Less Than Expected
Less Than Expected
African American Women As Expected Less Than Expected
Less Than Expected
Less Than Expected
Hispanic or Latino Men Less Than Expected
Less Than Expected
Less Than Expected
Less Than Expected
Hispanic or Latino Women
Less Than Expected
Less Than Expected
Less Than Expected
Less Than Expected
Asian Men As Expected As Expected As Expected
As Expected
Asian Women Less Than Expected
Less Than Expected
Less Than Expected
Less Than Expected
Native Hawaiian or Other Pacific Islander Men
As Expected As Expected As Expected
Less Than Expected
Native Hawaiian or Other Pacific Islander Women
As Expected As Expected Less Than Expected
Less Than Expected
American Indian or Alaska Native Men
As Expected As Expected As Expected
As Expected
American Indian or Alaska Native Women
Less Than Expected
Less Than Expected
Less Than Expected
As Expected
Multiracial Men As Expected As Expected As Expected
Less Than Expected
Multiracial Women Less Than Expected
As Expected Less Than Expected
Less Than Expected
Figure 13
Based on the distribution of EEO groups using the CLF, the expected population is
also shown in figure 14. The number of White men would expectedly be smaller while the
number of employees in other EEO groups would expectedly be larger or smaller,
depending on the pay grade. At the GS 12 level, the number of White women and Hispanic
or Latino men and women would be larger if the population matched the CLF while the
population of other EEO groups would be smaller.
Group - FY 10 12 13 14 15 Expected 12 13 14 15
White Men 16,511 13,300 5,188 1,908 13,147 9,505 3,487 1,179
White Women 7,761 5,105 1764 576 11,360 8,214 3,013 1,019
African American Men
2,508 1,709 570 140 1,618 1,170 429 145
African American 2,504 1,535 472 109 1,921 1,389 510 172

EEOC FORM
U.S. Equal Employment Opportunity Commission
FEDERAL AGENCY ANNUAL EEO PROGRAM STATUS REPORT
Headquarters Department of the Army Page 52 of 98
Group - FY 10 12 13 14 15 Expected 12 13 14 15
Women
Hispanic or Latino Men
1,047 585 205 60 2,090 1,511 554 187
Hispanic or Latino Women
508 262 85 31 1,517 1,097 402 136
Asian Men 1,034 749 269 81 640 463 170 57
Asian Women 520 304 105 34 573 414 152 51
Native Hawaiian or Other Pacific Islander Men
201 43 18 4 34 24 9 3
Native Hawaiian or Other Pacific Islander Women
44 25 10 3 34 24 9 3
American Indian or Alaska Native Men
186 138 39 15 101 73 27 9
American Indian or Alaska Native Women
107 48 16 5 101 73 27 9
Multiracial Men 517 384 127 43 270 195 72 24
Multiracial Women 261 186 74 14 270 195 72 24
Total Population 33,709 24,373 8942 3023 33,675 24,349 8,933 3,020
Figure 14
Statistics reflecting the number of employees in particular categories on an Army-
wide basis does not account for local conditions that impact recruitment and retention
strategies. For example, although the Army population of Hispanic or Latino employees is
less than expected based upon the CLF, this evaluation does not reflect local conditions
found in other Army locations. This means that coordinated Army-wide strategies related
to recruitment and retention of Hispanic or Latino men and women has to include the
impact of local hiring conditions. To demonstrate this point, the sample of Hispanic or
Latino employee populations shown in figure 15 reflects the variation in local populations
of Hispanic or Latino employees in the locations shown. The CLF for locations in Texas and
New Mexico have a higher CLF than employees in Georgia, and therefore different
strategies might need to be employed in each state. Even within the same state, the CLF
populations vary widely. These illustrate a need to increase the visibility of local issues
because the culmination of those issues impacts coordinated Army-wide efforts.
Group Location Population Percentage CLF
Hispanic or Latino Men Ft Sam Houston, TX 732 9.57% 25.4%
Ft. Bliss, TX 599 16.21% 15.9%
White Sands Missile Range, NM
589 31.16% 21.0%
Ft. Benning, GA 81 2.48% 1.9%

EEOC FORM
U.S. Equal Employment Opportunity Commission
FEDERAL AGENCY ANNUAL EEO PROGRAM STATUS REPORT
Headquarters Department of the Army Page 53 of 98
Group Location Population Percentage CLF
Hispanic or Latino Women
Ft Sam Houston, TX 651 8.51% 22.3%
Ft. Bliss, TX 423 11.44% 11.5%
White Sands Missile Range, NM
181 9.58% 18.0%
Ft. Benning, GA 74 2.26% 1.6%
Figure 15
The over arching strategy will be to identify locations that have the greatest challenges and
provide policy and programmatic assistance towards the model program goals expressed
in the six essential elements.
SUPERVISORS
The overall population of supervisors in pay grades GS 12-15 is depicted in figure
16. This population includes supervisors in all EEOC categories and is not limited to the
officials and managers category. The general CLF is used since the population includes
more than officials and managers or professionals. White men comprise the largest EEO
population of supervisors in grades 12 – 15, followed by White women and African
Americans, Hispanic or Latino men and women as well as members of other EEO groups.
Percentage 12 13 14 15 Totals CLF GEN
White Men 51% 56% 61% 65% 57% 39.00%
White Women 20% 21% 19% 18% 20% 33.70%
African American Men 10% 7% 6% 5% 7% 4.80%
African American Women
6% 5% 4% 4% 5% 5.70%
Hispanic or Latino Men
4% 3% 2% 2% 3% 6.20%
Hispanic or Latino Women
1% 1% 1% 1% 1% 4.50%
Asian Men 2% 2% 2% 2% 2% 1.90%
Asian Women 1% 1% 1% 1% 1% 1.70%
Native Hawaiian or Other Pacific Islander Men
0% 0% 0% 0% 0% 0.10%
Native Hawaiian or Other Pacific Islander Women
0% 0% 0% 0% 0% 0.10%

EEOC FORM
U.S. Equal Employment Opportunity Commission
FEDERAL AGENCY ANNUAL EEO PROGRAM STATUS REPORT
Headquarters Department of the Army Page 54 of 98
Percentage 12 13 14 15 Totals CLF GEN
American Indian or Alaska Native Men
1% 1% 0% 0% 1% 0.30%
American Indian or Alaska Native Women
0% 0% 0% 0% 0% 0.30%
Multiracial Men 2% 2% 2% 2% 2% 0.80%
Multiracial Women 0% 1% 1% 0% 1% 0.80%
Total Population 100% 100% 100% 100% 100%
Figure 16
The number of supervisors expected by comparing the total supervisory population to the
general CLF is shown in figure 17. The variation by pay grade indicates that a variety of
career program issues have to be analyzed with the respective career program managers in
order to determine which barriers exist and can be acted on.
Group - FY 10 12 13 14 15 Totals Expected 12 13 14 15
White Men 2,303 4,134 2,935 1,471 10,843 1,763 2,864 1,889 884
White Women 906 1,529 911 412 3,758 1,523 2,475 1,632 764
African American Men 443 501 313 112 1,369 217 352 233 109
African American Women 293 361 205 84 943 258 419 276 129
Hispanic or Latino Men 196 203 118 41 558 280 455 300 141
Hispanic or Latino Women 66 83 46 21 216 203 330 218 102
Asian Men 85 168 115 44 412 86 140 92 43
Asian Women 50 78 36 17 181 77 125 82 39
Native Hawaiian or Other Pacific Islander Men
15 14 9 3 41 5 7 5 2
Native Hawaiian or Other Pacific Islander Women
6 12 4 3 25 5 7 5 2
American Indian or Alaska Native Men
33 61 22 8 124 14 22 15 7
American Indian or Alaska Native Women
14 21 7 5 47 14 22 15 7
Multiracial Men 88 119 84 37 328 36 59 39 18
Multiracial Women 22 59 39 9 129 36 59 39 18
Total Population 4,520 7,343 4844 2267 18,974 4,515 7,336 4,839 2,265
Figure 17
Applicant Pool GS 12-15
The data on the applicant pool for GS 12-15 positions is provided in figure 18 which
shows the data on applications received from each EEO group for supervisory positions.
The majority of applications received from members of EEO groups were from White men
followed by White women. The percentage of applications received from white men was
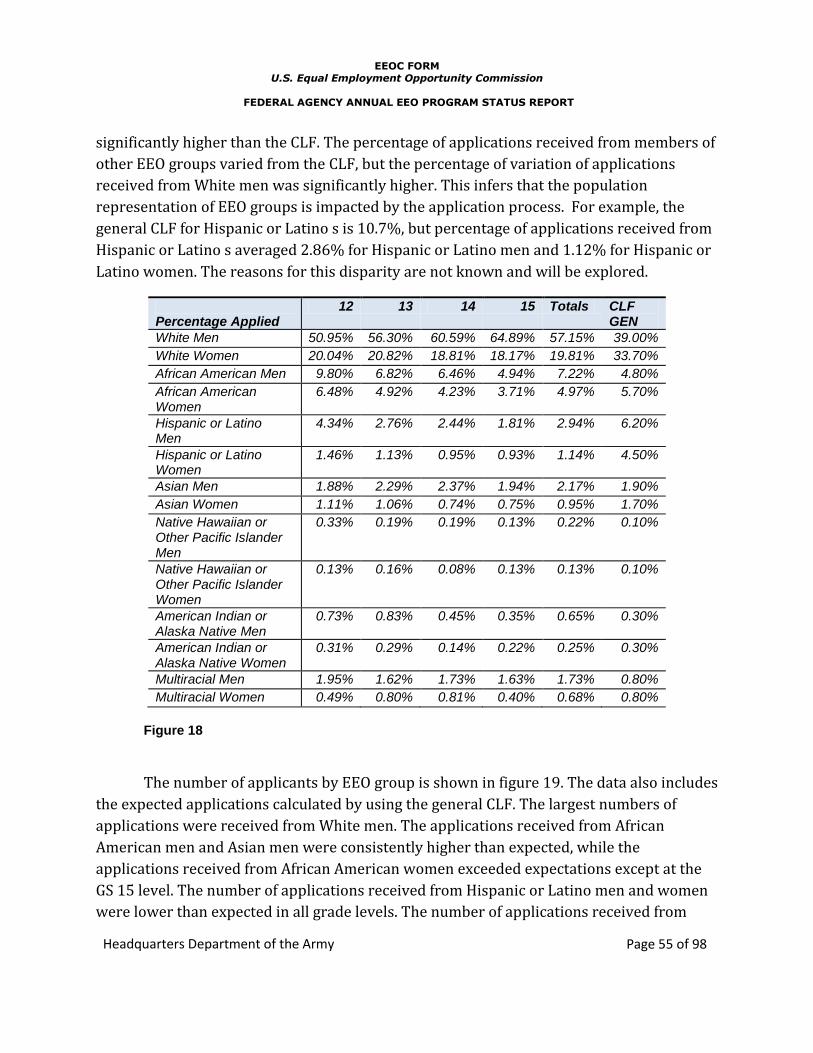
EEOC FORM
U.S. Equal Employment Opportunity Commission
FEDERAL AGENCY ANNUAL EEO PROGRAM STATUS REPORT
Headquarters Department of the Army Page 55 of 98
significantly higher than the CLF. The percentage of applications received from members of
other EEO groups varied from the CLF, but the percentage of variation of applications
received from White men was significantly higher. This infers that the population
representation of EEO groups is impacted by the application process. For example, the
general CLF for Hispanic or Latino s is 10.7%, but percentage of applications received from
Hispanic or Latino s averaged 2.86% for Hispanic or Latino men and 1.12% for Hispanic or
Latino women. The reasons for this disparity are not known and will be explored.
Percentage Applied
12 13 14 15 Totals CLF GEN
White Men 50.95% 56.30% 60.59% 64.89% 57.15% 39.00%
White Women 20.04% 20.82% 18.81% 18.17% 19.81% 33.70%
African American Men 9.80% 6.82% 6.46% 4.94% 7.22% 4.80%
African American Women
6.48% 4.92% 4.23% 3.71% 4.97% 5.70%
Hispanic or Latino Men
4.34% 2.76% 2.44% 1.81% 2.94% 6.20%
Hispanic or Latino Women
1.46% 1.13% 0.95% 0.93% 1.14% 4.50%
Asian Men 1.88% 2.29% 2.37% 1.94% 2.17% 1.90%
Asian Women 1.11% 1.06% 0.74% 0.75% 0.95% 1.70%
Native Hawaiian or Other Pacific Islander Men
0.33% 0.19% 0.19% 0.13% 0.22% 0.10%
Native Hawaiian or Other Pacific Islander Women
0.13% 0.16% 0.08% 0.13% 0.13% 0.10%
American Indian or Alaska Native Men
0.73% 0.83% 0.45% 0.35% 0.65% 0.30%
American Indian or Alaska Native Women
0.31% 0.29% 0.14% 0.22% 0.25% 0.30%
Multiracial Men 1.95% 1.62% 1.73% 1.63% 1.73% 0.80%
Multiracial Women 0.49% 0.80% 0.81% 0.40% 0.68% 0.80%
Figure 18
The number of applicants by EEO group is shown in figure 19. The data also includes
the expected applications calculated by using the general CLF. The largest numbers of
applications were received from White men. The applications received from African
American men and Asian men were consistently higher than expected, while the
applications received from African American women exceeded expectations except at the
GS 15 level. The number of applications received from Hispanic or Latino men and women
were lower than expected in all grade levels. The number of applications received from

EEOC FORM
U.S. Equal Employment Opportunity Commission
FEDERAL AGENCY ANNUAL EEO PROGRAM STATUS REPORT
Headquarters Department of the Army Page 56 of 98
Asian women was lower than expected. In most cases, the number of applications received
from women was lower than expected.
Group - FY 10 – Applied
12 13 14 15 Totals Expected To Apply
12 13 14 15
White Men 263,101 195,468 72,532 18,583 549,684 210,589 156,319 62,543 13,735
White Women 78,059 50,049 17,605 3,514 149,227 181,970 135,076 54,044 11,868
African American Men
63,119 46,458 17,481 2,879 129,937 25,919 19,239 7,698 1,690
African American Women
48,672 32,642 12,724 1,786 95,824 30,778 22,847 9,141 2,007
Hispanic or Latino Men
26,535 17,075 5,155 1,258 50,023 33,478 24,851 9,943 2,184
Hispanic or Latino Women
9,304 4,905 1,776 220 16,205 24,299 18,037 7,217 1,585
Asian Men 19,642 16,923 5,928 1,015 43,508 10,259 7,616 3,047 669
Asian Women 6,736 4,496 1,558 217 13,007 9,180 6,814 2,726 599
Native Hawaiian or Other Pacific Islander Men
1,100 628 288 72 2,088 540 401 160 35
Native Hawaiian or Other Pacific Islander Women
709 479 146 24 1,358 540 401 160 35
American Indian or Alaska Native Men
2,192 1,781 674 132 4,779 1,620 1,202 481 106
American Indian or Alaska Native Women
1,071 832 422 45 2,370 1,620 1,202 481 106
Multiracial Men 11,340 19,896 15,765 3,974 50,975 4,320 3,207 1,283 282
Multiracial Women 8,391 9,187 8,313 1,499 27,390 4,320 3,207 1,283 282
Total Population 539,971 400,819 160,367 35,218 1,136,375
539,431 400,418 160,207
35,144
Figure 19
The percentage of applications referred by EEO group is shown in figure 20. The
highest number of referrals was for White men and whose referral rate was higher than the
CLF. The CLF is used as a standard of comparison because of the automated nature of
Resumix which allows automated referral list generation. The percentage of White women
referred was higher than the rate of African American men and women, but still below the
general CLF. The percentage of men being referred was generally higher than their
corresponding CLF compared to the referral rate for women which was generally lower
than their corresponding CLF. The referral rate for Hispanic or Latino men and women was
lower than their corresponding CLF, but the referral rate for Asian men was higher than
their CLF. The referral rate for American Indian or Alaska Native men was marginally
higher than their CLF.

EEOC FORM
U.S. Equal Employment Opportunity Commission
FEDERAL AGENCY ANNUAL EEO PROGRAM STATUS REPORT
Headquarters Department of the Army Page 57 of 98
Group - FY 10 Referred
12 13 14 15 Total General CLF
White Men 47.83% 46.57% 45.44% 52.89% 47.15% 39.00%
White Women 15.19% 13.61% 12.47% 11.94% 14.07% 33.70%
African American Men 13.15% 11.97% 11.13% 8.51% 12.24% 4.80%
African American Women
10.22% 9.58% 9.03% 6.23% 9.67% 5.70%
Hispanic or Latino Men
4.57% 3.46% 3.22% 3.16% 3.90% 6.20%
Hispanic or Latino Women
1.59% 1.14% 1.21% 0.41% 1.33% 4.50%
Asian Men 4.29% 4.67% 3.79% 2.86% 4.31% 1.90%
Asian Women 1.50% 1.31% 1.11% 0.65% 1.34% 1.70%
Native Hawaiian or Other Pacific Islander Men
0.28% 0.21% 0.23% 0.28% 0.24% 0.10%
Native Hawaiian or Other Pacific Islander Women
0.11% 0.09% 0.12% 0.13% 0.10% 0.10%
American Indian or Alaska Native Men
0.59% 0.58% 0.45% 0.43% 0.56% 0.30%
American Indian or Alaska Native Women
0.31% 0.27% 0.37% 0.11% 0.30% 0.30%
Multiracial Men 0.38% 4.37% 7.28% 9.08% 3.22% 0.80%
Multiracial Women 0.00% 2.16% 4.14% 3.34% 1.55% 0.80%
Total Population 100.00% 100.00% 100.00% 100.00% 100.00%
Figure 20
The number of referrals and selections are combined in figure 21. The largest
number of referrals was for white men as well as the largest number of selections. No
predictors are used to project the number of selections expected because of the random
nature of the selection process. It is noted that the difference in the number of referrals
between White women and African Americans is measured in thousands while the
difference in referrals between White men and any other group is measured in tens of
thousands. Nearly half of the referrals were for White men.
Group - FY 10- Referred
12 13 14 15 Total Selected 12 13 14 15 Total
White Men 50,895 42,719 16751 4178 114,543 1463 983 262 50 2,758
White Women 16,163 12,486 4597 943 34,189 712 505 106 21 1,344
African American Men
13,992 10,977 4103 672 29,744 229 155 40 5 429
African American Women
10,872 8,793 3329 492 23,486 246 150 37 2 435
Hispanic or Latino Men
4,863 3,177 1187 250 9,477 65 46 15 3 129

EEOC FORM
U.S. Equal Employment Opportunity Commission
FEDERAL AGENCY ANNUAL EEO PROGRAM STATUS REPORT
Headquarters Department of the Army Page 58 of 98
Group - FY 10- Referred
12 13 14 15 Total Selected 12 13 14 15 Total
Hispanic or Latino Women
1,694 1,046 447 32 3,219 41 18 4 1 64
Asian Men 4,567 4,283 1396 226 10,472 82 66 16 0 164
Asian Women 1,593 1,204 411 51 3,259 44 33 6 0 83
Native Hawaiian or Other Pacific Islander Men
295 191 85 22 593 6 0 1 0 7
Native Hawaiian or Other Pacific Islander Women
115 84 44 10 253 1 9 3 0 13
American Indian or Alaska Native Men
625 536 165 34 1,360 19 8 0 0 27
American Indian or Alaska Native Women
334 252 138 9 733 9 0 2 0 11
Multiracial Men 408 4,012 2,685 717 7,822 3 49 15 4 71
Multiracial Women 0 1,980 1,526 264 3,770 0 19 4 0 23
Total Population 106,416 91,740 36,864 7,900 242,920 2,920 2,041 511 86 5,558
Figure 21
The percentage of selections for EEO groups is shown in figure 22. Predictably, the
largest number of selections made at all grade levels was for White men. The predictability
of this data stems from applicant and referral data that indicates that White men are the
largest group of applicants and referees. The selection rate for White women is the second
highest, followed by African American women. Although African American men applied and
were referred at a rate higher than African American men, African American women were
selected at a higher rate.
Group - FY 10 12 13 14 15 Total
White Men 50.10% 48.16% 51.27% 58.14% 49.62%
White Women 24.38% 24.74% 20.74% 24.42% 24.18%
African American Men 7.84% 7.59% 7.83% 5.81% 7.72%
African American Women
8.42% 7.35% 7.24% 2.33% 7.83%
Hispanic or Latino Men
2.23% 2.25% 2.94% 3.49% 2.32%
Hispanic or Latino Women
1.40% 0.88% 0.78% 1.16% 1.15%
Asian Men 2.81% 3.23% 3.13% 0.00% 2.95%
Asian Women 1.51% 1.62% 1.17% 0.00% 1.49%
Native Hawaiian or Other Pacific Islander Men
0.21% 0.00% 0.20% 0.00% 0.13%
Native Hawaiian or 0.03% 0.44% 0.59% 0.00% 0.23%

EEOC FORM
U.S. Equal Employment Opportunity Commission
FEDERAL AGENCY ANNUAL EEO PROGRAM STATUS REPORT
Headquarters Department of the Army Page 59 of 98
Group - FY 10 12 13 14 15 Total
Other Pacific Islander Women
American Indian or Alaska Native Men
0.65% 0.39% 0.00% 0.00% 0.49%
American Indian or Alaska Native Women
0.31% 0.00% 0.39% 0.00% 0.20%
Multiracial Men 0.10% 2.40% 2.94% 4.65% 1.28%
Multiracial Women 0.00% 0.93% 0.78% 0.00% 0.41%
Total Population 100.00% 100.00% 100.00% 100.00% 100.00%
Figure 22
The applicant pool data infers that greater analysis should be performed on the
applicant data for EEO groups in grades 12-15. The data indicating that White men were
selected at a rate higher than any other group appears to be based on the data indicating
that White men are the largest group of applicants and therefore the largest group of those
referred. The primary trigger is that the selection rate for African American men is lower
than for groups that had a lower rate of applications and referrals. In addition, the
application rate for Hispanic or Latino men and women is less than expected based upon
the CLF which will require analysis of the outreach process to identify barriers within the
application process.
OFFICIALS AND MANAGERS
Officials and managers comprise the largest population of employees within the
nine EEOC categories. This category, as defined by EEOC, includes administrative and
managerial personnel who set broad policies, exercise overall responsibility for execution
of these policies, and direct individual offices, programs, divisions or other units or special
phases of an agency's operations. The analysis of this population will use the nationwide
officials and managers CLF rather than the general CLF.
The population of employees classified as officials and managers in pay grades GS
12-15 is show in figure 23. The population representation changes as the grades increase.
The pay plans ES and IE, the traditional senior executive service and intelligence executives
are included in this data. The percentage of white men in the GS 12 and 13 pay grades is
less than expected, while the representation of white men at the GS 14, 15, and SES level is
greater than expected based upon the officials and managers CLF. The representation of
African-American men and women is greater than expected at all grade levels. The
representation of the Hispanic or Latino men and women is lower than expected at all

EEOC FORM
U.S. Equal Employment Opportunity Commission
FEDERAL AGENCY ANNUAL EEO PROGRAM STATUS REPORT
Headquarters Department of the Army Page 60 of 98
grade levels as well as in the senior executive service. The percentage of Asian men is less
than expected, except at the GS 14 and senior executive level. The percentages of
individuals in the smaller populations of EEO groups are generally less than expected, with
the exception of American Indian or Alaska Native men and women.
Officials and Managers FY 10
12 13 14 15 ES/IE Totals OM CLF
White Men 43.05% 47.05% 62.57% 29.95% 74.43% 46.66% 52.10%
White Women 26.01% 24.79% 8.08% 36.09% 14.77% 23.62% 30.60%
African American Men 10.10% 9.43% 9.47% 10.65% 4.55% 9.77% 2.80%
African American Women
9.64% 9.29% 8.33% 7.89% 1.14% 9.26% 3.50%
Hispanic or Latino Men
2.86% 2.23% 2.50% 3.51% 0.57% 2.59% 3.30%
Hispanic or Latino Women
1.90% 1.44% 1.44% 2.26% 0.00% 1.68% 2.40%
Asian Men 1.56% 1.45% 1.69% 3.26% 2.27% 1.59% 2.10%
Asian Women 1.44% 1.15% 1.22% 1.25% 1.14% 1.30% 1.30%
Native Hawaiian or Other Pacific Islander Men
0.39% 0.21% 0.28% 0.25% 0.00% 0.31% 0.00%
Native Hawaiian or Other Pacific Islander Women
0.18% 0.13% 0.17% 0.25% 0.00% 0.16% 0.00%
American Indian or Alaska Native Men
0.56% 0.65% 0.58% 0.75% 0.57% 0.60% 0.20%
American Indian or Alaska Native Women
0.41% 0.27% 0.31% 0.38% 0.57% 0.35% 0.20%
Multiracial Men 1.01% 0.96% 2.00% 3.13% 0.00% 1.16% 0.70%
Multiracial Women 0.90% 0.94% 1.36% 0.38% 0.00% 0.95% 0.50%
Total Population 100% 100% 100% 100% 100% 100%
Figure 23
The population of EEO groups is shown in figure 24. Based on the relationship with
the civilian labor force statistic for officials and managers, the expected population is also
depicted in figure 25. The population of white men relative to their expected population
indicates that at all grade levels expected population of white men is much lower than the
actual population. The population of African-American men meets the expectation of the
officials and managers category, while the population of African-American women meets
the population expectations with the exception of the Senior Executive Service (SES) and
intelligence executives. The population of Hispanic or Latino s and Asian men and women
does not meet the population expected for officials and managers. The population of the
smaller EEO groups varies relative to the officials and managers civilian labor force statistic

EEOC FORM
U.S. Equal Employment Opportunity Commission
FEDERAL AGENCY ANNUAL EEO PROGRAM STATUS REPORT
Headquarters Department of the Army Page 61 of 98
and their expectations also vary because of their smaller representation in the civilian
labor force statistic.
Group FY 10 12 13 14 15 ES/IE Totals Expected 12 13 14 15 ES/IE
White Men 6,333 5,054 2,253 239 131 14,010 7,664 5,597 1,876 416 92
White Women 3,826 2,663 291 288 26 7,094 4,502 3,287 1,102 244 54
African American Men
1,486 1,013 341 85 8 2,933 412 301 101 22 5
African American Women
1,418 998 300 63 2 2,781 515 376 126 28 6
Hispanic or Latino Men
420 240 90 28 1 779 485 354 119 26 6
Hispanic or Latino Women
279 155 52 18 0 504 353 258 86 19 4
Asian Men 229 156 61 26 4 476 309 226 76 17 4
Asian Women 212 123 44 10 2 391 191 140 47 10 2
Native Hawaiian or Other Pacific Islander Men
58 23 10 2 0 93 0 0 0 0 0
Native Hawaiian or Other Pacific Islander Women
26 14 6 2 0 48 0 0 0 0 0
American Indian or Alaska Native Men
82 70 21 6 1 180 29 21 7 2 0
American Indian or Alaska Native Women
61 29 11 3 1 105 29 21 7 2 0
Multiracial Men 148 103 72 25 0 348 103 75 25 6 1
Multiracial Women 133 101 49 3 0 286 74 54 18 4 1
Total Population 14,711 10,742 3,601 798 176 30,028 14,679 10,723 3,604 811 0
Figure 24
Officials and Managers – Supervisors
The distribution of EEO groups in supervisory positions within the officials and
managers category is shown in figure 25. The percentage of white men in supervisory
positions exceeds the officials and managers CLF. The representation of African-American
men and women exceeds the officials and managers expect CLF at all grade levels. Hispanic
or Latino men and women meet or exceed this CLF expectation only in grades GS 12 and
13; they did not meet the CLF expectation in grades 14 and 15. Asian men and women meet
the CLF expectation only in grade 12. The remaining EEO group representations meet the
CLF expectations, but the populations are small.
Group FY 09 12 13 14 15 OM CLF
White Men 46% 50% 57% 63% 52.10%
White Women 22% 23% 21% 19% 30.60%
African American Men 10% 9% 7% 6% 2.80%
African American Women
7% 6% 5% 4% 3.50%

EEOC FORM
U.S. Equal Employment Opportunity Commission
FEDERAL AGENCY ANNUAL EEO PROGRAM STATUS REPORT
Headquarters Department of the Army Page 62 of 98
Group FY 09 12 13 14 15 OM CLF
Hispanic or Latino Men
5% 3% 2% 2% 3.30%
Hispanic or Latino Women
2% 2% 1% 1% 2.40%
Asian Men 2% 1% 1% 2% 2.10%
Asian Women 2% 1% 1% 1% 1.30%
Native Hawaiian or Other Pacific Islander Men
0% 0% 0% 0% 0.00%
Native Hawaiian or Other Pacific Islander Women
0% 0% 0% 0% 0.00%
American Indian or Alaska Native Men
1% 1% 1% 0% 0.20%
American Indian or Alaska Native Women
0% 0% 0% 0% 0.20%
Multiracial Men 2% 2% 2% 2% 0.70%
Multiracial Women 1% 1% 1% 1% 0.50%
Total Population 100% 100% 100% 100%
Figure 25
The population of EEO groups in supervisory positions within the officials and
managers category is shown in figure 26. Based on a comparison with the officials and
managers CLF, the expected population of supervisors is also shown in figure 27. The
population of white men in supervisory positions is less than the expected population of
officials and managers at the GS 12 level; however, the population of white men in
supervisory positions in grades 13 through 15 is greater than expected. The population of
white women in supervisory positions is less than expected in all pay grades, while the
population of African-Americans in supervisory positions is greater than expected. The
number of Hispanic or Latino men in pay grades GS 12 is greater than expected, but is less
than expected in all other pay grades. The number of Hispanic or Latino women is less than
expected in all supervisory pay grades. The population of Asian men in supervisory
positions is less than expected in all pay grades, but the population of Asian women meets
the expectations in pay grades 12 and 13. The number of individuals in the remaining EEO
groups tends to meet the expected population because of the small civilian labor force
statistic.

EEOC FORM
U.S. Equal Employment Opportunity Commission
FEDERAL AGENCY ANNUAL EEO PROGRAM STATUS REPORT
Headquarters Department of the Army Page 63 of 98
Group FY 09 12 13 14 15 Totals Expected 12 13 14 15
White Men 1,079 1,639 1,437 834 4,989 1,217 1,711 1,323 695
White Women 524 767 546 257 2,094 715 1,005 777 408
African American Men 235 290 188 78 791 65 92 71 37
African American Women
159 206 121 53 539 82 115 89 47
Hispanic or Latino Men 120 87 62 21 290 77 108 84 44
Hispanic or Latino Women
40 51 25 15 131 56 79 61 32
Asian Men 43 49 33 22 147 49 69 53 28
Asian Women 36 42 26 10 114 30 43 33 17
Native Hawaiian or Other Pacific Islander Men
8 6 5 2 21 0 0 0 0
Native Hawaiian or Other Pacific Islander Women
2 6 1 2 11 0 0 0 0
American Indian or Alaska Native Men
17 34 13 6 70 5 7 5 3
American Indian or Alaska Native Women
9 11 5 3 28 5 7 5 3
Multiracial Men 49 63 54 22 188 16 23 18 9
Multiracial Women 15 33 24 9 81 12 16 13 7
Total Population 2,336 3,284 2,540 1,334 9,494 2,341 3,287 2,546 1,345
Figure 26
Officials and Managers – Applicant Pool Analysis
The number of applications received for positions in the officials and managers
category is shown on figure 28. In addition, the number of applications expected based on
the relationship with the officials and managers CLF is also shown in figure 27. Within each
grade level, the largest number of applications received was from white men; the numbers
of applications received from African-American men were nearly as many as those received
from white women in most grade levels. For example, in pay grades 12, 13 and 14, the
number of applications received from African-American men was greater than those
received from White women. The exception was a great 15 in which the number of
applications received from White women exceeded those of African-American men.
The number of applications received from white men exceeded the expectations in
all pay grades, while the number of applications received from White women was
significantly less than expected. At all grade levels, the number of applications received
from African-Americans exceeded expectations. With the exception of pay grade 15, the
number of applications received from Hispanic or Latino men exceeded the expectations at
all grade levels. The applications received from Asian men at grade 12 and 13 exceeded
expectations, but fell below expectations at grades 14 and 15.

EEOC FORM
U.S. Equal Employment Opportunity Commission
FEDERAL AGENCY ANNUAL EEO PROGRAM STATUS REPORT
Headquarters Department of the Army Page 64 of 98
Group - FY 10 12 13 14 15 Totals Expected 12 13 14 15
White Men 57,584 56,296 24,720 6122 144,722 79,419 71,104 29,196 6,279
White Women 23,242 18,793 7,091 1538 50,664 46,645 41,762 17,148 3,688
African American Men 23,973 22,356 7,905 1460 55,694 4,268 3,821 1,569 337
African American Women 19,794 17,191 7,026 933 44,944 5,335 4,777 1,961 422
Hispanic or Latino Men 5,783 4,862 1,776 480 12,901 5,030 4,504 1,849 398
Hispanic or Latino Women 2,454 1,512 696 80 4,742 3,658 3,275 1,345 289
Asian Men 3,074 2,933 1,090 175 7,272 3,201 2,866 1,177 253
Asian Women 1,946 1,374 618 71 4,009 1,982 1,774 728 157
Native Hawaiian or Other Pacific Islander Men
606 347 162 47 1,162 2 1 1 0
Native Hawaiian or Other Pacific Islander Women
248 93 43 14 398 2 1 1 0
American Indian or Alaska Native Men
1,021 965 315 68 2,369 305 273 112 24
American Indian or Alaska Native Women
431 421 239 18 1,109 305 273 112 24
Multiracial Men 7,649 6,036 2,742 675 17,102 1,067 955 392 84
Multiracial Women 4,631 3,297 1,615 370 9,913 762 682 280 60
Total Population 152,436 136,476 56,038 12,051 357,001 151,982 136,069 55,871 12,015
Figure 27
The population of EEO groups that were referred for selection is shown in figure 28 which
indicates that white men were the largest group of individuals referred for selection, and
were the largest group of individuals selected within the EEOC category of officials and
managers.
Group - FY 10 Referred 12 13 14 15 Totals Selected 12 13 14 15 Totals
White Men 16,706 16,537 7,104 1825 42,172 736 498 129 32 1,395
White Women 7,113 6,402 2,337 576 16,428 431 331 70 18 850
African American Men 6,352 5,866 2,169 412 14,799 141 104 32 2 279
African American Women 5,810 5,349 2,102 298 13,559 175 110 26 2 313
Hispanic or Latino Men 1,611 1,177 496 115 3,399 31 23 10 1 65
Hispanic or Latino Women 722 476 226 16 1,440 30 11 4 1 46
Asian Men 1,075 938 336 64 2,413 33 14 5 3 55
Asian Women 768 537 239 32 1,576 23 13 4 0 40
Native Hawaiian or Other Pacific Islander Men
167 114 54 16 351 4 0 1 0 5
Native Hawaiian or Other Pacific Islander Women
58 32 19 8 117 1 0 2 0 3
American Indian or Alaska Native Men
358 324 89 16 787 13 6 0 0 19
American Indian or Alaska Native Women
195 150 96 7 448 5 4 2 0 11
Multiracial Men 2,063 1,594 755 229 4,641 34 27 11 0 72

EEOC FORM
U.S. Equal Employment Opportunity Commission
FEDERAL AGENCY ANNUAL EEO PROGRAM STATUS REPORT
Headquarters Department of the Army Page 65 of 98
Group - FY 10 Referred 12 13 14 15 Totals Selected 12 13 14 15 Totals
Multiracial Women 1,286 925 540 124 2,875 34 11 3 0 48
Total Population 44,284 40,421 16,562 3,738 105,005 1,691 1,152 299 59 3,201
Figure 28
The data in figure 29 shows that of EEO groups with larger populations, Asian men
and women were the largest group that applied for positions and were subsequently
referred, followed by White women and African-American women. This infers that
members of these groups would be selected at a rate proportional to their referral rate. The
data indicates that within the large EEO groups that the percentage of individuals being
referred is more than 25%.
Applied Who has the Were Referred
12 13 14 15
White Men 29.01% 29.38% 28.74% 29.81%
White Women 30.60% 34.07% 32.96% 37.45%
African American Men 26.50% 26.24% 27.44% 28.22%
African American Women
29.35% 31.12% 29.92% 31.94%
Hispanic or Latino Men
27.86% 24.21% 27.93% 23.96%
Hispanic or Latino Women
29.42% 31.48% 32.47% 20.00%
Asian Men 34.97% 31.98% 30.83% 36.57%
Asian Women 39.47% 39.08% 38.67% 45.07%
Native Hawaiian or Other Pacific Islander Men
27.56% 32.85% 33.33% 34.04%
Native Hawaiian or Other Pacific Islander Women
23.39% 34.41% 44.19% 57.14%
American Indian or Alaska Native Men
35.06% 33.58% 28.25% 23.53%
American Indian or Alaska Native Women
45.24% 35.63% 40.17% 38.89%
Multiracial Men 26.97% 26.41% 27.53% 33.93%
Multiracial Women 27.77% 28.06% 33.44% 33.51%
Total Population 29.05% 29.62% 29.55% 31.02%
Figure 29

EEOC FORM
U.S. Equal Employment Opportunity Commission
FEDERAL AGENCY ANNUAL EEO PROGRAM STATUS REPORT
Headquarters Department of the Army Page 66 of 98
The data in figure 29 indicates that within the large EEO groups that African-American men
that were referred had the lowest rate of those referred for selection. This is contrasted
with the information in figure 28 that indicates that the average referral rate was 28%.
Referred who were Selected
12 13 14 15
White Men 4.41% 3.01% 1.82% 1.75%
White Women 6.06% 5.17% 3.00% 3.13%
African American Men 2.22% 1.77% 1.48% 0.49%
African American Women
3.01% 2.06% 1.24% 0.67%
Hispanic or Latino Men
1.92% 1.95% 2.02% 0.87%
Hispanic or Latino Women
4.16% 2.31% 1.77% 6.25%
Asian Men 3.07% 1.49% 1.49% 4.69%
Asian Women 2.99% 2.42% 1.67% 0.00%
Native Hawaiian or Other Pacific Islander Men
2.40% 0.00% 1.85% 0.00%
Native Hawaiian or Other Pacific Islander Women
1.72% 0.00% 10.53% 0.00%
American Indian or Alaska Native Men
3.63% 1.85% 0.00% 0.00%
American Indian or Alaska Native Women
2.56% 2.67% 2.08% 0.00%
Multiracial Men 1.65% 1.69% 1.46% 0.00%
Multiracial Women 2.64% 1.19% 0.56% 0.00%
Total Population 3.82% 2.85% 1.81% 1.58%
Figure 30
Officials and Managers – Summary
The relationship between the applicant pool and EEO group population infers that,
as with the population overall, that a key element in the representation of EEO groups is
maintaining a well supplied pool of qualified individuals. Exact statistical tests to show
specific significance levels should be conducted at the operational level to validate this
inference. Because this category contains occupational series with very specific special
occupational codes, more specific analysis can be conducted on this category of series to
determine relationships between populations and supporting applicant pool data. Using
this type of analysis on the general population does not provide the appropriate statistical
controls and specificity needed to provide answers that lead to supportable strategies.
This means that problem identification is one of the first steps to be implemented in the

EEOC FORM
U.S. Equal Employment Opportunity Commission
FEDERAL AGENCY ANNUAL EEO PROGRAM STATUS REPORT
Headquarters Department of the Army Page 67 of 98
development of an over arching strategy that addresses specific barriers that may be
identified.
Three triggers have been identified: the relationship between African-American
men being referred for selection and their selection rate, the less than expected application
rate of white women based upon the CLF, and the representation of Hispanic or Latino men
and women not only in the specific job categories, but in the applicant pool.
Professionals
The population of those individuals classified as professionals within the EEOC
categories in pay grades 12 to 15 is depicted in figure 31. This group is the second largest
employee group in the Army. This group includes occupations that normally require formal
education as a basic job qualification. White men and women are the largest EEO groups
within this category, followed by African-American men and women. Asian men and
women are the third largest EEO group within this category, followed by Hispanic or Latino
men and women which of the fourth-largest population. The percentage of white men is
greater than the professional civilian labor force statistic. The percentage of African-
American men and women is also greater than the civilian labor force statistic, while the
percentage of White women in all pay grades is lower than the civilian labor force statistic.
The percentage of Hispanic or Latino s and Asians relative to the professional CLF varies by
pay grade.
Group - FY 10 12 13 14 15 Professionals CLF
White Men 52% 64% 62% 63% 37.10%
White Women 22% 20% 19% 19% 42.30%
African American Men 7% 5% 5% 3% 2.70%
African American Women
6% 4% 4% 3% 4.90%
Hispanic or Latino Men
3% 3% 2% 2% 2.29%
Hispanic or Latino Women
1% 1% 1% 1% 2.80%
Asian Men 5% 0% 5% 4% 3.20%
Asian Women 2% 0% 1% 2% 2.60%
Native Hawaiian or Other Pacific Islander Men
0% 0% 0% 0% 0.00%
Native Hawaiian or Other Pacific Islander Women
0% 0% 0% 0% 0.00%
American Indian or Alaska Native Men
0% 1% 0% 0% 0.20%

EEOC FORM
U.S. Equal Employment Opportunity Commission
FEDERAL AGENCY ANNUAL EEO PROGRAM STATUS REPORT
Headquarters Department of the Army Page 68 of 98
Group - FY 10 12 13 14 15 Professionals CLF
American Indian or Alaska Native Women
0% 0% 0% 0% 0.30%
Multiracial Men 1% 1% 1% 1% 0.60%
Multiracial Women 1% 1% 1% 0% 0.80%
Total Population 100% 100% 100% 100%
Figure 31
The population of professional employees in pay grades 12 through 15 is shown in
figure 32, along with the expected population. White men are the largest population and
with African-American men and women, Hispanic or Latino and Asian men, exceed their
population expectations based upon the professional CLF depending on the pay grade.
White women comprise the next largest group, but do not exceed their population
expectations. Because the civilian labor force statistic for the remaining EEO groups is
small, the population expectations reflect a smaller range of population expectations. The
expected population of white women is larger than expected population of white men and
of any other EEO group. This is directly related to the civilian labor force statistic for white
women, which is 42%, while the civilian labor force statistic for white men is 37%.
Group - FY 10 12 13 14 15 Totals Expected 12 13 14 15
White Men 8,657 7,644 2,802 941 20,044 6,175 4,411 1,690 551
White Women 3,672 2,322 850 286 7,130 7,041 5,029 1,927 629
African American Men 1,095 616 212 51 1,974 449 321 123 40
African American Women
1,037 517 167 45 1,766 816 583 223 73
Hispanic or Latino Men 465 324 109 32 930 381 272 104 34
Hispanic or Latino Women
219 97 33 12 361 466 333 128 42
Asian Men 763 16 207 55 1,041 533 380 146 48
Asian Women 294 12 60 24 390 433 309 118 39
Native Hawaiian or Other Pacific Islander Men
37 19 8 2 66 0 0 0 0
Native Hawaiian or Other Pacific Islander Women
17 11 4 1 33 0 0 0 0
American Indian or Alaska Native Men
83 61 16 7 167 33 24 9 3
American Indian or Alaska Native Women
39 12 5 2 58 50 36 14 4
Multiracial Men 149 153 54 22 378 100 71 27 9
Multiracial Women 118 85 29 6 238 133 95 36 12
Total Population 16,645 11,889 4,556 1,486 34,576 16,610 11,864 4,546 1,483
Figure 32

EEOC FORM
U.S. Equal Employment Opportunity Commission
FEDERAL AGENCY ANNUAL EEO PROGRAM STATUS REPORT
Headquarters Department of the Army Page 69 of 98
Professionals – Applicant Pool Analysis
The applicant pool data for professional positions in grades 12-15 is shown in figure
33. The data shows that the majority of the applications received were from White men,
followed by African American men and women. When compared to the professional CLF,
White men, followed by African American men, had the highest average number of
applications submitted. The average submission rates exceed the CLF for all men’s groups
and African American women, while the average application rate for women was generally
less than expected.
Group - FY 10 Applied
12 13 14 15 Totals Average Professionals CLF
White Men 42.99% 46.16% 43.76% 54.93% 44.72% 46.96% 37.10%
White Women 12.81% 12.26% 11.53% 10.10% 12.30% 11.67% 42.30%
African American Men
14.39% 13.47% 16.52% 10.69% 14.27% 13.77% 2.70%
African American Women
10.12% 7.69% 7.52% 5.61% 8.62% 7.73% 4.90%
Hispanic or Latino Men
2.71% 2.60% 2.46% 2.79% 2.63% 2.64% 2.29%
Hispanic or Latino Women
1.30% 0.74% 0.73% 0.35% 0.97% 0.78% 2.80%
Asian Men 5.76% 8.12% 8.51% 6.06% 7.11% 7.11% 3.20%
Asian Women 1.09% 1.43% 0.96% 0.72% 1.19% 1.05% 2.60%
Native Hawaiian or Other Pacific Islander Men
0.18% 0.16% 0.22% 0.25% 0.18%
0.20%
0.00%
Native Hawaiian or Other Pacific Islander Women
0.15% 0.26% 0.13% 0.01% 0.19%
0.14%
0.00%
American Indian or Alaska Native Men
0.53% 0.41% 0.55% 0.51% 0.49%
0.50%
0.20%
American Indian or Alaska Native Women
0.35% 0.30% 0.39% 0.28% 0.33%
0.33%
0.30%
Multiracial Men 4.97% 4.01% 3.97% 5.92% 4.47% 4.72% 0.60%
Multiracial Women
2.65% 2.41% 2.73% 1.77% 2.54% 2.39% 0.80%
Total Population 100.00% 100.00% 100.00% 100.00% 100.00% 100.00%
Figure 33
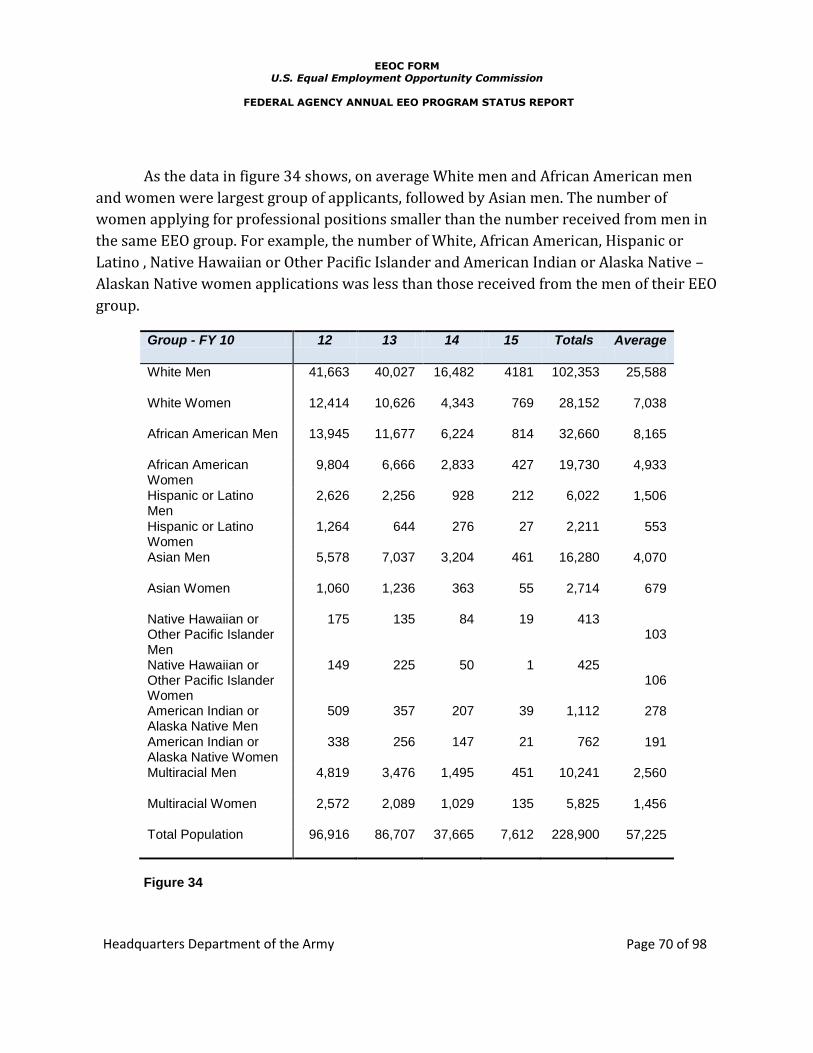
EEOC FORM
U.S. Equal Employment Opportunity Commission
FEDERAL AGENCY ANNUAL EEO PROGRAM STATUS REPORT
Headquarters Department of the Army Page 70 of 98
As the data in figure 34 shows, on average White men and African American men
and women were largest group of applicants, followed by Asian men. The number of
women applying for professional positions smaller than the number received from men in
the same EEO group. For example, the number of White, African American, Hispanic or
Latino , Native Hawaiian or Other Pacific Islander and American Indian or Alaska Native –
Alaskan Native women applications was less than those received from the men of their EEO
group.
Group - FY 10 12 13 14 15 Totals Average
White Men 41,663 40,027 16,482 4181 102,353 25,588
White Women 12,414 10,626 4,343 769 28,152 7,038
African American Men 13,945 11,677 6,224 814 32,660 8,165
African American Women
9,804 6,666 2,833 427 19,730 4,933
Hispanic or Latino Men
2,626 2,256 928 212 6,022 1,506
Hispanic or Latino Women
1,264 644 276 27 2,211 553
Asian Men 5,578 7,037 3,204 461 16,280 4,070
Asian Women 1,060 1,236 363 55 2,714 679
Native Hawaiian or Other Pacific Islander Men
175 135 84 19 413 103
Native Hawaiian or Other Pacific Islander Women
149 225 50 1 425 106
American Indian or Alaska Native Men
509 357 207 39 1,112 278
American Indian or Alaska Native Women
338 256 147 21 762 191
Multiracial Men 4,819 3,476 1,495 451 10,241 2,560
Multiracial Women 2,572 2,089 1,029 135 5,825 1,456
Total Population 96,916 86,707 37,665 7,612 228,900 57,225
Figure 34

EEOC FORM
U.S. Equal Employment Opportunity Commission
FEDERAL AGENCY ANNUAL EEO PROGRAM STATUS REPORT
Headquarters Department of the Army Page 71 of 98
The data in figure 35 shows the number of applications expected from each EEO
group relative to the CLF. The number of applications received from White and African
American men and women was greater than expected, as it was for Asian men. The number
of applications received from Hispanic or Latino s was less than expected while the data
from the remaining EEO groups is varied.
Expected 12 13 14 15 Average
White Men 35,956 32,168 13,974 2,824 84,922
White Women 40,995 36,677 15,932 3,220 96,825
African American Men 2,617 2,341 1,017 206 6,180
African American Women
4,749 4,249 1,846 373 11,216
Hispanic or Latino Men
2,219 1,986 863 174 5,242
Hispanic or Latino Women
2,714 2,428 1,055 213 6,409
Asian Men 3,101 2,775 1,205 244 7,325
Asian Women 2,520 2,254 979 198 5,951
Native Hawaiian or Other Pacific Islander Men
1 1 0 0 2
Native Hawaiian or Other Pacific Islander Women
0 0 0 0 0
American Indian or Alaska Native Men
194 173 75 15 458
American Indian or Alaska Native Women
291 260 113 23 687
Multiracial Men 581 520 226 46 1,373
Multiracial Women 775 694 301 61 1,831
Total Population 96,714 86,526 37,586 7,596 228,422
Figure 35
The data in figure 36 depicts the percentage of those referred and selected. The
majority of individuals referred and selected at all grade levels were white men. This is
related to figure 35 that shows that the majority of applications received were from White
men. The referral and selection rate varies by pay grade, as the percentage of African

EEOC FORM
U.S. Equal Employment Opportunity Commission
FEDERAL AGENCY ANNUAL EEO PROGRAM STATUS REPORT
Headquarters Department of the Army Page 72 of 98
American men were referred than White women, but the percentage of White women
selected was greater than the African American men.
Referred 12 13 14 15 Selected 12 13 14 15
White Men 44.14% 46.42% 46.07% 55.70% 53.99% 52.93% 64.32% 58.33%
White Women 12.80% 12.65% 13.13% 10.55% 20.26% 18.88% 16.76% 8.33%
African American Men
12.85% 11.08% 12.69% 8.55% 6.79% 5.59% 3.78% 8.33%
African American Women
9.08% 7.75% 7.61% 6.42% 5.29% 4.65% 5.41% 0.00%
Hispanic or Latino Men
2.94% 2.69% 3.06% 3.25% 2.10% 2.26% 1.62% 8.33%
Hispanic or Latino Women
1.34% 0.80% 0.94% 0.23% 0.70% 0.80% 0.00% 0.00%
Asian Men 7.54% 9.42% 7.86% 5.76% 3.89% 6.38% 5.41% 0.00%
Asian Women 1.13% 1.54% 0.84% 0.65% 1.50% 2.53% 1.08% 0.00%
Native Hawaiian or Other Pacific Islander Men
0.26% 0.19% 0.18% 0.42% 0.20% 0.00% 0.00% 0.00%
Native Hawaiian or Other Pacific Islander Women
0.13% 0.17% 0.19% 0.00% 0.00% 0.00% 0.54% 0.00%
American Indian or Alaska Native Men
0.55% 0.41% 0.42% 0.70% 0.40% 0.40% 0.00% 0.00%
American Indian or Alaska Native Women
0.29% 0.30% 0.33% 0.09% 0.20% 0.53% 0.00% 0.00%
Multiracial Men 4.78% 4.23% 3.78% 5.90% 3.29% 3.59% 1.08% 16.67%
Multiracial Women 2.16% 2.36% 2.90% 1.77% 1.40% 1.46% 0.00% 0.00%
Total Population 100.00% 100.00% 100.00% 100.00% 100.00% 100.00% 100.00% 100.00%
Figure 36
Figure 37 shows that on average there is variation in the referral and selection rates
between EEO groups. For example, the average referral rate for White men is 48%, while
the average selection rate was 55% which was 7% more than their average referral rate.
The average referral rate for White women was 12% while the average selection rate as
16% with a difference of almost 4% between their average referral and selection rates.
African American men, on average, comprised 11% of those referred but their selection
rate were -5% when their average referral and selection rates were compared. The
comparisons of rates from other groups vary but most other EEO group referral to
selection rate differences were less than their referral rates.
Referred Average Referred
Average Selected
Difference
White Men 48.08% 55.53% 7.45%
White Women 12.28% 16.06% 3.77%

EEOC FORM
U.S. Equal Employment Opportunity Commission
FEDERAL AGENCY ANNUAL EEO PROGRAM STATUS REPORT
Headquarters Department of the Army Page 73 of 98
Referred Average Referred
Average Selected
Difference
African American Men 11.29% 6.12% -5.17%
African American Women
7.71% 3.84% -3.88%
Hispanic or Latino Men
2.99% 3.58% 0.59%
Hispanic or Latino Women
0.83% 0.37% -0.45%
Asian Men 7.65% 3.92% -3.73%
Asian Women 1.04% 1.28% 0.24%
Native Hawaiian or Other Pacific Islander Men
0.26% 0.05% -0.21%
Native Hawaiian or Other Pacific Islander Women
0.12% 0.14% 0.01%
American Indian or Alaska Native Men
0.52% 0.20% -0.32%
American Indian or Alaska Native Women
0.25% 0.18% -0.07%
Multiracial Men 4.67% 6.16% 1.48%
Multiracial Women 2.30% 0.71% -1.58%
Total Population 100.00% 100.00% 0.00%
Figure 37
Further analysis indicates that Hispanic or Latino men, on average, who applied for
positions were referred at the highest rate of the large EEO groups, followed by Asian men.
The rate of those who applied and were referred varied by grade; on average 30% of the
applications were referred. The applications of African American men were referred on
average 25%; at the GS 12 level, Asian men were referred almost 40% of the time but at
grades 14-15, the referral rate was less than the average.
Applied Who Were Referred
12 13 14 15 Average Median
White Men 31.11% 31.58% 31.31% 28.65% 30.66% 31.21%
White Women 30.28% 32.42% 33.87% 29.52% 31.52% 31.35%
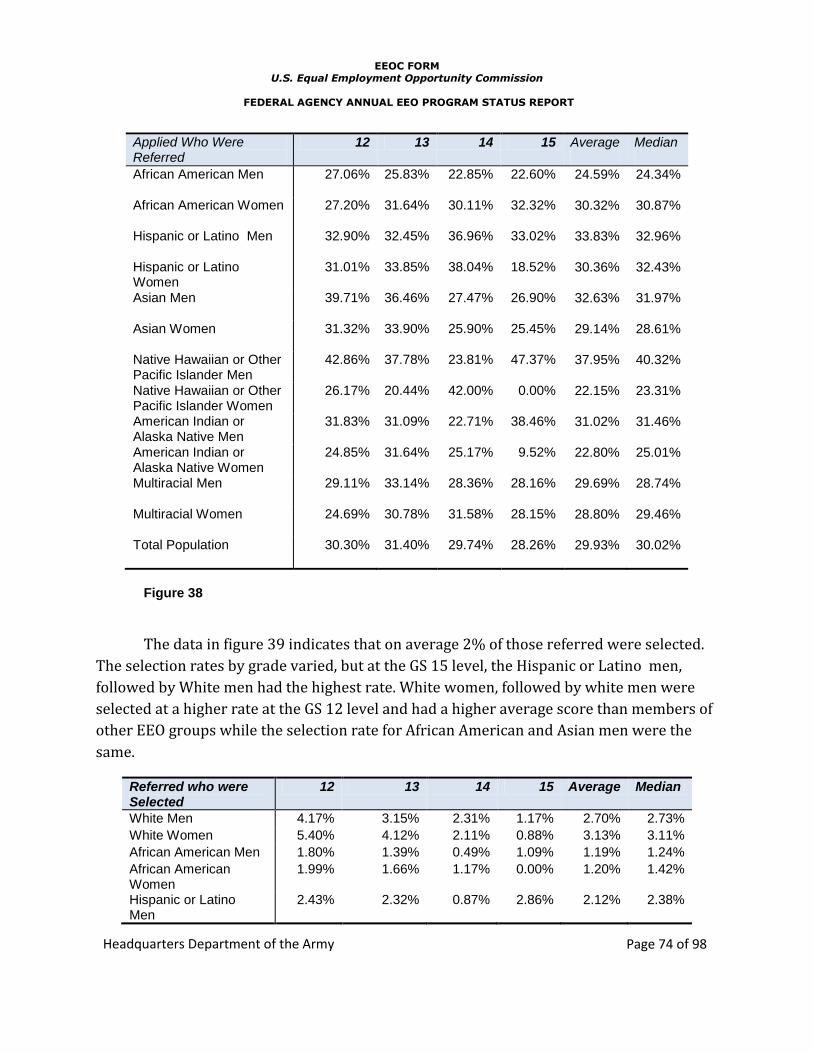
EEOC FORM
U.S. Equal Employment Opportunity Commission
FEDERAL AGENCY ANNUAL EEO PROGRAM STATUS REPORT
Headquarters Department of the Army Page 74 of 98
Applied Who Were Referred
12 13 14 15 Average Median
African American Men 27.06% 25.83% 22.85% 22.60% 24.59% 24.34%
African American Women 27.20% 31.64% 30.11% 32.32% 30.32% 30.87%
Hispanic or Latino Men 32.90% 32.45% 36.96% 33.02% 33.83% 32.96%
Hispanic or Latino Women
31.01% 33.85% 38.04% 18.52% 30.36% 32.43%
Asian Men 39.71% 36.46% 27.47% 26.90% 32.63% 31.97%
Asian Women 31.32% 33.90% 25.90% 25.45% 29.14% 28.61%
Native Hawaiian or Other Pacific Islander Men
42.86% 37.78% 23.81% 47.37% 37.95% 40.32%
Native Hawaiian or Other Pacific Islander Women
26.17% 20.44% 42.00% 0.00% 22.15% 23.31%
American Indian or Alaska Native Men
31.83% 31.09% 22.71% 38.46% 31.02% 31.46%
American Indian or Alaska Native Women
24.85% 31.64% 25.17% 9.52% 22.80% 25.01%
Multiracial Men 29.11% 33.14% 28.36% 28.16% 29.69% 28.74%
Multiracial Women 24.69% 30.78% 31.58% 28.15% 28.80% 29.46%
Total Population 30.30% 31.40% 29.74% 28.26% 29.93% 30.02%
Figure 38
The data in figure 39 indicates that on average 2% of those referred were selected.
The selection rates by grade varied, but at the GS 15 level, the Hispanic or Latino men,
followed by White men had the highest rate. White women, followed by white men were
selected at a higher rate at the GS 12 level and had a higher average score than members of
other EEO groups while the selection rate for African American and Asian men were the
same.
Referred who were Selected
12 13 14 15 Average Median
White Men 4.17% 3.15% 2.31% 1.17% 2.70% 2.73%
White Women 5.40% 4.12% 2.11% 0.88% 3.13% 3.11%
African American Men 1.80% 1.39% 0.49% 1.09% 1.19% 1.24%
African American Women
1.99% 1.66% 1.17% 0.00% 1.20% 1.42%
Hispanic or Latino Men
2.43% 2.32% 0.87% 2.86% 2.12% 2.38%

EEOC FORM
U.S. Equal Employment Opportunity Commission
FEDERAL AGENCY ANNUAL EEO PROGRAM STATUS REPORT
Headquarters Department of the Army Page 75 of 98
Referred who were Selected
12 13 14 15 Average Median
Hispanic or Latino Women
1.79% 2.75% 0.00% 0.00% 1.13% 0.89%
Asian Men 1.76% 1.87% 1.14% 0.00% 1.19% 1.45%
Asian Women 4.52% 4.53% 2.13% 0.00% 2.80% 3.32%
Native Hawaiian or Other Pacific Islander Men
2.67% 0.00% 0.00% 0.00% 0.67% 0.00%
Native Hawaiian or Other Pacific Islander Women
0.00% 0.00% 4.76% 0.00% 1.19% 0.00%
American Indian or Alaska Native Men
2.47% 2.70% 0.00% 0.00% 1.29% 1.23%
American Indian or Alaska Native Women
2.38% 4.94% 0.00% 0.00% 1.83% 1.19%
Multiracial Men 2.35% 2.34% 0.47% 3.15% 2.08% 2.35%
Multiracial Women 2.20% 1.71% 0.00% 0.00% 0.98% 0.86%
Total Population 3.41% 2.76% 1.65% 1.12% 2.24% 2.21%
Figure 39
Supervisors
The population percentage distribution of supervisors in the professionals category
is shown in figure 40. The majority of supervisors are White men followed by White
women across all pay grades, although the expected population of white women exceeds
the expected population of white men. This is because the CLF for white women is 42%,
while the CLF for white men is 37%. This means that white women would have the largest
population if that population were based on matching the CLF.
Group - FY 10 12 13 14 15 Totals Professionals CLF
White Men 55.11% 61.04% 64.65% 67.92% 61.50% 37.10%
White Women 17.90% 19.06% 16.31% 16.98% 17.90% 42.30%
African American Men 9.57% 4.99% 5.07% 3.44% 5.76% 2.70%
African American Women
6.81% 4.04% 3.73% 3.33% 4.44% 4.90%
Hispanic or Latino Men
3.40% 2.86% 2.40% 2.22% 2.78% 2.29%
Hispanic or Latino Women
1.35% 0.84% 0.97% 0.55% 0.94% 2.80%
Asian Men 1.82% 3.13% 3.73% 2.44% 2.95% 3.20%
Asian Women 0.76% 0.94% 0.41% 0.78% 0.75% 2.60%
Native Hawaiian or Other Pacific Islander Men
0.29% 0.13% 0.18% 0.11% 0.18% 0.00%
Native Hawaiian or Other Pacific Islander
0.23% 0.16% 0.14% 0.11% 0.17% 0.00%

EEOC FORM
U.S. Equal Employment Opportunity Commission
FEDERAL AGENCY ANNUAL EEO PROGRAM STATUS REPORT
Headquarters Department of the Army Page 76 of 98
Group - FY 10 12 13 14 15 Totals Professionals CLF
Women
American Indian or Alaska Native Men
0.65% 0.57% 0.41% 0.22% 0.51% 0.20%
American Indian or Alaska Native Women
0.18% 0.27% 0.09% 0.22% 0.20% 0.30%
Multiracial Men 1.64% 1.38% 1.24% 1.66% 1.43% 0.60%
Multiracial Women 0.29% 0.59% 0.65% 0.00% 0.48% 0.80%
Total Population 100.00% 100.00% 100.00% 100.00% 100.00%
Figure 40
The population of GS 12 through 15 supervisors within the professional’s category
is shown in figure 41, along with the expected population. The largest population is White
men and White women. The number of African American men and women supervisors
exceeds their expected number, but the number of Hispanic or Latino men and women and
Asian men and women supervisors is less than the expected distribution. The population of
the remaining EEO groups in supervisory positions varies because of the smaller CLF
statistic for each group.
Group - FY 10 12 13 14 15 Totals Expected 12 13 14 15
White Men 939 2,264 1,403 612 5,218 632 1,376 805 334
White Women 305 707 354 153 1,519 721 1,569 918 381
African American Men 163 185 110 31 489 46 100 59 24
African American Women
116 150 81 30 377 83 182 106 44
Hispanic or Latino Men
58 106 52 20 236 39 85 50 21
Hispanic or Latino Women
23 31 21 5 80 48 104 61 25
Asian Men 31 116 81 22 250 55 119 69 29
Asian Women 13 35 9 7 64 44 96 56 23
Native Hawaiian or Other Pacific Islander Men
5 5 4 1 15 0 0 0 0
Native Hawaiian or Other Pacific Islander Women
4 6 3 1 14 0 0 0 0
American Indian or Alaska Native Men
11 21 9 2 43 3 7 4 2
American Indian or Alaska Native Women
3 10 2 2 17 5 11 7 3
Multiracial Men 28 51 27 15 121 10 22 13 5

EEOC FORM
U.S. Equal Employment Opportunity Commission
FEDERAL AGENCY ANNUAL EEO PROGRAM STATUS REPORT
Headquarters Department of the Army Page 77 of 98
Group - FY 10 12 13 14 15 Totals Expected 12 13 14 15
Multiracial Women 5 22 14 0 41 14 30 17 7
Total Population 1,704 3,709 2,170 901 8,484 1,700 3,701 2,165 899
Figure 41
Professional Category – Summary
The population of employees in the professional categories is dominated by White
men. The applicant pool data infers that because White men are the largest group of
applicants, exceeded their expected applicant pool population, that there is a relationship
between the applicant pool and the resulting population. Although the CLF statistic for
White women is larger than the CLF statistic for White men, the applicant data indicates on
average White men apply for professional positions at a rate more than 3 times that of
White women. The rate that White men who apply for positions are referred is controlled
in part by the volume of applications received from this group. It appears that when
applications from an EEO group exceed the expected distribution based upon the CLF, that
group establishes a statistical expectation that the selection rate would follow. This theory
was not validated because of the variation in selection rates experienced by the EEO groups
other than White men and women. This establishes a trigger to examine the relationship
between the referral and selection rate by examining the underlying occupational series
data to find out if specific barriers exist.
The federal initiatives to focus on STEM6 occupational series creates visibility to find
out if STEM based initiatives with minority colleges and universities can be successful.
However, the analysis in this report focuses on positions above the entry level. This means
that STEM initiatives should focus on workplace issues of existing employees as well as
entry level positions.
Senior Level Positions
The population of individuals in senior level positions is shown in figure 42. The pay
plans include executive service (ES), intelligence executives (IE), intelligence professionals
(IP), science and technology positions (ST), and senior level positions (SL). No applicant
pool analysis is provided because the data was not available. There is a common
assumption that the feeder pool into these positions is created by GS 14 and 15 positions.
The population of senior executives is small relative to the overall population of the Army.
Although a number of senior executives are appointed from the Army pool of GS 14 and 15
employees, a number of these positions are filled with individuals from outside the Army.
6 STEM; Science, Technology, Engineering, Medical occupational categories

EEOC FORM
U.S. Equal Employment Opportunity Commission
FEDERAL AGENCY ANNUAL EEO PROGRAM STATUS REPORT
Headquarters Department of the Army Page 78 of 98
Because the applicant pool data is not available, the assumption that the GS 14 and 15
positions provide a substantial feeder pool into these positions cannot be tested.
Even though these positions include occupational series that are normally classified
in other EEOC categories, the basis of comparison is the officials and managers civilian
labor force statistic. The population within each pay plan is depicted in figure 42. The
percentages within each pay plan are shown in figure 43, while the expected population is
shown in figure 44. White men are the largest population within each pay plan, followed by
white women and African-American men. Although the ES positions comprise the largest
group, and is dominated by white men, with the exception of Native Hawaiian or Other
Pacific Islander men and women, every EEO group is represented. However, the positions
in the intelligence community (IE and IP) have seven white women and one Hispanic or
Latino man within its 47 positions. As figure 43 indicates, 73% of the positions in pay plan
ES are held by white men, 82% of the positions in IE are held by white men.
Group - FY 10 ES IE IP ST SL Totals Average
White Men 211 9 28 31 3 282 56
White Women 48 2 5 2 0 57 11
African American Men 12 0 0 1 0 13 3
African American Women
2 0 0 0 0 2 0
Hispanic or Latino Men 2 0 1 2 0 5 1
Hispanic or Latino Women
2 0 0 0 0 2 0
Asian Men 7 0 2 5 0 14 3
Asian Women 2 0 0 1 0 3 1
Native Hawaiian or Other Pacific Islander Men
0 0 0 0 0 0 0
Native Hawaiian or Other Pacific Islander Women
0 0 0 0 0 0 0
American Indian or Alaska Native Men
1 0 0 0 0 1 0
American Indian or Alaska Native Women
1 0 0 0 0 1 0
Multiracial Men 1 0 0 0 0 1 0
Multiracial Women 0 0 0 0 0 0 0
Total Population 289 11 36 42 3 381 76
Figure 42
The distribution of EEO groups by percentage is shown in figure 43 with group average
population and the officials and managers CLF statistic. The overall evaluation is that the

EEOC FORM
U.S. Equal Employment Opportunity Commission
FEDERAL AGENCY ANNUAL EEO PROGRAM STATUS REPORT
Headquarters Department of the Army Page 79 of 98
population of White men is greater than expected, which impacts the population of other
EEO groups. The largest population is contained in the ES pay plan and population of
African American men exceeds the CLF in pay plans ES and ST. However there are no
African American men in pay plan IE and IP. The population of White and African American
women, Hispanic or Latino s and Asians is less than the CLF in all pay plans.
Group - FY 10 ES IE IP ST SL Totals Average OM CLF
White Men 73.01% 81.82% 77.78% 73.81% 100.00% 74.02% 81.28% 52.10%
White Women 16.61% 18.18% 13.89% 4.76% 0.00% 14.96% 10.69% 30.60%
African American Men 4.15% 0.00% 0.00% 2.38% 0.00% 3.41% 1.31% 2.80%
African American Women 0.69% 0.00% 0.00% 0.00% 0.00% 0.52% 0.14% 3.50%
Hispanic or Latino Men 0.69% 0.00% 2.78% 4.76% 0.00% 1.31% 1.65% 3.30%
Hispanic or Latino Women 0.69% 0.00% 0.00% 0.00% 0.00% 0.52% 0.14% 2.40%
Asian Men 2.42% 0.00% 5.56% 11.90% 0.00% 3.67% 3.98% 2.10%
Asian Women 0.69% 0.00% 0.00% 2.38% 0.00% 0.79% 0.61% 1.30%
Native Hawaiian or Other Pacific Islander Men
0.00% 0.00% 0.00% 0.00% 0.00% 0.00% 0.00% 0.00%
Native Hawaiian or Other Pacific Islander Women
0.00% 0.00% 0.00% 0.00% 0.00% 0.00% 0.00% 0.00%
American Indian or Alaska Native Men
0.35% 0.00% 0.00% 0.00% 0.00% 0.26% 0.07% 0.20%
American Indian or Alaska Native Women
0.35% 0.00% 0.00% 0.00% 0.00% 0.26% 0.07% 0.20%
Multiracial Men 0.35% 0.00% 0.00% 0.00% 0.00% 0.26% 0.07% 0.70%
Multiracial Women 0.00% 0.00% 0.00% 0.00% 0.00% 0.00% 0.00% 0.50%
Total Population 100.00% 100.00% 100.00% 100.00% 100.00% 100.00% 100.00%
Figure 43
The expected population for each pay plan is shown in figure 44, which are the calculations
of the senior level population when distributed with the CLF. The data indicates that the
expected populations of all EEO groups would be higher if the population was distributed
according the CLF.
Expected ES IE IP ST SL
White Men 151 6 19 22 2
White Women 88 3 11 13 1
African American Men 8 0 1 1 0
African American Women
10 0 1 1 0
Hispanic or Latino Men 10 0 1 1 0
Hispanic or Latino Women
7 0 1 1 0

EEOC FORM
U.S. Equal Employment Opportunity Commission
FEDERAL AGENCY ANNUAL EEO PROGRAM STATUS REPORT
Headquarters Department of the Army Page 80 of 98
Expected ES IE IP ST SL
Asian Men 6 0 1 1 0
Asian Women 4 0 0 1 0
Native Hawaiian or Other Pacific Islander Men
0 0 0 0 0
Native Hawaiian or Other Pacific Islander Women
0 0 0 0 0
American Indian or Alaska Native Men
1 0 0 0 0
American Indian or Alaska Native Women
1 0 0 0 0
Multiracial Men 2 0 0 0 0
Multiracial Women 1 0 0 0 0
Total Population 288 11 36 42 3
Figure 44
Senior Executive Summary
The population analysis of the senior executive positions is incomplete because the
applicant pool data was not available. Without this information it becomes difficult to
validate the relationship between the feeder groups and senior executive appointments.
The population data indicates that while pay plans ES shows a more diverse demographic,
that the intelligence play plans do not reflect the diversity that the ES pay plans do. This
establishes a trigger to examine the senior level appointment process to include a range of
policies that impact the feeder group developmental process to determine the barriers to a
greater degree of senior level diversification.
Non Appropriated Fund Employees
The population of employees in non foreign national non appropriated fund
positions is shown in figure 45. Many NAF positions mirror the appropriated fund while
supporting basic operations in the US and overseas. Using the general CLF, the expected
population is provided. The large number of employees classified as more than one racial
group is due to the total and global unavailability of self identification capability at various
work sites; this problem is being corrected. The data also indicates net losses in population
in NAF positions, with a net loss of 408 employees.
Group - FY 10 FY 10 FY 09 Change Expected
White Men 1,825 2,118 -293 11,653
White Women 2,393 2,780 -387 10,069
African American Men 820 919 -99 1,434

EEOC FORM
U.S. Equal Employment Opportunity Commission
FEDERAL AGENCY ANNUAL EEO PROGRAM STATUS REPORT
Headquarters Department of the Army Page 81 of 98
Group - FY 10 FY 10 FY 09 Change Expected
African American Women 1,644 1,853 -209 1,703
Hispanic or Latino Men 314 350 -36 1,852
Hispanic or Latino Women 619 693 -74 1,345
Asian Men 185 202 -17 568
Asian Women 474 515 -41 508
Native Hawaiian or Other Pacific Islander Men
44 53 -9 30
Native Hawaiian or Other Pacific Islander Women
83 89 -6 30
American Indian or Alaska Native Men
17 19 -2 90
American Indian or Alaska Native Women
23 31 -8 90
Multiracial Men 7,136 6,826 310 239
Multiracial Women 14,302 13,023 1,279 239
Total Population 29,879 29,471 -408 29,849
Figure 45
The data in figure 46 depicts the population percentage distribution with the
general CLF. The NAF population is dominated by White men and women, African
American men and women, followed by Hispanic or Latino men and women. The data for
NAF does not indicate any Army wide triggers.
Group - FY 10 General CLF
White Men 6.11% 39.00%
White Women 8.01% 33.70%
African American Men 2.74% 4.80%
African American Women
5.50% 5.70%
Hispanic or Latino Men 1.05% 6.20%
Hispanic or Latino Women
2.07% 4.50%
Asian Men 0.62% 1.90%
Asian Women 1.59% 1.70%
Native Hawaiian or Other Pacific Islander Men
0.15% 0.10%
Native Hawaiian or Other Pacific Islander Women
0.28% 0.10%
American Indian or Alaska Native Men
0.06% 0.30%
American Indian or Alaska Native Women
0.08% 0.30%

EEOC FORM
U.S. Equal Employment Opportunity Commission
FEDERAL AGENCY ANNUAL EEO PROGRAM STATUS REPORT
Headquarters Department of the Army Page 82 of 98
Group - FY 10 General CLF
Multiracial Men 23.88% 0.80%
Multiracial Women 47.87% 0.80%
Total Population 100.00%
Figure 46
Educational Summary
The data summarizing the Army workforce by education is provided to demonstrate
the formal education EEO groups bring to their workplace experience. The data in figure
47 is the demographic distribution of Army employees who have one or more years of
formal college education when aligned with the total population of the individual EEO
group. The majority of employees with degrees ranging from bachelors degree to doctorate
degrees are White men followed by White women. As the data in figure 48 indicates, White
men are 45% of the total Army population and represent nearly 49% o those with a degree,
followed by White women, African Americans, and Hispanic or Latino s; at the doctorate
level White men and women hold more doctorate degrees, followed by Asians and African
Americans.
Group - FY 10
Population by degree
Total Employee Population
With 1+Yrs Of College
Bachelors Degree
Masters Degree
Doctorate Professional Degree
White Men 117,344 67,621 31,076 15,842 3,217 650
White Women 61,600 35,571 15,338 7,418 1,339 328
Black Men 21,930 10,562 4,267 2,150 146 58
Black Women 24,125 13,128 5,306 2,703 165 56
Hispanic or Latino Men 9,045 4,200 1,723 773 68 24
Hispanic or Latino Women 5,006 2,518 1,026 402 25 14
Asian Men 5,717 4,380 2,172 1,132 407 40
Asian Women 4,687 3,288 1,523 733 245 48
Native Hawaiian or Other Pacific Islander Men
719 298 114 48 9 4
Native Hawaiian or Other Pacific Islander Women
635 308 109 56 5 2
American Indian or Alaska Native Men
1,524 741 271 152 22 9
American Indian or Alaska Native Women
962 486 183 78 4 2
Multiracial Men 4,140 2,500 1,102 556 63 14
Multiracial Women 3,113 1,923 829 367 64 11
Total Population 260,547 147,524 65,039 32,410 5,779 1,260
Figure 47

EEOC FORM
U.S. Equal Employment Opportunity Commission
FEDERAL AGENCY ANNUAL EEO PROGRAM STATUS REPORT
Headquarters Department of the Army Page 83 of 98
White men and women dominate the population of those with professional degrees
followed by African Americans and Asians as shown in figure 48.
Group - FY 10
Population by degree
Pop Percent
Percent With
Degree
With 1+Yrs Of College
Bachelors Degree
Masters Degree
Doctorate Professional Degree
White Men 45.04% 48.60% 45.84% 47.78% 48.88% 55.67% 51.59%
White Women 23.64% 23.37% 24.11% 23.58% 22.89% 23.17% 26.03%
African American Men 8.42% 6.34% 7.16% 6.56% 6.63% 2.53% 4.60%
African American Women 9.26% 7.88% 8.90% 8.16% 8.34% 2.86% 4.44%
Hispanic or Latino Men 3.47% 2.48% 2.85% 2.65% 2.39% 1.18% 1.90%
Hispanic or Latino Women
1.92% 1.40% 1.71% 1.58% 1.24% 0.43% 1.11%
Asian Men 2.19% 3.59% 2.97% 3.34% 3.49% 7.04% 3.17%
Asian Women 1.80% 2.44% 2.23% 2.34% 2.26% 4.24% 3.81%
Native Hawaiian or Other Pacific Islander Men
0.28% 0.17% 0.20% 0.18% 0.15% 0.16% 0.32%
Native Hawaiian or Other Pacific Islander Women
0.24% 0.16% 0.21% 0.17% 0.17% 0.09% 0.16%
American Indian or Alaska Native Men
0.58% 0.43% 0.50% 0.42% 0.47% 0.38% 0.71%
American Indian or Alaska Native Women
0.37% 0.26% 0.33% 0.28% 0.24% 0.07% 0.16%
Multiracial Men 1.59% 1.66% 1.69% 1.69% 1.72% 1.09% 1.11%
Multiracial Women 1.19% 1.22% 1.30% 1.27% 1.13% 1.11% 0.87%
Total Population 100.00% 100.00% 100.00% 100.00% 100.00% 100.00% 100.00%
Figure 48
The information in figure 49 indicates that within each educational level for each
EEO group the proportion of degrees held by each group tends to be higher than their
overall workforce percentage. Of the degrees held by White men, 61% are bachelor’s
degrees, 31% are master’s degrees and 6% are at the doctoral level. A similar trend is
evident for White women and African Americans. The proportion of doctorate degrees for
African American and Hispanic or Latino men and women tends to drop off at 2% while the
portion of doctorate degrees increases significantly for Asian men and women.

EEOC FORM
U.S. Equal Employment Opportunity Commission
FEDERAL AGENCY ANNUAL EEO PROGRAM STATUS REPORT
Headquarters Department of the Army Page 84 of 98
Group - FY 10 College
degrees within EEO
groups
Percent With
Degree
Bachelors Degree
Masters Degree
Doctorate Professional Degree
White Men 48.60% 61.19% 31.19% 6.33% 1.28%
White Women 23.37% 62.80% 30.37% 5.48% 1.34%
African American Men 6.34% 64.45% 32.47% 2.21% 0.88%
African American Women
7.88% 64.47% 32.84% 2.00% 0.68%
Hispanic or Latino Men 2.48% 66.58% 29.87% 2.63% 0.93%
Hispanic or Latino Women
1.40% 69.94% 27.40% 1.70% 0.95%
Asian Men 3.59% 57.90% 30.18% 10.85% 1.07%
Asian Women 2.44% 59.75% 28.76% 9.61% 1.88%
Native Hawaiian or Other Pacific Islander Men
0.17% 65.14% 27.43% 5.14% 2.29%
Native Hawaiian or Other Pacific Islander Women
0.16% 63.37% 32.56% 2.91% 1.16%
American Indian or Alaska Native Men
0.43% 59.69% 33.48% 4.85% 1.98%
American Indian or Alaska Native Women
0.26% 68.54% 29.21% 1.50% 0.75%
Multiracial Men 1.66% 63.52% 32.05% 3.63% 0.81%
Multiracial Women 1.22% 65.22% 28.87% 5.04% 0.87%
Total Population 100.00% 62.25% 31.02% 5.53% 1.21%
Figure 49
Educational Summary
The educational data indicates that with the exception of doctoral degrees, the
educational attainment by EEO groups tend to cluster in patterns that emulate their
population percentages. This may be due to the educational requirements for professional
positions or the Army culture that views formal education as a professional additive. Even
though OPM guidelines do not require formal education in the majority of occupational
series, the percentage of Army employees with formal degrees closes matches their
percentage in the overall population. This does not create any triggers but indicates that
data analysis of identified triggers should examine the role formal education plays in the
applicant selection process for pay grades 12 through 15.

EEOC FORM
U.S. Equal Employment Opportunity Commission
FEDERAL AGENCY ANNUAL EEO PROGRAM STATUS REPORT
Headquarters Department of the Army Page 85 of 98
Individuals with Disabilities (IWD) Program
The Army’s IWD program continues to evolve to support civilian employees as well
as service members. A number of command activities illustrate the outreach efforts
undertaken by various commands. One of the areas of interest is the development of
enterprise software to track provision of reasonable accommodations for employees. This
will provide greater visibility to the Army’s effort to support individuals with disabilities.
The requirement development was begun during this reporting period. In addition, the
development of online training modules for EEO careerists and the general workforce are
being planned. The software development is moving through the secondary requirements
phase towards design and prototype testing.
The Army effort to support the employment of persons with disabilities achieved
mixed results. The proportion of persons with disabilities increased as the Army
population increased. The DOD goal that 9% the Army population should include persons
with disabilities was met, but the EEOC guideline of 2% for persons with targeted
disabilities was not met as shown in figure 50. Absent a validated CLF for persons with
disabilities, it is difficult to judge whether or not Army has been able to reach out to the
available population of persons with disabilities.
Group - FY 10 FY 09 FY 10 Change
No Disability 254,264 268,444 14,180
Total Disability 26,114 27,611 1,497
Targeted Disabilities 1,832 1,880 48
Totals 280,378 296,055 15,677
Change
No Disability 90.69% 90.67% -5.28%
Total Disability 9.31% 9.33% 5.42%
Targeted Disabilities 0.65% 0.64% 2.55%
Figure 50
The data in figure 51 shows the population of persons with disabilities and includes
the population of persons with targeted disabilities distributed in the EEOC Fed9
Categories. The majority of persons with disabilities work in positions classified as
professionals, officials and managers and administrative support workers, followed by
craft workers.

EEOC FORM
U.S. Equal Employment Opportunity Commission
FEDERAL AGENCY ANNUAL EEO PROGRAM STATUS REPORT
Headquarters Department of the Army Page 86 of 98
Occupational Groups Total Detail by Disability Status
(05) No Disability
(01) Not Identified
(06 - 94) Disability
Targeted Disability
Officials and Managers # 68,648 61,234 1,336 6,078 391
Professionals # 90,141 82,276 1,611 6,254 495
Technicians # 18,733 16,788 376 1,569 136
Sales Workers # 75 69 0 6 0
Administrative Support Workers
# 38,569 33,789 715 4,065 461
Craft Workers # 25,979 23,715 438 1,826 168
Operatives # 11,992 10,793 225 974 83
Laborers and Helpers # 1,022 904 13 105 30
Service Workers # 11,024 10,070 198 756 47
Total # 266,183 239,638 4,912 21,633 1,811
Figure 51
The date in figure 52 shows the percentage of individuals with disabilities and that the
majority of individuals with targeted disabilities work on positions classified as
professionals, officials and managers and administrative support workers.
Occupational Groups (05) No Disability
(01) Not Identified
(06 - 94) Disability
Targeted Disability
Officials and Managers % 25.78% 25.55% 27.19% 28.09% 21.59%
Professionals % 33.86% 34.33% 32.79% 28.90% 27.33%
Technicians % 7.03% 7.00% 7.65% 7.25% 7.50%
Sales Workers % 0.02% 0.02% 0.00% 0.02% 0.00%
Administrative Support Workers
% 14.48% 14.10% 14.55% 18.79% 25.45%
Craft Workers % 9.75% 9.89% 8.91% 8.44% 9.27%
Operatives % 4.50% 4.50% 4.58% 4.50% 4.58%
Laborers and Helpers % 0.38% 0.37% 0.26% 0.48% 1.65%
Service Workers % 4.14% 4.20% 4.03% 3.49% 2.59%
Total % 100.00%
100.00% 100.00% 100.00%
100.00%
Figure 52
In the absence of a CLF for persons with disabilities, the federal high7 percentage
issued by EEOC is the basis of comparison to determine what the agency distribution for
7 http://www.eeoc.gov/federal/directives/qanda_md715.cfm The participation rate of the agency (with
500 or more permanent employees) which had the greatest participation rate of employees with targeted disabilities during the prior fiscal year.

EEOC FORM
U.S. Equal Employment Opportunity Commission
FEDERAL AGENCY ANNUAL EEO PROGRAM STATUS REPORT
Headquarters Department of the Army Page 87 of 98
persons with targeted disabilities should approximate. Within the Fed9 categories, only
laborers and helpers meet or exceed the EEOC standard as shown in figure 53.
Occupational Groups (05) No Disability
(01) Not Identified
(06 - 94) Disability
Targeted Disability
2.16%
Officials and Managers % 89.19% 1.94% 8.85% 0.570%
Professionals % 91.27% 1.78% 6.93% 0.549%
Technicians % 89.61% 2.00% 8.37% 0.726%
Sales Workers % 92.00% 0.00% 8.00% 0.000%
Administrative Support Workers % 87.60% 1.85% 10.53% 1.195%
Craft Workers % 91.28% 1.68% 7.02% 0.647%
Operatives % 90.00% 1.87% 8.12% 0.692%
Laborers and Helpers % 88.45% 1.27% 10.27% 2.935%
Service Workers % 91.34% 1.79% 6.85% 0.426%
Total % 90.03% 1.85% 8.13% 0.680%
Figure 53
The applicant pool data for persons with disabilities is shown in figure 54. The data
indicates that of the total ratio of applicants, almost 10% were persons with disabilities but
only .06% of the applicants were persons with targeted disabilities. The EEOC guidelines
for persons with targeted disabilities were met.
Group - FY 10 Persons with Disabilities
Apply Referred Selected
No Disability 1,823,401 435,625 19,842
Not Identified 46,442 12,100 428
With Disability 203,505 52,785 1,830
Total Disability 249,947 64,885 2,258
Targeted 12,085 2,933 109
Total 2,073,348 500,510 22,100
Percentages Apply Referred Selected
No Disability 87.9% 87.0% 89.8%
Not Identified 2.2% 2.4% 1.9%
With Disability 9.8% 10.5% 8.3%
Total Disability 12.1% 13.0% 10.2%
Targeted 4.8% 4.5% 4.8%
Figure 54

EEOC FORM
U.S. Equal Employment Opportunity Commission
FEDERAL AGENCY ANNUAL EEO PROGRAM STATUS REPORT
Headquarters Department of the Army Page 88 of 98
The data in figure 55 shows the distributions of the applicant pool based on the DOD
and EEOC goals for persons with disabilities. The application of the DOD 9% goal for
persons with disabilities would generate an expected result of 186k applicants having
disabilities, the actual number of applicants with disabilities was 250k as shown in figure
57; therefore the DOD goal was met. The number expected to be referred was 45k and the
Army’s actual number referred was almost 65k, therefore the goal was met. The number
expected to be selected was 1,989, and the actual number selected in Army was 2,258;
therefore the goal was met.
The evaluation of the goals accomplished by the Army for applicants with targeted
disabilities indicates that the EEOC goal was met, as shown in figure 58. The EEOC goal is
2%, which meant that the expected number of applicants with targeted disabilities is 5k,
the actual number of Army applicants with targeted disabilities just over 12k; the Army
goal for applicants was met. The expected number of persons referred was 1.3k, the actual
number referred was 2.9k; the Army goal was met. The goal for selections generated an
expectation that 45 persons would have been selected and the Army selected 109; the
selection goal was met.
Goals Expected to Apply
Expected to be
Referred
Expected to be
Selected
9.0% 186,601 45,046 1,989
Evaluation Met Met Met
2.0% 4,999 1,298 45
Evaluation Met Met Met
Figure 55
The population of persons with disabilities is multidimensional. The data in figure
56 shows the distribution of persons with disabilities by Race and Ethnicity Indicators
origin (RNO). There is no CLF for this data and no expected numbers were calculated. The
data shows that White men and women, followed by African American Men were the
largest population of persons with disabilities and targeted disabilities. This is expected
since these EEO groups are also the largest employee population.
Group - FY 10 Persons with Disability by RNO
No Disability
Not Identified
With Disability
Targeted Total Disabled
White Men 120,161 2,341 10,365 858 12,706
White Women 63,081 899 4,050 477 4,949
African American Men 22,391 512 2,333 125 2,845
African American Women 24,567 379 1,801 119 2,180

EEOC FORM
U.S. Equal Employment Opportunity Commission
FEDERAL AGENCY ANNUAL EEO PROGRAM STATUS REPORT
Headquarters Department of the Army Page 89 of 98
Group - FY 10 Persons with Disability by RNO
No Disability
Not Identified
With Disability
Targeted Total Disabled
Hispanic or Latino Men 9,097 176 862 71 1,038
Hispanic or Latino Women
5,059 78 368 24 446
Asian Men 5,785 105 342 23 447
Asian Women 4,736 75 221 30 296
Native Hawaiian or Other Pacific Islander Men
728 20 90 3 110
Native Hawaiian or Other Pacific Islander Women
648 12 43 2 55
American Indian or Alaska Native Men
1,544 52 210 14 262
American Indian or Alaska Native Women
978 18 83 7 101
Multiracial Men 4,211 170 581 40 751
Multiracial Women 3,197 75 284 18 359
Total Population 266,183 4,912 21,633 1,811 26,545
Men 163,917 3,376 14,783 1,134 18,159
Women 102,266 1,536 6,850 677 8,386
Figure 56
The data in figure 57 shows the percentage distribution of persons with disabilities by
RNO. The population of persons with disabilities is closely correlated to the individual
populations of each RNO group. However, the EEOC goal of 2% was not met.
Group - FY 10 Persons with Disability by RNO
No Disability
Not Identified
With Disability
Targeted Total Disabled
White Men 45.14% 47.66% 47.91% 47.38% 47.87%
White Women 23.70% 18.30% 18.72% 26.34% 18.64%
African American Men 8.41% 10.42% 10.78% 6.90% 10.72%
African American Women 9.23% 7.72% 8.33% 6.57% 8.21%
Hispanic or Latino Men 3.42% 3.58% 3.98% 3.92% 3.91%
Hispanic or Latino Women
1.90% 1.59% 1.70% 1.33% 1.68%
Asian Men 2.17% 2.14% 1.58% 1.27% 1.68%
Asian Women 1.78% 1.53% 1.02% 1.66% 1.12%
Native Hawaiian or Other Pacific Islander Men
0.27% 0.41% 0.42% 0.17% 0.41%
Native Hawaiian or Other Pacific Islander Women
0.24% 0.24% 0.20% 0.11% 0.21%
American Indian or Alaska Native and Alaskan Native Men
0.58% 1.06% 0.97% 0.77% 0.99%
American Indian or Alaska 0.37% 0.37% 0.38% 0.39% 0.38%

EEOC FORM
U.S. Equal Employment Opportunity Commission
FEDERAL AGENCY ANNUAL EEO PROGRAM STATUS REPORT
Headquarters Department of the Army Page 90 of 98
Group - FY 10 Persons with Disability by RNO
No Disability
Not Identified
With Disability
Targeted Total Disabled
Native and Alaskan Native Women Multiracial Men 1.58% 3.46% 2.69% 2.21% 2.83%
Multiracial Women 1.20% 1.53% 1.31% 0.99% 1.35%
Total Population 100.00% 100.00% 100.00% 100.00% 100.00%
Total with Disability 0.68% 9.97%
Men 61.58% 68.73% 68.34% 62.62% 68.41%
Women 38.42% 31.27% 31.66% 37.38% 31.59%
0.66% 8.20%
Figure 57
A major initiative in the Army’s persons with disabilities program is the
management of the efforts to support disabled veterans not only in employment efforts, but
as part of the overarching program for persons with disabilities. The population of veterans
is predictably large based on the Army mission. The data in figure 58 shows that slightly
more than 51% of Army veterans are white men followed by White women and African
American men and women.
Group - FY 10 Veterans Status
Veterans Percentage
30%DAV 30%Perc Population Percent
White Men 79,268 50.88% 12,552 50.08% 45.04%
White Women 25,763 16.53% 2,274 9.07% 23.64%
African American Men 18,086 11.61% 4,849 19.34% 8.42%
African American Women 12,942 8.31% 2,193 8.75% 9.26%
Hispanic or Latino Men 6,625 4.25% 1,116 4.45% 3.47%
Hispanic or Latino Women 2,059 1.32% 230 0.92% 1.92%
Asian Men 3,169 2.03% 365 1.46% 2.19%
Asian Women 1,367 0.88% 105 0.42% 1.80%
Native Hawaiian or Other Pacific Islander Men
540 0.35% 134 0.53% 0.28%
Native Hawaiian or Other Pacific Islander Women
232 0.15% 29 0.12% 0.24%
American Indian or Alaska Native Men
1,066 0.68% 202 0.81% 0.58%
American Indian or Alaska Native Women
429 0.28% 44 0.18% 0.37%
Multiracial Men 2,992 1.92% 754 3.01% 1.59%
Multiracial Women 1,271 0.82% 219 0.87% 1.19%
Total Population 155,809 100.00% 25,066 100.00% 100.00%
Figure 58

EEOC FORM
U.S. Equal Employment Opportunity Commission
FEDERAL AGENCY ANNUAL EEO PROGRAM STATUS REPORT
Headquarters Department of the Army Page 91 of 98
The applicant pool data for veterans who have a 30% of more compensated
disability is shown in figure 59. There is no CLF for this category of data but the majority of
applications received from veterans were received from veterans who are White men
followed by African American men and women, and from White women. Hispanic or Latino
men and women are the next largest group of applicants although the percentage of
Hispanic or Latino women in the selection process is low. There is no CLF for veterans and
therefore expected numbers were not calculated.
Group - FY 10 - 30% DAV Applied Percent Referred Referred Selected Selected
White Men 115,450 39.23% 31,995 41.62% 1518 48.50%
White Women 29,610 10.06% 7,101 9.24% 354 11.31%
African American Men 72,081 24.50% 18,075 23.51% 522 16.68%
African American Women 38,022 12.92% 9,223 12.00% 298 9.52%
Hispanic or Latino Men 12,273 4.17% 3,165 4.12% 104 3.32%
Hispanic or Latino Women 2,409 0.82% 676 0.88% 33 1.05%
Asian Men 3,884 1.32% 1,154 1.50% 48 1.53%
Asian Women 1,148 0.39% 251 0.33% 17 0.54%
Native Hawaiian or Other Pacific Islander Men
1,968 0.67% 605 0.79% 25 0.80%
Native Hawaiian or Other Pacific Islander Women
413 0.14% 130 0.17% 3 0.10%
American Indian or Alaska Native Men
0 0.00% 0 0.00% 0 0.00%
American Indian or Alaska Native Women
0 0.00% 0 0.00% 0 0.00%
Multiracial Men 12,387 4.21% 3,345 4.35% 159 5.08%
Multiracial Women 4,620 1.57% 1,146 1.49% 49 1.57%
Total Population 294,265 100.00% 76,866 100.00% 3130 100.00%
Figure 59

EEOC FORM
U.S. Equal Employment Opportunity Commission
FEDERAL AGENCY ANNUAL EEO PROGRAM STATUS REPORT
Headquarters Department of the Army Page 92 of 98
Appendix D
Command Summaries
The following information provides a sampling of the major accomplishments
provided by Army commands.
HQ Army Material Command (AMC)
Conducted college recruitment with 25 colleges in FY 10. Some of the colleges
visited were Alabama A&M, University of Alabama at Huntsville, UAB, Auburn,
University of Alabama, Mississippi State, and University of Mississippi.
Joint Munitions Command will have thirty-eight interns at thirteen locations
throughout the JMC/ASC beginning in Jan 2011; assignments are 10 to 15 weeks in
duration. The MCRP Team is continuing to refine the FY11 program; one goal is for
Rock Island to host a Diversity Workshop with all participating minority
institutions. For FY10, 67 students participated in the spring and summer programs.
In FY10, there were two awards to AAMU Research Institute (HBCU), and Chicago
State University (MI) with a total dollar value of $144,995.
The recruitment team attended events at various minority universities including
Delaware State, Virginia State, Howard University, Morgan State, Maryland Eastern
Shore, and North Carolina A&T. In addition, the team participated in specific
diversity-focused events to include the 9th Annual Latino Job Fair held in
Philadelphia, PA, the University of Virginia’s Diversity Job Fair, the Employment
Guide Diversity Job Fair held in Baltimore, MD, and the Diversity Job Fair held in
College Park, MD. The recruitment team also participated in job fairs aimed at
recruiting transitioning military veterans and more experienced, mid to senior level
job candidates through the Wounded Warrior Program, the VA Sponsored Veterans’
Job Fair, and company sponsored events such as Corporate Grey, Military Stars,
Recruit Military, and Tech Expo, held throughout Maryland, Pennsylvania, and
Virginia. The team also took part in job fairs held at Fort Meade, MD, Fort Dix, NJ,
and a West Point Job Fair held in Arlington, VA.
Tobyhanna Army Depot (TYAD) EEO Office arranged for a shadow program for 27
high school students from the Monroe Career and Technical Institute (MCTI). MCTI
is one of the most diverse schools in the local community, and their students
shadowed a variety of our employees, to include employees with positions in
carpentry; Heating, Ventilation and Air Conditioning (HVAC); automotive;

EEOC FORM
U.S. Equal Employment Opportunity Commission
FEDERAL AGENCY ANNUAL EEO PROGRAM STATUS REPORT
Headquarters Department of the Army Page 93 of 98
Automated Storage and Retrieval System (ASRS); security; sheet metal; machine
shop; welding; information technology; and electronics. In order to educate Monroe
County students about TYAD, TYAD arranged three visits to two Monroe County
high schools (Stroudsburg and East Stroudsburg South). The discussion panel
consisted of engineer and electronic employees who discussed the value of
absorbing the data being taught in the classroom. They put emphasis on the
benefits of paying careful attention during classroom instructions and its related job
benefits. TYAD also spoke about why TYAD is a great place to work and about the
Student Career Experience Program (SCEP).
RDECOM signed a Cooperative Research and Development Agreement (CRADA)
with Morgan State University on 10 May 2010. The CRADA formalizes a partnership
between RDECOM and the university to work on research projects through school
laboratories, personnel, facilities, equipment and other resources. The partnership
reinforces the command’s expanding teamwork between Aberdeen Proving Ground,
Maryland and local universities.
HQ TACOM actively pursues relations with several minority institutions:
Coordinated job fairs with CPAC, ILSC, TACOM Contracting (TCC), and TARDEC at
Wilberforce, Central State, Texas-San Antonio. Visited the Michigan and Michigan
State Universities career services in an effort to build a partner and gain access to
student minority clubs/organizations.
On 25 August 2010, the HQ TACOM EEO Office hosted a visit from Wilberforce
University, Wilberforce, Ohio. Wilberforce is historically Black university near the
metropolitan Dayton, Ohio area. The visit consisted of briefs from the Integrated
Logistics Service Center (ILSC), TACOM Contracting Command (TCC), G-1, Civilian
Personnel Advisory Center (CPAC) followed by a tour of TARDEC facilities and brief
in the afternoon. The attendees from Wilberforce were the Senior Dean, Business &
Engineering; Career Services Director; and other principal staff from the Business
and Engineering Department, Wilberforce, OH.
Anniston Army Depot has partnered with local schools in the Mentoring Program
for many years; the participation has increased through the years to include
sponsoring mentors at eighteen (18) schools in four (4) school systems: Oxford City
Schools, Anniston City Schools, Calhoun County Schools and Gadsden City Schools.
ANAD currently has a roster of 80 mentors. The mentoring program assists at-risk

EEOC FORM
U.S. Equal Employment Opportunity Commission
FEDERAL AGENCY ANNUAL EEO PROGRAM STATUS REPORT
Headquarters Department of the Army Page 94 of 98
students in academics, emotional conflicts, self-concept, and critical thinking skills.
Students with language and cultural barriers are included in those considered at-
risk.
HQ USA EUROPE
A USAREUR European Diversity Council is being re-established to coordinate
installation programs and activities that enhance development and employment;
improve and promote training of special emphasis program managers; serve as an
informal liaison and provide online training that enhances cultural awareness; serve
as a networking and sharing resource to communicate and exchange information
about programs, advancement, education, and training to further goals of
establishing a model EEO program. Information about employment for disabled
veterans will be shared and posted on the Council’s webpage for dissemination at
installations across Europe.
HQ INSTALLATION MANAGEMENT COMMAND
IMCOM is committed to taking care of people as evidenced by numerous efforts to
keep the workforce informed on major initiatives such as Base Realignment and
Closure (BRAC), Joint Basing and Transformation. This commitment is further
demonstrated by routine strategic communication to the workforce via various
social media sites such as Facebook and Twitter. Other communication vehicles
include the D6 Sends Articles, Town Hall and the AUSA Installation Management
Campaign Plan Roll-out Conference.
HQ IMCOM continues its efforts to develop and deploy the web-based Equal
Employment Opportunity Self Assessment Tool (EEOSAT) enterprise wide in FY
2010. EEOSAT creates efficiencies and serves to measure the effectiveness of EEO
programs at the garrisons. This tool gives the operating EEO Office control at the
first stage of the evaluation process to identify program strengths and/or
weaknesses and helps to develop strategies for improvement. The EEOSAT, via
three distinct survey Modules (employee, manager/supervisor, and EEO staff)
collects information from all major program areas for an accurate picture of the
total EEO operation. This approach provides a 360 degree snapshot of the EEO
program at that particular point in time. Once results are evaluated, the HQ IMCOM
staff in conjunction with the Garrison staff prepares an action plan to address non-
compliance issues identified in the assessment.

EEOC FORM
U.S. Equal Employment Opportunity Commission
FEDERAL AGENCY ANNUAL EEO PROGRAM STATUS REPORT
Headquarters Department of the Army Page 95 of 98
Training via webcast was available to all IMCOM EEO Disability Program Managers
by EEOC and OPM trainers on Oct. 26, 2010. The training was entitled, “How To
Comply With The Executive Order 13548 And Actually Increase Federal
Employment Of Individuals With Disabilities At Your Agency.” The training
provided Disability Program Managers with relevant, practical and useful
information.
The Americans with Disabilities Act Amendments Act of 2008 teleconference
training has been held at numerous IMCOM installations during FY 2010. The
training is targeted for EEO Managers, Labor Counselors, and Personnelists and is
eligible for 1.5 hours of Continuing Legal Education credit. Fort Bragg’s EEO office
serves as an example; providing training to 179 managers and supervisors on the
Americans With Disabilities Act Amendments Act of 2008; an Equal Employment
Opportunity Commission Administrative Judge facilitated the training and discussed
amendments to the ADA and responsibilities of managers and supervisors under the
law.
The Fellows Program is a five-year program which was established to create future
multi-functional leaders for the Army. During the course of the program, Fellows
earn master’s degrees and begin a series of on-the-job training assignments in
which they learn two career programs. Fellows are on ACTEDS rolls and funding for
the first two years of training and thereafter are transferred to HQ IMCOM rolls for
the duration of their training prior to final placement. IMCOM currently employs 8
Fellows (3 Fellows from Class 6 graduating in July 2010; 5 Fellows from Class 7
graduating in July 2011). IMCOM gained 4 Fellows in July 2009 (Class 8 graduating
in July 2012) and due to a program change, 7 Fellows in August (Class 9 graduating
in July 2013).
Newly established EEO Program: implementation of the FMWRC and AEC EEO
Program that exclusively serviced FMWRC and AEC. Both developed Mid Point MD
715 Reports as their baseline. The FMWRC and AEC EEO team hit the ground
running to ensure sexual harassment and EEO training was conducted for all of the
AFRC employees and that Directors and leaders receive staff assistance visits when
they are made aware of potential trends or issues negatively affecting the
organization.

EEOC FORM
U.S. Equal Employment Opportunity Commission
FEDERAL AGENCY ANNUAL EEO PROGRAM STATUS REPORT
Headquarters Department of the Army Page 96 of 98
In the West Region, USAG Carson chartered an EEO Council whose purpose is to
have regular, proactive and effective dialogue with senior leaders concerning EEO
and diversity issues impacting the workforce.
During FY 2010, the European EEO Regional Director continued to emphasize that
garrisons must provide consistent EEO services to their customers and ensure
timely complaint processing. As a result of this focus the Region’s overall EEO
performance rating for FY 2010 was green. Workforce Recruitment Program
(WRP): Eight college students were placed throughout the Europe Region during the
FY 2010 WRP season. The WRP student employed at the USAG Heidelberg EEO
Office was instrumental in the production of several marketing tools to advertise the
program including a “WRP Supervisor Information Guide.”
The Fort Carson Employment Services Office of Personnel Management (OPM)
Representative is fully immersed in assisting the Washington based Veterans
Employment Services Team in the strategic planning and follow-on execution in
support of the Presidential Executive Order aimed at hiring more Veterans to work
in the federal government. Through the efforts of the Fort Carson OPM
Representative in collaboration with the Wounded Warrior Occupational Therapist
and the Army Career and Alumni Program (ACAP) the Operation Warfighter
Program in Colorado stood up in January 2010. Combined with FY09 and now, a
total of 43 have been hired with 12 potential hires.
Workforce Recruitment Program (WRP): In February 2010, the HQ IMCOM SEPM
served as a WRP Recruiter interviewing numerous college students for summer
employment. For the summer of FY 2010, fifteen placements have been made; in
the Southeast Region: 2 at Fort Benning and 2 at Fort Bragg. In the North East
Region, a WRP student was selected for placement at the US Army Garrison, Rock
Island Arsenal, one at Fort Monroe and one at Fort Belvoir. In the Korea Region,
USAG Humphreys acquired 2 new college student employees and USAG Yongsan
acquired one new college student through WRP. In the Europe Region, three WRP
students were selected for placement at the US Army Garrison, Ansbach. Finally, in
the West Region, one WRP placement was made at Fort Bliss and on at Presidio of
Monterey
SPACE MISSILE DEFENSE COMMAND
EEO collaborated with the G1 office in developing a recruitment schedule for FY
2010 to visit minority institutions for recruiting entry level positions. Command
management representatives visited Alabama A&M University (AAMU), a local

EEOC FORM
U.S. Equal Employment Opportunity Commission
FEDERAL AGENCY ANNUAL EEO PROGRAM STATUS REPORT
Headquarters Department of the Army Page 97 of 98
Historically Black College/University (HBCU), to attend a career fair for recruiting
students under the Student Career Experience Program (SCEP). Those
organizations requiring resumes from minority institutions were assisted by the G1
office through posting of student/intern vacancies on electronic bulletin boards at
various minority universities.
Assisted some organizations in collecting resumes through networking with deans
of engineering schools at HBCUs. During FY 2010, the MCRP manager visited an
HBCU, Jackson State University in Mississippi, and met with university placement
office officials to review their career center, and inform them about jobs within
USASMDC/ARSTRAT. Resumes were also collected for vacant entry level
engineering positions and disseminated to supervisors with entry level positions.
The command continues to hire/recruit students under the SCEP appointing
authority and Federal Career Intern Program (FCIP). During FY 2010, there were a
total of 4 students recruited and hired under SCEP and FCIP appointments from
HBCUs. Seven students were hired under the SCEP in FY 2010 which was a
significant increase over the one hire in FY 2009.
The command participated in the employment of students under the STEP in FY
2010 by hiring 3 students. The STEP workforce for FY 2010, consisting of FY 10
gains and prior students, was a total of 14 students. The STEP student workforce
has historically served as a source for converting students to the SCEP for future
employment with the command.
RESERVE COMMAND
Conducted 20 Staff Assistance Visits (SAV) in FY10 and provided training at 154
different training forums in 58 different locations across the United States and
Puerto Rico. Over 5,700 employees received some form of in-person EEO training; a
72% increase from FY09. A total of 3,446 employees received in-person sexual
harassment training by a member of the EEO Staff, which amounts to approximately
27% of the total workforce. Because of the transition of distance learning
courseware from the Virtual University to the Army Learning Management System
(ALMS), there was a loss in data on the number of employees who completed on-
line sexual harassment training in FY10. More than a quarter of employees

EEOC FORM
U.S. Equal Employment Opportunity Commission
FEDERAL AGENCY ANNUAL EEO PROGRAM STATUS REPORT
Headquarters Department of the Army Page 98 of 98
completed No FEAR Act training in FY10. No FEAR Act training was provided in-
person to 472 employees and an additional 2,950 employees completed the course
on-line. This represents a 40% increase from FY09. In total, 48% of the workforce
has completed this bi-annual training in a timely fashion.
SPECIAL OPERATIONS COMMAND
Community Outreach: Members of USASOC's EEO staff attended the Sanderson
High School 5th Annual Hispanic or Latino Career Fair, Raleigh, NC, to provide
employment information to students, faculty, and members of the Hispanic or
Latino community. The staff set up an informational display and shared
information about federal employment and career opportunities to include
information regarding USASOC's Student Educational Employment Program (SEEP).
Approximately 200 students ranging from ninth to twelfth grades participated in
the fair. Many students were interested in the Call to Serve initiative and the fact
that they could serve their country as civilians in the federal government. The Call
to Serve initiative is aimed at highlighting the importance of recruiting and
maintaining a well-qualified, diverse civil service workforce.
Minority College Relations Program (MCRP): USASOC has cooperative educational
employment agreements with two Historically Black Colleges and Universities
(HBCUs), Fayetteville State University in Fayetteville, NC and Savannah State
University in Savannah, GA. An agreement is being finalized with North Carolina
A&T State University in Greensboro, to increase the number of participating HBCUs
to three. In FY 10, 54 college students participated in the MCRP.