fy 2011 federal agency annual eeo program status report 2011 - for... · fy 2011 federal agency...
TRANSCRIPT

FY 2011
FEDERAL AGENCY
ANNUAL EEO PROGRAM STATUS REPORT
MANAGEMENT DIRECTIVE 715
U.S. Department of Commerce National Oceanic and Atmospheric Administration
Civil Rights Office
_______________________________________________________
OCTOBER 1, 2010 TO SEPTEMBER 30, 2011

2
TABLE OF CONTENTS
I. Agency Information (MD-715-01 Parts A – D)………………………………………….3
II. Executive Summary (MD-715-01 Part E)…………………………………………….....7
III. Certification of Establishment of Continuing EEO Programs (MD-715-01 Part F)....14
IV. Agency Self-Assessment Checklist (MD-715-01 Part G)…………………………….15
V. EEO Plans (MD-715-01 Part H)…………………………………………………………32
VI. Plan for Barrier Elimination (MD-715-01 Part I)………………………………………..33
VII. Employment Plan for Individuals w/Targeted Disabilities (MD-715-01 Part J)…….39
VIII. Attachments • Workforce Data Table A Analysis • Workforce Data Table B Analysis • MD-715 Terminology and Definitions • Federal EEO Statistical Report of Discrimination Complaints (EEOC Form 462) • Federal Equal Opportunity Recruitment Plan (FEORP) • Civil Rights Program Strategic Plan • Organization Chart • NOAA EEO Policy Statement

3
EEOC FORM 715-01 PART A - D
U.S. Equal Employment Opportunity Commission FEDERAL AGENCY ANNUAL EEO PROGRAM STATUS REPORT
For period covering October 1, 2010 to September 30, 2011
PART A
Department or Agency Identifying Information
1. Agency U.S. Department of Commerce
1.a. 2nd level reporting component National Oceanic and Atmospheric Administration
1.b. 3rd level reporting component
1.c. 4th level reporting component
2. Address Herbert C. Hoover Building, Room 5128 14th and Constitution Avenue, N.W., OR 1305 East West Highway SSMC4, Room 7500
3. City, State, Zip Code Washington, DC 20230 OR Silver Spring, MD 20910
4. CPDF Code 5. FIPS code(s) 1330 4. CM54 5. 11 – DC 24031 – MD
PART B
Total Employment
1. Enter total number of permanent full-time and part-time employees
12,687
2. Enter total number of temporary employees 378
3. Enter total number employees paid from non-appropriated funds
Not Available
4. TOTAL EMPLOYMENT [add lines B 1 through 3] 13,065
PART C
Agency Official(s)
Responsible For
1. Head of Agency Official Title
Jane Lubchenco, Ph.D., Administrator, NOAA
2. Agency Head Designee Edward C. Horton, Chief Administrative Officer
3. Principal EEO Director/Official Official Title/series/grade
Joseph E. Hairston, Director, Civil Rights Office ZA-260-V

4
Oversight of EEO
Program(s)
4. Title VII Affirmative EEO Program Official
4. Coneshea Simpson, EEO Specialist
5. Section 501 Affirmative Action Program Official
5. N/A
6. Complaint Processing Program Manager
6. Carol Summers, EEO Specialist
7. Other Responsible EEO Staff 7. Helen Buggs, EEO Specialist Michelle Moore, EEO Specialist Jeanette Toledo, EEO Specialist Tillman Peck, Data Analyst Monica Hodnett, EEO Assistant

5
EEOC FORM
715-01 PART A - D U.S. Equal Employment Opportunity Commission
FEDERAL AGENCY ANNUAL EEO PROGRAM STATUS REPORT
PART D
List of Subordinate Components Covered in This Report
Subordinate Component and Location (City/State)
CPDF and FIPS codes
National Weather Service (NWS) Silver Spring, MD
CM54 24031
National Ocean Service (NOS) Silver Spring, MD
CM54 24031
National Marine Fisheries Service (NMFS) Silver Spring, MD
CM54 24031
Office of Oceanic and Atmospheric Research Silver Spring, MD/Boulder, CO
CM54 24031/08013
National Environmental Satellite, Data and Information Service (NESDIS) Silver Spring, MD
CM54 24031
Office of Marine and Aviation Operations (OMAO) Silver Spring, MD
CM54 24031
NOAA Staff Offices Washington, DC & Silver Spring, MD
CM54 24031
EEOC FORMS and Documents Included With This Report
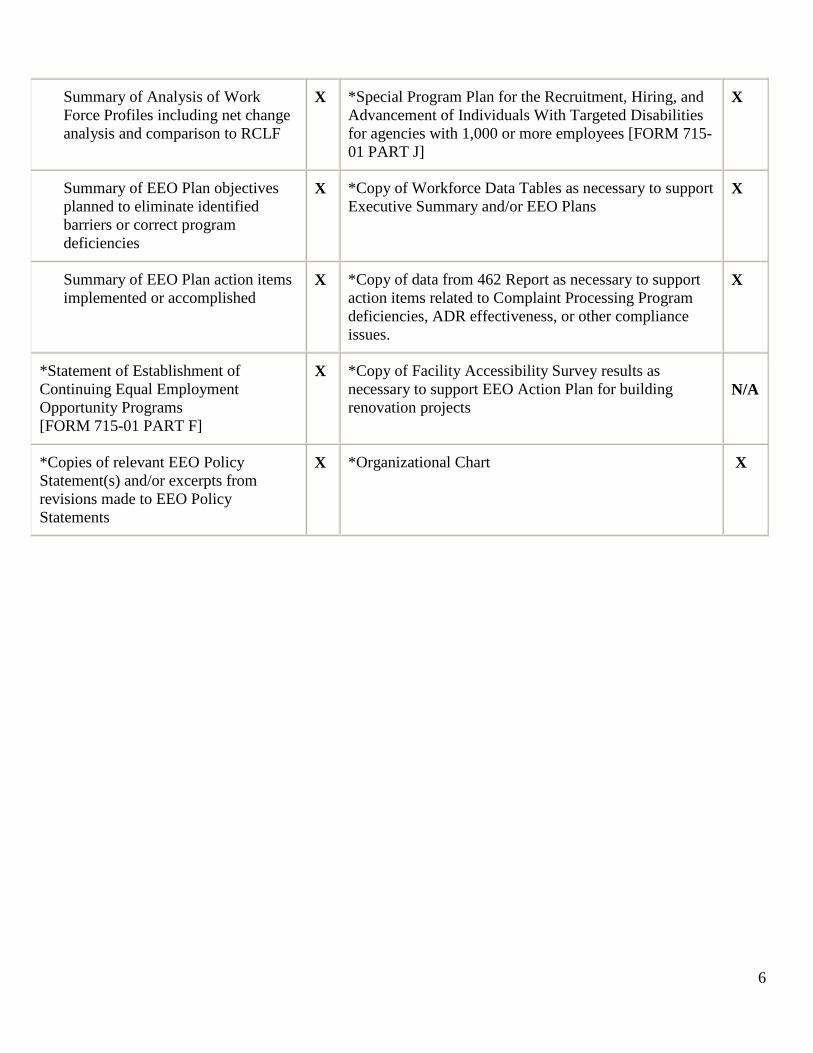
*Executive Summary [FORM 715-01 PART E], that includes:
X *Optional Annual Self-Assessment Checklist Against Essential Elements [FORM 715-01PART G]
X
Brief paragraph describing the agency's mission and mission-related functions
X *EEO Plan To Attain the Essential Elements of a Model EEO Program [FORM 715-01PART H] for each programmatic essential element requiring improvement
X
Summary of results of agency's annual self-assessment against MD-715 "Essential Elements”
X *EEO Plan To Eliminate Identified Barrier [FORM 715-01 PART I] for each identified barrier
X
6
Summary of Analysis of Work Force Profiles including net change analysis and comparison to RCLF
X *Special Program Plan for the Recruitment, Hiring, and Advancement of Individuals With Targeted Disabilities for agencies with 1,000 or more employees [FORM 715-01 PART J]
X
Summary of EEO Plan objectives planned to eliminate identified barriers or correct program deficiencies
X *Copy of Workforce Data Tables as necessary to support Executive Summary and/or EEO Plans
X
Summary of EEO Plan action items implemented or accomplished
X *Copy of data from 462 Report as necessary to support action items related to Complaint Processing Program deficiencies, ADR effectiveness, or other compliance issues.
X
*Statement of Establishment of Continuing Equal Employment Opportunity Programs [FORM 715-01 PART F]
X *Copy of Facility Accessibility Survey results as necessary to support EEO Action Plan for building renovation projects
N/A
*Copies of relevant EEO Policy Statement(s) and/or excerpts from revisions made to EEO Policy Statements
X *Organizational Chart X

7
EEOC FORM
715-01 PART E U.S. Equal Employment Opportunity Commission
FEDERAL AGENCY ANNUAL EEO PROGRAM STATUS REPORT
NATIONAL OCEANIC AND ATMOSPHERIC ADMINISTRATION For Period Covering October 1, 2010 to September 30, 2011
EXECUTIVE SUMMARY INTRODUCTION On October 1, 2003, Management Directive 715 (MD-715) became effective. Title VII of the Civil Rights Act of 1964, as amended, and Section 501 of the Rehabilitation Act of 1973, as amended, require federal agencies to take proactive steps to ensure equal employment opportunity for all employees and applicants for employment. This means that agencies must work to proactively prevent potential discrimination before it occurs and establish systems to monitor compliance with Title VII. MISSION AND VISION-RELATED FUNCTIONS NOAA’s mission is to understand and predict changes in climate, weather, oceans, and coasts; to share that knowledge and information with others, and to conserve and manage coastal and marine ecosystems and resources. Our vision of the future incorporates healthy ecosystems, communities, and economies that are resilient in the face of change. NOAA, one of several operating units within the U.S. Department of Commerce (DOC), provides a variety of services to the Nation. NOAA’s goals are: 1) climate adaption and mitigation, 2) a weather-ready nation, 3) healthy oceans, and 4) Coastal and Great Lake communities that are environmentally and economically sustainable. These services are provided by NOAA’s National Weather Service (NWS); National Marine Fisheries Service (NMFS); National Ocean Service (NOS); National Environmental Satellite, Data and Information Service (NESDIS); Office of Oceanic and Atmospheric Research (OAR); and the Office of Program Planning and Integration (PPI). NOAA’s major occupations include the following job series: Meteorologist, Fishery Biologist, Computer Science/Information Technology Specialist, and Electronic Engineer. WORKFORCE ANALYSIS SUMMARY During FY 2011, NOAA’s total workforce (permanent, temporary, and term) included 13,0651
1 The demographic data for this report is based on the MD-715 Data Tables provided to NOAA by the Department of Commerce’s Office of Civil Rights. MD-715 requires that the data include all employees who appeared on the rolls at any time during the year. This is different than typical data reports or references, which are snapshot, and “as of” a certain time of the year, i.e., September 30.
total employees. This represents an increase from the FY 2010 workforce (13,043) of 22 individuals (0.2%). An analysis of the workforce data shows several trends. Hispanic males and females, White females, African American males and females, American Indian/Alaska Native females and Multiple Race males and females have lower than

8
expected participation rates when compared to their availability in the Civilian Labor Force (CLF). Although the number of Hispanic females, White females, African American males, and Multiple Race males and females increased, the participation rates remained below the CLF. The following EEO groups are above or equal to the CLF:
• White males • Asian males and females • Native Hawaiian or Other Pacific Islander males and females • American Indian or Alaska Native males
During FY 2011, NOAA also experienced declining participation rates among some EEO groups. Those groups affected include Black females by 2.7%, American Indian/Alaska Native males by 5.0%, and American Indian/Alaska Native females by 7.1%. During this same time period, the number of permanent employees with disabilities increased by 25. The participation rate of NOAA employees with targeted disabilities remains at 0.6%, substantially below the 2% Federal Goal2
.
NOAA’s largest groups of permanent employees with targeted disabilities are in the following categories: mental illness (18), deafness (16), and blindness (14). AGENCY SELF ASSESSMENT SUMMARY OF THE “ESSENTIAL ELEMENTS” A. Demonstrated commitment from agency leadership.
Strengths:
• The EEO/Anti-harassment policy statement was re-issued and posted throughout the various facilities. Reasonable accommodations procedures were disseminated on NOAA’s Web site.
• Employees promoted into supervisory positions are provided mandatory EEO training. • The Workforce Management Office (WFMO) conducts a quarterly Supervisory Training Program
that includes EEO-related workshops.
• The Civil Rights Office staff is adequately trained to ensure that EEO programs and procedures are effectively implemented.
• SES-level executives were evaluated on their compliance and commitment to EEO.
2 In FY 2009 NOAA adopted the Federal Goal of 2% participation of employees with targeted disabilities, and therefore is using that figure as the benchmark for comparison. The EEOC has recommended a goal of 2% as a part of the Leadership for the Employment of Americans with Disabilities (LEAD) initiative to address the declining number of employees with targeted disabilities in the federal workforce. In a training of Disability Program Managers, EEOC formally announced that the Federal High would no longer be used--instead the benchmark will be the Federal Goal of 2%.

9
• Line/Staff Civil Rights Offices conducted training on various EEO-related subjects.
• All National Environmental Satellite Data & Information Service (NESDIS) employees are required to participate in at least one EEO/Diversity activity annually.
• NESDIS senior managers held their EEO & Diversity Council Meeting, which included
presentations on hiring persons with disabilities and reasonable accommodation.
Deficiencies: There are no deficiencies in this element. B. Integration of EEO into the agency’s strategic mission
Strengths:
• A State of the Agency briefing on MD-715 was presented to the Human Resource Council by the Civil Rights Director.
• NOAA’s Line and Staff Office representatives drafted a Framework Plan on Workforce Diversity
aimed at addressing the full employment lifecycle as well as the full spectrum of diversity, including education, planning, accountability, and recruitment.
• The Civil Rights Director and EEO Program Managers attend weekly senior staff meetings. • NMFS designated an FTE for a Special Emphasis Program Manager (SEPM) for Persons with
Disabilities.
• The Office of the Chief Administrative Officer (OCAO) hosted two (2) Student Interns in the Hispanic Association of Colleges and Universities (HACU) National Internship during the summer session and summer work opportunities for two (2) students in the DC Summer Youth Employment Program.
• NESDIS serves on the planning committee for the Perspectives on Employment of Persons with
Disabilities Training and leads the exhibit hall at the Society for the Advancement of Chicanos and Native Americans in Science (SACNAS) Conference.
• OAR produced and distributed fact sheets on Asian American Pacific Islander Heritage Month, and
Lesbian, Gay Bisexual, Transgender (LGBT) Month. • OAR provided funding support and participated in the Northwest Indian College (NWIC) Career
Fair and Training Symposium. • OAR participated in the Society of American Indian Government Employees (SAIGE) conference. • NOS hired a summer intern and provided host assignments for interns via the Student Temporary
Employment Program (STEP) to work on mission-related occupations. NOS also provided 33 host assignments for Undergraduate Scholars.

10
• NWS participated in the Northwest Indian College (NWIC) two-day Career Fair and Training Symposium, providing networking opportunities, presenters, and workshops to promote student success.
• The Office of National Marine Sanctuaries, in partnership with Murrain Associates, Inc. and the
National Association of Black Scuba Divers (NABS) launched a website highlighting untold stories of African-Americans and the sea in order to foster participation in marine science education and careers and to encourage greater ocean conservation awareness among African-Americans.
• NOS supported three (3) NABS students by providing a training opportunity at Thunder Bay. • NOS hired a person with disabilities through the Department of Labor’s Workforce Recruitment
Program (WRP) and hired two (2) veterans through the Operation Warfighter intern program. • Through the Science, Technology, Engineering, and Mathematics (STEM) Program, NOS provided
a host assignment for a senior at Albert Einstein High School.
• The NMFS sponsored 12 employees (2 White males, 4 White females, 1 African American male, and 5 African American females) in the Undergraduate Academic Program (UPA).
Deficiencies: The Civil Rights Director does not report directly to the agency head. However, the Civil Rights Director regularly participates in the Human Resource Council Meeting and other high level meetings which serve as a forum to communicate the status and effectiveness of EEO programs.
C. Management and Program Accountability
Strengths:
• The Civil Rights Office provided EEO complaint activity updates to Line/Staff EEO Program Managers in order to analyze trends and proactively address potential discriminatory actions.
• The Office of the Chief Administrative Officer Human Capital Advisor regularly communicates with
hiring officials to ensure that personnel policies and procedures are applied fairly and equitably and that alternative hiring options are considered.
• OAR hired a Schedule A applicant at the OAR laboratory in Boulder, Colorado. • NWS conducted a Technical Assistance Visit to its Southern Region to ensure consistent compliance
with MD-715 requirements and the essentials for a Model EEO Program.
• The Workforce Management Office (WFMO) introduced a tool for hiring managers which provides information on qualified applicants who are eligible for Schedule A or one of the Disabled Veterans Hiring Authorities.

11
• The CRO hosted a training session with the Department and Line/Staff EEO Program Managers
(including grants officers and outreach coordinators) on the new guidelines for annual Minority-serving Institutions (MSI) reporting.
Deficiency: There are no deficiencies in this element.
D. Proactive prevention of unlawful discrimination
Strengths:
• WFMO developed an Alternative Dispute Resolution (ADR) component for NOAA’s Leadership Training Program to increase ADR knowledge for new supervisors.
• NESDIS conducts quarterly meetings with senior managers to identify trends in performance and
conduct issues to proactively prevent unlawful discrimination. • NMFS established Equal Employment Opportunity Advisory Committees and Work-life Diversity
Groups to assist in the identification of employee issues/barriers.
• NOAA supported nine Special Emphasis Programs and other cultural-related events. Deficiency: The participation of supervisors and managers in the ADR process is not required. Departmental policy on ADR requires that ADR be voluntary for all parties.
E. Efficiency
Strengths: • CRO utilizes iComplaints as a tool to track and monitor the status of EEO complaints.
• WFMO designated a new Reasonable Accommodations Coordinator to review and process all
request for reasonable accommodations.
• CRO ensured that newly elected EEO counselors received the required 32 hours of training and the annual 8-hour refresher training for all EEO counselors.
• At a minimum, 90% of all reasonable accommodation requests are processed within the required
timeframes. Deficiency: The agency does not track recruitment efforts and analyze efforts to identify potential barriers.

12
F. Responsiveness and legal compliance.
Strengths:
• NOAA was in compliance with federal EEO statues and regulations, policy guidance, and other applicable written instructions with respect to responsiveness and legal compliance.
• Monetary agreements were timely processed, and documentation for compliance was promptly
provided and reviewed by the CRO.
Deficiencies: There are no deficiencies in this element.
SUMMARY OF EEO PLAN OBJECTIVES TO ELIMINATE IDENTIFIED BARRIERS – PART I PLAN SUMMARIES An analysis of NOAA’s workforce data tables A and B shows several “triggers” at various stages of the employment cycle. These analyses have been included behind tab 8 of this year’s report. NOAA developed three (3) Part I Plans to initiate in FY 2012. The Part I Plans address the following conditions: 1) the low participation rates of women at the GS-13 (or equivalent) and above; 2) the low participation rates of Hispanic Fishery Biologist; and 3) the low participation rates of individuals with targeted disabilities. Part I Plan #1 addresses the low participation of women in higher graded positions. During FY 2012, the CRO will conduct a barrier analysis to identify the root cause of this condition. Part I Plan #2 focuses on the low participation rates of Hispanics in NOAA’s Fishery Biologist positions. The CRO will collaborate with WFMO and Line Office EEO Program Mangers to determine if current databases will allow the tracking of applicant flow data, and conduct outreach/education campaigns in predominantly Hispanic communities/colleges and universities to increase awareness of fish biology careers. Part I Plan #3 addresses the low participation rate of employees with targeted disabilities. As participation rates remain unchanged on an annual basis, this appears to be a negative trend. This condition will be addressed through implementation of the NOAA-wide Diversity Recruitment Plan. EEO COMPLAINT TRENDS According to the FY 2011 EEOC-462 Report, the NOAA Civil Rights Office processed 99 requests for EEO counseling. This represents no change as compared to FY 2010. In addition, the use of Alternative Dispute Resolution (ADR) remained at 18 in FY 2011. However, of those that elected ADR, 7 (39%) were settled, which represents an increase of 2 as compared to 5 in FY 2010. We will continue to encourage managers and employees to utilize the ADR process to resolve workplace conflict. During FY 2011, NOAA experienced an increase of 7 (12%) in the number of formal complaints from 60 in FY 2010 to 67 in FY 2011. Reprisal and age continued as the top two (2) bases, the same as they were for the last five fiscal years. Harassment (non-sexual) continued to be the highest raised issue in FY 2011, with Evaluation/Appraisal and Time and Attendance among the next highest set of issues. The NOAA CRO will

13
continue to collaborate with the Line Office EEO Program Managers to address these current trends through training and other measures. CONCLUSION During Fiscal Year 2011, NOAA moved closer to achieving the goal of becoming a model EEO agency. The self-assessment showed that NOAA met all but two (2) of the basic compliance measures required of a model EEO agency. NOAA’s workforce demographics by ethnicity, race, sex, and disability show that while the workforce is stable and growing slightly, the agency is still not as diverse as the general population of the country. The agency remains committed to examining the reasons for the low participation rates by conducting a thorough barrier analysis on identified triggers and implementing the Framework Plan on Workforce Diversity. In looking toward Fiscal Year 2012, the CRO will continue to strengthen relationships with key stakeholders across the agency and provide sound guidance and education to the Line and Staff Offices and other partners on issues relating to MD-715. The agency will work to address the identified compliance measures that were not met in FY 2011. In order to achieve these goals over the coming year, the NOAA CRO will continue its efforts to promote MD-715 as a year round process and a paradigm shift from reactive to pro-active prevention.


15
EEOC FORM
715-01 PART G U.S. Equal Employment Opportunity Commission
FEDERAL AGENCY ANNUAL EEO PROGRAM STATUS REPORT AGENCY SELF-ASSESSMENT CHECKLIST MEASURING ESSENTIAL ELEMENTS
NATIONAL OCEANIC AND ATMOSPHERIC ADMINISTRATION – FY 2011
Essential Element A: DEMONSTRATED COMMITMENT FROM AGENCY LEADERSHIP Requires the agency head to issue written policy statements ensuring a workplace free of discriminatory harassment and a commitment to equal employment opportunity.
Compliance Indicator
EEO policy statements are up-to-date.
Measure has been
met
For all unmet measures,
provide a brief explanation in
the space below or complete and
attach an EEOC FORM
715-01 PART H to the agency's status report
Measures Yes No
The Agency Head was installed on March 20, 2009. The EEO policy statement was issued on September 30, 2010. Was the EEO policy Statement issued within 6 - 9 months of the installation of the Agency Head? If no, provide an explanation.
X
During the current Agency Head's tenure, has the EEO policy Statement been re-issued annually? If no, provide an explanation.
X
Are new employees provided a copy of the EEO policy statement during orientation?
X
When an employee is promoted into the supervisory ranks, is s/he provided a copy of the EEO policy statement?
X
Compliance Indicator
EEO policy statements have been communicated to all employees.
Measure has been
met
For all unmet measures,
provide a brief

16
Measures Yes No explanation in the space below or complete and
attach an EEOC FORM
715-01 PART H to the agency's status report
Have the heads of subordinate reporting components communicated support of all agency EEO policies through the ranks?
X
Has the agency made written materials available to all employees and applicants, informing them of the variety of EEO programs and administrative and judicial remedial procedures available to them?
X
Has the agency prominently posted such written materials in all personnel offices, EEO offices, and on the agency's internal website? [see 29 CFR §1614.102(b)(5)]
X
Compliance Indicator
Agency EEO policy is vigorously enforced by agency management.
Measure has been
met
For all unmet measures,
provide a brief explanation in
the space below or complete and
attach an EEOC FORM
715-01 PART H to the agency's status report
Measures Yes No
Are managers and supervisors evaluated on their commitment to agency EEO policies and principles, including their efforts to:
X
- resolve problems/disagreements and other conflicts in their respective work environments as they arise?
X
- address concerns, whether perceived or real, raised by employees and following-up with appropriate action to correct or eliminate tension in the workplace?
X
- support the agency's EEO program through allocation of mission personnel to participate in community out-reach and recruitment programs with private employers, public schools and universities?
X
- ensure full cooperation of employees under his/her supervision with EEO X

17
office officials such as EEO Counselors, EEO Investigators, etc.?
- ensure a workplace that is free from all forms of discrimination, harassment and retaliation?
X
- ensure that subordinate supervisors have effective managerial, communication and interpersonal skills in order to supervise most effectively in a workplace with diverse employees and avoid disputes arising from ineffective communications ?
X
- ensure the provision of requested religious accommodations when such accommodations do not cause an undue hardship?
X
- ensure the provision of requested disability accommodations to qualified individuals with disabilities when such accommodations do not cause an undue hardship?
X
Have all employees been informed about what behaviors are inappropriate in the workplace and that this behavior may result in disciplinary actions?
X Annual EEO Policy Statement
Describe what means were utilized by the agency to so inform its workforce about the penalties for unacceptable behavior.
Have the procedures for reasonable accommodation for individuals with disabilities been made readily available/accessible to all employees by disseminating such procedures during orientation of new employees and by making such procedures available on the World Wide Web or Internet?
X
Have managers and supervisor been trained on their responsibilities under the procedures for reasonable accommodation?
X
Essential Element B: INTEGRATION OF EEO INTO THE AGENCY'S STRATEGIC MISSION Requires that the agency's EEO programs be organized and structured to maintain a workplace that is free from discrimination in any of the agency's policies, procedures or practices and supports the agency's strategic mission.
Compliance Indicator
The reporting structure for the EEO Program provides the Principal EEO
Official with appropriate authority and
Measure has been
met
For all unmet measures, provide a brief explanation in

18
Measures resources to effectively carry out a successful EEO Program.
Yes No the space below or complete and attach an EEOC FORM 715-01
PART H to the agency's status report
Is the EEO Director under the direct supervision of the agency head? [see 29 CFR §1614.102(b)(4)] For subordinate level reporting components, is the EEO Director/Officer under the immediate supervision of the lower level component's head official? (For example, does the Regional EEO Officer report to the Regional Administrator?)
X The Civil Rights Director regularly participated in the Human Capital Council Meetings, as well as other high-level meetings, including the Commerce Alternative Personnel System Meetings.
Are the duties and responsibilities of EEO officials clearly defined? X
Do the EEO officials have the knowledge, skills, and abilities to carry out the duties and responsibilities of their positions?
X
If the agency has 2nd level reporting components, are there organizational charts that clearly define the reporting structure for EEO programs?
X
If the agency has 2nd level reporting components, does the agency-wide EEO Director have authority for the EEO programs within the subordinate reporting components?
X
If not, please describe how EEO program authority is delegated to subordinate reporting components.
Compliance Indicator
The EEO Director and other EEO professional staff responsible for EEO
programs have regular and effective means of informing the agency head and senior
management officials of the status of EEO programs and are involved in, and consulted
on, management/personnel actions.
Measure has been
met
For all unmet measures, provide a brief explanation in the space below or
complete and attach an EEOC FORM 715-01
PART H to the agency's status report
Measures Yes No

19
Does the EEO Director/Officer have a regular and effective means of informing the agency head and other top management officials of the effectiveness, efficiency and legal compliance of the agency's EEO program?
X
Following the submission of the immediately preceding FORM 715-01, did the EEO Director/Officer present to the head of the agency and other senior officials the "State of the Agency" briefing covering all components of the EEO report, including an assessment of the performance of the agency in each of the six elements of the Model EEO Program and a report on the progress of the agency in completing its barrier analysis including any barriers it identified and/or eliminated or reduced the impact of?
X
Are EEO program officials present during agency deliberations prior to decisions regarding recruitment strategies, vacancy projections, succession planning, selections for training/career development opportunities, and other workforce changes?
X
Does the agency consider whether any group of employees or applicants might be negatively impacted prior to making human resource decisions such as re-organizations and re-alignments?
X
Are management/personnel policies, procedures and practices examined at regular intervals to assess whether there are hidden impediments to the realization of equality of opportunity for any group(s) of employees or applicants? [see 29 C.F.R. § 1614.102(b)(3)]
X
Is the EEO Director included in the agency's strategic planning, especially the agency's human capital plan, regarding succession planning, training, etc., to ensure that EEO concerns are integrated into the agency's strategic mission?
X
Compliance Indicator
The agency has committed sufficient human resources and budget allocations to its EEO
programs to ensure successful operation.
Measure has been
met
For all unmet measures, provide a brief explanation in the space below or
complete and attach an EEOC FORM 715-01
PART H to the agency's status report
Measures Yes No
Does the EEO Director have the authority and funding to ensure implementation of agency EEO action plans to improve EEO program efficiency and/or eliminate identified barriers to the realization of equality of opportunity?
X

20
Are sufficient personnel resources allocated to the EEO Program to ensure that agency self-assessments and self-analyses prescribed by EEO MD-715 are conducted annually and to maintain an effective complaint processing system?
X
Are statutory/regulatory EEO related Special Emphasis Programs sufficiently staffed?
X
Federal Women's Program - 5 U.S.C. 7201; 38 U.S.C. 4214; Title 5 CFR, Subpart B, 720.204
X
Hispanic Employment Program - Title 5 CFR, Subpart B, 720.204 X
People With Disabilities Program Manager; Selective Placement Program for Individuals With Disabilities - Section 501 of the Rehabilitation Act; Title 5 U.S.C. Subpart B, Chapter 31, Subchapter I-3102; 5 CFR 213.3102(t) and (u); 5 CFR 315.709
X
Are other agency special emphasis programs monitored by the EEO Office for coordination and compliance with EEO guidelines and principles, such as FEORP - 5 CFR 720; Veterans Employment Programs; and Black/African American; American Indian/Alaska Native, Asian American/Pacific Islander programs?
X
Compliance Indicator
The agency has committed sufficient budget to support the success of its EEO Programs.
Measure has been
met
For all unmet measures, provide a brief explanation in the space below or
complete and attach an EEOC FORM 715-01
PART H to the agency's status report
Measures Yes No
Are there sufficient resources to enable the agency to conduct a thorough barrier analysis of its workforce, including the provision of adequate data collection and tracking systems
X
Is there sufficient budget allocated to all employees to utilize, when desired, all EEO programs, including the complaint processing program and ADR, and to make a request for reasonable accommodation? (Including subordinate level reporting components?)
X
Has funding been secured for publication and distribution of EEO materials (e.g. harassment policies, EEO posters, reasonable accommodations procedures, etc.)?
X

21
Is there a central fund or other mechanism for funding supplies, equipment and services necessary to provide disability accommodations?
X
A central fund is established for Interpreting Services Only
Does the agency fund major renovation projects to ensure timely compliance with Uniform Federal Accessibility Standards?
X
Is the EEO Program allocated sufficient resources to train all employees on EEO Programs, including administrative and judicial remedial procedures available to employees?
X
Is there sufficient funding to ensure the prominent posting of written materials in all personnel and EEO offices? [see 29 C.F.R. § 1614.102(b)(5)]
X
Is there sufficient funding to ensure that all employees have access to this training and information?
X
Is there sufficient funding to provide all managers and supervisors with training and periodic up-dates on their EEO responsibilities:
X
- for ensuring a workplace that is free from all forms of discrimination, including harassment and retaliation?
X
- to provide religious accommodations?
X
- to provide disability accommodations in accordance with the agency's written procedures?
X
- in the EEO discrimination complaint process? X
- to participate in ADR? X
Essential Element C: MANAGEMENT AND PROGRAM ACCOUNTABILITY This element requires the Agency Head to hold all managers, supervisors, and EEO Officials responsible for the effective implementation of the agency's EEO Program and Plan.
Compliance Indicator
EEO program officials advise and provide appropriate assistance to
managers/supervisors about the status of
Measure has been
met
For all unmet measures, provide a brief explanation in

22
Measures EEO programs within each manager or supervisor area or responsibility.
Yes No the space below or complete and attach
an EEOC FORM 715-01 PART H to the
agency's status report
Are regular (monthly/quarterly/semi-annually) EEO updates provided to management/supervisory officials by EEO program officials?
X
Do EEO program officials coordinate the development and implementation of EEO Plans with all appropriate agency managers to include Agency Counsel, Human Resource Officials, Finance, and the Chief information Officer?
X
Compliance Indicator
The Human Resources Director and the EEO Director meet regularly to assess
whether personnel programs, policies, and procedures are in conformity with instructions contained in EEOC
management directives. [see 29 CFR § 1614.102(b)(3)]
Measure has been
met
For all unmet measures, provide a brief explanation in the space below or
complete and attach an EEOC FORM 715-
01 PART H to the agency's status report
Measures Yes No
Have time-tables or schedules been established for the agency to review its Merit Promotion Program Policy and Procedures for systemic barriers that may be impeding full participation in promotion opportunities by all groups?
X
Have time-tables or schedules been established for the agency to review its Employee Recognition Awards Program and Procedures for systemic barriers that may be impeding full participation in the program by all groups?
X
Have time-tables or schedules been established for the agency to review its Employee Development/Training Programs for systemic barriers that may be impeding full participation in training opportunities by all groups?
X
Compliance Indicator
When findings of discrimination are made, the agency explores whether or not
disciplinary actions should be taken.
Measure has been
met
For all unmet measures, provide a brief explanation in the space below or
complete and attach an EEOC FORM 715-
01 PART H to the agency's status report
Measures Yes No

23
Does the agency have a disciplinary policy and/or a table of penalties that covers employees found to have committed discrimination?
X
Have all employees, supervisors, and managers been informed as to the penalties for being found to perpetrate discriminatory behavior or for taking personnel actions based upon a prohibited basis?
X
Has the agency, when appropriate, disciplined or sanctioned managers/supervisors or employees found to have discriminated over the past two years?
X N/A
If so, cite number found to have discriminated and list penalty /disciplinary action for each type of violation. There have been no findings of discrimination at NOAA during the preceding two years.
Does the agency promptly (within the established time frame) comply with EEOC, Merit Systems Protection Board, Federal Labor Relations Authority, labor arbitrators, and District Court orders?
X
Does the agency review disability accommodation decisions/actions to ensure compliance with its written procedures and analyze the information tracked for trends, problems, etc.?
X
Essential Element D: PROACTIVE PREVENTION Requires that the agency head makes early efforts to prevent discriminatory actions and eliminate barriers to equal employment opportunity in the workplace.
Compliance Indicator
Analyses to identify and remove unnecessary barriers to employment are conducted throughout
the year.
Measure has been
met
For all unmet measures,
provide a brief explanation in
the space below or complete and attach an EEOC FORM 715-01 PART H to the agency's status
report
Measures Yes No
Do senior managers meet with and assist the EEO Director and/or other EEO Program Officials in the identification of barriers that may be impeding the realization of equal employment opportunity?
X
When barriers are identified, do senior managers develop and implement, with the assistance of the agency EEO office, agency EEO Action Plans to
X

24
eliminate said barriers?
Do senior managers successfully implement EEO Action Plans and incorporate the EEO Action Plan Objectives into agency strategic plans?
X
Are trend analyses of workforce profiles conducted by race, national origin, sex and disability?
X
Are trend analyses of the workforce's major occupations conducted by race, national origin, sex and disability?
X
Are trends analyses of the workforce's grade level distribution conducted by race, national origin, sex and disability?
X
Are trend analyses of the workforce's compensation and reward system conducted by race, national origin, sex and disability?
X
Are trend analyses of the effects of management/personnel policies, procedures and practices conducted by race, nat’l origin, sex and disability?
X
Compliance Indicator
The use of Alternative Dispute Resolution (ADR) is encouraged by senior management.
Measure has been
met
For all unmet measures,
provide a brief explanation in
the space below or complete and attach an EEOC FORM 715-01 PART H to the agency's status
report
Measures Yes No
Are all employees encouraged to use ADR? X
Is the participation of supervisors and managers in the ADR process required?
X DOC-ADR policy requires that ADR be voluntary for all parties.
Essential Element E: EFFICIENCY Requires that the agency head ensure that there are effective systems in place for evaluating the impact and effectiveness of the agency's EEO Programs as well as an efficient and fair dispute resolution process.

25
Compliance Indicator
The agency has sufficient staffing, funding, and authority to achieve the elimination of
identified barriers.
Measure has been
met
For all unmet measures, provide a brief explanation in the space below or
complete and attach an EEOC FORM 715-01 PART H to the agency's status
report
Measures Yes No
Does the EEO Office employ personnel with adequate training and experience to conduct the analyses required by MD-715 and these instructions?
X
Has the agency implemented an adequate data collection and analysis systems that permit tracking of the information required by MD-715 and these instructions?
X
Have sufficient resources been provided to conduct effective audits of field facilities' efforts to achieve a model EEO program and eliminate discrimination under Title VII and the Rehabilitation Act?
X
Is there a designated agency official or other mechanism in place to coordinate or assist with processing requests for disability accommodations in all major components of the agency?
X
Are 90% of accommodation requests processed within the time frame set forth in the agency procedures for reasonable accommodation?
X
Compliance Indicator
The agency has an effective complaint tracking and monitoring system in place to
increase the effectiveness of the agency's EEO Programs.
Measure has been
met
For all unmet measures, provide a brief explanation in the space below or
complete and attach an EEOC FORM 715-01 PART H to the agency's status
report
Measures Yes No
Does the agency use a complaint tracking and monitoring system that allows identification of the location and status of complaints and length of time elapsed at each stage of the agency's complaint resolution process?
X
Does the agency's tracking system identify the issues and bases of the complaints, the aggrieved individuals/complainants, the involved management officials and other information to analyze complaint
X

26
activity and trends?
Does the agency hold contractors accountable for delay in counseling and investigation processing times?
X
If yes, briefly describe how: Contract Investigators are not paid until cases are completed.
Does the agency monitor and ensure that new investigators, counselors, including contract and collateral duty investigators, receive the 32 hours of training required in accordance with EEO Management Directive MD-110?
X
Does the agency monitor and ensure that experienced counselors, investigators, including contract and collateral duty investigators, receive the 8 hours of refresher training required on an annual basis in accordance with EEO Management Directive MD-110?
X
Compliance Indicator The agency has sufficient staffing, funding
and authority to comply with the time frames in accordance with the EEOC (29
C.F.R. Part 1614) regulations for processing EEO complaints of employment
discrimination.
Measure has been
met
For all unmet measures, provide a brief explanation in the space below or
complete and attach an EEOC FORM 715-01 PART H to the agency's status
report
Measures Yes No
Are benchmarks in place that compare the agency's discrimination complaint processes with 29 C.F.R. Part 1614?
X
Does the agency provide timely EEO counseling within 30 days of the initial request or within an agreed upon extension in writing, up to 60 days?
X
Does the agency provide an aggrieved person with written notification of his/her rights and responsibilities in the EEO process in a timely fashion?
X
Does the agency complete the investigations within the applicable prescribed time frame?
X Under DOC purview. See DOC MD-715 Report.
When a complainant requests a final agency decision, does the agency issue the decision within 60 days of the request?
X Under DOC purview. See DOC MD-715 Report.

27
When a complainant requests a hearing, does the agency immediately upon receipt of the request from the EEOC AJ forward the investigative file to the EEOC Hearing Office?
X Under DOC purview. See DOC MD-715 Report.
When a settlement agreement is entered into, does the agency timely complete any obligations provided for in such agreements?
X
Does the agency ensure timely compliance with EEOC AJ decisions which are not the subject of an appeal by the agency?
X Under DOC purview. See DOC MD-715 Report.
Compliance Indicator
There is an efficient and fair dispute resolution process and effective systems for
evaluating the impact and effectiveness of the agency's EEO complaint processing program.
Measure has been
met
For all unmet measures, provide a brief explanation in the space below or
complete and attach an EEOC FORM 715-01 PART H to the agency's status
report
Measures Yes No
In accordance with 29 C.F.R. §1614.102(b), has the agency established an ADR Program during the pre-complaint and formal complaint stages of the EEO process?
X
Does the agency require all managers and supervisors to receive ADR training in accordance with EEOC (29 C.F.R. Part 1614) regulations, with emphasis on the federal government's interest in encouraging mutual resolution of disputes and the benefits associated with utilizing ADR?
X
After the agency has offered ADR and the complainant has elected to participate in ADR, are the managers required to participate?
X DOC-ADR policy requires that ADR be voluntary for all parties.
Does the responsible management official directly involved in the dispute have settlement authority?
X
Compliance Indicator
The agency has effective systems in place for maintaining and evaluating the impact and
effectiveness of its EEO programs.
Measure has been
met
For all unmet measures, provide a brief explanation in

28
Measures Yes No the space below or complete and attach
an EEOC FORM 715-01 PART H to the agency's status
report
Does the agency have a system of management controls in place to ensure the timely, accurate, complete and consistent reporting of EEO complaint data to the EEOC?
X
Does the agency provide reasonable resources for the EEO complaint process to ensure efficient and successful operation in accordance with 29 C.F.R. § 1614.102(a)(1)?
X
Does the agency EEO office have management controls in place to monitor and ensure that the data received from Human Resources is accurate, timely received, and contains all the required data elements for submitting annual reports to the EEOC?
X
Do the agency's EEO programs address all of the laws enforced by the EEOC?
X
Does the agency identify and monitor significant trends in complaint processing to determine whether the agency is meeting its obligations under Title VII and the Rehabilitation Act?
X
Does the agency track recruitment efforts and analyze efforts to identify potential barriers in accordance with MD-715 standards?
X See Part H Plan #1
Does the agency consult with other agencies of similar size on the effectiveness of their EEO programs to identify best practices and share ideas?
X
Compliance Indicator The agency ensures that the investigation
and adjudication function of its complaint resolution process are separate from its
legal defense arm of agency or other offices with conflicting or competing
interests.
Measure has been
met
For all unmet measures, provide a brief explanation in the space below or
complete and attach an EEOC FORM 715-01 PART H to the agency's status
report
Measures Yes No

29
Are legal sufficiency reviews of EEO matters handled by a functional unit that is separate and apart from the unit which handles agency representation in EEO complaints?
X
Does the agency discrimination complaint process ensure a neutral adjudication function?
X
If applicable, are processing time frames incorporated for the legal counsel's sufficiency review for timely processing of complaints?
X This is managed by the DOC –Office of General Counsel.
Essential Element F: RESPONSIVENESS AND LEGAL COMPLIANCE This element requires that federal agencies are in full compliance with EEO statutes and EEOC regulations, policy guidance, and other written instructions.
Compliance Indicator
Agency personnel are accountable for timely compliance with orders issued by EEOC
Administrative Judges.
Measure has been
met
For all unmet measures, provide
a brief explanation in the
space below or complete and
attach an EEOC FORM 715-01 PART H to the agency's status
report
Measures Yes No
Does the agency have a system of management control to ensure that agency officials timely comply with any orders or directives issued by EEOC Administrative Judges?
X
Compliance Indicator
The agency's system of management controls ensures that the agency timely completes all
ordered corrective action and submits its compliance report to EEOC within 30 days of
such completion.
Measure has been
met
For all unmet measures, provide
a brief explanation in the
space below or complete and
attach an EEOC FORM 715-01 PART H to the agency's status
report
Measures Yes No

30
Does the agency have control over the payroll processing function of the agency? If Yes, answer the two questions below.
X This is partially under NOAA control and the National Finance Center.
Are there steps in place to guarantee responsive, timely, and predictable processing of ordered monetary relief?
X
Are procedures in place to promptly process other forms of ordered relief?
X
Compliance Indicator
Agency personnel are accountable for the timely completion of actions required to
comply with orders of EEOC.
Measure has been
met
For all unmet measures, provide
a brief explanation in the
space below or complete and
attach an EEOC FORM 715-01 PART H to the agency's status
report
Measures Yes No
Is compliance with EEOC orders encompassed in the performance standards of any agency employees?
X
If so, please identify the employees by title in the comments section, and state how performance is measured.
Civil Rights Director: Annual Performance Plan.
Is the unit charged with the responsibility for compliance with EEOC orders located in the EEO office?
X
If not, please identify the unit in which it is located, the number of employees in the unit, and their grade levels in the comments section.
Have the involved employees received any formal training in EEO compliance?
X
Does the agency promptly provide to the EEOC the following documentation for completing compliance:
X
Attorney Fees: Copy of check issued for attorney fees and /or a narrative statement by an appropriate agency official, or agency payment order dating the dollar amount of attorney fees paid?
X

31
Awards: A narrative statement by an appropriate agency official stating the dollar amount and the criteria used to calculate the award?
X
Back Pay and Interest: Computer print-outs or payroll documents outlining gross back pay and interest, copy of any checks issued, and narrative statement by an appropriate agency official of total monies paid?
X
Compensatory Damages: The final agency decision and evidence of payment, if made?
X
Training: Attendance roster at training session(s) or a narrative statement by an appropriate agency official confirming that specific persons or groups of persons attended training on a date certain?
X
Personnel Actions (e.g., Reinstatement, Promotion, Hiring, Reassignment): Copies of SF-50s
X
Posting of Notice of Violation: Original signed and dated notice reflecting the dates that the notice was posted. A copy of the notice will suffice if the original is not available.
X
Supplemental Investigation: 1. Copy of letter to complainant acknowledging receipt from EEOC of remanded case. 2. Copy of letter to complainant transmitting the Report of Investigation (not the ROI itself unless specified). 3. Copy of request for a hearing (complainant's request or agency's transmittal letter).
X
Final Agency Decision (FAD): FAD or copy of the complainant's request for a hearing.
X
Restoration of Leave: Print-out or statement identifying the amount of leave restored, if applicable. If not, an explanation or statement.
X
Civil Actions: A complete copy of the civil action complaint demonstrating same issues raised as in compliance matter.
X
Settlement Agreements: Signed and dated agreement with specific dollar amounts, if applicable. Also, appropriate documentation of relief is provided.
X
Footnotes: 1. See 29 C.F.R. § 1614.102. 2. When an agency makes modifications to its procedures, the procedures must be resubmitted to the Commission. See EEOC Policy Guidance on Executive Order 13164: Establishing Procedures to Facilitate the Provision of Reasonable Accommodation (10/20/00), Question 28.

32
EEOC FORM
715-01 PART H U.S. Equal Employment Opportunity Commission
FEDERAL AGENCY ANNUAL EEO PROGRAM STATUS REPORT EEO Plan to Attain the Essential Elements of a Model EEO Program
FY 2012 - PART H PLAN #1 - NOAA
STATEMENT of MODEL PROGRAM ESSENTIAL ELEMENT E DEFICIENCY:
Does the agency track recruitment efforts and analyze efforts to identify potential barriers in accordance with MD-715 standards?
OBJECTIVE: Improve NOAA’s process for collecting applicant flow data to begin conducting regular analyses in order to identify potential barriers.
RESPONSIBLE OFFICIAL: Director, Workforce Management Office Director, Civil Rights Office
DATE OBJECTIVE INITIATED:
March 1, 2012
TARGET DATE FOR COMPLETION OF OBJECTIVE:
September 28, 2012
PLANNED ACTIVITIES TOWARD COMPLETION OF OBJECTIVE: TARGET DATE (Must be specific)
1) The Civil Rights Office will collaborate with Workforce Management to determine if/how the current recruitment databases will allow the tracking of applicant flow data.
March 2012
2) Once the tracking of data has been established, the Civil Rights Office will review/analyze data on a semi-annual basis.
June 2012
REPORT OF ACCOMPLISHMENTS and MODIFICATIONS TO OBJECTIVE

33
EEOC FORM 715-01 PART I
U.S. Equal Employment Opportunity Commission FEDERAL AGENCY ANNUAL EEO PROGRAM STATUS REPORT
EEO Plan to Eliminate Identified Barrier
FY 2012: PART I PLAN #1 – NOAA
STATEMENT OF CONDITION THAT WAS A TRIGGER FOR A POTENTIAL BARRIER: Provide a brief narrative describing the condition at issue. How was the condition recognized as a potential barrier?
Lower Than Expected Participation Rate For Women At The GS-13 And Above Grade Levels. The participation rate of women at the GS-13 and above is 25.3%, which is lower than the expected rate of 33.0%.
BARRIER ANALYSIS: Provide a description of the steps taken and data analyzed to determine cause of the condition.
As in the previous fiscal year, workforce statistics for grades GS-13 and above were reviewed and analyzed on a basic level. However, the triggers identified above require additional, refined analysis in order to initiate the investigation of the root cause. NOAA’s Line and Staff Office representatives drafted a Framework Plan on Workforce Diversity aimed at addressing the full employment lifecycle, as well as the full spectrum of diversity, including education, planning, accountability, and recruitment.
STATEMENT OF IDENTIFIED BARRIER: Provide a succinct statement of the agency policy, procedure or practice that has been determined to be the barrier of the undesired condition.
As a thorough barrier analysis has not been completed at this time, no barrier has been identified.
OBJECTIVE: State the alternative or revised agency policy, procedure or practice to be implemented to correct the undesired condition.
The Civil Rights Office will utilize the barrier analysis methodology to identify the root cause of this condition.
RESPONSIBLE OFFICIAL: Director, CRO
DATE OBJECTIVE INITIATED: March 2012
TARGET DATE FOR COMPLETION OF OBJECTIVE:
September 2013
PLANNED ACTIVITIES TOWARD COMPLETION OF OBJECTIVE:
TARGET DATE (Must be specific)

34
REPORT OF ACCOMPLISHMENTS and MODIFICATIONS TO OBJECTIVE:

35
EEOC FORM 715-01 PART I
U.S. Equal Employment Opportunity Commission FEDERAL AGENCY ANNUAL EEO PROGRAM STATUS REPORT
EEO Plan to Eliminate Identified Barrier
FY 2011: PART I PLAN #2 –NOAA
STATEMENT OF CONDITION THAT WAS A TRIGGER FOR A POTENTIAL BARRIER: Provide a brief narrative describing the condition at issue. How was the condition recognized as a potential barrier?
Lower Than Expected Participation Rate For Hispanic Fishery Biologist. The participation rate of Hispanics Fishery Biologist is 2.3% (1.8% male, 0.5% female), which is lower than the expected rate of 4.0% (1.9% male, 2.1% female).
BARRIER ANALYSIS: Provide a description of the steps taken and data analyzed to determine cause of the condition.
The Civil Rights Office developed a barrier analysis tool to investigate the ‘why’ behind EEO target group low participation. The methodology enabled NOAA to conduct this type of investigation for any target group. The methodology was tested on Hispanic Fisheries Biologists, and was completed in FY 2010.
STATEMENT OF IDENTIFIED BARRIER: Provide a succinct statement of the agency policy, procedure or practice that has been determined to be the barrier of the undesired condition.
1. Since applicant data is not tracked, it is impossible to determine if a lack of workforce parity arises from hiring practices, by the agency, office, or individual manager. 2. NOAA does not coordinate or track recruitment efforts. Without this information, there is no way to evaluate the success of a recruitment effort. 3. Eligible Hispanic Fishery Biologists are not applying for promotions at the expected rate. This results in Hispanics not being appropriately represented in the higher pay levels of Fishery Biologists.
OBJECTIVE: State the alternative or revised agency policy, procedure or practice to be implemented to correct the undesired condition.
1. Collect and analyze applicant flow data by Office/Hiring Official. 2. Conduct evaluations of recruitment events, which include the number of attendees, type of questions asked and materials taken, and other pertinent observations. 3. Implement activities outlined in the NOAA’s Diversity Plan.
36
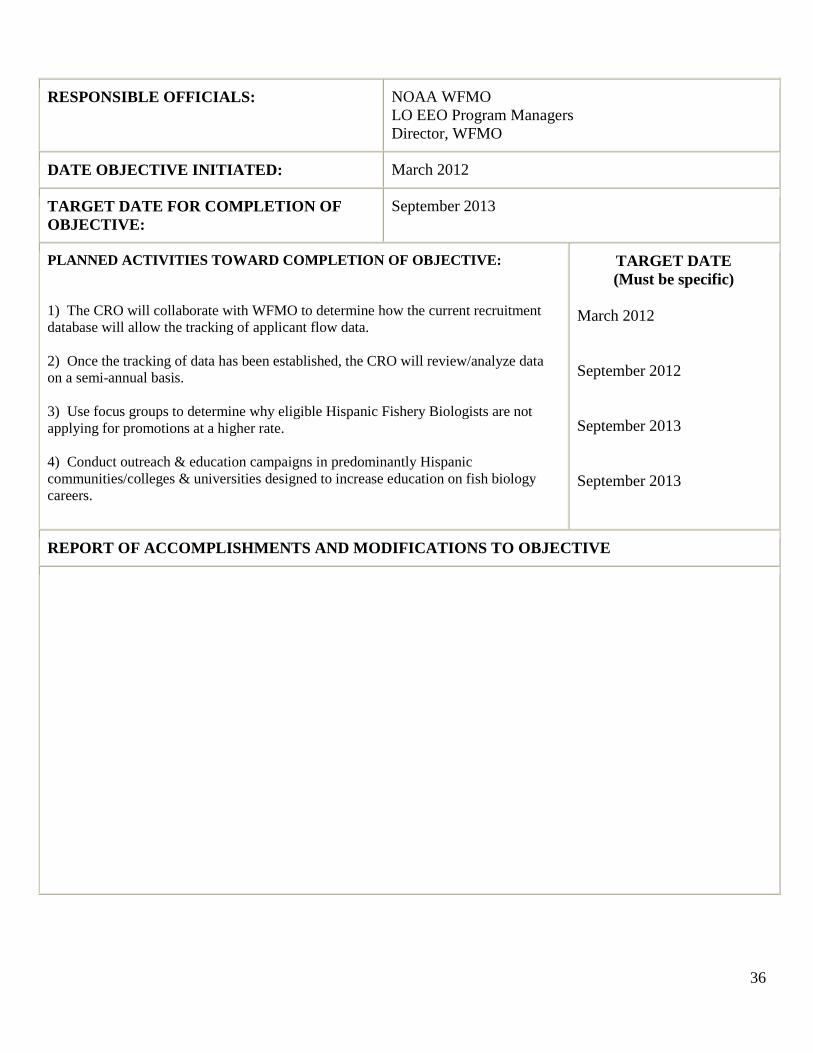
RESPONSIBLE OFFICIALS: NOAA WFMO LO EEO Program Managers Director, WFMO
DATE OBJECTIVE INITIATED: March 2012
TARGET DATE FOR COMPLETION OF OBJECTIVE:
September 2013
PLANNED ACTIVITIES TOWARD COMPLETION OF OBJECTIVE: 1) The CRO will collaborate with WFMO to determine how the current recruitment database will allow the tracking of applicant flow data. 2) Once the tracking of data has been established, the CRO will review/analyze data on a semi-annual basis. 3) Use focus groups to determine why eligible Hispanic Fishery Biologists are not applying for promotions at a higher rate. 4) Conduct outreach & education campaigns in predominantly Hispanic communities/colleges & universities designed to increase education on fish biology careers.
TARGET DATE (Must be specific)
March 2012 September 2012 September 2013 September 2013
REPORT OF ACCOMPLISHMENTS AND MODIFICATIONS TO OBJECTIVE

37
EEOC FORM 715-01 PART I
U.S. Equal Employment Opportunity Commission FEDERAL AGENCY ANNUAL EEO PROGRAM STATUS REPORT
EEO Plan to Eliminate Identified Barrier
FY 2011: PART I PLAN #3 – NOAA
STATEMENT OF CONDITION THAT WAS A TRIGGER FOR A POTENTIAL BARRIER: Provide a brief narrative describing the condition at issue. How was the condition recognized as a potential barrier?
Lower Than Expected Participation Rate For Employees With Targeted Disabilities. The participation rate of NOAA employees with targeted disabilities during FY 2011 was 0.6%, substantially below the 2% Federal Goal.
BARRIER ANALYSIS: Provide a description of the steps taken and data analyzed to determine cause of the condition.
At the end of Fiscal Year 2011, NOAA’s workforce increased from 13,043 to 13,065 employees. During this same time period, the number of permanent employees with disabilities increased by 3. Employees with targeted disabilities are concentrated in lower grade (or equivalent) groupings and have lower than expected participation rates at higher grades (or equivalents).
STATEMENT OF IDENTIFIED BARRIER: Provide a succinct statement of the agency policy, procedure or practice that has been determined to be the barrier of the undesired condition.
As a thorough barrier analysis has not been completed at this time, no barrier has been identified.
OBJECTIVE: State the alternative or revised agency policy, procedure or practice to be implemented to correct the undesired condition.
1) Implement activities outlined in NOAA’s Diversity Plan.
RESPONSIBLE OFFICIAL: Director, WFMO
DATE OBJECTIVE INITIATED: January 2012
TARGET DATE FOR COMPLETION OF OBJECTIVE:
September 2012

38
PLANNED ACTIVITIES TOWARD COMPLETION OF OBJECTIVE:
TARGET DATE (Must be specific)
REPORT OF ACCOMPLISHMENTS AND MODIFICATIONS TO OBJECTIVE

39
EEOC FORM 715-01 PART J
U.S. Equal Employment Opportunity Commission FEDERAL AGENCY ANNUAL EEO PROGRAM STATUS REPORT
Special Program Plan for the Recruitment, Hiring, and Advancement of Individuals with Targeted Disabilities
PART I. Department or Agency
Information
1. Agency 1. Department of Commerce
1.a. 2nd Level Component 1.a. National Oceanic and Atmospheric Administration
1.b. 3rd Level or lower 1.b. n/a
PART II. Employment Trend and
Special Recruitment for Individuals With
Targeted Disabilities
Enter Actual Number at the ...
... beginning of FY ... end of FY Net Change
Number % Number % Number Rate of Change
Total Work Force
13,043 100.00% 13,065 100.00% 22 0.2%
Reportable Disability
652 5.0% 680 5.2% 28 4.3%
Targeted Disability*
84 0.6% 84 0.6% 0 0.0%
* If the rate of change for persons with targeted disabilities is not equal to or greater than the rate of change for the total workforce, a barrier analysis should be conducted (see below).
1. Total Number of Applications Received From Persons With Targeted Disabilities during the reporting period.
Data not available.
2. Total Number of Selections of Individuals with Targeted Disabilities during the reporting period.
7

40
PART III. Participation Rates In Agency Employment Programs
Other Employment/
Personnel Programs
TOTAL Reportable Disability
Targeted Disability
Not Identified No Disability
# % # % # % # %
3. Competitive Promotions*
4. Non-Competitive Promotions*
5. Employee Career Development Programs
5.a. Grades 5 - 12
8 1 12.5% 0 0% 1 12.5% 6 75.0%
5.b. Grades 13 - 14
10 0 0% 0 0% 0 0% 10 100%
5.c. Grade 15/SES
0 0 0% 0 0% 0 0% 0 0%
6. Employee Recognition and Awards
6.a. Time-Off Awards (Total hrs awarded)
11,256 429 3.8% 56 0.5% 265 2.4% 10,562 93.8%
6.b. Cash Awards (total $$$ awarded)
24,151,002
938,652
3.9% 79,506
0.33% 353,523
1.5% 22,858,827
94.6%
6.c. Quality-Step Increase
171 3 1.8% 0 0% 4 2.3% 164 95.9%
EEOC FORM 715-01 Part J
Special Program Plan for the Recruitment, Hiring, and Advancement of Individuals With Targeted Disabilities

41
Part IV
Identification and
Elimination of Barriers
Agencies with 1,000 or more permanent employees MUST conduct a barrier analysis to address any barriers to increasing employment opportunities for employees and applicants with targeted disabilities using FORM 715-01 PART I. Agencies should review their recruitment, hiring, career development, promotion, and retention of individuals with targeted disabilities in order to determine whether there are any barriers. Note: Information on competitive promotions and non-competitive promotions is not available at this time. STATEMENT OF CONDITION THAT WAS A TRIGGER FOR A POTENTIAL BARRIER: Provide a brief narrative describing the condition at issue. The overall representation of NOAA employees with targeted disabilities is 0.6%. The NOAA offices with the largest participation rates for employees with targeted disabilities are the Staff Office of the Office of the Under Secretary (Office of the Chief Information Officer, the Office of the Chief Financial Officer, the Office of the Human Resources Director, the Office of Acquisitions and Grants, and the Office of the Chief Administrative Officer) at (1.8%) and the National Environmental Satellite Data and Information Service (NESDIS) at (0.9%), which are below the NOAA and Federal-wide goal of 2%. Although NOAA selected 7 (0.8%) new permanent employees with targeted disabilities, 7 (1.0%) voluntarily separated, and 2 (4.2%) involuntarily separated; resulting in 81 (0.8%) total permanent employees in FY 2011 as compared to 78 (0.6%) in FY 2010. The participation rate for GS-12/equivalent employees with targeted disabilities is 4.3% as compared to 29.5% participation rate for the overall workforce. The participation rate for GS-13/equivalent employees with targeted disabilities is 0.4% as compared to 14.5% participation rate for the overall workforce. The GS-14/equivalent employees with targeted disabilities have a participation rate of 0.3%, while the overall workforce participation rate is 24.7%. Employees with targeted disabilities were not represented at the GS-15/equivalent grade level. The participation rate of officials and managers with targeted disabilities at the GS-15 and above level is 2.5% as compared to 2.7% for the overall workforce. Mid-level (GS-13-14) managers and officials participated at 1.2%, as compared to 1.3% overall. In the four most populous major occupations, 1) Meteorologist with targeted disabilities participated at 0.4% as compared to 21.9% of the overall workforce; 2) Computer Science & Information Technology 0.9% as compared to 9.9%, 3) Fishery Biologist 0.1% compared to 8.1%, and 4) Electronic Engineer 0.6% as compared to 6.7%. NOAA’s largest groups of employees with targeted disabilities are in the following categories: mental illness (18), deafness (16), and blindness (14).

42
All seven of the permanent employees who voluntarily separated in FY 2011 had self-disclosed a mental illness, convulsive disorder, blindness, partial paralysis, and distortion of limb/spine. The two involuntary separations had self-disclosed blindness, and distortion of the limb/spine. Employees with targeted disabilities were not represented in the number of participants in Career Development Programs in FY 2011.
Part V
Goals for Targeted
Disabilities
Agencies with 1,000 or more permanent employees are to use the space provided below to describe the strategies and activities that will be undertaken during the coming fiscal year to maintain a special recruitment program for individuals with targeted disabilities and to establish specific goals for the employment and advancement of such individuals. For these purposes, targeted disabilities may be considered as a group. Agency goals should be set and accomplished in such a manner as will effect measurable progress from the preceding fiscal year. Agencies are encouraged to set a goal for the hiring of individuals with targeted disabilities that is at least as high as the anticipated losses from this group during the next reporting period, with the objective of avoiding a decrease in the total participation rate of employees with disabilities.
Goals, objectives and strategies described below should focus on internal as well as external sources of candidates and include discussions of activities undertaken to identify individuals with targeted disabilities who can be (1) hired; (2) placed in such a way as to improve possibilities for career development; and (3) advanced to a position at a higher level or with greater potential than the position currently occupied.
Goal I. Increase (and retain) the employment of people with targeted disabilities within NOAA to achieve a NOAA-wide participation rate of 2% within the next five years. Goal II. Increase the number of qualified applicants with disabilities who are offered employment with NOAA. Strategies:
• Implement 2% Goals. Each LO will implement hiring/retention goals for people with targeted disabilities to be broken down over the next five years to achieve 2%. Expand the Number of People with Disabilities in NOAA’s Recruitment Pool. NOAA’s Resume Bank provides hiring managers with resumes of 30% or more service-connected disabled veterans and Schedule A individuals with disabilities who meet the qualification requirements. The NOAA Resume Bank is a recruitment tool for managers who are interested in considering high quality candidates with disabilities, particularly those trained and/or experienced in the scientific, engineering, financial management, IT, and other professional fields. All Resume Bank candidates have been pre-certified by the Workforce Management Office (WFMO) to meet the minimum qualifications for one or more job series. Hiring managers are encouraged to

43
check available Resume Bank candidates early the workforce planning stage, well before a vacancy is posted on USAjobs. Managers may conduct interviews with candidates from the Resume Bank at any time (before an announcement opens, while an announcement is posted, or after considering applicants from the certificate of the posted announcement.) WFMO is now in the process of establishing internal Standard Operating Procedures and outreach materials for managers and applicants regarding use of the NOAA Resume Bank. In addition, instructions for applicants for applying via the Schedule A hiring authority for people with disabilities will be provided via the NOAA Careers website and in other marketing materials.
• Create a Pipeline for Future Employment through Federal Internship Programs and On-The-Job Programs for Students and Veterans with Disabilities. Participation in the Workforce Recruitment Program (WRP) will be publicized heavily in partnership with other NOAA WRP champions. Initiate partnerships with organizations supporting Veterans with Disabilities, and educate NOAA managers on the benefits of hiring veterans with disabilities.
• Increase Retention of Employees with Disabilities by Providing Technical Assistance on Disability Issues. Publicize the role of the NOAA Selective Placement Coordinator (SPC), regarding recruitment and outreach to applicants with disabilities. WFMO has developed a variety of tools and guidance to facilitate the use of special hiring authorities and strategies tailored towards three separate audiences: applicants with disabilities, hiring managers, and WFMO employees.
• Improve Management’s Awareness on Issues Related to Hiring and Retaining Employees with Disabilities. WFMO provides guidance as it relates to the hiring tools currently available to management to increase hiring of People with Targeted Disabilities and Veterans with Disabilities, including Veterans’ preference and noncompetitive appointments for Schedule A and preference eligible Veterans, as well as reasonable accommodations through the Computer/Electronic Accommodations Program (CAP) and the Job Accommodation Network (JAN). Hiring officials are provided briefings on success stories of employed people with disabilities and engage in other activities to make them more receptive to hiring people with disabilities. The Recruitment and Workforce Planning modules on the Commerce Learning Center have recently been updated to include information on how to hire employees with disabilities.

44
A TABLES ANALYSES Overall Notes: 1. Groups in which the number of people is less than 10 if the benchmark was applied to that group are considered to be too low for a valid evaluation. Table A1 Total Workforce – Distribution by Race/Ethnicity and Sex
Employment Tenure
Total Employees
RACE/ETHNICITY
Hispanic or Latino
Non-Hispanic or Latino
White Black or African
American Asian
Native Hawaiian or Other Pacific
Islander
American Indian or Alaska Native
Multiple Races
All M F M F M F M F M F M F M F M F
TOTAL
Prior FY # 13,043 8,702 4,341 221 119 7,611 3,257 404 668 386 234 13 20 60 28 7 15
% 100.0 66.7 33.3 1.7 0.9 58.4 25.0 3.1 5.1 3.0 1.8 0.1 0.2 0.5 0.2 0.2 0.3
Current FY # 13,065 8,703 4,362 221 122 7,585 3,279 415 650 398 242 15 22 57 26 12 21
% 100.0 66.6 33.4 1.7 0.9 58.1 25.1 3.2 5.0 3.0 1.9 0.1 0.2 0.4 0.2 0.1 0.2 CLF (2000) % 100.0 53.2 46.8 6.2 4.5 39.0 33.7 4.8 5.7 1.9 1.7 0.1 0.1 0.3 0.3 0.8 0.8 Difference # 22 1 21 0 3 -26 22 11 -18 12 8 2 2 -3 -2 5 6
Ratio Change % 0.0 -0.1 0.1 0.0 0.0 -0.3 0.1 0.1 -0.1 0.1 0.1 0.0 0.0 0.0 0.0 -0.1 -0.2
Net Change % 0.2 0.0 0.5 0.0 2.5 -0.3 0.7 2.7 -2.7 3.1 3.4 15.4 10.0 -5.0 -7.1 71.4 40.0
PERMANENT
Prior FY # 12,690 8,508 4,182 217
116
7,447
3,132
394
650
379
226
9
18
57
27
5
13
% 100.0 67.0 33.0 1.7 0.9 58.7 24.7 3.1 5.1 3.0 1.8 0.1 0.1 0.4 0.2 0.1 0.3
Current FY # 12,687 8,496 4,191 218
120
7,418
3,139
394
634
389
233
12
21
55
25
10
19
% 100.0 67.0 33.0 1.7 0.9 58.5 24.7 3.1 5.0 3.1 1.8 0.1 0.2 0.4 0.2 0.2 0.5 Difference # -3 -12 9 1 4 -29 7 0 -16 10 7 3 3 -2 -2 5 6
Ratio Change % 0.0 -0.1 0.1 0.0 0.0 -0.2 0.1 0.0 -0.1 0.1 0.1 0.02 0.02 -0.02 -0.02 0.12 0.14
Net Change % 0.0 -0.1 0.2 0.5 3.4 -0.4 0.2 0.0 -2.5 2.6 3.1 33.3 16.7 -3.5 -7.4 100.0 46.2
TEMPORARY
Prior FY # 353 194 159
4
3
164
125
10
18
7
8
4
2
3
1
2
2
% 100.0 55.0 45.0 1.1 0.8 46.5 35.4 2.8 5.1 2.0 2.3 1.1 0.6 0.8 0.3 1.3 1.3
Current FY # 378 207 171 3
2
167
140
21
16
9
9
3
1
2
1
2
2
% 100.0 54.8 45.2 0.8 0.5 44.2 37.0 5.6 4.2 2.4 2.4 0.8 0.3 0.5 0.3 1.2 1.2 Difference # 25 13 12 -1 -1 3 15 11 -2 2 1 -1 -1 -1 0 0 0
Ratio Change % 0.0 -0.2 0.2 -0.3 -0.3 -2.3 1.6 2.7 -0.9 0.4 0.1 -0.3 -0.3 -0.3 0.0 -0.1 -0.1
Net Change % 7.1 6.7 7.5 -25.0 -33.3 1.8 12.0 110.0 -11.1 28.6 12.5 -25.0 -50.0 -33.3 0.0 0.0 0.0

45
ANALYSIS OF WORK FORCE The total number of employees (permanent and temporary) increased from 13,043 in FY 2010 to 13,065 in FY 2011. This is an increase of 22 employees. Increases occurred in females (0.5%); Hispanic/Latino females (2.5%); White females (0.7%); African American males (2.7%), Asian males (3.1%), Asian females (3.4%); Native Hawaiian or other Pacific Islander males (15.4%); Native Hawaiian or other Pacific Islander females (10.0%); Multiple Race males (71.4%); and Multiple Race females (40.0%). NOAA saw a net decrease in its representation of White males (-0.3%), African American females (-2.7%); American Indian males (-5.0%); and American Indian females (-7.1%). The total number of permanent employees decreased from 12,690 in FY 2010 to 12,687 in FY 2011. This represents a decrease of 3 permanent employees. Decreases occurred in males (-0.1%); White males (-0.4%); African American females (-2.5%); American Indian males (-3.5%); and American Indian females (-7.4%). However, NOAA saw net increases in its representation of females (0.2%); Hispanic/Latino males (0.5%); Hispanic/Latino females (3.4%); White females (0.2%); Asian males (2.6%); Asian females (3.1%); Native Hawaiian or other Pacific Islander males (33.3%); Native Hawaiian or other Pacific Islander females (16.7%); and Multiple Race males (100.0%); and Multiple Race females (46.2%). The total number of temporary employees increased from 353 in FY 2010 to 378 in FY 2011. This is was an increase of 25 temporary employees. Increases occurred in males (6.7%); females (7.5%); White males (1.8%); White females (12.0%) White males (34.9%); White females (47.6%); African American males (110.0%); Asian males (28.6%); and Asian females (12.5%). Decreases occurred in Hispanic/Latino males (-25.0%); Hispanic/Latino females (-33.3%), African American females (-11.1%); Native Hawaiian or other Pacific Islander males (-25.0%); Native Hawaiian or other Pacific Islander females (-50.0%); and American Indian males (-33.3%). In comparison to the CLF, the following groups are above their participation rate in the CLF: Total males White males Asian males Asian females Native Hawaiian or other Pacific Islander females American Indian or Alaska Native males In comparison to the CLF, the following groups are below their participation rate in the CLF: Total females Hispanic males Hispanic females White females African American males African American females American Indian or Alaskan Native females Multiple Race males Multiple Race females

46
Table A2: Total Workforce (Permanent Employees Only) By Component - Distribution by Race/Ethnicity and Sex
Employment Tenure
Total Employees
RACE/ETHNICITY
Hispanic or Latino
Non-Hispanic or Latino
White Black or African
American Asian
Native Hawaiian
or Other
Pacific Islander
American Indian or
Alaska Native
Multiple Races
All M F M F M F M F M F M F M F M F
TOTAL FY # 12,687 8,496 4,191 218 120 7,418 3,139 394 634 389 233 12 21 55 25 10 19
% 100.0 67.0 33.0 1.7 0.9 58.5 24.7 3.1 5.0 3.1 1.8 0.1 0.2 0.4 0.2 0.2 0.5
CLF (2000) % 100.0 53.2 46.8 6.2 4.5 39.0 33.7 4.8 5.7 1.9 1.7 0.1 0.1 0.3 0.3 0.8 0.8 OFFICE OF UNDER SECRETARY
# 281 111 170 1
3
92
121
15
43
1
3
0
0
1
0
1
0
% 100.0 39.5 60.5 0.4 1.1 32.7 43.1 5.3 15.3 0.4 1.1 0.0 0.0 0.4 0.0 0.6 0.0 STAFF OFFICES OF THE OFFICE OF THE UNDER SECRETARY
# 808 279 529 15
14
193
313
43
160
25
38
0
0
3
0
0
4
% 100.0 34.5 65.5 1.9 1.7 23.9 38.7 5.3 19.8 3.1 4.7 0.0 0.0 0.4 0.0 0.0 0.8 NOAA MARINE AND AVIATION OPERATIONS
# 630 535 95 14
0
433
73
56
18
21
1
1
1
7
0
3
2
% 100.0 84.9 15.1 2.2 0.0 68.7 11.6 8.9 2.9 3.3 0.2 0.2 0.2 1.1 0.0 3.2 2.1 NATIONAL OCEAN SERVICE
# 1230 716 514 8
5
634
400
38
82
34
20
0
2
1
2
1
3
% 100.0 58.2 41.8 0.7 0.4 51.5 32.5 3.1 6.7 2.8 1.6 0.0 0.2 0.1 0.2 0.2 0.6 NATIONAL WEATHER SERVICE
# 4908 3941 967 102
34
3,568
757
109
111
120
42
11
13
30
7
1
3
% 100.0 80.3 19.7 2.1 0.7 72.7 15.4 2.2 2.3 2.4 0.9 0.2 0.3 0.6 0.1 0.1 0.3 NATIONAL MARINE FISHERIES SERVICE
# 3219 1859 1360
50
41
1,626
1,097
59
101
113
103
0
5
9
7
2
6
% 100.0 57.8 42.2 1.6 1.3 50.5 34.1 1.8 3.1 3.5 3.2 0.0 0.2 0.3 0.2 0.1 0.4 NATIONAL ENVIRONMENTAL SATELLITE, DATA & INFO SERVICE
# 855 568 287
15
4
449
179
58
85
45
16
0
0
1
2
0
1
% 100.0 66.4 33.6 1.8 0.5 52.5 20.9 6.8 9.9 5.3 1.9 0.0 0.0 0.1 0.2 0.0 0.3 OFFICE OF OCEANIC AND ATMOSPHERIC RESEARCH
# 739 480 259 13
18
416
195
16
29
30
10
0
0
3
7
2
0
% 100.0 65.0 35.0 1.8 2.4 56.3 26.4 2.2 3.9 4.1 1.4 0.0 0.0 0.4 0.9 0.8 0.0 ORG LEVEL 2 (CM5460)
# 17 7 10 0
1
7
4
0
5
0
0
0
0
0
0
0
0
% 100.0 41.2 58.8 0.0 5.9 41.2 23.5 0.0 29.4 0.0 0.0 0.0 0.0 0.0 0.0 0.0 0.0 In FY 2011, the National Weather Service (NWS) remained the largest Line Office with 4,908 (38.7%) employees and the National Marine Fisheries Service (NMFS) followed with 3,219 (25.4%) employees. The workforce breakdown shows that females are below the CLF in all offices except the Office of the Under Secretary and Staff Offices. Also, Hispanic males and females are substantially below the CLF in all of NOAA’s Offices.

47
In comparison to the CLF, the following groups had lower than expected participation rates when compared to the CLF: Under Secretary - Total males Hispanic males and females White males Asian males and females Native Hawaiian or other Pacific Islander males and females American Indian or Alaskan Native females Multiple Race male and females Staff Offices – Total males Hispanic males and females White males Native Hawaiian or other Pacific Islander males and females Asian females Multiple Race males OMAO - Total females Hispanic males and females While females African American females Asian females American Indian or Alaskan Native females NOS - Total females Hispanic males and females White females African American males Asian females Native Hawaiian or other Pacific Islander males American Indian or Alaskan Native males and females Multiple Race males and females NWS - Total females Hispanic males and females White females African American males and females Asian females American Indian or Alaskan Natives females Multiple Race males and females

48
NMFS - Total females Hispanic males and females Black males Black females Native Hawaiian or other Pacific Islander males American Indian or Alaskan Natives females Multiple Race males and females NESDIS – Total females Hispanic males and females White females Native Hawaiian or other Pacific Islander males and females American Indian or Alaskan Natives males and females Multiple Race males and females OAR – Total females Hispanic males and females White females African American males and females Asian females Native Hawaiian or other Pacific Islander males and females Multiple Race females PPI – Total males Hispanic males White females African American males Asian males and females Native Hawaiian or other Pacific Islander males and females American Indian or Alaskan Natives males and females Multiple Race males and females

49
Table A3: Occupational Categories (Permanent) - Distribution by Race/Ethnicity and Sex Officials And Managers
` Total
Employees
RACE/ETHNICITY
Hispanic or
Latino
Non-Hispanic or Latino
White Black or African
American Asian
Native Hawaiian
or Other
Pacific Islander
American Indian or Alaska Native
Multiple Races
All M F M F M F M F M F M F M F M F Officials and
Managers
Executive/Senior Level (Grades 15
and Above)
# 334 262 72 8 2 237 62 10 6 6 1 0 0 1 0 0 1
% 100.0 78.4 21.6 2.4 0.6 71.0 18.6 3.0 1.8 1.8 0.3 0.0 0.0 0.3 0.0 0.0 0.3
Mid-Level (Grades 13-14)
# 164 140 24 9 4 118 9 7 10 6 1 0 0 0 0 0 0
% 100.0 85.4 14.6 5.5 2.4 72.0 5.5 4.3 6.1 3.7 0.6 0.0 0.0 0.0 0.0 0.0 0.0
First-Level (Grades 12 and
below)
# 958 662 296 10 3 604 242 19 32 22 13 0 2 6 3 1 1
% 100.0 69.1 30.9 1.0 0.3 63.0 25.3 2.0 3.3 2.3 1.4 0.0 0.2 0.6 0.3 0.1 0.1
Other # 1,562 547 1,015 17 30 442 668 57 250 26 53 0 3 2 5 3 6
% 100.0 35.0 65.0 1.1 1.9 28.3 42.8 3.6 16.0 1.7 3.4 0.0 0.2 0.1 0.3 0.2 0.4
Officials and Managers Total
# 3,018 1,611 1,407 44 39 1,401 981 93 298 60 68 0 5 9 8 4 8
% 100.0 53.4 46.6 1.5 1.3 46.4 32.5 3.1 9.9 2.0 2.3 0.0 0.2 0.3 0.3 0.1 0.3
Overall, males represent 53.4% of all Officials and Managers and females represent 46.6%. Hispanic females, White females, African American males and females, Asian females, Native Hawaiian or other Pacific Islander females, and American Indian or Alaska Native females have rates of participation equal to or higher than their overall representation in the permanent workforce. All Hispanic, White, Asian, Native Hawaiian or other Pacific Islander, American Indian or Alaska Native males, and Multiple Race males and females have less participation in this category than their participation in the permanent workforce. At the Executive/Senior levels, males represent 78.4% with females at 21.6%; which is below their overall workforce representation. Hispanic and White males have a higher participation rate than their overall representation in the workforce. At the First-Level, males represent 69.1% and females 30.9%, which is slightly below their overall workforce representation. White males and females, Native Hawaiian or other Pacific Islander females, and American Indian or Alaska Native males and females have a participation rate higher and/or equal to their overall workforce representation.

50
Professionals
` Total
Employees
RACE/ETHNICITY
Hispanic or
Latino
Non-Hispanic or Latino
White Black or African
American Asian
Native Hawaiian
or Other
Pacific Islander
American Indian or Alaska Native
Multiple Races
All M F M F M F M F M F M F M F M F
Professionals # 7,124 5,225 1,899 121 49 4,657 1,563 149 141 279 126 1 2 18 10 0 8
% 100.0 73.3 26.7 1.7 0.7 65.4 21.9 2.1 2.0 3.9 1.8 0.0 0.0 0.3 0.1 0.0 0.1
Overall, males represent 73.3% of all Professionals and females represent 26.7%. Hispanic males, White males, and Asian males and females have rates of participation equal to or higher than their overall representation in the permanent workforce. Hispanic females, White females, African American males and females, Native Hawaiian or other Pacific Islander males and females, American Indian or Alaska Native males and females, and Multiple Race males and females have less participation in this category than their participation in the permanent workforce. Technicians
` Total
Employees
RACE/ETHNICITY
Hispanic or
Latino
Non-Hispanic or Latino
White Black or African America
n Asian
Native Hawaiia
n or Other Pacific
Islander
American
Indian or Alaska Native
Multiple Races
All M F M F M F M F M F M F M F M F
Technicians # 1,203 1,042 161 32 5 883 123 72 22 30 9 2 0 21 2 2 0
% 100.0 86.6 13.4 2.7 0.4 73.4 10.2 6.0 1.8 2.5 0.7 0.2 0.0 1.7 0.2 0.2 0.0
Males represent 86.6% of all Technicians and females represent 13.4%. Hispanic males, White males, African American males, Native Hawaiian or other Pacific Islander males, American Indian or Alaska Native males and females, and Multiple Race males have rates of participation equal to or higher than their overall representation in the permanent workforce. Hispanic females, White females, African American females, Native Hawaiian or other Pacific Islander females, and Multiple Race females have less participation in this category than their participation in the permanent workforce.

51
Sales Workers All EEO groups were absent from this category during FY 2011. Administrative Support Workers
` Total
Employees
RACE/ETHNICITY
Hispanic or
Latino
Non-Hispanic or Latino
White Black or African
American Asian
Native Hawaiian
or Other
Pacific Islander
American Indian or Alaska Native
Multiple Races
All M F M F M F M F M F M F M F M F Administrative
Support Workers
# 762 111 651 4 25 74 416 28 165 4 37 0 1 1 5 0 2
% 100.0 14.6 85.4 0.5 3.3 9.7 54.6 3.7 21.7 0.5 4.9 0.0 0.1 0.1 0.7 0.0 0.3 Overall, males represent 14.6% of all Administrative Support Workers and females represent 85.4%. Females of all ethnic/racial groups have a higher participation in this category than their participation in the workforce, except Native Hawaiian or other Pacific Islander females and Multiple Race females. Males of all ethnic/racial groups, except African American, have less participation in this category than their participation in the overall workforce. Craft Workers
` Total
Employees
RACE/ETHNICITY
Hispanic or
Latino
Non-Hispanic or Latino
White Black or African
American Asian
Native Hawaiian
or Other
Pacific Islander
American Indian or Alaska Native
Multiple Races
All M F M F M F M F M F M F M F M F
Craft Workers
# 43 43 0 2 0 35 0 4 0 0 0 0 0 1 0 1 0
% 100.0 100.0 0.0 4.7 0.0 81.4 0.0 9.3 0.0 0.0 0.0 0.0 0.0 2.3 0.0 0.0 0.0
Males represent 100.0% of all Craft workers and 67.0% of the permanent workforce. Hispanic, White, African American, and American Indian or Alaska Native males have higher participation in this category than their participation in the workforce. Females and Asian, Native Hawaiian or other Pacific Islander, and Multiple Race males were not represented in this category in FY 2011.

52
Operatives
` Total
Employees
RACE/ETHNICITY
Hispanic or
Latino
Non-Hispanic or Latino
White Black or African
American Asian
Native Hawaiian
or Other
Pacific Islander
American Indian or Alaska Native
Multiple Races
All M F M F M F M F M F M F M F M F
Operatives
# 18 15 3 1 0 10 3 2 0 2 0 0 0 0 0 0 0
% 100.0 83.3 16.7 5.6 0.0 55.6 16.7 11.1 0.0 11.1 0.0 0.0 0.0 0.0 0.0 0.0 0.0 Males represent 83.3% of all Operatives and females represent 16.7%. Hispanic males, African American males, and Asian males have rates of participation higher than their overall representation in the permanent workforce. White females have less participation in this category than their participation in the permanent workforce. Hispanic females, African American females, Asian females, Native Hawaiian or other Pacific Islander males and females, American Indian or Alaska Native males and females, and Multiple Race males and females were not represented in this category in FY 2011. Laborers And Helpers All EEO groups were absent from this category during FY 2011. Service Workers
` Total
Employees
RACE/ETHNICITY
Hispanic or
Latino
Non-Hispanic or Latino
White Black or African
American Asian
Native Hawaiian or Other Pacific
Islander
American Indian or Alaska Native
Multiple Races
All M F M F M F M F M F M F M F M F
Service Workers
# 124 95 29 3 2 84 20 2 2 5 5 0 0 0 0 1 0
% 100.0 76.6 23.4 2.4 1.6 67.7 16.1 1.6 1.6 4.0 4.0 0.0 0.0 0.0 0.0 0.8 0.0 Overall males represent 76.6% of all Service Workers and females represent 23.4%. Hispanic males and females, White males, Asian males and females, and Multiple Race males have rates of participation higher than their overall representation in the permanent workforce. White females and African American males and females have less participation in this category than their participation in the permanent workforce. Native Hawaiian or other Pacific Islander males and females, American Indian or Alaska Native males and females, and Multiple Race females were not represented in this category in FY 2011.

53
Table A4-1: (Permanent) Participation Rates for GS Grades and CAPS by Race/Ethnicity and Sex
GS/GM, SES, and Related Grade
Total Employees
RACE/ETHNICITY
Hispanic or Latino
Non-Hispanic or Latino
White Black or African
American Asian
Native Hawaiian or
Other Pacific Islander
American Indian or
Alaska Native Multiple Races
All M F M F M F M F M F M F M F M F
GS-01 # 1 1 0 0 0 0 0 0 0 0 0 1 0 0 0 0 0
% 100.0 100.0 0.0 0.0 0.0 0.0 0.0 0.0 0.0 0.0 0.0 100.0 0.0 0.0 0.0 0.0 0.0
GS-02 # 2 1 1 0 1 1 0 0 0 0 0 0 0 0 0 0 0
% 100.0 50.0 50.0 0.0 50.0 50.0 0.00 0.0 0.0 0.0 0.0 0.0 0.0 0.0 0.0 0.0 0.0
GS-03 # 5 3 2 0 0 3 2 0 0 0 0 0 0 0 0 0 0
% 100.0 60.0 40.0 0.0 0.0 60.0 40.0 0.0 0.0 0.0 0.0 0.0 0.0 0.0 0.0 0.0 0.0
GS-04 # 63 32 31 0 2 29 18 3 8 0 1 0 1 0 0 0 1
% 100.0 50.7 49.2 0.0 3.1 46.0 28.5 4.7 12.7 0.0 1.5 0.0 1.5 0.0 0.0 0.0 1.5
GS-05 # 56 40 16 0 0 37 13 0 3 3 0 0 0 0 0 0 0
% 100.0 71.4 28.5 0.0 0.0 66.0 23.2 0.0 5.3 5.3 0.0 0.0 0.0 0.0 0.0 0.0 0.0
GS-06 # 151 34 117 3 4 23 76 6 27 1 7 0 0 1 2 0 1
% 100.0 22.5 77.4 1.9 2.6 15.2 50.3 3.9 17.8 0.6 4.6 0.0 0.0 0.6 1.3 0.0 0.6
GS-07 # 169 79 90 3 2 64 64 10 19 2 3 0 1 0 1 0 0
% 100.0 46.7 53.2 1.7 1.1 37.8 37.8 5.9 11.2 1.1 1.7 0.0 0.5 0.0 0.5
0.0
GS-08 # 582 110 472 2 21 74 307 23 112 9 26 1 2 1 4 0 0
% 100.0 18.9 81.1 0.3 3.6 12.7 52.7 3.9 19.2 1.5 4.4 0.1 0.3 0.1 0.6 0.0 0.0
GS-09 # 218 125 93 4 4 108 71 7 12 3 4 0 0 3 2 0 0
% 100.0 57.3 42.6 1.8 1.8 49.5 32.5 3.2 5.5 1.3 1.8 0.0 0.0 1.3 0.9 0.0 0.0
GS-10 # 731 355 376 11 13 280 263 31 66 25 26 1 4 4 1 3 3
% 100.0 48.5 51.4 1.5 1.7 38.3 35.9 4.2 9.0 3.4 3.5 0.1 0.5 0.5 0.1 0.4 0.4
GS-11 # 793 657 136 26 5 576 106 30 17 11 6 2 1 12 1 0 0
% 100.0 82.8 17.1 3.2 0.6 72.6 13.3 3.7 2.1 1.3 0.7 0.2 0.1 1.5 0.1 0.0 0.0
GS-12 # 3,605 2,275 1,330 59 37 2000 1026 94 170 105 75 3 6 12 9 2 7
% 100.0 63.11 36.89 1.64 1.03 55.48 28.46 2.61 4.72 2.91 2.08 0.08 0.17 0.33 0.25 0.06 0.1
GS-13 # 1,771 1,516 255 28 9 1386 205 34 23 60 17 1 1 7 0 0 0
% 100.0 85.6 14.4 1.5 0.5 78.2 11.5 1.9 1.3 3.3 0.9 0.0 0.0 0.4 0.0 0.0 0.0
GS-14 # 3,017 2,062 955 50 16 1806 719 79 148 120 60 0 4 5 4 2 4
% 100.0 68.3 31.6 1.6 0.5 59.8 23.8 2.6 4.9 3.9 1.9 0.0 0.1 0.1 0.1 0.0 0.1
GS-15 # 921 682 239 17 4 615 200 18 25 28 6 0 0 4 2 0 2
% 100.0 74.0 25.9 1.8 0.4 66.7 21.7 1.9 2.7 3.0 0.6 0.0 0.0 0.4 0.2 0.0 0.2
OTHER # 9 9 0 1 0 7 0 1 0 0 0 0 0 0 0 0 0
% 100.0 100.0 0.0 11.1 0.0 77.7 0.0 11.1 0.0 0.0 0.0 0.0 0.0 0.0 0.0 0.0 0.0
SES # 117 88 29 1 1 75 26 8 1 4 1 0 0 0 0 0 0
% 100.0 75.2 24.7 0.8 0.8 64.1 22.2 6.8 0.8 3.4 0.8 0.0 0.0 0.0 0.0 0.0 0.0
TOTAL # 12,211 8,069 4,142 205 119 7,084 3,096 344 631 371 232 9 20 49 26 7 18
% 100.0 66.0 33.9 1.6 0.9 58.0 25.3 2.8 5.1 3.0 1.9 0.0 0.1 0.4 0.2 0.0 0.1
The majority of NOAA employees (8,393) comprise the GS-12-14/CAPS III-IV pay levels. Males represent 69.7% and females 30.3%. When compared to their overall representation in the permanent workforce (67.0%), males have lower than expected participation rates at the lower pay levels (GS 1-10/CAPS I & II) and higher than expected participation rates at the higher pay levels (GS 13-15/CAPS III-V/SES).
54
In contrast, females (33.0%) have a higher than expected participation rate at the lower pay levels (GS-1-10/CAPS I &II), than at the higher pay levels (25.3%). This holds true across all EEO groups, except Hispanic males, Asian males, and Multiple Race males and females.

55
Table A5-1: (Permanent) Wage Grade Participation Rates by Race/Ethnicity and Sex
WD/WG, WLWS &
Other Wage Grades
Total Employees
RACE/ETHNICITY
Hispanic or Latino
Non-Hispanic or Latino
White Black or African
American Asian
Native Hawaiian
or Other Pacific
Islander
American Indian or Alaska Native
Multiple Races
All M F M F M F M F M F M F M F M F
Grade-01 # 0 0 0 0 0 0 0 0 0 0 0 0 0 0 0 0 0
% 0 0 0 0 0 0 0 0 0 0 0 0 0 0 0 0 0
Grade-02 # 1 1 0 0 0 1 0 0 0 0 0 0 0 0 0 0 0
% 100.0 100.0 0.0 0.0 0.0 100.0 0.0 0.0 0.0 0.0 0.0 0.0 0.0 0.0 0.0 0 0
Grade-03 # 0 0 0 0 0 0 0 0 0 0 0 0 0 0 0 0 0
% 0 0 0 0 0 0 0 0 0 0 0 0 0 0 0 0 0
Grade-04 # 0 0 0 0 0 0 0 0 0 0 0 0 0 0 0 0 0
% 0 0 0 0 0 0 0 0 0 0 0 0 0 0 0 0 0
Grade-05 # 3 3 0 0 0 2 0 0 0 1 0 0 0 0 0 0 0
% 100.0 100.0 0.0 0.0 0.0 66.6 0.0 0.0 0.0 33.3 0.0 0.0 0.0 0.0 0.0 0 0
Grade-06 # 18 15 3 1 0 11 3 2 0 1 0 0 0 0 0 0 0
% 100.0 83.3 16.6 5.5 0.0 61.1 16.6 11.1 0.0 5.5 0.0 0.0 0.0 0.0 0.0 0.0 0.0
Grade-07 # 1 1 0 1 0 0 0 0 0 0 0 0 0 0 0 0 0
% 100.0 100.0 0.0 100.0 0.0 0.0 0.0 0.0 0.0 0.0 0.0 0.0 0.0 0.0 0.0 0.0 0.0
Grade-08 # 5 5 0 0 0 4 0 1 0 0 0 0 0 0 0 0 0
% 100.0 100.0 0.0 0.0 0.0 80.0 0.0 20.0 0.0 0.0 0.0 0.0 0.0 0.0 0.0 0 0
Grade-09 # 14 14 0 0 0 12 0 2 0 0 0 0 0 0 0 0 0
% 100.0 100.0 0.0 0.0 0.0 85.7 0.0 14.2 0.0 0.0 0.0 0.0 0.0 0.0 0.0 0 0
Grade-10 # 21 21 0 1 0 17 0 1 0 0 0 0 0 1 0 1 0
% 100.0 100.0 0.0 4.7 0.0 80.9 0.0 4.7 0.0 0.0 0.0 0.0 0.0 4.7 0.0 4.7 0.0
Grade-11 # 4 4 0 0 0 4 0 0 0 0 0 0 0 0 0 0 0
% 100.0 100.0 0.0 0.0 0.0 100.0 0.0 0.0 0.0 0.0 0.0 0.0 0.0 0.0 0.0 0.0 0.0
Grade-12 # 1 1 0 0 0 1 0 0 0 0 0 0 0 0 0 0 0
% 100.0 100.0 0.0 0.0 0.0 100.0 0.0 0.0 0.0 0.0 0.0 0.0 0.0 0.0 0.0 0.0 0.0
Grade-13 # 0 0 0 0 0 0 0 0 0 0 0 0 0 0 0 0 0
% 0 0 0 0 0 0 0 0 0 0 0 0 0 0 0 0 0
Grade-14 # 1 1 0 0 0 1 0 0 0 0 0 0 0 0 0 0 0
% 100.0 100.0 0.0 0.0 0.0 100.0 0.0 0.0 0.0 0.0 0.0 0.0 0.0 0.0 0.0 0.0 0.0
Grade-15 # 0 0 0 0 0 0 0 0 0 0 0 0 0 0 0 0 0
% 0 0 0 0 0 0 0 0 0 0 0 0 0 0 0 0 0 All Other
Wage Grades
# 0 0 0 0 0 0 0 0 0 0 0 0 0 0 0 0 0
% 0 0 0 0 0 0 0 0 0 0 0 0 0 0 0 0 0
Total # 69 66 3 3 0 53 3 6 0 2 0 0 0 1 0 1 0
% 100.0 95.6 4.3 4.3 0.0 76.8 4.3 8.7 0.0 2.9 0.0 0.0 0.0 1.4 0.0 1.4 0.0
Males represent 95.6% of all Wage Grade workers and females 4.3%. Males of all EEO groups, except Asian, have higher participation in this category than they do in the total permanent workforce. White females have lower participation in this category than they do in the total permanent workforce. Hispanic, African American, Asian, Native Hawaiian or other Pacific Islander, American Indian or Alaska Native, and Multiple Race females and Native Hawaiian or other Pacific Islander males were not represented in this category in FY 2011.

56
Table A6: Participation Rates for Major Occupations (Permanent) by Race/Ethnicity and Sex Overall Note: The following Major Occupations are the four (4) most populous occupations employed at NOAA: 1) Meteorologist; 2) Fishery Biologist; 3) Computer Science & Information Technology Specialist; and 4) Electronic Engineer. The Occupational CLF is determined by the percentage of the population that is available for a specific position. Therefore, each position is compared to the respective Occupational CLF. 1) Meteorologist:
Job Title/Series Agency Rate Occupational CLF
Total Employees
RACE/ETHNICITY
Hispanic or
Latino
Non-Hispanic or Latino
White Black or African
American Asian
Native Hawaiian
or Other
Pacific Islander
American Indian or Alaska Native
Multiple Races
All M F M F M F M F M F M F M F M F
1340 Meteorologist
# 2,679 2,312 367 48
11
2,170
316
33
19
53
16
0
1
8
3
0
1
% 100.0 86.3 13.7 1.7 0.4 81.0 11.8 1.2 0.7 1.9 0.6 0.0 0.0 0.3 0.1 0.0 0.0
CLF 87.1 12.9 2.1 0.2 79.1 11.6 2.7 0.3 2.0 0.5 0.1 0.0 0.2 0.1 * * *Multiple Race CLF data was not available. This is NOAA’s highest employed major occupation. In FY 2011, males comprised 86.3% of this occupation and females represented 13.7%. Those that participated at rates above and/or equal to the occupational CLF include Hispanic females, White males and females, African American females, Asian females, Native Hawaiian or Other Pacific Islander females, and American Indian or Alaska Native males and females. In comparison to the occupational CLF, the following groups had participation rates that fell below the occupational CLF: Hispanic males African American males Asian males Native Hawaiian or Other Pacific Islander males

57
Table A6: Participation Rates for Major Occupations (Permanent) by Race/Ethnicity and Sex 2) Fishery Biologist:
Job Title/Series Agency Rate Occupational CLF
Total Employees
RACE/ETHNICITY
Hispanic or
Latino
Non-Hispanic or Latino
White Black or African
American Asian
Native Hawaiian
or Other
Pacific Islander
American Indian or Alaska Native
Multiple Races
All M F M F M F M F M F M F M F M F 0482 Fishery Biology
# 991 630 361 18
5
575
337
9
10
26
8
0
0
2
1
0
0
% 100.0 63.5 36.4 1.8 0.5 58.0 34.0 0.9 1.0 2.6 0.8 0.0 0.0 0.2 0.1 0.0 0.0
CLF 55.9 44.1 1.9 2.1 47.3 35.0 1.2 1.8 4.1 4.3 0.0 0.0 0.4 0.2 * * *Multiple Race CLF data was not available. In FY 2011, males comprised 63.5% of this occupation and females represented 36.4%. Those that participated at rates above and/or equal to the occupational CLF include White males and Native Hawaiian or Other Pacific Islander males and females. In comparison to the occupational CLF, the following groups had participation rates that fell below the occupational CLF: White females Hispanic males and females African American males and females Asian males and females American Indian or Alaska Native males and females

58
Table A6: Participation Rates for Major Occupations (Permanent) by Race/Ethnicity and Sex 3) Computer Science & Information Technology Specialist:
Job Title/Series Agency Rate Occupational CLF
Total Employees
RACE/ETHNICITY
Hispanic or
Latino
Non-Hispanic or Latino
White Black or African
American Asian
Native Hawaiian
or Other
Pacific Islander
American Indian or Alaska Native
Multiple Races
All M F M F M F M F M F M F M F M F 2210 Computer Science & Info Tech Specialist
# 1,208 916 292 28
10
727
184
67
51
89
45
1
0
4
0
0
2
% 100.0 75.8 24.1 2.3 0.8 60.1 15.2 5.5 4.2 7.3 3.7 0.0 0.0 0.3 0.0 0.0 0.1
CLF 66.8 33.2 3.1 1.6 50.4 24.7 4.3 3.5 7.4 2.9 0.1 0.0 0.2 0.1 * *
*Multiple Race CLF data was not available. In FY 2011, males comprised 75.8% of this occupation and females represented 24.1%. Those that participated at rates above and/or equal to the occupational CLF include White males, African American males and females, Asian females, Native Hawaiian or Other Pacific Islander females, and American Indian or Alaska Native males. In comparison to the occupational CLF, the following groups had participation rates that fell below the occupational CLF: White females Hispanic males and females Asian males Native Hawaiian Island or Other Pacific Islander males American Indian or Alaskan Native females

59
Table A6: Participation Rates for Major Occupations (Permanent) by Race/Ethnicity and Sex 4) Electronic Engineer:
Job Title/Series Agency Rate Occupational CLF
Total Employees
RACE/ETHNICITY
Hispanic or
Latino
Non-Hispanic or Latino
White Black or African
American Asian
Native Hawaiian
or Other
Pacific Islander
American Indian or Alaska Native
Multiple Races
All M F M F M F M F M F M F M F M F 0800 Electronic Engineer
# 818 781 37 31 1 668 29 32 4 35 3 1 0 13 0 1 0
% 100.0 95.4 4.5 3.7 0.1 81.6 3.5 3.9 0.4 4.2 0.3 0.1 0.0 1.5 0.0 0.1 0.0
CLF 91.3 8.7 3.6 0.4 72.1 5.5 3.5 0.9 10.5 1.6 0.1 0.0 0.2 0.0 * *
*Multiple Race CLF data was not available. In FY 2011, males comprised 95.4% of this occupation and females represented 4.5%. Those that participated at rates above and/or equal to the occupational CLF include Hispanic males, White males, African American males, Native Hawaiian or Other Pacific Islander males and females, and American Indian or Alaska Native males and females. In comparison to the occupational CLF, the following groups had participation rates that fell below the occupational CLF: Hispanic females White females African American females Asian males and females

60
Table A8: New Hires by Type of Appointment – Distribution by Race/Ethnicity and Sex
Type of Appointment
Total Employees
RACE/ETHNICITY
Hispanic or
Latino
Non-Hispanic or Latino
White Black or African
American Asian
Native Hawaiian
or Other
Pacific Islander
American Indian or Alaska Native
Multiple Races
All M F M F M F M F M F M F M F M F
Permanent # 710 445 265 10
7
363
201
32
37
34
15
0
0
1
1
5
4
% 100.0 62.7 37.3 1.4 1.0 51.1 28.3 4.5 5.2 4.8 2.1 0.0 0.0 0.1 0.1 0.7 0.6
Temporary # 212 117 95 1 1 87 72 19 10 7 8 0 0 1 2 2 2
% 100.0 55.2 44.8 0.5 0.5 41.0 34.0 9.0 4.7 3.3 3.8 0.0 0.0 0.5 0.9 0.9 0.9 Non- Appropriated
# 0 0 0 0 0 0 0 0 0 0 0 0 0 0 0 0 0 % 0.0 0.0 0.0 0.0 0.0 0.0 0.0 0.0 0.0 0.0 0.0 0.0 0.0 0.0 0.0 0.0 0.0
Total # 922 562 360 11 8 450 273 51 47 41 23 0 0 2 3 7 6 % 100.0 61.0 39.0 1.2 0.9 48.8 29.6 5.5 5.1 4.4 2.5 0.0 0.0 0.2 0.3 0.8 0.7
CLF (2000) % 100.0 53.2 46.8 6.2 4.5 30.0 33.7 4.8 5.7 1.9 1.7 0.1 0.1 0.3 0.3 0.3 0.3 In FY 2011, males comprised 61.0% of all new hires and females represent 39.0%. White males represented the highest number of new hires at 450 (48.8), while White females represented the second highest group at 273 (29.6%). Those EEO groups above and/or equal to the CLF include White males, African American males, Asian males and females, American Indian or Alaskan Natives females, and Multiple Race males. Native Hawaiian or other Pacific Islander males and females were not represented in new hire appointments in FY 2011. In comparison to the CLF, the following new hire rates fell below the CLF: Hispanic males and females White females African American females Native Hawaiian or other Pacific Islander males and females American Indian or Alaskan Native males Multiple Race females

61
Table A12: PARTICIPATION IN CAREER DEVELOPMENT by Race/Ethnicity and Sex
Employment Tenure
Total Employees
RACE/ETHNICITY
Hispanic or
Latino
Non-Hispanic or Latino
White Black or African
American Asian
Native Hawaiian or Other Pacific
Islander
American Indian or Alaska Native
Multiple Races
All M F M F M F M F M F M F M F M F Career Development Programs for GS 5 - 12:
SLOTS # 30 Relevent Pool # 6,683 4,010 2,673 118 86 3416 1961 250 432 172 147 7 15 39 20 8 12
Applied # 26 15 11 0 2 12 9 0 0 3 0 0 0 0 0 0 0
% 100.0 57.6 42.3 0.0 7.6 46.1 34.6 0.0 0.0 11.5 0.0 0.0 0.0 0.0 0.0 0.0 0.0
Participants # 8 7 1 0 0 6 1 0 0 1 0 0 0 0 0 0 0
% 100.0 87.5 12.5 0.0 0.0 75.0 12.5 0.0 0.0 12.5 0.0 0.0 0.0 0.0 0.0 0.0 0.0
Career Development Programs for GS 13 - 14:
SLOTS # 30 Relevent Pool # 4,848 3,636 1,212 81 25 3241 926 114 171 183 77 3 5 12 4 2 4
Applied # 28 22 6 1 0 16 4 2 2 3 0 0 0 0 0 0 0
% 100.0 78.5 21.4 3.5 0.0 57.1 14.2 7.1 7.1 10.7 0.0 0.0 0.0 0.0 0.0 0.0 0.0
Participants # 10 7 3 0 0 5 2 0 1 2 0 0 0 0 0 0 0
% 100.0 70.0 30.0 0.0 0.0 50.0 20.0 0.0 10.0 20.0 0.0 0.0 0.0 0.0 0.0 0.0 0.0
Career Development Programs for GS 15 and
SES: SLOTS # 30
Relevent Pool # 0 0 0 0 0 0 0 0 0 0 0 0 0 0 0 0 0
Applied # 0 0 0 0 0 0 0 0 0 0 0 0 0 0 0 0 0
% 0.0 0.0 0.0 0.0 0.0 0.0 0.0 0.0 0.0 0.0 0.0 0.0 0.0 0.0 0.0 0.0 0.0
Participants # 0 0 0 0 0 0 0 0 0 0 0 0 0 0 0 0 0
% 0.0 0.0 0.0 0.0 0.0 0.0 0.0 0.0 0.0 0.0 0.0 0.0 0.0 0.0 0.0 0.0 0.0
Of 30 available slots in career development programs for GS 5-12 employees, 26 applied and 8 were selected participants. Of those, 7 (87.5%) were male and 1 (12.5%) female. White males and Asian males participated at rates higher than their overall workforce representation. However, White females participated at a rate below their overall representation in the workforce. No other EEO-groups were selected to participate, although 2 Hispanic females applied to the program. In the GS 13-14 career development program, 30 slots were available, 28 employees applied, and 10 were selected as participants. Of those, 7 (70.0%) were males and 3 (30.0%) females. African American females and Asian males participated at rates above their overall workforce representation, while White males and females participated at rates slightly below their overall representation. No other EEO-groups participated, although 1 Hispanic male and 2 African American males applied to the program.

62
Table A13: EMPLOYEE RECOGNITION AND AWARDS – Distribution by Race/Ethnicity and Sex
Recognition or Award Program # Awards Given Total Cash
Total Employees
RACE/ETHNICITY
Hispanic or Latino
Non-Hispanic or Latino
White Black or African American
Asian
Native Hawaiian or Other Pacific Islander
American Indian or Alaska Native
Multiple Races
All M F M F M F M F M F M F M F M F
Time-Off Awards: 1- 9 hours Total Time
Off Awards 1-9 Hrs.
# 623 461 162 2 6 437 127 13 25 6 3 0 0 3 0 0 1
% 100.0 74.0 26.0 0.3 1.0 70.1 20.4 2.1 4.0 1.0 0.5 0.0 0.0 0.5 0.0 0.0 0.2
Total Hours 4315 3179 1136 16 44 2,989 878 102 194 48 20 0 0 24 0 0 8
Average Hours 7 7 7 8 7 7 7 8 8 8 7 0 0 8 0 0 8
Total Time Off Awards 9+ Hrs.
# 290 192 98 4 1 174 79 10 17 1 1 0 0 3 0 0 0
% 100.0 66.2 33.8 1.4 0.3 60.0 27.2 3.4 5.9 0.3 0.3 0.0 0.0 1.0 0.0 0.0 0.0
Total Hours 6941 4766 2175 88 16 4,319 1,805 215 338 40 16 0 0 104 0 0 0
Average Hours 24 25 22 22 16 25 23 22 20 40 16 0 0 35 0 0 0
In FY 2011, 913 (11,256 hrs) Time-off awards were earned by employees, of which males represented 653 (71.5%) of all Time-off awards and females 260 (28.5%). White males and females, African American males and females, and American Indian or Alaska Native males received these awards at a rate higher than their participation in the workforce. Hispanic males and females, Asian males and females, and Multiple Race females received awards at rates below their overall workforce representation rates. Native Hawaiian or Other Pacific Islanders, American Indian or Alaska Native females, and Multiple Race males were not represented in the distribution of these awards.

63
Table A13: EMPLOYEE RECOGNITION AND AWARDS – Distribution by Race/Ethnicity and Sex
Recognition or Award Program # Awards Given Total Cash
Total Employees
RACE/ETHNICITY
Hispanic or Latino
Non-Hispanic or Latino
White Black or African
American Asian
Native Hawaiian or Other Pacific
Islander
American Indian or
Alaska Native Multiple Races
All M F M F M F M F M F M F M F M F
Cash awards $100 - $500
NOAA 2011
# 4807 3566 1241 69 40 3,305 1,008 101 128 55 51 2 2 32 9 2 3
% 100.0 74.2 25.8 1.4 0.8 68.8 21.0 2.1 2.7 1.1 1.1% 0.0% 0.0% 0.7% 0.2% 0.0% 0.1% Total Amount
$1,611,309
1,191, 839 419,470
22, 989
14, 148
1,101, 885
337, 923
36, 350
46, 119
17, 706
16, 176 546 550
11,568 3,504 795 1,050
Average Amount $335 $334 $338 $333 $354 $333 $335 $360 $360 $336 $326 $273 $275 $362 $389 $398 $350
Cash Awards $501+
Total
# 12587 8042 4545 219 123 7,050 3,418 350 699 368 248 4 13 45 27 6 17
% 100.0 63.9 36.1 1.7 1.0 56.0 27.2 2.8 5.6 2.9 2.0 0.0 0.1 0.4 0.2 0.0 0.1 Total Amount
$22,539,693
14,148, 880
8,390, 813
344, 465
226, 701
12,422,126
6,408,401
600, 739
1,241,754
705, 912
416,015 4,761
27, 156
62, 361
43, 514 8,516
27, 272
Average Amount $1,791 $1,759 $1,846
$1,573 $1,843 $1,762 $1,875 $1,716 $1,776 $1,918
$1,677 $1,190
$2,089
$1,386 $1,612 $1,419 $1,604
During FY 2011, 17,394 cash awards were distributed to employees totaling $24,151,002; of which males received 11,608 ($15,340,719 or 66.7%) and females 5,786 ($8,810,283 or 33.3%). All EEO-groups received awards at rates equal to and/or higher than their overall workforce representation, except Hispanic males and females, Native Hawaiian or Other Pacific Islander males, and Multiple Race males and females.

64
Table A13: EMPLOYEE RECOGNITION AND AWARDS – Distribution by Race/Ethnicity and Sex
Recognition or Award Program
Total Employees
RACE/ETHNICITY
Hispanic or Latino
Non-Hispanic or Latino
White Black or African
American Asian
Native Hawaiian
or Other
Pacific Islander
American Indian or
Alaska Native Multiple Races
All M F M F M F M F M F M F M F M F
Quality Step Increases (QSI)
Total
# 170 119 51 4 0 112 45 1 3 1 2 0 0 1 0 0 1
% 100.0 70.0 30.0 2.4 0.0 65.9 26.5 0.6 1.8 0.6 1.2 0.0 0.0 0.6 0.0 0.0 0.6 Total Benefit$
448, 848
341, 003
107, 845
11, 141 0
323, 408
95, 993 2,389 7,896 2,389 3,956 0 0 1,676 0 0 2,009
Average Benefit $ 2,640 2,866 2,115 2,785 0 2,888 2,133 2,389 2,632 2,389 1,978 0 0 1,676 0 0 2,009
In FY 2011, 170 QSI’s were earned by employees, of which males represented 119 (70.0%) and females 51 (30.0%). White males and American Indian or Alaska Native males were the only groups that received this award at a rate equal to and/or higher than their overall workforce participation. Native Hawaiians, American Indian or Alaska Native females, and Multiple Race males were not represented in the distribution of these awards.

65
Table A14 and A14a: Separations by Type of Separation (Permanent and Temporary combined) – Distribution by Race/Ethnicity and Sex
Type of Separation
Total Employees
RACE/ETHNICITY
Hispanic or
Latino
Non-Hispanic or Latino
White Black or African
American Asian
Native Hawaiia
n or Other Pacific
Islander
American Indian or Alaska Native
Multiple Races
All M F M F M F M F M F M F M F M F
Voluntary # 716 462 254 8
2
399
200
31
44
20
6
1
1
3
1
0
0
% 100.0 64.5 35.5 1.1 0.3 55.7 27.9 4.3 6.1 2.8 0.8 0.1 0.1 0.4 0.1 0.0 0.0
Involuntary # 48 32 16 2 2 24 8 4 5 2 0 0 0 0 1 0 0
% 100.0 66.7 33.3 4.2 4.2 50.0 16.7 8.3 10.4 4.2 0.0 0.0 0.0 0.0 2.1 0.0 0.0
RIF # 0 0 0 0 0 0 0 0 0 0 0 0 0 0 0 0 0 % 0.0 0.0 0.0 0.0 0.0 0.0 0.0 0.0 0.0 0.0 0.0 0.0 0.0 0.0 0.0 0.0 0.0
Total # 764 494 270 10 4 423 208 35 49 22 6 1 1 3 2 0 0 % 100.0 64.7 35.3 1.3 0.5 55.4 27.2 4.6 6.4 2.9 0.8 0.1 0.1 0.4 0.3 0.0 0.0
Total Work Force
# 13,065 8,703 4,362 221 122 7,585 3,279 415 650 398 242 15 22 57 26 12 21 % 100.0 66.6 33.4 1.7 0.9 58.1 25.1 3.2 5.0 3.0 1.9 0.1 0.2 0.4 0.2 0.1 0.2
Total Separations In FY 2011, males represented 64.7% of all separations and females 35.3%. Voluntary Separations White females, and African American males and females separated at a rate higher than their participation rate in the workforce. Involuntary Separations Hispanic males and females, Black males and females, Asian males, and American Indian or Alaskan Native females experienced this action at a rate higher than their overall workforce representation.

66
B TABLES ANALYSES Overall Notes: NOAA has adopted the Federal Goal of 2% participation of employees with targeted disabilities, and therefore is using that figure as the benchmark for comparison. Detailed data by disability category such as deafness, blindness, etc. have not been included in this analysis due to numbers in these groups being too small to evaluate (in most cases, less than 10 in each category; all groups have less than 20 in each category.) Table B1 Total Workforce – Distribution by Disability
Employment Tenure Total
Total by Disability Status
[05] No Disability
[01] Not Identified
[06-94] Disability
Targeted Disability
TOTAL
Prior FY # 13,043 12,186 205 652 84 % 100.0% 93.4% 1.6% 5.0% 0.6%
Current FY # 13,065 12,113 272 680 84 % 100.0% 92.7% 2.1% 5.2% 0.6%
Difference # 22 -73 67 28 0 Ratio Change % 0.0% -0.7% 0.5% 0.2% 0.0% Net Change % 0.2% -0.6% 32.7% 4.3% 0.0%
Federal High %
2.27%
PERMANENT
Prior FY # 12,690 11,866 194 630 78 % 100.0% 93.5% 1.5% 5.0% 0.6%
Current FY # 12,687 11,788 244 655 81 % 1.0% 92.9% 1.92% 5.16% 0.6%
Difference # -3 -78 50 25 3 Ratio Change % 0.0% -0.6% 0.4% 0.2% 0.0% Net Change % 0.0% -0.7% 25.8% 4.0% 3.8%
TEMPORARY
Prior FY # 353 320 11 22 6 % 100.0% 90.7% 3.1% 6.2% 1.7%
Current FY # 378
325
28
25
3
% 100.0% 85.9% 7.4% 6.6% 0.8% Difference # 25 5 17 3 -3
Ratio Change % 0.0% -4.7% 4.3% 0.4% -0.9% Net Change % 7.1% 1.6% 154.5% 13.6% -50.0%
ANALYSIS OF WORK FORCE BY DISABILITY STATUS In comparing the FY 2011 workforce (13,065) to the FY 2010 workforce (13,043), there was an overall increase of 22 individuals (0.2%). During this same time period, the number of permanent employees with targeted disabilities increased by 3. However, the participation rate of NOAA employees with targeted disabilities remained below the 2% Federal at 0.6%.

67
The number of temporary employees with targeted disabilities is too small to evaluate as a group (3). The number of permanent employees with reportable disabilities did increase slightly, from 630 to 655. The number of temporary employees with reportable disabilities also increased from 22 to 25. Table B2: Total Workforce (Permanent Employees Only) By Component - Distribution by Disability
Employment Tenure Total
Total by Disability Status [05] No Disability
[01] Not Identified
[06-94] Disability
Targeted Disability
Total Work Force # 12,687 11,788 244 655 81 % 100.00% 92.91% 1.92% 5.16% 0.64%
Federal High %
2.27% OFFICE OF UNDER SECRETARY # 281 264 7 10 0
% 100.00% 93.95% 2.49% 3.56% 0.00% STAFF OFFICES OF THE OFFICE OF THE UNDER SECRETARY
# 808 727 15 66 15
% 100.00% 89.98% 1.86% 8.17% 1.86% NOAA MARINE AND AVIATION OPERATIONS # 630 585 11 34 1
% 100.00% 92.86% 1.75% 5.40% 0.16% NATIONAL OCEAN SERVICE # 1,230 1,166 17 47 8
% 100.00% 94.80% 1.38% 3.82% 0.65% NATIONAL WEATHER SERVICE # 4,908 4,547 81 280 32
% 100.00% 92.64% 1.65% 5.70% 0.65% NATIONAL MARINE FISHERIES SERVICE # 3,219 3,015 69 135 14
% 100.00% 93.66% 2.14% 4.19% 0.43% NATIONAL ENVIRONMENTAL SATELLITE, DATA & INFO SERVICE
# 855 774 26 55 8
% 100.00% 90.52% 3.04% 6.43% 0.93% OFFICE OF OCEANIC AND ATMOSPHERIC RESEARCH # 739 698 15 26 3
% 100.00% 94.4% 2.03% 3.52% 0.41% ORG LEVEL 2 (CM5460) # 17 12 3 2 0
% 100.00% 70.58% 17.64% 11.76% 0.00%
For FY 2011, the National Weather Service (NWS) was the largest line office with 4,908 (38.6%) permanent employees and the National Marine Fisheries Service (NMFS) followed with 3,219 (25.3%) employees. The NWS has a 0.65% participation rate for employees with targeted disabilities and 0.43% for NMFS, both substantially below the Federal and NOAA Goal of 2%. The Staff Offices (Office of the Chief Information Officer, Office of the Chief Financial Officer, Office of Acquisition and Grants, Office of the Chief Administration Officer, and the Workforce Management Office) has a participation rate of 1.86%, moderately below the Federal and NOAA Goal of 2%. The numbers of employees with targeted disabilities in the other line offices are too small to evaluate and therefore are not included.

68
Table B3: Occupational Categories (Permanent) - Distribution by Disability Note: Employees in the 0312 job series are not represented in the following tables due to errors in the Department’s Occupational Series Code data.
Occupational Categories Total
Total by Disability Status
[05] No Disability
[01] Not Identified
[06-94] Disability
Targeted Disability
1.Officials and Managers Executive/Senior Level (Grades 15 and Above)
# 334 320 2 12 2
% 2.7% 2.8% 0.8% 1.9% 2.5%
Mid-Level (Grades 13-14)
# 164 157 2 5 1
% 1.3% 1.4% 0.8% 0.8% 1.2%
First-Level (Grades 12 and below)
# 958 911 15 32 1
% 7.8% 8.0% 6.3% 5.0% 1.2%
Other # 1,562 1,442 32 88 11
% 12.7% 12.6% 13.5% 13.8% 13.6%
Officials and Managers Total
# 3,018 2,830 51 137 15
% 24.6% 24.8% 21.5% 21.5% 18.5%
2. Professionals # 7,124 6,679 126 319 37
% 58.0% 58.5% 53.2% 50.1% 45.7%
3. Technicians # 1,203 1,096 30 77 8
% 9.8% 9.6% 12.7% 12.1% 9.9%
4. Sales Workers # 0 0 0 0 0
% 0.0% 0.0% 0.0% 0.0% 0.0%
5. Administrative Support Workers
# 762 643 23 96 21
% 6.2% 5.6% 9.7% 15.1% 25.9%
6. Craft Workers # 43 38 3 2 0
% 0.3% 0.3% 1.3% 0.3% 0.0%
7. Operatives # 18 16 1 1 0
% 0.1% 0.1% 0.4% 0.2% 0.0%
8. Laborers and Helpers # 0 0 0 0 0
% 0.0% 0.0% 0.0% 0.0% 0.0%
9. Service Workers # 124 116 3 5 0
% 1.0% 1.0% 1.3% 0.8% 0.0%
TOTAL # 12,292 11,418 237 637 81 % 100.0% 100.0% 100.0% 100.0% 100.0%
Compared to the overall workforce participation rate of 24.6% for Officials and Managers, Officials and Managers with targeted disabilities have a participation rate of 18.5%.

69
The overall workforce participation rate for Professionals is 58.0%, as compared to 45.7% participation rate for people with targeted disabilities in this category. However, the situation is reversed for Technicians and Administrative Support Workers. Technicians with targeted disabilities are represented at 9.9%, as compared to 9.8% overall workforce participation rate, and Administrative Support Workers with targeted disabilities are represented at 25.9%, as compared to 6.2% overall participation rate. The numbers of employees with targeted disabilities in the other categories are too small to evaluate and therefore are not included.

70
Table B4-1: (Permanent) Participation Rates for GS by Disability
GS/GM, SES, and Related Grade Total
Total by Disability Status
[05] No Disability
[01] Not Identified
[06-94] Disability
Targeted Disability
GS-01 # 1 0 0 1 0 % 100.0% 0.0% 0.0% 100.0% 0.0%
GS-02 # 2 1 0 1 1 % 100.0% 50.0% 0.0% 50.0% 50.0%
GS-03 # 5 4 0 1 1 % 100.0% 80.0% 0.0% 20.0% 20.0%
GS-04 # 63 52 4 7 6 % 100.0% 82.5% 6.3% 11.1% 9.5%
GS-05 # 56 50 1 5 3 % 100.0% 89.3% 1.8% 8.9% 5.4%
GS-06 # 151 117 9 25 8 % 100.0% 77.5% 6.0% 16.6% 5.3%
GS-07 # 169 141 8 20 2 % 100.0% 83.4% 4.7% 11.8% 1.2%
GS-08 # 582 503 13 66 10 % 100.0% 86.4% 2.2% 11.3% 1.7%
GS-09 # 218 197 4 17 0 % 100.0% 90.4% 1.8% 7.8% 0.0%
GS-10 # 731 667 18 46 4 % 100.0% 91.2% 2.5% 6.3% 0.5%
GS-11 # 793 733 14 46 2 % 100.0% 92.4% 1.8% 5.8% 0.3%
GS-12 # 3,605 3382 68 155 16 % 100.0% 93.8% 1.9% 4.3% 0.4%
GS-13 # 1,771 1660 24 87 7 % 100.0% 93.7% 1.4% 4.9% 0.4%
GS-14 # 3,017 2836 56 125 9 % 100.0% 94.0% 1.9% 4.1% 0.3%
GS-15 # 921 876 15 30 0 % 100.0% 95.1% 1.6% 3.3% 0.0%
OTHER # 9 8 0 1 0 % 100.0% 88.9% 0.0% 11.1% 0.0%
SES # 117 109 2 6 1 % 100.0% 93.2% 1.7% 5.1% 0.9%
TOTAL # 12,211 11,336 236 639 70 % 100.0% 92.8% 1.9% 5.2% 0.6%
In general, employees with targeted disabilities have a higher participation rate at the lower pay levels (GS 1-11) than the higher pay levels (GS 12-SES). The participation rate for GS 12 equivalent employees with disabilities is 4.3% as compared to the 29.5% participation rate for the overall workforce.

71
B5-1: (Permanent) Wage Grade Participation Rates by Disability
WD/WG, WLWS &
Other Wage Grades
Total
Total by Disability Status
[05] No Disability
[01] Not Identified
[06-94] Disability
Targeted Disability
Grade-01 # 0 0 0 0 0
% 0.0% 0.0% 0.0% 0.0% 0.0%
Grade-02 # 1 1 0 0 0
% 100.0% 100.0% 0.0% 0.0% 0.0%
Grade-03 # 0 0 0 0 0
% 0.0% 0.0% 0.0% 0.0% 0.0%
Grade-04 # 0 0 0 0 0
% 0.0% 0.0% 0.0% 0.0% 0.0%
Grade-05 # 3 2 1 0 0
% 100.0% 66.7% 33.3% 0.0% 0.0%
Grade-06 # 18 16 1 1 0
% 100.0% 88.9% 5.6% 5.6% 0.0%
Grade-07 # 1 1 0 0 0
% 100.0% 100.0% 0.0% 0.0% 0.0%
Grade-08 # 5 4 0 1 0
% 100.0% 80.0% 0.0% 20.0% 0.0%
Grade-09 # 14 13 0 1 0
% 100.0% 92.9% 0.0% 7.1% 0.0%
Grade-10 # 21 18 2 1 0
% 100.0% 85.7% 9.5% 4.8% 0.0%
Grade-11 # 4 4 0 0 0
% 100.0% 100.0% 0.0% 0.0% 0.0%
Grade-12 # 1 1 0 0 0
% 100.0% 100.0% 0.0% 0.0% 0.0%
Grade-13 # 0 0 0 0 0
% 0.0% 0.0% 0.0% 0.0% 0.0%
Grade-14 # 1 1 0 0 0
% 100.0% 100.0% 0.0% 0.0% 0.0%
Grade-15 # 0 0 0 0 0
% 0.0% 0.0% 0.0% 0.0% 0.0% All Other Wage Grades
# 0 0 0 0 0
% 0.0% 0.0% 0.0% 0.0% 0.0%
Total # 69 61 4 4 0
% 100.0% 88.4% 5.8% 5.8% 0.0%
The numbers of employees with targeted disabilities in all of the wage grade categories are too small to evaluate and therefore the analysis is not included.
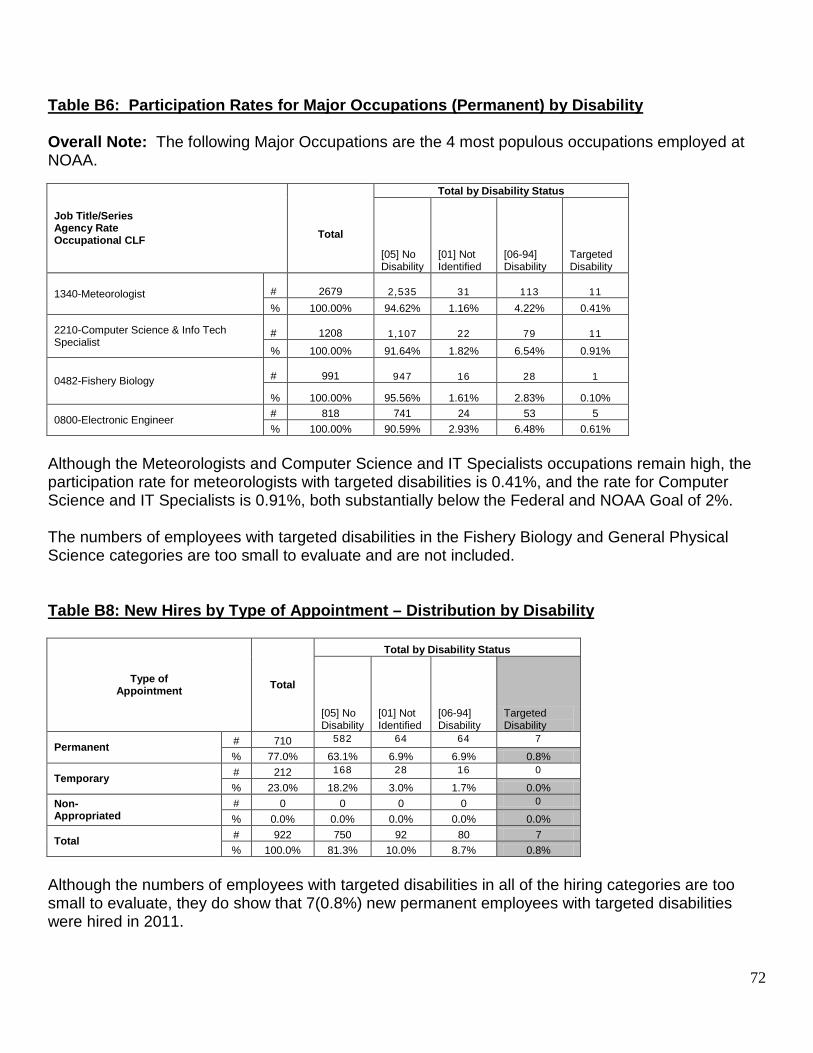
72
Table B6: Participation Rates for Major Occupations (Permanent) by Disability Overall Note: The following Major Occupations are the 4 most populous occupations employed at NOAA.
Job Title/Series Agency Rate Occupational CLF
Total
Total by Disability Status
[05] No Disability
[01] Not Identified
[06-94] Disability
Targeted Disability
1340-Meteorologist # 2679
2,535
31
113
11
% 100.00% 94.62% 1.16% 4.22% 0.41%
2210-Computer Science & Info Tech Specialist
# 1208
1,107
22
79
11
% 100.00% 91.64% 1.82% 6.54% 0.91%
0482-Fishery Biology # 991
947
16
28 1
% 100.00% 95.56% 1.61% 2.83% 0.10%
0800-Electronic Engineer # 818 741 24 53 5 % 100.00% 90.59% 2.93% 6.48% 0.61%
Although the Meteorologists and Computer Science and IT Specialists occupations remain high, the participation rate for meteorologists with targeted disabilities is 0.41%, and the rate for Computer Science and IT Specialists is 0.91%, both substantially below the Federal and NOAA Goal of 2%. The numbers of employees with targeted disabilities in the Fishery Biology and General Physical Science categories are too small to evaluate and are not included. Table B8: New Hires by Type of Appointment – Distribution by Disability
Type of Appointment Total
Total by Disability Status
[05] No Disability
[01] Not Identified
[06-94] Disability
Targeted Disability
Permanent # 710 582 64 64 7
% 77.0% 63.1% 6.9% 6.9% 0.8%
Temporary # 212 168 28 16 0
% 23.0% 18.2% 3.0% 1.7% 0.0% Non- Appropriated
# 0 0 0 0 0
% 0.0% 0.0% 0.0% 0.0% 0.0%
Total # 922 750 92 80 7 % 100.0% 81.3% 10.0% 8.7% 0.8%
Although the numbers of employees with targeted disabilities in all of the hiring categories are too small to evaluate, they do show that 7(0.8%) new permanent employees with targeted disabilities were hired in 2011.

73
Table B12: PARTICIPATION IN CAREER DEVELOPMENT Distribution by Disability [OPM Form 256 Self-Identification Codes]
Employment Tenure Total
Total by Disability Status
[05] No Disability
[01] Not Identified
[06-94] Disability
Targeted Disability
Career Development Programs for GS 5 - 12: SLOTS # 30
Relevent Pool # 6683 6142 144 353 44
Applied # 26 24 1 1 0 % 100.00% 92.31% 3.85% 3.85% 0.00%
Participants # 8 6 1 1 0 % 100.00% 75.00% 12.50% 12.50% 0.00%
Career Development Programs for GS 13 - 14:
SLOTS # 30 Relevent Pool # 4848 4553 82 197 16
Applied # 28 28 0 0 0 % 100.00% 100.00% 0.00% 0.00% 0.00%
Participants # 10 10 0 0 0 % 100.00% 100.00% 0.00% 0.00% 0.00%
Career Development Programs for GS 15 and SES: SLOTS # 30
Relevent Pool # 0
0
Applied # 0
0 0 0 % 0.00% 0.00% 0.00% 0.00% 0.00%
Participants # 0 0 0 0 0 % 0.00% 0.00% 0.00% 0.00% 0.00%
Of all career development programs for GS 5-12 employees, 26 applied and 8 were selected participants. Of those, 1 (12.5%) was an employee with a disclosed disability; not targeted. Employees with targeted disabilities did not apply nor were they selected in career development programs for GS-13-SES employees.

74
Table B13: EMPLOYEE RECOGNITION AND AWARDS - Distribution by Disability
Recognition or Award
Program # Awards Given
Total Cash Total
Total by Disability Status
[05] No Disability
[01] Not Identified
[06-94] Disability
Targeted Disability
Time-Off Awards: 1- 9 hours
Total Time Off Awards 1-9 hours
# 623 588 15 20 3
% 100.0% 94.4% 2.4% 3.2% 0.5% Total Hours 4,315 4,091 96 128 24
Average Hours 7 7 6 6 8
Time-Off Awards: 9+ hours
Total Time Off Awards 9+ hours
# 290 267 7 16 2
% 100.0% 92.1% 2.4% 5.5% 0.7% Total Hours 6,941 6,471 169 301 32
Average Hours 24 24 24 19 16 In FY 2011, of 913 (11,256 hrs.) Time-off awards, 5 (1.2%) were earned by employees with targeted disabilities. Cash awards $100 - $500
Total Cash Awards $500 and under
# 4,807 4,496 62 249 17
% 100.0% 93.5% 1.3% 5.2% 0.4% Total Amount 1,611,309 1,502,424 23,332 85,553 5728
Average Amount $335 $334 $376 $344 $337
Cash Awards $501+
Total Cash Awards $501 and over
# 12,587 11,830 196 561 55
% 100.0% 94.0% 1.6% 4.5% 0.4% Total Amount 22,539,693 21,356,403 330,191 853,099 73778
Average Amount $1,791 $1,805 $1,685 $1,521 $1,341 Of 17,394 cash awards, 72 (0.8%) were distributed to employees with targeted disabilities, totaling $79,506. Quality Step Increases
Total QSIs Awarded
# 171 164 4 3 0
% 100.0% 95.9% 2.3% 1.8% 0.0% Total Benefit 452,866 438,662 7,750 6,454 0
Average Benefit $2,648 $2,675 $1,938 $2,151 $0
In FY 2011, employees with targeted disabilities were not represented in the number of QSI’s.

75
Table B14: Separations by Type of Separation (Permanent) – Distribution by Disability
Type of Separation Total
Total by Disability Status
[05] No Disability
[01] Not Identified
[06-94] Disability
Targeted Disability
Voluntary # 716 666 9 41 7
% 100.0% 93.0% 1.3% 5.7% 1.0%
Involuntary # 48 41 1 6 2
% 100.0% 85.4% 2.1% 12.5% 4.2%
RIF # 0 0 0 0 0
% 0.0% 0.0% 0.0% 0.0% 0.0%
Total # 764 707 10 47 9 % 100.0% 92.5% 1.3% 6.2% 1.2%
Total Workforce
# 13,065 12,113 272 680 84 % 100.0% 92.7% 2.1% 5.2% 0.6%
Although the numbers of permanent employees with targeted disabilities in all of the separation categories are too small to evaluate, they do show that 7 (1.0%) permanent employees with targeted disabilities voluntarily separated in FY 2011, while 2 (4.2%) involuntarily separated at a rate higher than the overall representation in the workforce.