77th unece grpe session · oemery oil not suitable for the calibration of the whole system ... •...
TRANSCRIPT

77th UNECE GRPE session
PMP IWG Progress Report
Geneva, 7th -8th June 2018
UNITED NATIONS
Informal document GRPE-77-1477th GRPE, 6–8 June 2018
Agenda item 7

PMP meetings in 2018
• 2018-01-09: PMP 46th (GRPE Geneva summary)• 2018-05-16/17: PMP 47th
• NEXT F-2-F MEETING: 13th/14th (tbc) November 2018 (Location: tbc)

EXHAUST PARTICLE EMISSIONS
Main open points
• Round Robin Sub-23nm• Raw exhaust sampling• Calibration - Round Robin PNC (Particle Number Counter)• Horizon 2020 projects

Sub23 nm particles
• Development of a sub23nm (cut-off size:∼ 10 nm) particle number measurement procedure based on the existing PMP methodology conveniently adapted.
• Main purpose: Monitoring particle emissions of new engine/after-treatment technologies.
• Assessment of the repeatability/reproducibility of the proposed particle counting methodology by means of a “round robin”.

About the exercise
• Measurement of a LD GDI vehicle in 8 laboratories• 3 cold WLTC, 5 hot WLTC, 1 steady speed test• Objectives of the exercise is to
ouncertainties PMP-23nm and PMP-10nm, the need of a catalytic stripper (CS) and data for sub23nm
• Two systems with CS and 10nm CPC to circulate
APC 10 and , 23 nm cut-off, CS
SPCS 10 nm cut-off, CS
AM10 10 nm cut-off LabPMP
TSI23 23 nm cut-off, SPCS
TSI10 10 nm cut-off LabPMP

About the exercise
• Measurements so far conducted in 6 different laboratories• Switzerland and Japan to be done• Some problems with instruments and transportation (always solved
but caused some delay)
• PN10 and PN23 Data with Heated Evaporation Tube and Catalytic Stripper (CS) from all of the laboratories (CS1 or CS2 )
• Until now only results from PMP vehicle (gasoline DI without GPF)
• The data shown is about variability between the laboratories
Summary
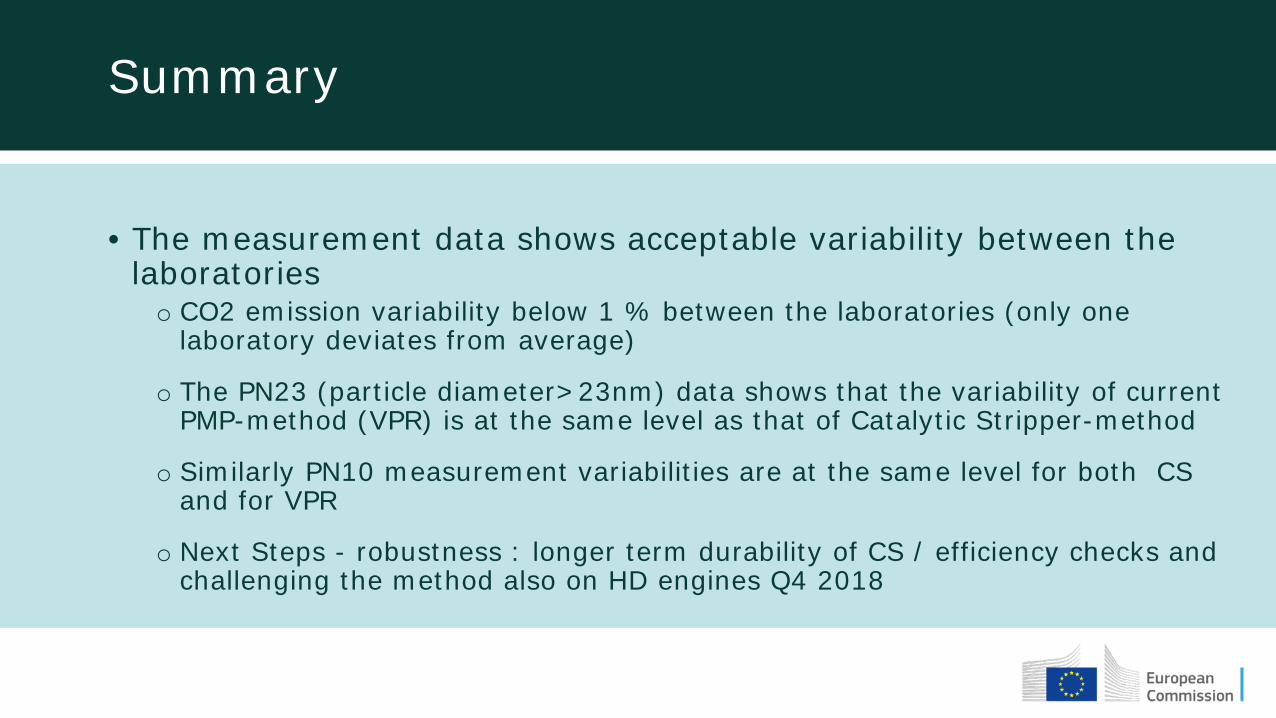
• The measurement data shows acceptable variability between the laboratorieso CO2 emission variability below 1 % between the laboratories (only one
laboratory deviates from average)
o The PN23 (particle diameter>23nm) data shows that the variability of current PMP-method (VPR) is at the same level as that of Catalytic Stripper-method
o Similarly PN10 measurement variabilities are at the same level for both CS and for VPR
o Next Steps - robustness : longer term durability of CS / efficiency checks and challenging the method also on HD engines Q4 2018

Summary
PN measurement variability between labs
Speed/gear
PN23,VPR
PN23,CS
PN10,VPR
PN10,CS
100/4 11% 13% 27% 14%
120/5 6% 10% 27% 8%
100/3 4% 6% 19% 5%
50/2 5% 8% 22% 7%
Measurement variability between laboratories over WLTC-cycle. The variablity between PN-emissions
CO2PN23,VPR
PN23,CS
PN10,VPR PN10,CS
HOT 2% 19% 16% 19% 18%
COLD 1% 12% 12% 16% 8%

Average CO2 emission in (WLTP)
Lab1 Lab2 Lab3 Lab4 Lab5 Lab6
CO
2 (g
/km
)
WLTC CO2 (g/km)COLD START HOT START
CO2 variability, normalized to mean (100)STD Lab1 Lab2 Lab3 Lab4 Lab5 Lab6
HOT 2% 100 99 98 99 100 104COLD 1% 100 100 98 101 99 102
To be solved
Emissions normalized to mean Reddish color |deviation| > std
Things to do: recheck labs normalization temperature
Random order

PN Counting from Raw Exhaust via Fixed Dilution• Interest in this approach confirmed by some engine manufacturers
and some instrument manufacturers• 01 Series of amendments to Reg. 132 already includes such
possibility but the procedure is not defined• Preliminary results generated by the JRC show 20% differences -
Data presented by the industry during the 43rd meeting confirms good correlation
• ACEA and JRC have discussed and agreed to carry out a joint experimental programme to investigate all the open issues –Indicative timing: 4th quarter 2018

PNC Calibration Round Robin
• Draft final report finished – Uploaded on the PMP website for comments• Main message: soot can work well as material for calibration. Generation of
soot particles critical
• Open issues:o Emery oil or soot? “Academic calibration exercise” vs real world?o Emery oil not suitable for the calibration of the whole system (RDE)o Differences up to ±15% in the field among CPC calibrated according to the
procedure (need to tighten tolerances?)

PNC Calibration
• Options: 1. Continue working for the improvement of the current calibration procedure
to reduce the differences between PMP systems (up to ± 20% in the field)However impact on the existing systems and on limits should be considered
2. Focusing the attention on the calibration procedure for systems able to measure below 23 nm
• The PMP group will prepare a roadmap in the November meeting for one or both options to be presented in the next GRPE plenary session

HORIZON 2020 projects
• The group is monitoring the progress of the three projects funded by EU under the H2020 scheme
• DownToTen• PEMS4nano• SUREAL-23
• These projects have the objective of investigating (nature, composition,…) sub23 nm emissions and to develop new test procedures to measure these particles
• Representative of the consortia provide regular updates to PMP group – Presentations available on the PMP website

Gas engine testing
• Further investigations on light duty and heavy duty will be carried out during 2018
• Gas engine tested in the joint project ACEA/JRC?

Additional topics to be addressed?
In the informal meeting during the GRPE of January 2018 a few additional points were raised:
• Impact of fuel quality on PN emissions
• Effect of biofuels of different nature blended with conventional fuels on PN emissions
These topics are not included in the current mandate of PMP.

Additional topics to be addressed?
The PMP IWG has discussed in the last meeting the issue and has proposed the following approach• First step: Literature survey and knowledge gap analysis• Further steps to be decided on the basis of the result of the survey• Scope of the literature survey to be defined (guidance from GRPE)
oEngine out, tailpipe emissions or both?oOnly light duty? (i.e. exclude motorcycles and HD ?)oPI, Diesel or both?
• Guidance from GRPE is welcome
NON-EXHAUST PARTICLE EMISSIONS

• WLTP Database Analysis (Concluded)
• Comparison of WLTP data with Existing Industrial Cycles (Concluded)
• Development of a first version of the new (WLTP based) and backup (LACT based)
braking schedule (Concluded)
• Validation of the cycles - Round robin (reproducibility assessment on different dynos)
(Deadline: March – April 2018) (Deadline: December 2018)
NON-EXHAUST PARTICLE EMISSIONSDEVELOPMENT OF A NEW REAL-WORLD BRAKING CYCLE FOR
STUDYING BRAKE PARTICLE EMISSIONS

NON-EXHAUST PARTICLE EMISSIONSDEVELOPMENT OF A NEW REAL-WORLD BRAKING CYCLE FOR
STUDYING BRAKE PARTICLE EMISSIONS
• FORD has concluded the
development of the schedule in
collaboration with Heinz Steven
• Technical details regarding the
cycle have been presented in
EuroBrake 2018
• The cycle will become available
to the public after its acceptance
to the WEAR Journal (June 2018)

• 303 stops at a
distance of 192 km
• 4h 24min duration
• Average speed of 44
km/h and maximum
speed of 133 km/h
• Deceleration 0.49 –
2.18 m/s² (mean of
0.97 m/s²)
DEVELOPMENT OF A NEW REAL-WORLD BRAKING CYCLE FOR STUDYING BRAKE PARTICLE EMISSIONS
NOVEL CYCLE

BRAKING TEST CYCLE – OPEN ISSUES
Low flow dynamometer testing will lead to higher maximum temperatures than
observed in the field. How can we reproduce correct temperature levels?
Which temperature will be achieved for other vehicles (vehicle classes)
How to adapt cycle to other vehicle classes?
Influence of breaks between the trips
Temperature level and cooling influence on other test setups for emission testing

BRAKING TEST CYCLE – NEXT STEP
A round robin has been scheduled for the next months with the purpose of
validating both braking schedules in terms of temperature. All labs participating in
TF1 will take part and the round robin is expected to be completed by the end of
2018
A paper with the title “A novel real-world braking cycle for studying brake
wear particle emissions” has been submitted to WEAR and is expected to be
published soon
BRAKE DUST SAMPLING AND MEASUREMENT MAIN TASKS
• Selection of the testing methodology (Concluded)
• Comparison of existing systems/test rig configurations (Deadline: January 2018 –
Concluded on-time)
• Selection/definition of testing parameters (Deadline: March 2018 – Still on-going)
• Validation of the selected configuration(s) & measurement methodologies (Deadline:
To be defined depending on the progress)
• Data processing method (Deadline: To be defined depending on the progress)

Pin-on-disc Brake dyno Chassis dyno
BRAKE DUST SAMPLING AND MEASUREMENT SELECTION OF THE TESTING METHODOLOGY
Also, different on-road approaches have been employed by several researchers
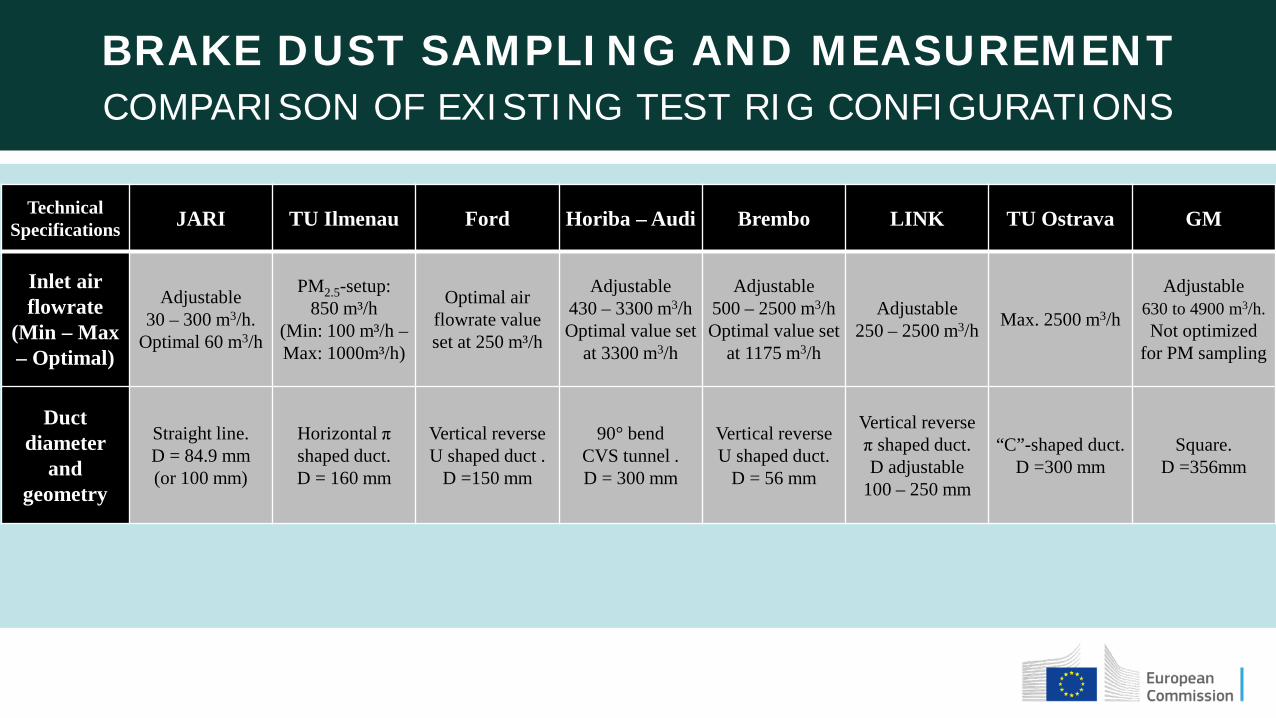
Technical Specifications JARI TU Ilmenau Ford Horiba – Audi Brembo LINK TU Ostrava GM
Inlet air flowrate
(Min – Max – Optimal)
Adjustable 30 – 300 m3/h.
Optimal 60 m3/h
PM2.5-setup: 850 m³/h
(Min: 100 m³/h –Max: 1000m³/h)
Optimal air flowrate value set at 250 m³/h
Adjustable 430 – 3300 m3/h Optimal value set
at 3300 m3/h
Adjustable 500 – 2500 m3/h Optimal value set
at 1175 m3/h
Adjustable 250 – 2500 m3/h Max. 2500 m3/h
Adjustable 630 to 4900 m3/h.Not optimized
for PM sampling
Duct diameter
and geometry
Straight line. D = 84.9 mm (or 100 mm)
Horizontal π shaped duct. D = 160 mm
Vertical reverse U shaped duct .
D =150 mm
90° bend CVS tunnel . D = 300 mm
Vertical reverse U shaped duct.
D = 56 mm
Vertical reverse π shaped duct. D adjustable
100 – 250 mm
“C”-shaped duct. D =300 mm
Square. D =356mm
BRAKE DUST SAMPLING AND MEASUREMENT COMPARISON OF EXISTING TEST RIG CONFIGURATIONS
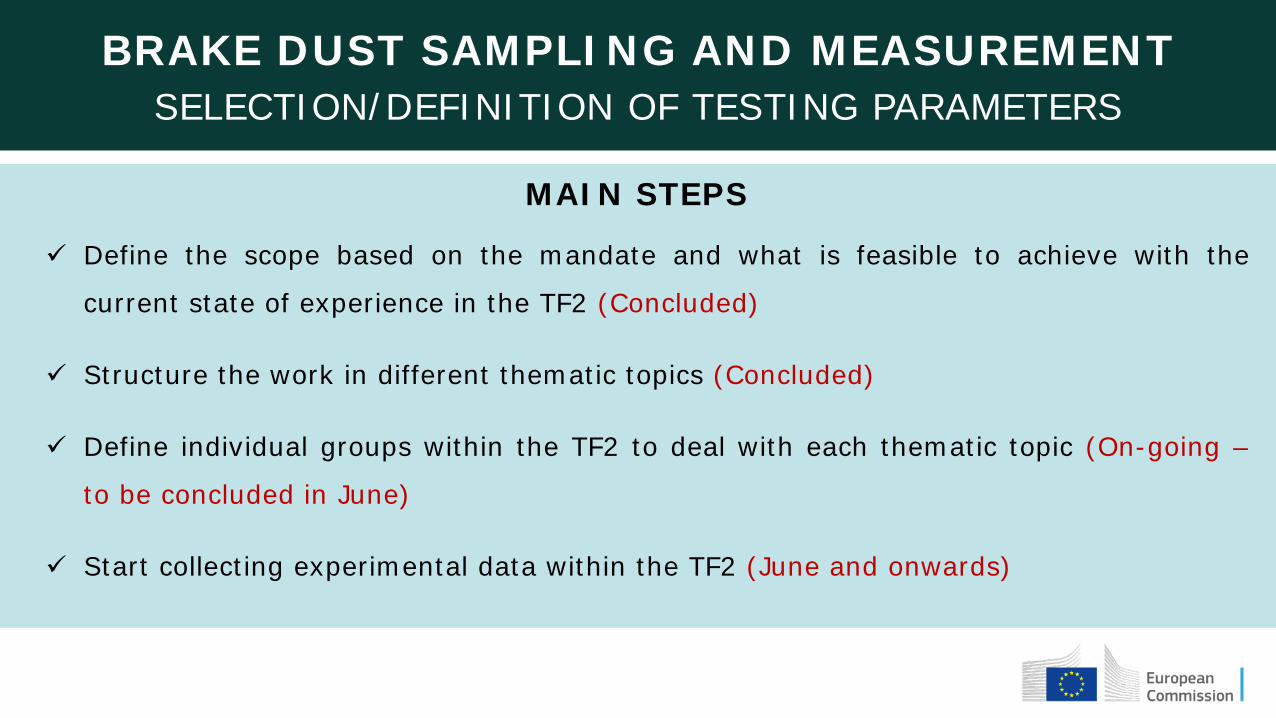
Define the scope based on the mandate and what is feasible to achieve with the
current state of experience in the TF2 (Concluded)
Structure the work in different thematic topics (Concluded)
Define individual groups within the TF2 to deal with each thematic topic (On-going –
to be concluded in June)
Start collecting experimental data within the TF2 (June and onwards)
BRAKE DUST SAMPLING AND MEASUREMENT SELECTION/DEFINITION OF TESTING PARAMETERS
MAIN STEPS
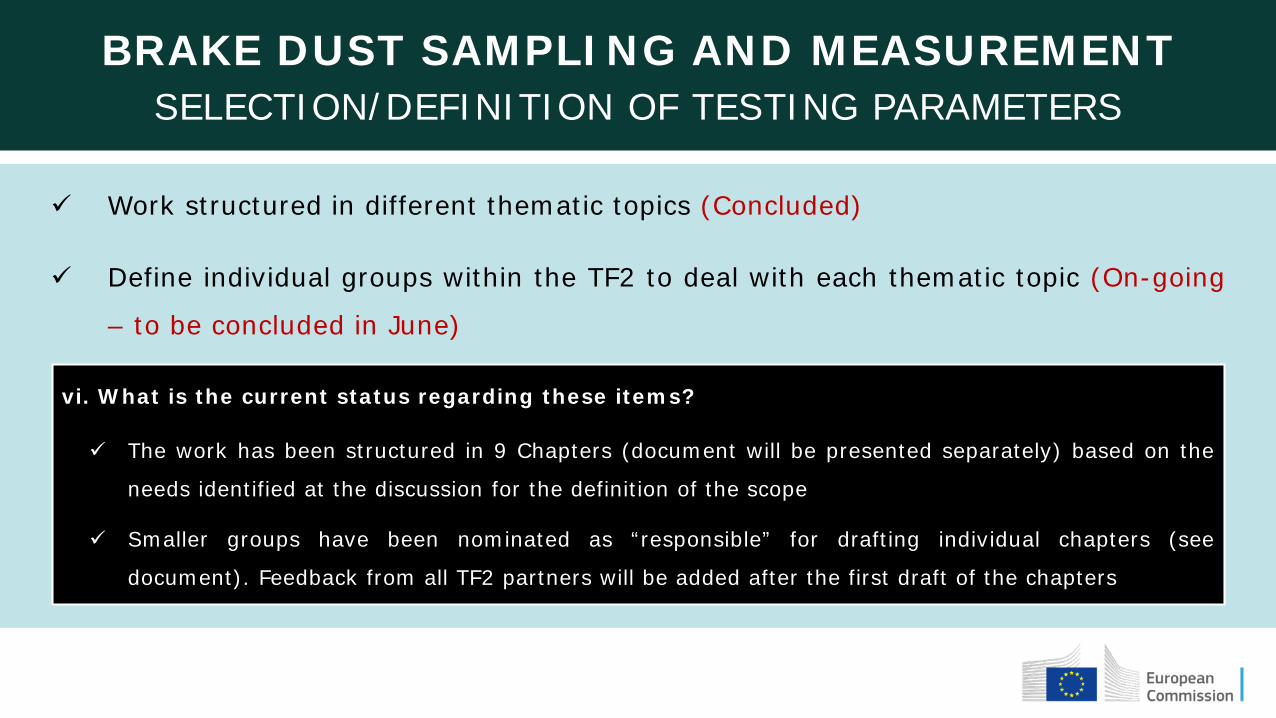
Work structured in different thematic topics (Concluded)
Define individual groups within the TF2 to deal with each thematic topic (On-going
– to be concluded in June)
vi. What is the current status regarding these items?
The work has been structured in 9 Chapters (document will be presented separately) based on the
needs identified at the discussion for the definition of the scope
Smaller groups have been nominated as “responsible” for drafting individual chapters (see
document). Feedback from all TF2 partners will be added after the first draft of the chapters
BRAKE DUST SAMPLING AND MEASUREMENT SELECTION/DEFINITION OF TESTING PARAMETERS

Start collecting experimental data within the TF2 (June and onwards)
Data already exist from previous projects (already presented in 37th – 45th PMPMeetings)
TF2 members are involved in many on-going projects and more data will comefrom there in the near future
Based on this data the TF2 will define all necessary testing parameters and willcome up with a minimum set of requirements for the sampling set-up and thenecessary instrumentation
BRAKE DUST SAMPLING AND MEASUREMENT SELECTION/DEFINITION OF TESTING PARAMETERS

SAMPLING AND MEASUREMENT – Challenges
• There is a common understanding that both PM10 and PM2.5 as well as
PN emissions should be investigated
• Challenge: Optimal layout and sampling conditions might be different
for mass and PN measurement!
• A compromise could be needed
How to take into consideration other technologies capable of reducing brake wear emissions?
• The test rig approach clearly focuses only on the brake system
• Other technologies (e.g. regenerative braking, v-2-v communication,…)
may have the potential to reduce brake wear PN emissions
• How to assess these technologies?
o The topic has been discussed in the last PMP meeting – Presentation from VDA
o Different options have been identified (modified cycle, modified brake dynos, eco-
innovation like approach, modelling…)
o Further analysis will follow once the common methodology development is
concluded

Particles from tyre and road wear
• In the 47th PMP meeting a session was dedicated to this subject
• No major developments in the field.
• JRC presented the results of a small study investigating the influence
of the treadwear rating on PM/PN emissions
• The development of a standardized methodology to measure the
abrasion rate is currently an option under discussion

SCOPE OF THE EXERCISE
The aim is to explore the relevance of expected tyre
durability expressed as the Treadwear Rating (TWR) for
total tyre wear as well as for PM and PN emissions from
the interaction between the tyre and the road surface.
iii. What is the Treadwear Rating (TWR)?
The Treadwear Rating (TWR) provided by tyre manufacturers on the sidewall of summer tyres is a
marking intended to inform the customer about the expected durability of the tyre (USA – “49 CFR
575.104 - Uniform tyre quality grading standards”)
TWR uses numbers from 100 to about 700. The higher the number, the higher the mileage that the
customer can expect to drive before reaching the minimum allowed tread depth

WRAP-UP
There is no general relation between TWR and measured tread mass loss or PM10,
PM2.5 or PN concentration
Tyres of different brands and same TWR display different wear as well as PM10 and
PM2.5 concentrations, thus not allowing a categorization based on the TWR
Within the subset of two B tyres the one with lower TWR has higher tread mass loss
and PM10 emissions. Further research with more tyres of same brand and different
TWR is required to confirm the feasibility of categorization within the same brand
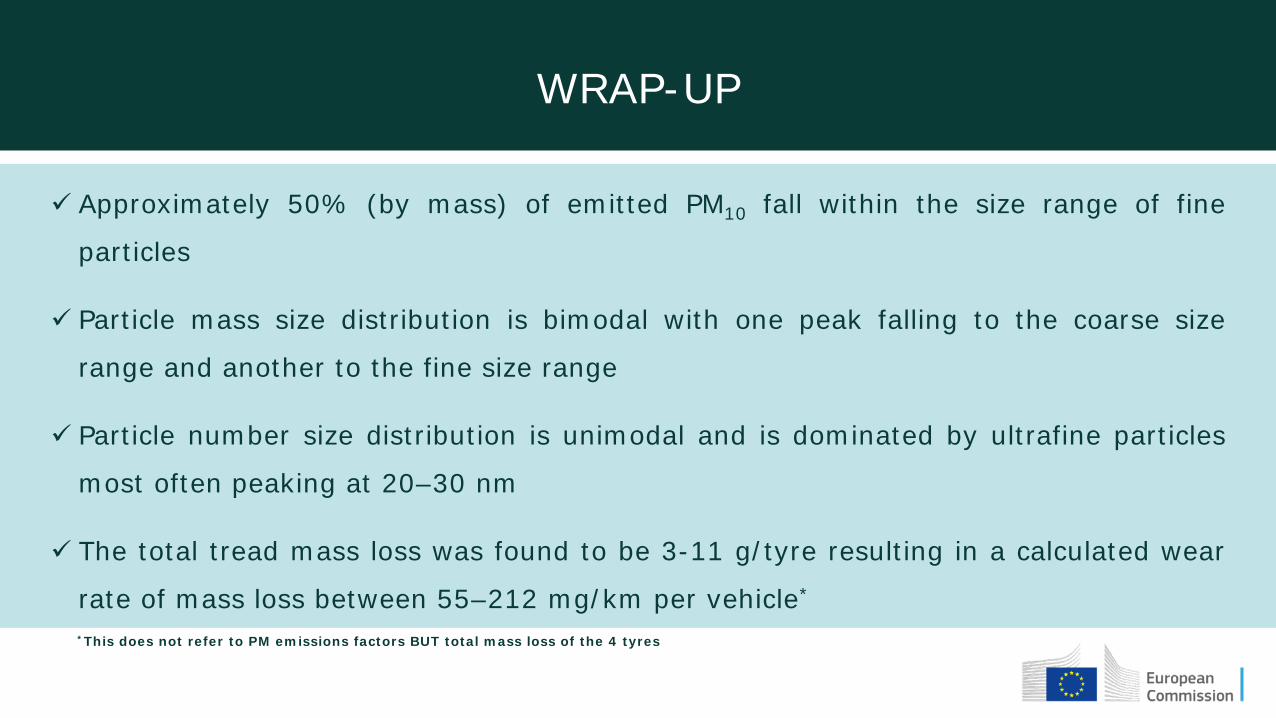
WRAP-UP
Approximately 50% (by mass) of emitted PM10 fall within the size range of fine
particles
Particle mass size distribution is bimodal with one peak falling to the coarse size
range and another to the fine size range
Particle number size distribution is unimodal and is dominated by ultrafine particles
most often peaking at 20–30 nm
The total tread mass loss was found to be 3-11 g/tyre resulting in a calculated wear
rate of mass loss between 55–212 mg/km per vehicle*
*This does not refer to PM emissions factors BUT total mass loss of the 4 tyres
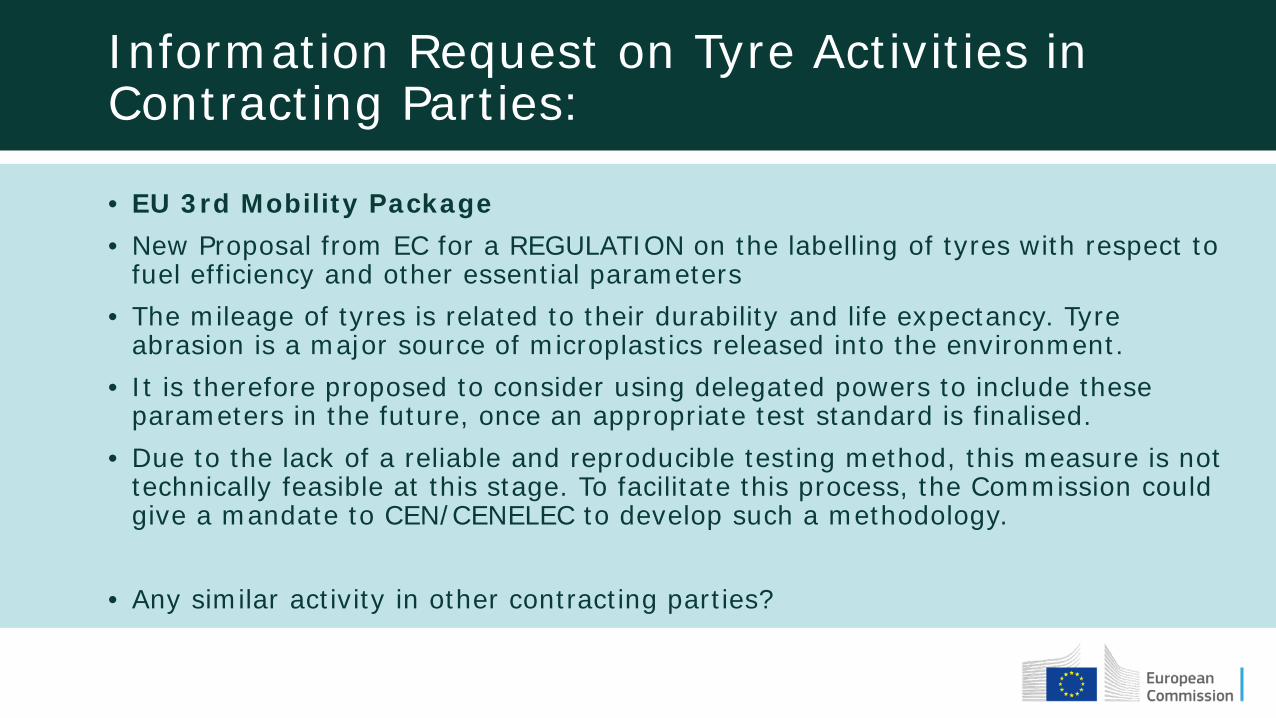
Information Request on Tyre Activities in Contracting Parties:
• EU 3rd Mobility Package• New Proposal from EC for a REGULATION on the labelling of tyres with respect to
fuel efficiency and other essential parameters• The mileage of tyres is related to their durability and life expectancy. Tyre
abrasion is a major source of microplastics released into the environment. • It is therefore proposed to consider using delegated powers to include these
parameters in the future, once an appropriate test standard is finalised.• Due to the lack of a reliable and reproducible testing method, this measure is not
technically feasible at this stage. To facilitate this process, the Commission could give a mandate to CEN/CENELEC to develop such a methodology.
• Any similar activity in other contracting parties?

Any questions?You can find us at
[email protected] - Chairman of UNECE PMP IWG
[email protected] - Technical Secretary of UNECE PMP IWG