7innova lesson 5 slides for t26
TRANSCRIPT
From answers to action
Market survey analysis
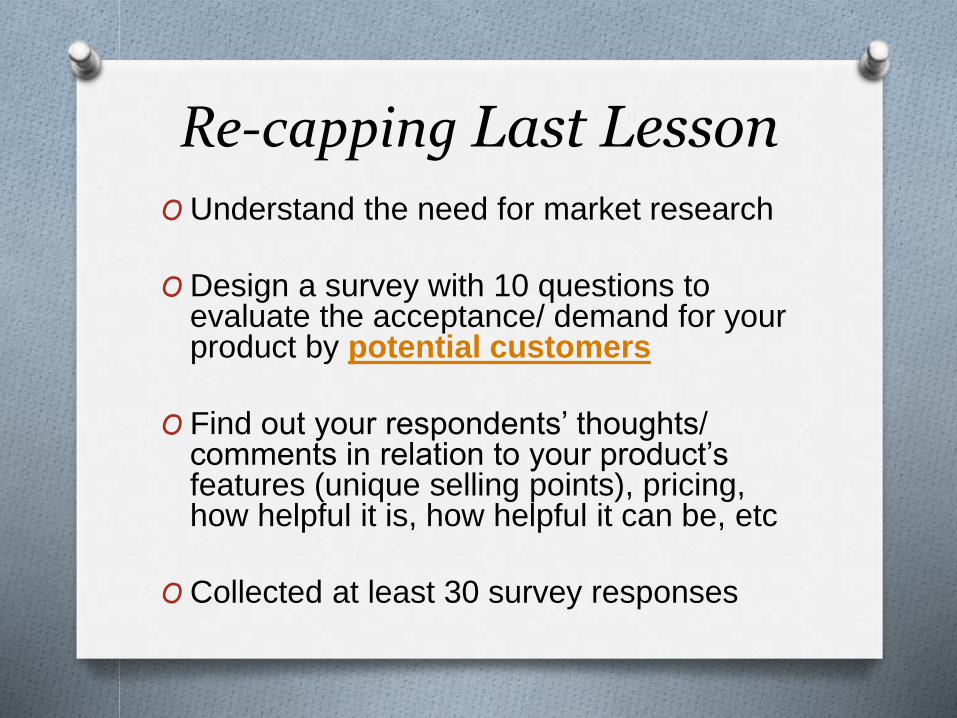
Re-capping Last Lesson
O Understand the need for market research
O Design a survey with 10 questions to evaluate the acceptance/ demand for your product by potential customers
O Find out your respondents’ thoughts/ comments in relation to your product’s features (unique selling points), pricing, how helpful it is, how helpful it can be, etc
O Collected at least 30 survey responses

Today
O Analyze the results of the market survey
done in Lesson 4
O Draw valid conclusions and insights based
on the analysis, and propose
improvement to the product accordingly
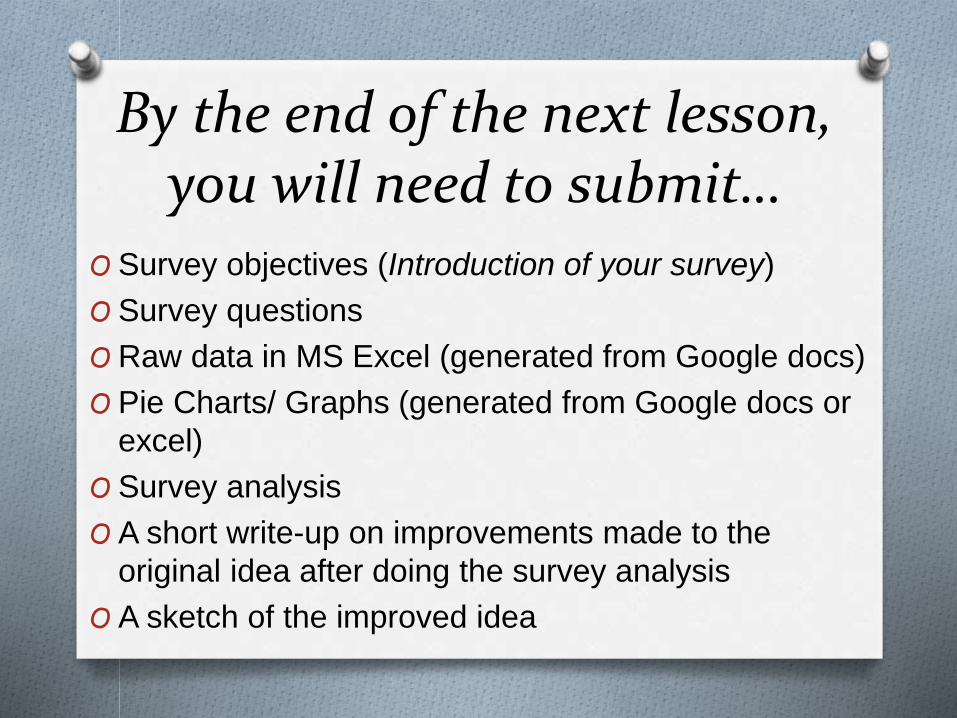
By the end of the next lesson, you will need to submit…
O Survey objectives (Introduction of your survey)
O Survey questions
O Raw data in MS Excel (generated from Google docs)
O Pie Charts/ Graphs (generated from Google docs or
excel)
O Survey analysis
O A short write-up on improvements made to the
original idea after doing the survey analysis
O A sketch of the improved idea

Last lesson ASST 2 – 15%Survey
Grading
Far Exceeds
Expectations
Exceeds
Expectations
Meets
Expectations
Below
Expectations
Far Below
Expectations
Design, Structure & Objectives
of Questions
All or most (>=90%)
questions logically
sequenced and well
designed, with
appropriate choice of
formatting and
grammatically correct.
All or most questions
designed to meet
research objectives.
At least 70% of
questions
logically
sequenced and
well designed,
with appropriate
choice of
formatting and
grammatically
correct. 7-8
questions
purposely
designed.
At least 50% of
the questions
are logically
sequenced and
well designed,
with appropriate
choice of
formatting and
grammatically
correct. 5-6
questions
purposely
designed.
Few questions
(30-40%) are
logically
sequenced and
well designed,
with appropriate
choice of
formatting and
grammatically
correct. Few
questions
purposely
designed.
> 70% illogically
sequenced,
ambiguous, with
frequent
mistakes made
in choice of
formatting and
grammar. Most
questions are off
tangent or not
known.
5 4 3 2
1-2 logically
sequenced,
correctly
formatted and
grammatically
sound questions
= 1 mark; zero
questions = 0
mark

This lesson – ASST 2 cont. Analysis
Grading
Far Exceeds
Expectations
Exceeds
Expectations
Meets
Expectations
Below
Expectations
Far Below
Expectations
Sense-making (*open-ended Qns, only if applicable)
Close-ended Qns:
Strong meaningful
information based on
logical inferences
from data collected.
*Open-ended Qns:
Data is grouped in
meaningful
categories and is
accurate. Very deep
insights into
consumers' wants
and needs analysed
Close-ended Qns:
Good meaningful
information inferred
from data. Can be
more logical/ clearer in
the information
derived. *Open-ended
Qns: Data is grouped
in meaningful
categories and mostly
accurate. Good depth
in understanding
insight into consumers'
needs and wants.
Close-ended
Qns: Sufficiently
described data,
without further
attempt to infer
deeper. *Open-
ended Qns:
Sufficient attempt
to group data in
categories
accurately. No
further inference
done.
Surface data
reported as it is
without further
attempt to
categorise
*open-ended
qns, or infer
deeper for the
close-ended qns.
Noticeable
omissions and/or
inaccuracies in
data (< 50%).
Data described
without further
attempt to
categorise *open-
ended Qns, or infer
deeper from the
close-ended Qns.
Huge omissions
and/ or inaccuracies
in data (> 50%) = 1
mark; No attempt to
analyse or report
results = 0 mark
5 4 3 2 0 - 1
Recommendations of feedback (for or against customer feedback analysis)
All changes
recommended are
very strongly linked
to consumer needs
and preferences,
based on analysis of
survey results
Changes
recommended show
strong link (>75%) to
consumer needs and
preferences.
Changes
recommended
show sufficient
(>50%) link to
consumer needs
and preferences.
Changes
recommended
show little
(>25%) link.
Changes
recommended do
not meet consumer
needs and
preferences = 1;
Failure to link any
ideas for product
design = 0
5 4 3 2 0 - 1

Learning Objectives
OOrganise and compile survey findings
for market analysis.
ODraw sound and valid conclusions and
insights from compiled survey findings
OPropose improvements to product(s)
based on survey analysis
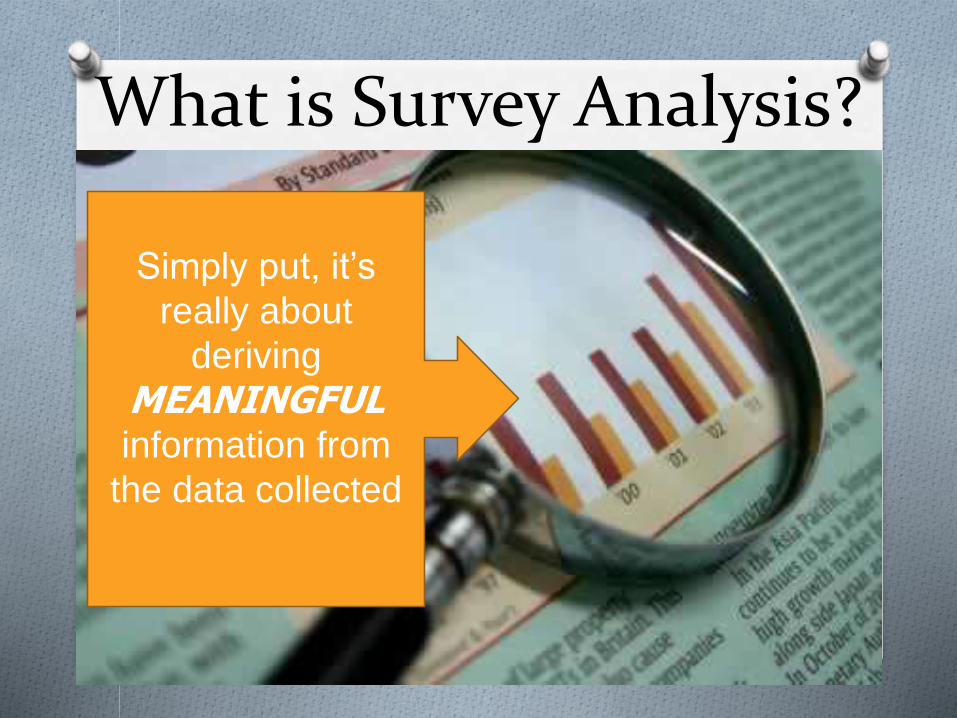
What is Survey Analysis?
8
Simply put, it’s
really about
deriving
MEANINGFULinformation from
the data collected

What to analyse for, depends on what you want to search for…
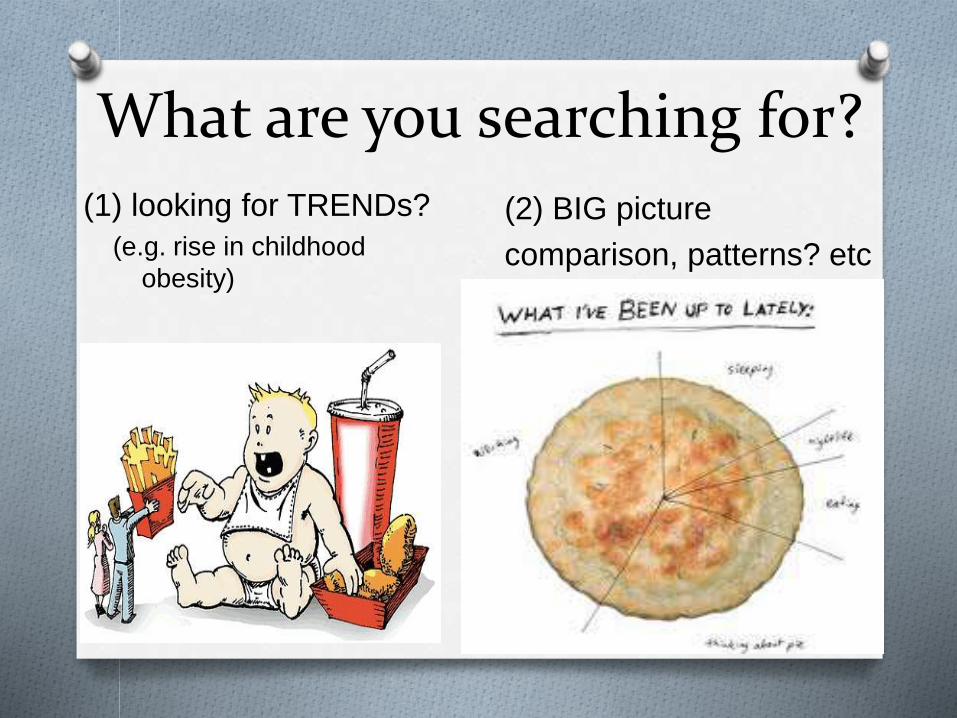
What are you searching for?(1) looking for TRENDs?
(e.g. rise in childhood
obesity)
(2) BIG picture
comparison, patterns? etc
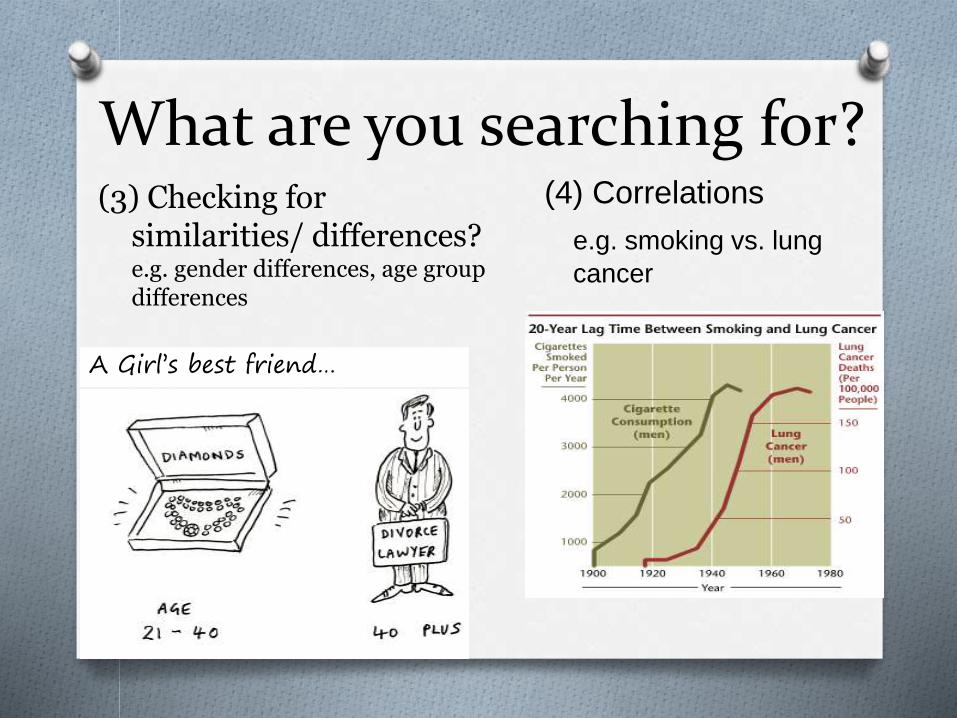
What are you searching for?(4) Correlations
e.g. smoking vs. lung
cancer
(3) Checking for similarities/ differences? e.g. gender differences, age group differences
A Girl’s best friend…

Consider this example…
You are conducting a market research to investigate the
receptiveness of a newly launched air freshner
100 respondents:
60 female, 40 male
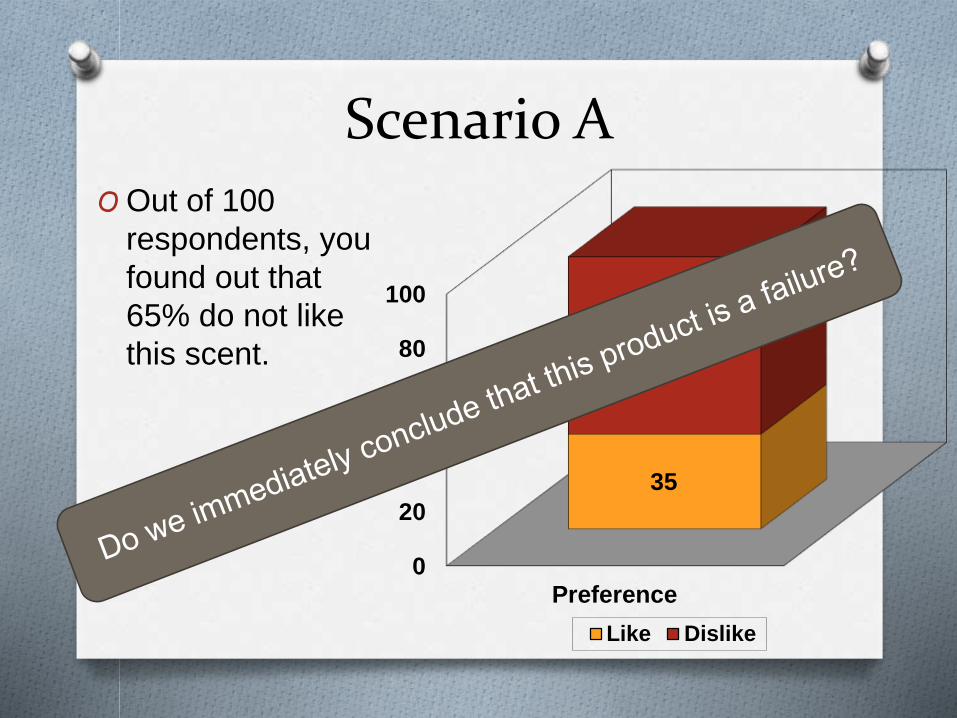
Scenario AO Out of 100
respondents, you
found out that
65% do not like
this scent.
0
20
40
60
80
100
Preference
35
65
Like Dislike

Let’s take a look at
another scenario
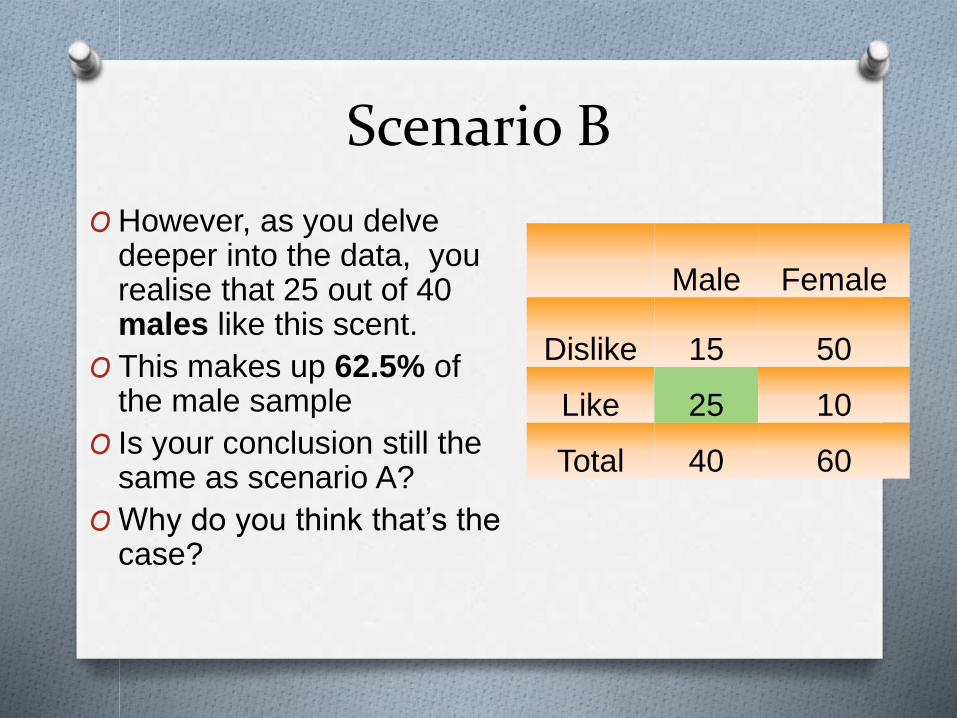
Scenario B
O However, as you delve deeper into the data, you realise that 25 out of 40 males like this scent.
O This makes up 62.5% of the male sample
O Is your conclusion still the same as scenario A?
O Why do you think that’s the case?
Male Female
Dislike 15 50
Like 25 10
Total 40 60

Let’s consider
a 3rd scenario
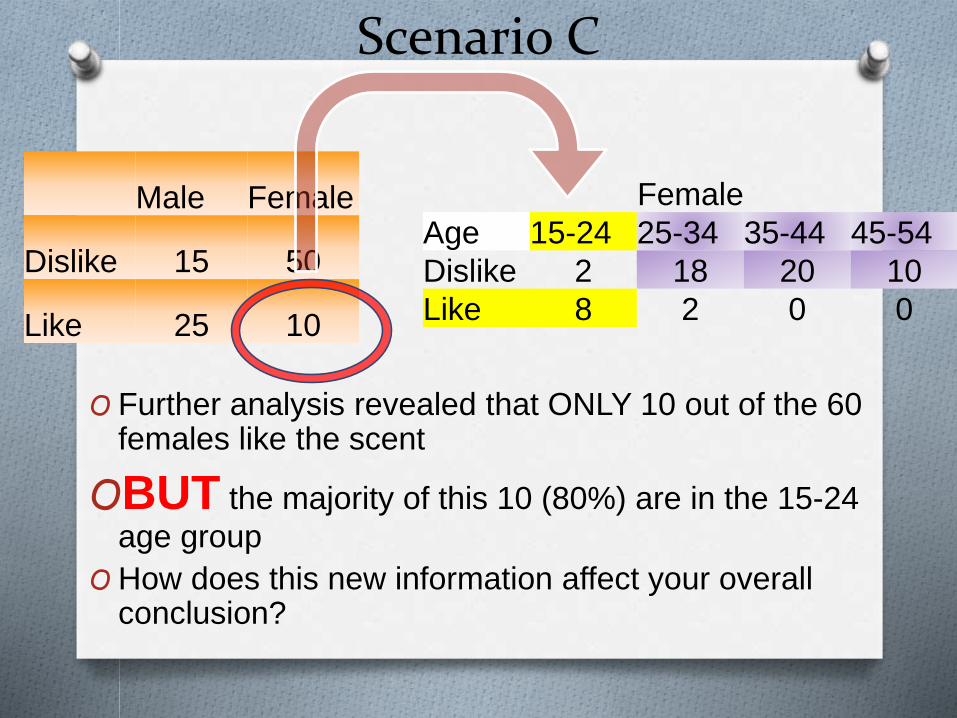
Scenario C
O Further analysis revealed that ONLY 10 out of the 60 females like the scent
OBUT the majority of this 10 (80%) are in the 15-24
age group
O How does this new information affect your overall conclusion?
Male Female
Dislike 15 50
Like 25 10
Female
Age 15-24 25-34 35-44 45-54
Dislike 2 18 20 10
Like 8 2 0 0
Mis/ Representation
O Is your analysis a fair and accurate
representation of the data?
OAll data and findings from scenarios A to C
are correct.
O But deeper analyses in scenarios B and C
surfaced a more accurate and fair
representation of the market research which
allowed for a more holistic conclusions
O Hence, we need to look deeper within the data
to surface interesting findings
Group Activity:Analysis Practice
O Visit MeL and download a sample raw data file titled “Lesson 5 Fanbrella Survey (Responses).xls”
O Analyse the data and come up with as much useful information as possible
O Determine if there could have been some other data collected which would have been more pertinent to your analysis
Note: This survey was done by a previous group of 7INNOVA students
and scored an A grade

Notes on Filtering DataO You will find that the data is already auto-filtered, meaning
to say, there are drop down menus for all the columns.
O To filter filter the data by age, click on drop-down menu for
Age and select either 15-20, 21-30, 41-50 or >51.
O To further filter the data e.g. by gender, click on drop down
menu for Gender and select either Female or Male.
O Using the above example for instance, after you filter first
by Gender, then by Age, you will find that there are 7
respondents who are above 40 and the majority of them
are females.

21

To clear all data filter to show all, click Data FilterClear
22

1. Are there questions that can answer the basic
question?
O e.g. What is the age of the majority of the respondents?
2. Go into specifics: Who are these people that say
that they never use an umbrella?
O i.e. What are their main reasons?
3. Try to go deeper:
O Of those who do carry umbrellas, what is their most
preferred method of carrying it? Is there a gender-
specific preference for any method?


Let’s take a look at some possible scenarios that can be inferred from the
sample data:
O24 of the 31 respondents (about 77%) who have never used an umbrella in a week would also not use “Fanbrella”.
OTheir reason being, both these products are troublesome and a burden to carry about.
OMost who carry umbrellas choose to carry it in a bag – a feature that needs to be incorporated into any improvements that is made.
OThose who carry it in their hands are predominantly males (7 out of 9 or about 78%)

IMPROVEMENT IDEA
Open-ended questions
O Open-ended questions such as “if willing, why?” can be
sorted into categories, e.g. time-saving.
O (As this is an open-ended question, it can’t be done by
filtering. Students need to categorize the answers
themselves.)
O Remember to clear the filter and show all data before
doing a new set of filtering.
O To clear all data filter to show all, click Data
FilterClear

Analysing Your Data
Using what you’ve learnt in class, analyse your
own survey data.
Use your analysis to see:
• How you can make your product more appealing to your target consumer group
• What improvements should/ can be made to your product.

Findings & AnalysisO Submit your survey
questions, tabulated findings/
implications, suggestions for
changes to product design in
either PowerPoint slides or as
a Word document.
(All raw data should also
be submitted to your tutor.)
29
Assessment 2: (15%)
Osurvey objectives and questions (from Google)
Oraw data (from Google)
O tabulated findings and graphs (from Google)
Osurvey findings and implications
Osuggestions for improvement
O final sketch
Due Date: Friday 28th November 5pm to my pigeon hole 30
Submit your print out with the following info :
7INNOVA

Magnetic Earrings
31
Suggested Unique Selling Points
O assemble and reconfigure the design of
earrings by yourself to suit your
reference, outfits and moods
O The metal dots are light enough that they
generally won’t come loose and fall off in
everyday wear
Taken from http://bit.ly/ADnMI0
Product 2 pierced earrings that are
made of silver with a magnet on
the base.
There are also 12 coloured
metal dots
Cost Price = S$55

Glo Pillow
32
Unique Selling Points
O 40 minutes before the pre-set alarm time the pillow begins to glow and gently brings the user out of sleep.
O This natural waking process helps to set the circadian rhythm or "body clock" and results in more healthy sleep/wake patterns.
Product The Glo pillow is an alternative to the
traditional alarm clock. The pillow uses an LED
fabric substrate below the surface to wake the
user using light. This substrate also functions
as an optional display, showing the time on the
pillows surface using the grid of LEDs below.
Cost Price = S$45
Taken from http://bit.ly/pEpkOR

BreadWrite
33
Suggested Unique Selling Points
O The message gets “toasted” into the
toast itself and gives new meaning to
“read while you eat”.
O Add personalised messages,
reminders etc. to your toast.
Product This toaster incorporates a little message
board where one can write quick notes.
Cost Price: S$128
Taken from http://bit.ly/19Ugou

Cool Ice Straw Tray
34
Suggested Unique Selling Points
O Simple to use - fill, freeze, serve
O 3-in-1: Straw, Stirrer and Ice
O Impress your guest, straws add zing to any
occasion such as birthday parties, gatherings
or kids' parties
O Re-usable!
Taken from http://bit.ly/ocz119
Product The Ice Straw Tray comes with four reusable
straws that can be frozen in water, juice, or
cola. After the ice melts, the straws become
exposed.
Cost Price = S$4
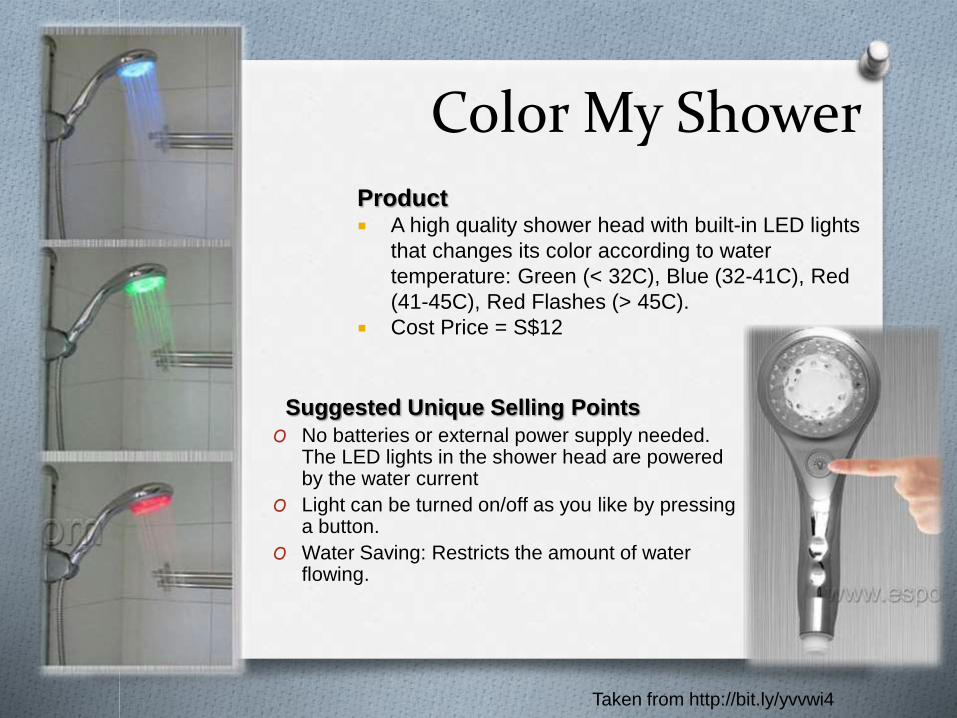
Color My Shower
35
Suggested Unique Selling Points
O No batteries or external power supply needed. The LED lights in the shower head are powered by the water current
O Light can be turned on/off as you like by pressing a button.
O Water Saving: Restricts the amount of water flowing.
Taken from http://bit.ly/yvvwi4
Product A high quality shower head with built-in LED lights
that changes its color according to water
temperature: Green (< 32C), Blue (32-41C), Red
(41-45C), Red Flashes (> 45C).
Cost Price = S$12

Virtual Keyboard
36
Suggested Unique Selling Points
O Small cube projector slight bigger than the size of a lighter.
O Smoothly connects to your mobile devices (tablet pcs, notebooks, smartphones etc.) and desktop pc.
O Full-size keyboard and producing real tapping sounds.
Taken from http://bit.ly/mP4MMy
Product A light projected keyboard based on
an optical recognition mechanism
technology that enable the user to tap
on the projected key images.
Cost Price = S$110