8 d etailed assessment of selected an minimum allowance of half the significant wave height...
TRANSCRIPT

DETAILED ASSESSMENT OF SELECTED MANAGEMENT OPTIONS 8-1
H:\N0683 SWANSEA CHANNEL & SWANBAY INVESTIGATION\DOCS\FINALDRAFTPDFS\R.N0683.001.03.DRAFT_INCLUDINGFIGURES.DOC 8/10/03 11:10
8 DETAILED ASSESSMENT OF SELECTED MANAGEMENT OPTIONS
8.1 Consideration of Social and Environmental Management Issues
8.1.1 Navigation
There are a number of issues that have been considered when assessing the different management options for Swansea Channel and Swan Bay. One of the most important issues is safe navigation through Swansea Channel.
A good guide for determining appropriate navigation depths can be obtained from Australian Standard 3962 “Guidelines for design of marinas” (2001). These standards suggest the following:
• Navigation depth should be referenced to ISLW (in the study area, this would be around –0.2 m AHD at the most downstream extent of the study area);
• An allowance for the maximum expected draft vessel. Advice provided by the Waterways Authority has indicated that the maximum vessel draft within Lake Macquarie is 2.4m;
• An minimum allowance of half the significant wave height (including boat wake) should be provided (assuming a boat wake value of up to 0.5 m, an allowance of 0.25 m should be more than adequate);
• A minimum under keel clearance of 300 mm; and
• An allowance for siltation within an appropriate timeframe. For the study area, it was estimated that this allowance could be up to 700 mm.
Based on the above, it has been assessed that a suitable channel bed level depth for navigation purposes would be within the range –3.5 to –4.0 m AHD.
Whilst the above considerations were based on a vessel draft of 2.4 m, it will be necessary for a more detailed economic assessment to be carried out to determine relative cost-benefits of various channel dredge depths. Of importance within the economic assessment will be the consideration of increased tourism and visitation by larger vessels when the channel is dredged to deeper depths.
With regard to navigation into and out of Swan Bay, it has been assumed that navigation via the northern entrance of Swan Bay would be satisfactory. As stated in Section 1.4, Belmont Sands Pty Ltd has stopped dredging within Swan Bay without completing the proposed dredging in the northern entrance. Therefore, any long term dredging works would need to be preceded or accompanied by the finalisation of dredging in the northern entrance of Swan Bay to previous design conditions.
8.1.2 Ecological Considerations
Ecological considerations also need to be addressed when considering management options. There are two different species of seagrass present within the study area. These are Strap-weed Posidonia australis and Eelgrass Zostera capricorni. The overall health of these seagrasses can be affected by the erosion and accretion of sediment, and poor flushing.

DETAILED ASSESSMENT OF SELECTED MANAGEMENT OPTIONS 8-2
H:\N0683 SWANSEA CHANNEL & SWANBAY INVESTIGATION\DOCS\FINALDRAFTPDFS\R.N0683.001.03.DRAFT_INCLUDINGFIGURES.DOC 8/10/03 11:10
Additionally, some species of migratory fauna are likely to utilise habitats within the area, (the sand islands in particular) are protected under internationally agreements (i.e. CAMBA and/or JAMBA).
8.1.3 Channel Stability, Erosion and Geomorphology
Erosion is particularly important in some sections of the study area. Firstly, evidence indicates that the eastern foreshore of Swan Bay is affected by wind waves. Some of the options being modelled include either full or partial closure of the southern entrance to Swan Bay. These would effectively reduce the fetch length for waves impacting along the eastern foreshore of Swan Bay from a south-easterly direction.
Other areas of significant bank erosion within the study area include Coon Island, Naru Point and the western foreshore of the Spoil Island.
Channel migration is significantly related to the issues of bed erosion and accretion. It is difficult to make predictions regarding future behaviour of the channel, due to the uncertainties associated with the quantity of sediment that is currently entering the system from downstream of Swansea Bridge. The presence of a ‘slug’ of sand similar to that identified as moving northwards through the study area during the 1990’s would have a significant impact on channel stability and may result in an increased need for maintenance dredging, if safe navigation is to be maintained.
8.2 Technical Assessment of Management Options
8.2.1 Details of Assessment Methodology
8.2.1.1 Introduction
A qualitative assessment of the “do nothing” approach was undertaken during stage 1 of this study to assist in the development of suitable management options. Readers are referred to Section 5.3 for details of this assessment.
In order to provide an assessment of the various management options relative to a baseline scenario, it has been necessary to assess the “do nothing” approach along with each of the management options being considered.
Each of the options were compared against the baseline scenario and against each other by assessing:
• Hydraulics;
• Tidal Flushing;
• Sediment transport patterns;
• Infill rates of dredge holes; and
• Interaction with the social and environmental management considerations summarised in Section 8.1.
The methodology for assessing these quantities is described in the following sections.

DETAILED ASSESSMENT OF SELECTED MANAGEMENT OPTIONS 8-3
H:\N0683 SWANSEA CHANNEL & SWANBAY INVESTIGATION\DOCS\FINALDRAFTPDFS\R.N0683.001.03.DRAFT_INCLUDINGFIGURES.DOC 8/10/03 11:10
8.2.1.2 Hydraulics
The hydraulic differences between the various options were determined by analysing the tidal prism and tidal range. A mean spring tide scenario was modelled for the base scenario and all management options. Generally, the results showed only small differences between all management options and the base scenario. Due to the relatively small differences it can be concluded that differences for a mean neap tide scenario would also be minimal.
For each of the options the simulated levels of Mean High Water Spring (MHWS) and the Mean Low Water Spring (MLWS) were extracted from the model. Significant water surface gradients do not occur in the lake, and as such a single value was used to represent the high and low tide levels in the main body of the lake. From these results the tidal range and the tidal prism were also calculated. Reported tidal ranges are simply the differences between MHWS and MLWS levels for each option. The tidal prism for each option has been calculated as the product of the tidal range and the surface area of Lake Macquarie.
8.2.1.3 E-folding Time
The e-folding time is an estimation of the time required for the concentration of a conservative (non-decaying) water quality constituent at a given point in the lake to reduce from an initial value of 1.0 to a value of 1/e or 0.37. In the context of this report, the e-folding time is related purely to the action of the tides. This parameter can therefore be used as an indication of tidal flushing efficiency.
Care needs to be taken when interpreting this parameter in terms of water quality improvements as it neglects the effects of wind driven currents and catchment inflows on water quality. For example, the results show that the southern parts of the lake have the largest e-folding times (generally greater than 365 days to the south of Pulbah Island), although it is commonly understood that water quality in the northern parts of the lake is worse than in the southern parts due to other factors, such as catchment inputs and contaminated sediments (WBM, 1997).
For the purpose of consistency, a mean spring tide has been used to calculate the e-folding time.
To emphasise the distinction between the values calculated and the actual times required to reduce the concentrations of pollutants for the various locations in the lake (considering all relevant processes and inputs), this report refers to the calculated flushing as ‘e-folding times’.
E-folding times were predicted at a number of the location around Lake Macquarie and within Swan Bay (see Figure 8-1).
Generally, the study found that e-folding times for the majority of the lake were very long (typically greater than 200 days) and any feasible changes to the navigation channel would not result in significant changes to these e-folding times.

DETAILED ASSESSMENT OF SELECTED MANAGEMENT OPTIONS 8-4
H:\N0683 SWANSEA CHANNEL & SWANBAY INVESTIGATION\DOCS\FINALDRAFTPDFS\R.N0683.001.03.DRAFT_INCLUDINGFIGURES.DOC 8/10/03 11:10
Figure 8-1 Location of E-folding Time Simulations
8.2.1.4 Erosion/Accretion Patterns
The erosion/accretion patterns predicted by the model are presented for each of the options and the ‘do nothing’ base scenario. These patterns have been derived using the predicted change in the bed levels over a single tidal cycle and then repeating this over a full year. The erosion/accretion patterns for each of the relevant options are presented in Appendix G, the blue areas represent erosion while red areas represent accretion. These patterns must be considered with caution and readers are referred to Section 5.3.2 for a discussion on the general applicability of the sediment transport model.

DETAILED ASSESSMENT OF SELECTED MANAGEMENT OPTIONS 8-5
H:\N0683 SWANSEA CHANNEL & SWANBAY INVESTIGATION\DOCS\FINALDRAFTPDFS\R.N0683.001.03.DRAFT_INCLUDINGFIGURES.DOC 8/10/03 11:10
8.2.1.5 Infill Rates
In order to calculate the amount of sediment that would accrete within the dredged channels, control lines were established around the dredged areas and the net volume of sediment moving into the dredged area was calculated. Using this methodology, it was determined that dredged holes, particularly those with smaller depths, showed a tendency to erode. This is commensurate with conclusions of the Lake Macquarie Estuary Management Study (WBM, 1997A) which indicated that the size of Swansea Channel was out of regime compared to its tidal flows, and was still adjusting in response to the training of the entrance over a century ago. Nevertheless, this does not mean that the need for maintenance dredging would be eliminated by these management options. Material eroded from the dredge profile would tend to be transported upstream, resulting in a dynamic system of shoals comprising the eroded material and any other material that moves into the study area (eg. from downstream source). Maintenance dredging would still be required if navigation was to be maintained.
8.2.2 Base Scenario
8.2.2.1 Hydraulics
For the base scenario, the mean spring tidal range in the lake was 0.105, with MHWS = 0.137 m AHD, MLWS = 0.032 m AHD and a Mean Lake Level of 0.085 m AHD. The mean spring tidal prism for the base scenario is 11.06 x 10⁶ m3.
8.2.2.2 Erosion/Accretion Patterns
The erosion and accretion patterns for the base scenario is shown in Figure G1, Appendix G. This figure shows a number of areas that have previously been identified within this report as areas of potential erosion and accretion.
The erosion/accretion patterns for the base scenario show erosion occurring along the north of Coon Island, Naru Point, midway along the western edge of the spoil island and in areas adjacent to the Pelican Flat shoreline.
The figure also shows significant erosion of the Airforce channel and in the northern entrance to Swan Bay. Notably, the figure also shows accretion at the extents of the dropover, which is consistent with the ultimate transport of material up the channel and deposition in the deeper waters of the lake. Importantly for this study, there is a significant amount of deposition in the southern entrance of Swan Bay and in areas immediately to the west.
Overall, the patterns indicate a fairly unstable state with the potential for the unpredictable migration and growth of shoals over the short term.
Based on the current analysis, it is expected that sedimentation would continue to affect navigation within the channel. Eventually, it is likely that the channel will select a preferred predominant pathway to the lake. However, the time frame over which this will occur is uncertain as it is likely to be dependant on the cessation of sediment transport from Salts Bay and the adjustment of the channel cross-section to increased tidal flows resulting from entrance training works. Until that time, a braided system of channels is likely to exist and ongoing sediment infeed will continue to block the

DETAILED ASSESSMENT OF SELECTED MANAGEMENT OPTIONS 8-6
H:\N0683 SWANSEA CHANNEL & SWANBAY INVESTIGATION\DOCS\FINALDRAFTPDFS\R.N0683.001.03.DRAFT_INCLUDINGFIGURES.DOC 8/10/03 11:10
dominant channel, forcing selection of alternative channels. This process is likely to be repeated each time a sand slug moves through the study area. At present, the main channel is being progressively blocked by sedimentation, and the southern entrance to Swan Bay appears to be modifying the patterns of sediment transport. It is likely, within the foreseeable future, that channels to the west of the delta, such as Airforce channel or to the north of Coon Island, would take more of the flow, naturally deepening as the flows increase.
8.2.2.3 E-folding Time
The e-folding times for the base scenario are shown in Table 8-1 below. Warners Bay and Pulbah Island show approximately 40 days difference in the e-folding time. The difference between the north and south of the lake is consistent with previous studies of Lake Macquarie.
The e-folding time varies in Swan Bay. There is a difference of approximately 60 days between the north and south of Swan Bay. The e-folding times within the south of Swan Bay are influenced by open conditions at the southern entrance.
Table 8-1 E-folding Times in Lake Macquarie and Swan Bay
Location E-folding Time (Days)
Warners Bay 320
Toronto 270
Pulbah Island 364
North of Swan Bay 77
South of Swan Bay 19
8.2.2.4 Interaction with social, recreational and ecological considerations
From the modelling results, particularly the sediment transport patterns, it can be seen if the do nothing approach is taken, navigation through the channel will continue to be a problem. As a minimum it is expected that regular and significant maintenance dredging of the channel would be required. Maintenance dredging tends to work directly against naturally occurring processes in the channel and may retard the channel’s ability to adjust to a long term stable configuration.
Short term impacts on ecology would include the further loss of vegetation from the immediate vicinity of Naru Point and from the western edge of the main spoil island in Swan Bay. An increase in flows around the northern point of Coon Island is likely to result in the loss of vegetation from this foreshore and similarly from the northern and eastern foreshore of Pelican Island. It has been noted that Pelican Island may contain significantly important habitats for threatened avifauna.

DETAILED ASSESSMENT OF SELECTED MANAGEMENT OPTIONS 8-7
H:\N0683 SWANSEA CHANNEL & SWANBAY INVESTIGATION\DOCS\FINALDRAFTPDFS\R.N0683.001.03.DRAFT_INCLUDINGFIGURES.DOC 8/10/03 11:10
8.2.3 Option 1
8.2.3.1 Overview of Option
Option 1 involves broad scale dredging within the main navigation channel, between Naru Point and the drop-over. A series of dredging scenarios were considered with dredge depths ranging from 3 m to 4.5 m, and dredge channel widths of either 60 m or 120 m.
8.2.3.2 Hydraulics
Hydraulic parameters for the range of simulations comprising Option 1 are shown in Table 8-2. The base scenario values are also provided for comparison.
Table 8-2 Option 1: Spring Tidal Range, Prism and Mean Lake Level
Spring Tidal Range (m)
Spring Tidal Prism
(x 106 m3)
Mean Lake Level (m) AHD
Base Scenario 0.105 11.06 0.085
Option 1 (3 m deep, 60 m wide) 0.106 11.11 0.083
Option 1 (3.5 m deep, 60 m wide) 0.107 11.27 0.082
Option 1 (4 m deep, 60 m wide) 0.109 11.42 0.080
Option 1 (4.5 m deep, 60 m wide) 0.110 11.53 0.079
Option 1 (3 m deep, 120 m wide) 0.107 11.21 0.082
Option 1 (3.5 m deep, 120 m wide) 0.110 11.53 0.079
Option 1 (4 m deep, 120 m wide) 0.112 11.80 0.078
Option 1 (4.5 m deep, 120 m wide) 0.113 11.90 0.077
The results show an increase in the tidal range and prism as the volume of dredging increased. The maximum tidal range for Option 1 is 0.113, which was predicted for the option with the maximum dredging (4.5 m deep and 120 m wide). In comparison to the base scenario, this represents an 8% increase in the tidal prism.
Generally, changes to lake hydraulics are considered to be small. The changes would represent a very minor benefit to tidal exchange and water quality.
8.2.3.3 E-folding Time
The results show a decrease in the e-folding times in the lake in comparison with the base scenario, which is consistent with the increase in flow entering the lake. The reductions in e-folding times tend

DETAILED ASSESSMENT OF SELECTED MANAGEMENT OPTIONS 8-8
H:\N0683 SWANSEA CHANNEL & SWANBAY INVESTIGATION\DOCS\FINALDRAFTPDFS\R.N0683.001.03.DRAFT_INCLUDINGFIGURES.DOC 8/10/03 11:10
to be larger for the options with the greater amount of dredging. The reduction in e-folding times (for a representative dredging scenario of –4m AHD and 120 m wide when compared to the base scenario) is largest in the northern extremes of Lake Macquarie at Warners Bay (233 days compared to a base scenario time of 320) and Toronto (182 days compared to 270). The southern part of Lake Macquarie represented by Pulbah Island shows a smaller reduction in the e-folding time (328 days compared to 364).
The e-folding times within Swan Bay decrease in the northern part of Swan Bay (42 days compared to 77) but in the southern part there is an increase in e-folding times (27 days compared to 19). This is due to a reduction in the flow of water through the southern entrance to Swan Bay caused by redirection of the of flow along the main navigation channel and away from the southern entrance. The decrease shown by the northern parts of Swan Bay result from the increase in flow along the main channel during the flood tide which is then carried back into the northern entrance to Swan Bay during the subsequent ebb tide.
The e-folding times resulting from the management options analysed all indicate that regardless of the management strategy adopted, e-folding times are still very large in the main body of the lake. Accordingly, dredging is not considered to be an effective solution to water quality problems within the lake.
8.2.3.4 Erosion/Accretion Patterns
The erosion/accretion patterns for Option 1 are shown in Appendix G, Figure G2 to G5. For each of the runs the figures show that erosion is occurring within the centre of the dredge hole as the channel tends towards a shape which is more in equilibrium with the tidal regime.
The patterns for the dredge holes with a dredged width of 60 m tend towards quite patchy accretion/erosion patterns, similar in some regards to the base scenario but showing some improvement, in that this option results in a better defined channel. The 120 m wide scenarios demonstrate that the channel tends to maintain a larger navigable width (generally at least 90 m) which is beneficial for navigation. The 60 m wide scenarios tend to show localised areas of infill that encroach into the dredged channel. A clear width of around 60 m would be required for navigation purposes.
Notably, all patterns show an interruption to the scouring potential of the channel adjacent to the southern entrance of Swan Bay. This is indicative of the processes that have caused deposition of sand in this area in recent years. If the southern entrance remains open, it is apparent that the need for ongoing maintenance dredging in this area would still remain.
The model results indicate that erosion which is currently occurring at Naru Point and adjacent to the western edge of the Spoil Island would no longer be a problem.
It should also be noted that, as the amount of dredging increases, the extent of erosion adjacent to the northern edge of Coon Island and through the Airforce channel is considerably reduced. This occurs because the flow tends to favour a path past Marks Point, thus reducing scour in the area between Elizabeth and Coon Islands.

DETAILED ASSESSMENT OF SELECTED MANAGEMENT OPTIONS 8-9
H:\N0683 SWANSEA CHANNEL & SWANBAY INVESTIGATION\DOCS\FINALDRAFTPDFS\R.N0683.001.03.DRAFT_INCLUDINGFIGURES.DOC 8/10/03 11:10
The modelling also indicates that the 120 m wide dredging options tend to encourage some erosion adjacent to the north eastern foreshore of Elizabeth Island.
8.2.3.5 Other Issues
Overall, widths of 120 m appear to be more beneficial in terms of the reduction of erosion at locations such as the Spoil Island, Coon Island and Naru Point. A reduction in erosion at these locations is beneficial in ecological terms as the loss of potentially valuable habitat areas is reduced.
The 120 m options also tend towards maintaining a more stable navigable width, with the deeper options (-4.0 and –4.5 m AHD) being more stable in the vicinity of the open southern entrance to Swan Bay. As described in Section 8.1.1, a bed level of –3.5 m AHD or below would be suitable for navigation purposes.
In order to determine the optimum dredging configuration in terms of cost effectiveness and overall benefit further investigation would be required to refine the dredge widths and depths. The results of modelling indicate that the optimum configuration is likely to be between 60 and 120 m wide. In addition, various orientations of the dredged channel should be considered to minimise the risk of erosion, such as that predicted adjacent to Elizabeth Island for the 120 m wide options.
On balance, the most appropriate dredging profile modelled would seem to be the –4.0 m AHD, 120 m wide dredging scenario. For Options 3, 4 and 5, which include dredging along with other works, this configuration of dredging has been adopted to enable direct comparison of results to Option 1.
8.2.4 Option 2
8.2.4.1 Overview of Option
Option 2 involves the dredging of a navigation channel through the existing Airforce Channel. A breakwater was included across the existing northern channel to redirect flows westwards, while a small gap in the breakwater was incorporated to allow for flushing through Swan Bay. Once again, dredging depths of 3 to 4.5 m were assessed, while gaps of 20, 40 and 100 m were considered.
8.2.4.2 Hydraulics
The hydraulic results for scenarios that were analysed within Option 2 are shown in Table 8-3. This table presents spring tidal range, tidal prism and mean lake level for each scenario modelled.
Four sub options adopted a 20 m wide gap with varied dredge depths. These showed a general increase in tidal range and prism with dredge depth. Notably, tidal range and prism is less than the base scenario for options with dredge levels of -3.0 m and -3.5 m AHD.
Scenarios were also modelled to investigate the impacts of gap width on lake hydraulics. The modelled scenarios considered gaps of 20, 40 and 100 m with a dredge level of –4.0 m AHD. Results indicate that the larger gap sizes (40 and 100 m) produced a slight increase in tidal range and prism within the lake.
DETAILED ASSESSMENT OF SELECTED MANAGEMENT OPTIONS 8-10
H:\N0683 SWANSEA CHANNEL & SWANBAY INVESTIGATION\DOCS\FINALDRAFTPDFS\R.N0683.001.03.DRAFT_INCLUDINGFIGURES.DOC 8/10/03 11:10
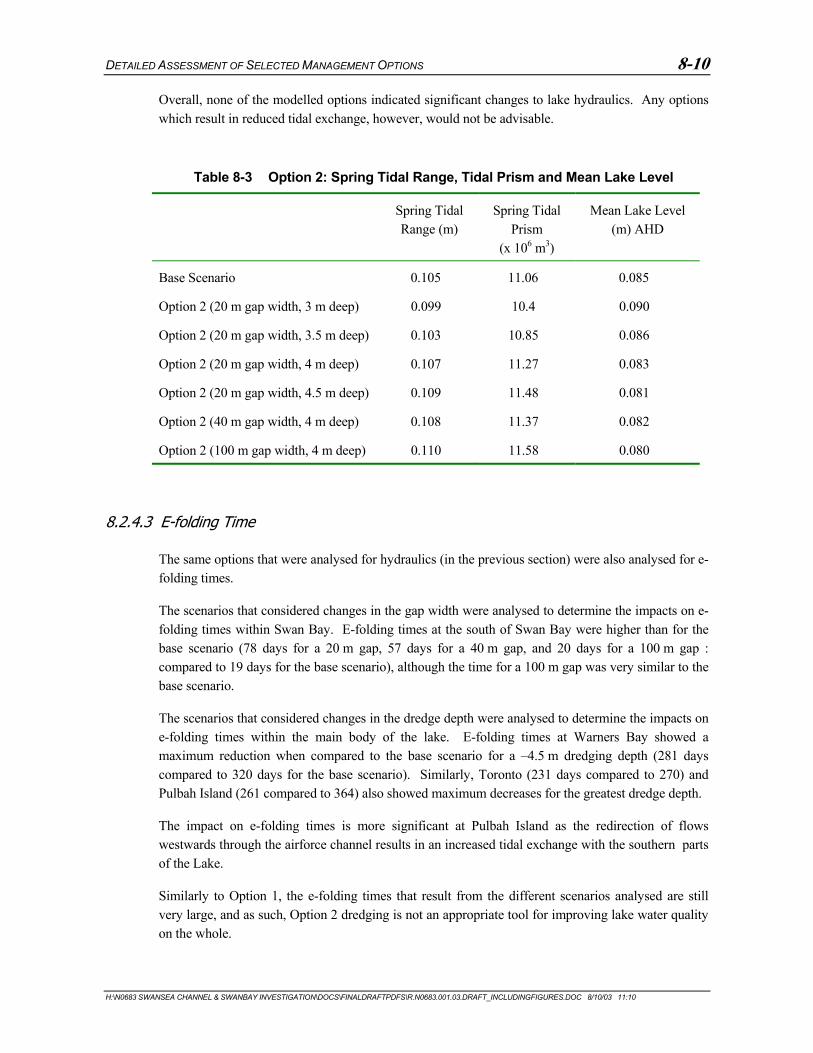
Overall, none of the modelled options indicated significant changes to lake hydraulics. Any options which result in reduced tidal exchange, however, would not be advisable.
Table 8-3 Option 2: Spring Tidal Range, Tidal Prism and Mean Lake Level
Spring Tidal Range (m)
Spring Tidal Prism
(x 106 m3)
Mean Lake Level (m) AHD
Base Scenario 0.105 11.06 0.085
Option 2 (20 m gap width, 3 m deep) 0.099 10.4 0.090
Option 2 (20 m gap width, 3.5 m deep) 0.103 10.85 0.086
Option 2 (20 m gap width, 4 m deep) 0.107 11.27 0.083
Option 2 (20 m gap width, 4.5 m deep) 0.109 11.48 0.081
Option 2 (40 m gap width, 4 m deep) 0.108 11.37 0.082
Option 2 (100 m gap width, 4 m deep) 0.110 11.58 0.080
8.2.4.3 E-folding Time
The same options that were analysed for hydraulics (in the previous section) were also analysed for e-folding times.
The scenarios that considered changes in the gap width were analysed to determine the impacts on e-folding times within Swan Bay. E-folding times at the south of Swan Bay were higher than for the base scenario (78 days for a 20 m gap, 57 days for a 40 m gap, and 20 days for a 100 m gap : compared to 19 days for the base scenario), although the time for a 100 m gap was very similar to the base scenario.
The scenarios that considered changes in the dredge depth were analysed to determine the impacts on e-folding times within the main body of the lake. E-folding times at Warners Bay showed a maximum reduction when compared to the base scenario for a –4.5 m dredging depth (281 days compared to 320 days for the base scenario). Similarly, Toronto (231 days compared to 270) and Pulbah Island (261 compared to 364) also showed maximum decreases for the greatest dredge depth.
The impact on e-folding times is more significant at Pulbah Island as the redirection of flows westwards through the airforce channel results in an increased tidal exchange with the southern parts of the Lake.
Similarly to Option 1, the e-folding times that result from the different scenarios analysed are still very large, and as such, Option 2 dredging is not an appropriate tool for improving lake water quality on the whole.

DETAILED ASSESSMENT OF SELECTED MANAGEMENT OPTIONS 8-11
H:\N0683 SWANSEA CHANNEL & SWANBAY INVESTIGATION\DOCS\FINALDRAFTPDFS\R.N0683.001.03.DRAFT_INCLUDINGFIGURES.DOC 8/10/03 11:10
8.2.4.4 Erosion/Accretion Patterns
The erosion/accretion patterns for the scenarios where the gap was kept constant at 20 m and the depth of the channel varies from 3.0 m to 4.5 m, are shown in Appendix G, Figure G4 and G5. For all of these scenarios erosion still occurs around the north of Coon Island. Erosion in the vicinity of Naru Point and the Spoil Island is not present in these scenarios.
Modelling predicts that erosion through the gap of the training wall is larger when the dredge depths are not as large. As the dredge depth increases the modelled erosion in the gap reduces, as more water tends to flow along Airforce Channel.
Overall, less dredging results in more scour at the base of the channel, as the channel tries to move towards a more stable configuration. Notably, significant erosion appears to occur adjacent to the northern foreshore of Pelican Island for dredging levels of –3.0 and –3.5 m AHD.
8.2.4.5 Other Issues
Modelling indicates that Option 2 reduces the problem of erosion at Naru Point and the Spoil Island but increases erosion adjacent to Pelican Island for lower dredging depths. Accordingly, in order to minimise impacts on potentially valuable habitats, a dredge level of at least –4.0 m AHD would be desirable. This depth would also be adequate for navigation. Nevertheless, it is likely that to maintain adequate navigation, some maintenance dredging would be required within the channel.
The maximum velocities within the gap range from 1.4 m/s (100 m wide) to 1.6 m/s (20 m wide). The impact of these velocities on navigation safety, would need further consideration.
8.2.5 Option 3
8.2.5.1 Overview of Option
Option 3 involves reclamation within the southern entrance to Swan Bay. Three scenarios have been modelled, full reclamation (no gap), and partially reclamation (retaining gaps of 50 and 100 m). Dredging through the main navigation channel is also included for each scenario. The dredging comprises a 120 m wide and 4 m deep channel.
8.2.5.2 Hydraulics
Calculated hydraulic parameters for each of the scenarios within Option 3 are shown in Table 8-4. Results for the base scenario and Option 1 with the same dredging configuration are also presented.
In terms of lake hydraulics, Option 3 is very similar to the corresponding Option 1 scenario. Hydraulic impacts are relatively small when compared to the base scenario.

DETAILED ASSESSMENT OF SELECTED MANAGEMENT OPTIONS 8-12
H:\N0683 SWANSEA CHANNEL & SWANBAY INVESTIGATION\DOCS\FINALDRAFTPDFS\R.N0683.001.03.DRAFT_INCLUDINGFIGURES.DOC 8/10/03 11:10
Table 8-4 Option 3: Spring Tidal Range, Tidal Prism and Mean Lake Level
Spring Tidal Range (m)
Spring Tidal Prism
(x 106 m3)
Mean Lake Level (m) AHD
Base Scenario 0.105 11.06 0.085
Option 1 (4 m deep, 120 m wide) 0.112 11.80 0.078
Option 3 (No gap) 0.111 11.64 0.079
Option 3 (50 m gap) 0.112 11.74 0.078
Option 3 (100 m gap) 0.112 11.74 0.078
8.2.5.3 E-folding Time
The major impact on e-folding times would be expected within Swan Bay due to the partial or full closure of the southern entrance. The e-folding times were as follows:
• North Swan Bay (88 days for no gap and 47 days for a 100 m gap, compared to 42 days for the corresponding scenario in Option 1).
• South Swan Bay (94 days for no gap, 28 days for a 100 m gap, compared to 27 days for the corresponding scenario in Option 1).
Clearly the degree of closure has a significant impact on e-folding times within Swan Bay, with e-folding times increasing with a greater degree of closure. Following closure of the southern entrance, it is likely that wind driven circulations would assume a more significant role in flushing within Swan Bay.
8.2.5.4 Erosion/Accretion Patterns
The erosion and accretion patterns for Option 3 are shown in Appendix G, Figure G6 and G7. Closure of the southern entrance to Swan Bay indicates a far stabler channel adjacent to the southern entrance when compared to the corresponding configuration in Option 1. Predictably, the width of the gap affects stability in this area with larger widths resulting in reduced stability of the main dredged channel adjacent to the entrance. Otherwise, erosion and accretion patterns for the different option scenarios are similar to each other and the corresponding scenario in Option 1. The only other notable difference is the vicinity of the northern entrance to Swan Bay. Larger gap widths in the southern entrance increase the amount of flow through Swan Bay which results in an increased tendency to scour at the northern entrance to Swan Bay.

DETAILED ASSESSMENT OF SELECTED MANAGEMENT OPTIONS 8-13
H:\N0683 SWANSEA CHANNEL & SWANBAY INVESTIGATION\DOCS\FINALDRAFTPDFS\R.N0683.001.03.DRAFT_INCLUDINGFIGURES.DOC 8/10/03 11:10
8.2.5.5 Other Issues
The closure of the southern entrance results in a more stable dredged channel adjacent to the closed area. Otherwise, the impacts are very similar to those discussed for the corresponding scenario within Option 1. In addition, the full or partial closure of the southern entrance would reduce the fetch length of wind generated waves encroaching upon the south eastern foreshore of Swan Bay. These wind waves have been identified as causing foreshore erosion problems experienced in Swan Bay.
Maximum modelled flood tidal velocities through the gap were in the vicinity of 0.5 m/s.
8.2.6 Option 4
8.2.6.1 Overview Option
Option 4 involves four scenarios that all includes construction of groynes at Naru Point. Two different groyne directions (north and north west) and two different lengths (150 m and 70 m) were modelled. Dredging through the main navigation channel (120 m wide and 4 m deep) was included in each scenario.
8.2.6.2 Hydraulics
The calculated hydraulic parameters for each of the scenarios within Option 4 are shown in Table 8-5. Results for the base scenario and Option 1 with the same dredging configuration are also presented. The results indicate that the impacts on lake hydraulics would be very similar to those for the corresponding option 1 configuration (dredging only). Notably, the option which includes a 150m groyne oriented towards the north- west is slightly different from the others, having a reduced tidal range and prism. This occurs as the groyne interferes with the northwards flow along the main navigation channel and tends to force flows westwards, towards the Airforce Channel.
Table 8-5 Option 4: Spring Tidal Range, Tidal Prism and Mean Lake Level
Spring Tidal Range (m)
Spring Tidal Prism
(x 106 m3)
Mean Lake Level (m) AHD
Base Scenario 0.105 11.06 0.085
Option 1 (4 m deep, 120 m wide) 0.112 11.80 0.078
Option 4 (North Groyne 150 m) 0.112 11.74 0.079
Option 4 (North West Groyne 150 m) 0.109 11.42 0.079
Option 4 (North Groyne 70 m) 0.112 11.74 0.078
Option 4 (North West Groyne 70 m) 0.112 11.74 0.078

DETAILED ASSESSMENT OF SELECTED MANAGEMENT OPTIONS 8-14
H:\N0683 SWANSEA CHANNEL & SWANBAY INVESTIGATION\DOCS\FINALDRAFTPDFS\R.N0683.001.03.DRAFT_INCLUDINGFIGURES.DOC 8/10/03 11:10
8.2.6.3 E-folding Times
The major impact on e-folding times would be expected within Swan Bay due to the presence of groynes within the southern entrance. The e-folding times were as follows:
• North Swan Bay : All scenarios indicated an e-folding time of approximately 46 days compared to 42 days for the corresponding Option 1 configuration and 77 days for the base scenario;
• South Swan Bay : (35 days for a 150 m groyne oriented northwards, 57 days for 150 m groyne oriented towards the northwest, 27 days for a 70 m groyne oriented northwards and 35 days for a 70 m groyne oriented to the northwest: compared to 27 days for the corresponding Option 1 scenario and 19 days for the base scenario).
These scenarios have less impact on the e-folding times within Swan Bay when compared to Option 3.
8.2.6.4 Erosion/Accretion Patterns
The erosion and accretion patterns for this option are shown in Appendix H, Figure G10 and G11.
The results shown in this option are somewhat similar to the results given for Option 1 with dredging of 4 m deep and 120 m wide. The main difference is for the option with a 150 m long groyne oriented towards the north west. The results for this option indicate that flow would tend to be forced more westwards towards the Airforce channel. This would have a detrimental effect on maintaining the stability of the dredged navigation channel.
In comparison to the other three scenarios the groyne 150 m to the north west has the largest impact on the erosion and accretion patterns, in contrast to Option 1. This groyne results in an unstable main navigation channel, whereas the northward oriented 150 m long groyne tends to result in a more stable channel.
The model predicts erosion at the end of the groynes in all scenarios.
8.2.6.5 Other Issues
Design of the groynes would need to take into consideration the potential for additional scour adjacent to the ends of the groynes and navigation safety in the vicinity of the groynes.
8.2.7 Option 5
8.2.7.1 Overview of Option
This option incorporates dredging to 4 m deep and 120 m wide, which was found to be the best dredging regime in Option1, along with the construction of a structure across the western parts of the dropover to confine all flows through the main navigation channel.

DETAILED ASSESSMENT OF SELECTED MANAGEMENT OPTIONS 8-15
H:\N0683 SWANSEA CHANNEL & SWANBAY INVESTIGATION\DOCS\FINALDRAFTPDFS\R.N0683.001.03.DRAFT_INCLUDINGFIGURES.DOC 8/10/03 11:10
8.2.7.2 Hydraulics
The estimated tidal range for this option is 0.104 m (compared to 0.105 m for the base scenario), tidal prism is 10.95 x 10⁶ m3 (compared to 11.06 x 10⁶ m3 for the base scenario and 11.80 x 10⁶ m3 for the corresponding Option 1). In comparison to the base scenario there is a slight reduction in the tidal range and tidal prism. In comparison to the corresponding scenario in Option 1 there is a reduction in the tidal range and prism of approximately 7%.
8.2.7.3 E-folding Time
In comparison to the base scenario there is an increase in the e-folding time within the lake (>366 days at Warners Bay, 350 days at Toronto and 648 days at Pulbah Island , compared to 320 days, 270 days and 364 days respectively) and also in Swan Bay, both north (156 days compared to 77 days) and South (42 days compared to 19).
These results highlight the importance of flow across the western portion of the dropover in terms of tidal exchange.
8.2.7.4 Erosion/Accretion Patterns
In comparison to the corresponding scenario in Option 1 (-4m AHD, 120m wide), the erosion and accretion patterns indicate a slight increase in stability of the dredged channel. Otherwise, erosion and accretion is minimised towards the west of the blockage between Coon and Elizabeth Islands, removing the threat to Coon Island. The predicted erosion and accretion patterns are shown on Figure G12.
8.2.7.5 Other Issues
Navigability into the lake would benefit from this option due to the increased stability of the channel. The main issue with this option is the reduction in flushing in the southern part of Lake Macquarie However, the there is a small reduction in tidal exchange for this option. Otherwise, impacts and consideration of other issues are similar to those discussed for the corresponding scenario within Option 1.
8.2.8 Option 6
8.2.8.1 Overview of Option
Option 6 involves removal of the sand islands, including Elizabeth Island, Pelican Island and Spectacle Island. The islands were removed to a depth of –0.5 m.
8.2.8.2 Hydraulics
The estimated tidal range for this option is 0.084 m (compared to 0.105 m for the base scenario), tidal prism is 11.27 x 10⁶ m3 (compared to 11.06 x 10⁶ m3 for the base scenario). This option has minimal impact on the predicted tidal range and prism (an increase of less than 2%).

DETAILED ASSESSMENT OF SELECTED MANAGEMENT OPTIONS 8-16
H:\N0683 SWANSEA CHANNEL & SWANBAY INVESTIGATION\DOCS\FINALDRAFTPDFS\R.N0683.001.03.DRAFT_INCLUDINGFIGURES.DOC 8/10/03 11:10
8.2.8.3 E-folding Times
Modelling predicts that the removal of the sand islands has minimal effect on e-folding times within the lake when compared to the base scenario. A reduction in e-folding times of 1 day was calculated for Warners Bay and Toronto, 7 days for Pulbah Island, and no change was calculated within Swan Bay .
8.2.8.4 Erosion/Accretion Patterns
The predicted erosion and accretion patterns are shown on Figure G12. The patterns show that there is minimal impact with removal of the island, which is also reflected in the hydraulic results
8.2.8.5 Other Issues
From an ecological perspective this approach would be detrimental. It has been detailed that there are a number species of conservation significance that may utilise these islands including the Caspian Tern Hydroprogne caspia, Little Tern Sterna albifrons and Eastern Curlew Nomenius madagascariensis. These species have been recognised as internationally significant and are listed in the CAMBA and/or JAMBA treaties. These agreements mean that the government are required to rake a range of actions on behalf of the species listed (refer to Section 3.2.1.4).
8.3 Preliminary Costs and Benefits
8.3.1 Preliminary Cost Estimates
8.3.1.1 Basis for Cost Estimates
The cost estimates for the various management options have been based on the following assumptions:
• Dredging site establishment for major works ($150,000) :based on recent experience;
• Dredging ($5 per m3 and $1 per m3 for each additional kilometre over 1 kilometre for pumping of the dredged slurry). Total of $6 per m3 to transport to Blacksmiths Beach;
• Rock structures costed at $30/m3 for core material and $40/m3 for armour material. Cost of groynes is expected to be around $3,800 per lineal metre, and for revetments around $1,900 per lineal metre);
• A 20% contingency was added to the capital costs;
• A 15% allowance was added to capital costs for design, investigation, survey and supervision;
• Maintenance dredging quantities have been calculated based on the amount of material that would be eroded from the dredge profile per year (as predicted by the numerical model). It needs to be accepted that some variation is likely in these amounts as described in Section 5.2.2;
• Dredging site establishment for maintenance works ($150,000). This cost was spread over the expected time frame for maintenance dredging which was based on the expected annual maintenance dredging quantities; and

DETAILED ASSESSMENT OF SELECTED MANAGEMENT OPTIONS 8-17
H:\N0683 SWANSEA CHANNEL & SWANBAY INVESTIGATION\DOCS\FINALDRAFTPDFS\R.N0683.001.03.DRAFT_INCLUDINGFIGURES.DOC 8/10/03 11:10
• Discount rate on the annual series has been set at 7%. Present value of maintenance dredging has been calculated over a 10 year and 25 year period due to uncertainties in the future behaviour of sediment flowing into the study area from downstream. In addition, total costs for both of these periods have been calculated.
Costs associated with dredging of the northern entrance to Swan Bay have not been included in the preliminary cost estimate. As indicated in Section 1.4, commercial extraction operations have ceased, with some 46,000m3 remaining to be dredged to meet the proposed dredge profile (Resources Planning, 1988). Costs for dredging the northern channel of Swan Bay have not been included as it is possibly that it will be carried out separate to the broadscale dredging program of Swansea Channel, and will attract different funding arrangements over a different timescale.
Using the above assumptions, preliminary costs for each of the management options, and the base scenario have been calculated. The costs are provided for comparison purposes between management options and are presented in Table 8-6.
Table 8-6 Preliminary Indicative Cost Estimates
Capital Cost Annual Maintenance
PV of Maintenance (25
yrs) Total Cost (25 yrs)
PV of Maintenance
(10 yrs) Total Cost
(10 yrs)
Option 1 (60m wide, -3.0m AHD) $569,000 $222,000 $2,766,000 $3,335,000 $1,667,000 $2,236,000 Option 1 (60m wide, -3.5m AHD) $963,000 $217,000 $2,705,000 $3,667,000 $1,630,000 $2,593,000 Option 1 (60m wide, -4.0m AHD) $1,357,000 $197,000 $2,452,000 $3,809,000 $1,478,000 $2,835,000 Option 1 (60m wide, -4.5m AHD) $1,751,000 $165,000 $2,054,000 $3,805,000 $1,238,000 $2,989,000 Option 1 (120m wide, -3.0m AHD) $1,394,000 $460,000 $5,731,000 $7,125,000 $3,454,000 $4,848,000 Option 1 (120m wide, -3.5m AHD) $2,283,000 $321,000 $4,007,000 $6,289,000 $2,415,000 $4,697,000 Option 1 (120m wide, -4.0m AHD) $3,171,000 $111,000 $1,385,000 $4,556,000 $835,000 $4,006,000 Option 1 (120m wide, -4.5m AHD) $4,059,000 $111,000 $1,387,000 $5,446,000 $836,000 $4,895,000 Option 2(-3.0 m AHD, 20m gap) $8,493,000 $704,000 $8,784,000 $17,277,000 $5,294,000 $13,787,000 Option 2(-3.5 AHD, 20m gap) $9,382,000 $567,000 $7,069,000 $16,451,000 $4,261,000 $13,642,000 Option 2(-4.0 m AHD, 20m gap) $10,270,000 $417,000 $5,196,000 $15,466,000 $3,131,000 $13,401,000 Option 2(-4.5 m AHD, 20m gap) $11,158,000 $267,000 $3,327,000 $14,486,000 $2,005,000 $13,164,000 Option 2(-4.0 m AHD, 40m gap) $10,168,000 $704,000 $8,784,000 $18,952,000 $5,294,000 $15,462,000 Option 2(-4.0 m AHD, 100m gap) $9,862,000 $704,000 $8,784,000 $18,646,000 $5,294,000 $15,156,000 Option 3 (No Gap) $3,809,000 $28,000 $346,000 $4,155,000 $209,000 $4,018,000 Option 3 (50m Gap) $3,681,000 $111,000 $1,385,000 $5,066,000 $835,000 $4,516,000 Option 3 (100m Gap) $3,554,000 $139,000 $1,731,000 $5,285,000 $1,043,000 $4,597,000 Option 4 (150m groyne North) $3,936,000 $111,000 $1,385,000 $5,321,000 $835,000 $4,771,000 Option 4 (150m groyne North West) $3,936,000 $405,000 $5,050,000 $8,987,000 $3,044,000 $6,980,000 Option 4 (70m groyne North) $3,528,000 $167,000 $2,077,000 $5,606,000 $1,252,000 $4,780,000 Option 4 (70m groyne North West) $3,528,000 $167,000 $2,077,000 $5,606,000 $1,252,000 $4,780,000 Option 5 $5,722,000 $56,000 $692,000 $6,415,000 $417,000 $6,140,000 Option 6 $851,000 $878,000 $10,942,000 $11,792,000 $6,595,000 $7,445,000
Baseline Scenario $0 $506,000 $6,313,000 $6,313,000 $3,805,000 $3,805,000

DETAILED ASSESSMENT OF SELECTED MANAGEMENT OPTIONS 8-18
H:\N0683 SWANSEA CHANNEL & SWANBAY INVESTIGATION\DOCS\FINALDRAFTPDFS\R.N0683.001.03.DRAFT_INCLUDINGFIGURES.DOC 8/10/03 11:10
8.3.2 Preliminary Estimate of Benefits
A preliminary assessment of the benefits of the options outlined above was undertaken as follows:
• Each option was given a score indicating the likely impact when considering the following issues:
o Navigation;
o The need for ongoing maintenance dredging;
o Accretion in the vicinity of the southern entrance to Swan Bay
o Erosion at Naru Point;
o Erosion Adjacent to the Spoil Island;
o Erosion Adjacent to Elizabeth Island;
o Erosion Adjacent to Pelican Island;
o Impact on Seagrasses;
o Wind waves on the Eastern Foreshore of Swan Bay;
o Flushing in Swan Bay; and
o Lake hydraulics and tidal exchange.
A score was assigned on a scale ranging between –10 and +10 with negative values indicating an expected negative impact when compared to the present scenario and positive values indicating a positive impact. Scores of zero indicate no perceived impact when compared to the base scenario. Scores are based upon the results of the modelling and qualitative assessment. These scores are presented in Table 8-7;
• Each of the issues for which a score was determined was given a percentage score, reflecting the relative importance of these issues and likelihood that changes would interact significantly with those issues. The percentage scores derived are indicated in Table 8-8;
• Percentage rankings were obtained for the performance of each management option against each issue by multiplying the benefit scores for each management option by the percentage score of the relevant issue. These percentage rankings were totalled for each management option to give a value representing the total assessed benefit. The results of this process are provided in Table 8-8;
This assessment method is subjective and is therefore influenced by our interpretation. Nonetheless, it has been used as a basis for preliminary analysis of the appropriateness of expenditure on the different management options.
The benefit assessment has not included consideration of the wider benefits to the Lake Macquarie community and businesses. A more formal economic assessment would be required

DETAILED ASSESSMENT OF SELECTED MANAGEMENT OPTIONS 8-19
H:\N0683 SWANSEA CHANNEL & SWANBAY INVESTIGATION\DOCS\FINALDRAFTPDFS\R.N0683.001.03.DRAFT_INCLUDINGFIGURES.DOC 8/10/03 11:10
to determine to potential increase in tourism, for example, that entrance channel works would generate. Such an economic assessment has been the subject of a parallel investigation carried out on behalf of the Office of the Lake Macquarie and Catchment Co-ordinator (Gillespie, 2003).
Table 8-7 Benefit Scores for Each Management Option
Need
for M
aint
enan
ce D
redg
ing
Accr
etio
n Ne
ar E
ntra
nce
to
Swan
Bay
Navi
gatio
n
Scou
r at N
aru
Poin
t
Scou
r Adj
acen
t to
Spoi
l Isl
and
Scou
r - E
lizab
eth
Isla
nd
Scou
r - C
oon
Isla
nd
Scou
r Pel
ican
Isla
nd
Seag
rass
Hea
lth
Wav
es In
Sw
an B
ay
Lake
Hyd
raul
ics
and
Tida
l Ex
chan
ge
Flus
hing
of S
wan
Bay
Option 1 (60m wide, -3.0m AHD) 1 1 4 0 0 0 1 1 0 0 0 2 Option 1 (60m wide, -3.5m AHD) 2 1 5 0 0 0 2 2 0 0 0 2 Option 1 (60m wide, -4.0m AHD) 3 1 6 0 0 0 3 3 0 0 0 2 Option 1 (60m wide, -4.5m AHD) 4 1 7 0 0 0 4 4 0 0 0 3 Option 1 (120m wide, -3.0m AHD) 1 0 5 7 7 -1 3 3 0 0 0 2 Option 1 (120m wide, -3.5m AHD) 3 0 7 8 8 -2 4 4 0 0 0 2 Option 1 (120m wide, -4.0m AHD) 8 8 9 9 9 -3 5 5 0 0 0 3 Option 1 (120m wide, -4.5m AHD) 8 8 10 10 10 -4 6 6 0 0 0 3 Option 2(-3.0 m AHD, 20m gap) 0 8 4 10 10 0 -1 -3 -5 10 -2 -3 Option 2(-3.5 AHD, 20m gap) 0 8 5 10 10 0 -1 -1 -4 10 -2 -3 Option 2(-4.0 m AHD, 20m gap) 2 8 6 10 10 0 -2 0 -3 10 0 -4 Option 2(-4.5 m AHD, 20m gap) 3 8 7 10 10 0 -2 0 -2 10 0 -4 Option 2(-4.0 m AHD, 40m gap) 2 8 6 10 10 0 -2 0 -3 10 0 -3 Option 2(-4.0 m AHD, 100m gap) 2 8 6 10 10 0 -2 0 -3 10 0 -2 Option 3 (No Gap) 10 10 10 9 9 -3 5 5 0 10 0 -4 Option 3 (50m Gap) 8 8 9.5 9 9 -3 5 5 0 7 0 3 Option 3 (100m Gap) 7 7 9 9 9 -3 5 5 0 4 0 2 Option 4 (150m groyne North) 8 9 9.5 9 9 -3 5 5 0 7 0 1 Option 4 (150m groyne North West) 3 6 3 9 9 0 5 5 0 5 0 -1 Option 4 (70m groyne North) 6 7 9 9 9 -3 5 5 0 4 0 2 Option 4 (70m groyne North West) 5 6 9 9 9 -3 5 5 0 3 0 1 Option 5 9 8 9 9 9 -3 5 5 0 8 -3 4
Option 6 0 0 0 0 0 -10 0 0 -3 0 0 0

DETAILED ASSESSMENT OF SELECTED MANAGEMENT OPTIONS 8-20
H:\N0683 SWANSEA CHANNEL & SWANBAY INVESTIGATION\DOCS\FINALDRAFTPDFS\R.N0683.001.03.DRAFT_INCLUDINGFIGURES.DOC 8/10/03 11:10
Table 8-8 Percentage Ranking for Management Options
Need
for M
aint
enan
ce D
redg
ing
Accr
etio
n Ne
ar E
ntra
nce
to S
wan
Bay
Navi
gatio
n
Scou
r at N
aru
Poin
t
Scou
r Adj
acen
t to
Spoi
l Isl
and
Scou
r - E
lizab
eth
Isla
nd
Scou
r - C
oon
Isla
nd
Scou
r Pel
ican
Isla
nd
Seag
rass
Hea
lth
Wav
es In
Sw
an B
ay
Lake
Hyd
raul
ics
and
Tida
l Exc
hang
e
Flus
hing
of S
wan
Bay
Tota
l Ben
efit
Scor
e
Importance Value 6 10 8 4 3 2 3 4 6 2 5 6 59
Importance (%) 10.17 16.95 13.56 6.78 5.08 3.39 5.08 6.78 10.17 3.39 8.47 10.17 100
Option 1 (60m wide, -3.0m AHD) 1.02 1.69 5.42 0.00 0.00 0.00 0.51 0.68 0.00 0.00 0.00 2.03 11.36Option 1 (60m wide, -3.5m AHD) 2.03 1.69 6.78 0.00 0.00 0.00 1.02 1.36 0.00 0.00 0.00 2.03 14.92Option 1 (60m wide, -4.0m AHD) 3.05 1.69 8.14 0.00 0.00 0.00 1.53 2.03 0.00 0.00 0.00 2.03 18.47Option 1 (60m wide, -4.5m AHD) 4.07 1.69 9.49 0.00 0.00 0.00 2.03 2.71 0.00 0.00 0.00 3.05 23.05Option 1 (120m wide, -3.0m AHD) 1.02 0.00 6.78 4.75 3.56 -0.34 1.53 2.03 0.00 0.00 0.00 2.03 21.36Option 1 (120m wide, -3.5m AHD) 3.05 0.00 9.49 5.42 4.07 -0.68 2.03 2.71 0.00 0.00 0.00 2.03 28.14Option 1 (120m wide, -4.0m AHD) 8.14 13.56 12.20 6.10 4.58 -1.02 2.54 3.39 0.00 0.00 0.00 3.05 52.54Option 1 (120m wide, -4.5m AHD) 8.14 13.56 13.56 6.78 5.08 -1.36 3.05 4.07 0.00 0.00 0.00 3.05 55.93 Option 2(-3.0 m AHD, 20m gap) 0.00 13.56 5.42 6.78 5.08 0.00 -0.51 -2.03 -5.08 3.39 -1.69 -3.05 21.86Option 2(-3.5 AHD, 20m gap) 0.00 13.56 6.78 6.78 5.08 0.00 -0.51 -0.68 -4.07 3.39 -1.69 -3.05 25.59Option 2(-4.0 m AHD, 20m gap) 2.03 13.56 8.14 6.78 5.08 0.00 -1.02 0.00 -3.05 3.39 0.00 -4.07 30.85Option 2(-4.5 m AHD, 20m gap) 3.05 13.56 9.49 6.78 5.08 0.00 -1.02 0.00 -2.03 3.39 0.00 -4.07 34.24Option 2(-4.0 m AHD, 40m gap) 2.03 13.56 8.14 6.78 5.08 0.00 -1.02 0.00 -3.05 3.39 0.00 -3.05 31.86Option 2(-4.0 m AHD, 100m gap) 2.03 13.56 8.14 6.78 5.08 0.00 -1.02 0.00 -3.05 3.39 0.00 -2.03 32.88 Option 3 (No Gap) 10.17 16.95 13.56 6.10 4.58 -1.02 2.54 3.39 0.00 3.39 0.00 -4.07 55.59Option 3 (50m Gap) 8.14 13.56 12.88 6.10 4.58 -1.02 2.54 3.39 0.00 2.37 0.00 3.05 55.59Option 3 (100m Gap) 7.12 11.86 12.20 6.10 4.58 -1.02 2.54 3.39 0.00 1.36 0.00 2.03 50.17 Option 4 (150m groyne North) 8.14 15.25 12.88 6.10 4.58 -1.02 2.54 3.39 0.00 2.37 0.00 1.02 55.25Option 4 (150m groyne North West) 3.05 10.17 4.07 6.10 4.58 0.00 2.54 3.39 0.00 1.69 0.00 -1.02 34.58Option 4 (70m groyne North) 6.10 11.86 12.20 6.10 4.58 -1.02 2.54 3.39 0.00 1.36 0.00 2.03 49.15Option 4 (70m groyne North West) 5.08 10.17 12.20 6.10 4.58 -1.02 2.54 3.39 0.00 1.02 0.00 1.02 45.08 Option 5 9.15 13.56 12.20 6.10 4.58 -1.02 2.54 3.39 0.00 2.71 -2.54 4.07 54.75
Option 6 0.00 0.00 0.00 0.00 0.00 -3.39 0.00 0.00 -3.05 0.00 0.00 0.00 -6.44

DETAILED ASSESSMENT OF SELECTED MANAGEMENT OPTIONS 8-21
H:\N0683 SWANSEA CHANNEL & SWANBAY INVESTIGATION\DOCS\FINALDRAFTPDFS\R.N0683.001.03.DRAFT_INCLUDINGFIGURES.DOC 8/10/03 11:10
8.3.3 Cost / Benefit Comparison
An indicative cost/benefit ratio has been calculated based on the indicative costs and potential benefits for each of the 23 scenarios. The results are provided in Table 8-9. These results do not take into consideration the wider benefits of the dredging works (such as increased tourism potential), which have been assessed as part of a separate investigation (Gillespie, 2003). The results of the indicative cost/benefit comparison generally show that options which involve dredging a channel past Marks Point, with or without partial closure of the southern entrance to Swan Bay are probably the most cost effective. It is important to note that these results are largely affected by the importance scores, particularly the value of 8/10 for navigation, provided in Table 8-8.
Table 8-9 Indicative Cost/Benefit Assessment for Management Options
Indi
cativ
e
Capi
tal
Cost
Indi
cativ
e Co
st (2
5 yr
s)
Indi
cativ
e Co
st (1
0 yr
s)
Indi
cativ
e Be
nefit
s (%
)
Indi
cativ
e Be
nefit
/Indi
cativ
e Ca
pita
l Cos
t
Indi
cativ
e B
enef
it/In
dica
tive
Cost
(2
5 yr
s)
Indi
cativ
e B
enef
it/In
dica
tive
Cost
(1
0 yr
s)
Rank
(C
apita
l)
Rank
(2
5 yr
s)
Rank
(1
0 yr
s)
Option 1 (60m wide, -3.0m AHD) $569,000 $3,335,000 $2,236,000 11.36 19.96 3.41 5.08 1 15 14 Option 1 (60m wide, -3.5m AHD) $963,000 $3,667,000 $2,593,000 14.92 15.49 4.07 5.75 3 13 13 Option 1 (60m wide, -4.0m AHD) $1,357,000 $3,809,000 $2,835,000 18.47 13.61 4.85 6.52 11 11 11 Option 1 (60m wide, -4.5m AHD) $1,751,000 $3,805,000 $2,989,000 23.05 13.16 6.06 7.71 12 10 10 Option 1 (120m wide, -3.0m AHD) $1,394,000 $7,125,000 $4,848,000 21.36 15.32 3.00 4.41 4 16 16 Option 1 (120m wide, -3.5m AHD) $2,283,000 $6,289,000 $4,697,000 28.14 12.32 4.47 5.99 14 12 12 Option 1 (120m wide, -4.0m AHD) $3,171,000 $4,556,000 $4,006,000 52.54 16.57 11.53 13.12 2 2 2 Option 1 (120m wide, -4.5m AHD) $4,059,000 $5,446,000 $4,895,000 55.93 13.78 10.27 11.43 10 5 5 Option 2(-3.0 m AHD, 20m gap) $8,493,000 $17,277,000 $13,787,000 21.86 2.57 1.27 1.59 22 22 22 Option 2(-3.5 AHD, 20m gap) $9,382,000 $16,451,000 $13,642,000 25.59 2.73 1.56 1.88 21 21 21 Option 2(-4.0 m AHD, 20m gap) $10,270,000 $15,466,000 $13,401,000 30.85 3.00 1.99 2.30 20 18 18 Option 2(-4.5 m AHD, 20m gap) $11,158,000 $14,486,000 $13,164,000 34.24 3.07 2.36 2.60 19 17 17 Option 2(-4.0 m AHD, 40m gap) $10,168,000 $18,952,000 $15,462,000 31.86 3.13 1.68 2.06 18 20 20 Option 2(-4.0 m AHD, 100m gap) $9,862,000 $18,646,000 $15,156,000 32.88 3.33 1.76 2.17 17 19 19 Option 3 (Full Reclamation) $3,809,000 $4,155,000 $4,018,000 55.59 14.60 13.38 13.84 6 1 1 Option 3 (50m Gap) $3,681,000 $5,066,000 $4,516,000 55.59 15.10 10.97 12.31 5 3 3 Option 3 (100m Gap) $3,554,000 $5,285,000 $4,597,000 50.17 14.12 9.49 10.91 7 6 6 Option 4 (150m groyne North) $3,936,000 $5,321,000 $4,771,000 55.25 14.04 10.38 11.58 8 4 4 Option 4 (150m groyne NorthWest) $3,936,000 $8,987,000 $6,980,000 34.58 8.78 3.85 4.95 16 14 15 Option 4 (70m groyne North) $3,528,000 $5,606,000 $4,780,000 49.15 13.93 8.77 10.28 9 7 7 Option 4 (70m groyne NorthWest) $3,528,000 $5,606,000 $4,780,000 45.08 12.78 8.04 9.43 13 9 8 Option 5 $5,722,000 $6,415,000 $6,140,000 54.75 9.57 8.53 8.92 15 8 9 Option 6 $851,000 $11,792,000 $7,445,000 -6.44 -7.57 -0.55 -0.87 24 24 24 Baseline Scenario $0 $6,313,000 $3,805,000 0.00 0.00 0.00 0.00 23 23 23