8. room acoustics
TRANSCRIPT

NOISE CONTROL Room Acoustics 8.1
8. ACOUSTICS OF ROOMS AND ENCLOSURES
8.1 Introduction This section covers the acoustics of enclosed spaces. Upon completion, the reader should have a basic understanding of how to design spaces with suitable acoustic characteristics for a particular use. The two fundamental qualities that determine a room’s suitability for a particular use are: • Reverberance or Liveliness: primarily a function of the sound absorption in the room
and quantified by the Reverberation Time • Background Noise Levels: predominantly HVAC noise, quantified by the NC or RC
value Typical applications: • Acoustical spaces such as concert halls, classrooms, churches, offices, etc • Industrial Environments - occupied spaces, or enclosures around noise sources 8.2 Sound Fields in a Room Important Concepts: Near Field Far Field Free Field Reverberant Field Diffuse Field
Figure 1. Sound pressure level variation with distance
from the source
J. S. Lamancusa Penn State 12/1/2000

NOISE CONTROL Room Acoustics 8.2
8.3 Sound Absorption
As sound strikes a wall, some of it is reflected, while some is absorbed by the wall. A measure of that absorption is the absorption coefficient αααα, defined as:
incident
reflectedincident
incident
absorbed
III
II −
==α Equation 1
α = 1 if totally absorptive α = 0 if totally reflective α is a function of the material, the frequency, a While some of the absorbed sound is dissipatedfrom the other side. The amount of energy thathe transmission coefficient: (more on this in S
incident
dtransmitte
II
= τ
Absorption can be obtained by three primary m
• porous materials, • panel resonators or • volume resonators:
Porous materials: Energy dissipation occurs dthe surface which pump air into and out of theand the tortuous passages of the material dissipheat. Materials in this category include fiberglfrequency dependence for felt (a common abso
F
Iincident
J. S. Lamancusa Penn State 12/1/2000
nd incidence angle
as heat in the material, some re-radiates t gets into the next room is quantified by ection 9)
Equation 2
echanisms:
ue to acoustic pressure fluctuations at material. Friction between this air flow ate energy as friction, and ultimately
ass, open cell foam, carpet and fabric. The rption material) is shown in Figure 3.
Ireflected
Itransmitted
igure 2. Sound striking an absorbing wall
NOISE CONTROL Room Acoustics 8.3
J. S. Lamancusa Penn State 12/1/2000
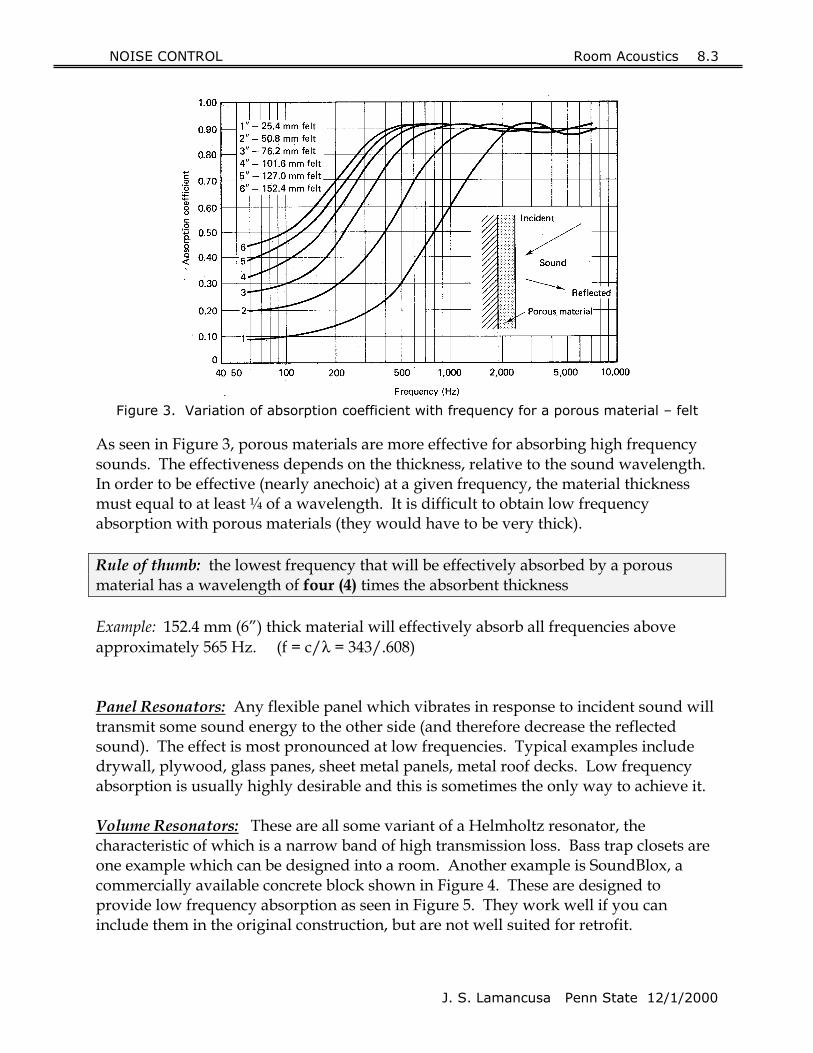
Figure 3. Variation of absorption coefficient with frequency for a porous material – felt
As seen in Figure 3, porous materials are more effective for absorbing high frequency sounds. The effectiveness depends on the thickness, relative to the sound wavelength. In order to be effective (nearly anechoic) at a given frequency, the material thickness must equal to at least ¼ of a wavelength. It is difficult to obtain low frequency absorption with porous materials (they would have to be very thick). Rule of thumb: the lowest frequency that will be effectively absorbed by a porous material has a wavelength of four (4) times the absorbent thickness Example: 152.4 mm (6”) thick material will effectively absorb all frequencies above approximately 565 Hz. (f = c/λ = 343/.608) Panel Resonators: Any flexible panel which vibrates in response to incident sound will transmit some sound energy to the other side (and therefore decrease the reflected sound). The effect is most pronounced at low frequencies. Typical examples include drywall, plywood, glass panes, sheet metal panels, metal roof decks. Low frequency absorption is usually highly desirable and this is sometimes the only way to achieve it. Volume Resonators: These are all some variant of a Helmholtz resonator, the characteristic of which is a narrow band of high transmission loss. Bass trap closets are one example which can be designed into a room. Another example is SoundBlox, a commercially available concrete block shown in Figure 4. These are designed to provide low frequency absorption as seen in Figure 5. They work well if you can include them in the original construction, but are not well suited for retrofit.

NOISE CONTROL Room Acoustics 8.4
J. S. Lamancusa Penn State 12/1/2000
Figure 4. SoundBlox type RSC, a concrete cinder block with enclosed volume resonators for
low frequency absorption
SoundBlox (Type RSC) Absorption
0
0.2
0.4
0.6
0.8
1
1.2
1.4
125
160
200
250
315
400
500
630
800
1000
1250
1600
2000
2500
3150
4000
5000
Frequency - Hz
Abs
orpt
ion
Coe
ffici
ent
4" SoundBlox, painted
8" SoundBlox, painted
8" Painted Cinder Block
8" Unpainted Cinder Block
Figure 5. Absorption coefficient of SoundBlox compared to ordinary solid blocks (SoundBlox
data from Proudfoot Company). Published Absorption Coefficient Values Absorption coefficients for commercially available materials are measured and published by manufacturers. A typical tabulation is shown in Table 1. It is possible to have absorption coefficient values greater than 1.0 for finite sized panels due to diffraction effects at the edges, and the additional absorption caused by the exposed area along the sides.

NOISE CONTROL Room Acoustics 8.5
J. S. Lamancusa Penn State 12/1/2000
Table 1. Absorption coefficients of common building materials (ref. NIOSH Compendium of Noise Control Materials, 1975)

NOISE CONTROL Room Acoustics 8.6
J. S. Lamancusa Penn State 12/1/2000
The Noise Reduction Coefficient (NRC) is an attempt to get a single number to quantify a material. It is the numerical average of the absorption coefficients in the 250, 500, 1000 and 2000 Hz bands.
NRC = (α250 + α500 + α1000 + α2000 )/4 Equation 3
8.3 Experimental Determination Of Absorption Absorption may be determined by experimental procedures, either:
• normal incidence coefficient αn using an impedance tube (Figure 8.3) • random incidence coefficient αsabine using a reverberation chamber
A third theoretical quantity sometimes used in equations is the statistical energy absorption coefficient αst It is defined as:
Energy SoundIncident field sound diffusein surface infiniteby absorbedEnergy Sound=STα Equation 4
This is an idealized quantity which cannot be measured directly.
8.4 Normal Incidence Coefficient ααααN The normal incidence absorption coefficient is the ratio of energy absorbed/energy incident, for a plane wave, normally incident on an absorptive surface. It is easy to determine using a “standing wave tube” (sometimes called an “impedance tube”). It uses a small sample (typically 4” diameter) and has limited validity and usefulness due to the small sample size and the difference between a true normal incidence condition, and the actual incidence conditions (nearly random) seen in most real installations. But it is still useful for comparison purposes. The diameter of the tube must be smaller than ½ wavelength to insure plane wave sound propagation. A 4” tube is good up to about 3300 Hz. For higher frequencies, a smaller diameter tube is used.

NOISE CONTROL Room Acoustics 8.7
Figure 6. Impedance tube for measuring normal incidence absorption coefficient We input a pure tone (or band of noise) using a loudspeaker. The incident wave from the speaker combines with the reflected wave from the end of the tube to form a standing wave. The depths of the minima are directly related to the absorption of the sample at the end of the tube. If the sample were perfectly reflective, total cancellation would occur ¼ wavelength from the end, and a pressure maximum would occur at ½ wavelength. A totally absorptive sample (anechoic) would exhibit a uniform pressure over the entire tube length. So, the difference in the maximum and minimum pressures is an indication of the absorptive characteristics of the sample.
Figure 7. Interaction between incident an
wave pattern in an impedance first minimum. D2 is the distan1/2 wavelength)
We experimentally measure the maximsliding a microphone along the centerlinincidence absorption coefficient, αn .
2
min
max
min
max
1
4
���
����
�+
=
PP
PP
Nα
1
Test
D2J. S. Lamancu
d partially reflected wavtube. D1 is the distancece between the first and
um and minimum prese, from which we can
Equation 5
Pmin
D
sample
Pmax
sa Penn State 12/1/2000
es result in a standing from the sample to the second minima (equal to
sures inside the tube by calculate the normal

NOISE CONTROL Room Acoustics 8.8
Additionally, if we measure the distance from the sample to the first minimum D1, and the distance between consecutive minima (or consecutive maxima) D2, the magnitude of the acoustic impedance can be calculated (ref. pg 57 L,G&E). A good check on the data is that D2 should be equal to one half of a wavelength.
2
1
minmax
minmax0
21
200
200 2
cos21cos21
DD
PPPPRc
RRRR
uPZ πθρ
θθ
=+−
=��
�
�
��
�
�
+−++
== Equation 6
8.5 Sabine Absorption Coefficient αααα Sabine
A patch of material is placed in a large, highly reverberant room having a diffuse field. α sabine is calculated from measurements of sound decay (reverberation time) in the room both with and without the material sample in place. It is a better approximation to real installations of absorptive materials, where the incidence angle can be anything. (reference standards: ISO R354-1963, ASTM C423-84 & AS 1045-1971)
8.6 Room Averaged Coefficient α Most real rooms have a variety of surfaces with different materials. The total effect of all these surfaces can be approximated by the average:
Ass(the If t
J. S. Lamancusa Penn State 12/1/2000
Equation 7
uming a uniform intensity (a diffuse sound field) �= ii SISI αα absorbed acoustical energy/unit time = the absorbed power)
he distribution of α is highly uneven, a better approximation is:
faceeach of absorption average
faces zy, x,of area re whe
zy,x,
,,
=
=++
=
α
ααα
α zyx
z
z
y
y
x
x
SSSS
S
surfaces absorbing ofNumber area surface Total surface i theof Area
surface i theof absorption :ere wh
th
th1
===
==�
=
NSS
S
S
i
i
i
N
ii
αα
α

NOISE CONTROL Room Acoustics 8.9
8.7 Sound Buildup In Rooms If a sound source with power of W is suddenly turned on, acoustic energy flows into the room, with maximum intensity occurring near the source. Waves travel outward and eventually bounce off walls (with partial absorption) back into the room. After several reflections, the sound field approaches diffuseness (if α is low). Energy builds up until an equilibrium is reached. At equilibrium, the total power input (W) is exactly balanced by the power absorbed by the walls. The power absorbed by the walls is determined by the incident sound intensity:
SIWW absorbedinput α== Since intensity is proportional to the square of sound pressure, this gives the result that the sound pressure in the room (in the reverberant field) is proportional to the input power and inversely proportional to the amount of absorption present.
SW
p input
α∝2
Another way to think about it is the sound pressure (and intensity) in the room continue to build up until the power absorbed by the walls equals the input power. The higher the absorption, the lower the overall level which results. A good analogy for this is a leaky water tank filled with a faucet (Figure 8). As the water level in the tank increases, more leaks out of the holes because the head (pressure) which forces water out the leaks is proportional to the water level. Eventually, the level will reach a steady height, where the inflow from the faucet is exactly equal to what leaks out. Now to complete the analogy to our acoustic problem, think of the water level as the sound pressure, the leaks are the sound absorption, and the flow from the faucet is the input sound power. Figure 8.
Mean water level (sound pressure in reverb field) = f (input flow rate [sound power] and amount of leaks [absorption] )
LeaksJ. S. Lamancusa Penn State 12/1/2000
Leaky tank analogy for sound pressure buildup in an absorptive room

NOISE CONTROL Room Acoustics 8.10
8.8 Sound Decay, Reverberation Time If we now turn off our noise source, the sound level will decay linearly with time. Qualitatively, it’s easy to understand that the more absorption a room has, the quicker the sound will decay. We can (and will) use this decay rate to experimentally measure the overall room absorption. The time required for the sound level to decay 60 dB is called the reverberation time, or T60. It is often difficult (particularly at low frequencies) to put enough sound energy into a room to raise the level 60 dB over the background noise. The typical approach is to fit a straight line to the actual decay and extrapolate to 60 dB. Methods to excite the room include impulse sources such as popping balloons (ok for small rooms) or starter pistols; or a steady source – white or pink noise from amplified
Figure 9. Typical decay of sound in a reverberation time test
Background noise level
J. S. Lamancusa Penn State 12/1/2000
speakers. Reverberation time is the single most important parameter for judging the acoustical properties of a room and its suitability for various uses. (Note, RC or NC criteria are measures of the background noise level of a room)
• High reverberation (long T60 ) is desirable for music (concert halls 1.8 – 2.0 seconds)
• Low reverberation (short T60) is desirable for speech intelligibility (such as in a classroom, 0.4 - 0.6 seconds)
The reverberation time at 512 or 1000 Hz is typically used as a single number to quantify the acoustic properties of a space. Recommended values for various applications are shown in Figure 9 and Table 2. An equation for calculating the “Optimum” Reverberation Time (according to Stephens and Bate 1950) is
T60 = K[ 0.0118 V1/3 + 0.1070] Equation 8 V = volume in meters K = 4 for speech, 5 for orchestras, 6 for choirs
NOISE CONTROL Room Acoustics 8.11
J. S. Lamancusa Penn State 12/1/2000
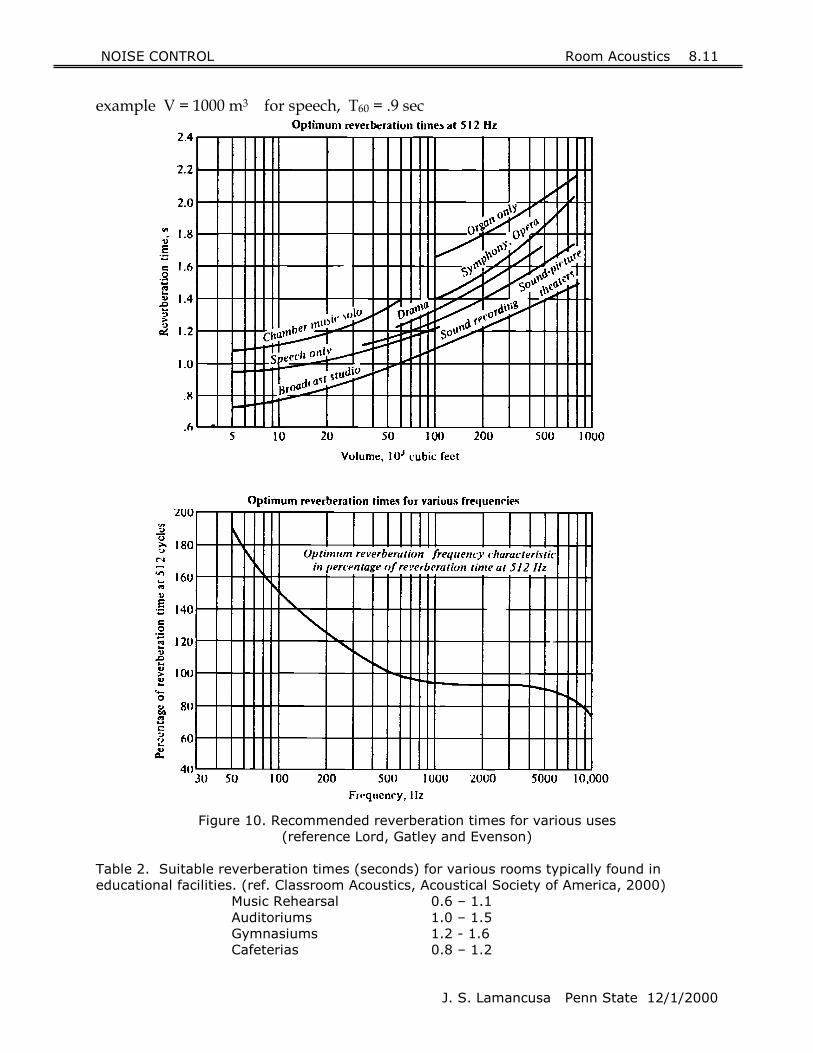
example V = 1000 m3 for speech, T60 = .9 sec
Figure 10. Recommended reverberation times for various uses
(reference Lord, Gatley and Evenson)
Table 2. Suitable reverberation times (seconds) for various rooms typically found in educational facilities. (ref. Classroom Acoustics, Acoustical Society of America, 2000)
Music Rehearsal 0.6 – 1.1 Auditoriums 1.0 – 1.5 Gymnasiums 1.2 - 1.6 Cafeterias 0.8 – 1.2
NOISE CONTROL Room Acoustics 8.12
J. S. Lamancusa Penn State 12/1/2000
Classrooms 0.4 – 0.6
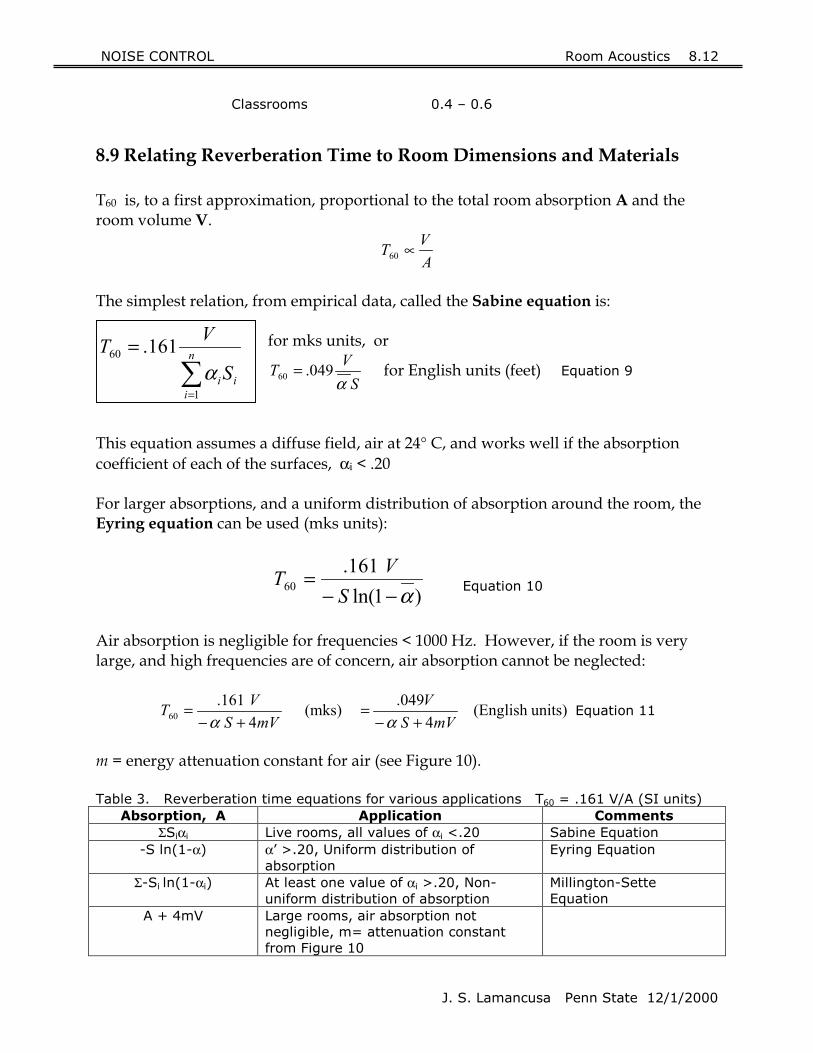
8.9 Relating Reverberation Time to Room Dimensions and Materials T60 is, to a first approximation, proportional to the total room absorption A and the room volume V.
AVT ∝60
The simplest relation, from empirical data, called the Sabine equation is:
for mks units, or
SVT 049.60 α
= for English units (feet) Equation 9
This equation assumes a diffuse field, air at 24° C, and works well if the absorption coefficient of each of the surfaces, αi < .20 For larger absorptions, and a uniform distribution of absorption around the room, the Eyring equation can be used (mks units):
)1ln( 161.
60 α−−=
SVT Equation 10
Air absorption is negligible for frequencies < 1000 Hz. However, if the room is very large, and high frequencies are of concern, air absorption cannot be neglected:
units)(English 4
049. (mks) 4
161.60 mVS
VmVS
VT+−
=+−
=αα
Equation 11
m = energy attenuation constant for air (see Figure 10). Table 3. Reverberation time equations for various applications T60 = .161 V/A (SI units)
Absorption, A Application Comments ΣSiαi Live rooms, all values of αi <.20 Sabine Equation
-S ln(1-α) α’ >.20, Uniform distribution of absorption
Eyring Equation
Σ-Si ln(1-αi) At least one value of αi >.20, Non-uniform distribution of absorption
Millington-Sette Equation
A + 4mV Large rooms, air absorption not negligible, m= attenuation constant from Figure 10
161.
1
60
�=
= n
iiiS
VTα

NOISE CONTROL Room Acoustics 8.13
J. S. Lamancusa Penn State 12/1/2000
Figure 11. Attenuation for propagation of sound in air
8.10 Steady State Sound Levels In Enclosures In a direct field, we already know that the intensity varies with distance.
factory directivit :where 4 2
=
=
θ
θθ πQ
Qr
WI and
pressure sound squaremean :where
2
2
=
=
p
c
pI
ρ
In a reverberant field, the intensity is constant everywhere and is related to pressure by:
cp
I rev 41
2
ρ= Equation 12
Note that the intensity in a diffuse (reverberant) field is only ¼ that of a plane wave.

NOISE CONTROL Room Acoustics 8.14
J. S. Lamancusa
If we assume steady state conditions and a diffuse field, the amount of energy absorbed by the walls must equal the reverberant power supplied. The reverberant power is the sound power of the source minus the sound power absorbed in the first reflection,
)1( STW α− . The absorbed power is )( STrev SI α . The reverberant intensity is then:
RW
SWI
ST
STrev =
−=
αα )1(
Equation 13
Where R is called the room constant, ST
STSR
αα
−=
1 Equation 14
In most cases of low absorption, we typically simplify by assuming:
SABINESTSTSR ααα ≈≈ and A real room is somewhere between a diffuse and a free field. Therefore the total pressure is the sum of the direct and reverberant fields.
��
���
� +=+=Rr
QcWcIcIp rev4
4 4 2
2
πρρρ θ
θ
and in terms of levels:
��
���
� ++=Rr
QLL WP4
4log10 210 π
θ
The quantity Lp – Lw is plotted in Figure 12. In the reverberant fpressure level is independent of location. Note that in a highly rethe reverberant field is very large, and begins very close to the so The change in a room’s SPL due to changing its absorption is callNoise Reduction, NR:
11
221221 log10)/log(10
αα
SSRRLLNR PP ==−= Equ
In order to get a decrease of 6 dB, the room absorption must be in4. (that’s a lot !)
Direct Field
d
Reverberant FielPenn State 12/1/2000
Equation 15
ield, the sound flective room (low R), urce.
ed the
ation 16
creased by a factor of

NOISE CONTROL Room Acoustics 8.15
J. S. Lamancusa Penn State 12/1/2000
Figure 12. Difference between the sound pressure level and the sound power level in a
room as a function of the room constant RT, the distance from the source r and the directivity factor Qθ
Other Room Theories: The preceding relation is based on diffuse field theory. Schultz [ASHRAE Transactions 1983, 91(1), pp 124-153] proposed an empirical formula based on his studies of domestic rooms and closed offices. He found that levels did not ever reach a constant level with distance from the source, as predicted by the diffuse field model. He found that the curves always had a slope of about -3dB/doubling of distance. Notice that there is no term for room absorption!
Lp = Lw - 10 log10 r - 5 log10 V - 3 log10 f +12 Equation 17 where: r = distance (m) V = room volume (m3) f = frequency (Hz)

NOISE CONTROL Room Acoustics 8.16
J. S. Lamancusa Penn State 12/1/2000
8.11 Effect of Mounting The more area an absorbing material presents to incident sound, the more energy is absorbed. In addition, it is possible to make a material more effective at low frequencies by mounting it with an air space between it and the adjacent wall or ceiling (see Figure 13 and Table 4). Figure 13. Methods of mounting absorbing panels on walls or ceilings:
a) hard mounted b) hanging baffle c) air space behind panel Table 4. Effect of mounting on a 24” x 48” x 1.5” thick fiberglass panel on total absorption
(absorption in Sabins) (data from NIOSH Compendium of Noise Control materials) Frequency - Hz Mounting Configuration 125 250 500 1000 2000 4000 Hanging baffle 4.3 6.6 9.8 13.3 13.6 10.8 Hard mounted on rigid wall (#4 mount) 1.5 3.5 6.2 7.4 6.5 6.2 16” air space (#7 mount) 7.2 6.4 6.0 7.2 6.2 3.6
Air space16”

NOISE CONTROL Room Acoustics 8.17
J. S. Lamancusa Penn State 12/1/2000
8.13 Standing Waves Room modes Placement of sound sources and absorbing material Modal density 8.12 Anechoic Rooms Effectiveness of wedges 8.12 Reverberation Rooms

NOISE CONTROL Room Acoustics 8.18
J. S. Lamancusa Penn State 12/1/2000
8.14 Good and Bad Reflections bad - flutter echo good – early reflections, reflectors in front of classrooms, orchestra shells effect of surface roughness on reflection:
Figure 15. Specular reflection – occurs when the surface roughness length is smaller than the acoustic wavelength (represented by the diameter of the balls)
Figure 16. Diffuse reflection – occurs when the surface roughness length is larger than the acoustic wavelength (represented by the diameter of the balls)

NOISE CONTROL Room Acoustics 8.19
J. S. Lamancusa Penn State 12/1/2000
8.15 Summary Adding absorption is only justifiable if the reverberant field is dominant. Absorption on walls or ceilings will have little or no effect in the direct field, i.e. in the immediate vicinity of a noise source. Design guidelines:
1. To have the greatest effect on total absorption (and the reverberation time), add absorption to the least absorptive areas first.
2. Distribute absorption around the room as much as possible to minimize local effects.
3. Avoid having two parallel walls that are both highly reflective. This can cause a flutter echo.
4. Low frequency absorption (< 250 Hz) is difficult to achieve with porous materials of reasonable thickness. To be effective at low frequency, porous materials must be thick,
Material thickness ≥ 1/4 λ for anechoic (α ≈ 1.0) 5. Low frequency absorption of porous materials can be increased by mounting
them with an airspace behind them. 6. Design the room with non-parallel walls wherever possible to break up
standing waves and flutter echo. 7. Absorption or a diffusing element on the back wall of a room (the wall
directly opposite to the sound source or speaking person) is highly desirable 8. Mount absorbing panels so as to maximize the area exposed to incident
sound 8.16 References 1) Compendium of Materials for Noise Control, NIOSH, 1975, HEW Publication No. 75-
165. 2) Sonic and Vibration Environments for Ground Facilities – A Design Manual, NASA ,
NAS8-11217. 3) Classroom Acoustics, Acoustical Society of America, Architectural acoustics technical
committee, August 2000.