81p. (statistics) - files.eric.ed.gov · pdf filecna document control and ... the monetary...
TRANSCRIPT
ED 429 168
AUTHORTITLEINSTITUTIONSPONS AGENCYREPORT NOPUB DATENOTEAVAILABLE FROM
PUB TYPE
EDRS PRICEDESCRIPTORS
IDENTIFIERS
ABSTRACT
DOCUMENT RESUME
CE 077 861
Garcia, Federico E.; Joy, Ernest H.; Reese, David L.Effectiveness of the Voluntary Education Program.Public Research Inst., Arlington, VA.Department of the Navy, Washington, DC.CRM-98-401998-04-0081p.
CNA Document Control and Distribution, 4401 Ford Ave.,Alexandria, VA 22302-1498; Tel: 703-824-2130 (1 copy free).Numerical/Quantitative Data (110) Reports Research(143)
MF01/PC04 Plus Postage.*Continuing Education; Cost Effectiveness; Higher Education;Labor Turnover; *Military Personnel; *Military Training;*Outcomes of Education; Program Costs; ProgramEffectiveness; Promotion (Occupational); Regression(Statistics) ; Student Attitudes; Student Financial Aid;Tables (Data)*Navy; *Voluntary Participation
The Navy's Voluntary Education (VOLED) program providesoff-duty sailors seeking to enhance their professional and personal growthwith educational opportunities integrating various continuing education.VOLED's four major components are tuition assistance, the Program for AfloatCollege Education (PACE), academic skills learning centers, and educationcenters. Cost-benefit analyses of VOLED's components were conducted byanalyzing the following: tuition assistance data for approximately 510,000students; instructor PACE data (approximately 63,000 records); data ontechnology PACE (approximately 22,000 records); 20,200 files on sailors whoparticipated in orientation briefs on the PACE program, and records for all2,230 courses offered at Navy schoolhouse training facilities during fiscalyear 1996. All VOLED's elements were deemed cost-effective. For each $1invested tuition assistance and instructor PACE, the Navy obtained $2 fromimproved retention. The Navy obtained slightly more than $1 from each $1invested in technology PACE. It was recommended that full support for VOLEDbe maintained and that academic skills investments be accelerated. (Appendedare the following: enlisted training cost, training cost of a rating;estimation of promotion and retention models; regression estimates ofpromotion, retention, and the probability of passing a PACE course; andacademic skills profile. Twenty-six tables/figures are included.) (MN)
********************************************************************************* Reproductions supplied by EDRS are the best that can be made *
* from the original document. *
********************************************************************************

CRM 98-40 / April 1998
Effectiveness of the Vo untaryEducation Program
Federico E. Garcia Ernest H. Joy, CAPT, USN
with David L. Reese
PERMISSION TO REPRODUCE ANDDISSEMINATE THIS MATERIAL HAS
BEEN GRANTED BY
64 ie.C.A
TO THE EDUCATIONAL RESOURCESINFORMATION CENTER (ERIC)
1
U.S. DEPARTMENT OF EDUCATIONOffice of Educational Research and Improvement
EDUCATIONAL RESOURCES INFORMATIONCENTER (ERIC)
This document has been reproduced asreceived from the person or organizationoriginating it.
ID Minor changes have been made toimprove reproduction quality.
Points of view or opinions stated in thisdocument do not necessarily representofficial OERI position or policy.
Center for Naval Analyses4401 Ford Avenue Alexandria, Virginia 22302-1498
2BESTCOPYAVA1LABLE

Approved for distribution: April 1998
Donald J. CyManpower, Personnel, an. Training TeamSupport Planning and Management Division
This document represents the best opinion of CNA at the time of issue.It does not necessarily represent the opinion of the Department of the Navy.
APPROVED FOR PUBLIC RELEASE; DISTRIBUTION UNLIMITEDFor copies of this document, call the CNA Document Control and Distribution Section (703) 824-2130
3 BEST COPY AVAILABLE
Acknowledgment
We would like to thank Fran Kelly, our study sponsor's point of con-tact, for her support and invaluable contributions.
Contents
Summary 1
Background 1
Findings 2
What is the impact on promotion and career?What is the impact on retention? 3
Is VOLED cost-effectiv0 3
How can VOLED services be enhanced? 4Recommendations 5
Introduction 7
Program elements 7
Tuition Assistance 8
Program for Afloat College Education 9
Academic Skills Learning Centers 11
Education centers 12Participation levels 12
Issues 14
Data and methodology 15
Sources of data 15
Tuition Assistance 15
Instructor PACE 15
Technology PACE 16
Other data 16
Method of analysis 17Measuring benefits 19
Accounting for high motivation of participants . 23Measuring costs 24Student performance in PACE 26
Findings 27Impact on promotion and career 27
Promotion 27Cross-rating 28

Example of impact of education andcareer choices 28
Demotion 31Impact on retention 32
College 32Academic skills 33
Is VOLED cost-effective? 33College 35Academic skills 36Comparison with other quality-of-life
(QOL) programs 37Enhancing VOLED services 38
What do Sailors think? 38Impact of counseling 39What is the need for academic skills? 39Student performance 41
Recommendations 44
Appendix A: Enlicted training cost 47
Appendix B: Training cost of a rating 49
Appendix C: Estimation of the promotion andretention models 53
Promotion 53Correcting for selection bias 54Retention 55
Appendix D: Regression estimates of promotion 57
Appendix E: Regression estimates of retention 61
Appendix F: Academic skills profile 65
Appendix G: Regression estimates of the probability ofpassing a PACE course 69
References 73
List of figures 75
List of tables 77
Distribution list 79
ii

Summary
Background
The Voluntary Education (VOLED) Program provides off-duty edu-.cational opportunities integrating a variety of continuing educationprograms to Sailors seeking to enhance their professional and per-sonal growth. VOLED supplements military training and allows Sail-ors to pursue college degrees of their choice. Funding for VOLED is$57.8 million in FY98. VOLED comprises three major instructionalelements: Tuition Assistance, the Program for Afloat College Educa-tion (PACE), and the Academic Skills Learning Centers (ASLCs).
Tuition Assistance covers 75 percent of tuition at colleges, universi-ties, and other schools. The current cap is $2,500 for undergraduatecollege courses and $3,500 for graduate courses. Effective 1 October1998, the cap will be $3,500 for all courses; however, there will be acredit hour cap of $187.50.
PACE offers courses on Navy ships and at selected remote locations.It offers free college as well as academic skills (noncredit remedialmodules) education in English, language arts, reading, math, andbasic science. PACE courses are taught either by onboard instructors(instructor PACE) or through electronic means (technology PACE).
The Academic Skills Learning Centers provide free self-paced soft-ware instruction in reading, writing, math, science, and work skills. Asof March 1998, 14 ASLCs were operational, but the Navy is establish-ing ASLCs at all major installations (about 1 per month), for a totalof 52 by the end of FY01.
About 61,000 active-duty enlisted Sailors-18 percent of the forceparticipated in VOLED in FY97. The total registration of the partici-pants was about 140,000 courses. During FY97, about 3,400 Navy offic-ers received Tuition Assistance; in addition, about 1,300 Marines
rl
1

received PACE instruction aboard Navy ships. By far, Tuition Assis-tance has the largest enrollment of any element of VOLED (77 per-cent of the total enlisted registration).
We built an educational history file for active-duty enlisted Sailors. Wecreated a combined data file of almost 600,000 records covering 1992through 1997.
Findings
What is the impact on promotion and career?
College education through VOLED improves promotion prospectssignificantly. Thirty-one percent of Sailors with no college educationmake it to E5 in 5 years or less. For Sailors with 15 college credits, theprobability increases to 43 percent. For Sailors with 60 college cred-itssufficient to obtain an associate degree in most casesthe proba-bility increases to 66 percent.
Sailors who participate in VOLED are likely to have above-averagemotivation. To account for this, we applied a widely known regressiontechnique that isolates the effect that is directly attributable toVOLED. We can link most of the promotion effect directly to VOLED;however, the high motivation of Sailors taking courses accounts for asmall portion.
Academic skills education helps Sailors retake the Armed ServicesVocational Aptitude Battery (ASVAB) to qualify for Navy ratings forwhich they were not eligible. Eighteen percent of academic skills par-ticipants switch ratings, compared to only 6 percent of those notenhancing their education through VOLED.
In addition to education, what can Sailors do to be more competitive?For Sailors wit.h associate degrees, cross-rating to cryptology, for exam-ple, increases the probability of making E5 in 5 years from 66 percentto 79 percent. This largely reflects the abundance of vacancies in cryp-tology. For Sailors with associate degrees working in cryptology, a 20-percentage-point increase in the proportion of time spent at seaincreases the probability of making E5 in 5 years to 84 percent.
2
Demotion is significantly less likely for Sailors who participated inVOLED than for those who did not. Among academic skills and col-lege participants, only 7 and 6 percent, respectively, were demoted bythe end of their first contract. Among nonparticipants, 14 percentwere demoted. This suggests that education reduces disciplinaryinfractions.
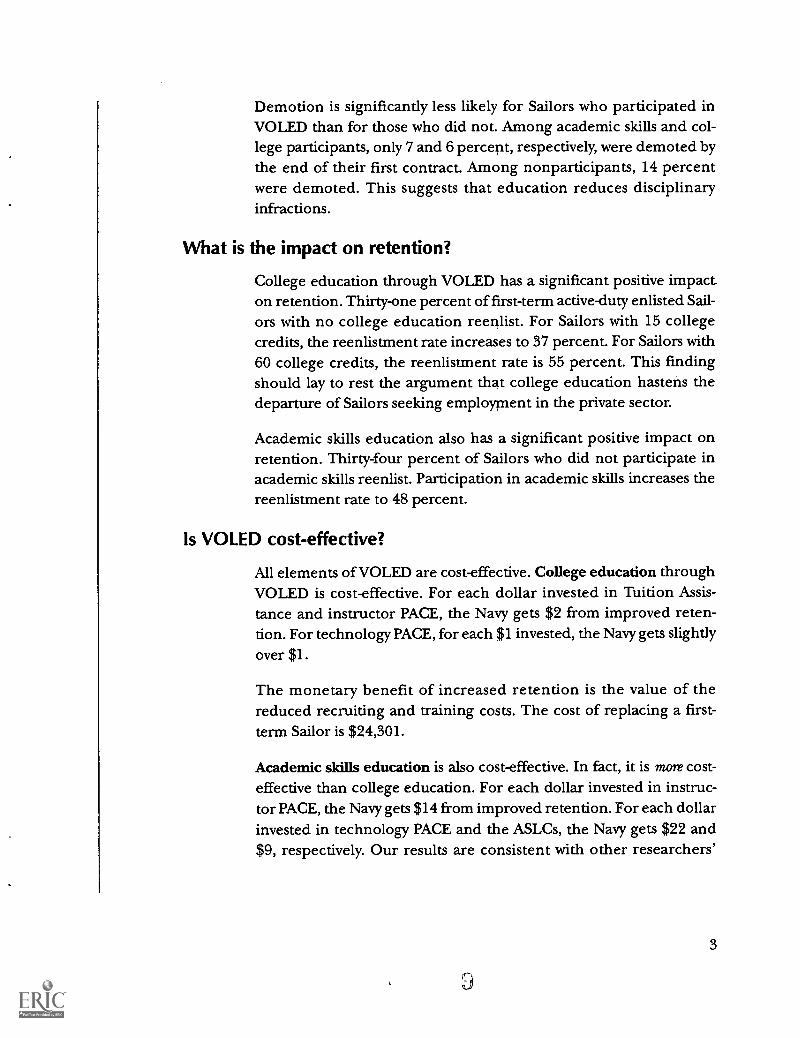
What is the impact on retention?
College education through VOLED has a significant positive impact.on retention. Thirty-one percent of first-term active-duty enlisted Sail-ors with no college education reenlist. For Sailors with 15 collegecredits, the reenlistment rate increases to 37 percent. For Sailors with60 college credits, the reenlistment rate is 55 percent. This findingshould lay to rest the argument that college education hastens thedeparture of Sailors seeking employment in the private sector.
Academic skills education also has a significant positive impact onretention. Thirty-four percent of Sailors who did not participate inacademic skills reenlist. Participation in academic skills increases thereenlistment rate to 48 percent.
Is VOLED cost-effective?
All elements of VOLED are cost-effective. College education throughVOLED is cost-effective. For each dollar invested in Tuition Assis-tance and instructor PACE, the Navy gets $2 from improved reten-tion. For technology PACE, for each $1 invested, the Navy gets slightlyover $1.
The monetary benefit of increased retention is the value of thereduced recruiting and training costs. The cost of replacing a first-term Sailor is $24,301.
Academic skills education is also cost-effective. In fact, it is more cost-effective than college education. For each dollar invested in instruc-tor PACE, the Navy gets $14 from improved retention. For each dollarinvested in technology PACE and the ASLCs, the Navy gets $22 and$9, respectively. Our results are consistent with other researchers'
3
4
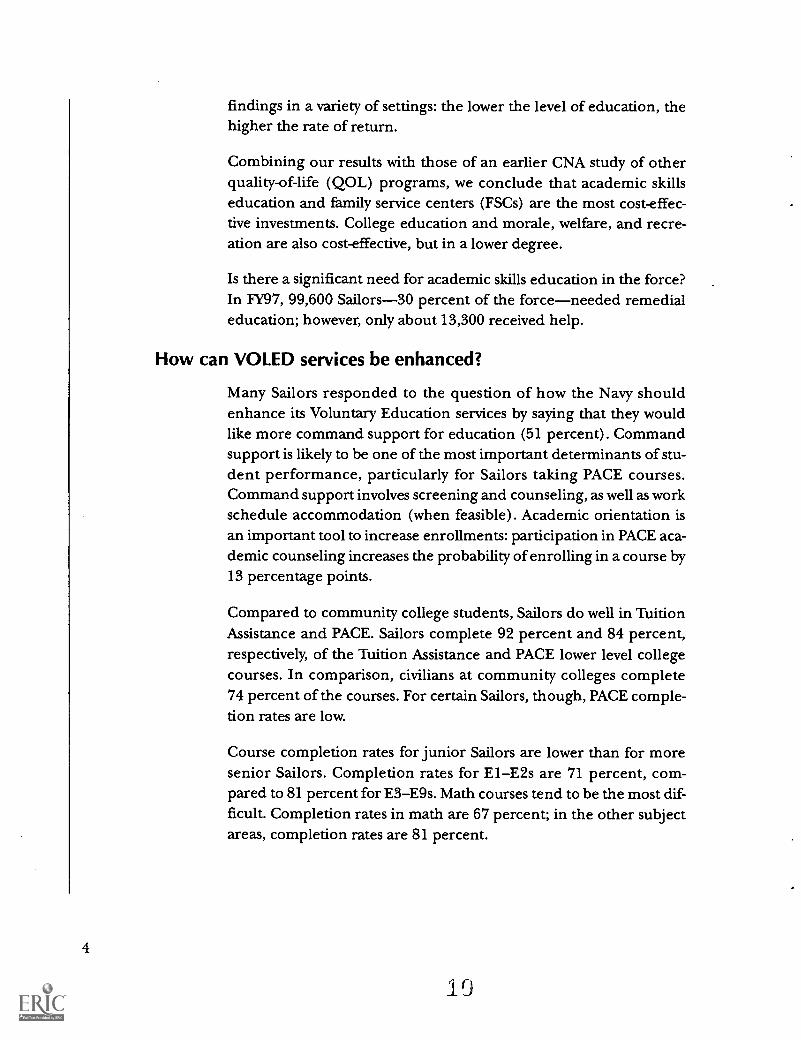
findings in a variety of settings: the lower the level of education, thehigher the rate of return.
Combining our results with those of an earlier CNA study of otherquality-of-life (QOL) programs, we conclude that academic skillseducation and family service centers (FSCs) are the most cost-effec-tive investments. College education and morale, welfare, and recre-ation are also cost-effective, but in a lower degree.
Is there a significant need for academic skills education in the force?In FY97, 99,600 Sailors-30 percent of the forceneeded remedialeducation; however, only about 13,300 received help.
How can VOLED services be enhanced?
Many Sailors responded to the question of how the Navy shouldenhance its Voluntary Education services by saying that they wouldlike more command support for education (51 percent). Commandsupport is likely to be one of the most important determinants of stu-dent performance, particularly for Sailors taking PACE courses.Command support involves screening and counseling, as well as workschedule accommodation (when feasible). Academic orientation isan important tool to increase enrollments: participation in PACE aca-demic counseling increases the probability of enrolling in a course by13 percentage points.
Compared to community college students, Sailors do well in TuitionAssistance and PACE. Sailors complete 92 percent and 84 percent,respectively, of the Tuition Assistance and PACE lower level collegecourses. In comparison, civilians at community colleges complete74 percent of the courses. For certain Sailors, though, PACE comple-tion rates are low.
Course completion rates for junior Sailors are lower than for moresenior Sailors. Completion rates for E1E2s are 71 percent, com-pared to 81 percent for E3E9s. Math courses tend to be the most dif-ficult. Completion rates in math are 67 percent; in the other subjectareas, completion rates are 81 percent.
19

While Sailors perform well in both delivery modes, completion ratesin technology PACE are lower than in the instructor program (com-pletion rates of 77 percent and 84 percent). This does not necessarilyimply that the instructor method is superior. Rather, it reflects otheraspects of the instruction, such as learner style and time managementabilities, as well as student familiarization with technology.
Recommendations
Based on our analysis, we make the following recommendations:
Maintain full support for VOLED, and accelerate academicskills investments. The Navy should reap the rewards ofVOLED by continuing to support it fully. Because the returnson academic skills are especially high and there is a sizableneed for remedial education, the Navy should accelerate itsinvestment in academic skills.
Modify the ASLC contract to promote greater participation.The Navy currently pays a per-center flat fee that is indepen-dent of the number of students. The Navy should pay the ASLCcontractor a fee that is based on enrollments. This would pro-vide the contractor with a greater incentive to be aggressive inpublicizing the centers and to expand working hours throughthe evenings and weekends.
Establish an academic transcript system. To facilitate programassessment and student counseling, the Navy should acceleratethe implementation of the Sailor-Marine/American Councilon Education Registry Transcript (SMART). The transcriptwould list all Navy training and subject tests of DANTES as wellas the results of College Level Examination Program (CLEP)with the corresponsing college credit recommendations. Thetranscript would also list college credits earned through TuitionAssistant and PACE.
Encourage a more supportive command climate. In a newVOLED instruction, the Navy should provide specific guidanceto COs on establishing a supportive command climate for
5
ii
6
education, including the identification, screening, and coun-seling of students.
Limit enrollment of Els and E2s. The Navy should considerlimiting participation of Els and E2s in college courses. Beforeenrollment, Els and E2s should demonstrate potential for aca-demic success. Indicators of potential for success include moti-vation, the ability to work independently, and a minimum Baverage on previous college courses or an ASVAB (arithmeticreasoning plus paragraph comprehension) score of 110 ormore.
12
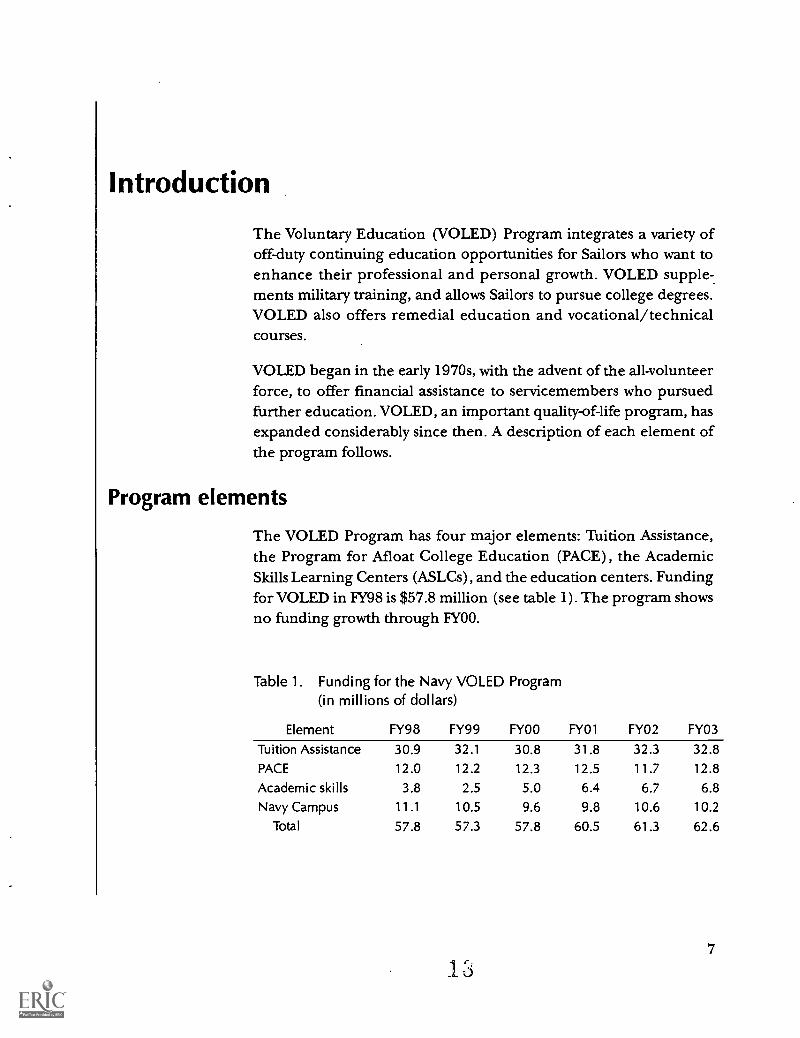
Introduction
The Voluntary Education (VOLED) Program integrates a variety ofoff-duty continuing education opportunities for Sailors who want toenhance their professional and personal growth. VOLED supple-.ments military training, and allows Sailors to pursue college degrees.VOLED also offers remedial education and vocational/technicalcourses.
VOLED began in the early 1970s, with the advent of the all-volunteerforce, to offer financial assistance to servicemembers who pursuedfurther education. VOLED, an important quality-of-life program, hasexpanded considerably since then. A description of each element ofthe program follows.
Program elements
The VOLED Program has four major elements: Tuition Assistance,the Program for Afloat College Education (PACE), the AcademicSkills Learning Centers (ASLCs), and the education centers. Fundingfor VOLED in FY98 is $57.8 million (see table 1). The program showsno funding growth through FY00.
Table 1. Funding for the Navy VOLED Program(in millions of dollars)
Element FY98 FY99 FY00 FY01 FY02 FY03
Tuition Assistance 30.9 32.1 30.8 31.8 32.3 32.8
PACE 12.0 12.2 12.3 12.5 11.7 12.8
Academic skills 3.8 2.5 5.0 6.4 6.7 6.8
Navy Campus 11.1 10.5 9.6 9.8 10.6 10.2
Total 57.8 57.3 57.8 60.5 61.3 62.6
7
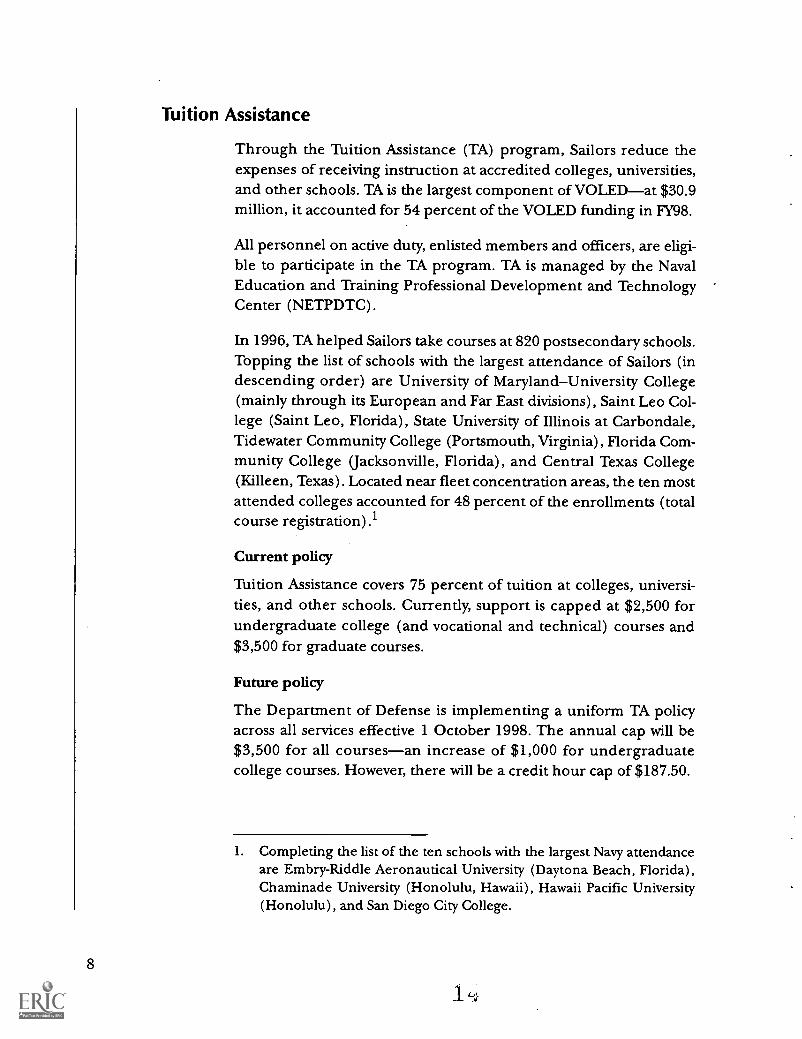
Tuition Assistance
Through the Tuition Assistance (TA) program, Sailors reduce theexpenses of receiving instruction at accredited colleges, universities,and other schools. TA is the largest component of VOLEDat $30.9million, it accounted for 54 percent of the VOLED funding in FY98.
All personnel on active duty, enlisted members and officers, are eligi-ble to participate in the TA program. TA is managed by the NavalEducation and Training Professional Development and TechnologyCenter (NETPDTC).
In 1996, TA helped Sailors take courses at 820 postsecondary schools.Topping the list of schools with the largest attendance of Sailors (indescending order) are University of MarylandUniversity College(mainly through its European and Far East divisions), Saint Leo Col-lege (Saint Leo, Florida), State University of Illinois at Carbondale,Tidewater Community College (Portsmouth, Virginia), Florida Com-munity College (Jacksonville, Florida), and Central Texas College(Killeen, Texas). Located near fleet concentration areas, the ten mostattended colleges accounted for 48 percent of the enrollments (totalcourse registration) .1
Current policy
Tuition Assistance covers 75 percent of tuition at colleges, universi-ties, and other schools. Currently, support is capped at $2,500 forundergraduate college (and vocational and technical) courses and$3,500 for graduate courses.
Future policy
The Department of Defense is implementing a uniform TA policyacross all services effective 1 October 1998. The annual cap will be$3,500 for all coursesan increase of $1,000 for undergraduatecollege courses. However, there will be a credit hour cap of $187.50.
1. Completing the list of the ten schools with the largest Navy attendanceare Embry-Riddle Aeronautical University (Daytona Beach, Florida),Chaminade University (Honolulu, Hawaii), Hawaii Pacific University(Honolulu), and San Diego City College.
8

Program for Afloat College Education
Tuition Assistance primarily helps Sailors on shore duty. The Programfor Afloat College Education (PACE) expands the opportunity ofeducation to Sailors on sea duty. PACE offers courses on Navy shipsand at selected remote locations. It also offers courses to detach-ments, air groups, and squadrons.
Currently, PACE is available on all ships with the exception of reserve,Military Sealift Command, and some support ships. On a ship-by-shipbasis, course offerings are available only at certain times of the yeardepending on operating and maintenance schedules. Courses areusually offered in conjunction with extended deployments or opera-tions at sea but may be conducted in the ship's home port as well.
PACE is free to Sailorsthey pay for books and supplies only. PACEaccounts for 21 percent of the FY98 VOLED funding ($12 million).Middlesex Research Center, a contractor based in Landover, Mary-land, administers PACE.
PACE offers the following types of courses:
College (credit-earning)
Academic skills (noncredit remedial modules) in
English
Language arts
Reading
Math
Basic science.
Placement in college or academic skills courses depends on ASVABscores, previous college or academic skills experience, and placementexams. The contractor tests the crew and determines eligibility. PACEis funded by the Navy, and both ship's company and embarkedMarines are entitled to participate.
As in the other elements of VOLED, participation in PACE is volun-tary. Commanding officers (COs) have the final say regarding thescope of PACE. Dealing directly with the contractor, COs choose the
9
combination of college and academic skills courses they believe bestmeets the needs of their Sailors. COs also request their preference forcourse delivery modeinstructor, electronic, or a combination of thetwo.
Instructor delivery
Instructor delivery fits the bill when enough Sailors want a particularcourse and are able to meet a traditional course timetable. Professorsfrom Central Texas College, an accredited two-year community col-lege, embark with the ship to provide instruction.
Instructor college courses are 48 hours long and cover 8 weeks (in theeast coast) or 6 weeks (in the west coast). Instructor academic skillsmodules are 4 to 5 hours long and cover a 4-week period.
Elecfronic delivery
If berthing is not available for an instructor, instruction is deliveredthrough video, computer interactive video, or CD-ROM.2 Electronicdelivery is also used for Sailors with work shifts that prevent themfrom taking instructor-delivered courses. Electronic delivery allowsSailors to take courses that fit their schedules and to study indepen-dently on their off-watch time. The Navy's position is that Sailors,whenever possible, should have a choice of delivery systems.
At present, the contractor offers a menu of 43 electronic collegecourses ranging from geology to economics. These courses are typi-cally 12 weeks long. The contractor also offers academic skillscourseware. Electronic courses are self-paced but students areexpected to finish before the end of the deployment.
The following universities and colleges offer electronic curricula tothe Navy: Coastline Community College (San Diego, California),Richland Community College (Dallas, Texas), The George Washing-ton University, The University of Maryland, and The University ofOklahoma. Students have no direct interface with professors until
2. On an experimental basis, the Navy recently contracted Old DominionUniversity and Georgia State University for teleconferencing deliveryaboard USS George Washington and USS Carl Vinson. The Navy is alsoexploring instruction through the internet.
10
they turn in the course materials at the end of the term. Designatedofficers on the ship proctor exams and monitor student progress.Sailors earn credits from the school offering the course.
The instructor and the electronic PACE programs are both availablein 30 percent of the ships. Only students who have completed course-work and demonstrated ability to do independent study are regis-tered for the electronic college courses. The extent of the screening,though, varies widely from one ship to another.
Academic Skills Learning Centers
Academic skills courses through PACE serve to redress academic defi-ciencies of Sailors on sea duty. To provide the same opportunity toshore-based Sailors, the Navy is establishing Academic Skills LearningCenters (ASLCs) at all major installations.
ASLCs provide self-paced software instruction in basic academicskills. In October 1997, the Navy contracted TRO Learning to estab-lish and run 52 ASLCs by the end of FY01. As of March 1998, 14ASLCs were operational.3 The contract calls for the activation ofabout one center per month.
The centers, which have from 4 to 12 computers, are staffed by facili-tators who assist students and track their progress. All active duty per-sonnel assigned to the base are eligible to use the ASLCs.
The contractor equips, staffs, and manages each center. It installs soft-ware on a local area network in the subject areas of reading, writing,math, science, and work skills.4 The language arts, math, and readingcoursework consists of lessons covering skill levels ranging fromsecond through twelfth grades. Students attend the ASLCs 1 to 5 daysa week for 2 hours a day.
3. Two pilot ASLCs began operation in October 1994 for 2 years. Based onpromising results, the Navy expanded the program worldwide.
4. ASLC courseware includes Fastrack (language arts, math, and reading).The advanced math offerings are geometry and beginning, intermedi-ate, and advanced algebra. Science offerings are chemistry, physics, biol-ogy, and earth science. The work skills offerred are applied math, dataskills, writing in the workplace, and reading for information.
11
Most students attend the centers to prepare for retaking the ASVABor for taking a college admissions test. Others attend to prepare fortrade school exams. Students need command approval to enroll.
Coursework at the ASLCs is free to Sailors. Funding in FY98 is$3.8 million. It will drop to $2.5 million in FY99 but will increase to $5million in FY00.
Education centers
Education centers provide individual counseling to Sailors abouttheir educational goals as well as program availability and degreerequirements:Civil-service counselors familiarize Sailors with collegeand other education programs available in the geographic area. Edu-cation centers process applications for Tuition Assistance and admin-ister college admission and General Educational Development(GED) tests. Education centers, also known as Navy Campus offices,are found on 60 Navy installations.
Education center counselors help Sailors explore non-traditionaleducation options, such as obtaining college credit for military train-ing. They also help Sailors pursue independent study through theDefense Activity for Non-Traditional Education Support (DANTES)programs.
Participation levels
About 60,800 active-duty enlisted Sailors-18.1 percent of the forceparticipated in the Voluntary Education Program in FY97. Thisincludes Sailors who received Tuition Assistance, or who receivedinstruction through PACE or at ASLCs.5 The total registration of theparticipants was about 140,000 courses (see figure 1).
Also, 3,400 naval officers received Tuition Assistance during the year.In addition, 1,300 Marines received PACE instruction aboard Navyships. Marines made up 7.4 percent and 3.5 percent of the instructorand technology PACE enrollment in FY97, respectively.
5. The enrollment figures account for the fact that some Sailors partici-pated in more than one element of VOLED during the year.
12
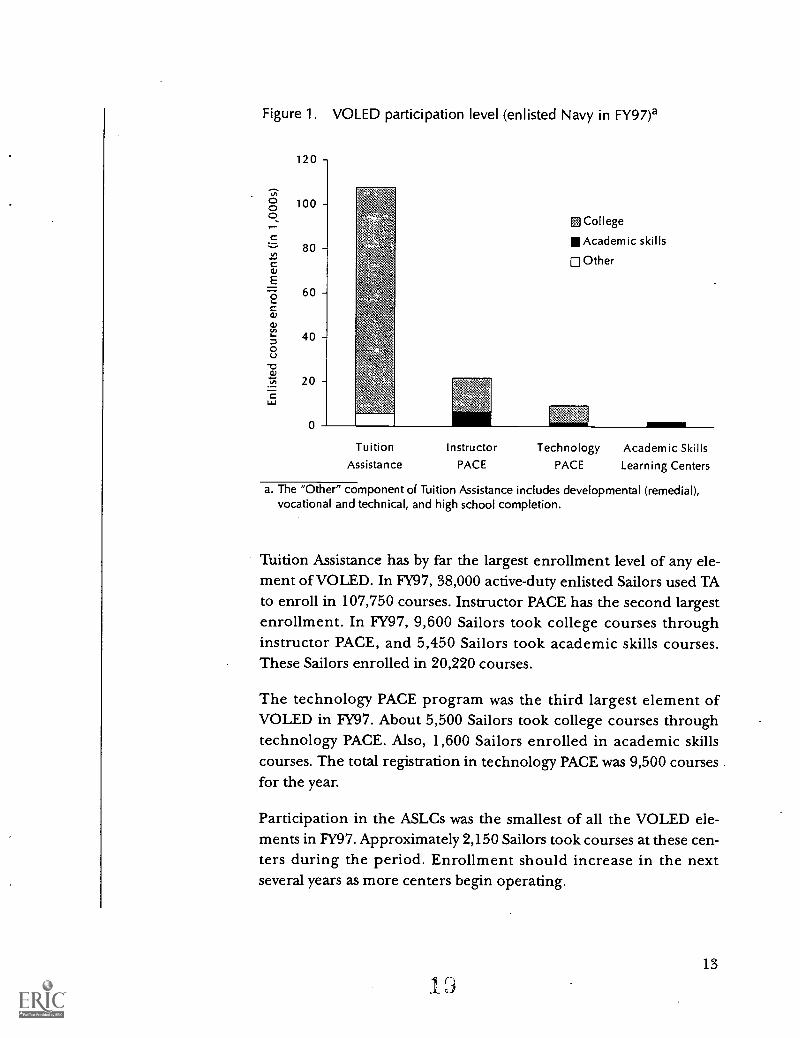
Figure 1. VOLED participation level (enlisted Navy in Fy97)a
120
51 College
III Academic skills
Other
Tuition Instructor Technology Academic SkillsAssistance PACE PACE Learning Centers
a. The "Other" component of Tuition Assistance includes developmental (remedial),vocational and technical, and high school completion.
Tuition Assistance has by far the largest enrollment level of any ele-ment of VOLED. In FY97, 38,000 active-duty enlisted Sailors used TAto enroll in 107,750 courses. Instructor PACE has the second largestenrollment. In FY97, 9,600 Sailors took college courses throughinstructor PACE, and 5,450 Sailors took academic skills courses.These Sailors enrolled in 20,220 courses.
The technology PACE program was the third largest element ofVOLED in FY97. About 5,500 Sailors took college courses throughtechnology PACE. Also, 1,600 Sailors enrolled in academic skillscourses. The total registration in technology PACE was 9,500 courses .
for the year.
Participation in the ASLCs was the smallest of all the VOLED ele-ments in FY97. Approximately 2,150 Sailors took courses at these cen-ters during the period. Enrollment should increase in the nextseveral years as more centers begin operating.
13

Issues
14
The Chief of Naval Personnel has tasked CNA to determine the effec-tiveness of the Voluntary Education Program. We investigated the fol-lowing issues:
What is the impact of VOLED on personnel
Promotion?
Retention?
Which VOLED elements have the greatest long-term benefitfor the Navy?
What is the current academic skills profile of the force?
What factors are associated with successful completion of PACEcourses?
This study conducts a cost-benefit analysis of the VOLED Program. Inan era of shrinking resources and competing demands, it is criticalfor the Navy to determine the return on its investments. This studywill assess the effectiveness of the different instructional elements ofVOLED: Tuition Assistance, PACE, and ASLCs. It will also formulateways to improve the effectiveness of the Navy's VOLED services.
24.1)

Data and methodology
Sou rces of data
We built an educational history file for active-duty enlisted Sailors forAugust 1992 through March 1997. The Navy does not have a central-ized student records system for the different elements of VOLED. Weused the data described below:
Tuition Assistance
The Tuition Assistance data contain individual student and courseinformation and consists of about 510,000 records. The data fields ofrelevance are the course level, credit hours, grade, course cost, autho-rized and collected amounts, course starting and completion dates,and school name.
The data cover all course levels: college (lower- and upper-level under-graduate and graduate), developmental (remedial precollege), voca-tional and technical, and high school. We obtained the TA data fromthe Navy Campus Management Information System (NCMIS), main-tained by NETPDTC. NCMIS supports the administration of theTuition Assistance program.
Instructor PACE
We obtained instructor PACE data, consisting of about 63,000 records,from Central Texas College (CTC). The data fields of relevance arecourse title, credit hours, grade, grade date, and command (ship orremote location). The data include all college and precollege (devel-opmental) courses. It does not include, though, data for the instruc-tor academic skills program. CTC does not maintain data on itsacademic skills courses in electronic format. We used data from tech-nology PACE to analyze academic skills.
15
21
Technology PACE
We obtained data on technology PACE from Middlesex ResearchCenter consisting of about 22,000 records. The data cover both col-lege and academic skills courses and contain the course title, credithours (for college courses), grade or course completion flag, coursestart and end dates, and command.
We did not get data from the Academic Skills Learning Centers.Because most ASLCs had been operating for only a few months, thebreadth of their data was not sufficient to conduct statistical analyses.Thus, here again we relied on technology PACE academic skills datato analyze the ASLCs. The curricula are nearly identical in the twoelements.
Other data
Orientation
We obtained a data file on 20,200 Sailors who participated in informa-tion and orientation briefs on the PACE program. These briefs, con-ducted for the crew over the course of several days, publicize courseofferings. These briefs also help Sailors with degree planning andexpose them to the availability of educational opportunities in theNavy. For example, they explain the process of converting militarytraining to college credits.6
In principle, Sailors who have been exposed to the Voluntary Educa-tion Program through these briefs are more likely to take courses.The data allowed us to flag Sailors who were exposed to the benefitsof the Voluntary Education Program. We obtained this data file fromthe PACE contractor.
6. These briefs also explain the reduced residency requirements underthe Servicemembers Opportunity Colleges, Navy (SOCNAV), a consor-tium of over 1,200 colleges and universities. SOCNAV considers themobile lifestyle of military students and reduces the hassle of transfer-ring credits and meeting residency requirements.
16

Schoolhouse course costs
We obtained data for all 2,230 courses offered at Navy schoolhousetraining facilities during FY96. The data contain bootcamp, A- andC-school, team and fleet, and other training courses. The datainclude the course data processing (CDP) code, course title, length,number of participants, and, more important, detailed course costinformation.
The course cost information is broken down at a great level of detail.This allowed us to select those components that are likely to beaffected by a change in the size of the VOLED program, that is, thecost net of overhead. The course cost components are supplies, con-tracts, depot level repairables, operation of simulators, instructors,curriculum development, construction of new facilities, and generalactivities of the installation. We obtained this data file from NETPDC.We used it to calculate the cost of replacing a Sailor.
Method of analysis
Are all elements of the Voluntary Education program cost-effective?We conduct a cost-benefit analysis of the two main education levels:college and academic skills. We do this for each instructional elementof VOLED: Tuition Assistance, instructor PACE, technology PACE,and Academic Skills Learning Centers. The focus in all our analysesis on active-duty enlisted Sailors. All the benefits and costs are in FY98dollars. For values in previous years, we use the consumer price indexto adjust them.
The cost-benefit analysis calculates the gains and losses resulting fromincreasing college and academic skills enrollments. It measures theinvestment returns on the different elements of the program. Armedwith this information, the Navy should be able to make better deci-sions about the elements of VOLED that merit expanding (or con-tracting). For each education level and program element, wecalculate the investment return, that is, the ratio of benefits to costs.
Following the guidelines from the Office of Management and Budgetfor cost-benefit analyses [1], we do the following:
Focus on incremental benefits and costs. We measure the monetarybenefits and costs of increasing college or academic skills
17

enrollments by 1,000. To determine VOLED's cost-effective-ness, we compare the incremental benefits and costs.
Ignore overhead. We ignore overhead, that is, cost that does notincrease with the enrollment level. For example, we ignore theadministrative costs of running VOLED. We assume that a mod-erate increase in enrollments will not increase the expensesinvolved in processing forms or other administrative activities.We assume that the education centers will handle a moderateincrease in workload using their available resources.
Include opportunity cost of resources. Sailors are not productiveduring training. Our schoolhouse training costs include theforgone productivity of the students. We measure the opportu-nity cost of these personnel by their compensation. In additionto basic pay, our measure of compensation includes retired payaccrual, basic allowance for quarters, basic allowance for subsis-tence, incentive and special pays, permanent change of station,and miscellaneous expenses [2].
Table 2 summarizes the costs and potential benefits of VOLED. Wenow explain our measures of the benefits of the program. We thenexplain how we derived the costs.
Table 2. Benefits and costs of VOLED
Potential benefitsa Costs
Accelerates promotion of Sailors
Lowers demotion chances
Tuition Assistance: authorized amountminus collected amount
PACE: Per-class, per-credit-hour, orindividual course registration feesas well as remote site travel
Helps increase ASVAB scores to Academic Skills Learning Centers:cross-rate per-site fees
Increases reenlistment rateb
a. An additional potential benefit of VOLED is the recruiting impact. Because of lack ofrecent data, we did not include it.
b. We calculated the monetary value of reduced recruiting and training costs resultingfrom a higher reenlistment rate.
18
Measuring benefits
As in most cost-benefit analyses, the monetary benefits of VOLEDinvestments are not fully measurable. For some of the benefits ofVOLED, no direct monetary value is available. In these cases, we pro-vide nonmonetary measures of their effect. In particular, we assess theimpact of participation in VOLED on the rates of promotion, demo-tion, and ability to cross-rate.
We also analyze the impact of VOLED participation on retention. By.extrapolating the impact on retention, we are able to quantify thereduction in recruiting and training costs. We calculate the cost ofreplacing a Sailor, which enables us to quantify the monetary benefitof VOLED.
We may not be capturing all the benefits of VOLED, however. Forexample, Sailors with inadequate reading skills may be a work safetyhazard. If so, academic skills education may be beneficial in reducingworkplace accidents. We did not measure this effect.
Promotion
We investigated the effect of participation in the Voluntary EducationProgram on promotion using regression analysis. We tested whetherSailors enhancing their careers with college education are more likelyto make it to E5 in their first 5 years of service. We merged the VOLEDdata files to the Enlisted Master Record to obtain information aboutSailors' personal and career characteristics, such as AFQT score andrating.
Our promotion sample consists of all enlisted active-duty cohorts thataccessed in the last two quarters of FY92 (8,112 observations). Weselected the last two quarters of the fiscal year to track the promotionpath of Sailors who joined the Navy up to 6 months apart.
Demotion
Are VOLED participants less likely to get demoted? VOLED may keepsome Sailors away from disciplinary troubles. To analyze demotion,we tracked the FY92 cohort of active-duty enlisted Sailors (4-year
19
2 QJ
obligors) through the end of their first term to compare the demo-tion rates of participants and nonparticipants.
Cross-rating
One of the main reasons for Sailors to enroll in academic skillscourses is to retake the ASVAB. Higher ASVAB scores give them asecond chance to qualify for A-school. We determined whether aca-demic skills participants are, on average, more likely to change rat-ings. We focused on changes in rating after being rated; that is, we didnot include GENDETs getting rated.
Retention
To analyze retention, we tracked the FY92 cohort of 4-year obligors(GENDETs and school guarantee personnel) through their first reen-listment decision (24,756 observations). Our measure of retentionincludes reenlistments and extensions of more than a year. Sailorswho did not reenlist include those who left before and on completionof their contracts. We estimated VOLED's impact on retention usingregression analysis.
We measured all time-varying variables, including educational attain-ment, at the decision date (reenlistment or attrition). The monetarybenefit of increased retention is the value of the reduced recruitingand training costs.
Recruiting benefits. Recruiting benefits include special recruit incen-tives, advertising, training and pay of staff, communications, andrecruiting support. Based on data from Navy Recruiting Command,we calculated the average cost of recruiting a Sailor to be $5,164. Thisfigure excludes overhead.7
Training benefits. Training benefits encompass bootcamp and a pro-rate of A-school and apprenticeship, C-school, and team and fleettraining. The training benefits include:
7. We subtracted the overhead by multiplying the total recruiting cost bythe proportion of recruit training cost that is variable (74.5 percent).We did this to obtain an estimate of recruiting cost net of overhead.
20
Student compensation
Instruction
Supplies
Contracts
Depot level repairables
Operation of simulators
Lodging and meals (where applicable)
Travel (where applicable).
Our training benefits are somewhat conservativewe did not want tooverestimate the retention benefits of VOLED. We did not includethe following training cost components in the training benefits:instructors, construction of new facilities, general activities of theinstallation, and curriculum development. A moderate reduction intraining requirements would not a.ffect these activities.8 Appendix Acontains the enlisted training cost by training type.
We calculated the cost of bootcamp using cost data from NETPTDC.Bootcamp, conducted at the recruiting training center in GreatLakes, costs $6,668 for every recruit.
The next step was to calculate the cost of individual ratings and NECs.How did we do that? We mapped the courses needed to obtain eachrating and NEC. We then matched the course costs to get the cost oftraining a Sailor in each rating and NEC. Here again, we used thecourse cost data from NETYI'DC.
We calculated the cost of training a Sailor as a weighted average of theratings as of the last quarter of FY97. We used the distribution ofstrength in each rating of the FY92 cohort at the first contract deci-sion point.
8. The number of instructors varies stepwise with the number of students.A small decrease in the number of students (say, of one per class) is notlikely to reduce the requirement of instructors. Again, we avoided over-estimating the retention benefits of VOLED.
21
How much does it cost to train a Sailor for a rating? The FY98 cost oftraining a Sailor for a rating ranges from $1,330 for a boatswain'smate to $49,290 for an electronics technician (nuclear-powered sub-marine or surface warfare). We assigned the average cost of the ratinggroup to ratings with missing cost data (11 ratings). The overall aver-age cost of a rating is $12,491.9 Appendix B contains the training costfor each enlisted rating (in FY96 dollars).
How much does it cost to train a Sailor for an NEC? As for ratings, thecost of NECs varies greatly. The NEC cost ranges from $746 for NEC9512 (3-M system coordinator) to $80,866 for NEC 1320 (Trident MK-118 combat control system maintenance technician). We were able tocalculate the cost of 560 NECs. For the rest, we assigned the averageNEC cost of $11,098.
For Sailors who did not attend A-school, we assigned the cost ofapprenticeship training. We calculated the cost of apprenticeshiptraining to be $1,707. Also, for every Sailor, we added the average costof fleet and team training. The average costs of team and fleet train-ing are, respectively, $426 and $890.
What is the cost of replacing a Sailor? The cost of replacing a first-term Sailor is $24,301. We obtained this figure by adding the costs ofrecruiting, bootcamp, A-school for Sailors with a rating at their reen-listment or attrition point (71 percent), and apprenticeship for therest. We also added the NEC cost for Sailors who had earned one atreenlistment (35 percent), and we assumed that each Sailor had par-ticipated, on average, in one team training and one fleet trainingactivity.19 Table 3 summarizes the components of the cost of replacinga Sailor.
9. For ratings with no A-school, such as boatswain's mate, we used the costof apprenticeship training. For the medical ratings (hospitalman anddental technician), no cost data were available. We assigned them theaverage rating cost.
10. We took into account that 8.0 percent of GENDETs get rated, so thatthey cost the Navy in both apprenticeship and A-school training. We alsoconsidered that 3.1 percent of Sailors had a second NEC atreenlistment
22

Table 3. Cost of replacing a Sailor'
Cost ($)
Recruiting 5,164Bootcamp 6,668
A-school/apprenticeship 6,902
C-school 4,251
Team training 426Fleet training 890
Total 24,301
a. FY98 average of first-term Sailors. It takes intoaccount the proportion of Sailors who havegone through each type of training at the end ofthe first term.
Accounting for high motivation of participants
Because we were unable to measure individual motivation, we did notfactor it directly in our analysis. It is likely, though, that Sailors whoparticipate in VOLED have above-average motivation. It is possible,for example, that VOLED participants would do well in promotioneven if they had not pursued further education. If that is the case, wewould overestimate the effect of VOLED on promotion. That is, wewould capture the effect that is directly attributable to VOLED com-bined with what is attributable to the high motivation of these Sailors.
This analytical problem is known as "selection bias." We corrected forit, which allowed us to separate the effect that is directly attributableto VOLED and that which is attributable to the high motivation ofparticipants.
In the case of retention, though, Sailors who decide to participate inVOLED may be those with unobserved characteristics that inclinethem to leave the Navy in high proportions. If that is the case, not cor-recting for selection bias would lead to an underestimate of the reten-tion impact.
Solution
To account for the high motivation ofVOLED participants, we applieda regression technique that isolates the promotion and retention
23
effects directly attributable to VOLED. This widely known techniqueconsists of estimating the impact of VOLED on promotion or reten-tion in two stages:
1. Decision to participate in VOLED
2. Impact of participation on promotion or retention.
Appendix C provides details about our method for estimating thepromotion and retention effects of VOLED.
What did we factor in?
In our regression analyses of promotion and retention, we factored inthe following variables:
AFQT score
Sea experience
Age
Marital status
Rating group
Degree of vacancies in the rating (promotion)
Selective reenlisted bonus (SRB) multiple (retention).
(Appendices D and E, which contain the regression results, specifythe variables we used for promotion and retention.)
Measuring costs
Tuition Assistance
By course level, we calculated the cost of Tuition Assistance based onthe 1996 authorized amount.11 To obtain the net cost, we subtractedan estimate of the amount that Sailors would refund to the Navy for
11. We estimated the authorized amount allowing for the conditions thatwill prevail under the new DOD policy effective 1 October 1998. In par-ticular, we imposed for a $3,500 per-participant annual cap and a$187.50 per-credit cap.
24
failed courses. Through a written agreement, the Navy requires a fullrefund for failed TA courses (with some exceptions).
We estimated the refunded TA based on recent course failure and col-lection rates. The college TA failure rate for enlisted Sailors was 7.3percent in 1996. NETPDTC, the TA manager, successfully collects71.3 percent of owed college funds.12 We divided the net cost of TAby the enrollments to obtain the cost per individual course.
PACE
In the instructor program, the contractor currently receives $1,630for each academic skills class and $809 for each college credit hour.These fees are independent of the number of students. In the tech-nology program, the contractor currently receives $154 and $302 foreach individual academic skills and college course registration,respectively. We multiplied the fees by the number of units on whichthey are based (classes, credit hours, or individual course registra-tion). We added the cost of instructor travel and hazard, $500, to eachinstructor course.13
Academic Skills Learning Centers
We calculated the cost of a course at the ASLCs based on the per sitecontractual fees. The Navy pays $106,800 for CONUS centers and$111,360 for OCONUS centers annually. We obtained a weightedaverage of the per-site fees based on the location of the centers. Whenall 52 centers are operational, 75 percent of them will be in CONUS.Based on current enrollments, we assumed an average number of 300Sailors participating at each center annually.
12. This is based on the 1993 owed amount that had been collected by April1997. This allowed NETPTDC for at least 3 years to collect the owedfunds. We assume that after 3 years, any additional collected amount isnegligible.
13. For technology PACE courses, the Navy pays about $500 per commandfor remote site travel. A moderate increase in enrollments would resultin some additional courses offered, but not necessarily an increase inthe number of commands involved. Because the cost to the Navy wouldnot change, we did not include the remote travel to the cost of the tech-nology PACE program.
25

26
Student performance in PACE
What factors are associated with successful completion of PACEcourses? The answer may facilitate efforts to enhance student screen-ing and counseling. Here again, "selection bias" may arise becausemany of the electronic courses are upper level and may be moredemanding than many of the instructor courses. They may have char-acteristics that make them difficult and that we are not able to factorinto our analysis, such as the need for greater individual timemanagement.
Using data on college-level PACE courses taken by active-duty enlistedSailors during July 1995 through May 1996 (11,101 observations), weconducted the analysis in two stages:
1. The probability of receiving instruction electronically (asopposed to from an instructor).
2. The factors that determine the successful completion of PACEcourses, including paygrade, subject area, and delivery mode.
We used the results of the first regression to compute a correctionfactor for selection bias. This allows us to estimate stage 2 free of selec-tion bias.
3r)

Findings
Impact on promotion and career
Promotion
Thirty-one percent of Sailors with no college education throughVOLED make it to E5 in 5 years or less. For those who earned collegecredits through VOLED, promotion prospects are significantly better.For example, from our regression results we see that, for Sailors with15 college credits, the chances of making E5 in 5 years increase to 43percent (see figure 2). (Appendix D contains our estimates of thepromotion regression.)
Figure 2. Effect of VOLED participation on promotiona
80 -
70 -
60
50 -
40 -
30 -
20 -
10 -
0
0 Attributable to high quality of VOLED participants
Directly attributable to VOLED
0 Baseline: No college
31
43
51
58
66
0 15 30 45
College credits accumulated through VOLED
a. FY92 cohort tracked for five years. Based on regression analysis.
3 3
60
27

As Sailors' involvement in VOLED increases, their promotion pros-pects improve. For Sailors with 60 college creditssufficient to obtainan associate degree in most casesthe chances of making E5 in 5years are 66 percent. Most of the promotion effect is directly attribut-able to VOLED, though the high motivation of Sailors who decide totake courses accounts for a small portion of the promotion impact.
College education, then, helps Sailors promote faster. It helps Sailorsget better evaluations from their supervisorslikely a result ofimproved work performance. College education may also help Sailorsscore higher on the advancement rating tests. We base these conclu-sions from tracking the FY92 cohort for 5 years. Academic skills edu-cation, which helps Sailors with deficiencies to catch up, does nothave a direct impact on promotion.
Cross-rating
One of the main reasons Sailors participate in academic skills is toretake the ASVAB. Higher ASVAB scores qualify them for A-schooltraining for which they were not originally eligible.
Academic skills participants are 3 times as likely to cross-rate as thosenot participating in the Voluntary Education Program (see figure 3).Eighteen percent of academic skills participants switch ratings, com-pared to only 6 percent of those not enhancing their educationthrough VOLED. These figures, based on the FY92 cohort tracked for5 years, do not include GENDETs getting rated.
Academic skills education, therefore, serves as a bootstrap for Sailorsretaking the ASVAB to get a better Navy job. It helps Sailors qualify forNavy ratings for which they were not eligible and enables Sailors torefresh or upgrade their skills in preparation for further education.
Example of impact of education and career choices
We have shown that Sailors can enhance their promotion chances bypursuing college education. Is there anything else Sailors can do to bemore competitive? Yes.
28
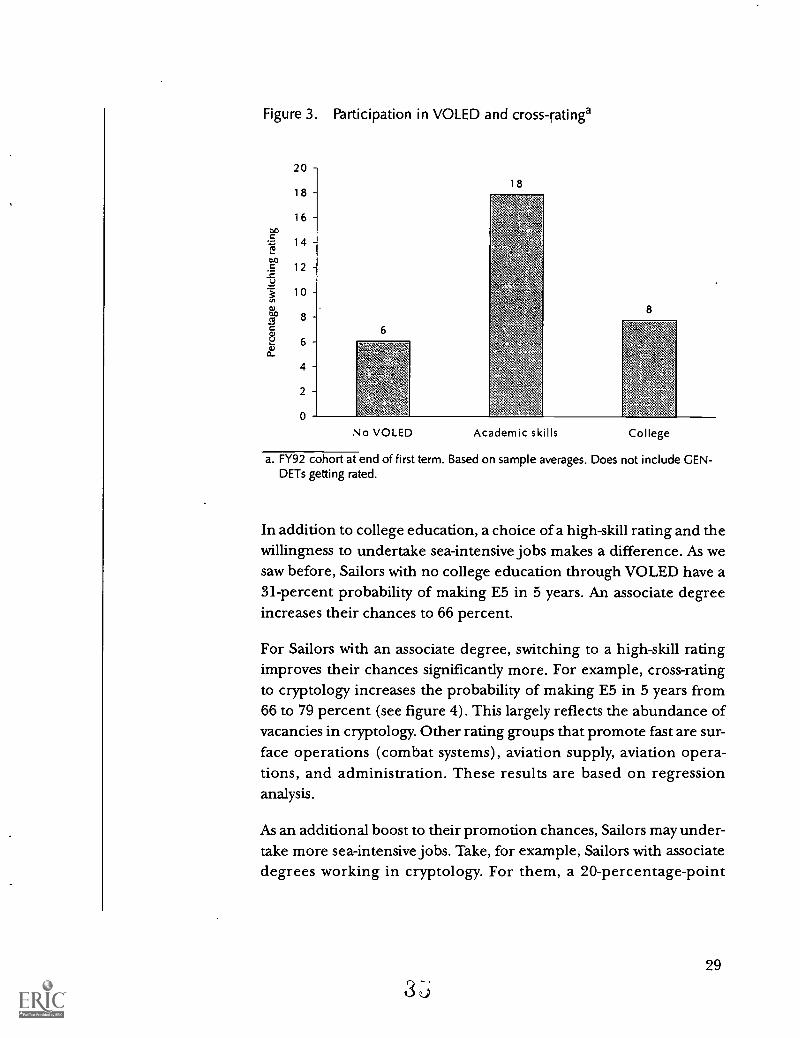
Figure 3. Participation in VOLED and cross-ratinga
20
18
16
14
12
10
18
8
No VOLED Academic skills College
a. FY92 cohort at end of first term. Based on sample averages. Does not include GEN-DETs getting rated.
In addition to college education, a choice of a high-skill rating and thewillingness to undertake sea-intensive jobs makes a difference. As wesaw before, Sailors with no college education through VOLED have a31-percent probability of making E5 in 5 years. An associate degreeincreases their chances to 66 percent.
For Sailors with an associate degree, switching to a high-skill ratingimproves their chances significantly more. For example, cross-ratingto cryptology increases the probability of making E5 in 5 years from66 to 79 percent (see figure 4). This largely reflects the abundance ofvacancies in cryptology. Other rating groups that promote fast are sur-face operations (combat systems), aviation supply, aviation opera-tions, and administration. These results are based on regressionanalysis.
As an additional boost to their promotion chances, Sailors may under-take more sea-intensive jobs. Take, for example, Sailors with associatedegrees working in cryptology. For them, a 20-percentage-point
29
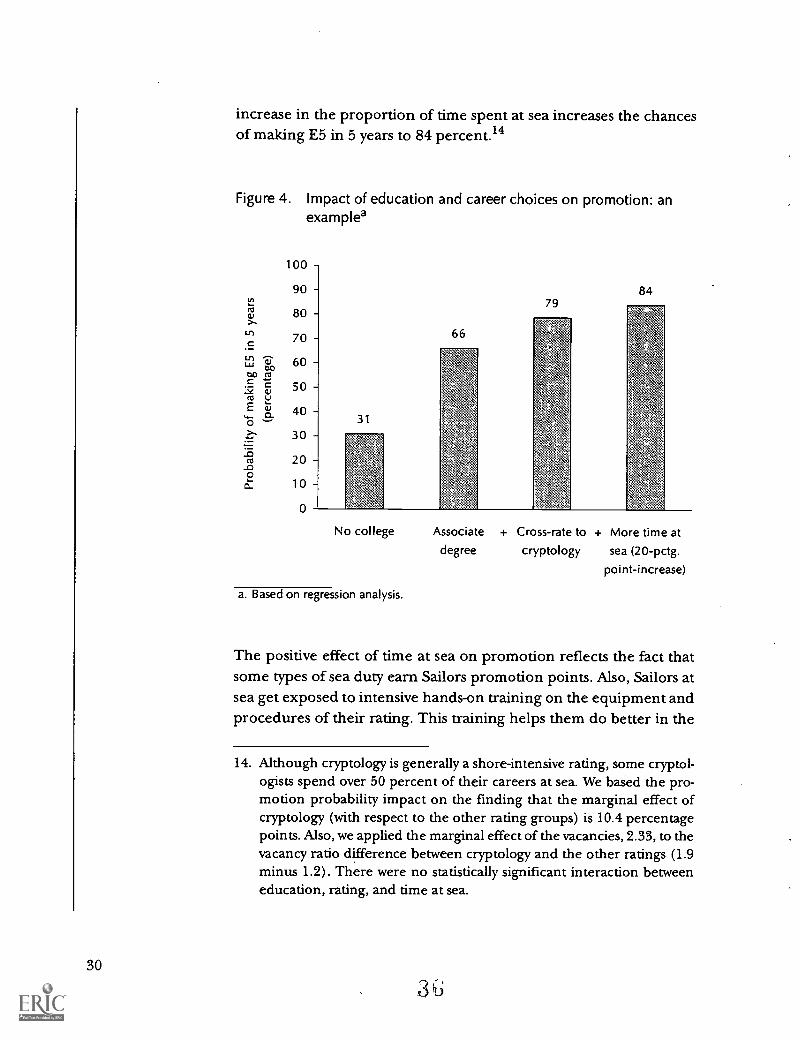
increase in the proportion of time spent at sea increases the chancesof making E5 in 5 years to 84 percent."
Figure 4. Impact of education and career choices on promotion: anexample'
100
90
t.9 80
L.r) 70
LU 11-1 60tto
7, 50u
E 40c_o
30:13 202 10
0
No college
a. Based on regression analysis.
Associate + Cross-rate to + More time atdegree cryptology sea (20-pctg.
point-increase)
The positive effect of time at sea on promotion reflects the fact thatsome types of sea duty earn Sailors promotion points. Also, Sailors atsea get exposed to intensive hands-on training on the equipment andprocedures of their rating. This training helps them do better in the
14. Although cryptology is generally a shore-intensive rating, some cryptol-ogists spend over 50 percent of their careers at sea. We based the pro-motion probability impact on the finding that the marginal effect ofcryptology (with respect to the other rating groups) is 10.4 percentagepoints. Also, we applied the marginal effect of the vacancies, 2.33, to thevacancy ratio difference between cryptology and the other ratings (1.9minus 1.2). There were no statistically significant interaction betweeneducation, rating, and time at sea.
30
advancement tests. Also, it is a requirement that Sailors be at sea toearn combat skills insignia. In addition, Sailors at sea have a betterchance of getting medals. Combat skills insignia and medals earn Sail-ors promotion points.
Demotion
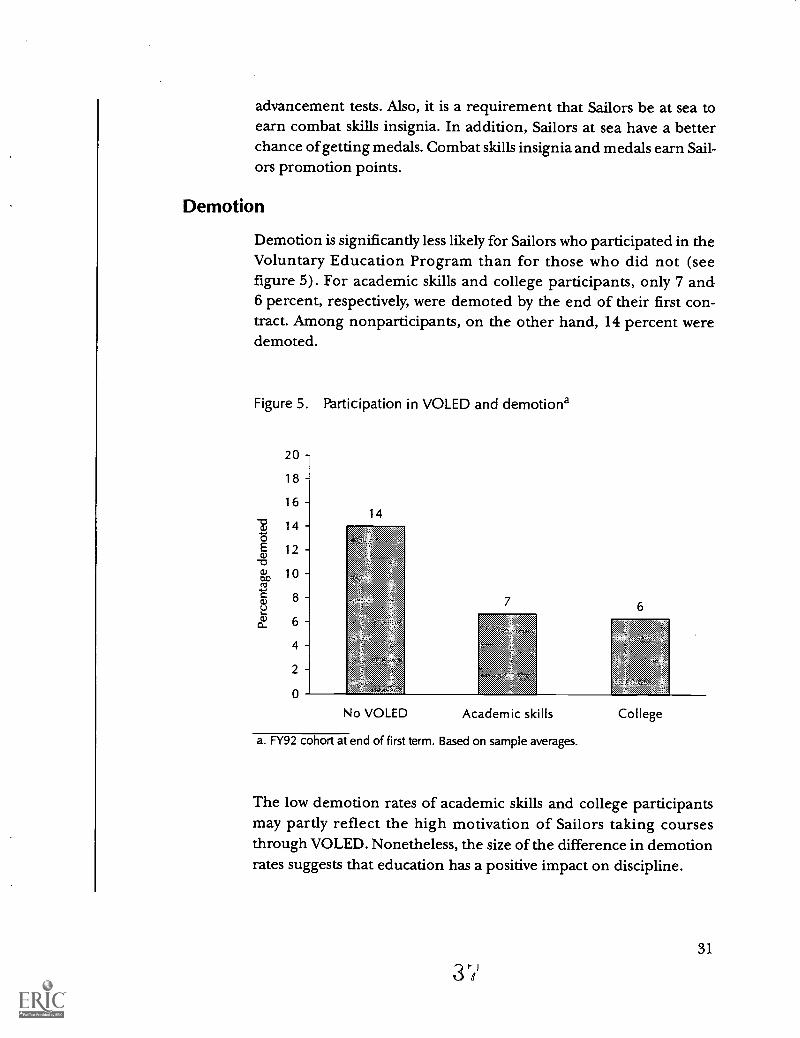
Demotion is significantly less likely for Sailors who participated in theVoluntary Education Program than for those who did not (seefigure 5). For academic skills and college participants, only 7 and-6 percent, respectively, were demoted by the end of their first con-tract. Among nonparticipants, on the other hand, 14 percent weredemoted.
Figure 5. Participation in VOLED and demotiona
20 -
18
16
14 -
12 -
10 -
8
6
4
2
0
14
7
Academic skills
a. FY92 cohort at end of first term. Based on sample averages.
6
College
The low demotion rates of academic skills and college participantsmay partly reflect the high motivation of Sailors taking coursesthrough VOLED. Nonetheless, the size of the difference in demotionrates suggests that education has a positive impact on discipline.
31
3' '
Impact on retention
College
32
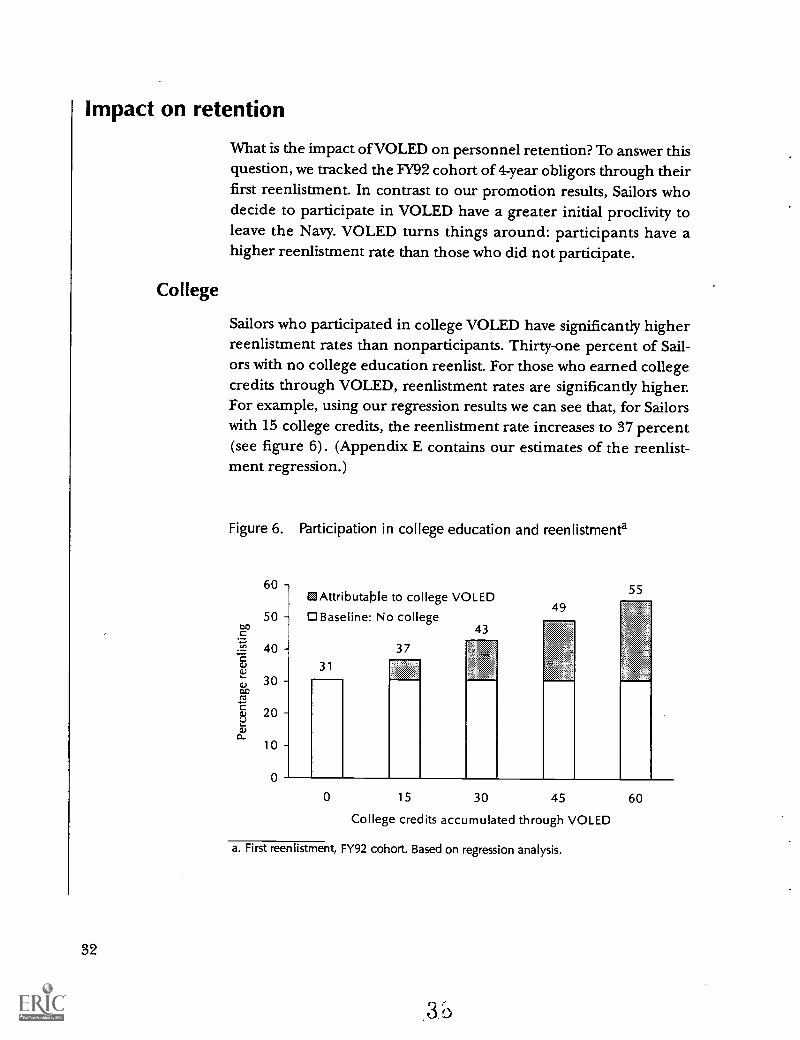
What is the impact of VOLED on personnel retention? To answer thisquestion, we tracked the FY92 cohort of 4-year obligors through theirfirst reenlistment. In contrast to our promotion results, Sailors whodecide to participate in VOLED have a greater initial proclivity toleave the Navy. VOLED turns things around: participants have ahigher reenlistment rate than those who did not participate.
Sailors who participated in college VOLED have significantly higherreenlistment rates than nonparticipants. Thirty-one percent of Sail-ors with no college education reenlist. For those who earned collegecredits through VOLED, reenlistment rates are significantly higher.For example, using our regression results we can see that, for Sailorswith 15 college credits, the reenlistment rate increases to 37 percent(see figure 6). (Appendix E contains our estimates of the reenlist-ment regression.)
Figure 6. Participation in college education and reenlistmenta
60
50
0 Attributable to college VOLED49
0 Baseline: No college43 ,
55
40 - 37 '``t:$;31
30 -
20
10
0
0 15 30 45 60
College credits accumulated through VOLED
a. First reenlistment, FY92 cohort. Based on regression analysis.

As Sailors' involvement in college education increases, their reenlist-ment rates also increase. For Sailors with 60 college credits, the reen-listment rate is 55 percent.
Sailors accumulating 60 college credits or more (who are thereforeeligible for associate degrees in most cases) are significantly morelikely to stay in the Navy. This finding should lay to rest the argumentthat college education hastens the departure of Sailors seekingemployment in the private sector.
Academic skills
Sailors who participated in academic skills also have significantlyhigher reenlistment rates than nonparticipants. Thirty four percentof Sailors who did not participate in academic skills reenlist. Partici-pation in academic skills increases the reenlistment rate to 48 percent(see figure 7) .15
Is VOLED cost-effective?
Figure 8 shows the cost per individual course completion for the dif-ferent VOLED courses. These costs reflect the course completionrates. For two equally costly courses, the cost per course completion ishigher for that with the poorest completion rate.
VOLED is low in cost. The cost per course completion is under $500for all courses. At $475, technology PACE college is the most expen-sive. This reflects its relatively high contractual fees as well as lowercompletion rates. At $185, instructor PACE college is the leastexpensive.
We now show the results of a cost-benefit analysis of the instructionalelements of VOLED.
15. The marginal effect we used to assess the impact of "academic skills" isa weighted average of the marginal effects of technology PACE aca-demic skills and instructor PACE and Tuition Assistance developmental(remedial) education. The weights are based on the FY97 enrollments:23 percent for the technology PACE academic skills and 67 percent forthe instructor PACE and Tuition Assistance developmental education.
3 33

Figure 7. Participation in academic skills and reenlistmenta
60
50
40
30 -
20
10 -
0
01 Attributable toacademic skills
34
48
No academic skills Academic skills
a. First reenlistment, FY92 cohort. Based on regression analysis.
Figure 8. Cost per course completiona
1,000
900
800 -
700
600Z4
ig 500u
400
300
200
100
0
College Academic skills
Instructor Technology TuitionPACE PACE Assistance
Instructor TechnologyPACE PACE
a. FY98 dollars. Because we did not get course completion data for the Academic SkillsLearning Centers, we did not calculate their cost per completion.
34

College
Is college education a cost-effective investment for the Navy? Figure 9summarizes our cost-benefit analysis of college education throughVOLED. For each element, it shows the benefits and costs of increas-ing enrollments by 1,000 (in FY98 dollars).
Figure 9. Benefits and costs of increasing college enrollments by 1,000-
(in FY98 dollars)
Cost
El Recruiting
o Bootcamp
EI Training
Tuition Assistance I Benefits-to-cost ratio
Instructor PACE
Technology PACE
Cost
(1,000,000) (500,000)
1110 500,000
2:1
2:1
1:1
Benefits
1,000,000
College education through Tuition Assistance, instructor PACE, andtechnology PACE is cost-effective. In each case, the benefits exceedthe cost. For each dollar invested in Tuition Assistance and instructorPACE, the Navy gets $2 from improved retention.
The technology PACE program is also cost-effective, but to a lesserdegree. For each $1 invested in the technology PACE program, theNavy gets slightly over $1 in return. In order of magnitude, the bene-fits from improved retention result from the reduction in the require-ments for training (A- and C-school and team and fleet training),bootcamp, and recruiting.
35

36
Academic skills
Is remediation through academic skills a cost-effective investment forthe Navy? Figure 10 summarizes our cost-benefit analysis of academicskills. For each element providing academic skills, it shows the bene-fits and costs of increasing enrollments by 1,000 (in FY98 dollars).
Figure 10. Benefits and costs of increasing academic skills enrollment by1,000 (in FY98 dollars)
Cost
0 Recruiting
o Bootcamp
STraining
Cost
Instructor PACE
Technology PACE
Academic Skills Learning Centers
Benefits-to-cost ratio
14:1
22:1
9:1
Benefits
(1,000,000) 0 1,000,000 2,000,000 3,000,000 4,000,000
Academic skills through instructor PACE, technology PACE, and theAcademic Skills Learning Centers is cost-effective. Furthermore, aca-demic skills is more cost-effective than college education. For eachdollar invested in instructor PACE, the Navy gets $14 from improvedretention. For each dollar invested in the technology PACE programand the ASLCs, the Navy gets $22 and $9, respectively.
Our finding that VOLED is cost-effective is consistent with a 1989study of PACE [3]. It found that participation in college PACE has apositive impact on retention. It also found that, for a 5-percentage-point increase in the reenlistment rate, the college PACE program iscost-effective. Our results are also consistent with a 1988 study of
4 2
Tuition Assistance in DOD [4]. This study found positive relationshipsbetween college TA and promotion and retention rates. These twostudies, though, did not analyze academic skills education.
Our results are also consistent with other researchers' findings in avariety of settings. In studies of country-wide education investment,including in the United States, they have repeatedly found that thereturns on education are positive for all education levels [5]. Moreimportant, they have found that basic (primary) education earns thehighest rate of return: The lower the level of education, the higher therate of return.
Comparison with other quality-of-life (Q0L) programs
An earlier CNA study [6] conducted a cost-benefit analysis of otherQOL programs, including family service centers (FSCs) and morale,welfare, and recreation (MWR). FSCs provide programs in personalfinancial management, deployment assistance, relocation assistance,and individual and family counseling. FSCs also provide programs forexceptional family members, parent education, crisis intervention,and information and referral. MWR, on the other hand, includes phys-ical fitness centers and gyms, youth programs and outdoor recreation,clubs, bowling alleys, and exchanges.
The study concluded that the FSC and MWR programs have retentionbenefits that exceed program costs. It demonstrated a tangible benefitto QOL programs by linking use and satisfaction data from a bODsurvey to actual retention data from CNA's Navy personnel files.16
Combining our results with those of the earlier CNA study, we con-clude the following:
16. As in VOLED, there is sample selection in participation in the FSC andMINR programs. Because the earlier CNA study did not have the exten-sive data we have, including a variable that affects program participationbut not retention, the authors were not able to make a correction forsample selection. The earlier study also analyzed childcare and housing,but the survey questions for these programs were not complete enoughto allow for definitive conclusions.
37
Most cost-effective. Academic skills and FSCs are the most cost-effective QOL investments.
Cost effective but in lower magnitude. College education and MWRare also cost-effective, but not to the same degree as academicskills and FSCs.
Enhancing VOLED services
38
What do Sailors think?
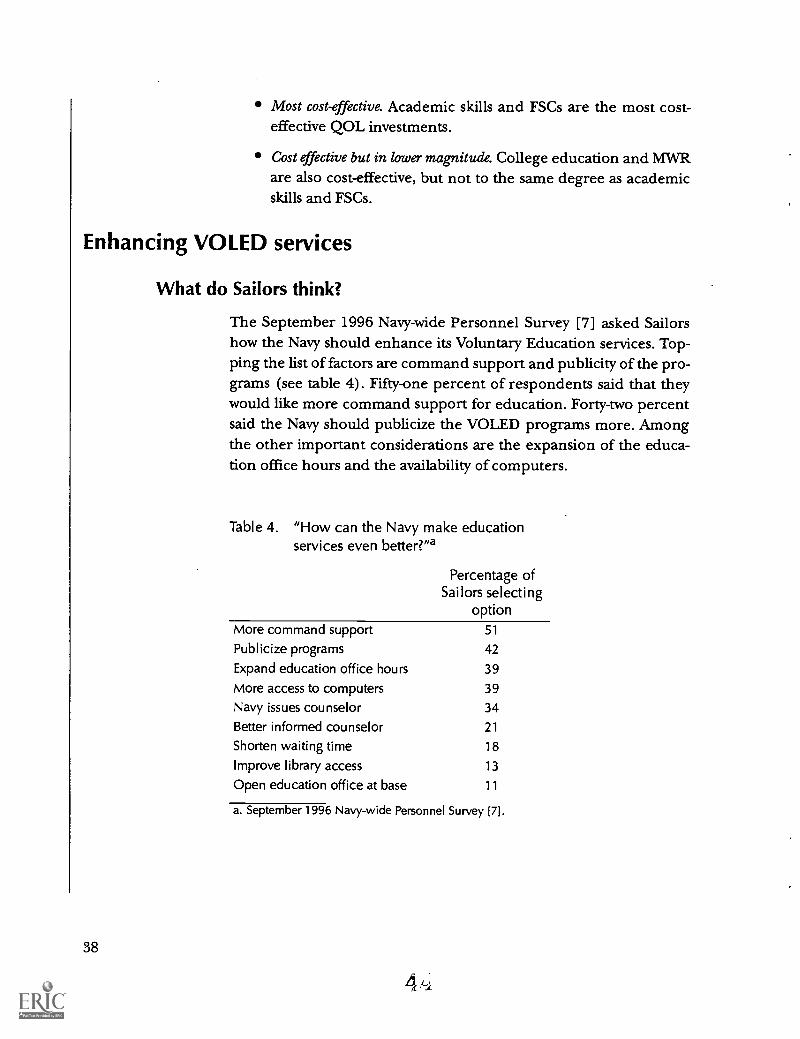
The September 1996 Navy-wide Personnel Survey [7] asked Sailorshow the Navy should enhance its Voluntary Education services. Top-ping the list of factors are command support and publicity of the pro-grams (see table 4). Fifty-one percent of respondents said that theywould like more command support for education. Forty-two percentsaid the Navy should publicize the VOLED programs more. Amongthe other important considerations are the expansion of the educa-tion office hours and the availability of computers.
Table 4. "How can the Navy make educationservices even better?"'
Percentage ofSailors selecting
optionMore command support 51
Publicize programs 42
Expand education office hours 39
More access to computers 39
Navy issues counselor 34
Better informed counselor 21
Shorten waiting time 18
Improve library access 13
Open education office at base 11
a. September 1996 Navy-wide Personnel Survey [7].
4

Command support is likely to be one of the most important determi-nants of student performance, particularly for Sailors taking coursesaboard ship. Command support includes participation in the screen-ing and selection process during registration and enrollment, as wellas encouragement and work schedule accommodation (when feasi-ble). Many Sailors aboard ship have rotating shifts and often worklong hours. The responses to the survey reflect Sailors' desire forgreater accommodation that allows them to pursue further educationin their off-duty time.
Impact of counseling
The contractor conducts predeployment surveys, screening, andcounseling. These counseling sessions serve as orientation about thecourse offerings and expose Sailors to the availability of educationalopportunities in the Navy. Academic orientation is an important toolto increase enrollmentsparticipation in PACE academic counselingincreases the probability of enrolling in a course by 13 percentagepoints.
What is the need for academic skills?
We showed that academic skills investments are highly cost-effec-tivemore than college education investments. Is there a significantneed for remedial education in the force?
A 1989 study [3] showed that Sailors with a combined ASVAB arith-metic reasoning (AR) and paragraph comprehension (PC) score of100 or below are significantly more likely to fail college courses.17These are Sailors with deficiencies in their reading, writing, or abilityto solve basic math problems.
The Navy adopted this cut-off rule to determine who should completeacademic skills before taking college-level PACE courses. Sailors may
17. The ASVAB consists of a battery of ten tests that measure knowledge andskill in the following areas: general science, arithmetic reasoning, wordknowledge, paragraph comprehension, numerical operations, codingspeed, auto and shop information, mathematics knowledge, mechani-cal comprehension, and electronics information.
39
4 rj

get a waiver by obtaining a satisfactory score on the American CollegeTesting Program ASSET test for the area in which they plan to study.
At the end of FY97, 99,600 Sailors-30 percent of the forcewere inneed of academic skills improvement because their ASVAB (AR plusPC) scores were 100 or below (see figure 11).18 These Sailors are inneed of academic skills improvement. We drew base-specific aca-demic skills profiles. The proportion of the enlisted population inneed of academic remediation is as high as 42 percent in Earle, NewJersey, and 41 percent in Atlanta, Georgia (see appendix F).
Figure 11. Academic skills profile of the force
120
100
80
60
40
20
0
71-80 81-90 91-100 101-110 111-120 121-130
ASVAB (AR + PC) score
a. ASVAB AR and PC scores of active-duty enlisted Sailors in fourth quarter of FY97.
18. The range of scores of the AR component is 26 to 67. The range ofscores of the PC component is 20 to 63. We estimated the proportion ofthe force that is in need of remedial education based on 336,024, theactive-duty enlisted strength in the fourth quarter of FY97. Of thisstrength, 219,432 Sailors (65.3 percent) had valid ASVAB data. Toaccount for the missing data, we inflated the counts by 1.53.
40

How many Sailors receive remedial education in a year? About 13,300received help in FY97. This figure include 9,220 Sailors who partici-pated in academic skills (instructor and technology PACE academicskills as well as in the Academic Skills Learning Centers). It alsoincludes 4,080 Sailors who received remedial education at school-house training facilities.19
Student performance
How do Sailors' course completion rates compare with those of civil-ians at community colleges? Sailors complete 92 percent and 84 per-cent of the TA and PACE lower level college courses, respectively. Incomparison, civilians at community colleges complete 74 percent ofthe courses (see figure 12).29
Thus, compared to community college students, Sailors do well in TAand PACE. TA completion rates may exceed those of PACE becauseSailors, who pay back the tuition on failed TA courses, have a directmonetary incentive for course completion. TA completion rates mayalso be high because of the relatively less demanding working condi-tions ashore.
PACE
To determine the factors leading to successful outcomes for Sailorsenrolled in PACE college courses, we conducted a regression analysisof student performance. We measured individual successful outcomeas a passing grade.21 We accounted for several important determi-nants of student performance, including demographic, mental abil-ity, career, and educational level.
19. This includes those who participated in academic remedial, Fundamen-tal Applied Skills Training (FAST), and Job Opportunity Basic Skills(JOBS) training.
20. We estimated the community college completion rate using 360 studentgrades downloaded from about 10 different college web pages. Thesedata are for the 1997 spring and fall semesters, and include a cross sec-tion of subject areas: algebra, astronomy, biology, business, communica-tions, and computer science.
21. We also analyzed student performance as measured by end-of-coursegrades, and arrived at similar conclusions.
41
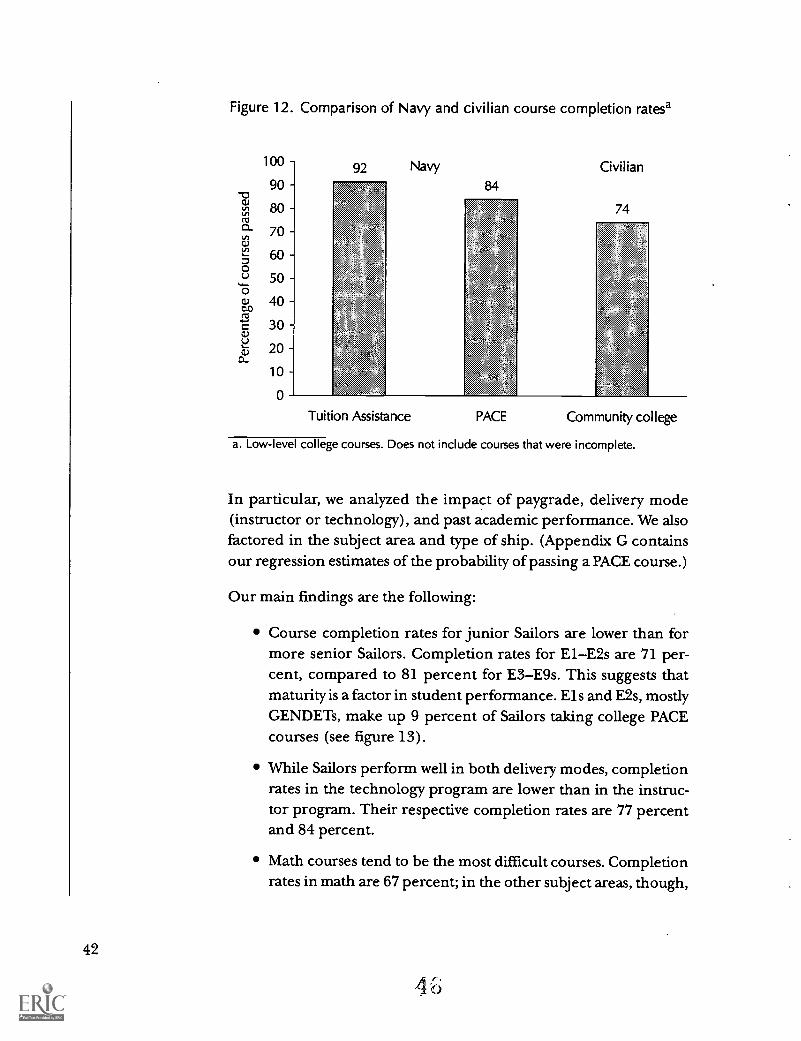
Figure 12. Comparison of Navy and civilian course completion rates'
100
90
80
70
60
50
40
30
20
10
0
Navy
84
Civilian
74
Tuition Assistance PACE Community college
a. Low-level college courses. Does not include courses that were incomplete.
In particular, we analyzed the impact of paygrade, delivery mode(instructor or technology), and past academic performance. We alsofactored in the subject area and type of ship. (Appendix G containsour regression estimates of the probability of passing a PACE course.)
Our main findings are the following:
Course completion rates for junior Sailors are lower than formore senior Sailors. Completion rates for E1E2s are 71 per-cent, compared to 81 percent for E3E9s. This suggests thatmaturity is a factor in student performance. Els and E2s, mostlyGENDETs, make up 9 percent of Sailors taking college PACEcourses (see figure 13).
While Sailors perform well in both delivery modes, completionrates in the technology program are lower than in the instruc-tor program. Their respective completion rates are 77 percentand 84 percent.
Math courses tend to be the most difficult courses. Completionrates in math are 67 percent; in the other subject areas, though,
42
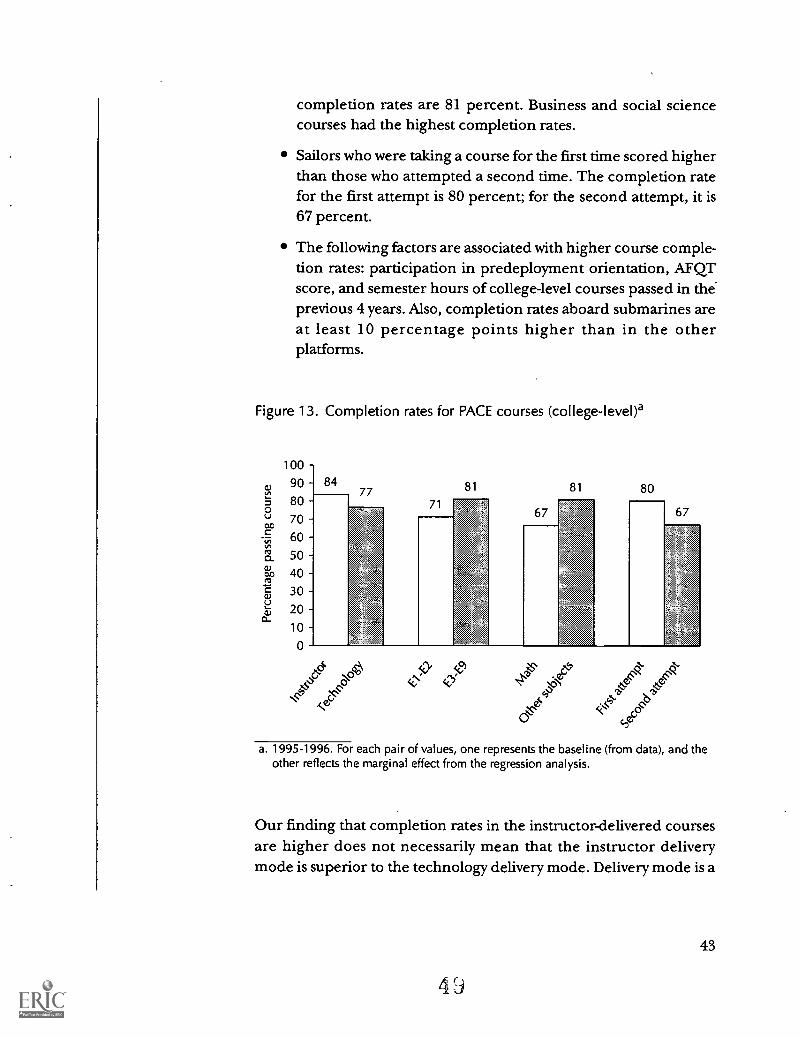
completion rates are 81 percent. Business and social sciencecourses had the highest completion rates.
Sailors who were taking a course for the first time scored higherthan those who attempted a second time. The completion ratefor the first attempt is 80 percent; for the second attempt, it is67 percent.
The following factors are associated with higher course comple-tion rates: participation in predeployment orientation, AFQTscore, and semester hours of college-level courses passed in the-previous 4 years. Also, completion rates aboard submarines areat least 10 percentage points higher than in the otherplatforms.
Figure 13. Completion rates for PACE courses (college-level)a
100
90
80
70
60
50
40
30
20
10
0
8477
4 40
,cse,e
81 81
67
SSS'
sks..
80
sc) e" *C'a a%e
c'De'
a. 1995-1996. For each pair of values, one represents the baseline (from data), and theother reflects the marginal effect from the regression analysis.
Our finding that completion rates in the instructor-delivered coursesare higher does not necessarily mean that the instructor deliverymode is superior to the technology delivery mode. Delivery mode is a
43
complex variable that implies more than differences in the mediathemselves. It includes course time on task (6- or 8-week terms versus12-week terms), methods of instruction and teacher effects, learnerstyle, time management abilities, individual motivation, and studentfamiliarization with technology. It also includes differences in assessedaptitude for college courses.
Recommendations
44
Education is more important than ever in an environment of down-sized forces and increased competitiveness. Education is a necessaryreadiness investment for a more technologically sophisticated force.Education builds individual confidence and sense of accomplish-ment. Based on our analysis, we have the following recommendations:
Maintain full support for VOLED, and accelerate academicskills investments. The Navy should reap the rewards of VOLEDby continuing to support it fully. Because the returns on aca-demic skills are especially high and there is a sizable need forremedial education, the Navy should accelerate its investmentin academic skills.
Modify the ASLC contract to promote greater participation.The number of participants at the Academic Skills LearningCenters is low. The Navy currently pays a per-center flat fee thatis independent of the number of students. The Navy should paythe ASLC contractor a fee that is based on enrollments. Thiswould provide the contractor with a greater incentive to beaggressive in publicizing the centers and to expand workinghours through the evenings and weekends.
Establish an academic transcript system. To facilitate programassessment and student counseling, the Navy should acceleratethe implementation of the Sailor-Marine/American Council onEducation Registry Transcript (SMART). In a format similar toa collegiate record, the transcript would provide a uniform andpermanent record of a Sailor's academic history. The transcriptwould list all Navy training and subject tests of DANTES as wellas the results of College Level Examination Program (CLEP)with the corresponsing college credit recommendations. The
5
transcript would also list college credits earned through TA andPACE.
Encourage a more supportive command climate. In a newVOLED instruction, the Navy should provide specific guidanceto COs on establishing a supportive command climate for edu-cation, including the identification, screening, and counselingof students.
Limit enrollment of Els and E2s. To make college PACE evenmore effective, the Navy should consider limiting participation-of Els and E2s in college-level courses. Before enrollment, Elsand E2s should demonstrate potential for academic success asdetermined by both the command authorities and the contrac-tor. Indicators of potential for academic success could includethe following:
An objective assessment by the next superior in the chain ofcommand of the Sailor's motivation and ability to workindependently
Consideration of the following criteria: a minimum B aver-age on previous college courses or an ASVAB (AR plus PC)score of 110 or more
An appraisal of other risk factors identified in this study:math courses and second attempt at same course.
45

Appendix A
Appendix A: Enlisted training cost
Table 5 shows the enlisted training cost per course completion. Bytraining type, it contains the enrollment, attrition rate, and numberof courses offered, as well as the average cost per course. Some typesof training consist of course pipelines (e.g., A-school), so the cost oftraining may be greater than the cost of one course. All the values inthe table are for FY96.
Table 5. Enlisted training cost per graduate (FY96 values)a
Type of training Code EnrollmentAttrition rate(percentage)
Number ofcourses
Average cost(per course)b
Team functional skill T1 151,766 0.9 124 $404
Functional Fl 98,742 1.8 738 844
Recruit R1 49,115 12.3 1 6,320
Initial skill (A-school) Al 43,241 7.2 112 6,469
Preparatory courses AP 36,988 4.5 80 2,724
Pipeline skill progression G1 30,055 1.1 273 3,911
Skill progression (C-school) Cl 26,268 3.8 468 5,414
Professional developmentfunctional skills
D1 11,026 5.3 67 4,442
Apprenticeship AA 7,744 2.3 4 1,618
FAST R4 2,048 6.9 3 1,994
a. Source: Naval Education and Training Professional Development and Technology Center (NETPDTC). Trainingtypes with FY96 enrollment under 1,000 are not shown. These smaller training categories are initial skill A-schoolor A-school pipeline (A3), initial skill nonaccession A-school (A4), initial skill remedial (AR), skill progressionmedical NEC (C5), and nondegree educational program (E6).
b. We included variable costs only. In particular, we included instruction, student compensation, and, where appli-cable, lodging, meals, and travel. We included the following cost components: direct supplies, direct contract,direct miscellaneous, depot level repairable (DLR) manpower, DLR civilian pay, DLR supplies, DLR contract, DLRmiscellaneous, contractor operation and maintenance for simulators (COMS) manpower, COMS civilian pay,COMS supplies, COMS contract, and COMS miscellaneous. We did not include costs that would not be affectedby a moderate change in the number of trainees: instructors, construction of new facilities, and general activities ofthe installation command and staff (such as logistics, transportation, safety, and facility engineering). We alsoexcluded curriculum development as well as base operating support functions, such as base facility and vehicleoperations and maintenance.
47
52
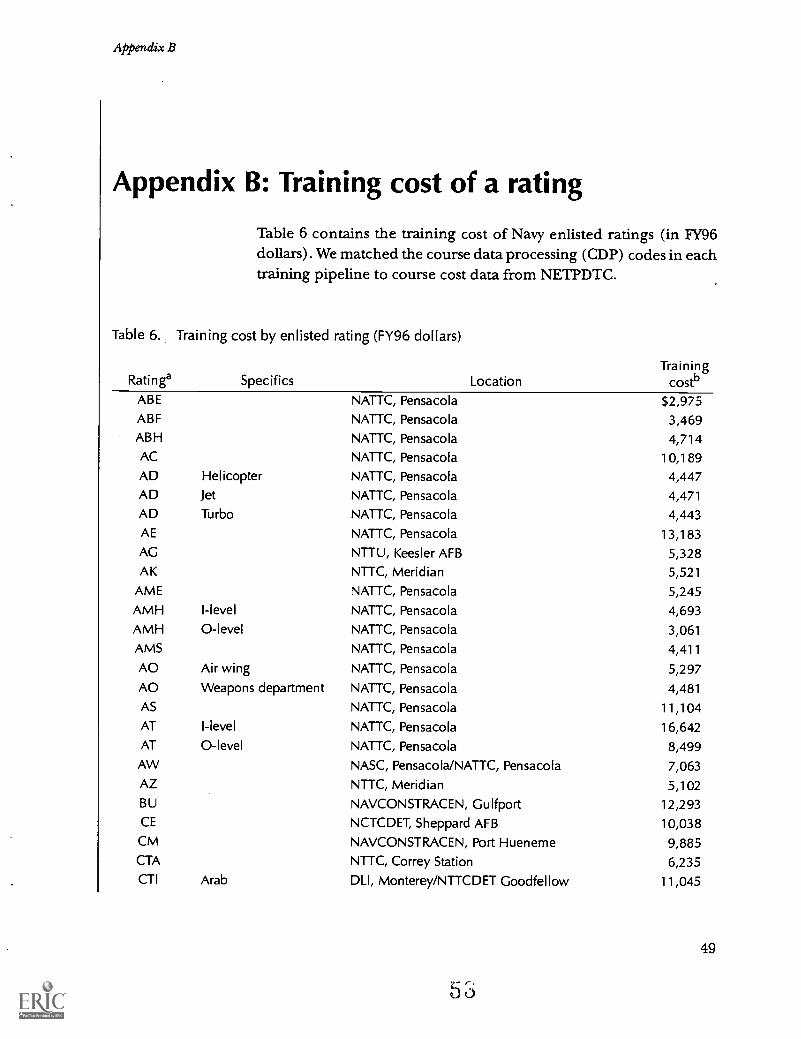
Appendix B
Appendix B: Training cost of a rating
Table 6 contains the training cost of Navy enlisted ratings (in FY96dollars). We matched the course data processing (CDP) codes in eachtraining pipeline to course cost data from NETPDTC.
Table 6.
Ratinga
Training cost by enlisted rating (FY96 dollars)
Specifics LocationTraining
costb
ABE NATTC, Pensacola $2,975ABF NATTC, Pensacola 3,469ABH NATTC, Pensacola 4,714AC NATTC, Pensacola 10,189AD Helicopter NATTC, Pensacola 4,447AD Jet NATTC, Pensacola 4,471AD Turbo NATTC, Pensacola 4,443AE NATTC, Pensacola 13,183AG NTTU, Kees ler AFB 5,328AK NTTC, Meridian 5,521
AME NATTC, Pensacola 5,245AMH I-level NATTC, Pensacola 4,693AMH 0-level NATTC, Pensacola 3,061
AMS NATTC, Pensacola 4,411
AO Air wing NATTC, Pensacola 5,297AO Weapons department NATTC, Pensacola 4,481
AS NATTC, Pensacola 11,104AT I-level NATTC, Pensacola 16,642AT 0-level NATTC, Pensacola 8,499
AW NASC, Pensacola/NATTC, Pensacola 7,063AZ NTTC, Meridian 5,102BU NAVCONSTRACEN, Gulfport 12,293CE NCTCDET, Sheppard AFB 10,038CM NAVCONSTRACEN, Port Hueneme 9,885CTA NTTC, Correy Station 6,235CTI Arab DLI, Monterey/NTTCDET Goodfellow 11,045
49

Table 6. Training cost by enlisted rating (FY96 dollars) (continued)
Ratinga Specifics Location
Appendix B
Trainingcostb
CTI Chinese Mandarin DLI, Monterey/NTTCDET Goodfellow 11,045CTI French DLI, Monterey/NTTCDET Goodfellow 11,045CTI Hebrew DLI, Monterey/NTTCDET Goodfellow 11,045CTI Korean DLI, Monterey/NTTCDET Goodfellow 11,045CTI Persian-Farsi DLI, Monterey/NTTCDET Goodfellow 11,045CTI Russian DLI, Monterey/NTTCDET Goodfellow 11,045CTI Serb-Croat DLI, Monterey/NTTCDET Goodfel low 11,045CTI Spanish DLI, Monterey/NTTCDET Goodfellow 11,045CTI Tagalog DLI, Monterey/NTMDET Goodfel low 11,045CM Vietnamese DLI, Monterey/NTTCDET Goodfellow 11,045
CTM NTTC, Correy Station 18,387CTO NTTC, Correy Station 6,248CTR NTTC, Correy Station 13,868CTT NTTC, Correy Station 9,843DC SERVSCOLCOM, Great Lakes 11,783DK NTTC, Meridian 4,812DS SERVSCOLCOM, Great Lakes 25,725EA NCTCDET, Ft Leonmo 10,165EM SERVSCOLCOM, Great Lakes 13,118
EM-NF NAVNUPWRTRACOM, Orlando 34,799EN SERVSCOLCOM, Great Lakes 13,293E0 NCTCDET, Ft Leonmo 10,165ET Comms SERVSCOLCOM, Great Lakes 20,813ET Radar SERVSCOLCOM, Great Lakes 20,813
ET-NF NAVNUPWRTRACOM, Orlando 46,720ET-SS (5Y0) RF Elect Tech. (SSBN) NAVSUBSCOL, Groton/TRITRAFAC Bangor 28,856ET-SS (6Y0) NAV OP (SSN) NAVSU BSCOL, Groton 32,073ET-SS (6Y0) NON-TNCP NAV OP NAVSUBSCOL, Groton/TRITRAFAC, Kings Bay 36,770
(SSBN)
ET-SS (6Y0) RF OP (SSBN) NAVSUBSCOL, Groton/TRITRAFAC Bangor 36,770ET-SS (6Y0) RF OP (SSBN) NAVSUBSCOL, GrotoniTRITRAFAC, Kings Bay 24,897ET-SS (6Y0) RF OP (SSN) NAVSUBSCOL, Groton 21,675ET-SS (6Y0) TNCP NAV OP (SSBN) NAVSUBSCOL, Groton/TRITRAFAC Bangor 21,507ET-SS (6Y0) TNCP NAV OP (SSBN) NAVSUBSCOL, Groton/TRITRAFAC, Kings Bay 18,824EW (4Y0) NTTC, Correy Station 9,888EW (6Y0) NTTC, Correy Station 33,790
FC SERVSCOLCOM, Great Lakes 27,973FT NAVSUBSCOL, Groton 11,350
50
54.*

Appendix B
Table 6. Training cost by enlisted rating (FY96 dollars) (continued)
Ratinga Specifics LocationTraining
costb
GM SERVSCOLCOM, Great Lakes 19,269
GSE SERVSCOLCOM, Great Lakes 17,873
GSM SERVSCOLCOM, Great Lakes 9,487HT SERVSCOLCOM, Great Lakes 7,994
IC SERVSCOLCOM, Great Lakes 13,880
IM NTTC, Correy Station 10,758
IS NMITC, Dam Neck 11,691
JO NTTCDET Ft Meade 4,608
LI Navy Training, Ft Belvoir 4,608
MM SERVSCOLCOM, Great Lakes 7,013
MM-A(SS) Weapons NAVSUBSCOL, Groton 23,424MM-W(SS) Auxillary NAVSUBSCOL, Groton 22,948
MM-W(SS) Auxillary NAVSUBSCOL, Groton/TRITRAFAC Bangor 22,955
MM-W(SS) Auxillary NAVSUBSCOL, Groton/TRITRAFAC, Kings Bay 23,290MMN NAVNUPWRTRACOM, Orlando 32,188MN NWTC, Ingleside 8,516
MR SERVSCOLCOM, Great Lakes 9,359
MS NTTCDET LACKLAND AF 3,967
MS-SUB NTTCDET LACKLAND AF/NAVSUBSCOL, Groton 7,196
MT NAVSUBSCOL, Groton 11,912
OM NTTC, Correy Station 15,591
OS FCTCL, Dam Neck 9,545
PC USAAGSCH, Ft Jax 4,608
PH Phototraining, Pensacola 5,328
PN NTTC, Meridian 4,592
PR I-level NATTC, Pensacola 5,271
QM SERVSCOLCOM, Great Lakes 4,549
RM SERVSCOLCOM, Great Lakes 8,730
RM21 SERVSCOLCOM, Great Lakes 8,730
RP NTTC, Meridian 4,327
SH NTTC, Meridian 2,768SK NTTC, Meridian 5,446
SK-SUB NTTC, Meridian/NAVSUBSCOL, Groton 8,675
SM SERVSCOLCOM, Great Lakes 3,409
SN SERVSCOLCOM, Great Lakes 1,267
STG NEC 0445 FLEASWTRACENPAC, San Diego 8,104
STS NAVSUBSCOL, Groton 15,991
SW NAVCONSTRACEN, Gulfport 8,443
51
.5.)

Appendix B
Table 6. Training cost by enlisted rating (FY96 dollars) (continued)
TrainingRatinga Specifics Location costb
TM SERVSCOLCOM, Great Lakes 5,696UT NCTCDET, Sheppard AFB 10,165YN NTTC, Meridian 4,906
YN-SUB NTTC, Meridian 6,520
a. Cost data were not available for the following ratings: AG, CTI, DT, EA, EO, HM, JO, LI, MU, PC, PH, and UT.b. We included variable costs only. The cost components include instruction, student compensation, and, where
applicable, lodging, meals, and travel. We included the following cost components: direct supplies, direct con-tract, direct miscellaneous, depot level repairable (DLR) manpower, DLR civilian pay, DLR supplies, DLR con-tract, DLR miscellaneous, contractor operation and maintenance for simulators (COMS) manpower, COMScivilian pay, COMS supplies, COMS contract, and COMS miscellaneous. We did not include costs that would notbe affected by a moderate change in the number of trainees: instructors, construction of new facilities, and gen-eral activities of the installation command and staff (such as logistics, transportation, safety, and facility engineer-ing). We also excluded curriculum development as well as base operating support functions, such as base facilityand vehicle operations and maintenance.
52

Appendix C
Appendix C: Estimation of the promotion andretention models
Promotion
To analyze the effect of participation in VOLED on promotion, weconducted a regression analysis of the paygrade attained after 5 yearsof service. Because paygrade is a ranking, ordinary least squares is notan appropriate option. For example, ordinary least squares wouldtake the difference between paygrades 1 and 2 to be the same as thatbetween paygrades 4 and 5.
A multinomial logit or probit model would not be appropriate eitherbecause it would fail to account for the ordinal nature of paygrade.We wanted to see whether participation in VOLED increased theprobability of making it to E5 and decreased the probability of beingin the lower paygrades.
To tackle the ordered nature of paygrade, we used an ordered probitmodel. This model has been applied to other ordinal variables, suchas the assignment of military personnel to job classifications by skilllevel (high-skill, medium-skill, and low-skill), opinion surveys (agree,neutral, disagree), and results of taste tests.
The ordered probit model is built around a latent equation [8] :
y* ,
where y, Sailors' individual ranking (based on Sailors' individualproductivity compared to each one of their peers), is unobserved.The term x denotes measurable factors, such as college education,vacancies in the rating, and sea experience; E denotes unmeasurablefactors (the error term).
53
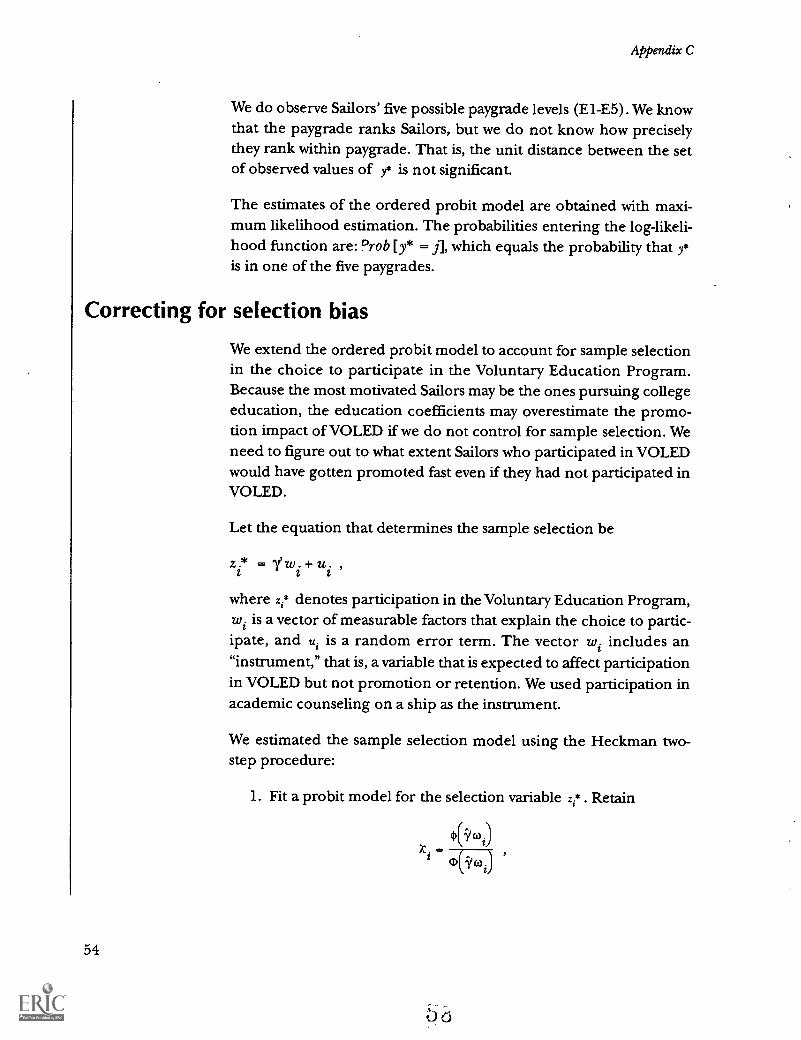
Appendix C
We do observe Sailors' five possible paygrade levels (E1-E5). We knowthat the paygrade ranks Sailors, but we do not know how preciselythey rank within paygrade. That is, the unit distance between the setof observed values of y* is not significant.
The estimates of the ordered probit model are obtained with maxi-mum likelihood estimation. The probabilities entering the log-likeli-hood function are: Prob [y* = j], which equals the probability that y*
is in one of the five paygrades.
Correcting for selection bias
We extend the ordered probit model to account for sample selectionin the choice to participate in the Voluntary Education Program.Because the most motivated Sailors may be the ones pursuing collegeeducation, the education coefficients may overestimate the promo-tion impact of VOLED if we do not control for sample selection. Weneed to figure out to what extent Sailors who participated in VOLEDwould have gotten promoted fast even if they had not participated inVOLED.
Let the equation that determines the sample selection be
where zi* denotes participation in the Voluntary Education Program,wi is a vector of measurable factors that explain the choice to partic-ipate, and ui is a random error term. The vector wi includes an"instrument," that is, a variable that is expected to affect participationin VOLED but not promotion or retention. We used participation inacademic counseling on a ship as the instrument.
We estimated the sample selection model using the Heckman two-step procedure:
1. Fit a probit model for the selection variable z,* . Retain
(1)(i'coi)=
0(i/coi)
54

Appendix C
Retention
where 4) (i/wi) is the normal probability density function, and()i) is the normal cumulative density function. The ratio ki
is also known as the "Inverse Mills Ratio."
2. Estimate the selection-corrected estimates of 13 by regressing y
on x and X.
The marginal effect of college credits (a component of the term x)gives us the promotion effect that is directly attributable to VOLED.The marginal effect of the Inverse Mills Ratio gives us the promotioneffect that is attributable to the high motivation of VOLEDparticipants.
To analyze the effect of participation in VOLED on retention, we esti-mated a binomial probit model. The dependent variable capturedwhether the first-term Sailor reenlisted (or extended). We trackedthe FY92 cohort of 4-year obligors (GENDETs and school guaranteepersonnel) through their first reenlistment decision. Sailors who didnot reenlist include the early-outs as well as those who left upon com-pletion of their contract terms.
Because sample selection arises in retention, we corrected for it usinga procedure similar to the one we used for promotion. Here again wefollowed the Heckman two-step process, where the first regression isidentical to the one we used for promotion.
55
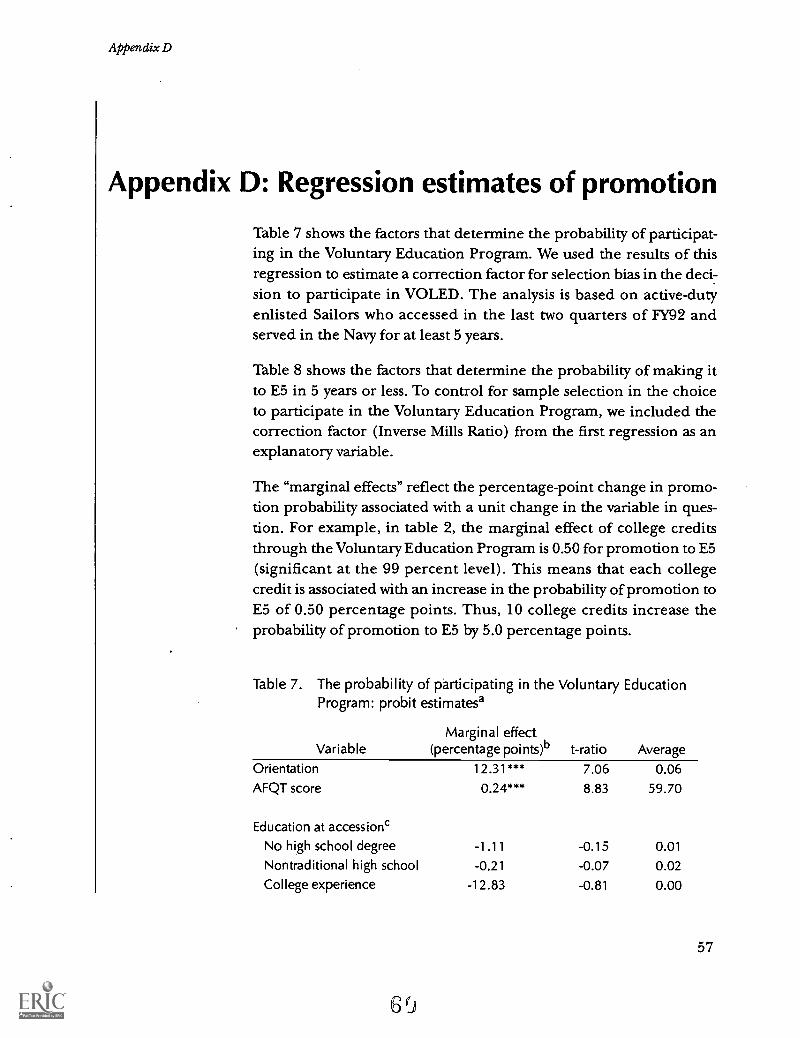
Appendix D
Appendix D: Regression estimates of promotion
Table 7 shows the factors that determine the probability of participat-ing in the Voluntary Education Program. We used the results of thisregression to estimate a correction factor for selection bias in the deci:sion to participate in VOLED. The analysis is based on active-dutyenlisted Sailors who accessed in the last two quarters of FY92 andserved in the Navy for at least 5 years.
Table 8 shows the factors that determine the probability of making itto E5 in 5 years or less. To control for sample selection in the choiceto participate in the Voluntary Education Program, we included thecorrection factor (Inverse Mills Ratio) from the first regression as anexplanatory variable.
The "marginal effects" reflect the percentage-point change in promo-tion probability associated with a unit change in the variable in ques-tion. For example, in table 2, the marginal effect of college creditsthrough the Voluntary Education Program is 0.50 for promotion to E5(significant at the 99 percent level). This means that each collegecredit is associated with an increase in the probability of promotion toE5 of 0.50 percentage points. Thus, 10 college credits increase theprobability of promotion to E5 by 5.0 percentage points.
Table 7. The probability of participating in the Voluntary EducationProgram: probit estimates'
Marginal effectVariable (percentage points)b t-ratio Average
Orientation 12.31*** 7.06 0.06AFQT score 0.24*** 8.83 59.70
Education at accessionc
No high school degree -1.11 -0.15 0.01
Nontraditional high school -0.21 -0.07 0.02
College experience -12.83 -0.81 0.00
57
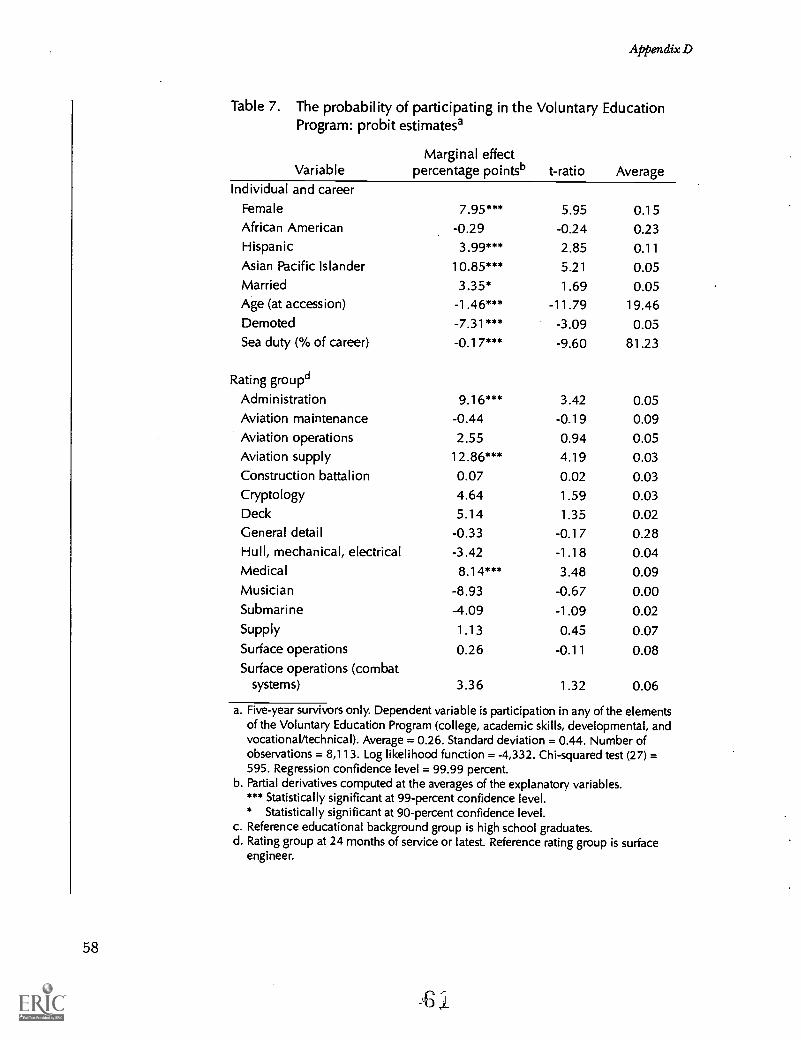
Appendix D
Table 7. The probability of participating in the Voluntary EducationProgram: probit estimatesa
Marginal effectVariable percentage pointsb t-ratio Average
Individual and careerFemale 7.95*** 5.95 0.15African American -0.29 -0.24 0.23Hispanic 3.99*** 2.85 0.1 1
Asian Pacific Islander 10.85*** 5.21 0.05Married 335* 1.69 0.05Age (at accession) -1.46*** -11.79 19.46Demoted -7.31*** -3.09 0.05Sea duty (% of career) -0.17*** -9.60 81.23
Rating groupd
Administration 9.16*** 3.42 0.05Aviation maintenance -0.44 -0.19 0.09Aviation operations 2.55 0.94 0.05Aviation supply 12.86*** 4.19 0.03
Construction battalion 0.07 0.02 0.03Cryptology 4.64 1.59 0.03Deck 5.14 1.35 0.02General detail -0.33 -0.17 0.28Hull, mechanical, electrical -3.42 -1 .1 8 0.04Medical 8.1 4*** 3.48 0.09Musician -8.93 -0.67 0.00Submarine -4.09 -1.09 0.02Supply 1.13 0.45 0.07Surface operations 0.26 -0.11 0.08Surface operations (combat
systems) 3.36 1.32 0.06
a. Five-year survivors only. Dependent variable is participation in any of the elementsof the Voluntary Education Program (college, academic skills, developmental, andvocational/technical). Average = 0.26. Standard deviation = 0.44. Number ofobservations = 8,113. Log likelihood function = -4,332. Chi-squared test (27) =595. Regression confidence level = 99.99 percent.
b. Partial derivatives computed at the averages of the explanatory variables.*** Statistically significant at 99-percent confidence level.* Statistically significant at 90-percent confidence level.
c. Reference educational background group is high school graduates.d. Rating group at 24 months of service or latest. Reference rating group is surface
engineer.
58

Appendix D
Table 8. The probability of reaching a determined paygrade: ordered probit model correctedfor sample selectiona
Marginal effect (percentage points)b
t-ratioc AverageEl E2 E3 E4 E5
Voluntary Education Program
Col lege creditsd 0.00 0.00 -0.07 -0.42 0.50 4.77*** 2.24Developmental (remedial) credits 0.00 0.00 0.00 -0.01 0.01 0.01 0.10
Academic skills participation 0.03 0.05 0.78 4.47 -5.33 -1.17 0.01
Vocational/technical coursework -0.02 -0.03 -0.47 -2.70 3.22 1.37 0.01
Education at accessione
No high school degree -0.04 -0.07 -1.04 -6.01 7.17 0.75 0.00
Non-traditional high school 0.02 0.04 0.56 3.24 -3.86 -1.12 0.02
College experience 0.17 0.27 4.04 23.26 -27.74 -1.25 0.00
Vacancies: ratio of E5 billets and E4inventory
-0.02 -0.04 -0.55 -3.15 3.76 3.03*** 1.28
Individual and career
Demoted 0.29 0.48 7.05 40.60 -48.43 -22.56*** 0.05
Sea duty (% of career) 0.00 0.00 -0.04 -0.22 0.26 12.15*** 56.23
AFQT score 0.00 -0.01 -0.09 -0.51 0.61 17.89*** 59.70
Age (at E5 or latest) -0.01 -0.01 -0.18 -1.06 1.27 5.85*** 24.61
Female 0.02 0.04 0.58 3.32 -3.96 -2.34** 0.15
African American 0.05 0.09 1.31 7.52 -8.97 -6.64*** 0.23
Hispan ic 0.04 0.06 0.95 5.49 -6.55 -4.10*** 0.11
Asian Pacific Islander 0.00 0.00 -0.05 -0.27 0.33 0.13 0.05
Married -0.05 -0.07 -1.09 -6.28 7.49 334*** 0.05
Accession programf
School guarantee 4Y0 0.04 0.07 1.07 6.14 -7.33 -2.35** 0.34
School guarantee 6Y0 0.02 0.03 0.39 2.22 -2.65 -0.80 0.19
General detail 0.03 0.04 0.61 3.51 -4.18 -1.30 0.34
Other program 0.00 0.01 0.11 0.62 -0.75 -0.22 0.08
Rating groups
Admi n istration -0.13 -0.21 -3.14 -18.07 21.55 6.79*** 0.05
Aviation maintenance 0.03 0.05 0.75 4.32 -5.16 -1.88* 0.09
Aviation operations -0.06 -0.10 -1.55 -8.93 10.65 335*** 0.05
Aviation supply -0.09 -0.14 -2.07 -11.95 14.25 395*** 0.03
Construction battalion -0.03 -0.05 -0.81 -4.64 5.54 1.31 0.03
Crypto I ogy -0.23 -0.38 -5.63 -32.40 38.64 10.35*** 0.03
59
6
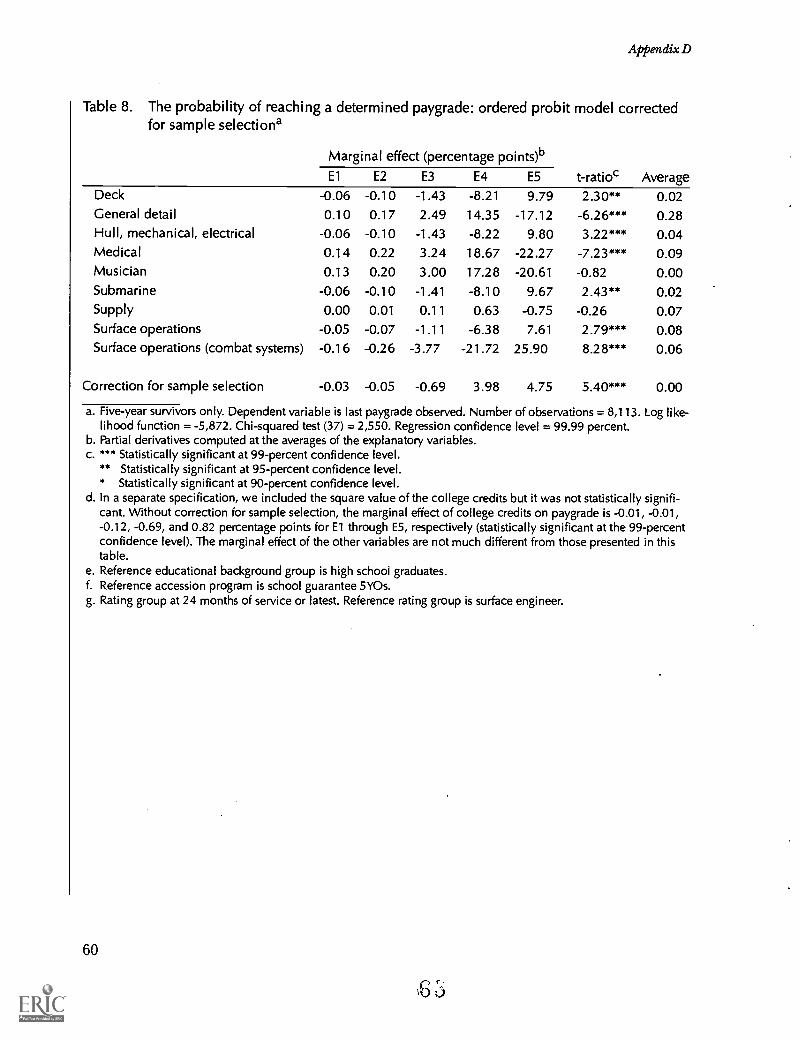
Appendix D
Table 8. The probability of reaching a determined paygrade: ordered probit model correctedfor sample selectiona
Marginal effect (percentage points)b
t-ratioc AverageEl E2 E3 E4 E5
Deck -0.06 -0.10 -1.43 -8.21 9.79 2.30** 0.02General detail 0.10 0.17 2.49 14.35 -17.12 -6.26*** 0.28Hull, mechanical, electrical -0.06 -0.10 -1.43 -8.22 9.80 3.22*** 0.04Medical 0.14 0.22 3.24 18.67 -22.27 -7.23*** 0.09Musician 0.13 0.20 3.00 17.28 -20.61 -0.82 0.00Submarine -0.06 -0.10 -1.41 -8.10 9.67 2.43** 0.02Supply 0.00 0.01 0.11 0.63 -0.75 -0.26 0.07Surface operations -0.05 -0.07 -1.11 -6.38 7.61 2.79*** 0.08Surface operations (combat systems) -0.16 -0.26 -3.77 -21.72 25.90 8.28*** 0.06
Correction for sample selection -0.03 -0.05 -0.69 3.98 4.75 5.40*** 0.00
a. Five-year survivors only. Dependent variable is last paygrade observed. Number of observations = 8,113. Log like-lihood function = -5,872. Chi-squared test (37) = 2,550. Regression confidence level = 99.99 percent.
b. Partial derivatives computed at the averages of the explanatory variables.c. *** Statistically significant at 99-percent confidence level.
** Statistically significant at 95-percent confidence level.* Statistically significant at 90-percent confidence level.
d. In a separate specification, we included the square value of the college credits but it was not statistically signifi-cant. Without correction for sample selection, the marginal effect of college credits on paygrade is -0.01, -0.01,-0.12, -0.69, and 0.82 percentage points for El through E5, respectively (statistically significant at the 99-percentconfidence level). The marginal effect of the other variables are not much different from those presented in thistable.
e. Reference educational background group is high school graduates.f. Reference accession program is school guarantee 5YOs.g. Rating group at 24 months of service or latest. Reference rating group is surface engineer.
60

Appendix E
Appendix E: Regression estimates of retention
Table 9 shows the factors that determine the probability of participat-ing in the Voluntary Education Program. We used the results of thisregression to estimate a correction factor for selection bias in thedecision to participate in VOLED. The analysis is based on the FY92cohort of active-duty enlisted Sailors with 4-year contracts.
Table 10 shows the factors that determine the probability of reenlist-ing. To control for sample selection in the decision to participate inthe Voluntary Education Program, we included the correction factor(Inverse Mills Ratio) from the first regression as an explanatoryvariable.
Table 9. The probability of participating in the Voluntary EducationProgram: probit estimatesa
Marginal effectVariable (percentage points)b t- ratio Average
Orientation 12.94*** 9.69 0.02
AFQT score 0.13*** 9.77 55.64
Education at accessionc
No high school degree -7.50* -1.74 0.01
Nontraditional high school -2.05 -1.45 0.03
College experience -6.22 -0.60 0.01
Individual and careerFemale 6.00*** 10.73 0.18African American -0.39 -0.66 0.18
Hispanic 3.31*** 5.12 0.11
Asian Pacific Islander 8.40*** 7.18 0.03
Married -0.65 -1.48 0.34Age (at accession) -2.21*** -50.52 19.53Demoted -7.11*** -9.75 0.13Sea duty (% of career) -0.01 -0.24 47.43
61

Appendix E
Table 9. The probability of participating in the Voluntary EducationProgram: probit estimatesa
Marginal effectVariable (percentage points)b t-ratio Average
Rating group°
Administration 22.43*** 7.00 0.01
Surface engineer 8.42*** 7.49 0.06Aviation maintenance 13.64*** 13.95 0.07Aviation operations 16.59*** 21.26 0.11
Aviation supply 15.98*** 17.44 0.08Construction battalion 21.90*** 20.69 0.04Cryptology 23.18*** 26.49 0.06Deck 16.93*** 13.64 0.03Hull, mechanical, electrical 15.21*** 16.67 0.08Medical 23.07*** 28.79 0.08Musician 25.69*** 22.42 0.03Submarine 17.49*** 13.07 0.02
Supply 15.51*** 14.35 0.04Surface operations 12.87*** 6.52 0.01
Surface operations (combatsystems)
25.86*** 4.08 0.01
a. Four-year obligors only. Dependent variable is participation in any of the ele-ments of the Voluntary Education Program (college, academic skills, develop-mental, and vocational/technical). Average = 0.15. Standard deviation = 0.36.Number of observations = 24,756. Log likelihood function = -9,329. Chi-squared test (27) = 2,313. Regression confidence level = 99.99 percent.
b. Partial derivatives computed at the averages of the explanatory variables.*** Statistically significant at 99-percent confidence level.* Statistically significant at 90-percent confidence level.
c. Reference educational background group is high school graduates.d. Rating group at 24 months of service or latest. Reference rating group is general
detail.
62
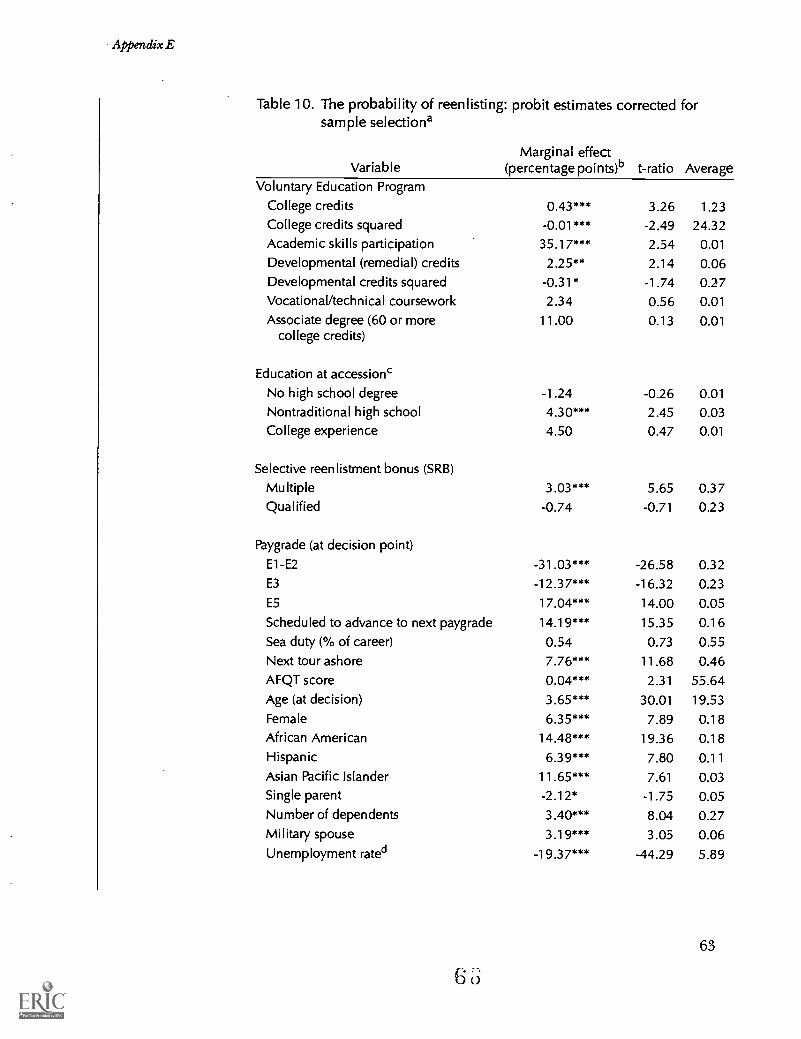
Appendix E
Table 10. The probability of reenlisting: probit estimates corrected forsample selectiona
VariableMarginal effect
(percentage points)b t-ratio AverageVoluntary Education Program
College credits 0.43*** 3.26 1.23
College credits squared -0.01*** -2.49 24.32Academic skills participation 35.17*** 2.54 0.01
Developmental (remedial) credits 2.25** 2.14 0.06Developmental credits squared -0.31* -1.74 0.27Vocational/technical coursework 2.34 0.56 0.01
Associate degree (60 or morecollege credits)
11.00 0.13 0.01
Education at accessionc
No high school degree -1.24 -0.26 0.01
Nontraditional high school 4.30*** 2.45 0.03College experience 4.50 0.47 0.01
Selective reenlistment bonus (SRB)
Multiple 3.03*** 5.65 0.37Qualified -0.74 -0.71 0.23
Paygrade (at decision point)
E1-E2 -31.03*** -26.58 0.32
E3 -12.37*** -16.32 0.23
E5 17.04*** 14.00 0.05
Scheduled to advance to next paygrade 14.19*** 15.35 0.16
Sea duty (% of career) 0.54 0.73 0.55
Next tour ashore 7.76*** 11.68 0.46AFQT score 0.04*** 2.31 55.64Age (at decision) 3.65*** 30.01 19.53
Female 6.35*** 7.89 0.18African American 14.48*** 19.36 0.18Hispanic 6.39*** 7.80 0.11
Asian Pacific Islander 11.65*** 7.61 0.03Single parent -2.12* -1.75 0.05Number of dependents 3.40*** 8.04 0.27Military spouse 3.19*** 3.05 0.06Unemployment rated -19.37*** -44.29 5.89
63

Appendix E
Table 10. The probability of reenlisting: probit estimates corrected forsample selectiona
VariableMarginal effect
(percentage points)b t-ratio AverageRating groupe
Administration 46.52*** 9.50 0.01
Surface engineer 14.86*** 10.74 0.06Aviation maintenance 10.74*** 7.86 0.07Aviation operations 21.74*** 18.60 0.11
Aviation supply 17.83*** 14.17 0.08Construction battalion 23.90*** 16.10 0.04Cryptology 22.53*** 17.14 0.06Deck 15.15*** 9.35 0.03General detail 22.47*** 18.28 0.08Hull, mechanical, electrical 35.55*** 27.97 0.08Medical 27.21*** 15.12 0.03Musician 17.85*** 9.97 0.02
Submarine 16.37*** 10.32 0.04Supply 23.00*** 9.74 0.01
Surface operations 40.79*** 4.70 0.01
Surface operations (combat systems)
Correction for sample selection -3.87 0.00
a. Includes 4-year obligors only. Dependent variable is reenlistment or extension observed.Number of observations = 8,113. Log likelihood function = -5,872. Chi-squared test (37)= 2,550. Regression confidence level = 99.99 percent.
b. Partial derivatives computed at the averages of the explanatory variables.*** Statistically significant at 99-percent confidence level.** Statistically significant at 95-percent confidence level.* Statistically significant at 90-percent confidence level.
c. Reference educational background group is high school graduates.d. The overall unemployment rate was 6.5 percent in FY92 and declined steadily to 4.2 per-
cent in FY97. The race-specific unemployment rates experienced a similar decliningtrend. The negative effect of the unemployment rate on reenlistment reflects that a largeproportion of the FY92 cohort's attrition occurred in the relatively high unemploymentperiod of FY92 and FY93.
e. Rating group at 24 months of service or latest. Reference rating group is general detail.
64

Appendix F
Appendix F: Academic skills profile
Table 11 shows the active-duty enlisted Navy population that is inneed of academic remediation. This is the population with a com-bined arithmetic reasoning and paragraph comprehension ASVABscore of 100 or less.
Here is how we assigned individual Sailors to the different AcademicSkills Learning Center sites. In the activity file, every UIC has an asso-ciated area code, called the ATC. ATCs are generally associated withspecific cities or areas. We did most groupings using the ATCs. But insome densely populated areas, such as San Diego, one ATC coveredseveral ASLC sites. To separate the areas in these cases, we first usedthe geographic location (GEOLOC) code. Where overlap stilloccurred, we used the activity name in order to perform the final UICassignment to the ASLC sites. For example, Fleet Anti-SubmarineWarfare Training Center, Pacific had the same ATC and GEOLOC asNaval Station, San Diego. To distinguish between the two, we lookedfor "ASW" or "anti-submarine" in the activity name.
65
fi

Table 11. Population in need of academic remediationa
ASLC site
Atlanta
Atsugi
Bangor, WA
Bremerton, WA
Brunswick, ME
China Lake, CA
Corpus Christi
Earle, NJ
Everett, WA
Fallon, NV
FASWTCP San Diego
Ft Worth/Dallas
Great Lakes, IL
Guam
Guantanamo
Gulfport, MS
Hueneme/Mugu, CA
Ingleside, TX
Jacksonville, FL
Keflavik, IC
Key West, FL
Kings Bay, GA
Kingsville, TX
Lemoore, CA
Little Creek, VA
Mayport, FL
Meridian, MS
Millington, TNMisawa, Japan
NAB Coronado, CA
Naples, Italy
NAS Oceana, VA
New London, CT
New Orleans, LA
Newport, RI
Norfolk, VA
North Island, SD CA
66
Status(as of March 1998)
TBD
In operation
In operation
TBD
TBD
TBD
Opening in FY98
TBD
Proposed opening in FY99
TBD
Proposed opening in FY99
TBD
In operation
Opening in FY98
In operation
Proposed opening in FY99
Proposed opening in FY99
Proposed opening in FY99
In operation
In operation
Proposed opening in FY99
TBD
TBD
Proposed opening in FY99
In operation
Opening in FY98
TBD
TBD
TBD
In operation
Proposed opening in FY99
Opening in FY98
Opening in FY98
TBD
In operation
Proposed opening in FY99
Proposed opening in FY99
Appendix F
Population in needof remediation
(percentage)
41
37
13
32
22
30
30
42
31
30
14
32
28
33
34
38
35
35
32
30
30
14
32
31
35
34
37
31
26
29
29
30
16
32
21
33
32
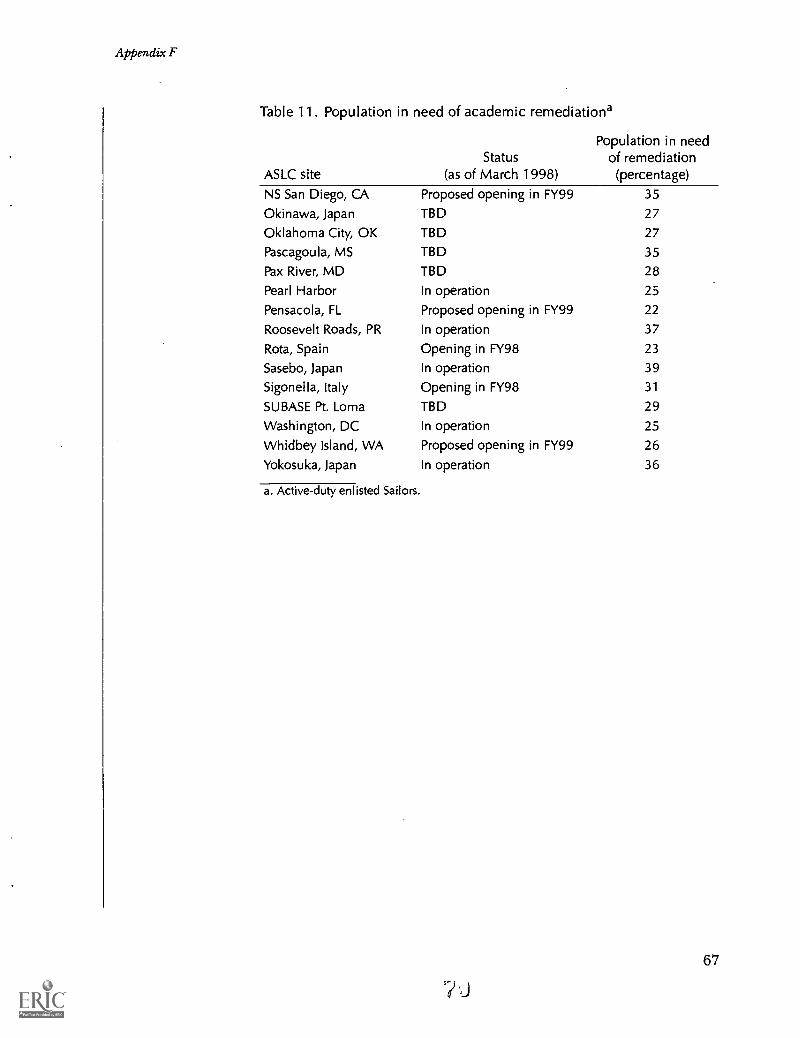
Appendix F
Table 11. Population in need of academic remediationa
ASLC site
NS San Diego, CA
Okinawa, Japan
Oklahoma City, OK
Pascagoula, MS
Pax River, MD
Pearl Harbor
Pensacola, FL
Roosevelt Roads, PR
Rota, Spain
Sasebo, Japan
Sigonella, Italy
SUBASE Pt. Loma
Washington, DC
Whidbey Island, WA
Yokosuka, Japan
a. Active-duty enlisted Sailors.
Status(as of March 1998)
Proposed opening in FY99
TBD
TBD
TBD
TBD
In operation
Proposed opening in FY99
In operation
Opening in FY98In operation
Opening in FY98
TBD
In operation
Proposed opening in FY99
In operation
7
Population in needof remediation(percentage)
35
27
27
35
28
25
22
37
23
39
31
29
25
26
36
67

Appendix G
Appendix G: Regression estimates of theprobability of passing a PACE course
Table 12 shows the factors that determine the probability of receivingtechnology instruction (as opposed to instruction from an instructor).The analysis focuses on college-level PACE courses taken by active-dutyenlisted Sailors during July 1995May 1996. We used the results of thisregression to estimate a correction factor for sample selection in thechoice of instruction method.
Table 13 shows the factors that determine the successful completion ofcollege PACE courses. To control for sample selection in the choice ofmethod of instruction, we included the correction factor (InverseMills Ratio) from the first regression as an explanatory variable.
The marginal effects reflect the percentage-point change in probabil-ity associated with a unit change in the variable in question. For exam-ple, in table 2, the marginal effect of E1-E2 paygrade is -17.25(significant at the 99 percent level). This means that Els and E2s, aftercontrolling for subject area and individual characteristics, among oth-ers, are associated with a completion probability that is 17.25 percent-age points lower than E7-E9s, the reference paygrade group.
69
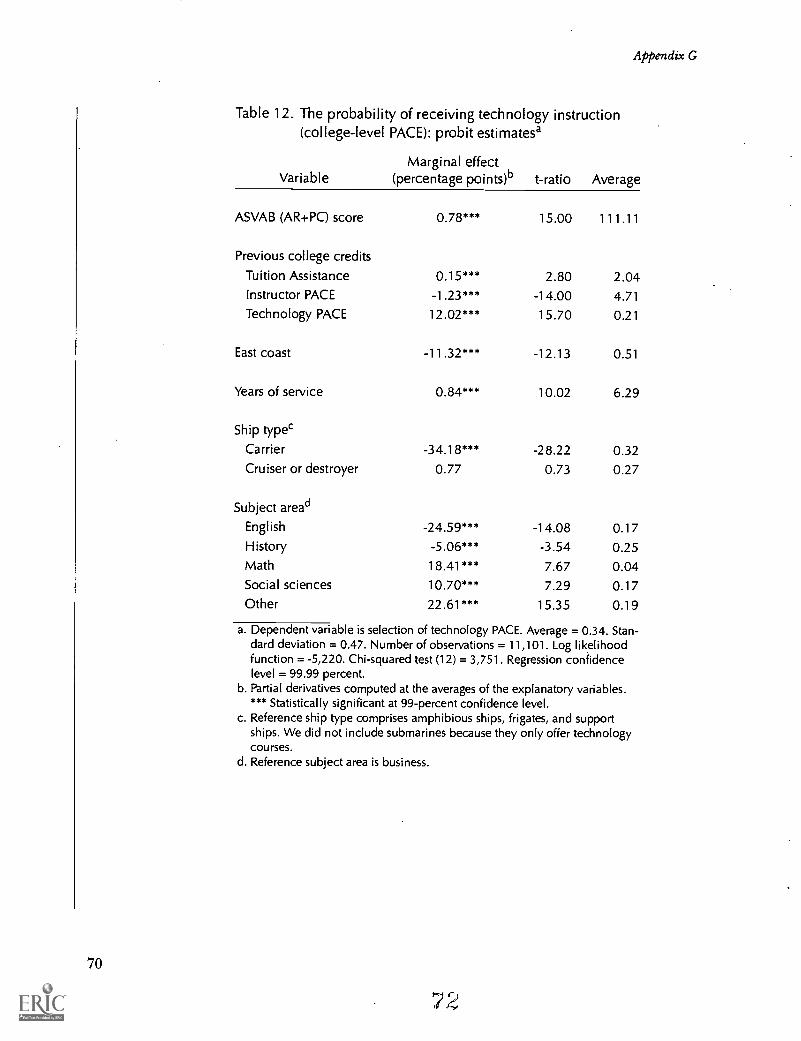
70
Appendix G
Table 12. The probability of receiving technology instruction(college-level PACE): probit estimates'
Marginal effectVariable (percentage points)b t-ratio Average
ASVAB (AR+PC) score 0.78*** 15.00 111.11
Previous college credits
Tuition Assistance 0.15*** 2.80 2.04Instructor PACE -14.00 4.71
Technology PACE 12.02*** 15.70 0.21
East coast -11.32*** -12.13 0.51
Years of service 0.84*** 10.02 6.29
Ship typec
Carrier -34.18*** -28.22 0.32Cruiser or destroyer 0.77 0.73 0.27
Subject aread
English -24.59*** -14.08 0.17History -5.06*** -3.54 0.25Math 18.41*** 7.67 0.04Social sciences 10.70*** 7.29 0.17Other 22.61*** 15.35 0.19
a. Dependent variable is selection of technology PACE. Average = 0.34. Stan-dard deviation = 0.47. Number of observations = 11,101. Log likelihoodfunction = -5,220. Chi-squared test (12) = 3,751. Regression confidencelevel = 99.99 percent.
b. Partial derivatives computed at the averages of the explanatory variables.*** Statistically significant at 99-percent confidence level.
c. Reference ship type comprises amphibious ships, frigates, and supportships. We did not include submarines because they only offer technologycourses.
d. Reference subject area is business.
'2 2

Appendix G
Table 13. The probability of passing a PACE college course:probit estimates corrected for sample selectiona
VariableMarginal effect
(percentage points)b t-ratio AverageTechnology instruction -7.16*** -2.48 0.34Failed same course before -13.18*** -3.87 0.01
Received orientation 4.48*** 4.25 0.18
Education`
Accessed without HS degree -2.28 -1.41 0.06Accessed with college experience 6.86** 2.14 0.02Recent college credits 0.17*** 6.49 6.96
Individual and career
AFQT score under 50 -2.86*** -2.73 0.18E1-E2d -17.25*** -8.07 0.09E3-E4 -10.80*** -6.56 0.45E5-E6 -6.20*** -3.95 0.37Female -0.11 -0.06 0.06African American -1.16 -1.03 0.14Hispanic 1.35 1.03 0.09Asian Pacific Islander 4.81** 2.35 0.04Married 1.38 1.60 0.50
Ship typee
Carrier 4.40*** 3.42 0.32Cruiser or destroyer 3.51*** 3.36 0.27Submarine 14.34*** 8.09 0.09
East coast -3.60 0.51
Subject areaf
English -5.94*** -4.20 0.17
H istory -6.09*** -4.93 0.25
Math -18.99*** -9.90 0.04Social sciences -5.72*** -4.27 0.17
Other -2.16 -1.49 0.19
2 .3
71
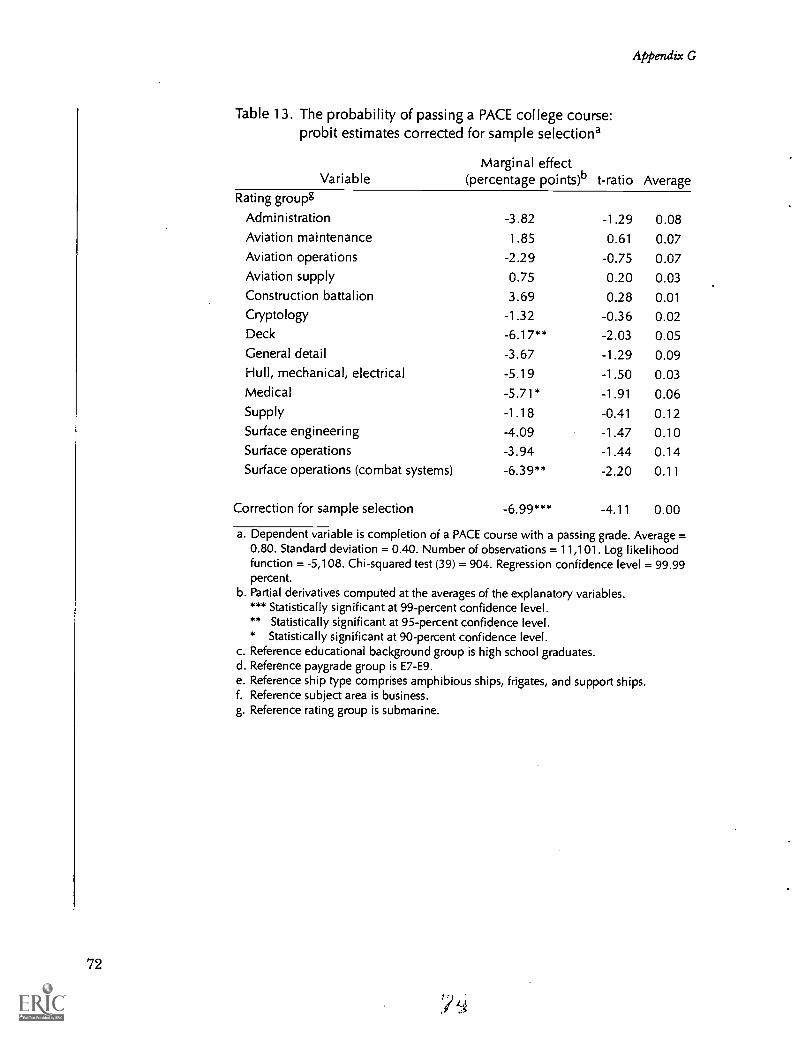
Appendix G
Table 13. The probability of passing a PACE college course:probit estimates corrected for sample selectiona
VariableMarginal effect
(percentage points)b t-ratio AverageRating groups
Administration -3.82 -1.29 0.08Aviation maintenance 1.85 0.61 0.07Aviation operations -2.29 -0.75 0.07Aviation supply 0.75 0.20 0.03Construction battalion 3.69 0.28 0.01
Cryptology -1.32 -0.36 0.02Deck -6.17** -2.03 0.05General detail -3.67 -1.29 0.09Hull, mechanical, electrical -5.19 -1.50 0.03Medical -5.71* -1.91 0.06Supply -1.18 -0.41 0.12Surface engineering -4.09 -1.47 0.10Surface operations -3.94 -1.44 0.14Surface operations (combat systems) -6.39** -2.20 0.11
Correction for sample selection -4.11 0.00
a. Dependent variable is completion of a PACE course with a passing grade. Average =0.80. Standard deviation = 0.40. Number of observations = 11,101. Log likelihoodfunction = -5,108. Chi-squared test (39) = 904. Regression confidence level = 99.99percent.
b. Partial derivatives computed at the averages of the explanatory variables.*** Statistically significant at 99-percent confidence level.** Statistically significant at 95-percent confidence level.* Statistically significant at 90-percent confidence level.
c. Reference educational background group is high school graduates.d. Reference paygrade group is E7-E9.e. Reference ship type comprises amphibious ships, frigates, and support ships.f. Reference subject area is business.g. Reference rating group is submarine.
72

References
[1] Office of Management and Budget. Guidelines and DiscountRates for Benefit-Cost Analysis of Federal Programs, Feb 1997(Circular No. A-94)
[2] Defense Finance and Accounting Service, Cleveland Center.FY98 Navy and Marine Corps Composite Standard Military Rates,Oct 1997
[3] Scott W. Dunlap et al. Program for Afloat College Education(PACE): A Cost-Effectiveness Analysis, Jan 1989 (Naval TrainingSystems Center, Special Report 89-003)
[4] David Boesel and Kyle Johnson. The DOD Tuition AssistanceProgram: Participation and Outcomes, May 1988 (Defense Man-power Data Center)
[5] Malcolm Gillis et al. Economics of Development. New York: W. W.Norton and Company, 1992
[6] Martha E. Koopman and Dan D. Goldhaber. Return on Quality-of-Life Investment, Mar 1997 (CNA Research Memorandum96-147)
[7] John Kantor, Michael Ford, and Murrey Olmsted. Navy-widePersonnel Survey (NPS) 1996: Statistical Tables for Enlisted Person-nel, Feb 1997 (Navy Personnel Research and DevelopmentCenter, NPRDC-TN-97-4)
[8] William H. Greene. Econometric Analysis. Upper Saddle River,NJ: Prentice Hall, 1997
73
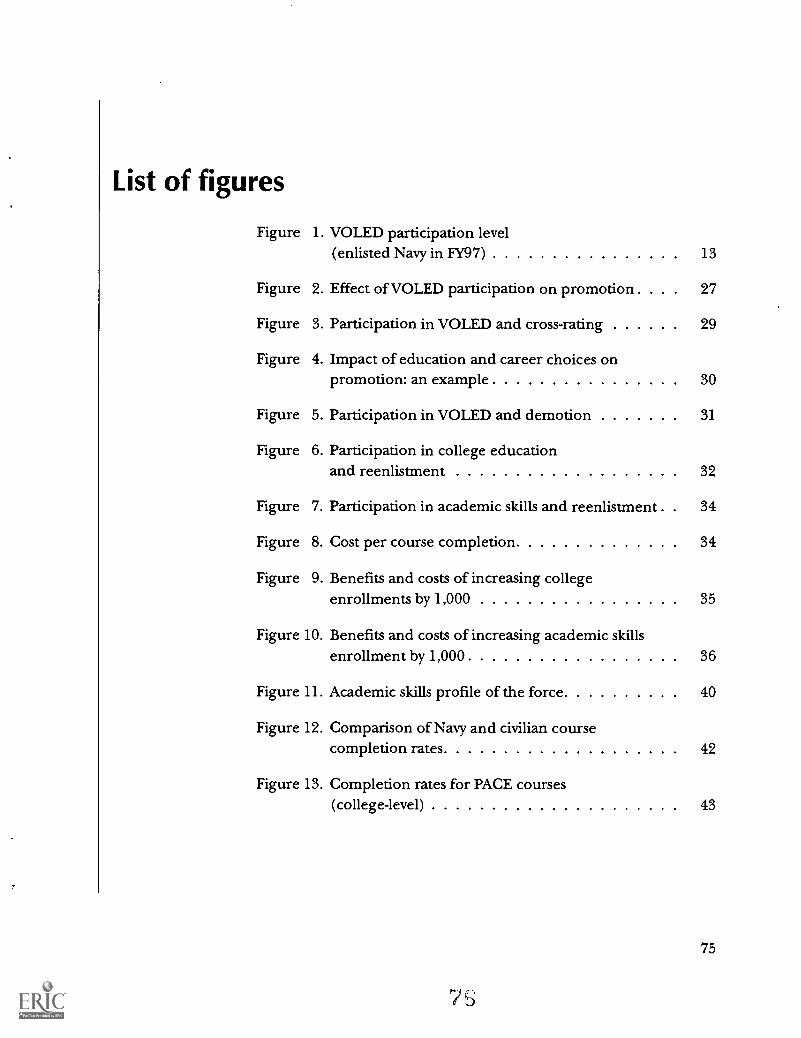
List of figures
Figure 1. VOLED participation level(enlisted Navy in FY97) 13
Figure 2. Effect of VOLED participation on promotion 27
Figure 3. Participation in VOLED and cross-rating 29
Figure 4. Impact of education and career choices onpromotion: an example 30
Figure 5. Participation in VOLED and demotion 31
Figure 6. Participation in college educationand reenlistment 32
Figure 7. Participation in academic skills and reenlistment . 34
Figure 8. Cost per course completion 34
Figure 9. Benefits and costs of increasing collegeenrollments by 1,000 35
Figure 10. Benefits and costs of increasing academic skillsenrollment by 1,000 36
Figure 11. Academic skills profile of the force 40
Figure 12. Comparison of Navy and civilian coursecompletion rates 42
Figure 13. Completion rates for PACE courses(college-level) 43
75
-
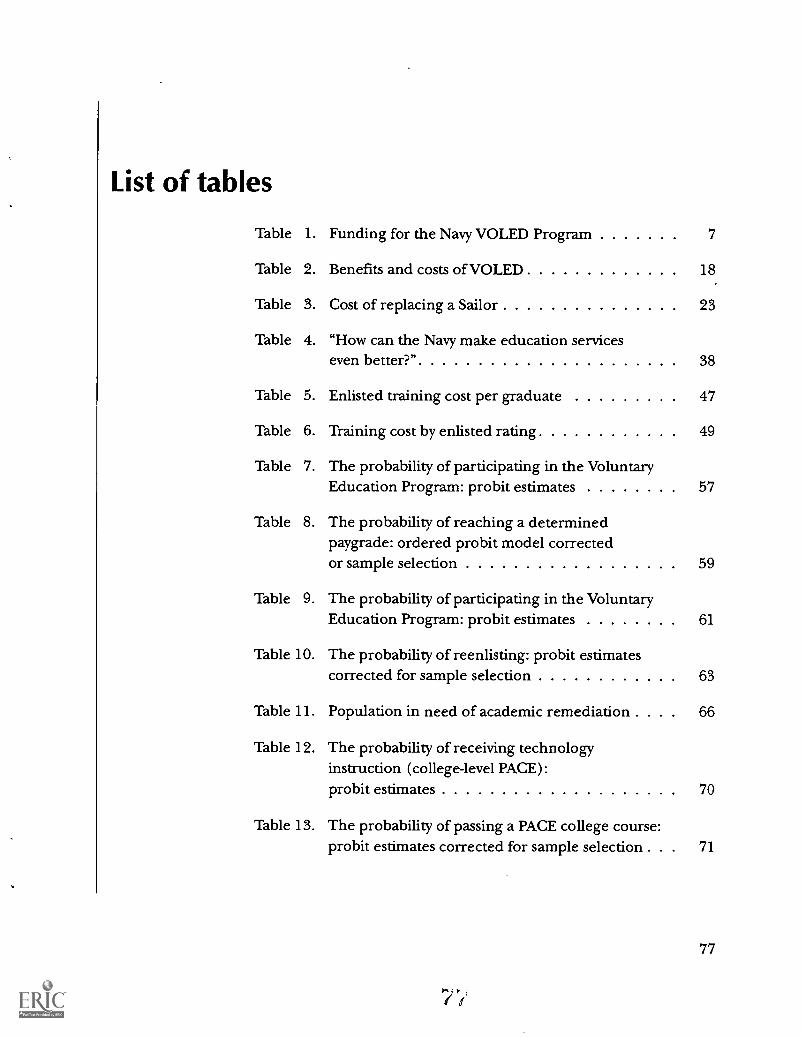
List of tables
Table 1. Funding for the Navy VOLED Program 7
Table 2. Benefits and costs of VOLED 18
Table 3. Cost of replacing a Sailor 23
Table 4. "How can the Navy make education serviceseven bette0" 38
Table 5. Enlisted training cost per graduate 47
Table 6. Training cost by enlisted rating 49
Table 7. The probability of participating in the VoluntaryEducation Program: probit estimates 57
Table 8. The probability of reaching a determinedpaygrade: ordered probit model correctedor sample selection 59
Table 9. The probability of participating in the VoluntaryEducation Program: probit estimates 61
Table 10. The probability of reenlisting: probit estimatescorrected for sample selection 63
Table 11. Population in need of academic remediation . . . 66
Table 12. The probability of receiving technologyinstruction (college-level PACE):probit estimates 70
Table 13. The probability of passing a PACE college course:probit estimates corrected for sample selection . . . 71
77
Distribution listResearch Memorandum 98-40
SNDLA1H ASSTSECNAV MRA WASHINGTON DC
Attn: ASSTSECNAV MRAAttn: MS. KAREN HEATHAttn: MS. PAM NEMFAKOS
A5 BUPERSPERS-00DPERS-01RPERS-2PERS-02PERS-05PERS-6PERS-60PERS-65PERS-66PERS-85PERS-222
Attn: MR. STEVE CYLKEPERS-285
A6 HQMC CMCAtm: MR. VERNON TAYLOR
HQMCAttn: MM DOUG MARR
FF38 USNA ANNAPOLISFF42 NAVPGSCOL MONTEREY CAFJA13 NAVPERSRANDCEN SAN DIEGO CA
Attn: MS. ELYSE KERCEAttn: MR. BERNARD ULOZASAtm: MR. GARY WILCOVE
FJB1 COMNAVCRUITCOM WASHINGTON DCFT78 NETPDTC PENSACOLA FL
Attn: COMMANDING OFFICERAttn: VOLUNTARY EDUCATION DEPARTMENTAttn: MS. MARIE GILESAttn: MR. CHARLES GIORLANDOAtm: MR. RICHARD GODLASKYAtm: MR. JAMES LOZIERAttn: MS. SHEILA NYJORDET
79

Research Memorandum 98-40
SNDLAttn: MR. JOHN PAGEAttn: MR. SANDY PARISHAtm: MR. ROBERT RUSSELAttn: MS. CAROL THOMPSON
OASD FMP/PSF&E/C SPAtm: MR. OTTO THOMAS
OSD RA (M&P)Attn: LTC PAUL BRADY
MISC HQ PERSCOMAttn: MS. DIAN STOSKOPF
HA USAF/DPPEAttn: MR. AL ARRIGHI
COGARD INSTAttn: MS. R. JOYCE TAYLOR
OSD DANTES (Code 00A)Attn: MR. BARRY COBB
OASD (FMP)Attn: MS. GAIL MCGINN
OUSD (P&R)Attn: MS. CAROLYN BECRAFT
OPNAVNINiBN12N120
N122N46
N7N7B
N80N8B
80
Attn: MR. DOUG PARRISH
Attn: CDR HOLLINBERGER
Attn: MR. ALLEN ZEMAN
Attn: MR. IRV BLICKSTEIN

Research Memorandum 98-40
SNDLN801
N8ONN813
N813R
N82
Attn: MS BONNIE MOREHOUSE
Attn: MS. JUDY CURTIS
Attn: CDR CHARLIE MARIN
81

86 - EiE
- PO
IUIIII
00'01,0086 42

U.S. Department of EducationOffice of Educational Research and Improvement (OEM)
National Library of Education (NLE)Educational Resources Information Center (ERIC)
REPRODUCTION RELEASE(Specific Document)
I. DOCUMENT IDENTIFICATION:
ERIC
Title: q,26h 012.1 or +k V43n+grj E uci06 A pror DIA
Author(s): eAa e4) E. G73trula,, trmsi H. 11 b.adi4 L keseCorporate Source:
Ce-146 -6( N)edgi AngbseiPublication Date:
rilJ 0q98'rII. REPRODUCTION RELEASE:
In order to disseminate as widely as possible timely and significant materials ofinterest to the educational community, documents announced In themonthty abstract journal of the ERIC system, Resources In Education (RIE), are usually made available to users in microfiche, reproduced paper copy,and electronic media, and sold through the ERIC Document Reproduction Service (EDRS). Credit is given to the source of each document, and, ifreproduction release is granted, one of the following notices is affixed to the document.
If permission is granted to reproduce and disseminate the identified document, please CHECK ONE of the following three options and sign at the bottomof the page.
The sample sticker shown below win beaffixed to all Level 1 documents
1
PERMISSION TO REPRODUCE ANDDISSEMINATE THIS MATERIAL HAS
BEEN GRANTED BY
TO THE EDUCATIONAL RESOURCESINFORMATION CENTER (ERIC)
Level 1
Check here for Level I release. permitting reproductionand dissemination in miaoliche or other ERIC archival
media (e.g., siectronic) and psoor copy.
Signhere,-)please
The sample radar shown below wAl beaffixed to all Level 2A documents
PERMISSION TO REPRODUCE ANDDISSEMINATE THIS MATERIAL IN
MICROFICHE, AND IN ELECTRONIC MEDIAFOR ERIC COLLECTION SUBSCRIBERS ONLY,
HAS BEEN GRANTED BY
2A
TO THE EDUCATIONAL RESOURCESINFORMATION CENTER (ERIC)
Level 2A
Check here tor Level 2A release. permitting reproductronand dlueminadon In meecho' and in electronic media
for ERIC archival collection subsalbers only
The sample sticker shown below win beaffixed to all Level 28 documents
PERMISSION TO REPRODUCE ANDDISSEMINATE THIS MATERIAL IN
MICROFICHE ONLY HAS BEEN GRANTED BY
2B
cfrTO THE EDUCATIONAL RESOURCES
INFORMATION CENTER (ERIC)
Level 213
Check here for Level 28 miens. permittingreproduction end dissemination in microfiche only
Documents will be processed as indicated provided reptoduction quality permits.If pemilssion to reproduce Is granted. but no kat Is chedted. documents will be processed at Level I.
I hereby gent to the Educational Resources Information Center (ERIC) nonexclusivepermission to reproduce and disseminate this documentas indicated above. Reproducticin from the ERIC microfiche or electronic media by persons,other than ERIC employees and its systemcontractors requires permission from the copyright holder. Exception is made for non-profit reproduction by fibreries end other service agenciesto satisfy information needs of educators in response to discrete inquiries.
F4e,g60,:a)ft-iwicammiw. mgv5i An3
eNoi f6701 Aw.
Signature: Printed harne/PoslboniThle:
FQ,dzriarE. Gro'QM cra4-
Atzv. mdir 12, VA nao/.
E4Aail Address: ecd'a onsi.*ri
FAL V.),3 e3V 7V9
Date: trig 21/1(over)

III. DOCUMENT AVAILABILITY INFORMATION (FROM NON-ERIC SOURCE):
If permission to reproduce is not granted to ERIC, or, if you wish ERIC to cite the availability of the document from another source, pleaseprovide the following information regarding the availability of the document. (ERIC will not announce a document unless it is publiclyavailable, and a dependable source can be specified. Contributors should also be aware that ERIC selection criteria are significantly morestringent for documents that cannot be made available through EDRS.)
Publisher/Distributor:Cer\keY kmal seS
Address: 'Vv4 `TtrA AvAnuzMen An* VA sava- Ovqg
Piwne 2,0Price:
Cric
IV. REFERRAL OF ERIC TO COPYRIGHT/REPRODUCTION RIGHTS HOLDER:If the right to grant this reproduction release is held by someone other than the addressee, please provide the appropriate name andaddress:
Name:
Address:
V. WHERE TO SEND THIS FORM:
Send this form to the following ERIC Clearinghouse:
However, if solicited by the ERIC Facility, or if making an unsolicited contribution to ERIC, return this form (and the document beingcontributed) to:
ERIC Processing and Reference Facilityiioo West Street, 2nd Floor
Laurel, Maryland 20707-3598
Telephone: 301-497-4080Toll Free: 800-7994742
FAX: 301-953-0263e-mail: erlcfacsaineLed.gov
WWW: http://ericfac.plccard.csc.com
EFF-088 (Rev. 9/97)PRFVICA IS vpracinnic TI-11C CrIDIA ADC noeni