9. source and petrogenesis of the igneous complex cored during
TRANSCRIPT
Morris, J.D., Villinger, H.W., and Klaus, A. (Eds.)Proceedings of the Ocean Drilling Program, Scientific Results Volume 205
9. SOURCE AND PETROGENESIS
OF THE IGNEOUS COMPLEX CORED
DURING ODP LEG 205: IMPLICATIONS
FOR OFF-AXIS PLUME-RIDGE INTERACTION ON THE COCOS PLATE1
Brian Dreyer,2 Valerie Chavagnac,3 Julie Morris,2 and Laura Font3,4
ABSTRACT
New major and trace element analyses of Ocean Drilling Program Leg170 and 205 mafic igneous samples are presented along with Sr and Ndisotopic results. Samples were cored from a sill unit (Subunit 4A) and alower igneous unit (Subunit 4B) whose lower boundary was not drilled.The samples are dominantly microcrystalline to medium-grained glom-erocrystic plagioclase-clinopyroxene gabbro in a nearly holocrystallinegroundmass. Samples are dominantly low-K subalkaline tholeiites withtrace element systematics that correlate with unit stratigraphy. Usingisotopic data, trace element ratios little affected by fractionation, andabundance data from the least fractionated samples, it is possible tomodel their mantle sources and subsequent igneous processing. Melt-ing models suggest that small differences in degrees of partial meltingcan generate the two geochemical groups identified within the igneouscomplex. Crystal fractionation and accumulation have further modi-fied the melt compositions, particularly within the lower stratigraphicunit. Mixing models indicate that these units are derived from a mantlesource that is 50%–70% enriched compared to depleted mid-ocean-ridge source mantle. In the context of the complex regional tectonicand volcanic history of the Cocos plate, this igneous complex likelyrepresents melts of depleted upper mantle that were previously en-
1Dreyer, B., Chavagnac, V., Morris, J., and Font, L., 2006. Source and petrogenesis of the igneous complex cored during ODP Leg 205: implications for off-axis plume-ridge interaction on the Cocos plate. In Morris, J.D., Villinger, H.W., and Klaus, A. (Eds.), Proc. ODP, Sci. Results, 205, 1–38 [Online]. Available from World Wide Web: <http://www-odp.tamu.edu/publications/205_SR/VOLUME/CHAPTERS/212.PDF>. [Cited YYYY-MM-DD]2Department of Earth and Planetary Sciences, Washington University, One Brookings Drive, St. Louis MO 63130, USA. Correspondence author: [email protected] of Southampton, National Oceanography Centre, Southampton, Waterfront Campus, European Way, Southampton SO14 3ZH, UK.4Department of Earth Science, University of Durham, Durham DH1 3LE, UK.
Initial receipt: 22 June 2005Acceptance: 18 January 2006Web publication: 5 September 2006Ms 205SR-212
B. DREYER ET AL.SOURCE AND PETROGENESIS OF THE IGNEOUS COMPLEX 2
riched during transit near the Galápagos hotspot. A postenrichmentchange in the local–regional tectonic stress regime may have triggereddecompression melting and emplacement of the igneous complex farfrom any active spreading center or plume. Preexisting plate fractures,ridge jumps, and abandoned spreading centers may have facilitated dis-tal reach of plume-overprinted material.
INTRODUCTION
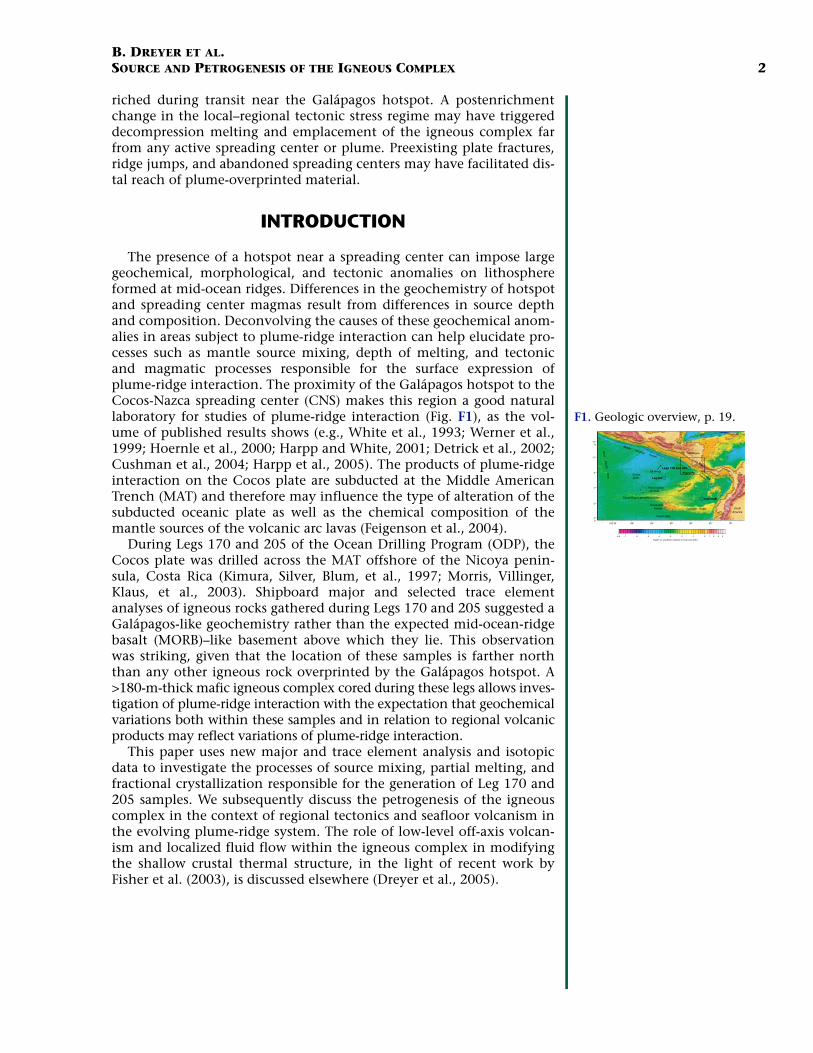
The presence of a hotspot near a spreading center can impose largegeochemical, morphological, and tectonic anomalies on lithosphereformed at mid-ocean ridges. Differences in the geochemistry of hotspotand spreading center magmas result from differences in source depthand composition. Deconvolving the causes of these geochemical anom-alies in areas subject to plume-ridge interaction can help elucidate pro-cesses such as mantle source mixing, depth of melting, and tectonicand magmatic processes responsible for the surface expression ofplume-ridge interaction. The proximity of the Galápagos hotspot to theCocos-Nazca spreading center (CNS) makes this region a good naturallaboratory for studies of plume-ridge interaction (Fig. F1), as the vol-ume of published results shows (e.g., White et al., 1993; Werner et al.,1999; Hoernle et al., 2000; Harpp and White, 2001; Detrick et al., 2002;Cushman et al., 2004; Harpp et al., 2005). The products of plume-ridgeinteraction on the Cocos plate are subducted at the Middle AmericanTrench (MAT) and therefore may influence the type of alteration of thesubducted oceanic plate as well as the chemical composition of themantle sources of the volcanic arc lavas (Feigenson et al., 2004).
During Legs 170 and 205 of the Ocean Drilling Program (ODP), theCocos plate was drilled across the MAT offshore of the Nicoya penin-sula, Costa Rica (Kimura, Silver, Blum, et al., 1997; Morris, Villinger,Klaus, et al., 2003). Shipboard major and selected trace elementanalyses of igneous rocks gathered during Legs 170 and 205 suggested aGalápagos-like geochemistry rather than the expected mid-ocean-ridgebasalt (MORB)–like basement above which they lie. This observationwas striking, given that the location of these samples is farther norththan any other igneous rock overprinted by the Galápagos hotspot. A>180-m-thick mafic igneous complex cored during these legs allows inves-tigation of plume-ridge interaction with the expectation that geochemicalvariations both within these samples and in relation to regional volcanicproducts may reflect variations of plume-ridge interaction.
This paper uses new major and trace element analysis and isotopicdata to investigate the processes of source mixing, partial melting, andfractional crystallization responsible for the generation of Leg 170 and205 samples. We subsequently discuss the petrogenesis of the igneouscomplex in the context of regional tectonics and seafloor volcanism inthe evolving plume-ridge system. The role of low-level off-axis volcan-ism and localized fluid flow within the igneous complex in modifyingthe shallow crustal thermal structure, in the light of recent work byFisher et al. (2003), is discussed elsewhere (Dreyer et al., 2005).
-8.5 -7 -6 -5 -4 -3 -2 -1 0 1 2 3 4
East P
acific Rise Cocos
plate
Nazca plate
GalapagosIslands
Cocos R
idge
Carnegie Ridge SouthAmerica
Nicaragua
Costa Rica
Middle America Trench
Legs 170 and 205
78°82°94°98° 90°102°W 86°
16°N
12°
8°
4°
0°
4°S
Depth or elevation relative to sea level (km)
Cocos-Nazca spreading center
Leg 206
Hole 504B
88 mm/yr Figure F2
Paleolocation ~14.5 Ma
Cocos track
tholeiites
F1. Geologic overview, p. 19.
B. DREYER ET AL.SOURCE AND PETROGENESIS OF THE IGNEOUS COMPLEX 3
GEOLOGICAL BACKGROUND
Tectonic Setting
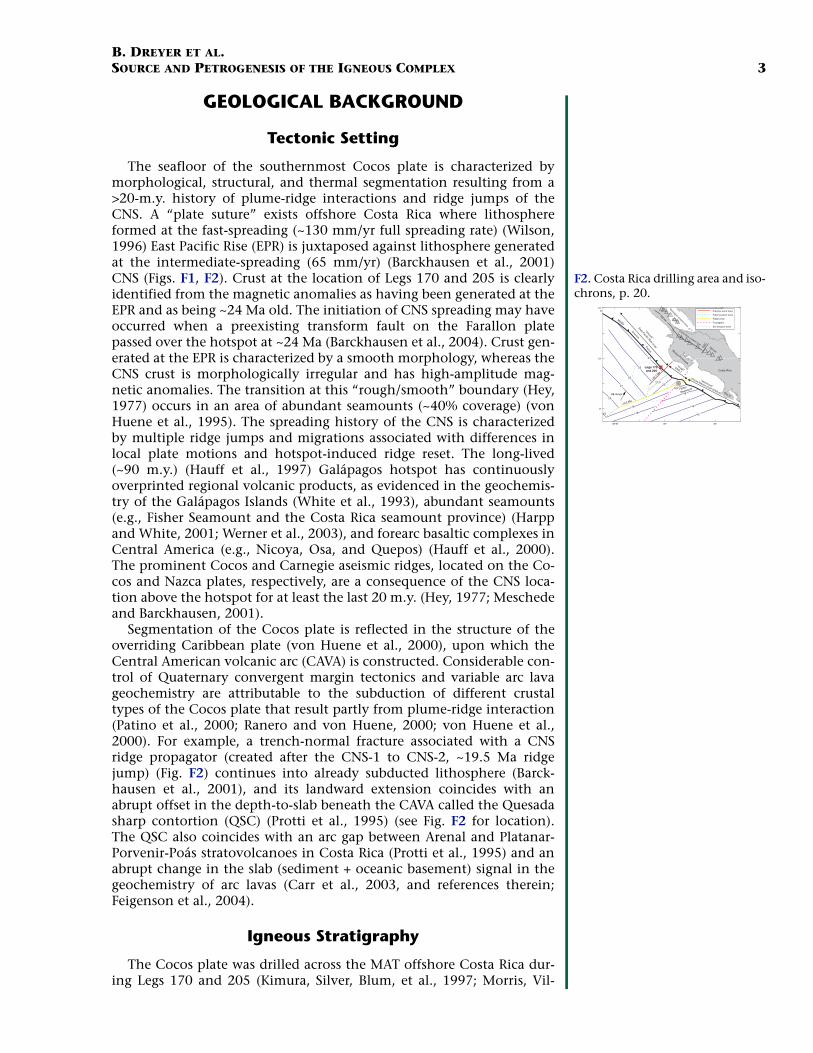
The seafloor of the southernmost Cocos plate is characterized bymorphological, structural, and thermal segmentation resulting from a>20-m.y. history of plume-ridge interactions and ridge jumps of theCNS. A “plate suture” exists offshore Costa Rica where lithosphereformed at the fast-spreading (~130 mm/yr full spreading rate) (Wilson,1996) East Pacific Rise (EPR) is juxtaposed against lithosphere generatedat the intermediate-spreading (65 mm/yr) (Barckhausen et al., 2001)CNS (Figs. F1, F2). Crust at the location of Legs 170 and 205 is clearlyidentified from the magnetic anomalies as having been generated at theEPR and as being ~24 Ma old. The initiation of CNS spreading may haveoccurred when a preexisting transform fault on the Farallon platepassed over the hotspot at ~24 Ma (Barckhausen et al., 2004). Crust gen-erated at the EPR is characterized by a smooth morphology, whereas theCNS crust is morphologically irregular and has high-amplitude mag-netic anomalies. The transition at this “rough/smooth” boundary (Hey,1977) occurs in an area of abundant seamounts (~40% coverage) (vonHuene et al., 1995). The spreading history of the CNS is characterizedby multiple ridge jumps and migrations associated with differences inlocal plate motions and hotspot-induced ridge reset. The long-lived(~90 m.y.) (Hauff et al., 1997) Galápagos hotspot has continuouslyoverprinted regional volcanic products, as evidenced in the geochemis-try of the Galápagos Islands (White et al., 1993), abundant seamounts(e.g., Fisher Seamount and the Costa Rica seamount province) (Harppand White, 2001; Werner et al., 2003), and forearc basaltic complexes inCentral America (e.g., Nicoya, Osa, and Quepos) (Hauff et al., 2000).The prominent Cocos and Carnegie aseismic ridges, located on the Co-cos and Nazca plates, respectively, are a consequence of the CNS loca-tion above the hotspot for at least the last 20 m.y. (Hey, 1977; Meschedeand Barckhausen, 2001).
Segmentation of the Cocos plate is reflected in the structure of theoverriding Caribbean plate (von Huene et al., 2000), upon which theCentral American volcanic arc (CAVA) is constructed. Considerable con-trol of Quaternary convergent margin tectonics and variable arc lavageochemistry are attributable to the subduction of different crustaltypes of the Cocos plate that result partly from plume-ridge interaction(Patino et al., 2000; Ranero and von Huene, 2000; von Huene et al.,2000). For example, a trench-normal fracture associated with a CNSridge propagator (created after the CNS-1 to CNS-2, ~19.5 Ma ridgejump) (Fig. F2) continues into already subducted lithosphere (Barck-hausen et al., 2001), and its landward extension coincides with anabrupt offset in the depth-to-slab beneath the CAVA called the Quesadasharp contortion (QSC) (Protti et al., 1995) (see Fig. F2 for location).The QSC also coincides with an arc gap between Arenal and Platanar-Porvenir-Poás stratovolcanoes in Costa Rica (Protti et al., 1995) and anabrupt change in the slab (sediment + oceanic basement) signal in thegeochemistry of arc lavas (Carr et al., 2003, and references therein;Feigenson et al., 2004).
Igneous Stratigraphy
The Cocos plate was drilled across the MAT offshore Costa Rica dur-ing Legs 170 and 205 (Kimura, Silver, Blum, et al., 1997; Morris, Vil-
88°W 86° 84°
15
16
17
18
1922
22.5
18
19
20
21
22
23
24
19
Legs 170 and 205
Middle
Costa Rica
Nicoya Peninsula
Osa P.
America
Trench
CNS-1
East Pacific Rise crust 100 km
100 km
QSC
Costa Rica volcanic front
Nicaragua volcanic front
Cocos-Nazca crust (CNS-2)88 mm/yr
Propagator
Ridge jump
Fracture zone trace
Triple junction trace
~19.5 Ma
~22.7
Ma
Fisher
Seamount
Sill intrusion zone
“smooth”
“rough”
“seamount”
12°N
10°
8°
F2. Costa Rica drilling area and iso-chrons, p. 20.
B. DREYER ET AL.SOURCE AND PETROGENESIS OF THE IGNEOUS COMPLEX 4
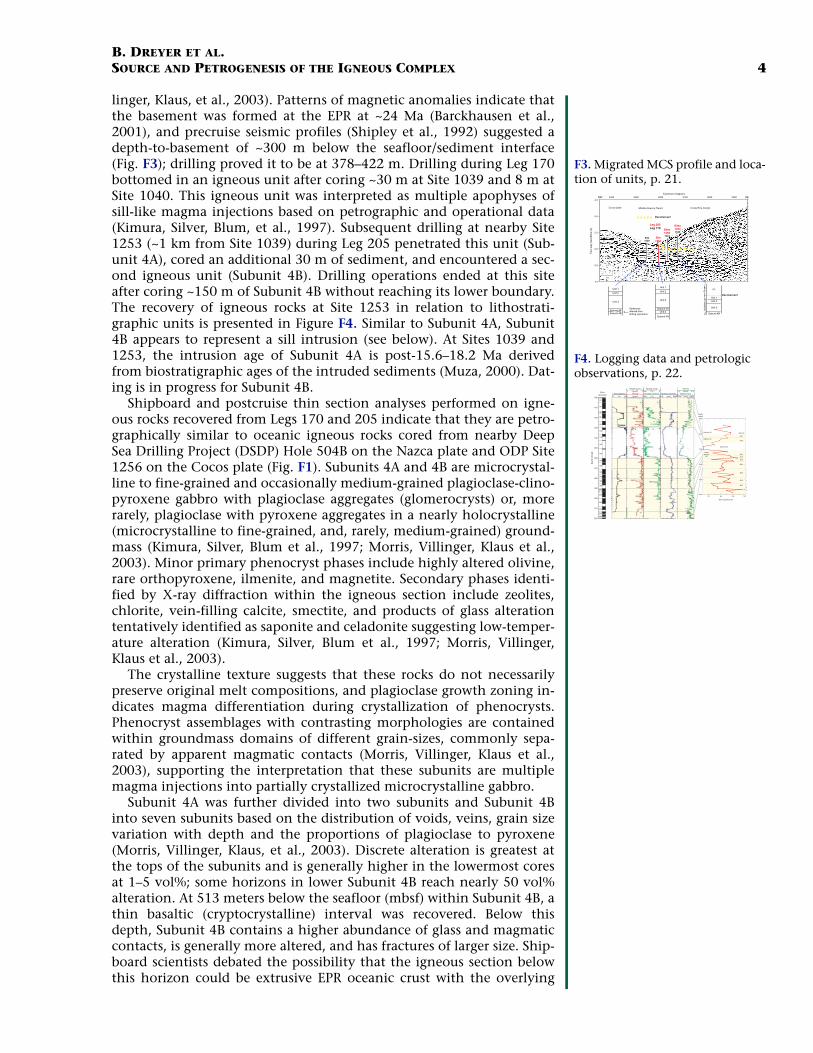
linger, Klaus, et al., 2003). Patterns of magnetic anomalies indicate thatthe basement was formed at the EPR at ~24 Ma (Barckhausen et al.,2001), and precruise seismic profiles (Shipley et al., 1992) suggested adepth-to-basement of ~300 m below the seafloor/sediment interface(Fig. F3); drilling proved it to be at 378–422 m. Drilling during Leg 170bottomed in an igneous unit after coring ~30 m at Site 1039 and 8 m atSite 1040. This igneous unit was interpreted as multiple apophyses ofsill-like magma injections based on petrographic and operational data(Kimura, Silver, Blum, et al., 1997). Subsequent drilling at nearby Site1253 (~1 km from Site 1039) during Leg 205 penetrated this unit (Sub-unit 4A), cored an additional 30 m of sediment, and encountered a sec-ond igneous unit (Subunit 4B). Drilling operations ended at this siteafter coring ~150 m of Subunit 4B without reaching its lower boundary.The recovery of igneous rocks at Site 1253 in relation to lithostrati-graphic units is presented in Figure F4. Similar to Subunit 4A, Subunit4B appears to represent a sill intrusion (see below). At Sites 1039 and1253, the intrusion age of Subunit 4A is post-15.6–18.2 Ma derivedfrom biostratigraphic ages of the intruded sediments (Muza, 2000). Dat-ing is in progress for Subunit 4B.
Shipboard and postcruise thin section analyses performed on igne-ous rocks recovered from Legs 170 and 205 indicate that they are petro-graphically similar to oceanic igneous rocks cored from nearby DeepSea Drilling Project (DSDP) Hole 504B on the Nazca plate and ODP Site1256 on the Cocos plate (Fig. F1). Subunits 4A and 4B are microcrystal-line to fine-grained and occasionally medium-grained plagioclase-clino-pyroxene gabbro with plagioclase aggregates (glomerocrysts) or, morerarely, plagioclase with pyroxene aggregates in a nearly holocrystalline(microcrystalline to fine-grained, and, rarely, medium-grained) ground-mass (Kimura, Silver, Blum et al., 1997; Morris, Villinger, Klaus et al.,2003). Minor primary phenocryst phases include highly altered olivine,rare orthopyroxene, ilmenite, and magnetite. Secondary phases identi-fied by X-ray diffraction within the igneous section include zeolites,chlorite, vein-filling calcite, smectite, and products of glass alterationtentatively identified as saponite and celadonite suggesting low-temper-ature alteration (Kimura, Silver, Blum et al., 1997; Morris, Villinger,Klaus et al., 2003).
The crystalline texture suggests that these rocks do not necessarilypreserve original melt compositions, and plagioclase growth zoning in-dicates magma differentiation during crystallization of phenocrysts.Phenocryst assemblages with contrasting morphologies are containedwithin groundmass domains of different grain-sizes, commonly sepa-rated by apparent magmatic contacts (Morris, Villinger, Klaus et al.,2003), supporting the interpretation that these subunits are multiplemagma injections into partially crystallized microcrystalline gabbro.
Subunit 4A was further divided into two subunits and Subunit 4Binto seven subunits based on the distribution of voids, veins, grain sizevariation with depth and the proportions of plagioclase to pyroxene(Morris, Villinger, Klaus, et al., 2003). Discrete alteration is greatest atthe tops of the subunits and is generally higher in the lowermost coresat 1–5 vol%; some horizons in lower Subunit 4B reach nearly 50 vol%alteration. At 513 meters below the seafloor (mbsf) within Subunit 4B, athin basaltic (cryptocrystalline) interval was recovered. Below thisdepth, Subunit 4B contains a higher abundance of glass and magmaticcontacts, is generally more altered, and has fractures of larger size. Ship-board scientists debated the possibility that the igneous section belowthis horizon could be extrusive EPR oceanic crust with the overlying
290030003100320033003400Common midpoint
Two-
way
trav
eltim
e (s
)
Site1039
Site1253
Sites12541040
Sites12551043
Cocos plate Middle America Trench Costa Rica margin
10
km
4.5
5.0
5.5
6.0
6.5
7.0
Leg 205Leg 170
Décollement
Décollement
Und
erth
rust
Pris
m
SENW
Sedimentsinferred fromdrilling operations Subunit 4B
Unit 2
Unit 3
Unit 1
P1
Subunit 4A
Subunit 4B
Unit 3
Unit 2
Unit 1
Unit 3Subunit 4ASubunit 4B
Unit 3
Unit 2
Unit 1
F3. Migrated MCS profile and loca-tion of units, p. 21.
400
410
420
430
440
450
460
470
480
490
500
510
520
1
2
3
4
5
6
Subunit 3C
Gabbro sill
Lowerigneous
unit
Subunit 3C
Hole diameter
Density (core)
Density
Porosity (core)
Porosity (neutron) Shallow resistivity
Velocity
Velocity (core)10 20(in)
(g/cm3)
(g/cm3)
(%)
(%) (Ωm)
(km/s)
(m/s)
1 3
1 3
100
100
0
0 0.2 2000
1.5 6.5
1500 6500
4B-1
4B-2
4B-3
4B-4
4B-5
4B-6
4B-7
Subunit
4A-1
4A-2
Core recovery (%)
20 10060 140
5R
6R
7R
8R
9R
10R
11R
12R
13R
14R
15R
16R
17R
18R
19R
20R
22R
23R
24R
25R
26R
Corerecovery
Dep
th (
mbs
f)
500
550
450
400
600
350
Depth(mbsf)
F4. Logging data and petrologic observations, p. 22.
B. DREYER ET AL.SOURCE AND PETROGENESIS OF THE IGNEOUS COMPLEX 5
material resulting from shallow sill emplacement. Geochemical evi-dence presented here, however, argues that all igneous material coredduring ODP Leg 205 results from magmatic overprinting of the EPRbasement that was generated from an enriched source. Hydrothermalalteration and implications of fluid flow within Subunit 4B are dis-cussed elsewhere (Dreyer et al., 2005).
ANALYTICAL METHODS
Previously published geochemical data of Subunits 4A and 4B in-clude onboard X-ray fluorescence (XRF) (Leg 170) and inductively cou-pled plasma–atomic emission spectroscopy (ICP-AES) (Leg 205) analysesof a total of 52 samples for major and selected trace elements (Kimura,Silver, Blum, et al., 1997; Morris, Villinger, Klaus, et al., 2003). An addi-tional 50 samples were powdered in an alumina ball mill and analyzedby XRF, inductively coupled plasma–mass spectrometry (ICP-MS), andinstrumental neutron activation analysis (INAA) at Washington Univer-sity in St. Louis (Missouri, USA). Results are reported here. A total of 33samples from Leg 205 were analyzed for Sr and Nd isotopes by thermalionization mass spectrometry (TIMS) at the National OceanographyCentre, Southampton (UK).
Major Elements
XRF
Major elements were determined for 34 samples from Leg 205 atWashington University by XRF analysis of fused glass discs preparedfrom preignited sample powders, using procedures described by Cou-ture et al. (1993). Loss on ignition (LOI) values represent mass loss mea-sured on sample powders ignited for 50 min at 950°C in a mufflefurnace. LOI was <0.5 wt% for most samples but was 0.91–1.46 wt% forsamples with Mg# (= Mg2+/[Mg2+ + Fe2+], where Fe2O3 is converted toFeO) >0.58 (one exception), which are clustered at the top half of Sub-unit 4B (~460–509 mbsf). Average sum of element oxides is 99.6 wt%,with all but three samples having totals between 99.5 and 100.5 wt%.Analyses of the reference basalts BHVO-2 and BIR-1 and gabbro JGB-1agree with certified values within 1 or 2 σ, except for the low values(<0.05 wt%) of K2O and P2O5 in BIR-1 (Tables T1, T2).
Trace Elements
ICP-MS
Trace element abundances were analyzed by high-resolution ICP-MS(Table T2). Powders of rock samples and geochemical reference stan-dards were dissolved with 5:1 HF:HNO3 in a microwave-assisted diges-tion system. Solutions were diluted with 1% trace metal grade HNO3 toattain a sample mass:dilution ratio of ~1:1000. For analysis of Sr, Ba, Y,and selected transition row metals, samples were further diluted to1:5000 to reduce concentrations enough to preserve detection in pulsecounting mode.
Instrument calibration for rare earth elements (REEs) and high-field-strength elements (HFSEs) (Zr, Hf, Nb, Ta, U, and Th) is performed usinga rock reference standard solution, and the regression is forced through
T1. Analysis of standard reference materials, p. 33.
T2. XRF and ICP-MS analysis, p. 35.
B. DREYER ET AL.SOURCE AND PETROGENESIS OF THE IGNEOUS COMPLEX 6
the origin after blank subtraction. This is a reliable method given the >6orders of magnitude dynamic linear range of the ICP-MS (Jarvis et al.,1992; Eggins et al., 1997). Calibration with geochemical reference stan-dards maintains approximately constant matrix conditions, includingthe presence of residual trace HF from sample digestion (McGinnis etal., 1997), and mitigates many of the issues created using calibrationwith near matrix-free synthetic cocktails of high-field-strength single-element standards. Elements that are not appreciably affected by oxideinterferences and easily rinsed with a few percent HNO3 are calibratedagainst synthetic multielement solutions created from single-elementstandards. The choice of geochemical reference standards for some ele-ments and synthetic calibration standards for others was made after ex-tensive testing of both approaches. External oxide correction for theREEs Eu-Lu and HFSEs Hf and Ta is performed offline following meth-ods modified from Lichte et al. (1987). Initial oxidation formation fac-tors range from ~3% to <0.5% for the REEs, depending on element. In-run measurement of ThO/Th during analysis monitors changes in oxideformation and allows sample-to-sample oxide correction (Lichte et al.,1987); REE + Th oxide formation is approximately linear run to run (R2
> 0.97).Typical instrument runs include measurements of procedural blanks,
geochemical reference standards, and a drift solution interspersed fre-quently with sample solutions. Accuracy and precision based on repli-cate measurements of appropriate geochemical reference standards JGb-1 and BIR-1 are shown in Table T1.
INAA
Trace elements for 16 samples from Leg 170 (12 from Site 1039 and 4from Site 1040) were measured by INAA at Washington University in St.Louis (Table T3). Powdered rock chips were encapsulated in high-puritysilica tubing and subsequently irradiated at the University of Missouriresearch reactor in a thermal neutron flux of 5.15 × 1013 cm/s. Sampleswere radioassayed by gamma ray spectroscopy following the methodsof Korotev (1996), and data were reduced using an updated version ofthe TEABAGS (trace element analysis by automated gamma ray spec-troscopy) software developed by Lindstrom and Korotev (1982). Esti-mated accuracy and 1-σ precision for standard reference material JGb-1is given in Table T1.
Comparison of Multiple Data Sets
The coherence of data measured by multiple analytical techniqueswas evaluated by comparing ongoing, long-term analyses of standardreference materials at Washington University in St. Louis. Analyses ofrepeated determinations of reference basalts BCR-1 and NBS-688 byXRF and INAA methods at Washington University (Korotev, 1996; Cou-ture et al., 1993) are in excellent agreement with certified values. Sev-eral trace elements of reference basalt JGb-1 have also been measuredby both INAA and ICP-MS at Washington University and agree within2-σ error (Table T1).
T3. INA analysis, p. 38.
B. DREYER ET AL.SOURCE AND PETROGENESIS OF THE IGNEOUS COMPLEX 7
RESULTS
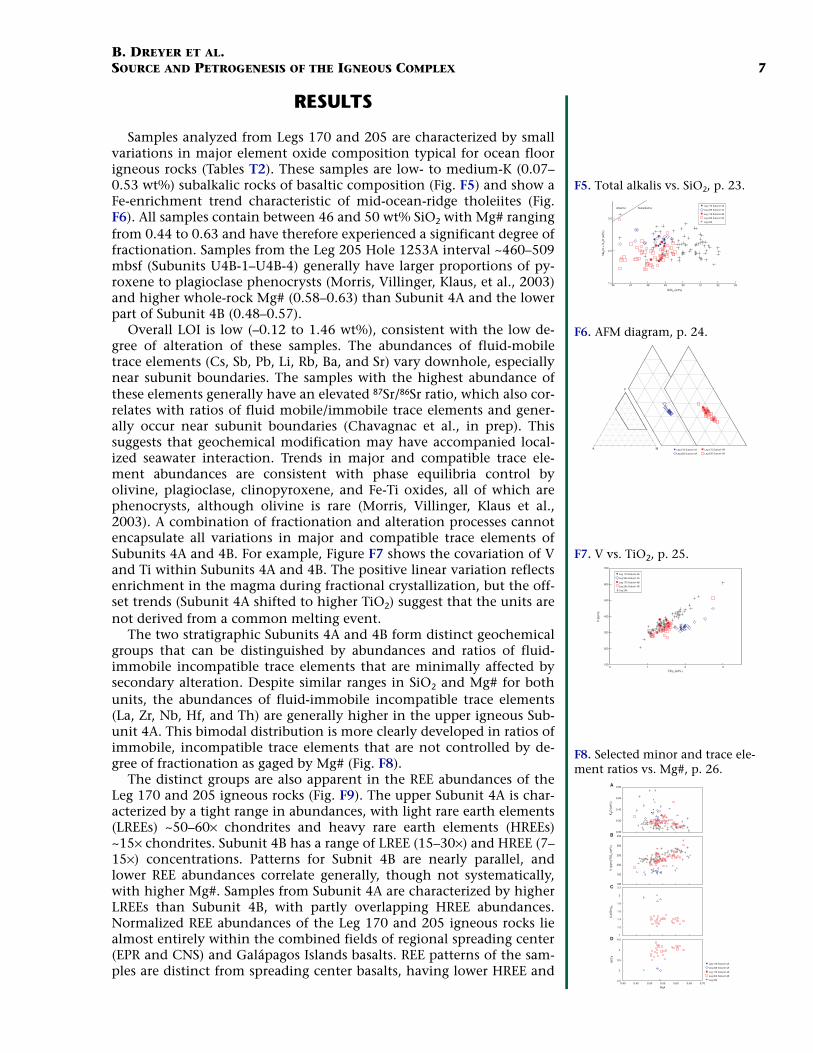
Samples analyzed from Legs 170 and 205 are characterized by smallvariations in major element oxide composition typical for ocean floorigneous rocks (Tables T2). These samples are low- to medium-K (0.07–0.53 wt%) subalkalic rocks of basaltic composition (Fig. F5) and show aFe-enrichment trend characteristic of mid-ocean-ridge tholeiites (Fig.F6). All samples contain between 46 and 50 wt% SiO2 with Mg# rangingfrom 0.44 to 0.63 and have therefore experienced a significant degree offractionation. Samples from the Leg 205 Hole 1253A interval ~460–509mbsf (Subunits U4B-1–U4B-4) generally have larger proportions of py-roxene to plagioclase phenocrysts (Morris, Villinger, Klaus, et al., 2003)and higher whole-rock Mg# (0.58–0.63) than Subunit 4A and the lowerpart of Subunit 4B (0.48–0.57).
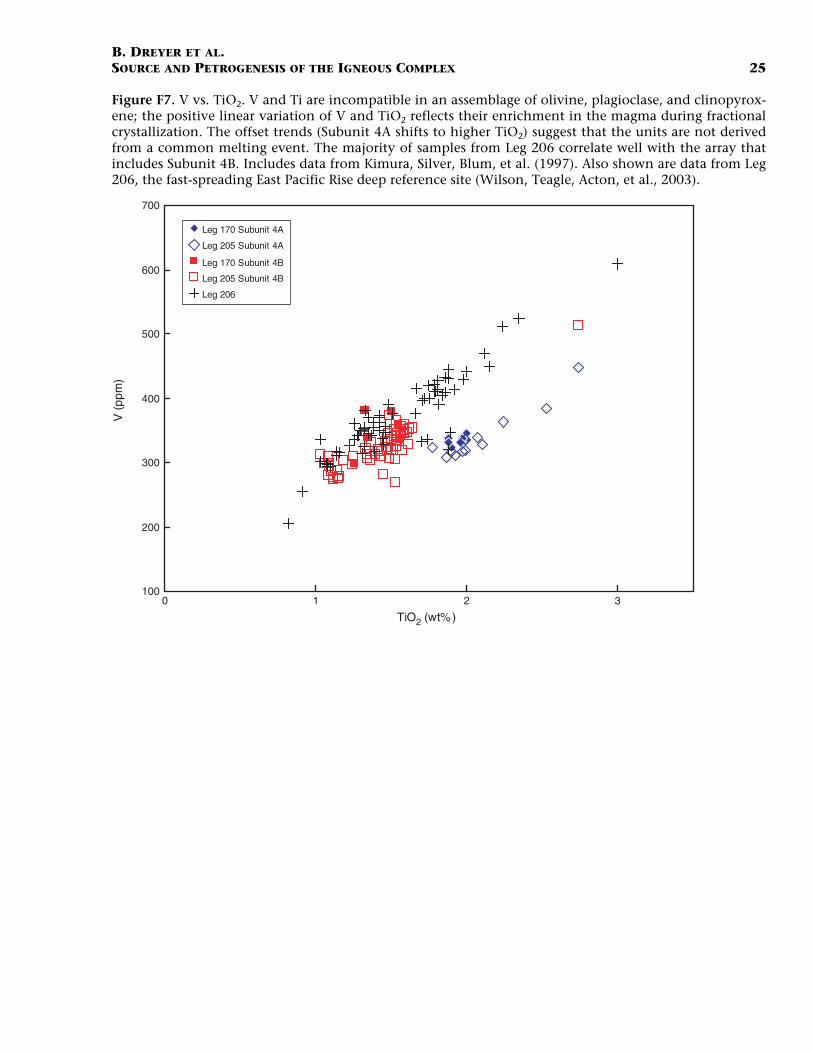
Overall LOI is low (–0.12 to 1.46 wt%), consistent with the low de-gree of alteration of these samples. The abundances of fluid-mobiletrace elements (Cs, Sb, Pb, Li, Rb, Ba, and Sr) vary downhole, especiallynear subunit boundaries. The samples with the highest abundance ofthese elements generally have an elevated 87Sr/86Sr ratio, which also cor-relates with ratios of fluid mobile/immobile trace elements and gener-ally occur near subunit boundaries (Chavagnac et al., in prep). Thissuggests that geochemical modification may have accompanied local-ized seawater interaction. Trends in major and compatible trace ele-ment abundances are consistent with phase equilibria control byolivine, plagioclase, clinopyroxene, and Fe-Ti oxides, all of which arephenocrysts, although olivine is rare (Morris, Villinger, Klaus et al.,2003). A combination of fractionation and alteration processes cannotencapsulate all variations in major and compatible trace elements ofSubunits 4A and 4B. For example, Figure F7 shows the covariation of Vand Ti within Subunits 4A and 4B. The positive linear variation reflectsenrichment in the magma during fractional crystallization, but the off-set trends (Subunit 4A shifted to higher TiO2) suggest that the units arenot derived from a common melting event.
The two stratigraphic Subunits 4A and 4B form distinct geochemicalgroups that can be distinguished by abundances and ratios of fluid-immobile incompatible trace elements that are minimally affected bysecondary alteration. Despite similar ranges in SiO2 and Mg# for bothunits, the abundances of fluid-immobile incompatible trace elements(La, Zr, Nb, Hf, and Th) are generally higher in the upper igneous Sub-unit 4A. This bimodal distribution is more clearly developed in ratios ofimmobile, incompatible trace elements that are not controlled by de-gree of fractionation as gaged by Mg# (Fig. F8).
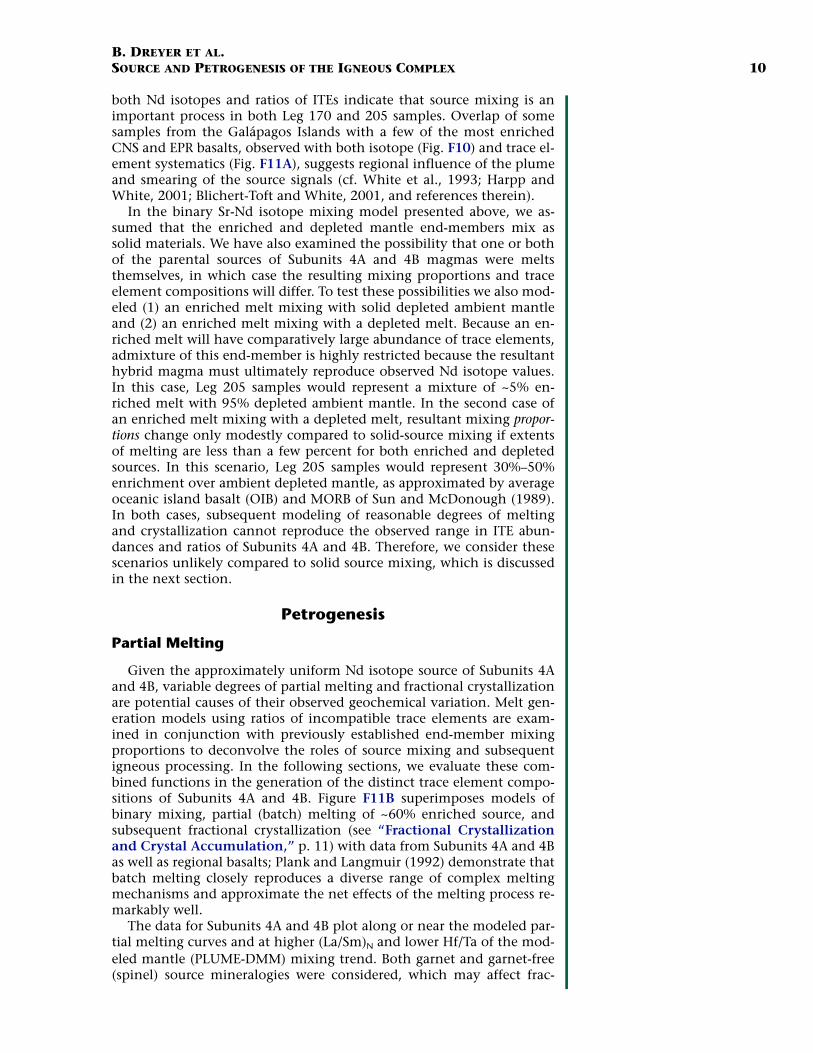
The distinct groups are also apparent in the REE abundances of theLeg 170 and 205 igneous rocks (Fig. F9). The upper Subunit 4A is char-acterized by a tight range in abundances, with light rare earth elements(LREEs) ~50–60× chondrites and heavy rare earth elements (HREEs)~15× chondrites. Subunit 4B has a range of LREE (15–30×) and HREE (7–15×) concentrations. Patterns for Subnit 4B are nearly parallel, andlower REE abundances correlate generally, though not systematically,with higher Mg#. Samples from Subunit 4A are characterized by higherLREEs than Subunit 4B, with partly overlapping HREE abundances.Normalized REE abundances of the Leg 170 and 205 igneous rocks liealmost entirely within the combined fields of regional spreading center(EPR and CNS) and Galápagos Islands basalts. REE patterns of the sam-ples are distinct from spreading center basalts, having lower HREE and
1.5
2.5
3.5
46 47 48 49 50 51 52 53
SiO2 (wt%)
Na 2
O +
K2O
(w
t%)
Leg 170 Subunit 4A
Leg 205 Subunit 4A
Leg 170 Subunit 4B
Leg 205 Subunit 4B
Leg 206
Alkaline Subalkaline
F5. Total alkalis vs. SiO2, p. 23.
F
MA Leg 170 Subunit 4A
Leg 205 Subunit 4A
Leg 170 Subunit 4B
Leg 205 Subunit 4B
F6. AFM diagram, p. 24.
100
200
300
400
500
600
700
0 1 2 3
TiO2 (wt%)
V (p
pm)
Leg 170 Subunit 4A
Leg 205 Subunit 4A
Leg 170 Subunit 4B
Leg 205 Subunit 4B
Leg 206
F7. V vs. TiO2, p. 25.
0.40 0.45 0.50 0.55 0.60 0.65 0.70
Mg#
100
150
200
250
300
350
0.00
0.20
0.40
0.60
0.80
1
1.2
1.4
1.6
1.8
2
2.2
2.5
3
3.5
4
4.5
V (p
pm)/T
iO2
(wt%
)K
2O (w
t%)
(La/
Sm
) N
B
A
C
D
Hf/T
a
Leg 170 Subunit 4A
Leg 205 Subunit 4A
Leg 170 Subunit 4B
Leg 205 Subunit 4B
Leg 206
F8. Selected minor and trace ele-ment ratios vs. Mg#, p. 26.

B. DREYER ET AL.SOURCE AND PETROGENESIS OF THE IGNEOUS COMPLEX 8
higher LREE abundance patterns, and are more similar to moderatelyenriched basalts of the Galápagos Islands.
DISCUSSION
Mantle Source and Mixing Relationships
Sr and Nd Isotopes
The compositional ranges of regional hotspot-related volcanic prod-ucts have been attributed to mixing of three or more end-members inaddition to a depleted MORB source (White et al., 1993; Kurz and Geist,1999; Harpp and White, 2001; Blichert-Toft and White, 2001; Harpp etal., 2005). One end-member (most prevalent in lavas from the Wolf-Darwin Lineament) accounts exclusively for elevated Pb isotope sys-tematics but a small amount of total variation (3.3%) (Harpp andWhite, 2001; Harpp et al., 2005). As this data set does not yet exist forour samples, the remaining regional geochemical end-members reduceto (1) depleted, MORB source; (2) enriched, plume source; and(3) elevated incompatible trace element (ITE), Sr radiogenic (Bow, 1978;Bow and Geist, 1992; Geist, 1992; Graham et al., 1993; Harpp andWhite, 2001; Blichert-Toft and White, 2001). The locus of this last po-tential end-member (“FLO” of Harpp and White, 2001) is thought to bebeneath Isla Floreana in the southern Galápagos archipelago, but it maynot represent a signal of the plume (Kurz and Geist, 1999).
Neodymium isotopes are used here to help constrain mixing rela-tionships between the aforementioned geochemical mantle end-mem-bers and as a prerequisite for the identification of reasonable parentaltrace element composition that will, in turn, be used to model petro-genesis. Figure F10 plots Sr-Nd isotopic values of samples from Subunits4A and 4B from Leg 205 and fields of the EPR, CNS, and the GalápagosIslands, along with tholeiitic seamounts north of the Cocos Ridge axisproximal to the locations of Legs 170 and 205. The restricted range inNd isotopes (0.512937–0.512974, N = 25; one value extends to0.513020) indicates that Subunits 4A and 4B sample an approximatelyuniform 143Nd/144Nd source despite the wide regional isotopic variation.This mantle source is more isotopically enriched (less radiogenic Nd)than that of EPR MORB and is likely a mixture of more and less en-riched mantles, similar to the source for the Galápagos Islands, regionalseamounts, and the Cocos and Carnegie Ridges (White et al., 1993; Ho-ernle et al., 2000, 2002; Harpp and White, 2001; Harpp et al., 2005).The overlapping fields suggest widespread mixing, as has been arguedpreviously for the CNS (White et al., 1993; Hoernle et al., 2000). An ex-tended discussion on the relationship between the enriched signaturesof Subunits 4A and 4B with those of seamounts on the flanks of the EPRexisting far from plume influence (Nui and Batiza, 1997; Nui et al.,2002) is beyond the scope of this paper. However, a link between Sub-units 4A and 4B and the Galápagos hotspot is suggested from geochem-ical similarities and the proximity of the hotspot and the paleolocationof emplacement. Though not conclusive in resolving the source of en-richment, we note that the 143Nd/144Nd ratios of Subunits 4A and 4B(only one value above 0.513000) are more enriched than the vast ma-jority of EPR flank seamount lavas (143Nd/144Nd = 0.512956–0.513183)(Nui et al., 2002).
1
10
100
La Ce Pr Nd Sm Eu Gd Tb Dy Ho Er Tm Yb Lu
Sam
ple/
CI c
hond
rite
Leg 170 Subunit 4A Leg 170 Subunit 4B
1
10
100
La Ce Pr Nd Sm Eu Gd Tb Dy Ho Er Tm Yb Lu
Sam
ple/
CI c
hond
rite
Leg 205 Subunit 4A Leg 205 Subunit 4B
A
B
F9. Chondrite-normalized REE diagram, p. 28.
0.702250 0.702750 0.703250 0.703750 0.704250 0.704750 0.705250
87Sr/86Sr
143 N
d/14
4 Nd
FLO
DMM
PLUME
Seawateralteration
GalapagosIslands
EPR
Hybrid
CNS Subunit 4A
Subunit 4B
Fisher Seamount
Mixing line
Cocos track tholeiites
Hybrid-FLO
0.512800
0.512850
0.512900
0.512950
0.513000
0.513050
0.513100
0.513150
0.513200
F10. 143Nd/144Nd vs. 87Sr/86Sr, p. 29.

B. DREYER ET AL.SOURCE AND PETROGENESIS OF THE IGNEOUS COMPLEX 9
Assuming that elevated (higher 87Sr/86Sr) ratios seen in Leg 205 sam-ples is due to seawater interaction, and therefore not primary, Nd iso-topes are used to calculate mixing proportions between depleted MORBmantle and the enriched Galápagos end-member. The majority of Leg205 samples are derived from a mantle source that is 50%–70% en-riched; one sample requires ~30% enrichment to explain elevated144Nd/144Nd = 0.513020. If the mantle source is isotopically homoge-neous as argued, then variations observed in minor and fluid-immobileincompatible trace elements are most likely due to differences in de-grees of partial melting and/or fractional crystallization. The premisethat elevated Sr isotope values are due to seawater interaction ratherthan admixture of the FLO end-member is supported by several inde-pendent lines of evidence. Most Sr isotope excursions are correlatedwith increased ratios of fluid-mobile:less-fluid-mobile trace elementsand measurements of increased fracture density (Pfender and Vil-linger, this volume; Chavagnac et al., in prep), suggesting a secondaryorigin. The trend of Leg 205 Sr-Nd isotopes is primarily horizontal to-ward elevated Sr isotopic values with very limited variation in Nd isoto-pic values. This is in contrast with trends predicted by modeling mixingof the FLO end-member with a uniform mantle source, itself composedof depleted MORB and enriched plume components. Furthermore, 87Sr/86Sr values of several samples extend beyond the range of values ex-pected from a three-component mixture (Fig. F10). We conclude thatcompositions of Leg 205 samples are dominated by binary mixing ofenriched and depleted sources; this question will be revisited with traceelements.
Trace Elements
Regional geochemical end-members have characteristic trace ele-ment abundances. Figure F11A plots data from regional basalts and il-lustrates end-member mixing relationships in terms of ratios ofchondrite-normalized (La/Sm)N vs. Hf/Ta, forming the hyperbolic“mantle mixing” trend. Samples from Subunits 4A and 4B are well sepa-rated; ratios of additional immobile incompatible elements (e.g., Nb/Yand Zr/Y) give similar results. Generally, Subunit 4A has (La/Sm)N >1.75and Hf/Ta <3.5, and samples from Subunit 4B have (La/Sm)N <1.5 andHf/Ta >3.5, with the exception of one sample (Hf/Ta ~2.5). Leg 170 and205 samples cluster toward the enriched end-member and lie within afield outlined by the Galápagos Islands. Samples from the “main series”from Isla Floreana of the Galápagos Islands trend toward anomalouslyhigh (La/Sm)N, the locus of proposed ITE-rich FLO end-member. Meltmodeling, presented in detail in the following section, shows that in-creasingly small degrees of partial melting of a hybrid mixture of en-riched and depleted sources would approach the high (La/Sm)N, low Hf/Ta of the ITE-rich Isla Floreana samples, but melt processes alone areunable to explain the distinctive isotope systematics of this end-mem-ber (namely, high 206,208Pb/204Pb, high 87Sr/86Sr, low 143Nd/144Nd, and rel-atively high 176Hf/177Hf) (cf. Kurz and Geist, 1999). Variable decouplingbetween isotopes and ITE ratios during igneous processing of Galápagoshotspot products is discussed in Harpp et al, (2005). Without more de-finitive Pb and Hf isotope data, we tentatively conclude that the FLOend-member is not a significant component in the source of Leg 170and 205 samples and have instead focused, therefore, on two-compo-nent mixing between enriched and depleted end-members. In sum,
0
1
2
3
4
5
6
7
0 5 10 15
Hf/Ta
(La/
Sm
) N
Isla Floreana
A
Galapagos Islands
EPR
CNS
OIB
MORB
PM
Leg 170 Subunit 4A
Leg 205 Subunit 4A
Leg 170 Subunit 4B
Leg 205 Subunit 4B
F11. (La/Sm)N vs. Hf/Ta, p. 30.
B. DREYER ET AL.SOURCE AND PETROGENESIS OF THE IGNEOUS COMPLEX 10
both Nd isotopes and ratios of ITEs indicate that source mixing is animportant process in both Leg 170 and 205 samples. Overlap of somesamples from the Galápagos Islands with a few of the most enrichedCNS and EPR basalts, observed with both isotope (Fig. F10) and trace el-ement systematics (Fig. F11A), suggests regional influence of the plumeand smearing of the source signals (cf. White et al., 1993; Harpp andWhite, 2001; Blichert-Toft and White, 2001, and references therein).
In the binary Sr-Nd isotope mixing model presented above, we as-sumed that the enriched and depleted mantle end-members mix assolid materials. We have also examined the possibility that one or bothof the parental sources of Subunits 4A and 4B magmas were meltsthemselves, in which case the resulting mixing proportions and traceelement compositions will differ. To test these possibilities we also mod-eled (1) an enriched melt mixing with solid depleted ambient mantleand (2) an enriched melt mixing with a depleted melt. Because an en-riched melt will have comparatively large abundance of trace elements,admixture of this end-member is highly restricted because the resultanthybrid magma must ultimately reproduce observed Nd isotope values.In this case, Leg 205 samples would represent a mixture of ~5% en-riched melt with 95% depleted ambient mantle. In the second case ofan enriched melt mixing with a depleted melt, resultant mixing propor-tions change only modestly compared to solid-source mixing if extentsof melting are less than a few percent for both enriched and depletedsources. In this scenario, Leg 205 samples would represent 30%–50%enrichment over ambient depleted mantle, as approximated by averageoceanic island basalt (OIB) and MORB of Sun and McDonough (1989).In both cases, subsequent modeling of reasonable degrees of meltingand crystallization cannot reproduce the observed range in ITE abun-dances and ratios of Subunits 4A and 4B. Therefore, we consider thesescenarios unlikely compared to solid source mixing, which is discussedin the next section.
Petrogenesis
Partial Melting
Given the approximately uniform Nd isotope source of Subunits 4Aand 4B, variable degrees of partial melting and fractional crystallizationare potential causes of their observed geochemical variation. Melt gen-eration models using ratios of incompatible trace elements are exam-ined in conjunction with previously established end-member mixingproportions to deconvolve the roles of source mixing and subsequentigneous processing. In the following sections, we evaluate these com-bined functions in the generation of the distinct trace element compo-sitions of Subunits 4A and 4B. Figure F11B superimposes models ofbinary mixing, partial (batch) melting of ~60% enriched source, andsubsequent fractional crystallization (see “Fractional Crystallizationand Crystal Accumulation,” p. 11) with data from Subunits 4A and 4Bas well as regional basalts; Plank and Langmuir (1992) demonstrate thatbatch melting closely reproduces a diverse range of complex meltingmechanisms and approximate the net effects of the melting process re-markably well.
The data for Subunits 4A and 4B plot along or near the modeled par-tial melting curves and at higher (La/Sm)N and lower Hf/Ta of the mod-eled mantle (PLUME-DMM) mixing trend. Both garnet and garnet-free(spinel) source mineralogies were considered, which may affect frac-
B. DREYER ET AL.SOURCE AND PETROGENESIS OF THE IGNEOUS COMPLEX 11
tionation within the REEs and Hf from Ta during partial melting be-cause of their contrasting incompatibilities in the presence of garnet.Additional melt modeling (not shown) using the REE concentrations ofSubunits 4A and 4B indicates that a small, early formed proportion ofthe total melt occurring in the presence of garnet can transmit the char-acteristic slope of the HREE to the subsequent melts. Although pub-lished melting models for the vast majority of Galápagos Islandseamounts and the Cocos and Carnegie Ridges (Harpp and White,2001; Harpp et al., 2005) indicate the majority of melting in the pres-ence of garnet, the gentle slope of normalized HREE patterns for bothSubunits 4A and 4B suggests that the bulk of melting did not occur inthe garnet stability field (i.e., >60 km) (Fig. F9).
Combined results suggest that the majority of Subunit 4A and 4Bsamples are adequately explained by 2%–7% partial melting of a hybridsource containing 50%–70% of the enriched end-member (Fig. F11B;see caption for model details). Furthermore, Subunit 4A is distinguishedfrom Subunit 4B by lower degrees of partial melting; a difference of atleast 2% melting separates Subunit 4A from Subunit 4B (Fig. F11B). Off-set linear trends of V vs. TiO2 (Fig. F7) and variable ITE ratios (such asHf/Ta) (Fig. F8) at similar Mg# are also consistent with variations in de-gree of partial melting. More sophisticated models of polybaric partialmelting that consider the compositional dependence of partition coeffi-cients have yet to be applied, but it appears that Subunits 4A and 4B arenot associated with extensive melting at lithospheric levels deeper thantypical MORB despite geochemical evidence for hotspot overprinting.These conditions place limitations on melt generation in proximity tothe plume (see “Models of Sill Emplacement,” p. 12). In the next sec-tion, we discuss the causes of variable trace element abundances withinthe igneous units.
Fractional Crystallization and Crystal Accumulation
Petrologic relations and geochemical variation within Subunits 4Aand 4B indicate that they are likely to have experienced a significantdegree of fractional crystallization. Previously, we have shown that theisotopic and ITE ratio compositions of the majority of Leg 170 and 205samples can be modeled with a restricted range of mantle mixing andmelting. These geochemical parameters were chosen, in part, based ontheir relative insensitivity to the degree of shallow fractional crystalliza-tion. Models indicate that reasonable degrees of fractional crystalliza-tion of basaltic liquids are not responsible for the observed differencesin ITE ratios between Subunits 4A and 4B (Fig. F11B, inset). For exam-ple, 50% modal fractional crystallization from a basaltic melt results inan increase of La/Sm of ~3% in the remaining melt, whereas the mini-mum difference between Subunits 4A and 4B is ~20%. However, a two-fold range in the abundances of the REE with similarly shaped patternsis evidence of additional variation with Subunit 4B, which we relate tothe effects of fractional crystallization and crystal accumulation.
In the preceding discussion, we have shown that the majority ofsamples are modeled as a partial melts of a mixture of enriched and de-pleted mantle sources. These melts produce magmas with elevated REEabundances, adequately matching compositions observed in the major-ity of samples from Subunits 4A and 4B. However, Subunit 4B sampleswith the lowest REE abundance cannot be reconciled without addi-tional consideration. We suggest that the compositional differenceswithin Subunit 4B can be related by crystal accumulation. As envi-
B. DREYER ET AL.SOURCE AND PETROGENESIS OF THE IGNEOUS COMPLEX 12
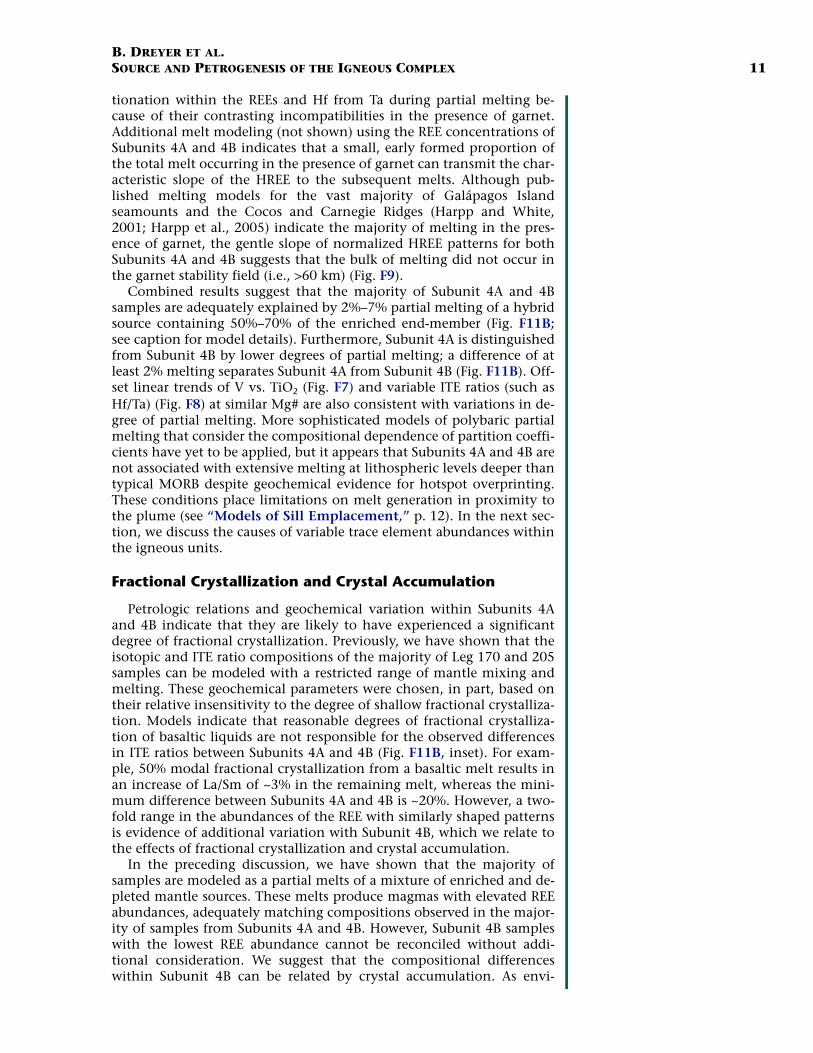
sioned, ITE-rich melts are effectively “diluted” by the addition of vari-able amounts of early-formed fractionates that are relatively ITE poor(Fig. F12). Whole-rock geochemical data are used to place plausible con-straints on this process. We are able to reproduce the entire REE abun-dance range of Subunit 4B by adding increments of an instantaneousfractionating phase assemblage to the Subunit 4B sample with the high-est REE abundance. The modeled fractionating phase assemblages (pla-gioclase = 0.57; clinopyroxene = 0.25; olivine = 0.09; orthopyroxene =0.08; magnetite = 0.01) are consistent with approximate modal abun-dances within Leg 170 and 205 samples. The La/Sm ratio of the mod-eled bulk partition coefficient is 1.3, indicating that little LREEfractionation would occur during this relatively small interval of crys-tallization (Mg# = 0.63–0.51). This is consistent with the observed (La/Sm)N ratios of Subunit 4B samples (1.24–1.51). Samples with the lowestREE abundance occur within the interval 460–509 mbsf and exhibit thehighest whole-rock Mg# and most positive Eu anomalies (up to Eu/Eu*= 1.15), which may be consistent with these samples having a higherproportion of earlier formed minerals. However, there are no reports ofa distinct change in the crystallinity or modal mineralogy from on-board visual core descriptions of this interval (Morris, Villinger, Klaus,et al., 2003), suggesting that the differences in the bulk compositionsmay be due to variations in mineral chemistry rather than mode. With-out geochemical analyses of individual phenocrysts we are unable tomore quantitatively model this process.
Models of Sill Emplacement
Geochemistry and tectonics together provide constraints on mecha-nisms for sill emplacement and its regional impact. Trace element andNd isotope systematics indicate that both subunits cored during Legs170 and 205 share geochemical similarities with other volcanic prod-ucts of the Galápagos hotspot. At the time of intrusion, after 15.6–18.2Ma, the paleolocation of Subunit 4A was quite distant from both theEPR (~400 km) and the CNS (~140 km) (Fig. F1). Distal off-axis emplace-ment is unlikely because morphological, petrographic, and geochemi-cal studies of the EPR show that the vast majority of off-axis volcanismoccurs within ~10 km of the axis (Wilson, Teagle, Acton, et al., 2003;Reynolds and Langmuir, 2000; Sims et al., 2003), although some meltproduction extends >100 km from the fast-spreading EPR axis at 17°–19°S (Scheirer et al., 1998). Although precise ages are yet unknown, ex-isting petrographic and geochemical similarities imply a link betweenSubunits 4A and 4B, which are unlikely to represent true EPR basement.Similarly, at its nearest point to the Galápagos hotspot at 14–12 Ma, thepaleolocation of Legs 170 and 205 was still several hundred kilometers tothe northwest (see Meschede and Barckhausen, 2000, 2001; Harpp etal., 2005) (Fig. F1). If Subunits 4A and 4B are related to the Galapagoshotspot, then it is likely that they are far-field manifestations of plume-ridge interaction.
A possible explanation for the age-location relationship of the igne-ous complex is distal emplacement of a melt originating near thehotspot. As envisioned, preexisting lithospheric weakness resultingfrom the initial fracture of the Farallon plate and/or prior ridge jumpson the CNS may have permitted enhanced plume influence at greaterdistances. A similar scenario may explain a series of alkalic and tholei-itic OIB-like ~14-Ma seamounts that are clustered north of the CocosRidge near an extinct spreading center of the CNS (Barckhausen et al.,
Lowest REE, Subunit 4B
Highest REE, Subunit 4B
Instantaneous solid fractionate after 1% crystallization
Crystal accumulation model result
0
1
La Ce Pr Nd Sm Eu Gd Tb Dy Ho Er Tm Yb Lu
Residual
0.1
1
10
100
Sam
ple/
CI c
hond
rite
Res
idua
l(p
pm)
F12. Crystal accumulation model, p. 32.
B. DREYER ET AL.SOURCE AND PETROGENESIS OF THE IGNEOUS COMPLEX 13
2001), and this age is consistent with an intrusion age after 15.6–18.2Ma for Subunit 4A. Geochemical constraints based on mixing and melt-ing models discussed above restrict this style of (enriched) melt-inducedmixing with ambient MORB-source mantle and argue instead for solidsource mixing prior to melting.
Alternatively, the generation and emplacement of the Leg 170 and205 igneous complex may involve melting of upper mantle that waspreviously enriched. This enrichment could exist as Galápagos plumematerial entrained within the ambient depleted mantle. An age of 8–10Ma brackets a high-amplitude seismic reflector associated with wide-spread deformation of the Cocos plate called the sill intrusion zone,which includes the locations of Leg 170 and 205 (Silver et al., 2004)(Fig. F2). Although controversy surrounds the cause of the deformation,this age may be coincident with the Cocos Ridge collision with theMAT (Abratis and Woerner, 2001, but cf. Graefe et al., 2002), leading tothe development of a stress regime that may have fostered renewed de-compression melting on a local to regional scale. Such a scenario is con-sistent with a recently published model by Harpp et al. (2005) regardingthe tectonic-petrogenetic formation of the Cocos and Carnegie Ridgesand associated seamounts. This model suggests that postabandonmentalkalic and tholeiitic volcanism immediately followed and was probablycaused by either a ridge jump or rift failure and not the direct activity ofthe Galápagos hotspot.
CONCLUSIONS
The microcrystalline to medium-grained plagioclase-clinopyroxeneigneous units cored during Legs 170 and 205 are low- to medium-K sub-alkaline tholeiites; trace element systematics distinguish two geochemi-cal groups that are also stratigraphically separated as Subunits 4A and4B. Models of mixing between regional geochemical end-members indi-cate that these sills are 50%–70% enriched compared to depletedMORB-source mantle. Models suggest that small differences in degreesof partial melting (2.5%–3.5% vs. 5%–7%) can explain the distinctgeochemical groups. Geochemical variability in the lower Subunit 4B isconsistent with modest amounts of fractional crystallization and/orcrystal accumulation.
Within the context of the complex regional tectonic and volcanichistory of the Cocos plate, the igneous complex likely represents meltsof upper mantle that was previously close to, but not above, theGalápagos hotspot. Fractures, ridge jumps, and abandoned spreadingcenters on the southern Cocos plate could be related to proximity ofthe plume (Barckhausen et al., 2001). These lithospheric weaknessesmay have facilitated distal reach of material overprinted by the plume.This material was likely melted subsequent to the time of enrichment atintermediate depths less than those of garnet stability (i.e., <60 km). Achange in tectonic stresses associated with subduction of the irregularlithosphere of the southern Cocos plate may have facilitated local de-compression melting and emplacement.
ACKNOWLEDGMENTS
This research used samples and data provided by the Ocean DrillingProgram (ODP). The ODP is sponsored by the U.S. National Science
B. DREYER ET AL.SOURCE AND PETROGENESIS OF THE IGNEOUS COMPLEX 14
Foundation (NSF) and participating countries under management ofJoint Oceanographic Institutions (JOI), Inc. Funding for this researchwas provided by the U.S. Science Support Program. Randy Korotev isthanked for his assistance with INAA. This work was supported in partby the US Department of Energy (DOE) reactor sharing program at theUniversity of Missouri Research Reactor (MURR). We are grateful toFolkmar Hauff, Holger Paulick, an anonymous reviewer, and the ODPeditorial staff for their thoughtful comments, which significantly im-proved the manuscript.

B. DREYER ET AL.SOURCE AND PETROGENESIS OF THE IGNEOUS COMPLEX 15
REFERENCES
Abratis, M., and Woerner, G., 2001. Ridge collision, slab-window formation, and theflux of Pacific asthenosphere into the Caribbean realm. Geology, 29(2):127–130.doi:10.1130/0091-7613(2001)029<0127:RCSWFA>2.0.CO;2
Agee, C.B., 1990. A new look at differentiation of the Earth from melting experimentson the Allende meteorite. Nature (London, U. K.), 346:834–837. doi:10.1038/346834a0
Barckhausen, U., Ranero, C.R., von Huene, R., Cande, S.C., and Roeser, H.A., 2001.Revised tectonic boundaries in the Cocos plate off Costa Rica: implications for thesegmentation of the convergent margin and for plate tectonic models. J. Geophys.Res., 106:19207–19220. doi:10.1029/2001JB000238
Barckhausen, U., Ranero, C.R., and Weinrebe, W., 2004. Did the Cocos-Nazca spread-ing center form at a transform fault during Farallon plate break-up? Eos, Trans. Am.Geophys. Union, 85:T41A-1166. (Abstract)
Blichert-Toft, J., and White, W.M., 2001. Hf isotope geochemistry of the GalápagosIslands. Geochem., Geophys., Geosyst., 2(9). doi:10.1029/2000GC000138
Bow, C.S., 1978. Petrogenesis of basanitoid lavas from Floreana Island, Galápagos: anexample of partial melting of a light-rare-earth-enriched source? Geol. Soc. Am.Bull., 10(7):370.
Bow, C.S., and Geist, D.J., 1992. Geology and petrology of Floreana Island, Galápagosarchipelago, Ecuador. J. Volcanol. Geotherm. Res., 52:83–105. doi:10.1016/0377-0273(92)90134-Y
Carr, M.J., Feigenson, M.D., Patino, L.C., and Walker, J.A., 2003. Volcanism andgeochemistry in Central America: progress and problems. In Eiler, J. (Ed.), Inside theSubduction Factory. Geophys. Monogr., 138.
Couture, R.A., Smith, M.S., and Dymek, R.F., 1993. X-ray fluorescence analysis of sili-cate rocks using fused glass discs and a side-window Rh source tube: accuracy, pre-cision and reproducibility. Chem. Geol., 110:315–328. doi:10.1016/0009-2541(93)90326-E
Cushman, B., Sinton, J., Ito, G., and Eaby Dixon, J., 2004. Glass compositions,plume-ridge interaction, and hydrous melting along the Galápagos spreading cen-ter, 90.5°W to 98°W. Geochem., Geophys., Geosyst., 5:Q08E17. doi:10.1029/2004GC000709
DeMets, C., Gordon, R.G., Argus, D.F., and Stein, S., 1990. Current plate motions.Geophys. J. Internat., 101:425–478.
Detrick, R.S., Sinton, J.M., Ito, G., Canales, J.P., Behn, M., Blacic, T., Cushman, B.,Dixon, J.E., Graham, D.W., and Mahoney, J.J., 2002. Correlated geophysical,geochemical, and volcanological manifestations of plume-ridge interaction alongthe Galápagos spreading center. Geochem., Geophys., Geosyst., 3(10):8501.doi:10.1029/2002GC000350
Dreyer, B., Chavagnac, V., and Morris, J., 2005. Low temperature fluid flow in the per-meable igneous complex of the subducting Cocos plate, offshore Costa Rica. Eos,Trans. Am. Geophys. Union, 86(52)(Suppl.):T33A-0515. (Abstract)
Eggins, S.M., Woodhead, J.D., Kinsley, L.P.J., Mortimer, G.E., Sylvester, P., McCulloch,M.T., Hergt, J.M., and Handler, M.R., 1997. A simple method for the precise deter-mination of ≥40 trace elements in geological samples by ICPMS using enriched iso-tope internal standardisation. Chem. Geol., 134:311–326. doi:10.1016/S0009-2541(96)00100-3
Feigenson, M.D., Carr, M.J., Maharaj, S.V., Juliano, S., and Bolge, L.L., 2004. Lead iso-tope composition of Central American volcanoes: influence of the Galápagosplume. Geochem., Geophys., Geosyst., 5(6):Q06001. doi:10.1029/2003GC000621
Fisher, A.T., Stein, C.A., Harris, R.N., Wang, K., Silver, E.A., Pfender, M., Hutnak, M.,Cherkaoui, A., Bodzin, R., and Villinger, H., 2003. Abrupt thermal transition
B. DREYER ET AL.SOURCE AND PETROGENESIS OF THE IGNEOUS COMPLEX 16
reveals hydrothermal boundary and role of seamounts within the Cocos plate.Geophys. Res. Lett., 30(11). doi:10.1029/2002GL016766
Geist, D.J., 1992. An appraisal of melting processes and the Galápagos hotspot:major- and trace- element evidence. J. Volcanol. Geotherm. Res., 52:65–82.doi:10.1016/0377-0273(92)90133-X
Graefe, K., Frisch, W., Villa, I.M., and Meschede, M., 2002. Geodynamic evolution ofsouthern Costa Rica related to low-angle subduction of the Cocos Ridge: con-straints from thermochronology. Tectonophysics, 348(4):187–204. doi:10.1016/S0040-1951(02)00113-0
Graham, D.W., Christie, D.M., Harpp, K.S., and Lupton, J.E., 1993. Mantle plumehelium in submarine basalts from the Galápagos platform. Science, 262:2023–2026.
Guevara, M., Verma, S.P., and Velasco-Tapia, F., 2001. Evaluation of GSJ intrusiverocks JG1, JG2, JG3, JG1a, and JGb1 by an objective outlier rejection statistical pro-cedure: Revista Mexicana de Ciencias. Geologicas, 18:74–88.
Harpp, K.S., Wanless, V.D., Otto, R.H., Hoernle, K., and Werner, R., 2005. The Cocosand Carnegie aseismic ridges: a trace element record of long-term plume-spreadingcenter interaction. J. Petrol., 46(1):109–133. doi:10.1093/petrology/egh064
Harpp, K.S., and White, W.M., 2001. Tracing a mantle plume: isotopic and trace ele-ment variations of Galápagos seamounts. Geochem., Geophys., Geosyst., 2(6).doi:10.1029/2000GC000137
Hauff, F., Hoernle, K., Schminke, H.-U., and Werner, R., 1997. A mid-Cretaceous ori-gin for the Galapagos hotspot: volcanological, petrological, and geochemical evi-dence from Costa Rican oceanic crustal segments. Geol. Rundsch., 86(1):141–155.doi:10.1007/PL00009938
Hauff, F., Hoernle, K., van den Bogaard, P., Alvarado, G., and Garbe-Schoenberg, D.,2000. Age and geochemistry of basaltic complexes in western Costa Rica: contribu-tions to the geotectonic evolution of Central America. Geochem., Geophys., Geosyst.,1(5). doi:10.1029/1999GC000020
Hey, R., 1977. Tectonic evolution of the Cocos-Nazca spreading center. Geol. Soc. Am.Bull., 88:1404–1420. doi:10.1130/0016-7606(1977)88<1404:TEOTCS>2.0.CO;2
Hoernle, K., van den Bogaard, P., Werner, R., Lissinna, B., Hauff, F., Alvarado, G., andGarbe-Schoenberg, D., 2002. Missing history (16–71 Ma) of the Galápagos hotspot:implications for the tectonic and biological evolution of the Americas. Geology,30(9):795–798. doi:10.1130/0091-7613(2002)030<0795:MHMOTG>2.0.CO;2
Hoernle, K., Werner, R., Phipps Morgan, J., Garbe-Schoenberg, D., Bryce, J., andMrazek, J., 2000. Existence of complex spatial zonation in the Galápagos plume.Geology, 28:435–438. doi:10.1130/0091-7613(2000)028<0435:EOCSZI>2.3.CO;2
Jarvis, K.E., Gray, A.L., and Houk, R.S., 1992. Handbook of Inductively Coupled PlasmaMass Spectrometry: New York (Chapman and Hall).
Kimura, G., Silver, E.A., Blum, P., et al., 1997. Proc. ODP, Init. Repts., 170: College Sta-tion, TX (Ocean Drilling Program). [HTML]
Kinzler, R.J., 1997. Melting of mantle peridotite at pressures approaching the spinelto garnet transition: application to mid-ocean ridge basalt petrogenesis. J. Geophys.Res., [Solid Earth], 102:853–874. doi:10.1029/96JB00988
Korotev, R.L., 1996. A self-consistent compilation of elemental concentration data for93 geochemical reference samples. Geostand. Newsl., 20:217–245.
Kurz, M.D., and Geist, D., 1999. Dynamics of the Galápagos hotspot from helium iso-tope geochemistry. Geochim. Cosmochim. Acta, 63(23–24):4139–4156. doi:10.1016/S0016-7037(99)00314-2
Lichte, F.E., Meier, A.L., and Crock, J.G., 1987. Determination of the rare earth ele-ments in geological materials by inductively coupled plasma mass spectrometry.Anal. Chem., 59:1150–1157. doi:10.1021/ac00135a018
Lindstrom, D.J., and Korotev, R.L., 1982. TEABAGS: computer programs for instru-mental neutron activation analysis. J. Radioanal. Chem., 70:439–458.
B. DREYER ET AL.SOURCE AND PETROGENESIS OF THE IGNEOUS COMPLEX 17
Lodders, K., and Fegley, B., Jr., 1998. The Planetary Scientist’s Companion: Oxford(Oxford Univ. Press).
McGinnis, C.E., Jain, J.C., and Neal, C.R., 1997. Characterization of memory effectsand development of an effective wash protocol for the measurement of petroge-netically critical trace elements in geological samples by ICP-MS. Geostand. Newsl.,21:289–305.
McKenzie, D., and O’Nions, R.K., 1991. Partial melt distributions from inversion ofrare earth element concentrations. J. Petrol., 32:1021–1091.
Meschede, M., and Barckhausen, U., 2000. Plate tectonic evolution of the Cocos-Nazca spreading center. In Silver, E.A., Kimura, G., Blum, P., and Shipley, T.H.(Eds.), Proc. ODP, Sci. Results, 170, 1–10 [Online]. Available from World Wide Web:<http://www-odp.tamu.edu/publications/170_SR/VOLUME/CHAPTERS/SR170_07.PDF>.
Meschede, M., and Barckhausen, U., 2001. Plate tectonic evolution of the Cocos-Nazca spreading center. In Silver, E.A., Kimura, G., Blum, P., and Shipley, T.H.(Eds.), Proc. ODP, Sci. Results, 170, 1–10 [CD-ROM]. Available from: Ocean DrillingProgram, Texas A&M University, College Station TX 77845-9547, USA. [PDF]
Morris, J.D., Villinger, H.W., Klaus, A., et al., 2003. Proc. ODP, Init. Repts., 205 [CD-ROM]. Available from: Ocean Drilling Program, Texas A&M University, College Sta-tion TX 77845-9547, USA. [HTML]
Muza, J.P., 2000. Calcareous nannofossil biostratigraphy from a 15-km transect(Cocos plate to Caribbean plate) across the Middle America Trench, Nicoya Penin-sula, Costa Rica. In Silver, E.A., Kimura, G., Blum, P., and Shipley, T.H. (Eds.), Proc.ODP, Sci. Results, 170 [Online]. Available from World Wide Web: <http://www-odp.tamu.edu/publications/170_SR/chap_05/chap_05.htm>.
Nui, Y., and Batiza, R., 1997. Trace element evidence from seamounts for recycledoceanic crust in the eastern Pacific mantle. Earth Planet. Sci. Lett., 148:471–483.doi:10.1016/S0012-821X(97)00048-4
Nui, Y., Regelous, M., Wednt, I.J., Batiza, R., and O’Hara, M.J., 2002. Geochemistry ofnear-EPR seamounts: importance of source vs. process and the origin of theenriched mantle component. Earth Planet. Sci. Lett., 199:327–345. doi:10.1016/S0012-821X(02)00591-5
Patino, L.C., Carr, M.J., and Feigenson, M.D., 2000. Local and regional variations inCentral American arc lavas controlled by variations in subducted sediment input.Contrib. Mineral. Petrol., 138:265–283. doi:10.1007/s004100050562
Plank, T., and Langmuir, C.H., 1992. Effects of the melting regime on the composi-tion of the oceanic crust. J. Geophys. Res., 97:19749–19770.
Protti, M., Guendel, F., and McNally, K., 1995. Correlation between the age of thesubducted Cocos plate and the geometry of the Wadati-Benioff zone under Nicara-gua and Costa Rica. In Mann, P. (Ed.), Geologic and Tectonic Development of the Carib-bean Plate Boundary in Southern Central America. Spec. Pap.—Geol. Soc. Am., 295.
Ranero, C.R., and von Huene, R., 2000. Subduction erosion along the Middle Americaconvergent margin. Nature (London, U. K.), 404:748–752. doi:10.1038/35008046
Reynolds, J.R., and Langmuir, C.H., 2000. Identification and implications of off-axislava flows around the East Pacific Rise. Geochem., Geophys., Geosyst., 1(6).doi:10.1029/1999GC000033
Scheirer, D.S., Forsyth, D.W., Cormier, M.-H., and Macdonald, K.C., 1998. Shipboardgeophysical indications of asymmetry and melt production beneath the EastPacific Rise near the MELT experiment. Science, 280(5367):1221–1224. doi:10.1126/science.280.5367.1221
Shipley, T.H., McIntosh, K.D., Silver, E.A., and Stoffa, P.L., 1992. Three-dimensionalseismic imaging of the Costa Rica accretionary prism: structural diversity in a smallvolume of the lower slope. J. Geophys. Res., 97:4439–4459.
Silver, E., Costa Pisani, P., Hutnak, M., Fisher, A., DeShon, H., and Taylor, B., 2004. An8–10 Ma tectonic event on the Cocos plate offshore Costa Rica: results of CocosRidge collision? Geophys. Res. Lett., 31(18). doi:10.1029/2004GL020272
B. DREYER ET AL.SOURCE AND PETROGENESIS OF THE IGNEOUS COMPLEX 18
Sims, K.W.W., Blichert-Toft, J., Fornari, D.J., Perfit, M.R., Goldstein, S.J., Johnson, P.,DePaolo, D.J., Hart, S.R., Murrell, M.T., Michael, P.J., Layne, G.D., and Ball, L.A.,2003. Aberrant youth: chemical and isotopic constraints on the origin of off-axislavas from the East Pacific Rise, 9°–10°N. Geochem., Geophys., Geosyst., 4(10).doi:10.1029/2002GC000443
Sun, S.-S., and McDonough, W.F., 1989. Chemical and isotopic systematics of oceanicbasalts: implications for mantle composition and processes. In Saunders, A.D., andNorry, M.J. (Eds.), Magmatism in the Ocean Basins. Geol. Soc. Spec. Publ., 42:313–345.
Villemant, B., Jaffrezic, H., Joron, J.L. and Treuil, M., 1981. Distribution coefficientsof major and trace elements: fractional crystallization in the alkali basalt series ofChaîne des Puys (Massif Central, France). Geochim. Cosmochim. Acta, 45(11):1997–2016. doi:10.1016/0016-7037(81)90055-7
von Huene, R., Bialas, J., Flueh, E., Cropp, B., Csernok, T., Fabel, E., Hoffmann, J.,Emeis, K., Holler, P., Jeschke, G., Leandro, M.C., Perez Fernandez, I., Chavarria, S.J.,Florez, H.A., Escobedo, Z.D., Leon, R., and Barrios, L.O., 1995. Morphotectonics ofthe Pacific convergent margin of Costa Rica. In Mann, P. (Ed.), Geologic and TectonicDevelopment of the Caribbean Plate Boundary in Southern Central America. Spec.Pap.—Geol. Soc. Am., 291–307.
von Huene, R., Ranero, C.R., Weinrebe, W., and Hinz, K., 2000. Quaternary conver-gent margin tectonics of Costa Rica, segmentation of the Cocos plate, and CentralAmerican volcanism. Tectonics, 19:314–334. doi:10.1029/1999TC001143
Werner, R., Hoernle, K., Barckhausen, U., and Hauff, F., 2003. Geodynamic evolutionof the Galápagos hot spot system (central East Pacific) over the past 20 m.y.: con-straints from morphology, geochemistry, and magnetic anomalies. Geochem., Geo-phys., Geosyst., 4. doi:10.1029/2003GC000576
Werner, R., Hoernle, K., van den Bogaard, P., Ranero, C., von Huene, R., and Korich,D., 1999. Drowned 14-m.y.-old Galápagos archipelago off the coast of Costa Rica:implications for tectonic and evolutionary models. Geology, 27(6):499–502.doi:10.1130/0091-7613(1999)027<0499:DMYOGP>2.3.CO;2
White, W.M., McBirney, A.R., and Duncan, R.A., 1993. Petrology and geochemistry ofthe Galápagos Islands: portrait of a pathological mantle plume. J. Geophys. Res.,98:19533–19563.
Wilson, D.S., 1996. Fastest known spreading on the Miocene Cocos–Pacific plateboundary. Geophys. Res. Lett., 23(21):3003–3006. doi:10.1029/96GL02893
Wilson, D.S., Teagle, D.A.H., Acton, G.D., et al., 2003. Proc. ODP, Init. Repts., 206 [CD-ROM]. Available from: Ocean Drilling Program, Texas A&M University, College Sta-tion TX 77845-9547, USA. [HTML]
Workman, R.K., and Hart, S.R., 2005. Major and trace element composition of thedepleted MORB mantle (DMM). Earth Planet. Sci. Lett., 231(1–2):53–72.doi:10.1016/j.epsl.2004.12.005
B. DREYER ET AL.SOURCE AND PETROGENESIS OF THE IGNEOUS COMPLEX 19
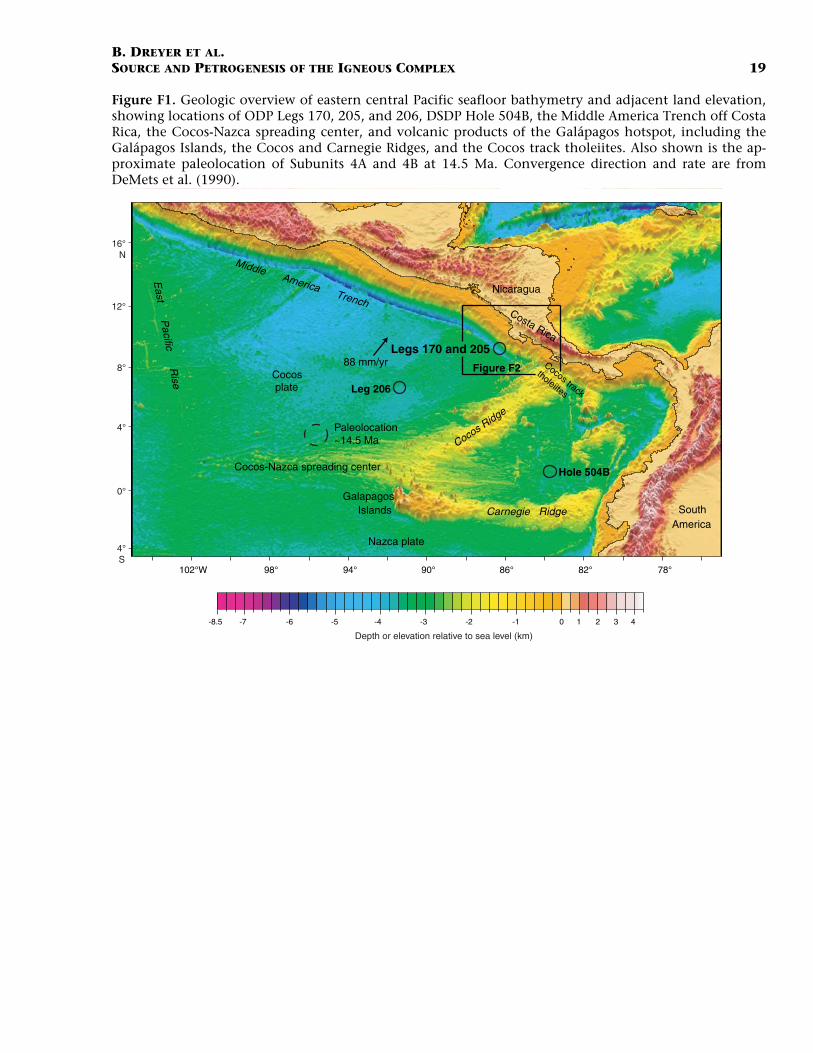
Figure F1. Geologic overview of eastern central Pacific seafloor bathymetry and adjacent land elevation,showing locations of ODP Legs 170, 205, and 206, DSDP Hole 504B, the Middle America Trench off CostaRica, the Cocos-Nazca spreading center, and volcanic products of the Galápagos hotspot, including theGalápagos Islands, the Cocos and Carnegie Ridges, and the Cocos track tholeiites. Also shown is the ap-proximate paleolocation of Subunits 4A and 4B at 14.5 Ma. Convergence direction and rate are fromDeMets et al. (1990).
-8.5 -7 -6 -5 -4 -3 -2 -1 0 1 2 3 4
East P
acific Rise Cocos
plate
Nazca plate
GalapagosIslands
Cocos R
idge
Carnegie Ridge SouthAmerica
Nicaragua
Costa Rica
Middle America Trench
Legs 170 and 205
78°82°94°98° 90°102°W 86°
16°N
12°
8°
4°
0°
4°S
Depth or elevation relative to sea level (km)
Cocos-Nazca spreading center
Leg 206
Hole 504B
88 mm/yr Figure F2
Paleolocation ~14.5 Ma
Cocos track
tholeiites

B. DREYER ET AL.SOURCE AND PETROGENESIS OF THE IGNEOUS COMPLEX 20
Figure F2. Leg 170 and 205 Costa Rica drilling area and isochrons derived from seafloor magnetic anoma-lies (Barckhausen et al., 2001). Numbers indicate crustal age in millions of years. Fracture zone trace markslocation where spreading of the Cocos-Nazca spreading center (CNS) initiates; triple junction trace sepa-rates crust formed at the CNS and the East Pacific Rise. The ridge jump records the change from CNS-1 toCNS-2 spreading (~19.5 Ma). Convergence direction and rate (DeMets et al., 1990) and arc volcanoes (tri-angles) are also shown. Note the segmentation of the volcanic arc and the offset in Wadati-Benioff Zoneisodepths at the Quesada Sharp Contortion (QSC). Figure modified after Barckhausen et al., 2001. Sill in-trusion zone redrawn after Silver et al., 2004.
88°W 86° 84°
15
16
17
18
1922
22.5
18
19
20
21
22
23
24
19
Legs 170 and 205
Middle
Costa Rica
Nicoya Peninsula
Osa P.
America
Trench
CNS-1
East Pacific Rise crust 100 km
100 km
QSC
Costa Rica volcanic front
Nicaragua volcanic front
Cocos-Nazca crust (CNS-2)88 mm/yr
Propagator
Ridge jump
Fracture zone trace
Triple junction trace
~19.5 Ma
~22.7
Ma
Fisher
Seamount
Sill intrusion zone
“smooth”
“rough”
“seamount”
12°N
10°
8°
B. DREYER ET AL.SOURCE AND PETROGENESIS OF THE IGNEOUS COMPLEX 21
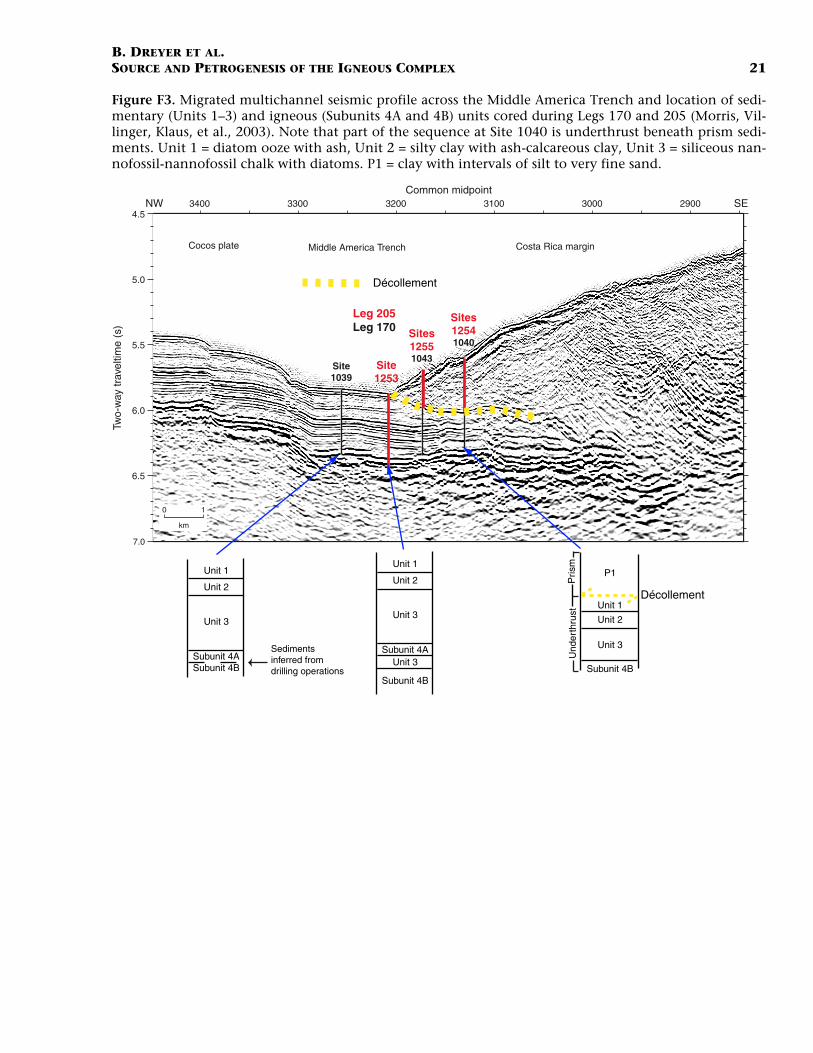
Figure F3. Migrated multichannel seismic profile across the Middle America Trench and location of sedi-mentary (Units 1–3) and igneous (Subunits 4A and 4B) units cored during Legs 170 and 205 (Morris, Vil-linger, Klaus, et al., 2003). Note that part of the sequence at Site 1040 is underthrust beneath prism sedi-ments. Unit 1 = diatom ooze with ash, Unit 2 = silty clay with ash-calcareous clay, Unit 3 = siliceous nan-nofossil-nannofossil chalk with diatoms. P1 = clay with intervals of silt to very fine sand.
290030003100320033003400Common midpoint
Two-
way
trav
eltim
e (s
)
Site1039
Site1253
Sites12541040
Sites12551043
Cocos plate Middle America Trench Costa Rica margin
10
km
4.5
5.0
5.5
6.0
6.5
7.0
Leg 205Leg 170
Décollement
Décollement
Und
erth
rust
Pris
m
SENW
Sedimentsinferred fromdrilling operations Subunit 4B
Unit 2
Unit 3
Unit 1
P1
Subunit 4A
Subunit 4B
Unit 3
Unit 2
Unit 1
Unit 3Subunit 4ASubunit 4B
Unit 3
Unit 2
Unit 1
B. DREYER ET AL.SOURCE AND PETROGENESIS OF THE IGNEOUS COMPLEX 22
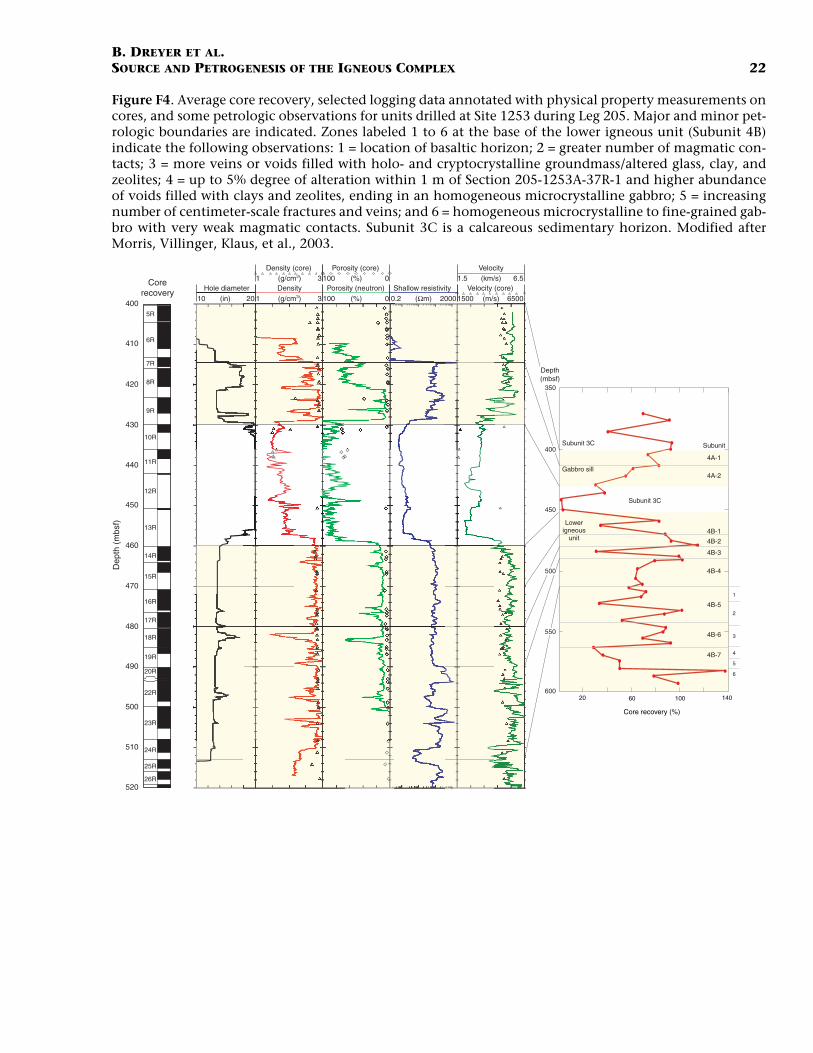
Figure F4. Average core recovery, selected logging data annotated with physical property measurements oncores, and some petrologic observations for units drilled at Site 1253 during Leg 205. Major and minor pet-rologic boundaries are indicated. Zones labeled 1 to 6 at the base of the lower igneous unit (Subunit 4B)indicate the following observations: 1 = location of basaltic horizon; 2 = greater number of magmatic con-tacts; 3 = more veins or voids filled with holo- and cryptocrystalline groundmass/altered glass, clay, andzeolites; 4 = up to 5% degree of alteration within 1 m of Section 205-1253A-37R-1 and higher abundanceof voids filled with clays and zeolites, ending in an homogeneous microcrystalline gabbro; 5 = increasingnumber of centimeter-scale fractures and veins; and 6 = homogeneous microcrystalline to fine-grained gab-bro with very weak magmatic contacts. Subunit 3C is a calcareous sedimentary horizon. Modified afterMorris, Villinger, Klaus, et al., 2003.
400
410
420
430
440
450
460
470
480
490
500
510
520
1
2
3
4
5
6
Subunit 3C
Gabbro sill
Lowerigneous
unit
Subunit 3C
Hole diameter
Density (core)
Density
Porosity (core)
Porosity (neutron) Shallow resistivity
Velocity
Velocity (core)10 20(in)
(g/cm3)
(g/cm3)
(%)
(%) (Ωm)
(km/s)
(m/s)
1 3
1 3
100
100
0
0 0.2 2000
1.5 6.5
1500 6500
4B-1
4B-2
4B-3
4B-4
4B-5
4B-6
4B-7
Subunit
4A-1
4A-2
Core recovery (%)
20 10060 140
5R
6R
7R
8R
9R
10R
11R
12R
13R
14R
15R
16R
17R
18R
19R
20R
22R
23R
24R
25R
26R
Corerecovery
Dep
th (
mbs
f)
500
550
450
400
600
350
Depth(mbsf)
B. DREYER ET AL.SOURCE AND PETROGENESIS OF THE IGNEOUS COMPLEX 23
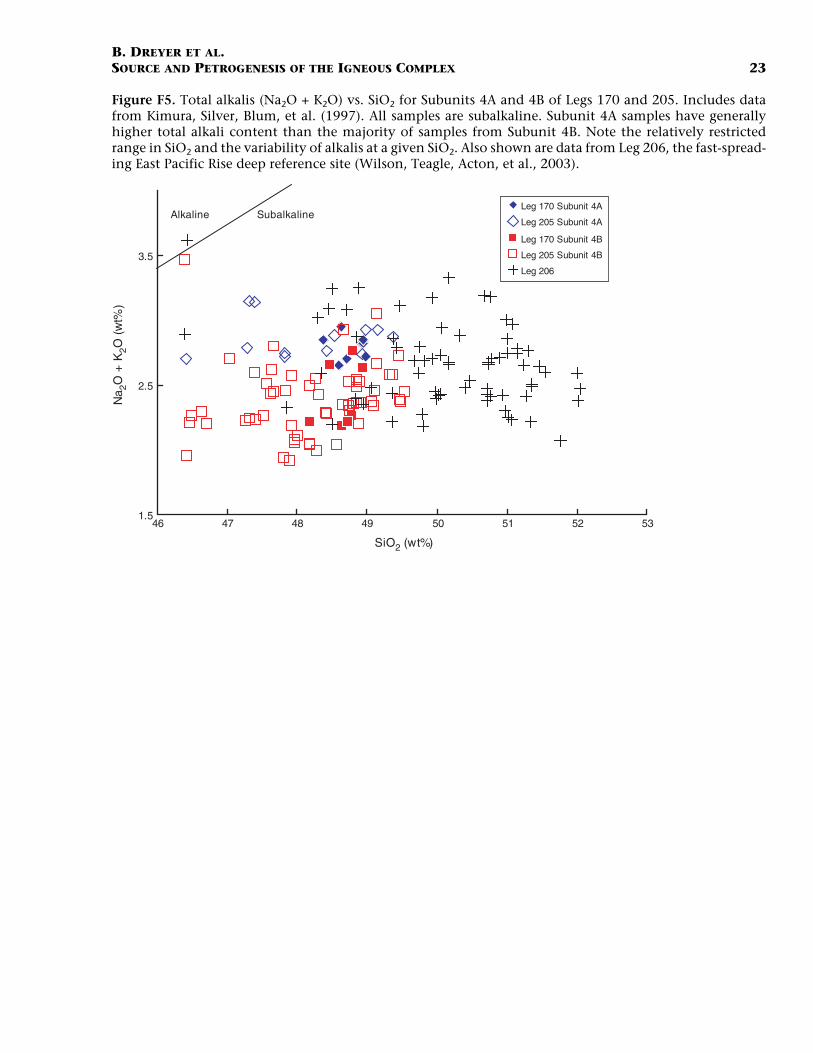
Figure F5. Total alkalis (Na2O + K2O) vs. SiO2 for Subunits 4A and 4B of Legs 170 and 205. Includes datafrom Kimura, Silver, Blum, et al. (1997). All samples are subalkaline. Subunit 4A samples have generallyhigher total alkali content than the majority of samples from Subunit 4B. Note the relatively restrictedrange in SiO2 and the variability of alkalis at a given SiO2. Also shown are data from Leg 206, the fast-spread-ing East Pacific Rise deep reference site (Wilson, Teagle, Acton, et al., 2003).
1.5
2.5
3.5
46 47 48 49 50 51 52 53
SiO2 (wt%)
Na 2
O +
K2O
(w
t%)
Leg 170 Subunit 4A
Leg 205 Subunit 4A
Leg 170 Subunit 4B
Leg 205 Subunit 4B
Leg 206
Alkaline Subalkaline
B. DREYER ET AL.SOURCE AND PETROGENESIS OF THE IGNEOUS COMPLEX 24
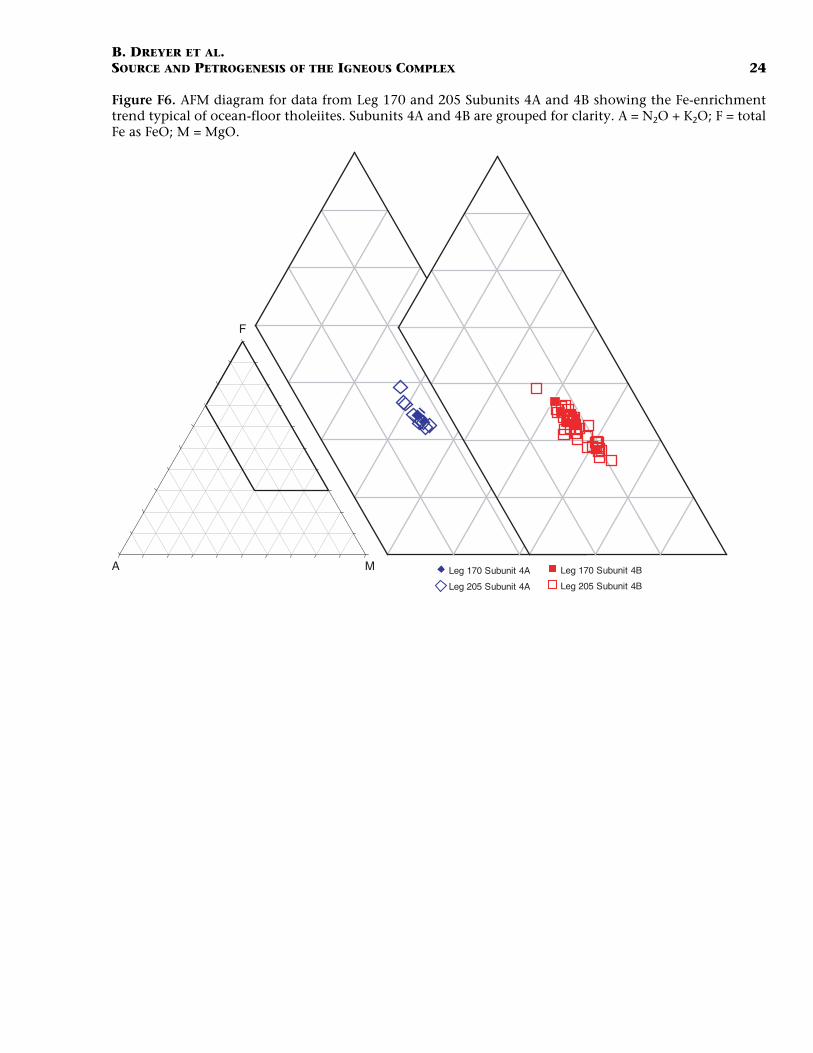
Figure F6. AFM diagram for data from Leg 170 and 205 Subunits 4A and 4B showing the Fe-enrichmenttrend typical of ocean-floor tholeiites. Subunits 4A and 4B are grouped for clarity. A = N2O + K2O; F = totalFe as FeO; M = MgO.
F
MA Leg 170 Subunit 4A
Leg 205 Subunit 4A
Leg 170 Subunit 4B
Leg 205 Subunit 4B
B. DREYER ET AL.SOURCE AND PETROGENESIS OF THE IGNEOUS COMPLEX 25
Figure F7. V vs. TiO2. V and Ti are incompatible in an assemblage of olivine, plagioclase, and clinopyrox-ene; the positive linear variation of V and TiO2 reflects their enrichment in the magma during fractionalcrystallization. The offset trends (Subunit 4A shifts to higher TiO2) suggest that the units are not derivedfrom a common melting event. The majority of samples from Leg 206 correlate well with the array thatincludes Subunit 4B. Includes data from Kimura, Silver, Blum, et al. (1997). Also shown are data from Leg206, the fast-spreading East Pacific Rise deep reference site (Wilson, Teagle, Acton, et al., 2003).
100
200
300
400
500
600
700
0 1 2 3
TiO2 (wt%)
V (p
pm)
Leg 170 Subunit 4A
Leg 205 Subunit 4A
Leg 170 Subunit 4B
Leg 205 Subunit 4B
Leg 206
B. DREYER ET AL.SOURCE AND PETROGENESIS OF THE IGNEOUS COMPLEX 26
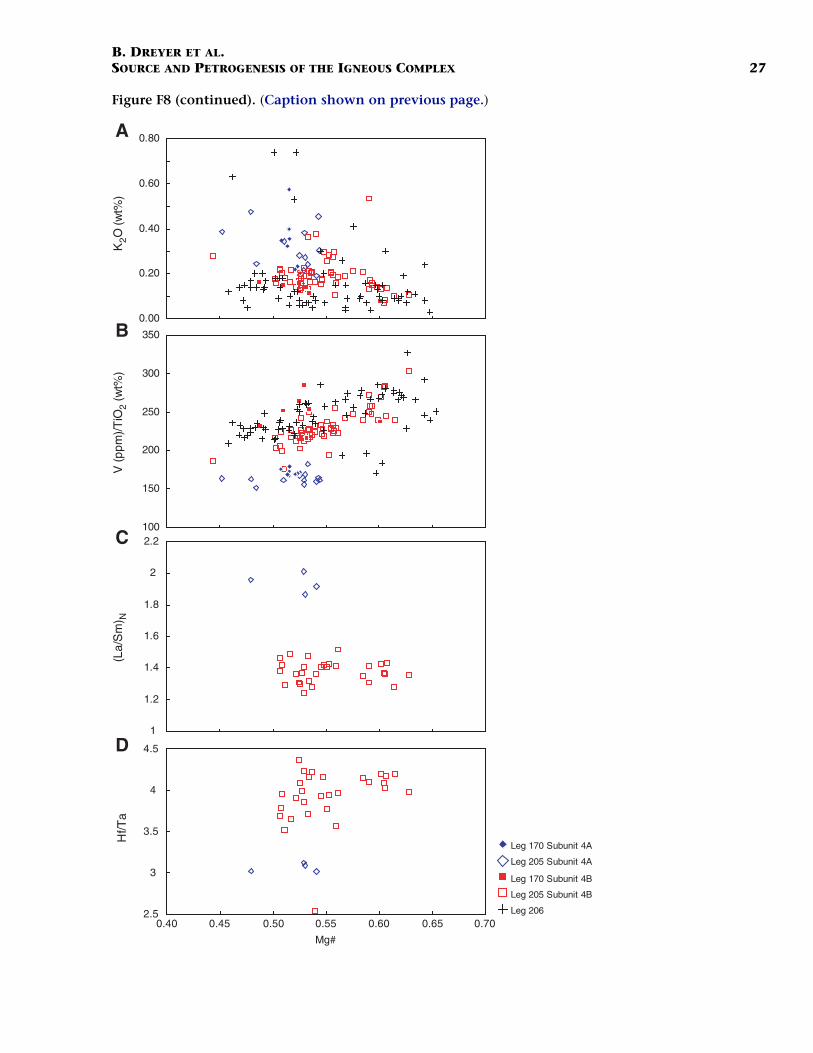
Figure F8. Selected minor and trace element ratios vs. Mg#. Fractionation and alteration processes alonecannot reproduce all of the geochemical variability observed. A. K2O. Alteration and/or differences in par-tial melting increase alkali variability at given Mg#. B. V/TiO2 is expected to be controlled by original mag-ma composition and proportion of fractionating Fe-Ti and/or clinopyroxene phases. The ratio V/TiOd is ap-proximately constant over a range of Mg# for Subunit 4A but is more scattered for Subunit 4B, tending toincrease with increasing Mg#. These relationships suggest that Subunits 4A and 4B were not generated froma common melting event at a single time. Fractionation is not responsible for the bimodal distribution of(C) (La/Sm)N and (D) Hf/Ta ratios. Mg# = [Mg / (Mg + Fe+2)]. Includes data from Kimura, Silver, Blum, et al.(1997). Also shown are data from Leg 206, the fast-spreading East Pacific Rise deep reference site (Wilson,Teagle, Acton, et al., 2003). (Figure shown on next page.)
B. DREYER ET AL.SOURCE AND PETROGENESIS OF THE IGNEOUS COMPLEX 27
Figure F8 (continued). (Caption shown on previous page.)
0.40 0.45 0.50 0.55 0.60 0.65 0.70
Mg#
100
150
200
250
300
350
0.00
0.20
0.40
0.60
0.80
1
1.2
1.4
1.6
1.8
2
2.2
2.5
3
3.5
4
4.5
V (p
pm)/T
iO2
(wt%
)K
2O (w
t%)
(La/
Sm
) N
B
A
C
D
Hf/T
a
Leg 170 Subunit 4A
Leg 205 Subunit 4A
Leg 170 Subunit 4B
Leg 205 Subunit 4B
Leg 206

B. DREYER ET AL.SOURCE AND PETROGENESIS OF THE IGNEOUS COMPLEX 28
Figure F9. Chondrite-normalized rare earth element (REE) diagram for samples from (A) Leg 170 and(B) Leg 205 (bottom), along with fields for Galápagos Islands and East Pacific Rise (5°–15°N). Geochemicalvariability is due to differences in the extent of partial melting and subsequent fractional crystallizationand/or crystal accumulation. Note that samples from Leg 170 were measured by INAA, which has poor pre-cision for Nd (see Table T1, p. 33). Normalization values are from Lodders and Fegley, 1998. Includes datafrom Kimura, Silver, Blum, et al. (1997). Also shown are data from Leg 206, the fast-spreading East PacificRise deep reference site (Wilson, Teagle, Acton, et al., 2003).
1
10
100
La Ce Pr Nd Sm Eu Gd Tb Dy Ho Er Tm Yb Lu
Sam
ple/
CI c
hond
rite
Leg 170 Subunit 4A Leg 170 Subunit 4B
1
10
100
La Ce Pr Nd Sm Eu Gd Tb Dy Ho Er Tm Yb Lu
Sam
ple/
CI c
hond
rite
Leg 205 Subunit 4A Leg 205 Subunit 4B
A
B

B. DREYER ET AL.SOURCE AND PETROGENESIS OF THE IGNEOUS COMPLEX 29
Figure F10. 143Nd/144Nd vs. 87Sr/86Sr, illustrating mixing relationships between regional geochemical end-members. Binary mixing lines are in increments of 10%. Seawater alteration is expected to elevate 87Sr/86Sr,as indicated. The narrow range in Nd isotope values suggests that Subunits 4A and 4B derive from approx-imately the same source that is a mixture of ~50%–70% enriched (PLUME) and 30%–50% depleted (DMM)sources. The hybrid composition represents mixture of 60% PLUME + 40% DMM end-members. Leg 205samples do not appear to have a significant admixture of the FLO end-member. East Pacific Rise (EPR; 5°–15°N) and Cocos-Nazca spreading center (CNS) fields are drawn from published data available from the Pet-rological Database of the Ocean Floor (www.petdb.org); Galápagos Island data are from the Geochemistryof Rocks from the Oceans and Continents (GEOROC) database (georoc.mpch-mainz.gwdg.de/georoc).Cocos Track tholeiites are selected from analyses by Werner et al. (2003) and Harpp et al. (2005). PLUME,DMM, and FLO represent regional geochemical end-members after (Harpp and White, 2001). Leg 205 dataare from V. Chavagnac, unpubl. data. Model input parameters as follows: PLUME: 87Sr/86Sr = 0.70331,143Nd/144Nd = 0.512887, Sr = 21.1 ppm, and Nd = 1.354 ppm; FLO: 0.7045, 0.51283, 45, and 2; DMM:0.702389, 0.513181, 7.664, and 0.581; hybrid: 70313, 0.51295, 15.726, and 1.045. PLUME concentrationdata from Sun and McDonough, 1989. PLUME and DMM isotope values from analyses of published valuesfor EPR and the Galápagos Islands. FLO isotope data from Harpp and White, 2001. FLO concentration dataare estimated from reasonable back-calculation of lavas from Isla Floreana (White et al., 1993). DMM con-centration data are from Workman and Hart (2005).
0.702250 0.702750 0.703250 0.703750 0.704250 0.704750 0.705250
87Sr/86Sr
143 N
d/14
4 Nd
FLO
DMM
PLUME
Seawateralteration
GalapagosIslands
EPR
Hybrid
CNS Subunit 4A
Subunit 4B
Fisher Seamount
Mixing line
Cocos track tholeiites
Hybrid-FLO
0.512800
0.512850
0.512900
0.512950
0.513000
0.513050
0.513100
0.513150
0.513200

B. DREYER ET AL.SOURCE AND PETROGENESIS OF THE IGNEOUS COMPLEX 30
Figure F11. A. (La/Sm)N vs. Hf/Ta for Subunits 4A and 4B. Also shown are East Pacific Rise (EPR) basalticglasses (5°–15°N) and Cocos-Nazca spreading center (CNS) and Galápagos Islands basalts extracted frompublished geochemical data (GEOROC and PetDB Web sites). Samples from the CNS and EPR generallyhave Hf/Ta >10 with (La/Sm)N ~0.5–1. Galápagos Island data have Hf/Ta <5, as do Subunits 4A and 4B, with(La/Sm)N = ~1–2.5. The highest (La/Sm)N values of the Galápagos Islands are from the anomalous “mainseries” of Isla Floreana, thought to be related to partial melting of an ITE-rich source distinct from the otherislands in the Galápagos (Bow and Geist, 1992; Harpp and White, 2001). Averages of oceanic island basalt(OIB), mid-ocean-ridge basalt (MORB), and primitive mantle (PM) are from Sun and McDonough (1989).Includes data from Kimura, Silver, Blum, et al. (1997). Also shown are data from Leg 206, the fast-spreadingEast Pacific Rise deep reference site (Wilson, Teagle, Acton, et al., 2003). For clarity, Cocos track tholeiitesare not shown. (Continued on next page.)
0
1
2
3
4
5
6
7
0 5 10 15
Hf/Ta
(La/
Sm
) N
Isla Floreana
A
Galapagos Islands
EPR
CNS
OIB
MORB
PM
Leg 170 Subunit 4A
Leg 205 Subunit 4A
Leg 170 Subunit 4B
Leg 205 Subunit 4B
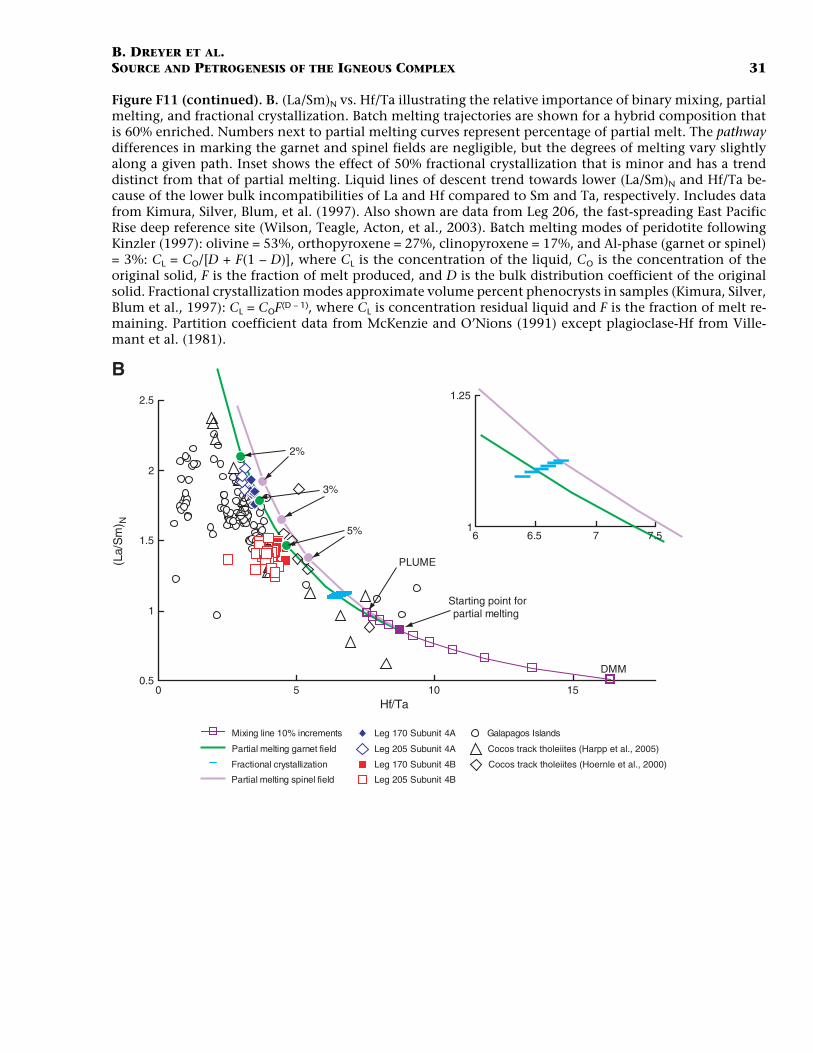
B. DREYER ET AL.SOURCE AND PETROGENESIS OF THE IGNEOUS COMPLEX 31
Figure F11 (continued). B. (La/Sm)N vs. Hf/Ta illustrating the relative importance of binary mixing, partialmelting, and fractional crystallization. Batch melting trajectories are shown for a hybrid composition thatis 60% enriched. Numbers next to partial melting curves represent percentage of partial melt. The pathwaydifferences in marking the garnet and spinel fields are negligible, but the degrees of melting vary slightlyalong a given path. Inset shows the effect of 50% fractional crystallization that is minor and has a trenddistinct from that of partial melting. Liquid lines of descent trend towards lower (La/Sm)N and Hf/Ta be-cause of the lower bulk incompatibilities of La and Hf compared to Sm and Ta, respectively. Includes datafrom Kimura, Silver, Blum, et al. (1997). Also shown are data from Leg 206, the fast-spreading East PacificRise deep reference site (Wilson, Teagle, Acton, et al., 2003). Batch melting modes of peridotite followingKinzler (1997): olivine = 53%, orthopyroxene = 27%, clinopyroxene = 17%, and Al-phase (garnet or spinel)= 3%: CL = CO/[D + F(1 – D)], where CL is the concentration of the liquid, CO is the concentration of theoriginal solid, F is the fraction of melt produced, and D is the bulk distribution coefficient of the originalsolid. Fractional crystallization modes approximate volume percent phenocrysts in samples (Kimura, Silver,Blum et al., 1997): CL = COF(D – 1), where CL is concentration residual liquid and F is the fraction of melt re-maining. Partition coefficient data from McKenzie and O’Nions (1991) except plagioclase-Hf from Ville-mant et al. (1981).
0 5 10 15Hf/Ta
(La/
Sm
) N
Mixing line 10% increments
Fractional crystallization
Partial melting garnet field
Partial melting spinel field
DMM
2%
5%
3%
PLUME
Starting point forpartial melting
1
1.25
6 6.5 7 7.5
0.5
1
1.5
2
2.5
B
Galapagos IslandsLeg 170 Subunit 4A
Leg 205 Subunit 4A
Leg 170 Subunit 4B
Leg 205 Subunit 4B
Cocos track tholeiites (Hoernle et al., 2000)
Cocos track tholeiites (Harpp et al., 2005)

B. DREYER ET AL.SOURCE AND PETROGENESIS OF THE IGNEOUS COMPLEX 32
Figure F12. Crystal accumulation model for the rare earth element (REE) range observed in Subunit 4B. Inthis model an instantaneous solid crystallized from the most enriched Subunit 4B sample is incrementallyadded to the most enriched sample composition for Subunit 4B until a match is found for the least enrichedcomposition of Subunit 4B. The composition of the instantaneous solid is constrained by the modal abun-dances observed in Leg 170 samples (Kimura, Silver, Blum, et al., 1997) and the partition coefficient dataof McKenzie and O’Nions (1991) (olivine, orthopyroxene, clinopyroxene, and plagioclase) and Agee (1990)(magnetite). We assume that the instantaneous solid is a product of fractional crystallization from liquidswith the composition of the more enriched samples from Subunit 4B. Mineral compositional data are re-quired to confirm this assumption; therefore, more quantitative modeling is deferred. The difference be-tween the lowest REE abundance sample in Subunit 4B and the model result is also shown. As modeled,crystal accumulation does not appreciably alter the slope of the REE and reproduces the slight positive Euanomaly observed in the lowest abundance samples from Subunit 4B. Note that the highest REE abundancewithin Subunit 4B occurs from Leg 170, but this model uses the highest Subunit 4B sample from Leg 205to avoid potential laboratory bias and because of the generally improved precision of ICP-MS analyses. Nor-malization values are from Lodders and Fegley, 1998.
Lowest REE, Subunit 4B
Highest REE, Subunit 4B
Instantaneous solid fractionate after 1% crystallization
Crystal accumulation model result
0
1
La Ce Pr Nd Sm Eu Gd Tb Dy Ho Er Tm Yb Lu
Residual
0.1
1
10
100
Sam
ple/
CI c
hond
rite
Res
idua
l(p
pm)
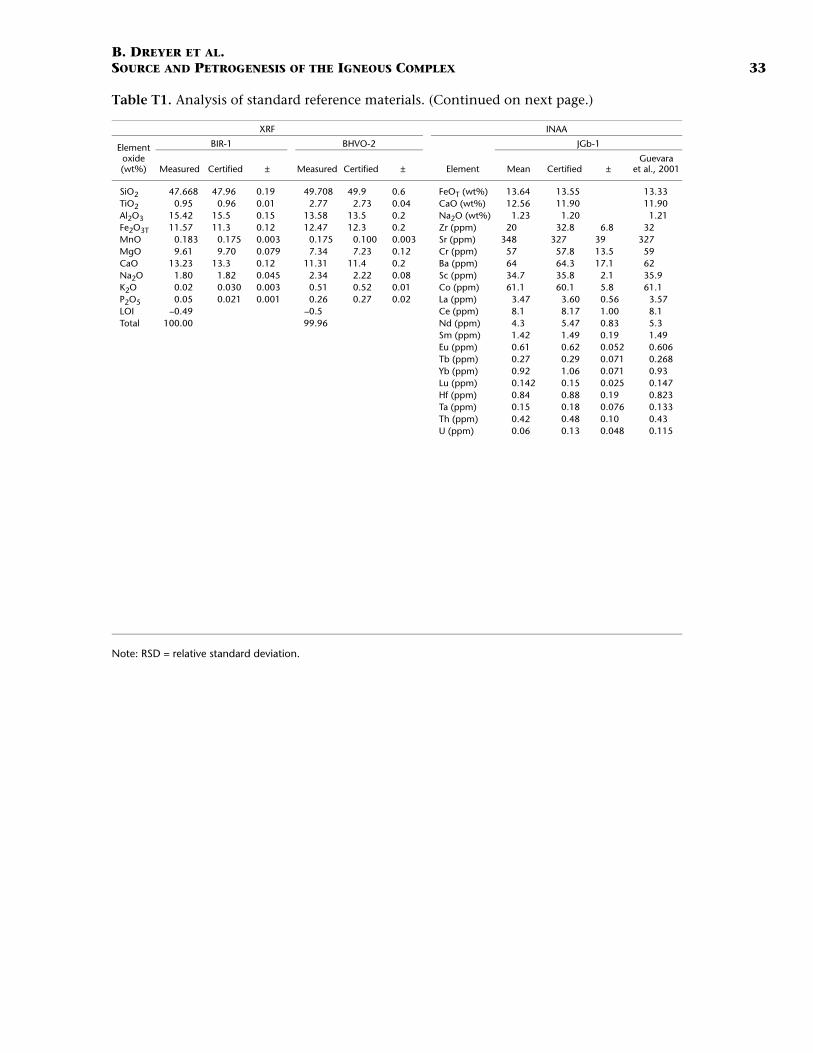
B. DREYER ET AL.SOURCE AND PETROGENESIS OF THE IGNEOUS COMPLEX 33
Table T1. Analysis of standard reference materials. (Continued on next page.)
Note: RSD = relative standard deviation.
XRF INAA
Elementoxide (wt%)
BIR-1 BHVO-2
Element
JGb-1
Measured Certified ± Measured Certified ± Mean Certified ±Guevara
et al., 2001
SiO2 47.668 47.96 0.19 49.708 49.9 0.6 FeOT (wt%) 13.64 13.55 13.33TiO2 0.95 0.96 0.01 2.77 2.73 0.04 CaO (wt%) 12.56 11.90 11.90Al2O3 15.42 15.5 0.15 13.58 13.5 0.2 Na2O (wt%) 1.23 1.20 1.21Fe2O3T 11.57 11.3 0.12 12.47 12.3 0.2 Zr (ppm) 20 32.8 6.8 32MnO 0.183 0.175 0.003 0.175 0.100 0.003 Sr (ppm) 348 327 39 327MgO 9.61 9.70 0.079 7.34 7.23 0.12 Cr (ppm) 57 57.8 13.5 59CaO 13.23 13.3 0.12 11.31 11.4 0.2 Ba (ppm) 64 64.3 17.1 62Na2O 1.80 1.82 0.045 2.34 2.22 0.08 Sc (ppm) 34.7 35.8 2.1 35.9K2O 0.02 0.030 0.003 0.51 0.52 0.01 Co (ppm) 61.1 60.1 5.8 61.1P2O5 0.05 0.021 0.001 0.26 0.27 0.02 La (ppm) 3.47 3.60 0.56 3.57LOI –0.49 –0.5 Ce (ppm) 8.1 8.17 1.00 8.1Total 100.00 99.96 Nd (ppm) 4.3 5.47 0.83 5.3
Sm (ppm) 1.42 1.49 0.19 1.49Eu (ppm) 0.61 0.62 0.052 0.606Tb (ppm) 0.27 0.29 0.071 0.268Yb (ppm) 0.92 1.06 0.071 0.93Lu (ppm) 0.142 0.15 0.025 0.147Hf (ppm) 0.84 0.88 0.19 0.823Ta (ppm) 0.15 0.18 0.076 0.133Th (ppm) 0.42 0.48 0.10 0.43U (ppm) 0.06 0.13 0.048 0.115
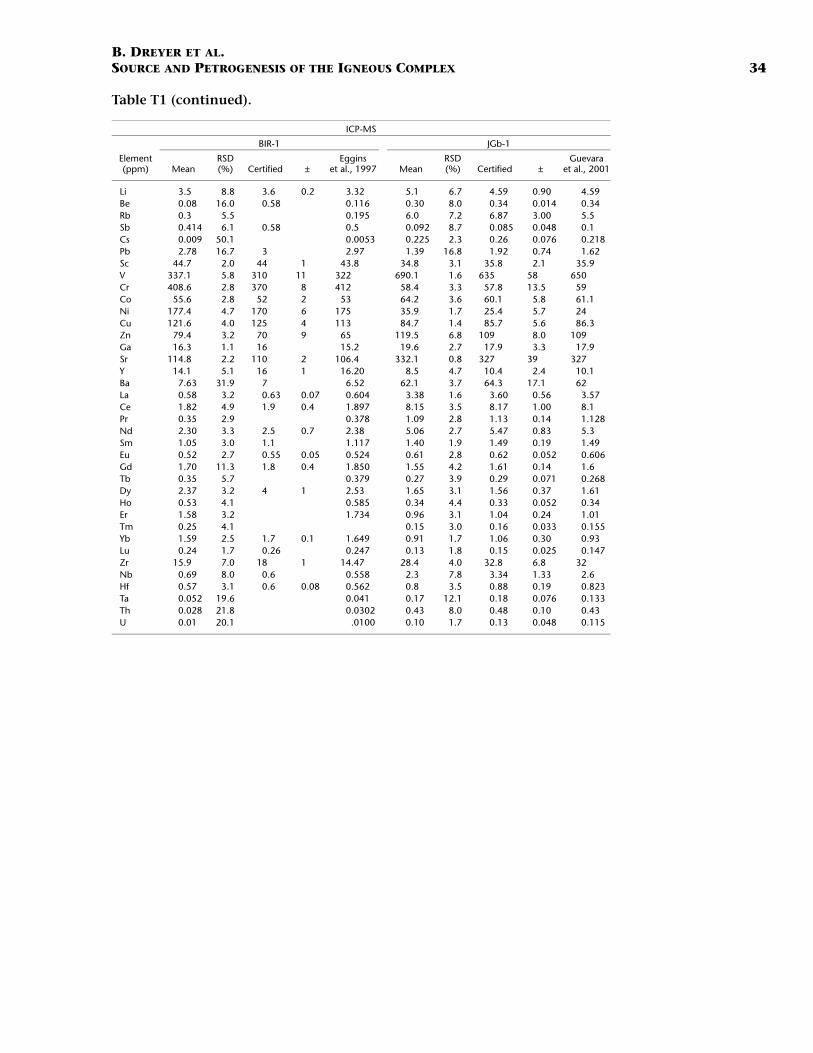
B. DREYER ET AL.SOURCE AND PETROGENESIS OF THE IGNEOUS COMPLEX 34
Table T1 (continued).
ICP-MS
Element (ppm)
BIR-1 JGb-1
MeanRSD (%) Certified ±
Egginset al., 1997 Mean
RSD (%) Certified ±
Guevaraet al., 2001
Li 3.5 8.8 3.6 0.2 3.32 5.1 6.7 4.59 0.90 4.59Be 0.08 16.0 0.58 0.116 0.30 8.0 0.34 0.014 0.34Rb 0.3 5.5 0.195 6.0 7.2 6.87 3.00 5.5Sb 0.414 6.1 0.58 0.5 0.092 8.7 0.085 0.048 0.1Cs 0.009 50.1 0.0053 0.225 2.3 0.26 0.076 0.218Pb 2.78 16.7 3 2.97 1.39 16.8 1.92 0.74 1.62Sc 44.7 2.0 44 1 43.8 34.8 3.1 35.8 2.1 35.9V 337.1 5.8 310 11 322 690.1 1.6 635 58 650Cr 408.6 2.8 370 8 412 58.4 3.3 57.8 13.5 59Co 55.6 2.8 52 2 53 64.2 3.6 60.1 5.8 61.1Ni 177.4 4.7 170 6 175 35.9 1.7 25.4 5.7 24Cu 121.6 4.0 125 4 113 84.7 1.4 85.7 5.6 86.3Zn 79.4 3.2 70 9 65 119.5 6.8 109 8.0 109Ga 16.3 1.1 16 15.2 19.6 2.7 17.9 3.3 17.9Sr 114.8 2.2 110 2 106.4 332.1 0.8 327 39 327Y 14.1 5.1 16 1 16.20 8.5 4.7 10.4 2.4 10.1Ba 7.63 31.9 7 6.52 62.1 3.7 64.3 17.1 62La 0.58 3.2 0.63 0.07 0.604 3.38 1.6 3.60 0.56 3.57Ce 1.82 4.9 1.9 0.4 1.897 8.15 3.5 8.17 1.00 8.1Pr 0.35 2.9 0.378 1.09 2.8 1.13 0.14 1.128Nd 2.30 3.3 2.5 0.7 2.38 5.06 2.7 5.47 0.83 5.3Sm 1.05 3.0 1.1 1.117 1.40 1.9 1.49 0.19 1.49Eu 0.52 2.7 0.55 0.05 0.524 0.61 2.8 0.62 0.052 0.606Gd 1.70 11.3 1.8 0.4 1.850 1.55 4.2 1.61 0.14 1.6Tb 0.35 5.7 0.379 0.27 3.9 0.29 0.071 0.268Dy 2.37 3.2 4 1 2.53 1.65 3.1 1.56 0.37 1.61Ho 0.53 4.1 0.585 0.34 4.4 0.33 0.052 0.34Er 1.58 3.2 1.734 0.96 3.1 1.04 0.24 1.01Tm 0.25 4.1 0.15 3.0 0.16 0.033 0.155Yb 1.59 2.5 1.7 0.1 1.649 0.91 1.7 1.06 0.30 0.93Lu 0.24 1.7 0.26 0.247 0.13 1.8 0.15 0.025 0.147Zr 15.9 7.0 18 1 14.47 28.4 4.0 32.8 6.8 32Nb 0.69 8.0 0.6 0.558 2.3 7.8 3.34 1.33 2.6Hf 0.57 3.1 0.6 0.08 0.562 0.8 3.5 0.88 0.19 0.823Ta 0.052 19.6 0.041 0.17 12.1 0.18 0.076 0.133Th 0.028 21.8 0.0302 0.43 8.0 0.48 0.10 0.43U 0.01 20.1 .0100 0.10 1.7 0.13 0.048 0.115
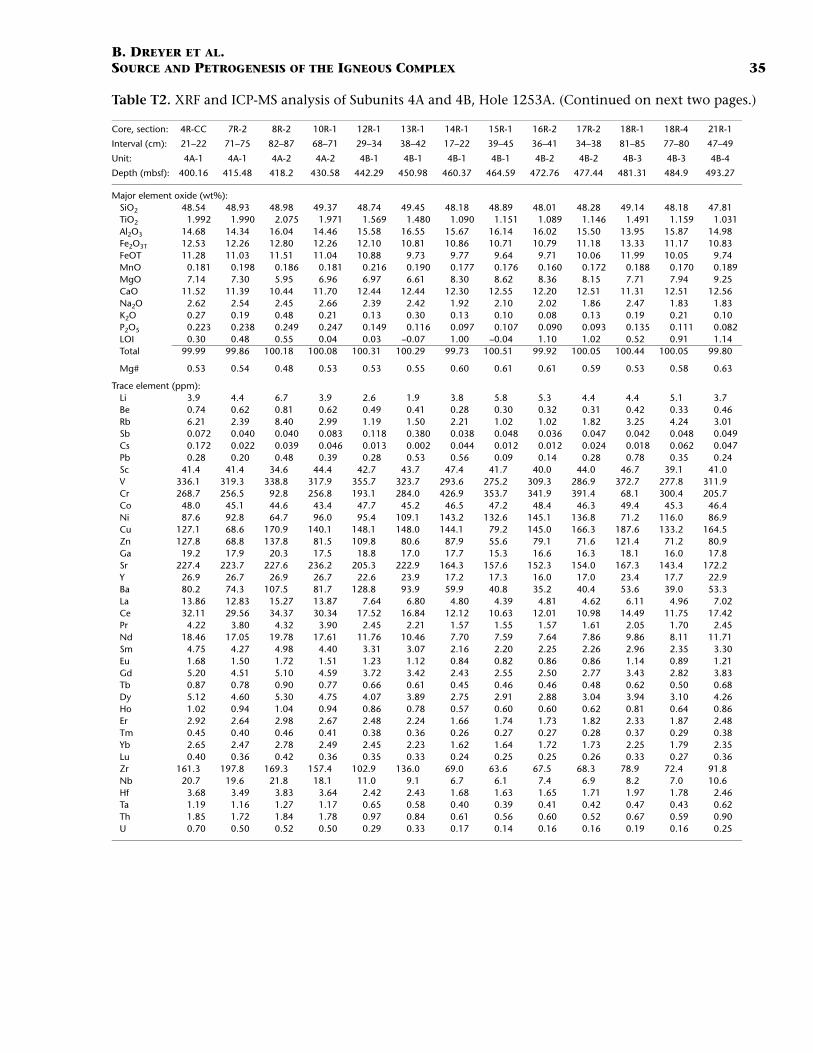
B. DREYER ET AL.SOURCE AND PETROGENESIS OF THE IGNEOUS COMPLEX 35
Table T2. XRF and ICP-MS analysis of Subunits 4A and 4B, Hole 1253A. (Continued on next two pages.)
Core, section: 4R-CC 7R-2 8R-2 10R-1 12R-1 13R-1 14R-1 15R-1 16R-2 17R-2 18R-1 18R-4 21R-1
Interval (cm): 21–22 71–75 82–87 68–71 29–34 38–42 17–22 39–45 36–41 34–38 81–85 77–80 47–49
Unit: 4A-1 4A-1 4A-2 4A-2 4B-1 4B-1 4B-1 4B-1 4B-2 4B-2 4B-3 4B-3 4B-4
Depth (mbsf): 400.16 415.48 418.2 430.58 442.29 450.98 460.37 464.59 472.76 477.44 481.31 484.9 493.27
Major element oxide (wt%):SiO2 48.54 48.93 48.98 49.37 48.74 49.45 48.18 48.89 48.01 48.28 49.14 48.18 47.81TiO2 1.992 1.990 2.075 1.971 1.569 1.480 1.090 1.151 1.089 1.146 1.491 1.159 1.031Al2O3 14.68 14.34 16.04 14.46 15.58 16.55 15.67 16.14 16.02 15.50 13.95 15.87 14.98Fe2O3T 12.53 12.26 12.80 12.26 12.10 10.81 10.86 10.71 10.79 11.18 13.33 11.17 10.83FeOT 11.28 11.03 11.51 11.04 10.88 9.73 9.77 9.64 9.71 10.06 11.99 10.05 9.74MnO 0.181 0.198 0.186 0.181 0.216 0.190 0.177 0.176 0.160 0.172 0.188 0.170 0.189MgO 7.14 7.30 5.95 6.96 6.97 6.61 8.30 8.62 8.36 8.15 7.71 7.94 9.25CaO 11.52 11.39 10.44 11.70 12.44 12.44 12.30 12.55 12.20 12.51 11.31 12.51 12.56Na2O 2.62 2.54 2.45 2.66 2.39 2.42 1.92 2.10 2.02 1.86 2.47 1.83 1.83K2O 0.27 0.19 0.48 0.21 0.13 0.30 0.13 0.10 0.08 0.13 0.19 0.21 0.10P2O5 0.223 0.238 0.249 0.247 0.149 0.116 0.097 0.107 0.090 0.093 0.135 0.111 0.082LOI 0.30 0.48 0.55 0.04 0.03 –0.07 1.00 –0.04 1.10 1.02 0.52 0.91 1.14Total 99.99 99.86 100.18 100.08 100.31 100.29 99.73 100.51 99.92 100.05 100.44 100.05 99.80
Mg# 0.53 0.54 0.48 0.53 0.53 0.55 0.60 0.61 0.61 0.59 0.53 0.58 0.63
Trace element (ppm):Li 3.9 4.4 6.7 3.9 2.6 1.9 3.8 5.8 5.3 4.4 4.4 5.1 3.7Be 0.74 0.62 0.81 0.62 0.49 0.41 0.28 0.30 0.32 0.31 0.42 0.33 0.46Rb 6.21 2.39 8.40 2.99 1.19 1.50 2.21 1.02 1.02 1.82 3.25 4.24 3.01Sb 0.072 0.040 0.040 0.083 0.118 0.380 0.038 0.048 0.036 0.047 0.042 0.048 0.049Cs 0.172 0.022 0.039 0.046 0.013 0.002 0.044 0.012 0.012 0.024 0.018 0.062 0.047Pb 0.28 0.20 0.48 0.39 0.28 0.53 0.56 0.09 0.14 0.28 0.78 0.35 0.24Sc 41.4 41.4 34.6 44.4 42.7 43.7 47.4 41.7 40.0 44.0 46.7 39.1 41.0V 336.1 319.3 338.8 317.9 355.7 323.7 293.6 275.2 309.3 286.9 372.7 277.8 311.9Cr 268.7 256.5 92.8 256.8 193.1 284.0 426.9 353.7 341.9 391.4 68.1 300.4 205.7Co 48.0 45.1 44.6 43.4 47.7 45.2 46.5 47.2 48.4 46.3 49.4 45.3 46.4Ni 87.6 92.8 64.7 96.0 95.4 109.1 143.2 132.6 145.1 136.8 71.2 116.0 86.9Cu 127.1 68.6 170.9 140.1 148.1 148.0 144.1 79.2 145.0 166.3 187.6 133.2 164.5Zn 127.8 68.8 137.8 81.5 109.8 80.6 87.9 55.6 79.1 71.6 121.4 71.2 80.9Ga 19.2 17.9 20.3 17.5 18.8 17.0 17.7 15.3 16.6 16.3 18.1 16.0 17.8Sr 227.4 223.7 227.6 236.2 205.3 222.9 164.3 157.6 152.3 154.0 167.3 143.4 172.2Y 26.9 26.7 26.9 26.7 22.6 23.9 17.2 17.3 16.0 17.0 23.4 17.7 22.9Ba 80.2 74.3 107.5 81.7 128.8 93.9 59.9 40.8 35.2 40.4 53.6 39.0 53.3La 13.86 12.83 15.27 13.87 7.64 6.80 4.80 4.39 4.81 4.62 6.11 4.96 7.02Ce 32.11 29.56 34.37 30.34 17.52 16.84 12.12 10.63 12.01 10.98 14.49 11.75 17.42Pr 4.22 3.80 4.32 3.90 2.45 2.21 1.57 1.55 1.57 1.61 2.05 1.70 2.45Nd 18.46 17.05 19.78 17.61 11.76 10.46 7.70 7.59 7.64 7.86 9.86 8.11 11.71Sm 4.75 4.27 4.98 4.40 3.31 3.07 2.16 2.20 2.25 2.26 2.96 2.35 3.30Eu 1.68 1.50 1.72 1.51 1.23 1.12 0.84 0.82 0.86 0.86 1.14 0.89 1.21Gd 5.20 4.51 5.10 4.59 3.72 3.42 2.43 2.55 2.50 2.77 3.43 2.82 3.83Tb 0.87 0.78 0.90 0.77 0.66 0.61 0.45 0.46 0.46 0.48 0.62 0.50 0.68Dy 5.12 4.60 5.30 4.75 4.07 3.89 2.75 2.91 2.88 3.04 3.94 3.10 4.26Ho 1.02 0.94 1.04 0.94 0.86 0.78 0.57 0.60 0.60 0.62 0.81 0.64 0.86Er 2.92 2.64 2.98 2.67 2.48 2.24 1.66 1.74 1.73 1.82 2.33 1.87 2.48Tm 0.45 0.40 0.46 0.41 0.38 0.36 0.26 0.27 0.27 0.28 0.37 0.29 0.38Yb 2.65 2.47 2.78 2.49 2.45 2.23 1.62 1.64 1.72 1.73 2.25 1.79 2.35Lu 0.40 0.36 0.42 0.36 0.35 0.33 0.24 0.25 0.25 0.26 0.33 0.27 0.36Zr 161.3 197.8 169.3 157.4 102.9 136.0 69.0 63.6 67.5 68.3 78.9 72.4 91.8Nb 20.7 19.6 21.8 18.1 11.0 9.1 6.7 6.1 7.4 6.9 8.2 7.0 10.6Hf 3.68 3.49 3.83 3.64 2.42 2.43 1.68 1.63 1.65 1.71 1.97 1.78 2.46Ta 1.19 1.16 1.27 1.17 0.65 0.58 0.40 0.39 0.41 0.42 0.47 0.43 0.62Th 1.85 1.72 1.84 1.78 0.97 0.84 0.61 0.56 0.60 0.52 0.67 0.59 0.90U 0.70 0.50 0.52 0.50 0.29 0.33 0.17 0.14 0.16 0.16 0.19 0.16 0.25
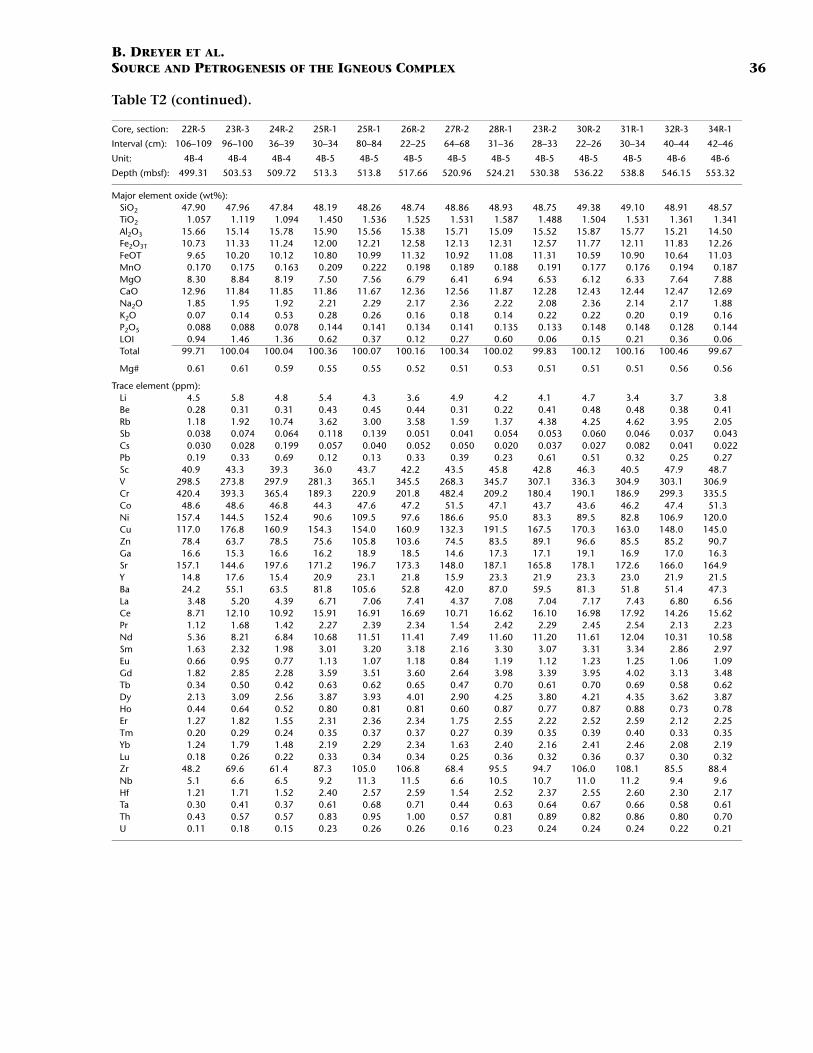
B. DREYER ET AL.SOURCE AND PETROGENESIS OF THE IGNEOUS COMPLEX 36
Table T2 (continued).
Core, section: 22R-5 23R-3 24R-2 25R-1 25R-1 26R-2 27R-2 28R-1 23R-2 30R-2 31R-1 32R-3 34R-1
Interval (cm): 106–109 96–100 36–39 30–34 80–84 22–25 64–68 31–36 28–33 22–26 30–34 40–44 42–46
Unit: 4B-4 4B-4 4B-4 4B-5 4B-5 4B-5 4B-5 4B-5 4B-5 4B-5 4B-5 4B-6 4B-6
Depth (mbsf): 499.31 503.53 509.72 513.3 513.8 517.66 520.96 524.21 530.38 536.22 538.8 546.15 553.32
Major element oxide (wt%):SiO2 47.90 47.96 47.84 48.19 48.26 48.74 48.86 48.93 48.75 49.38 49.10 48.91 48.57TiO2 1.057 1.119 1.094 1.450 1.536 1.525 1.531 1.587 1.488 1.504 1.531 1.361 1.341Al2O3 15.66 15.14 15.78 15.90 15.56 15.38 15.71 15.09 15.52 15.87 15.77 15.21 14.50Fe2O3T 10.73 11.33 11.24 12.00 12.21 12.58 12.13 12.31 12.57 11.77 12.11 11.83 12.26FeOT 9.65 10.20 10.12 10.80 10.99 11.32 10.92 11.08 11.31 10.59 10.90 10.64 11.03MnO 0.170 0.175 0.163 0.209 0.222 0.198 0.189 0.188 0.191 0.177 0.176 0.194 0.187MgO 8.30 8.84 8.19 7.50 7.56 6.79 6.41 6.94 6.53 6.12 6.33 7.64 7.88CaO 12.96 11.84 11.85 11.86 11.67 12.36 12.56 11.87 12.28 12.43 12.44 12.47 12.69Na2O 1.85 1.95 1.92 2.21 2.29 2.17 2.36 2.22 2.08 2.36 2.14 2.17 1.88K2O 0.07 0.14 0.53 0.28 0.26 0.16 0.18 0.14 0.22 0.22 0.20 0.19 0.16P2O5 0.088 0.088 0.078 0.144 0.141 0.134 0.141 0.135 0.133 0.148 0.148 0.128 0.144LOI 0.94 1.46 1.36 0.62 0.37 0.12 0.27 0.60 0.06 0.15 0.21 0.36 0.06Total 99.71 100.04 100.04 100.36 100.07 100.16 100.34 100.02 99.83 100.12 100.16 100.46 99.67
Mg# 0.61 0.61 0.59 0.55 0.55 0.52 0.51 0.53 0.51 0.51 0.51 0.56 0.56
Trace element (ppm):Li 4.5 5.8 4.8 5.4 4.3 3.6 4.9 4.2 4.1 4.7 3.4 3.7 3.8Be 0.28 0.31 0.31 0.43 0.45 0.44 0.31 0.22 0.41 0.48 0.48 0.38 0.41Rb 1.18 1.92 10.74 3.62 3.00 3.58 1.59 1.37 4.38 4.25 4.62 3.95 2.05Sb 0.038 0.074 0.064 0.118 0.139 0.051 0.041 0.054 0.053 0.060 0.046 0.037 0.043Cs 0.030 0.028 0.199 0.057 0.040 0.052 0.050 0.020 0.037 0.027 0.082 0.041 0.022Pb 0.19 0.33 0.69 0.12 0.13 0.33 0.39 0.23 0.61 0.51 0.32 0.25 0.27Sc 40.9 43.3 39.3 36.0 43.7 42.2 43.5 45.8 42.8 46.3 40.5 47.9 48.7V 298.5 273.8 297.9 281.3 365.1 345.5 268.3 345.7 307.1 336.3 304.9 303.1 306.9Cr 420.4 393.3 365.4 189.3 220.9 201.8 482.4 209.2 180.4 190.1 186.9 299.3 335.5Co 48.6 48.6 46.8 44.3 47.6 47.2 51.5 47.1 43.7 43.6 46.2 47.4 51.3Ni 157.4 144.5 152.4 90.6 109.5 97.6 186.6 95.0 83.3 89.5 82.8 106.9 120.0Cu 117.0 176.8 160.9 154.3 154.0 160.9 132.3 191.5 167.5 170.3 163.0 148.0 145.0Zn 78.4 63.7 78.5 75.6 105.8 103.6 74.5 83.5 89.1 96.6 85.5 85.2 90.7Ga 16.6 15.3 16.6 16.2 18.9 18.5 14.6 17.3 17.1 19.1 16.9 17.0 16.3Sr 157.1 144.6 197.6 171.2 196.7 173.3 148.0 187.1 165.8 178.1 172.6 166.0 164.9Y 14.8 17.6 15.4 20.9 23.1 21.8 15.9 23.3 21.9 23.3 23.0 21.9 21.5Ba 24.2 55.1 63.5 81.8 105.6 52.8 42.0 87.0 59.5 81.3 51.8 51.4 47.3La 3.48 5.20 4.39 6.71 7.06 7.41 4.37 7.08 7.04 7.17 7.43 6.80 6.56Ce 8.71 12.10 10.92 15.91 16.91 16.69 10.71 16.62 16.10 16.98 17.92 14.26 15.62Pr 1.12 1.68 1.42 2.27 2.39 2.34 1.54 2.42 2.29 2.45 2.54 2.13 2.23Nd 5.36 8.21 6.84 10.68 11.51 11.41 7.49 11.60 11.20 11.61 12.04 10.31 10.58Sm 1.63 2.32 1.98 3.01 3.20 3.18 2.16 3.30 3.07 3.31 3.34 2.86 2.97Eu 0.66 0.95 0.77 1.13 1.07 1.18 0.84 1.19 1.12 1.23 1.25 1.06 1.09Gd 1.82 2.85 2.28 3.59 3.51 3.60 2.64 3.98 3.39 3.95 4.02 3.13 3.48Tb 0.34 0.50 0.42 0.63 0.62 0.65 0.47 0.70 0.61 0.70 0.69 0.58 0.62Dy 2.13 3.09 2.56 3.87 3.93 4.01 2.90 4.25 3.80 4.21 4.35 3.62 3.87Ho 0.44 0.64 0.52 0.80 0.81 0.81 0.60 0.87 0.77 0.87 0.88 0.73 0.78Er 1.27 1.82 1.55 2.31 2.36 2.34 1.75 2.55 2.22 2.52 2.59 2.12 2.25Tm 0.20 0.29 0.24 0.35 0.37 0.37 0.27 0.39 0.35 0.39 0.40 0.33 0.35Yb 1.24 1.79 1.48 2.19 2.29 2.34 1.63 2.40 2.16 2.41 2.46 2.08 2.19Lu 0.18 0.26 0.22 0.33 0.34 0.34 0.25 0.36 0.32 0.36 0.37 0.30 0.32Zr 48.2 69.6 61.4 87.3 105.0 106.8 68.4 95.5 94.7 106.0 108.1 85.5 88.4Nb 5.1 6.6 6.5 9.2 11.3 11.5 6.6 10.5 10.7 11.0 11.2 9.4 9.6Hf 1.21 1.71 1.52 2.40 2.57 2.59 1.54 2.52 2.37 2.55 2.60 2.30 2.17Ta 0.30 0.41 0.37 0.61 0.68 0.71 0.44 0.63 0.64 0.67 0.66 0.58 0.61Th 0.43 0.57 0.57 0.83 0.95 1.00 0.57 0.81 0.89 0.82 0.86 0.80 0.70U 0.11 0.18 0.15 0.23 0.26 0.26 0.16 0.23 0.24 0.24 0.24 0.22 0.21
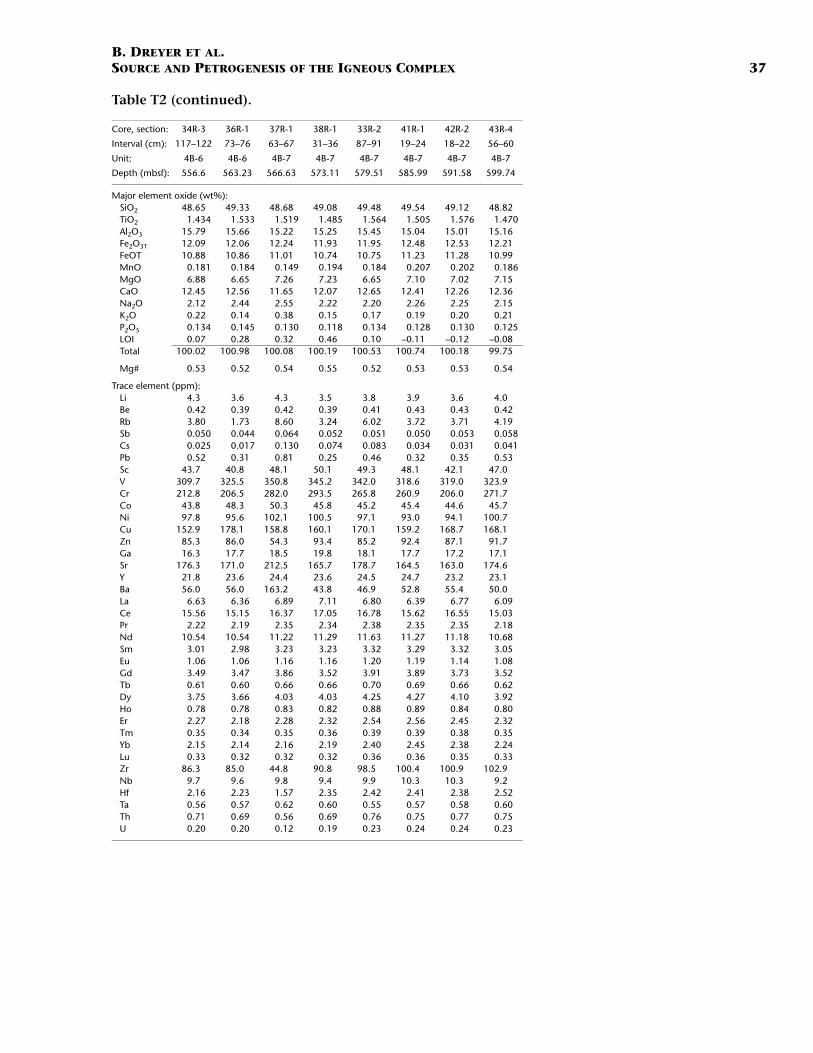
B. DREYER ET AL.SOURCE AND PETROGENESIS OF THE IGNEOUS COMPLEX 37
Table T2 (continued).
Core, section: 34R-3 36R-1 37R-1 38R-1 33R-2 41R-1 42R-2 43R-4
Interval (cm): 117–122 73–76 63–67 31–36 87–91 19–24 18–22 56–60
Unit: 4B-6 4B-6 4B-7 4B-7 4B-7 4B-7 4B-7 4B-7
Depth (mbsf): 556.6 563.23 566.63 573.11 579.51 585.99 591.58 599.74
Major element oxide (wt%):SiO2 48.65 49.33 48.68 49.08 49.48 49.54 49.12 48.82TiO2 1.434 1.533 1.519 1.485 1.564 1.505 1.576 1.470Al2O3 15.79 15.66 15.22 15.25 15.45 15.04 15.01 15.16Fe2O3T 12.09 12.06 12.24 11.93 11.95 12.48 12.53 12.21FeOT 10.88 10.86 11.01 10.74 10.75 11.23 11.28 10.99MnO 0.181 0.184 0.149 0.194 0.184 0.207 0.202 0.186MgO 6.88 6.65 7.26 7.23 6.65 7.10 7.02 7.15CaO 12.45 12.56 11.65 12.07 12.65 12.41 12.26 12.36Na2O 2.12 2.44 2.55 2.22 2.20 2.26 2.25 2.15K2O 0.22 0.14 0.38 0.15 0.17 0.19 0.20 0.21P2O5 0.134 0.145 0.130 0.118 0.134 0.128 0.130 0.125LOI 0.07 0.28 0.32 0.46 0.10 –0.11 –0.12 –0.08Total 100.02 100.98 100.08 100.19 100.53 100.74 100.18 99.75
Mg# 0.53 0.52 0.54 0.55 0.52 0.53 0.53 0.54
Trace element (ppm):Li 4.3 3.6 4.3 3.5 3.8 3.9 3.6 4.0Be 0.42 0.39 0.42 0.39 0.41 0.43 0.43 0.42Rb 3.80 1.73 8.60 3.24 6.02 3.72 3.71 4.19Sb 0.050 0.044 0.064 0.052 0.051 0.050 0.053 0.058Cs 0.025 0.017 0.130 0.074 0.083 0.034 0.031 0.041Pb 0.52 0.31 0.81 0.25 0.46 0.32 0.35 0.53Sc 43.7 40.8 48.1 50.1 49.3 48.1 42.1 47.0V 309.7 325.5 350.8 345.2 342.0 318.6 319.0 323.9Cr 212.8 206.5 282.0 293.5 265.8 260.9 206.0 271.7Co 43.8 48.3 50.3 45.8 45.2 45.4 44.6 45.7Ni 97.8 95.6 102.1 100.5 97.1 93.0 94.1 100.7Cu 152.9 178.1 158.8 160.1 170.1 159.2 168.7 168.1Zn 85.3 86.0 54.3 93.4 85.2 92.4 87.1 91.7Ga 16.3 17.7 18.5 19.8 18.1 17.7 17.2 17.1Sr 176.3 171.0 212.5 165.7 178.7 164.5 163.0 174.6Y 21.8 23.6 24.4 23.6 24.5 24.7 23.2 23.1Ba 56.0 56.0 163.2 43.8 46.9 52.8 55.4 50.0La 6.63 6.36 6.89 7.11 6.80 6.39 6.77 6.09Ce 15.56 15.15 16.37 17.05 16.78 15.62 16.55 15.03Pr 2.22 2.19 2.35 2.34 2.38 2.35 2.35 2.18Nd 10.54 10.54 11.22 11.29 11.63 11.27 11.18 10.68Sm 3.01 2.98 3.23 3.23 3.32 3.29 3.32 3.05Eu 1.06 1.06 1.16 1.16 1.20 1.19 1.14 1.08Gd 3.49 3.47 3.86 3.52 3.91 3.89 3.73 3.52Tb 0.61 0.60 0.66 0.66 0.70 0.69 0.66 0.62Dy 3.75 3.66 4.03 4.03 4.25 4.27 4.10 3.92Ho 0.78 0.78 0.83 0.82 0.88 0.89 0.84 0.80Er 2.27 2.18 2.28 2.32 2.54 2.56 2.45 2.32Tm 0.35 0.34 0.35 0.36 0.39 0.39 0.38 0.35Yb 2.15 2.14 2.16 2.19 2.40 2.45 2.38 2.24Lu 0.33 0.32 0.32 0.32 0.36 0.36 0.35 0.33Zr 86.3 85.0 44.8 90.8 98.5 100.4 100.9 102.9Nb 9.7 9.6 9.8 9.4 9.9 10.3 10.3 9.2Hf 2.16 2.23 1.57 2.35 2.42 2.41 2.38 2.52Ta 0.56 0.57 0.62 0.60 0.55 0.57 0.58 0.60Th 0.71 0.69 0.56 0.69 0.76 0.75 0.77 0.75U 0.20 0.20 0.12 0.19 0.23 0.24 0.24 0.23
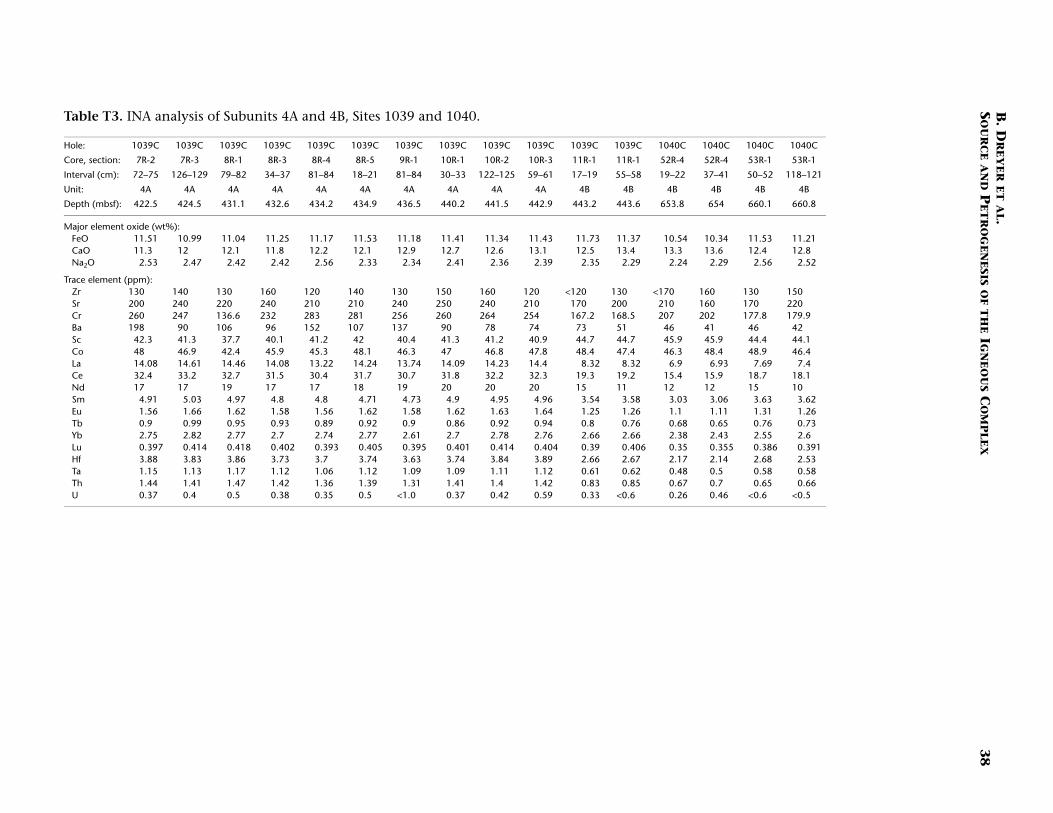
B. D
RE
YE
R E
T AL.
SO
UR
CE A
ND
PE
TR
OG
EN
ESIS O
F TH
E IGN
EO
US C
OM
PL
EX
38
Table
Hole: 1039C 1039C 1039C 1040C 1040C 1040C 1040C
Core, sec 10R-3 11R-1 11R-1 52R-4 52R-4 53R-1 53R-1
Interval ( 59–61 17–19 55–58 19–22 37–41 50–52 118–121
Unit: 4A 4B 4B 4B 4B 4B 4B
Depth (m 442.9 443.2 443.6 653.8 654 660.1 660.8
Major eleFeO 11.43 11.73 11.37 10.54 10.34 11.53 11.21CaO 13.1 12.5 13.4 13.3 13.6 12.4 12.8Na2O 2.39 2.35 2.29 2.24 2.29 2.56 2.52
Trace eleZr 120 <120 130 <170 160 130 150Sr 210 170 200 210 160 170 220Cr 254 167.2 168.5 207 202 177.8 179.9Ba 74 73 51 46 41 46 42Sc 40.9 44.7 44.7 45.9 45.9 44.4 44.1Co 47.8 48.4 47.4 46.3 48.4 48.9 46.4La 14.4 8.32 8.32 6.9 6.93 7.69 7.4Ce 32.3 19.3 19.2 15.4 15.9 18.7 18.1Nd 20 15 11 12 12 15 10Sm 4.96 3.54 3.58 3.03 3.06 3.63 3.62Eu 1.64 1.25 1.26 1.1 1.11 1.31 1.26Tb 0.94 0.8 0.76 0.68 0.65 0.76 0.73Yb 2.76 2.66 2.66 2.38 2.43 2.55 2.6Lu 0.404 0.39 0.406 0.35 0.355 0.386 0.391Hf 3.89 2.66 2.67 2.17 2.14 2.68 2.53Ta 1.12 0.61 0.62 0.48 0.5 0.58 0.58Th 1.42 0.83 0.85 0.67 0.7 0.65 0.66U 0.59 0.33 <0.6 0.26 0.46 <0.6 <0.5
T3. INA analysis of Subunits 4A and 4B, Sites 1039 and 1040.
1039C 1039C 1039C 1039C 1039C 1039C 1039C 1039C 1039C
tion: 7R-2 7R-3 8R-1 8R-3 8R-4 8R-5 9R-1 10R-1 10R-2
cm): 72–75 126–129 79–82 34–37 81–84 18–21 81–84 30–33 122–125
4A 4A 4A 4A 4A 4A 4A 4A 4A
bsf): 422.5 424.5 431.1 432.6 434.2 434.9 436.5 440.2 441.5
ment oxide (wt%):11.51 10.99 11.04 11.25 11.17 11.53 11.18 11.41 11.3411.3 12 12.1 11.8 12.2 12.1 12.9 12.7 12.6
2.53 2.47 2.42 2.42 2.56 2.33 2.34 2.41 2.36
ment (ppm):130 140 130 160 120 140 130 150 160200 240 220 240 210 210 240 250 240260 247 136.6 232 283 281 256 260 264198 90 106 96 152 107 137 90 78
42.3 41.3 37.7 40.1 41.2 42 40.4 41.3 41.248 46.9 42.4 45.9 45.3 48.1 46.3 47 46.814.08 14.61 14.46 14.08 13.22 14.24 13.74 14.09 14.2332.4 33.2 32.7 31.5 30.4 31.7 30.7 31.8 32.217 17 19 17 17 18 19 20 20
4.91 5.03 4.97 4.8 4.8 4.71 4.73 4.9 4.951.56 1.66 1.62 1.58 1.56 1.62 1.58 1.62 1.630.9 0.99 0.95 0.93 0.89 0.92 0.9 0.86 0.922.75 2.82 2.77 2.7 2.74 2.77 2.61 2.7 2.780.397 0.414 0.418 0.402 0.393 0.405 0.395 0.401 0.4143.88 3.83 3.86 3.73 3.7 3.74 3.63 3.74 3.841.15 1.13 1.17 1.12 1.06 1.12 1.09 1.09 1.111.44 1.41 1.47 1.42 1.36 1.39 1.31 1.41 1.40.37 0.4 0.5 0.38 0.35 0.5 <1.0 0.37 0.42