9,660 sf available
TRANSCRIPT

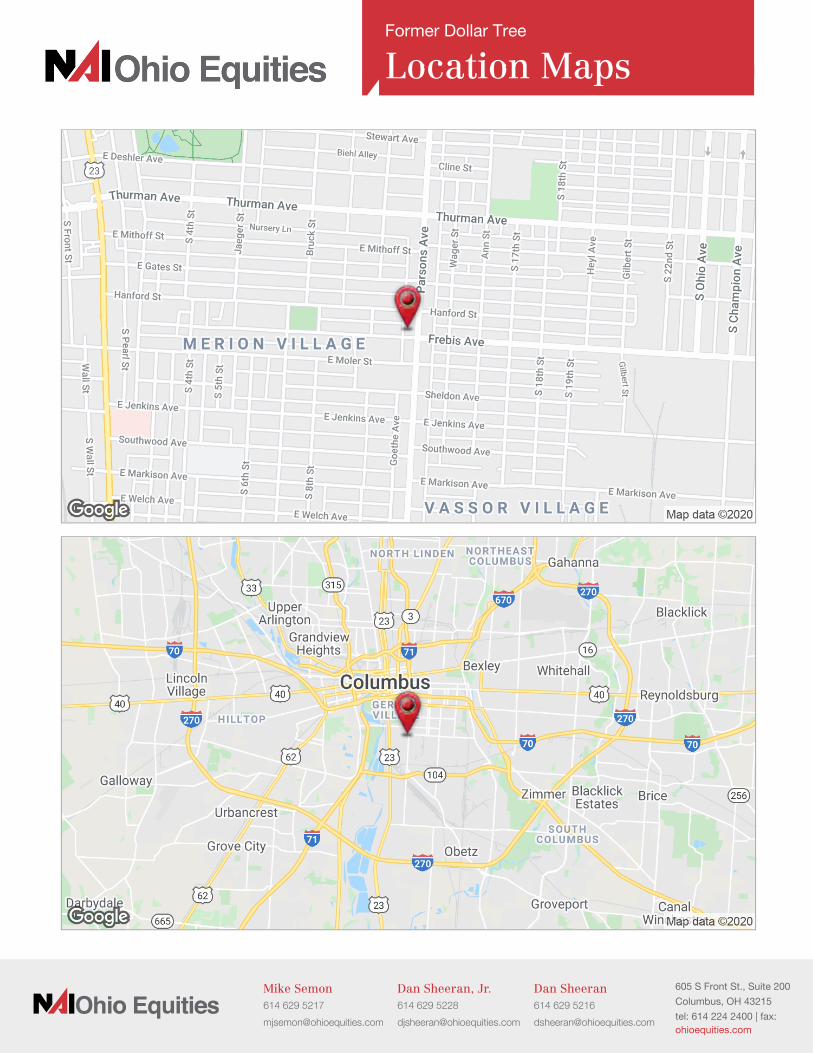
1351 S Parsons Avenue, Columbus, Ohio 43206
For more information:Mike Semon614 629 5217 • [email protected]
Dan Sheeran, Jr.614 629 5228 • [email protected]
Dan Sheeran614 629 5216 • [email protected]
Property Features
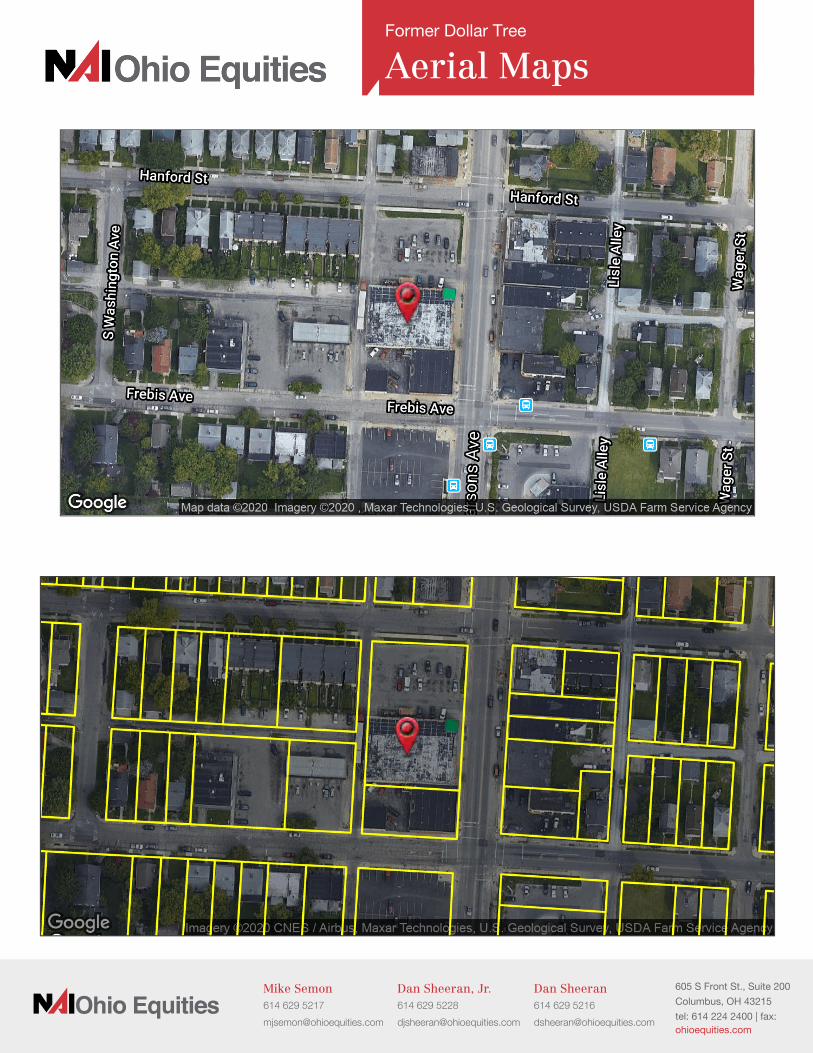
• Former Dollar Tree in revitalized Parsons Avenue on the
southeast side of Columbus
• 9,660 SF Freestanding commercial building
• Column spacing 30 x 20
• 34 Parking spaces
• Zoned C-4
• Strong demographics and traffic counts
• Nationwide Children's Hospital located just one mile North
• Just minutes from German Village, Merion Village, Hungarian
Village & downtown Columbus
Sale Price: $1,295,000Lease Rate: $12.00 SF/Yr (MG)
Former Dollar Tree
NAI Ohio Equities605 S Front Street, Columbus, OH 43215614 224 2400
NO WARRANTY OR REPRESENTATION, EXPRESS OR IMPLIED, IS MADE AS TO THE ACCURACY OFTHE INFORMATION CONTAINED HEREIN, AND THE SAME IS SUBMITTED SUBJECT TO ERRORS,OMISSIONS, CHANGE OF PRICE, RENTAL OR OTHER CONDITIONS, PRIOR SALE, LEASE ORFINANCING, OR WITHDRAWAL WITHOUT NOTICE, AND OF ANY SPECIAL LISTING CONDITIONSIMPOSED BY OUR PRINCIPALS NO WARRANTIES OR REPRESENTATIONS ARE MADE AS TO THECONDITION OF THE PROPERTY OR ANY HAZARDS CONTAINED THEREIN ARE ANY TO BE IMPLIED. ohioequities.com
For Sale or Lease
Retail | Office9,660 SF Available

605 S Front St., Suite 200
Columbus, OH 43215
tel: 614 224 2400 | fax:ohioequities.com
Mike Semon614 629 5217
Dan Sheeran, Jr.614 629 5228
Dan Sheeran614 629 5216
Former Dollar Tree
Floor Plan

605 S Front St., Suite 200
Columbus, OH 43215
tel: 614 224 2400 | fax:ohioequities.com
Mike Semon614 629 5217
Dan Sheeran, Jr.614 629 5228
Dan Sheeran614 629 5216
Former Dollar Tree
Property Photos
605 S Front St., Suite 200
Columbus, OH 43215
tel: 614 224 2400 | fax:ohioequities.com
Mike Semon614 629 5217
Dan Sheeran, Jr.614 629 5228
Dan Sheeran614 629 5216
Former Dollar Tree
Location Maps
605 S Front St., Suite 200
Columbus, OH 43215
tel: 614 224 2400 | fax:ohioequities.com
Mike Semon614 629 5217
Dan Sheeran, Jr.614 629 5228
Dan Sheeran614 629 5216
Former Dollar Tree
Aerial Maps

605 S Front St., Suite 200
Columbus, OH 43215
tel: 614 224 2400 | fax:ohioequities.com
Mike Semon614 629 5217
Dan Sheeran, Jr.614 629 5228
Dan Sheeran614 629 5216
Former Dollar Tree
Area Retailers

605 S Front St., Suite 200
Columbus, OH 43215
tel: 614 224 2400 | fax:ohioequities.com
Mike Semon614 629 5217
Dan Sheeran, Jr.614 629 5228
Dan Sheeran614 629 5216
Former Dollar Tree
Aerial View

This
repo
rt w
as p
rodu
ced
usin
g da
ta fr
om p
rivat
e an
d go
vern
men
t sou
rces
dee
med
to b
e re
liabl
e. T
he in
form
atio
n he
rein
is p
rovi
ded
with
out r
epre
sent
atio
n or
war
rant
y.
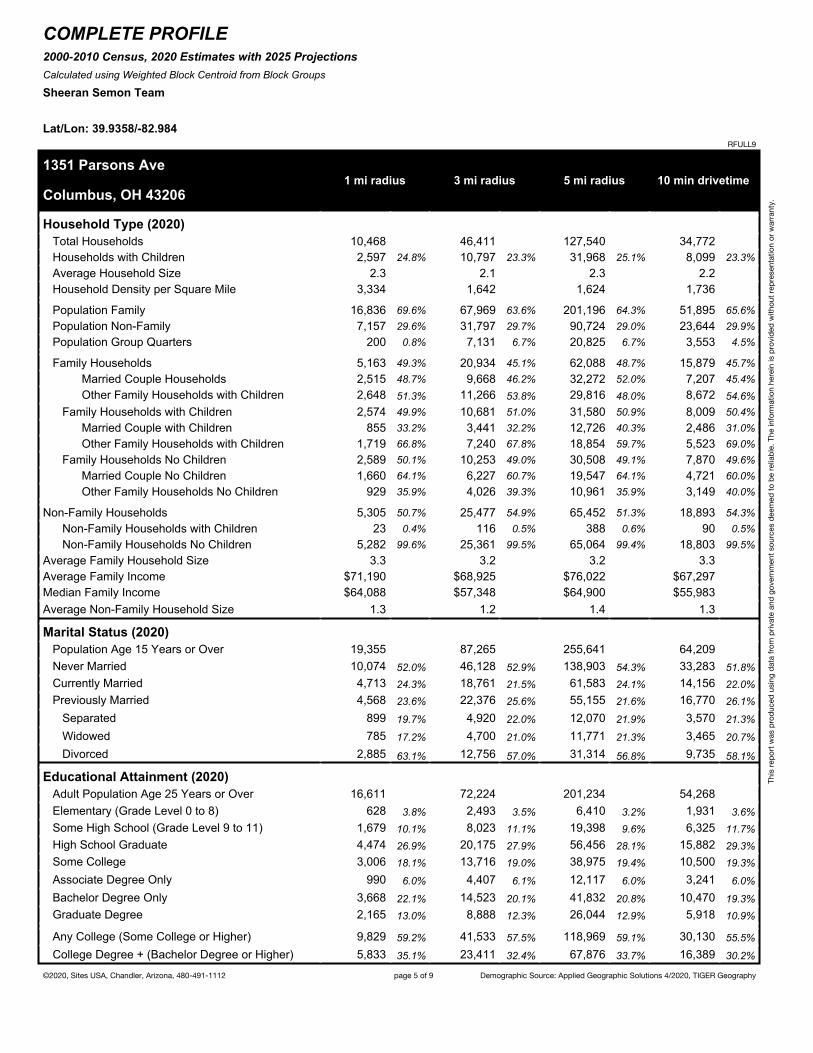
COMPLETE PROFILE2000-2010 Census, 2020 Estimates with 2025 ProjectionsCalculated using Weighted Block Centroid from Block Groups
Sheeran Semon Team
Lat/Lon: 39.9358/-82.984RFULL9
1351 Parsons Ave1 mi radius 3 mi radius 5 mi radius 10 min drivetime
Columbus, OH 43206
Population
Estimated Population (2020) 24,193 106,897 312,744 79,092 Projected Population (2025) 26,672 118,651 336,572 88,819 Census Population (2010) 20,998 88,746 266,343 66,708 Census Population (2000) 24,014 95,989 274,113 74,117
Projected Annual Growth (2020-2025) 2,479 2.0% 11,754 2.2% 23,828 1.5% 9,727 2.5% Historical Annual Growth (2010-2020) 3,195 1.5% 18,151 2.0% 46,401 1.7% 12,384 1.9% Historical Annual Growth (2000-2010) -3,016 -1.3% -7,243 -0.8% -7,769 -0.3% -7,409 -1.0%
Estimated Population Density (2020) 7,705 psm 3,783 psm 3,983 psm 3,949 psm Trade Area Size 3.1 sq mi 28.3 sq mi 78.5 sq mi 20.0 sq mi
Households Estimated Households (2020) 10,468 46,411 127,540 34,772 Projected Households (2025) 11,342 50,833 135,966 38,438 Census Households (2010) 9,196 37,762 107,969 28,721 Census Households (2000) 9,936 39,760 111,045 30,920
Projected Annual Growth (2020-2025) 874 1.7% 4,422 1.9% 8,426 1.3% 3,667 2.1% Historical Annual Change (2000-2020) 532 0.3% 6,650 0.8% 16,495 0.7% 3,852 0.6%
Average Household Income Estimated Average Household Income (2020) $71,448 $61,719 $63,917 $62,141 Projected Average Household Income (2025) $78,734 $66,149 $70,364 $66,209 Census Average Household Income (2010) $51,377 $44,815 $46,712 $42,828 Census Average Household Income (2000) $44,896 $39,258 $42,051 $38,379
Projected Annual Change (2020-2025) $7,286 2.0% $4,430 1.4% $6,446 2.0% $4,068 1.3% Historical Annual Change (2000-2020) $26,552 3.0% $22,461 2.9% $21,867 2.6% $23,762 3.1%
Median Household Income Estimated Median Household Income (2020) $57,972 $49,400 $52,397 $49,461 Projected Median Household Income (2025) $66,383 $56,680 $60,429 $56,456 Census Median Household Income (2010) $37,738 $32,753 $36,784 $31,123 Census Median Household Income (2000) $32,589 $28,185 $32,620 $27,870
Projected Annual Change (2020-2025) $8,412 2.9% $7,279 2.9% $8,032 3.1% $6,995 2.8% Historical Annual Change (2000-2020) $25,383 3.9% $21,216 3.8% $19,776 3.0% $21,591 3.9%
Per Capita Income Estimated Per Capita Income (2020) $31,007 $27,510 $26,521 $27,766 Projected Per Capita Income (2025) $33,566 $28,983 $28,847 $29,051 Census Per Capita Income (2010) $22,501 $19,069 $18,936 $18,439 Census Per Capita Income (2000) $18,348 $16,052 $16,912 $15,761
Projected Annual Change (2020-2025) $2,559 1.7% $1,473 1.1% $2,327 1.8% $1,285 0.9% Historical Annual Change (2000-2020) $12,659 3.4% $11,458 3.6% $9,609 2.8% $12,005 3.8% Estimated Average Household Net Worth (2020) $461,915 $408,318 $413,838 $397,574
©2020, Sites USA, Chandler, Arizona, 480-491-1112 page 1 of 9 Demographic Source: Applied Geographic Solutions 4/2020, TIGER Geography

COMPLETE PROFILE
This
rep
ort w
as p
rodu
ced
usin
g da
ta fr
om p
rivat
e an
d go
vern
men
t sou
rces
dee
med
to b
e re
liabl
e. T
he in
form
atio
n he
rein
is p
rovi
ded
with
out r
epre
sent
atio
n or
war
rant
y.
2000-2010 Census, 2020 Estimates with 2025 ProjectionsCalculated using Weighted Block Centroid from Block Groups
Sheeran Semon Team
Lat/Lon: 39.9358/-82.984RFULL9
1351 Parsons Ave1 mi radius 3 mi radius 5 mi radius 10 min drivetime
Columbus, OH 43206
Race and Ethnicity Total Population (2020) 24,193 106,897 312,744 79,092 White (2020) 14,368 59.4% 51,592 48.3% 174,525 55.8% 38,205 48.3% Black or African American (2020) 7,771 32.1% 46,479 43.5% 107,592 34.4% 34,586 43.7% American Indian or Alaska Native (2020) 89 0.4% 364 0.3% 985 0.3% 281 0.4% Asian (2020) 652 2.7% 2,828 2.6% 11,958 3.8% 2,018 2.6% Hawaiian or Pacific Islander (2020) 4 - 200 0.2% 318 0.1% 20 - Other Race (2020) 326 1.3% 1,251 1.2% 6,185 2.0% 959 1.2% Two or More Races (2020) 985 4.1% 4,184 3.9% 11,179 3.6% 3,023 3.8%
Population < 18 (2020) 5,545 22.9% 22,799 21.3% 65,809 21.0% 17,386 22.0% White Not Hispanic 2,244 40.5% 7,463 32.7% 26,512 40.3% 5,818 33.5% Black or African American 2,471 44.6% 11,971 52.5% 28,217 42.9% 9,100 52.3% Asian 120 2.2% 463 2.0% 1,874 2.8% 343 2.0% Other Race Not Hispanic 398 7.2% 1,567 6.9% 4,416 6.7% 1,178 6.8% Hispanic 313 5.6% 1,335 5.9% 4,788 7.3% 948 5.5%
Not Hispanic or Latino Population (2020) 23,218 96.0% 102,555 95.9% 297,828 95.2% 76,056 96.2% Not Hispanic White 13,987 60.2% 49,904 48.7% 169,006 56.7% 37,003 48.7% Not Hispanic Black or African American 7,690 33.1% 45,728 44.6% 105,849 35.5% 34,162 44.9% Not Hispanic American Indian or Alaska Native 76 0.3% 314 0.3% 823 0.3% 239 0.3% Not Hispanic Asian 606 2.6% 2,689 2.6% 11,718 3.9% 1,938 2.5% Not Hispanic Hawaiian or Pacific Islander 4 - 188 0.2% 292 - 20 - Not Hispanic Other Race 20 - 145 0.1% 538 0.2% 115 0.2% Not Hispanic Two or More Races 836 3.6% 3,587 3.5% 9,602 3.2% 2,578 3.4%
Hispanic or Latino Population (2020) 975 4.0% 4,342 4.1% 14,916 4.8% 3,036 3.8% Hispanic White 380 39.0% 1,688 38.9% 5,519 37.0% 1,202 39.6% Hispanic Black or African American 80 8.2% 751 17.3% 1,744 11.7% 423 13.9% Hispanic American Indian or Alaska Native 13 1.3% 50 1.1% 162 1.1% 41 1.4% Hispanic Asian 46 4.7% 139 3.2% 240 1.6% 80 2.6% Hispanic Hawaiian or Pacific Islander - - 11 0.3% 26 0.2% - - Hispanic Other Race 306 31.4% 1,106 25.5% 5,647 37.9% 845 27.8% Hispanic Two or More Races 149 15.3% 598 13.8% 1,577 10.6% 445 14.7%
Not Hispanic or Latino Population (2010) 20,303 96.7% 86,159 97.1% 256,067 96.1% 64,660 96.9% Hispanic or Latino Population (2010) 695 3.3% 2,587 2.9% 10,276 3.9% 2,048 3.1% Not Hispanic or Latino Population (2000) 23,556 98.1% 94,556 98.5% 268,614 98.0% 72,882 98.3% Hispanic or Latino Population (2000) 458 1.9% 1,433 1.5% 5,499 2.0% 1,235 1.7% Not Hispanic or Latino Population (2025) 25,581 95.9% 113,639 95.8% 320,067 95.1% 85,236 96.0% Hispanic or Latino Population (2025) 1,091 4.1% 5,013 4.2% 16,504 4.9% 3,583 4.0% Projected Annual Growth (2020-2025) 116 2.4% 671 3.1% 1,589 2.1% 547 3.6% Historical Annual Growth (2000-2010) 238 5.2% 1,154 8.1% 4,777 8.7% 814 6.6%
©2020, Sites USA, Chandler, Arizona, 480-491-1112 page 2 of 9 Demographic Source: Applied Geographic Solutions 4/2020, TIGER Geography

COMPLETE PROFILE
This
rep
ort w
as p
rodu
ced
usin
g da
ta fr
om p
rivat
e an
d go
vern
men
t sou
rces
dee
med
to b
e re
liabl
e. T
he in
form
atio
n he
rein
is p
rovi
ded
with
out r
epre
sent
atio
n or
war
rant
y.
2000-2010 Census, 2020 Estimates with 2025 ProjectionsCalculated using Weighted Block Centroid from Block Groups
Sheeran Semon Team
Lat/Lon: 39.9358/-82.984RFULL9
1351 Parsons Ave1 mi radius 3 mi radius 5 mi radius 10 min drivetime
Columbus, OH 43206
Total Age Distribution (2020) Total Population 24,193 106,897 312,744 79,092 Age Under 5 Years 1,738 7.2% 7,055 6.6% 19,988 6.4% 5,335 6.7% Age 5 to 9 Years 1,630 6.7% 6,586 6.2% 19,220 6.1% 4,988 6.3% Age 10 to 14 Years 1,470 6.1% 5,991 5.6% 17,895 5.7% 4,560 5.8% Age 15 to 19 Years 1,327 5.5% 7,543 7.1% 25,841 8.3% 4,933 6.2% Age 20 to 24 Years 1,418 5.9% 7,498 7.0% 28,566 9.1% 5,008 6.3% Age 25 to 29 Years 2,396 9.9% 9,584 9.0% 27,767 8.9% 7,107 9.0% Age 30 to 34 Years 2,384 9.9% 8,824 8.3% 25,346 8.1% 6,724 8.5% Age 35 to 39 Years 1,886 7.8% 7,210 6.7% 21,019 6.7% 5,503 7.0% Age 40 to 44 Years 1,507 6.2% 6,284 5.9% 17,886 5.7% 4,736 6.0% Age 45 to 49 Years 1,416 5.9% 6,329 5.9% 17,634 5.6% 4,740 6.0% Age 50 to 54 Years 1,410 5.8% 6,354 5.9% 17,375 5.6% 4,847 6.1% Age 55 to 59 Years 1,467 6.1% 6,667 6.2% 18,109 5.8% 5,101 6.4% Age 60 to 64 Years 1,362 5.6% 6,260 5.9% 16,857 5.4% 4,677 5.9% Age 65 to 69 Years 1,031 4.3% 5,049 4.7% 13,724 4.4% 3,803 4.8% Age 70 to 74 Years 745 3.1% 3,796 3.6% 10,132 3.2% 2,884 3.6% Age 75 to 79 Years 463 1.9% 2,557 2.4% 6,602 2.1% 1,925 2.4% Age 80 to 84 Years 283 1.2% 1,656 1.5% 4,344 1.4% 1,187 1.5% Age 85 Years or Over 261 1.1% 1,654 1.5% 4,439 1.4% 1,035 1.3%
Median Age 33.4 35.0 33.6 35.2 Age 19 Years or Less 6,164 25.5% 27,175 25.4% 82,944 26.5% 19,816 25.1% Age 20 to 64 Years 15,245 63.0% 65,011 60.8% 190,559 60.9% 48,442 61.2% Age 65 Years or Over 2,783 11.5% 14,711 13.8% 39,241 12.5% 10,834 13.7%
Female Age Distribution (2020) Female Population 12,056 49.8% 53,526 50.1% 156,955 50.2% 39,339 49.7% Age Under 5 Years 844 7.0% 3,454 6.5% 9,770 6.2% 2,635 6.7% Age 5 to 9 Years 781 6.5% 3,178 5.9% 9,287 5.9% 2,360 6.0% Age 10 to 14 Years 683 5.7% 2,903 5.4% 8,629 5.5% 2,219 5.6% Age 15 to 19 Years 585 4.9% 3,719 6.9% 12,926 8.2% 2,353 6.0% Age 20 to 24 Years 771 6.4% 3,972 7.4% 14,187 9.0% 2,637 6.7% Age 25 to 29 Years 1,260 10.5% 4,941 9.2% 13,987 8.9% 3,680 9.4% Age 30 to 34 Years 1,227 10.2% 4,332 8.1% 12,513 8.0% 3,306 8.4% Age 35 to 39 Years 884 7.3% 3,410 6.4% 10,112 6.4% 2,584 6.6% Age 40 to 44 Years 706 5.9% 2,938 5.5% 8,564 5.5% 2,198 5.6% Age 45 to 49 Years 674 5.6% 2,892 5.4% 8,285 5.3% 2,177 5.5% Age 50 to 54 Years 653 5.4% 2,962 5.5% 8,371 5.3% 2,215 5.6% Age 55 to 59 Years 756 6.3% 3,316 6.2% 9,226 5.9% 2,531 6.4% Age 60 to 64 Years 691 5.7% 3,170 5.9% 8,726 5.6% 2,377 6.0% Age 65 to 69 Years 539 4.5% 2,637 4.9% 7,344 4.7% 1,947 4.9% Age 70 to 74 Years 404 3.4% 2,130 4.0% 5,618 3.6% 1,643 4.2% Age 75 to 79 Years 249 2.1% 1,431 2.7% 3,770 2.4% 1,055 2.7% Age 80 to 84 Years 174 1.4% 1,007 1.9% 2,627 1.7% 711 1.8% Age 85 Years or Over 176 1.5% 1,132 2.1% 3,014 1.9% 711 1.8%
Female Median Age 33.8 35.5 34.4 35.7 Age 19 Years or Less 2,894 24.0% 13,254 24.8% 40,612 25.9% 9,567 24.3% Age 20 to 64 Years 7,620 63.2% 31,934 59.7% 93,970 59.9% 23,705 60.3% Age 65 Years or Over 1,542 12.8% 8,338 15.6% 22,373 14.3% 6,067 15.4%
©2020, Sites USA, Chandler, Arizona, 480-491-1112 page 3 of 9 Demographic Source: Applied Geographic Solutions 4/2020, TIGER Geography

COMPLETE PROFILE
This
repo
rt w
as p
rodu
ced
usin
g da
ta fr
om p
rivat
e an
d go
vern
men
t sou
rces
dee
med
to b
e re
liabl
e. T
he in
form
atio
n he
rein
is p
rovi
ded
with
out r
epre
sent
atio
n or
war
rant
y.
2000-2010 Census, 2020 Estimates with 2025 ProjectionsCalculated using Weighted Block Centroid from Block Groups
Sheeran Semon Team
Lat/Lon: 39.9358/-82.984RFULL9
1351 Parsons Ave1 mi radius 3 mi radius 5 mi radius 10 min drivetime
Columbus, OH 43206
Male Age Distribution (2020) Male Population 12,137 50.2% 53,371 49.9% 155,789 49.8% 39,753 50.3% Age Under 5 Years 893 7.4% 3,602 6.7% 10,219 6.6% 2,701 6.8% Age 5 to 9 Years 849 7.0% 3,409 6.4% 9,933 6.4% 2,628 6.6% Age 10 to 14 Years 787 6.5% 3,088 5.8% 9,265 5.9% 2,340 5.9% Age 15 to 19 Years 741 6.1% 3,823 7.2% 12,915 8.3% 2,579 6.5% Age 20 to 24 Years 647 5.3% 3,526 6.6% 14,380 9.2% 2,371 6.0% Age 25 to 29 Years 1,136 9.4% 4,643 8.7% 13,780 8.8% 3,427 8.6% Age 30 to 34 Years 1,157 9.5% 4,492 8.4% 12,833 8.2% 3,418 8.6% Age 35 to 39 Years 1,002 8.3% 3,800 7.1% 10,907 7.0% 2,919 7.3% Age 40 to 44 Years 802 6.6% 3,346 6.3% 9,322 6.0% 2,539 6.4% Age 45 to 49 Years 742 6.1% 3,436 6.4% 9,350 6.0% 2,563 6.4% Age 50 to 54 Years 758 6.2% 3,392 6.4% 9,004 5.8% 2,631 6.6% Age 55 to 59 Years 710 5.9% 3,351 6.3% 8,883 5.7% 2,570 6.5% Age 60 to 64 Years 672 5.5% 3,090 5.8% 8,132 5.2% 2,299 5.8% Age 65 to 69 Years 492 4.1% 2,411 4.5% 6,380 4.1% 1,857 4.7% Age 70 to 74 Years 340 2.8% 1,666 3.1% 4,514 2.9% 1,240 3.1% Age 75 to 79 Years 214 1.8% 1,126 2.1% 2,832 1.8% 870 2.2% Age 80 to 84 Years 110 0.9% 648 1.2% 1,718 1.1% 476 1.2% Age 85 Years or Over 85 0.7% 522 1.0% 1,425 0.9% 324 0.8%
Male Median Age 32.9 34.6 32.8 34.8 Age 19 Years or Less 3,271 26.9% 13,921 26.1% 42,332 27.2% 10,248 25.8% Age 20 to 64 Years 7,625 62.8% 33,077 62.0% 96,589 62.0% 24,737 62.2% Age 65 Years or Over 1,241 10.2% 6,374 11.9% 16,868 10.8% 4,767 12.0%
Males per 100 Females (2020) Overall Comparison 101 100 99 101 Age Under 5 Years 106 51.4% 104 51.0% 105 51.1% 103 50.6% Age 5 to 9 Years 109 52.1% 107 51.8% 107 51.7% 111 52.7% Age 10 to 14 Years 115 53.5% 106 51.5% 107 51.8% 105 51.8% Age 15 to 19 Years 127 55.9% 103 50.7% 100 50.0% 110 52.3% Age 20 to 24 Years 84 45.6% 89 47.0% 101 50.3% 90 47.3% Age 25 to 29 Years 90 47.4% 94 48.4% 99 49.6% 93 48.2% Age 30 to 34 Years 94 48.5% 104 50.9% 103 50.6% 103 50.8% Age 35 to 39 Years 113 53.1% 111 52.7% 108 51.9% 113 53.0% Age 40 to 44 Years 114 53.2% 114 53.2% 109 52.1% 116 53.6% Age 45 to 49 Years 110 52.4% 119 54.3% 113 53.0% 118 54.1% Age 50 to 54 Years 116 53.7% 115 53.4% 108 51.8% 119 54.3% Age 55 to 59 Years 94 48.4% 101 50.3% 96 49.1% 102 50.4% Age 60 to 64 Years 97 49.3% 97 49.4% 93 48.2% 97 49.2% Age 65 to 69 Years 91 47.7% 91 47.8% 87 46.5% 95 48.8% Age 70 to 74 Years 84 45.7% 78 43.9% 80 44.6% 75 43.0% Age 75 to 79 Years 86 46.2% 79 44.0% 75 42.9% 82 45.2% Age 80 to 84 Years 63 38.7% 64 39.2% 65 39.5% 67 40.1% Age 85 Years or Over 48 32.6% 46 31.5% 47 32.1% 46 31.3%
Age 19 Years or Less 113 53.1% 105 51.2% 104 51.0% 107 51.7% Age 20 to 39 Years 95 48.8% 99 49.7% 102 50.5% 99 49.9% Age 40 to 64 Years 106 51.4% 109 52.1% 104 50.9% 110 52.3% Age 65 Years or Over 80 44.6% 76 43.3% 75 43.0% 79 44.0%
©2020, Sites USA, Chandler, Arizona, 480-491-1112 page 4 of 9 Demographic Source: Applied Geographic Solutions 4/2020, TIGER Geography
COMPLETE PROFILE
This
repo
rt w
as p
rodu
ced
usin
g da
ta fr
om p
rivat
e an
d go
vern
men
t sou
rces
dee
med
to b
e re
liabl
e. T
he in
form
atio
n he
rein
is p
rovi
ded
with
out r
epre
sent
atio
n or
war
rant
y.
2000-2010 Census, 2020 Estimates with 2025 ProjectionsCalculated using Weighted Block Centroid from Block Groups
Sheeran Semon Team
Lat/Lon: 39.9358/-82.984RFULL9
1351 Parsons Ave1 mi radius 3 mi radius 5 mi radius 10 min drivetime
Columbus, OH 43206
Household Type (2020) Total Households 10,468 46,411 127,540 34,772 Households with Children 2,597 24.8% 10,797 23.3% 31,968 25.1% 8,099 23.3% Average Household Size 2.3 2.1 2.3 2.2 Household Density per Square Mile 3,334 1,642 1,624 1,736
Population Family 16,836 69.6% 67,969 63.6% 201,196 64.3% 51,895 65.6% Population Non-Family 7,157 29.6% 31,797 29.7% 90,724 29.0% 23,644 29.9% Population Group Quarters 200 0.8% 7,131 6.7% 20,825 6.7% 3,553 4.5%
Family Households 5,163 49.3% 20,934 45.1% 62,088 48.7% 15,879 45.7% Married Couple Households 2,515 48.7% 9,668 46.2% 32,272 52.0% 7,207 45.4% Other Family Households with Children 2,648 51.3% 11,266 53.8% 29,816 48.0% 8,672 54.6% Family Households with Children 2,574 49.9% 10,681 51.0% 31,580 50.9% 8,009 50.4% Married Couple with Children 855 33.2% 3,441 32.2% 12,726 40.3% 2,486 31.0% Other Family Households with Children 1,719 66.8% 7,240 67.8% 18,854 59.7% 5,523 69.0% Family Households No Children 2,589 50.1% 10,253 49.0% 30,508 49.1% 7,870 49.6% Married Couple No Children 1,660 64.1% 6,227 60.7% 19,547 64.1% 4,721 60.0% Other Family Households No Children 929 35.9% 4,026 39.3% 10,961 35.9% 3,149 40.0%
Non-Family Households 5,305 50.7% 25,477 54.9% 65,452 51.3% 18,893 54.3% Non-Family Households with Children 23 0.4% 116 0.5% 388 0.6% 90 0.5% Non-Family Households No Children 5,282 99.6% 25,361 99.5% 65,064 99.4% 18,803 99.5%Average Family Household Size 3.3 3.2 3.2 3.3Average Family Income $71,190 $68,925 $76,022 $67,297Median Family Income $64,088 $57,348 $64,900 $55,983Average Non-Family Household Size 1.3 1.2 1.4 1.3
Marital Status (2020) Population Age 15 Years or Over 19,355 87,265 255,641 64,209 Never Married 10,074 52.0% 46,128 52.9% 138,903 54.3% 33,283 51.8% Currently Married 4,713 24.3% 18,761 21.5% 61,583 24.1% 14,156 22.0% Previously Married 4,568 23.6% 22,376 25.6% 55,155 21.6% 16,770 26.1% Separated 899 19.7% 4,920 22.0% 12,070 21.9% 3,570 21.3% Widowed 785 17.2% 4,700 21.0% 11,771 21.3% 3,465 20.7% Divorced 2,885 63.1% 12,756 57.0% 31,314 56.8% 9,735 58.1%
Educational Attainment (2020) Adult Population Age 25 Years or Over 16,611 72,224 201,234 54,268 Elementary (Grade Level 0 to 8) 628 3.8% 2,493 3.5% 6,410 3.2% 1,931 3.6% Some High School (Grade Level 9 to 11) 1,679 10.1% 8,023 11.1% 19,398 9.6% 6,325 11.7% High School Graduate 4,474 26.9% 20,175 27.9% 56,456 28.1% 15,882 29.3% Some College 3,006 18.1% 13,716 19.0% 38,975 19.4% 10,500 19.3% Associate Degree Only 990 6.0% 4,407 6.1% 12,117 6.0% 3,241 6.0% Bachelor Degree Only 3,668 22.1% 14,523 20.1% 41,832 20.8% 10,470 19.3% Graduate Degree 2,165 13.0% 8,888 12.3% 26,044 12.9% 5,918 10.9%
Any College (Some College or Higher) 9,829 59.2% 41,533 57.5% 118,969 59.1% 30,130 55.5% College Degree + (Bachelor Degree or Higher) 5,833 35.1% 23,411 32.4% 67,876 33.7% 16,389 30.2%
©2020, Sites USA, Chandler, Arizona, 480-491-1112 page 5 of 9 Demographic Source: Applied Geographic Solutions 4/2020, TIGER Geography
COMPLETE PROFILE
This
rep
ort w
as p
rodu
ced
usin
g da
ta fr
om p
rivat
e an
d go
vern
men
t sou
rces
dee
med
to b
e re
liabl
e. T
he in
form
atio
n he
rein
is p
rovi
ded
with
out r
epre
sent
atio
n or
war
rant
y.
2000-2010 Census, 2020 Estimates with 2025 ProjectionsCalculated using Weighted Block Centroid from Block Groups
Sheeran Semon Team
Lat/Lon: 39.9358/-82.984RFULL9
1351 Parsons Ave1 mi radius 3 mi radius 5 mi radius 10 min drivetime
Columbus, OH 43206
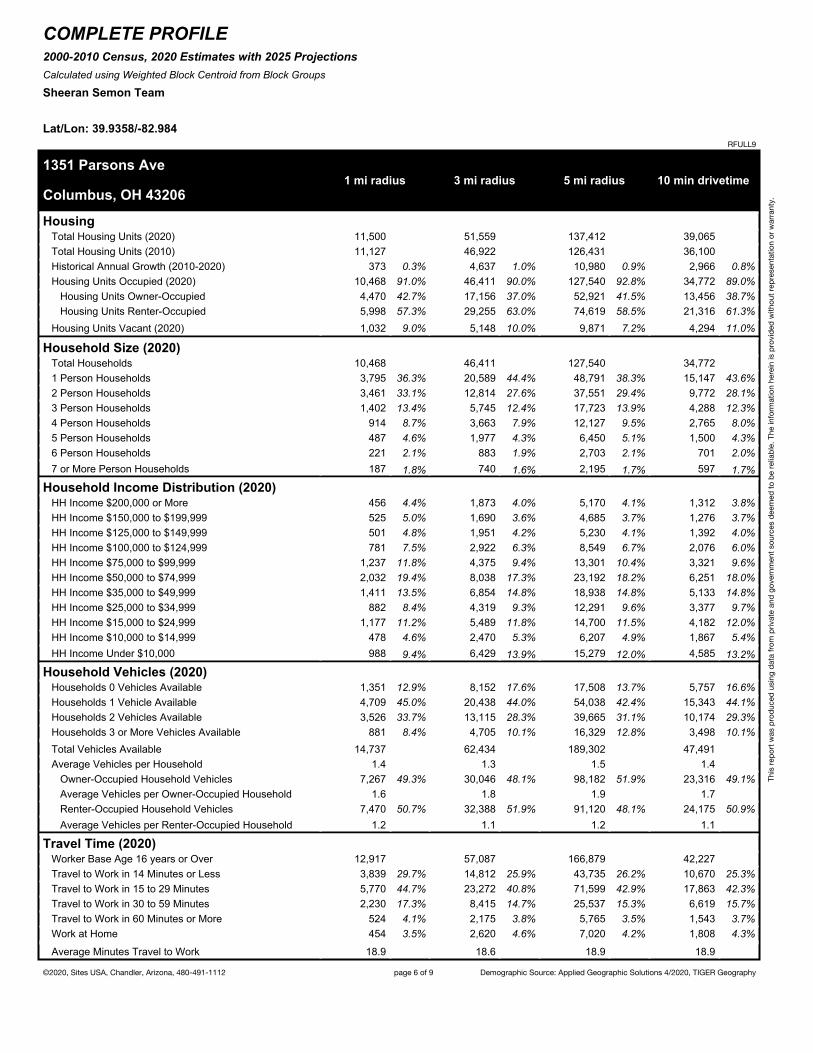
Housing Total Housing Units (2020) 11,500 51,559 137,412 39,065 Total Housing Units (2010) 11,127 46,922 126,431 36,100 Historical Annual Growth (2010-2020) 373 0.3% 4,637 1.0% 10,980 0.9% 2,966 0.8% Housing Units Occupied (2020) 10,468 91.0% 46,411 90.0% 127,540 92.8% 34,772 89.0% Housing Units Owner-Occupied 4,470 42.7% 17,156 37.0% 52,921 41.5% 13,456 38.7% Housing Units Renter-Occupied 5,998 57.3% 29,255 63.0% 74,619 58.5% 21,316 61.3% Housing Units Vacant (2020) 1,032 9.0% 5,148 10.0% 9,871 7.2% 4,294 11.0%
Household Size (2020) Total Households 10,468 46,411 127,540 34,772 1 Person Households 3,795 36.3% 20,589 44.4% 48,791 38.3% 15,147 43.6% 2 Person Households 3,461 33.1% 12,814 27.6% 37,551 29.4% 9,772 28.1% 3 Person Households 1,402 13.4% 5,745 12.4% 17,723 13.9% 4,288 12.3% 4 Person Households 914 8.7% 3,663 7.9% 12,127 9.5% 2,765 8.0% 5 Person Households 487 4.6% 1,977 4.3% 6,450 5.1% 1,500 4.3% 6 Person Households 221 2.1% 883 1.9% 2,703 2.1% 701 2.0% 7 or More Person Households 187 1.8% 740 1.6% 2,195 1.7% 597 1.7%
Household Income Distribution (2020) HH Income $200,000 or More 456 4.4% 1,873 4.0% 5,170 4.1% 1,312 3.8% HH Income $150,000 to $199,999 525 5.0% 1,690 3.6% 4,685 3.7% 1,276 3.7% HH Income $125,000 to $149,999 501 4.8% 1,951 4.2% 5,230 4.1% 1,392 4.0% HH Income $100,000 to $124,999 781 7.5% 2,922 6.3% 8,549 6.7% 2,076 6.0% HH Income $75,000 to $99,999 1,237 11.8% 4,375 9.4% 13,301 10.4% 3,321 9.6% HH Income $50,000 to $74,999 2,032 19.4% 8,038 17.3% 23,192 18.2% 6,251 18.0% HH Income $35,000 to $49,999 1,411 13.5% 6,854 14.8% 18,938 14.8% 5,133 14.8% HH Income $25,000 to $34,999 882 8.4% 4,319 9.3% 12,291 9.6% 3,377 9.7% HH Income $15,000 to $24,999 1,177 11.2% 5,489 11.8% 14,700 11.5% 4,182 12.0% HH Income $10,000 to $14,999 478 4.6% 2,470 5.3% 6,207 4.9% 1,867 5.4% HH Income Under $10,000 988 9.4% 6,429 13.9% 15,279 12.0% 4,585 13.2%
Household Vehicles (2020) Households 0 Vehicles Available 1,351 12.9% 8,152 17.6% 17,508 13.7% 5,757 16.6% Households 1 Vehicle Available 4,709 45.0% 20,438 44.0% 54,038 42.4% 15,343 44.1% Households 2 Vehicles Available 3,526 33.7% 13,115 28.3% 39,665 31.1% 10,174 29.3% Households 3 or More Vehicles Available 881 8.4% 4,705 10.1% 16,329 12.8% 3,498 10.1% Total Vehicles Available 14,737 62,434 189,302 47,491 Average Vehicles per Household 1.4 1.3 1.5 1.4 Owner-Occupied Household Vehicles 7,267 49.3% 30,046 48.1% 98,182 51.9% 23,316 49.1% Average Vehicles per Owner-Occupied Household 1.6 1.8 1.9 1.7 Renter-Occupied Household Vehicles 7,470 50.7% 32,388 51.9% 91,120 48.1% 24,175 50.9% Average Vehicles per Renter-Occupied Household 1.2 1.1 1.2 1.1
Travel Time (2020) Worker Base Age 16 years or Over 12,917 57,087 166,879 42,227 Travel to Work in 14 Minutes or Less 3,839 29.7% 14,812 25.9% 43,735 26.2% 10,670 25.3% Travel to Work in 15 to 29 Minutes 5,770 44.7% 23,272 40.8% 71,599 42.9% 17,863 42.3% Travel to Work in 30 to 59 Minutes 2,230 17.3% 8,415 14.7% 25,537 15.3% 6,619 15.7% Travel to Work in 60 Minutes or More 524 4.1% 2,175 3.8% 5,765 3.5% 1,543 3.7% Work at Home 454 3.5% 2,620 4.6% 7,020 4.2% 1,808 4.3%
Average Minutes Travel to Work 18.9 18.6 18.9 18.9
©2020, Sites USA, Chandler, Arizona, 480-491-1112 page 6 of 9 Demographic Source: Applied Geographic Solutions 4/2020, TIGER Geography

COMPLETE PROFILE
This
rep
ort w
as p
rodu
ced
usin
g da
ta fr
om p
rivat
e an
d go
vern
men
t sou
rces
dee
med
to b
e re
liabl
e. T
he in
form
atio
n he
rein
is p
rovi
ded
with
out r
epre
sent
atio
n or
war
rant
y.
2000-2010 Census, 2020 Estimates with 2025 ProjectionsCalculated using Weighted Block Centroid from Block Groups
Sheeran Semon Team
Lat/Lon: 39.9358/-82.984RFULL9
1351 Parsons Ave1 mi radius 3 mi radius 5 mi radius 10 min drivetime
Columbus, OH 43206
Transportation To Work (2020) Worker Base Age 16 years or Over 12,917 57,087 166,879 42,227 Drive to Work Alone 10,035 77.7% 43,483 76.2% 127,721 76.5% 32,292 76.5% Drive to Work in Carpool 1,212 9.4% 5,318 9.3% 15,386 9.2% 3,930 9.3% Travel to Work by Public Transportation 591 4.6% 2,335 4.1% 6,236 3.7% 1,779 4.2% Drive to Work on Motorcycle 2 - 19 - 90 - 17 - Bicycle to Work 100 0.8% 300 0.5% 1,064 0.6% 253 0.6% Walk to Work 442 3.4% 2,422 4.2% 7,916 4.7% 1,714 4.1% Other Means 79 0.6% 590 1.0% 1,447 0.9% 433 1.0% Work at Home 454 3.5% 2,620 4.6% 7,020 4.2% 1,808 4.3%
Daytime Demographics (2020) Total Businesses 622 8,463 16,901 6,495 Total Employees 6,477 154,010 294,596 93,854 Company Headquarter Businesses 3 0.5% 159 1.9% 205 1.2% 113 1.7% Company Headquarter Employees 359 5.5% 41,094 26.7% 73,182 24.8% 26,827 28.6% Employee Population per Business 10.4 to 1 18.2 to 1 17.4 to 1 14.4 to 1 Residential Population per Business 38.9 to 1 12.6 to 1 18.5 to 1 12.2 to 1 Adj. Daytime Demographics Age 16 Years or Over 12,736 189,229 394,298 118,903
Labor Force Labor Population Age 16 Years or Over (2020) 19,138 86,288 252,829 63,448 Labor Force Total Males (2020) 9,485 49.6% 42,736 49.5% 124,902 49.4% 31,656 49.9% Male Civilian Employed 6,412 67.6% 25,770 60.3% 78,044 62.5% 19,510 61.6% Male Civilian Unemployed 391 4.1% 1,660 3.9% 3,985 3.2% 1,301 4.1% Males in Armed Forces - - 10 - 16 - - - Males Not in Labor Force 2,681 28.3% 15,297 35.8% 42,856 34.3% 10,845 34.3% Labor Force Total Females (2020) 9,653 50.4% 43,552 50.5% 127,927 50.6% 31,792 50.1% Female Civilian Employed 6,466 67.0% 25,289 58.1% 75,030 58.7% 18,888 59.4% Female Civilian Unemployed 365 3.8% 1,702 3.9% 3,775 3.0% 1,159 3.6% Females in Armed Forces - - - - 38 - - - Females Not in Labor Force 2,822 29.2% 16,560 38.0% 49,084 38.4% 11,745 36.9% Unemployment Rate 756 3.9% 3,362 3.9% 7,760 3.1% 2,460 3.9%
Occupation (2020) Occupation Population Age 16 Years or Over 12,879 51,059 153,074 38,398 Occupation Total Males 6,412 49.8% 25,770 50.5% 78,044 51.0% 19,510 50.8% Occupation Total Females 6,466 50.2% 25,289 49.5% 75,030 49.0% 18,888 49.2% Management, Business, Financial Operations 2,258 17.5% 8,725 17.1% 24,556 16.0% 6,317 16.5% Professional, Related 3,306 25.7% 12,007 23.5% 35,294 23.1% 8,690 22.6% Service 2,451 19.0% 9,243 18.1% 28,597 18.7% 7,013 18.3% Sales, Office 2,268 17.6% 10,478 20.5% 33,105 21.6% 7,729 20.1% Farming, Fishing, Forestry 70 0.5% 91 0.2% 244 0.2% 79 0.2% Construction, Extraction, Maintenance 617 4.8% 2,361 4.6% 7,274 4.8% 2,026 5.3% Production, Transport, Material Moving 1,909 14.8% 8,154 16.0% 24,004 15.7% 6,544 17.0%
White Collar Workers 7,832 60.8% 31,210 61.1% 92,955 60.7% 22,736 59.2% Blue Collar Workers 5,047 39.2% 19,849 38.9% 60,119 39.3% 15,663 40.8%
©2020, Sites USA, Chandler, Arizona, 480-491-1112 page 7 of 9 Demographic Source: Applied Geographic Solutions 4/2020, TIGER Geography

COMPLETE PROFILE
This
rep
ort w
as p
rodu
ced
usin
g da
ta fr
om p
rivat
e an
d go
vern
men
t sou
rces
dee
med
to b
e re
liabl
e. T
he in
form
atio
n he
rein
is p
rovi
ded
with
out r
epre
sent
atio
n or
war
rant
y.
2000-2010 Census, 2020 Estimates with 2025 ProjectionsCalculated using Weighted Block Centroid from Block Groups
Sheeran Semon Team
Lat/Lon: 39.9358/-82.984RFULL9
1351 Parsons Ave1 mi radius 3 mi radius 5 mi radius 10 min drivetime
Columbus, OH 43206
Units In Structure (2020) Total Units 9,196 37,762 107,969 28,721 1 Detached Unit 5,681 61.8% 20,749 54.9% 62,122 57.5% 16,591 57.8% 1 Attached Unit 1,169 12.7% 3,873 10.3% 10,071 9.3% 2,983 10.4% 2 Units 731 7.9% 2,311 6.1% 5,831 5.4% 1,693 5.9% 3 to 4 Units 712 7.7% 3,739 9.9% 11,298 10.5% 2,559 8.9% 5 to 9 Units 813 8.8% 4,612 12.2% 12,692 11.8% 3,312 11.5% 10 to 19 Units 604 6.6% 3,443 9.1% 8,907 8.2% 2,420 8.4% 20 to 49 Units 280 3.0% 2,324 6.2% 5,622 5.2% 1,629 5.7% 50 or More Units 417 4.5% 4,952 13.1% 9,454 8.8% 3,197 11.1% Mobile Home or Trailer 60 0.7% 409 1.1% 1,534 1.4% 388 1.3% Other Structure - - - - 8 - - -
Homes Built By Year (2020) Homes Built 2014 or later 256 2.2% 1,812 3.5% 4,202 3.1% 1,388 3.6% Homes Built 2010 to 2013 147 1.3% 1,295 2.5% 3,813 2.8% 783 2.0% Homes Built 2000 to 2009 414 3.6% 2,785 5.4% 8,552 6.2% 1,969 5.0% Homes Built 1990 to 1999 328 2.9% 2,876 5.6% 10,658 7.8% 1,696 4.3% Homes Built 1980 to 1989 343 3.0% 2,292 4.4% 7,987 5.8% 1,394 3.6% Homes Built 1970 to 1979 490 4.3% 3,640 7.1% 13,543 9.9% 2,518 6.4% Homes Built 1960 to 1969 815 7.1% 5,758 11.2% 16,815 12.2% 4,461 11.4% Homes Built 1950 to 1959 1,198 10.4% 6,513 12.6% 19,605 14.3% 5,055 12.9% Homes Built 1940 to 1949 974 8.5% 3,567 6.9% 10,685 7.8% 2,766 7.1% Homes Built Before 1939 5,502 47.8% 15,874 30.8% 31,680 23.1% 12,740 32.6%
Median Age of Homes 64.2 yrs 55.6 yrs 51.7 yrs 57.1 yrs
Home Values (2020) Owner Specified Housing Units 4,011 15,225 47,664 12,027 Home Values $1,000,000 or More 35 0.9% 140 0.9% 425 0.9% 112 0.9% Home Values $750,000 to $999,999 31 0.8% 262 1.7% 764 1.6% 129 1.1% Home Values $500,000 to $749,999 180 4.5% 868 5.7% 2,696 5.7% 661 5.5% Home Values $400,000 to $499,999 271 6.8% 835 5.5% 2,470 5.2% 670 5.6% Home Values $300,000 to $399,999 594 14.8% 1,582 10.4% 5,059 10.6% 1,238 10.3% Home Values $250,000 to $299,999 515 12.8% 1,528 10.0% 4,093 8.6% 1,092 9.1% Home Values $200,000 to $249,999 425 10.6% 1,734 11.4% 4,655 9.8% 1,162 9.7% Home Values $175,000 to $199,999 286 7.1% 1,031 6.8% 2,909 6.1% 764 6.3% Home Values $150,000 to $174,999 372 9.3% 1,114 7.3% 3,742 7.9% 853 7.1% Home Values $125,000 to $149,999 356 8.9% 1,187 7.8% 4,537 9.5% 949 7.9% Home Values $100,000 to $124,999 247 6.2% 1,105 7.3% 4,798 10.1% 919 7.6% Home Values $90,000 to $99,999 126 3.1% 571 3.7% 1,877 3.9% 489 4.1% Home Values $80,000 to $89,999 188 4.7% 1,108 7.3% 3,499 7.3% 955 7.9% Home Values $70,000 to $79,999 165 4.1% 731 4.8% 2,312 4.9% 658 5.5% Home Values $60,000 to $69,999 191 4.8% 818 5.4% 2,246 4.7% 683 5.7% Home Values $50,000 to $59,999 108 2.7% 556 3.6% 1,370 2.9% 469 3.9% Home Values $35,000 to $49,999 149 3.7% 855 5.6% 2,407 5.1% 675 5.6% Home Values $25,000 to $34,999 99 2.5% 479 3.1% 1,374 2.9% 381 3.2% Home Values $10,000 to $24,999 102 2.6% 518 3.4% 1,122 2.4% 488 4.1% Home Values Under $10,000 28 0.7% 121 0.8% 473 1.0% 99 0.8% Owner-Occupied Median Home Value $195,851 $170,858 $172,796 $159,624 Renter-Occupied Median Rent $774 $736 $770 $723
©2020, Sites USA, Chandler, Arizona, 480-491-1112 page 8 of 9 Demographic Source: Applied Geographic Solutions 4/2020, TIGER Geography

COMPLETE PROFILE
This
rep
ort w
as p
rodu
ced
usin
g da
ta fr
om p
rivat
e an
d go
vern
men
t sou
rces
dee
med
to b
e re
liabl
e. T
he in
form
atio
n he
rein
is p
rovi
ded
with
out r
epre
sent
atio
n or
war
rant
y.
2000-2010 Census, 2020 Estimates with 2025 ProjectionsCalculated using Weighted Block Centroid from Block Groups
Sheeran Semon Team
Lat/Lon: 39.9358/-82.984RFULL9
1351 Parsons Ave1 mi radius 3 mi radius 5 mi radius 10 min drivetime
Columbus, OH 43206
Total Annual Consumer Expenditure (2020) Total Household Expenditure $568.81 M $2.3 B $6.48 B $1.73 B Total Non-Retail Expenditure $301.13 M $1.22 B $3.43 B $917.21 M Total Retail Expenditure $267.68 M $1.08 B $3.04 B $809.72 M
Apparel $20.02 M $80.59 M $227.4 M $60.54 M Contributions $18.08 M $72.25 M $203.98 M $54.23 M Education $16.73 M $67.36 M $189.11 M $50.41 M Entertainment $31.72 M $126.6 M $358.32 M $95.13 M Food and Beverages $84.34 M $341.92 M $963.01 M $256.98 M Furnishings and Equipment $19.74 M $78.74 M $222.79 M $59.16 M Gifts $13.76 M $55.08 M $155.1 M $41.26 M Health Care $47.94 M $194.23 M $547.89 M $146.09 M Household Operations $22.11 M $88.92 M $250.92 M $66.81 M Miscellaneous Expenses $10.73 M $43.43 M $122.06 M $32.61 M Personal Care $7.64 M $30.82 M $86.78 M $23.15 M Personal Insurance $3.83 M $15.05 M $42.9 M $11.3 M Reading $1.23 M $4.97 M $13.99 M $3.74 M Shelter $121.62 M $496.33 M $1.39 B $372.75 M Tobacco $3.65 M $15.43 M $42.88 M $11.61 M Transportation $103.11 M $412.1 M $1.17 B $309.96 M Utilities $42.56 M $174.39 M $490.4 M $131.21 M
Monthly Household Consumer Expenditure (2020) Total Household Expenditure $4,528 $4,127 $4,232 $4,139 Total Non-Retail Expenditure $2,397 52.9% $2,193 53.1% $2,243 53.0% $2,198 53.1% Total Retail Expenditures $2,131 47.1% $1,934 46.9% $1,989 47.0% $1,941 46.9%
Apparel $159 3.5% $145 3.5% $149 3.5% $145 3.5% Contributions $144 3.2% $130 3.1% $133 3.1% $130 3.1% Education $133 2.9% $121 2.9% $124 2.9% $121 2.9% Entertainment $252 5.6% $227 5.5% $234 5.5% $228 5.5% Food and Beverages $671 14.8% $614 14.9% $629 14.9% $616 14.9% Furnishings and Equipment $157 3.5% $141 3.4% $146 3.4% $142 3.4% Gifts $110 2.4% $99 2.4% $101 2.4% $99 2.4% Health Care $382 8.4% $349 8.5% $358 8.5% $350 8.5% Household Operations $176 3.9% $160 3.9% $164 3.9% $160 3.9% Miscellaneous Expenses $85 1.9% $78 1.9% $80 1.9% $78 1.9% Personal Care $61 1.3% $55 1.3% $57 1.3% $55 1.3% Personal Insurance $30 0.7% $27 0.7% $28 0.7% $27 0.7% Reading $10 0.2% $9 0.2% $9 0.2% $9 0.2% Shelter $968 21.4% $891 21.6% $908 21.5% $893 21.6% Tobacco $29 0.6% $28 0.7% $28 0.7% $28 0.7% Transportation $821 18.1% $740 17.9% $764 18.0% $743 17.9% Utilities $339 7.5% $313 7.6% $320 7.6% $314 7.6%
©2020, Sites USA, Chandler, Arizona, 480-491-1112 page 9 of 9 Demographic Source: Applied Geographic Solutions 4/2020, TIGER Geography