9781107005198pre pi-xiv - iiasa · efficiency of the energy system from ... future competition will...
TRANSCRIPT

1131
Energy Supply Systems
Convening Lead Authors (CLA) Robert N. Schock (World Energy Council, UK and Center for Global Security Research, USA) Ralph Sims (Massey University, New Zealand)
Lead Authors (LA) Stan Bull (National Renewable Energy Laboratory, USA) Hans Larsen (Technical University of Denmark) Vladimir Likhachev (Russian Academy of Sciences) Koji Nagano (Central Research Institute of Electric Power Industry, Japan) Hans Nilsson (FourFact, Sweden) Seppo Vuori (VTT Technical Research Centre of Finland) Kurt Yeager (Electric Power Research Institute and Galvin Electricity Initiative, USA) Li Zhou (Tsinghua University, China)
Contributing Author (CA) Xiliang Zhang (Tsinghua University, China)
Review Editor John Weyant (Stanford University, USA)
15

Energy Supply Systems Chapter 15
1132
Contents
Executive Summary . . . . . . . . . . . . . . . . . . . . . . . . . . . . . . . . . . . . . . . . . . . . . . . . . . . . . . . . . . . . . . . . . . . . . . . . . . . . . . . . . . . . . . . . . . . . . . . . . . . . . . . . . . . . . . . . . . . . . . . . . . . . . . . . . . . . . . . . . . . . . . . . . . . . . . . . . . . 1135
15.1 Overview . . . . . . . . . . . . . . . . . . . . . . . . . . . . . . . . . . . . . . . . . . . . . . . . . . . . . . . . . . . . . . . . . . . . . . . . . . . . . . . . . . . . . . . . . . . . . . . . . . . . . . . . . . . . . . . . . . . . . . . . . . . . . . . . . . . . . . . . . . . . . . . . . . . . . . . . . . . . . 1136
15.2 Background . . . . . . . . . . . . . . . . . . . . . . . . . . . . . . . . . . . . . . . . . . . . . . . . . . . . . . . . . . . . . . . . . . . . . . . . . . . . . . . . . . . . . . . . . . . . . . . . . . . . . . . . . . . . . . . . . . . . . . . . . . . . . . . . . . . . . . . . . . . . . . . . . . . . . . . . 1137
15.3 Sources . . . . . . . . . . . . . . . . . . . . . . . . . . . . . . . . . . . . . . . . . . . . . . . . . . . . . . . . . . . . . . . . . . . . . . . . . . . . . . . . . . . . . . . . . . . . . . . . . . . . . . . . . . . . . . . . . . . . . . . . . . . . . . . . . . . . . . . . . . . . . . . . . . . . . . . . . . . . . . . . 1139
15.3.1 Overview . . . . . . . . . . . . . . . . . . . . . . . . . . . . . . . . . . . . . . . . . . . . . . . . . . . . . . . . . . . . . . . . . . . . . . . . . . . . . . . . . . . . . . . . . . . . . . . . . . . . . . . . . . . . . . . . . . . . . . . . . . . . . . . . . . . . . . . . . . . . . . . . . . . . . . . . . . . . . . . . 1139
15.3.2 Oil and Gas . . . . . . . . . . . . . . . . . . . . . . . . . . . . . . . . . . . . . . . . . . . . . . . . . . . . . . . . . . . . . . . . . . . . . . . . . . . . . . . . . . . . . . . . . . . . . . . . . . . . . . . . . . . . . . . . . . . . . . . . . . . . . . . . . . . . . . . . . . . . . . . . . . . . . . . . . . . . . 1139
15.3.3 Coal and Peat . . . . . . . . . . . . . . . . . . . . . . . . . . . . . . . . . . . . . . . . . . . . . . . . . . . . . . . . . . . . . . . . . . . . . . . . . . . . . . . . . . . . . . . . . . . . . . . . . . . . . . . . . . . . . . . . . . . . . . . . . . . . . . . . . . . . . . . . . . . . . . . . . . . . . . . . . 1139
15.3.4 Renewable Energy . . . . . . . . . . . . . . . . . . . . . . . . . . . . . . . . . . . . . . . . . . . . . . . . . . . . . . . . . . . . . . . . . . . . . . . . . . . . . . . . . . . . . . . . . . . . . . . . . . . . . . . . . . . . . . . . . . . . . . . . . . . . . . . . . . . . . . . . . . . . . . . . . . 1139
15.3.5 Nuclear Power . . . . . . . . . . . . . . . . . . . . . . . . . . . . . . . . . . . . . . . . . . . . . . . . . . . . . . . . . . . . . . . . . . . . . . . . . . . . . . . . . . . . . . . . . . . . . . . . . . . . . . . . . . . . . . . . . . . . . . . . . . . . . . . . . . . . . . . . . . . . . . . . . . . . . . . . 1140
15.4 Solid Fuel Applications (including Coal, Biomass, Uranium, and Thorium) . . . . . . . . . . . . . . . . . . . . . . . . . . . . . . . . . . . . . 1140
15.4.1 Overview . . . . . . . . . . . . . . . . . . . . . . . . . . . . . . . . . . . . . . . . . . . . . . . . . . . . . . . . . . . . . . . . . . . . . . . . . . . . . . . . . . . . . . . . . . . . . . . . . . . . . . . . . . . . . . . . . . . . . . . . . . . . . . . . . . . . . . . . . . . . . . . . . . . . . . . . . . . . . . . . 1140
15.4.2 Conversion . . . . . . . . . . . . . . . . . . . . . . . . . . . . . . . . . . . . . . . . . . . . . . . . . . . . . . . . . . . . . . . . . . . . . . . . . . . . . . . . . . . . . . . . . . . . . . . . . . . . . . . . . . . . . . . . . . . . . . . . . . . . . . . . . . . . . . . . . . . . . . . . . . . . . . . . . . . . . 1142
15.4.3 Transmission and Distribution . . . . . . . . . . . . . . . . . . . . . . . . . . . . . . . . . . . . . . . . . . . . . . . . . . . . . . . . . . . . . . . . . . . . . . . . . . . . . . . . . . . . . . . . . . . . . . . . . . . . . . . . . . . . . . . . . . . . . . . . . . . . . . . . . 1143
15.4.4 Storage . . . . . . . . . . . . . . . . . . . . . . . . . . . . . . . . . . . . . . . . . . . . . . . . . . . . . . . . . . . . . . . . . . . . . . . . . . . . . . . . . . . . . . . . . . . . . . . . . . . . . . . . . . . . . . . . . . . . . . . . . . . . . . . . . . . . . . . . . . . . . . . . . . . . . . . . . . . . . . . . . . 1143
15.4.5 Policy and Investment Considerations . . . . . . . . . . . . . . . . . . . . . . . . . . . . . . . . . . . . . . . . . . . . . . . . . . . . . . . . . . . . . . . . . . . . . . . . . . . . . . . . . . . . . . . . . . . . . . . . . . . . . . . . . . . . . . . . . . . . . 1143
15.5 Liquid Fuel Applications (including Petroleum and Biofuels) . . . . . . . . . . . . . . . . . . . . . . . . . . . . . . . . . . . . . . . . . . . . . . . . . . . . . . . . . . . . . 1145
15.5.1 Overview . . . . . . . . . . . . . . . . . . . . . . . . . . . . . . . . . . . . . . . . . . . . . . . . . . . . . . . . . . . . . . . . . . . . . . . . . . . . . . . . . . . . . . . . . . . . . . . . . . . . . . . . . . . . . . . . . . . . . . . . . . . . . . . . . . . . . . . . . . . . . . . . . . . . . . . . . . . . . . . . 1145
15.5.2 Conversion . . . . . . . . . . . . . . . . . . . . . . . . . . . . . . . . . . . . . . . . . . . . . . . . . . . . . . . . . . . . . . . . . . . . . . . . . . . . . . . . . . . . . . . . . . . . . . . . . . . . . . . . . . . . . . . . . . . . . . . . . . . . . . . . . . . . . . . . . . . . . . . . . . . . . . . . . . . . . 1146
15.5.3 Transmission and Distribution . . . . . . . . . . . . . . . . . . . . . . . . . . . . . . . . . . . . . . . . . . . . . . . . . . . . . . . . . . . . . . . . . . . . . . . . . . . . . . . . . . . . . . . . . . . . . . . . . . . . . . . . . . . . . . . . . . . . . . . . . . . . . . . . . 1146
15.5.4 Storage . . . . . . . . . . . . . . . . . . . . . . . . . . . . . . . . . . . . . . . . . . . . . . . . . . . . . . . . . . . . . . . . . . . . . . . . . . . . . . . . . . . . . . . . . . . . . . . . . . . . . . . . . . . . . . . . . . . . . . . . . . . . . . . . . . . . . . . . . . . . . . . . . . . . . . . . . . . . . . . . . . 1146
Chapter 15 Energy Supply Systems
1133
15.6 Gaseous Fuel Applications (Including Natural Gas and Biogas) . . . . . . . . . . . . . . . . . . . . . . . . . . . . . . . . . . . . . . . . . . . . . . . . . . . . . . . . 1147
15.6.1 Overview . . . . . . . . . . . . . . . . . . . . . . . . . . . . . . . . . . . . . . . . . . . . . . . . . . . . . . . . . . . . . . . . . . . . . . . . . . . . . . . . . . . . . . . . . . . . . . . . . . . . . . . . . . . . . . . . . . . . . . . . . . . . . . . . . . . . . . . . . . . . . . . . . . . . . . . . . . . . . . . . 1147
15.6.2 Conversion . . . . . . . . . . . . . . . . . . . . . . . . . . . . . . . . . . . . . . . . . . . . . . . . . . . . . . . . . . . . . . . . . . . . . . . . . . . . . . . . . . . . . . . . . . . . . . . . . . . . . . . . . . . . . . . . . . . . . . . . . . . . . . . . . . . . . . . . . . . . . . . . . . . . . . . . . . . . . 1148
15.6.3 Transmission and Distribution . . . . . . . . . . . . . . . . . . . . . . . . . . . . . . . . . . . . . . . . . . . . . . . . . . . . . . . . . . . . . . . . . . . . . . . . . . . . . . . . . . . . . . . . . . . . . . . . . . . . . . . . . . . . . . . . . . . . . . . . . . . . . . . . . 1148
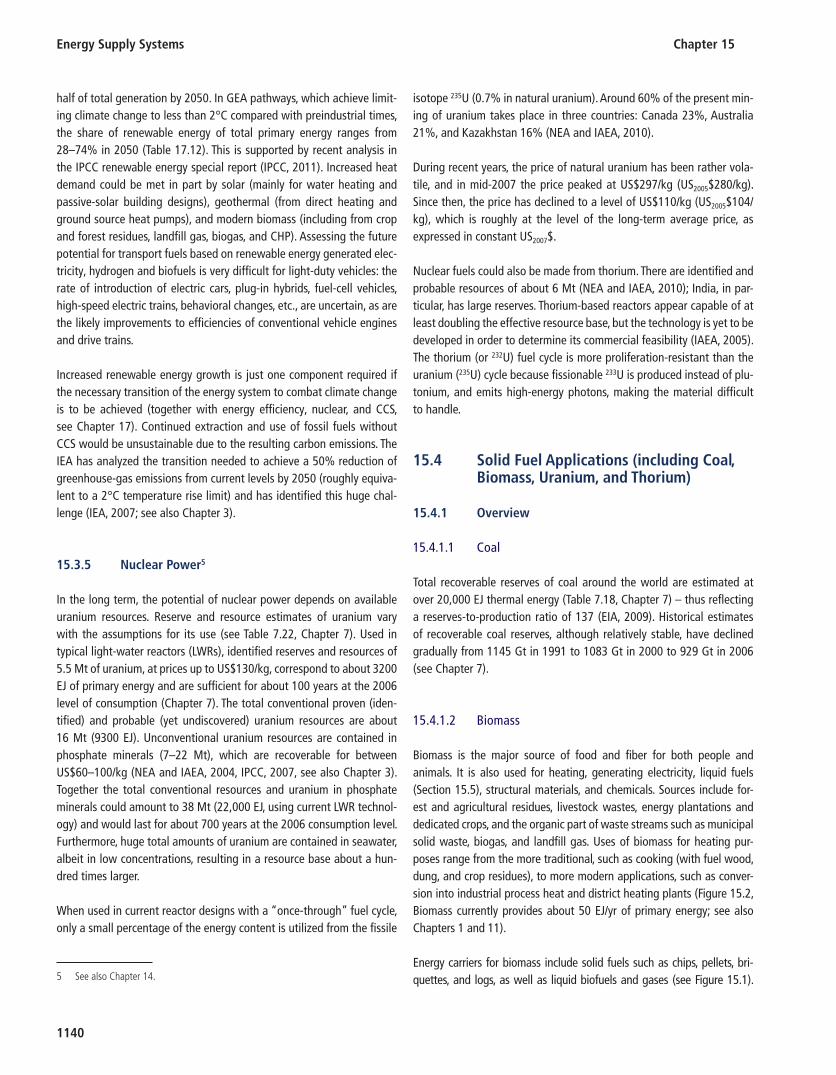
15.6.4 Storage . . . . . . . . . . . . . . . . . . . . . . . . . . . . . . . . . . . . . . . . . . . . . . . . . . . . . . . . . . . . . . . . . . . . . . . . . . . . . . . . . . . . . . . . . . . . . . . . . . . . . . . . . . . . . . . . . . . . . . . . . . . . . . . . . . . . . . . . . . . . . . . . . . . . . . . . . . . . . . . . . . 1151
15.6.5 Policy and Investment Considerations . . . . . . . . . . . . . . . . . . . . . . . . . . . . . . . . . . . . . . . . . . . . . . . . . . . . . . . . . . . . . . . . . . . . . . . . . . . . . . . . . . . . . . . . . . . . . . . . . . . . . . . . . . . . . . . . . . . . . 1152
15.7 Heating and Cooling . . . . . . . . . . . . . . . . . . . . . . . . . . . . . . . . . . . . . . . . . . . . . . . . . . . . . . . . . . . . . . . . . . . . . . . . . . . . . . . . . . . . . . . . . . . . . . . . . . . . . . . . . . . . . . . . . . . . . . . . . . . . . . . . . . . . . . . 1153
15.8 Electricity . . . . . . . . . . . . . . . . . . . . . . . . . . . . . . . . . . . . . . . . . . . . . . . . . . . . . . . . . . . . . . . . . . . . . . . . . . . . . . . . . . . . . . . . . . . . . . . . . . . . . . . . . . . . . . . . . . . . . . . . . . . . . . . . . . . . . . . . . . . . . . . . . . . . . . . . . . . . 1154
15.8.1 Overview . . . . . . . . . . . . . . . . . . . . . . . . . . . . . . . . . . . . . . . . . . . . . . . . . . . . . . . . . . . . . . . . . . . . . . . . . . . . . . . . . . . . . . . . . . . . . . . . . . . . . . . . . . . . . . . . . . . . . . . . . . . . . . . . . . . . . . . . . . . . . . . . . . . . . . . . . . . . . . . . 1154
15.8.2 Conversion . . . . . . . . . . . . . . . . . . . . . . . . . . . . . . . . . . . . . . . . . . . . . . . . . . . . . . . . . . . . . . . . . . . . . . . . . . . . . . . . . . . . . . . . . . . . . . . . . . . . . . . . . . . . . . . . . . . . . . . . . . . . . . . . . . . . . . . . . . . . . . . . . . . . . . . . . . . . . 1155
15.8.3 Transmission and Distribution . . . . . . . . . . . . . . . . . . . . . . . . . . . . . . . . . . . . . . . . . . . . . . . . . . . . . . . . . . . . . . . . . . . . . . . . . . . . . . . . . . . . . . . . . . . . . . . . . . . . . . . . . . . . . . . . . . . . . . . . . . . . . . . . . 1156
15.8.4 Storage . . . . . . . . . . . . . . . . . . . . . . . . . . . . . . . . . . . . . . . . . . . . . . . . . . . . . . . . . . . . . . . . . . . . . . . . . . . . . . . . . . . . . . . . . . . . . . . . . . . . . . . . . . . . . . . . . . . . . . . . . . . . . . . . . . . . . . . . . . . . . . . . . . . . . . . . . . . . . . . . . . 1162
15.8.5 Policy and Investment Considerations . . . . . . . . . . . . . . . . . . . . . . . . . . . . . . . . . . . . . . . . . . . . . . . . . . . . . . . . . . . . . . . . . . . . . . . . . . . . . . . . . . . . . . . . . . . . . . . . . . . . . . . . . . . . . . . . . . . . . 1162
15.9 Hydrogen . . . . . . . . . . . . . . . . . . . . . . . . . . . . . . . . . . . . . . . . . . . . . . . . . . . . . . . . . . . . . . . . . . . . . . . . . . . . . . . . . . . . . . . . . . . . . . . . . . . . . . . . . . . . . . . . . . . . . . . . . . . . . . . . . . . . . . . . . . . . . . . . . . . . . . . . . . . . 1164
15.9.1 Overview . . . . . . . . . . . . . . . . . . . . . . . . . . . . . . . . . . . . . . . . . . . . . . . . . . . . . . . . . . . . . . . . . . . . . . . . . . . . . . . . . . . . . . . . . . . . . . . . . . . . . . . . . . . . . . . . . . . . . . . . . . . . . . . . . . . . . . . . . . . . . . . . . . . . . . . . . . . . . . . . 1164
15.9.2 Conversion . . . . . . . . . . . . . . . . . . . . . . . . . . . . . . . . . . . . . . . . . . . . . . . . . . . . . . . . . . . . . . . . . . . . . . . . . . . . . . . . . . . . . . . . . . . . . . . . . . . . . . . . . . . . . . . . . . . . . . . . . . . . . . . . . . . . . . . . . . . . . . . . . . . . . . . . . . . . . 1164
15.9.3 Transmission and Distribution . . . . . . . . . . . . . . . . . . . . . . . . . . . . . . . . . . . . . . . . . . . . . . . . . . . . . . . . . . . . . . . . . . . . . . . . . . . . . . . . . . . . . . . . . . . . . . . . . . . . . . . . . . . . . . . . . . . . . . . . . . . . . . . . . 1165
15.9.4 Storage . . . . . . . . . . . . . . . . . . . . . . . . . . . . . . . . . . . . . . . . . . . . . . . . . . . . . . . . . . . . . . . . . . . . . . . . . . . . . . . . . . . . . . . . . . . . . . . . . . . . . . . . . . . . . . . . . . . . . . . . . . . . . . . . . . . . . . . . . . . . . . . . . . . . . . . . . . . . . . . . . . 1165
15.9.5 Policy and Investment Considerations . . . . . . . . . . . . . . . . . . . . . . . . . . . . . . . . . . . . . . . . . . . . . . . . . . . . . . . . . . . . . . . . . . . . . . . . . . . . . . . . . . . . . . . . . . . . . . . . . . . . . . . . . . . . . . . . . . . . . 1166
15.10 Summary and Conclusions . . . . . . . . . . . . . . . . . . . . . . . . . . . . . . . . . . . . . . . . . . . . . . . . . . . . . . . . . . . . . . . . . . . . . . . . . . . . . . . . . . . . . . . . . . . . . . . . . . . . . . . . . . . . . . . . . . . . . . . . . . 1166

Energy Supply Systems Chapter 15
1134
15.11 Insights . . . . . . . . . . . . . . . . . . . . . . . . . . . . . . . . . . . . . . . . . . . . . . . . . . . . . . . . . . . . . . . . . . . . . . . . . . . . . . . . . . . . . . . . . . . . . . . . . . . . . . . . . . . . . . . . . . . . . . . . . . . . . . . . . . . . . . . . . . . . . . . . . . . . . . . . . . . . . 1167
15.11.1 Conclusions . . . . . . . . . . . . . . . . . . . . . . . . . . . . . . . . . . . . . . . . . . . . . . . . . . . . . . . . . . . . . . . . . . . . . . . . . . . . . . . . . . . . . . . . . . . . . . . . . . . . . . . . . . . . . . . . . . . . . . . . . . . . . . . . . . . . . . . . . . . . . . . . . . . . . . . . . . . . 1167
Appendix A Demand Side Management . . . . . . . . . . . . . . . . . . . . . . . . . . . . . . . . . . . . . . . . . . . . . . . . . . . . . . . . . . . . . . . . . . . . . . . . . . . . . . . . . . . . . . . . . . . . . . . . . . . . . . . . . . . . . 1168
15A.1 One System, Different Measures and Different Actors . . . . . . . . . . . . . . . . . . . . . . . . . . . . . . . . . . . . . . . . . . . . . . . . . . . . . . . . . . . . . . . . . . . . . . 1168
15A.2 Energy Effi ciency Supply Curves . . . . . . . . . . . . . . . . . . . . . . . . . . . . . . . . . . . . . . . . . . . . . . . . . . . . . . . . . . . . . . . . . . . . . . . . . . . . . . . . . . . . . . . . . . . . . . . . . . . . . . . . . . . . . . . 1168
15A.3 DSM Formats . . . . . . . . . . . . . . . . . . . . . . . . . . . . . . . . . . . . . . . . . . . . . . . . . . . . . . . . . . . . . . . . . . . . . . . . . . . . . . . . . . . . . . . . . . . . . . . . . . . . . . . . . . . . . . . . . . . . . . . . . . . . . . . . . . . . . . . . . . . . . . . . . . 1169
References . . . . . . . . . . . . . . . . . . . . . . . . . . . . . . . . . . . . . . . . . . . . . . . . . . . . . . . . . . . . . . . . . . . . . . . . . . . . . . . . . . . . . . . . . . . . . . . . . . . . . . . . . . . . . . . . . . . . . . . . . . . . . . . . . . . . . . . . . . . . . . . . . . . . . . . . . . . . . . . . . . . . . . . . . . . 1170

Chapter 15 Energy Supply Systems
1135
Executive Summary
A sustainable future depends on more efficient use of the Earth’s abundant energy resources in order to meet the rapidly increasing demand for energy services as well as to provide broader access to everyone. In 2005 the overall efficiency of the energy system from primary energy to useful energy was only about 34%. Owing to diverse geographic inequities in both sources and people, supply cannot always meet the demand where needed. Energy pathways from source through conversion, transmission, storage, and distribution to end-users are complicated and presently consist of numerous discrete pathways that differ widely for each energy source and carrier. These include solid fuels, liquid fuels, gaseous fuels (including hydrogen), electricity and heat. Aging equipment, congested networks, and extreme demands complicate this picture in many countries of the Organisation for Economic Co-operation and Development (OECD). Development of new infrastructure in both non-OECD and OECD countries will lock-in future dependence on conventional or non-conventional energy sources. This chapter aims to assist decision-makers by providing up-to-date knowledge on the full range of energy pathways, their management, and operation. Energy systems to achieve a sustainable future should be made much more flexible in order to deal with societal needs and the probable deployment of technologies not yet commercially available (such as smart appliances, electric vehicles, fuel cells, and carbon capture and storage). Technology and policy solutions are available for supporting more energy for sustainable development, but in order to meet the transition necessary to avoid unacceptable events such as social unrest and/or climate change driven temperature rise, they should be put in place rapidly, and done in concert with each other.
Major energy supply pathways 1 today include oil, natural gas, and coal fossil fuel sources, nuclear energy, and renewable energy converted to energy carriers mostly as liquids, electricity and/or heat, and then used in households, for transport, and by industry. In future, larger contributions can be expected from purpose-grown energy crops and waste streams, wind, geothermal, small hydro and solar energy, as well as natural gas and, at least in some places, nuclear power. Electricity, and perhaps hydrogen, are expected to play increasing roles in the overall energy system, and perhaps with a trend away from centralized energy systems to decentralized and distributed generation. Increased use of electricity is key to greater energy access and more energy for sustainable development across the world, and to increasing energy efficiency throughout the energy supply-chain. Electricity is distinguished by its capacity to transform a broad array of raw energy resources efficiently and precisely into useful energy services (such as building thermal comfort and street lighting, motor-drives for industrial applications and mobility, heating and cooling), irrespective of scale. Local, state and national governments will continue to place a high priority on supplying heating, cooling, transport and particularly electricity to their citizens.
The goal for the energy system should be to make the transition from analogue to modern digital technologies having optimized interconnected networks using up-to-date information and communications technology and linking energy carrier, transmission and distribution sub-systems. In planning, constructing and operating such an energy system, redundancy, robustness and flexibility are critical. Integrated energy storage is an area where technology lags and needs intense development if systems with optimum overall efficiency gains are to be attained.
In most cases, the private sector will lead in developing and deploying the most effective energy system approaches, but will need to work closely with a stable governance policy framework. Success will depend on rapid creation and implementation of robust global-scale public-private partnerships that will, in turn, depend on unprecedented levels of integration and cooperation between the partners. This must be accompanied by increased investment in, and development of cleaner energy-sector technologies together with their wide deployment and efficient management and operation.
1 Quantities of energy carriers required vary according to the energy end use effi ciency level achieved, see Chapters 8 – 10 and 17 .

Energy Supply Systems Chapter 15
1136
15.1 Overview
Chapter 15 reviews recent literature on the movement and conversion of energy from its source to end-use. The various conversion steps involve “energy carriers 2 ,” which may include a secondary (converted) form of energy, such as electricity, heat, or hydrogen, or a primary energy source itself, such as natural gas, wind, or biomass ( Figure 15.1 ). For all the known sources of energy displayed in the lower left part of the Figure, from crude oil to nuclear, as one moves across the horizontal line, the
intersections denote conversions of the energy source to a form in which energy is moved to a point of use. The size of the dot at the intersection denotes which conversions are currently major uses of sources for an energy carrier. Moving from left to right, the first two lines represent solid fuels (coal, peat or woody biomass); the next two vertical lines represent liquid fuels (gasoline, diesel, jet fuel, biofuels); the following two lines represent gaseous fuels (natural gas, biomethane, propane or hydrogen); and the two lines, farthest to the right, represent electricity and heat forms of energy carriers. Energy end-uses are shown at the top.
Figure 15.1 | Relationships from energy sources through conversion to energy carriers and end-uses, showing intersections where current technologies make large contribu-tions, where the intersection is partially used and/or optional and where underdevelopment and a large future contribution to conversion and distribution is expected.
2 An energy carrier is a substance or phenomenon that has the ability to produce mechanical work or heat, or to operate chemical or physical processes (from ISO 13600).

Chapter 15 Energy Supply Systems
1137
The largest dots indicate the major uses of energy carriers for general-ized areas of end-use, e.g., vehicles, homes, industry.
Primary and secondary energy can be converted to provide energy ser-vices in the forms of heating, cooling, lighting, entertainment, motor engines, and mobility (transport). This Chapter assesses the inter- relationships between energy sources, conversion technologies, and energy carriers (referred to as “secondary energy” in Chapter 1 ), in terms of both their distribution and delivery to end-users today, and as innovative possibilities for the future. It presents potential pathways to a sustainable future. Energy sectors differ between regions, between major economies, and between developing and developed countries. The chapter describes varying approaches toward the transitions neces-sary for the creation of sustainable development, while noting how and why supportive energy policies that work successfully in one region may fail in another.
The focus is on energy carriers and the distribution systems for these carriers, including, but not limited to, electricity, solid fuels, liquid fuels, gaseous fuels, and heat. The chapter examines technologies and their potential development for these conversion and distribution steps. It gives more space to electricity because of the advanced state of elec-tricity production and distribution networks, their ubiquity in modern economies, and the future potential for electricity to power heat pumps and electric vehicles, thereby displacing some current fossil fuel demand in the heat and transport sectors. Other energy carrier and distribution systems can learn a great deal from the electricity supply and distribu-tion network.
Research, development, and demonstration (RD&D) in this area of energy supply and operation is assessed in terms of expenditures, both current and likely future costs, along with an examination of where funds may have to come from and where investments will need to be made (see Chapter 24 for a comprehensive discussion of RD&D). Critical questions include whether future competition will or should be between energy sources alone, between end-uses, between sources and end-uses, between integrated systems, or some combination of these. In this Chapter, current policies are assessed for effectiveness, and then related to more effective action in the future (see also Chapters 7 – 16 as well as Chapter 22 ).
15.2 Background
Throughout history, mankind’s ability to live in harmony with the nat-ural environment and its resources has depended on the availability of energy. Only through broader and more efficient access to the world’s diverse energy resources, made possible by continuous advances in sci-ence and technology, can a sustainable global energy future be achieved. The overall efficiency of the energy supply chain (extraction, conversion, delivery, and use) has reached only about 34% ( Figure 1.5 ). Major oppor-tunities for improving efficiency exist at every link in this chain.
For millennia, human societies have obtained useful energy for heat-ing and cooking by the combustion of “traditional” solid fuels, such as wood, animal dung, whale blubber, and other forms of biomass. In addition, manual labor and animal power depended on chemical stores of energy in the form of food and animal feed. Coal became prominent during the mid-19th century replacing much human and animal power as the northern hemisphere industrialized. The liquid-fuel era began in the late 1800s as the first oil fields were developed. It was not until after the middle of the 20th century that oil began to dominate the global primary energy mix. Natural gas was also consumed to a limited degree over this period, but real growth in demand only occurred in the past two to three decades as gaseous fuels began to replace liquid fuels. This on-going trend from solid to liquid to gaseous fuels continues to be driven by cost and convenience.
Between 1850 and the early 1900s, as human and animal power was replaced, primary global energy demand grew from around 17 EJ/yr (0.4 Gtoe/yr) sourced from traditional biomass and coal, to around 42 EJ/yr, as oil and gas now made up around 25% of the mix. Throughout the 20th century, the world’s population grew, people in developed countries became more mobile, and more countries became industrial-ized. As a result, primary energy demand continued to increase, growing by over 10 times that original figure (see Chapter 1 , Figure 1–3). By 2008, it was about 500 EJ/yr.
There are major differences between nations in energy use when con-sidered on a per capita basis. Residents of the least developed countries, such as Eritrea, Haiti, and Senegal, use around 12 GJ/person each year on average, whereas people living in the wealthiest regions of the world (such as the Middle East and the United States) use 30–40 times more per person. The global average annual energy use is currently around 70 GJ/capita (average rate of 2.3 kW). China is 25% below average, but rising. Overall, each year, the billion wealthiest people on the planet use more than 25 times more primary energy than the poorest two billion who still rely on traditional biomass fuels to provide their very limited energy services.
Energy use per unit of gross domestic product (GDP) is another indi-cator of regional differences, as are greenhouse-gas emissions per unit of GDP. Countries in the Organization for Economic Cooperation and Development (OECD) generally have lower greenhouse gas emission intensities (around 0.5–0.7 kgCO 2 -eq/GDP US$PPP 3 ) than transition and developing countries, which can have intensities up to three times higher due to the higher use of fossil fuels and less efficient energy conversion equipment including boilers, vehicles, and power plants (IPCC, 2007 ).
The critical requirement for transforming energy into refined carriers (electricity or heat) from the locations where it is converted into useful work and services is a system to transfer the energy (so that it is readily available where and when it is needed). Any leakage or loss during the
3 PPP = purchasing power parity.

Energy Supply Systems Chapter 15
1138
transmission and distribution process will result in increased cost and emissions per unit of energy for final use. Electricity, oil and natural gas transmission networks cover hundreds and even thousands of kilom-eters, linking energy conversion centers and energy users. These net-works have been developed to meet the needs of large facilities, such as central electrical generation plants or large manufacturing plants, often located at some remote distance from demand. For electricity systems, transmission and distribution networks account for 54% of the global capital assets (IEA, 2008a ).
Energy systems have four overall requirements: they should meet demand fluctuations, they should adapt to supply fluctuations, they should operate efficiently, and they must abide by regulations. Energy transfer may often, but not always, involve storing the energy in some form that can be utilized at a later time. This infrastructure demands storage, transmission, and distribution elements, all of which are con-nected with an energy carrier. Both energy carriers and storage systems contain energy that can be converted to useful energy for use at another time or in a different physical location.
Storage decouples energy supply and energy demand, thereby giving greater system flexibility, essential for both technical and economic reasons. Energy may be stored in chemical, mechanical, kinetic, electro-magnetic, or thermal forms. Fossil fuels, such as coal and natural gas, already contain stores of energy, whereas electricity, gasoline, ethanol, and hydrogen contain energy derived from some other source. Some forms of energy are easily stored in their existing states: solid fuels require little in the form of containment, whereas liquid fuels require a sealed container. No technology advances are needed, as current meth-ods are sufficient. However, gaseous fuels are not so easily stored for all intended applications, and so new storage technologies should better manage their inherent low density. Devices exist for converting electric-ity into energy forms that can be more easily stored using advances in technology (including pumped hydro, compressed-air, compressed natural gas, batteries, flywheels, super-capacitors, and superconducting magnetic systems). Such storage is useful for enabling more cost-effec-tive and efficient, and therefore expanded, use of electricity, particularly in small autonomous systems and in systems with high penetration lev-els of variable renewable energy (such as wind and solar photovolta-ics). Heat is generally stored simply by heating a thermal mass (e.g., bricks, stones, concrete, and water) to an elevated temperature and then extracting the heat for later use. Technology developments could lead to much better use of heat energy. The status and potential of storage technologies will be described later in this Chapter, along with the cor-responding energy carrier.
The concept of an energy pathway from the energy source to its end-use, with storage, transmission, and distribution in between, sounds simple. However, in actual applications, it may not be this simple three-step bridge, but may comprise storage-transmission-distribution-storage, or some other combination. Moreover, in the latter example, the two stor-age steps may be substantially different. It is therefore essential to take
an overall integrated system approach – or energy pathway – to a life-cycle-based, benefit-cost analysis of energy-supply operations. The other key element that requires robust development is the infrastructure for each of the energy carriers or combinations thereof.
In the case of electricity, it is widely recognized that aging infrastructure needs to be modernized, but that alone is insufficient. A “grid of the future” or “smart grid” could be developed to accommodate energy sources in a more optimal way. In the case of hydrogen, for example, it is not a modification of the infrastructure that is needed, but rather an entirely new infrastructure specifically tailored for a hydrogen carrier and storage system.
Aging equipment, congested networks, and extreme peak-load demands contribute to system losses and low reliability, especially for electricity systems in developing countries that often require substantial upgrades. Existing infrastructure also needs to be modernized to improve security, to add information and controls, and to reduce emissions. Future infra-structure and control systems will become more complex in order to be able to handle higher and more variable loads; to recognize and dis-patch energy at distribution and end-use sites; and to integrate variable and decentralized sources with higher load flows, frequency oscillations, and quality (e.g., electric voltage or gas pressure) without reducing sys-tem performance. In general, energy supply systems need to have more flexibility to accommodate higher penetrations of variable renewable energy. These problems are exacerbated by different degrees of decen-tralization and differing strengths of distribution systems, so that one solution cannot be applicable to all.
Superconducting cables, sensors, and rapid response controls that could help reduce electricity costs and line losses are already available or close to commercial development. System management can also be improved by incorporating devices that will help efficiency, for example, by rapidly routing flows on the grid, and introducing advanced pricing methods (such as time-based pricing, including, but not limited to, time-of-use (TOU) pricing, critical peak pricing, real-time pricing, and peak load reduction credits). The aim is to avoid peaks, as well as to take advan-tage of less expensive, off-peak electricity. Energy security challenges from technical failures, theft, physical threats, and geopolitical actions will become more important. Although co-utilization by various end-uses (e.g., plug-in hybrid vehicles) is introduced in this report, it will be developed in Chapter 16 , with particular discussion of the concept and its related economic, social and environmental consequences.
In planning, constructing, and operating energy systems, we should not simply focus on a cost optimized system, but also include a suffi-cient level of risk preparedness, which may be implemented in terms of redundancy, robustness, or flexibility. These aspects are important because energy is essential for human society, which is now both com-plex and interdependent, with connections between states and regions forged by a highly globalized market economy. A single incident in an energy system can have enormous negative effects, as we have seen in

Chapter 15 Energy Supply Systems
1139
recent years in several large power-transmission network failures. Those blackouts vividly illustrated how deeply dependent the system is on reli-able networks, rather than on traditional one-way routes from suppliers to end-users.
Also, cultural differences, as well as physical differences, mean that local/regional/national energy systems, although they may converge on a common set of best-available technologies, are likely to evolve in dif-ferent ways that are locally suitable and affordable. This means that they may eventually vary considerably from each other, at least within the time horizon of this assessment.
15.3 Sources
15.3.1 Overview
In terms of final consumer energy use (including heat, electricity, direct combustion of oil, coal, gas and biomass, and other renewable energy products), industry uses about 27%, transportation 28%, residential and commercial buildings 36%, and feedstock 9% (see also Chapter 1 ). Electricity generation accounts for over a third of the world’s primary energy demand, with an average conversion efficiency of just over 40% (ranging from up to 90% for large hydro to less than 15% for some older coal-fired power stations).
Of primary energy use, 40% results in useful heat (IEA, 2008a ). Where feasible, using “waste” heat from thermal and geothermal power sta-tions, industrial process heat, district-heating schemes, etc. makes com-bined heat and power (CHP) systems much more efficient. Almost half of all electricity generated is used in buildings (households, commercial services, and the public sector) and about one-third by industry.
15.3.2 Oil and Gas
Known reserves of oil and natural gas (including unconventional sources) will meet global demand for many decades at current rates of use (WEC, 2010 ; Moniz et al., 2010 ). The uses of oil and gas are partly interchangeable (for boiler fuels, light vehicle fuels, power generation), and this compatibility largely explains their correlation in global price fluctuations. The International Energy Agency’s World Energy Outlook 2008 analyzed ultimately recoverable reserves in detail and concluded that remaining proven oil reserves are equal to over 40 years of pro-duction at current rates of consumption, while proven gas reserves are equal to over 60 years (IEA, 2008a ; see also Chapter 7 ).
Besides conventional fossil-fuel reserves, unconventional sources of liquid fuels are available from oil shale, oil sands, coal-to-liquids, gas-to-liquids, heavy oils, and biofuels. Unconventional gaseous fuels include coal-bed methane, shale gas, methane hydrates, and clathrates. These are very large in quantity (see Chapter 7 ) but challenging to extract and
refine, and the environmental impacts are many. Therefore, unconven-tional liquid and gaseous fuels may cost more.
15.3.3 Coal and Peat
From 2003 to 2008, coal was the fastest growing fossil fuel (EIA, 2009 ) in spite of its relatively high greenhouse gas and local air pollution emis-sions. Coal is the world’s most abundant fossil fuel, and continues to be a vital resource in many countries (see Chapters 12 and 13 for detail). In 2009, it accounted for around 29% of total world energy use (about 153 EJ), primarily in the electricity and industrial sectors. Global proven recoverable reserves of coal are at least 20,000 EJ and an estimated additional possible resource of more than 400,000 EJ for all types. Coal resources have also been discovered on the Antarctic continent and in newly explored parts of Australia, but it is difficult to estimate the exact amounts. For details about the distribution of coal resources, see Chapter 7 . In general, the northern hemisphere has more coal than the southern, especially concentrated in temperate and sub-boreal regions. Together, coal resources represent stores of over 12,100 GtC. Consumption in 2009 introduced approximately 14.7 GtCO 2 /yr into the atmosphere.
Peat (partially decayed plant matter together with minerals) has been used as a heating fuel for thousands of years, particularly in northern Europe. In Finland, it still provides 7% of electricity and 19% of district heating (IPCC, 2007 ), but globally it is a small resource.
15.3.4 Renewable Energy 4
Renewable energy, by definition, is essentially time-limitless energy stemming from various energy forms. At present, enough renewable energy flows are captured and converted to provide around 18% of global electricity (mainly from hydroelectric power) and around 4–5% of the global heat market (from solar thermal, geothermal, and mod-ern bioenergy). In addition, traditional biomass for cooking and heating, which is mainly used in rural areas, accounts for around 10% of global primary energy use (IEA, 2008a ). Liquid biofuels provide around 1.5% of the world’s transport fuels. Detailed analyses of the potentials for each renewable energy resource category are given in Chapter 11 (and in IPCC, 2011 ) – but major uncertainties must be acknowledged, particu-larly for biomass and ocean energy.
Most energy scenarios assume rapid growth in renewable energy for the next few decades. For example, the IEA, in its “Blue-MAP” scenario (IEA, 2008a ) suggests that to achieve 450 ppm CO 2 -eq stabilization of atmospheric greenhouse gases, in tandem with nuclear power and ther-mal power generation plus carbon capture and storage (CCS), electricity generation from hydro, wind, solar and geothermal would need to rise to around 35% of global total power generation by 2030 and to almost
4 See also Chapter 11 .
Energy Supply Systems Chapter 15
1140
half of total generation by 2050. In GEA pathways, which achieve limit-ing climate change to less than 2°C compared with preindustrial times, the share of renewable energy of total primary energy ranges from 28–74% in 2050 ( Table 17.12 ). This is supported by recent analysis in the IPCC renewable energy special report (IPCC, 2011 ). Increased heat demand could be met in part by solar (mainly for water heating and passive-solar building designs), geothermal (from direct heating and ground source heat pumps), and modern biomass (including from crop and forest residues, landfill gas, biogas, and CHP). Assessing the future potential for transport fuels based on renewable energy generated elec-tricity, hydrogen and biofuels is very difficult for light-duty vehicles: the rate of introduction of electric cars, plug-in hybrids, fuel-cell vehicles, high-speed electric trains, behavioral changes, etc., are uncertain, as are the likely improvements to efficiencies of conventional vehicle engines and drive trains.
Increased renewable energy growth is just one component required if the necessary transition of the energy system to combat climate change is to be achieved (together with energy efficiency, nuclear, and CCS, see Chapter 17 ). Continued extraction and use of fossil fuels without CCS would be unsustainable due to the resulting carbon emissions. The IEA has analyzed the transition needed to achieve a 50% reduction of greenhouse-gas emissions from current levels by 2050 (roughly equiva-lent to a 2°C temperature rise limit) and has identified this huge chal-lenge (IEA, 2007 ; see also Chapter 3 ).
15.3.5 Nuclear Power 5
In the long term, the potential of nuclear power depends on available uranium resources. Reserve and resource estimates of uranium vary with the assumptions for its use (see Table 7.22 , Chapter 7 ). Used in typical light-water reactors (LWRs), identified reserves and resources of 5.5 Mt of uranium, at prices up to US$130/kg, correspond to about 3200 EJ of primary energy and are sufficient for about 100 years at the 2006 level of consumption ( Chapter 7 ). The total conventional proven (iden-tified) and probable (yet undiscovered) uranium resources are about 16 Mt (9300 EJ). Unconventional uranium resources are contained in phosphate minerals (7–22 Mt), which are recoverable for between US$60–100/kg (NEA and IAEA, 2004 , IPCC, 2007 , see also Chapter 3 ). Together the total conventional resources and uranium in phosphate minerals could amount to 38 Mt (22,000 EJ, using current LWR technol-ogy) and would last for about 700 years at the 2006 consumption level. Furthermore, huge total amounts of uranium are contained in seawater, albeit in low concentrations, resulting in a resource base about a hun-dred times larger.
When used in current reactor designs with a “once-through” fuel cycle, only a small percentage of the energy content is utilized from the fissile
isotope 235 U (0.7% in natural uranium). Around 60% of the present min-ing of uranium takes place in three countries: Canada 23%, Australia 21%, and Kazakhstan 16% (NEA and IAEA, 2010 ).
During recent years, the price of natural uranium has been rather vola-tile, and in mid-2007 the price peaked at US$297/kg (US 2005 $280/kg). Since then, the price has declined to a level of US$110/kg (US 2005 $104/kg), which is roughly at the level of the long-term average price, as expressed in constant US 2007 $.
Nuclear fuels could also be made from thorium. There are identified and probable resources of about 6 Mt (NEA and IAEA, 2010 ); India, in par-ticular, has large reserves. Thorium-based reactors appear capable of at least doubling the effective resource base, but the technology is yet to be developed in order to determine its commercial feasibility (IAEA, 2005 ). The thorium (or 232 U) fuel cycle is more proliferation-resistant than the uranium ( 235 U) cycle because fissionable 233 U is produced instead of plu-tonium, and emits high-energy photons, making the material difficult to handle.
15.4 Solid Fuel Applications (including Coal, Biomass, Uranium, and Thorium)
15.4.1 Overview
15.4.1.1 Coal
Total recoverable reserves of coal around the world are estimated at over 20,000 EJ thermal energy ( Table 7.18 , Chapter 7 ) – thus reflecting a reserves-to-production ratio of 137 (EIA, 2009 ). Historical estimates of recoverable coal reserves, although relatively stable, have declined gradually from 1145 Gt in 1991 to 1083 Gt in 2000 to 929 Gt in 2006 (see Chapter 7 ).
15.4.1.2 Biomass
Biomass is the major source of food and fiber for both people and animals. It is also used for heating, generating electricity, liquid fuels ( Section 15.5 ), structural materials, and chemicals. Sources include for-est and agricultural residues, livestock wastes, energy plantations and dedicated crops, and the organic part of waste streams such as municipal solid waste, biogas, and landfill gas. Uses of biomass for heating pur-poses range from the more traditional, such as cooking (with fuel wood, dung, and crop residues), to more modern applications, such as conver-sion into industrial process heat and district heating plants ( Figure 15.2 , Biomass currently provides about 50 EJ/yr of primary energy; see also Chapters 1 and 11 ).
Energy carriers for biomass include solid fuels such as chips, pellets, bri-quettes, and logs, as well as liquid biofuels and gases (see Figure 15.1 ). 5 See also Chapter 14 .

Chapter 15 Energy Supply Systems
1141
Before conversion, biomass feedstocks usually have a lower specific-energy than fossil fuels, and much lower specific-energy than nuclear fuel. Thus, the cost of accumulation, storage, transport, and handling raises the cost-per-unit of energy. In cases where the material is already accumulated for other reasons, such as residues from wood or sugarcane processing, these costs can be drastically reduced when the bioenergy is used on site.
15.4.1.3 Uranium 6
Nuclear reactors reflect three basic fuel cycles. Conventional thermal reactors operate in a “once-through” mode, where spent fuel is sent dir-ectly to disposal. Thermal reactors can operate in a “closed” fuel cycle, where waste products are separated from unused and recycled fission-able material. Fast reactors use reprocessed fuel in a closed cycle, which dramatically increases the nuclear fuel supply. Each of these nuclear fuel cycles has its advantages and disadvantages in addressing the four core issues related to the use of nuclear energy (cost, safety, waste, and nuclear-weapons proliferation). The development choice depends on the priorities placed on each of these issues, and how soon the deployment decision must be made. Even the most advanced closed-cycle reactor designs could be ready for large-scale commercial deployment by 2030 if the necessary development investment is promptly committed (see also Chapter 24 ).
With fast reactors in a closed fuel cycle, reprocessing of spent fuel and extraction of the un-utilized uranium and plutonium, reserves of nat-ural uranium may be extended to several thousand years at current consumption levels. In the recycle option, fast-neutron spectrum reac-tors utilize depleted uranium, and only plutonium is assumed to be recycled, so that the uranium resource efficiency is increased by a fac-tor of 30 (Pauluis and Van den Durpel, 2001 ). As a result, the estimated availability of the total conventional uranium resources corresponds to about 240,000 EJ of primary energy. If advanced breeder reactors are introduced in the future to efficiently utilize recycled or depleted uran-ium and all actinides, the resource utilization efficiency will be further improved by an additional factor of up to eight (NEA, 2006 ; NEA and IAEA, 2008 ), depending on the detailed design of these reactors.
15.4.1.4 Thorium
Further technical development is underway, predominantly in India (WNN, 2009 ). A government committee in Norway studying the opportunities for using thorium as an energy source concluded that current knowledge of thorium-based electricity generation and related geology is not sufficient to assess the potential value for Norway of a thorium-based system for long-term electricity supply. However, the committee recommended that the thorium option be kept open since it may offer the potential to com-plement the use of uranium, and so strengthen the long-term sustainabil-ity of nuclear energy. It is also worth bearing in mind that the thorium
Global Biomass Consumption45 +10 EJ
Traditional Biomass for Cooking/Heating36 + 9 EJ
Modern Biomass9 + 1 EJ
Electricity 2.4 EJ → 239 TWh
On-site Heat
4 EJ → 3.2 EJ
Biofuels2.6 EJ →
60 Gl Ethanol4 Gl Biodiesel
Conversion Losses3.5 EJ
Buildings1.2 EJ
Industry2 EJ
Includes Combined Heat and Power
Buildings: Useful Heat ~4 EJ
Conversion Losses32 EJ
Figure 15.2 | Breakdown of global biomass consumption by type. Source: IEA, 2008a .
6 See also Chapter 14 .

Energy Supply Systems Chapter 15
1142
cycle leaves only half the amount of long-lived radioactive waste per unit of energy compared with mainstream LWRs (WNN, 2009 ).
15.4.2 Conversion
Coal is unevenly distributed and abundant, and can be converted to liq-uids, gases, heat, and electricity, although more intense use demands viable CCS technologies if greenhouse-gas emissions are to be limited. Bioenergy can be used in similar conversion technologies to those used for coal, as outlined below. Although the conversion efficiencies are lower for bioenergy, atmospheric CO 2 concentrations can be reduced, assuming all the biomass used is regrown. Moreover, the process of biomass pyrolysis can produce bio-char as a co-product – and this can be incorporated in the soil as a long-term carbon sink (Lehmann et al., 2006 ), thereby removing carbon from the atmosphere.
Most coal-fired, electricity-generating plants are a conventional subcrit-ical, pulverized-fuel design, with typical conversion efficiencies of about 35% for the more modern units, although lower for biomass. Supercritical steam plants are in commercial use in many developed countries and are being installed in greater numbers in developing countries such as China. Current supercritical technologies employ steam temperatures of up to 600ºC and pressures of 280 bar, delivering fuel to electricity at cycle efficiencies of about 42%. Conversion efficiencies of almost 50% are possible in the best supercritical plants, but these are more costly. Improved efficiencies have reduced the amount of waste heat and CO 2 that would otherwise have been emitted per unit of electricity gener-ation (see also Chapters 12 and 13 ).
Technologies have changed little since those reported in the IPCC’s 4th Assessment Report (IPCC, 2007 ). Supercritical plants are now built to an international standard. An Australian Commonwealth Scientific and Industrial Research Organization (CSIRO) project is underway to inves-tigate the production of ultra-clean coal that reduces ash below 0.25%, and sulfur to low levels. With combined-cycle direct-fired turbines, it can reduce greenhouse-gas emissions by 24% per kWh, compared with conventional coal-fired power stations. Gasifying coal before conversion to heat reduces the emissions of sulfur, nitrogen oxides, and mercury, resulting in a much cleaner fuel, while reducing the cost of capturing CO 2 emissions from the flue gas. Continued development of conven-tional combustion integrated gasification combined cycle (IGCC) sys-tems is expected to further reduce emissions (IPCC, 2007 ).
Coal-to-liquid (CTL) is well-understood and regaining interest, but will increase greenhouse-gas emissions significantly without CCS. Liquefaction can be performed by direct solvent extraction, and hydro-genation results in liquid production at up to 67% conversion efficiency. Indirect gasification can also produce liquids by employing the Fischer-Tropsch (FT) process, producing synthetic diesel fuel (80%) plus naphtha (20%) at 37–50% thermal efficiency. Lower-quality coals reduce thermal efficiency, whereas co-production with electricity and heat increases it,
thereby reducing costs by around 10% (IPCC, 2007 ; see also Chapters 12 and 13 ).
The Fischer-Tropsch process is performed in three main types of reac-tors: fluidized-bed, slurry-phase bed, and fixed-bed. Many companies are competing to further develop fixed bed and slurry reactors. The conversion efficiency of the fixed bed and the slurry bed is almost the same. The main advantages of slurry-bed reactors are lower operating and reactor construction costs. Fixed-bed reactors are easily scaled up, which means it is easier to realize large capacity. Wax/catalyst separ-ation is easier and costs less than for fluidized- and slurry-bed reac-tors, which also have high capital costs and difficult process controls (Dry, 2002 ).
The first coal-to-methanol technology was commercialized by BASF in 1923. A major improvement was achieved in the 1960s by producing a sulfur-free synthesis gas that enabled the British ICI company to use the more active Cu/ZnO catalyst. This resulted in a significant reduction of the compression and heat exchange duty in the recycle loop. The lower reaction temperature also improved the selectivity by virtually suppressing the co-production of light hydrocarbons. Besides redu-cing the consumption of synthesis gas by a few percent, it also saved 5–10% cooling duty by avoiding the heat released by the side reactions (Lange, 2001 ). Nowadays, there are several kinds of methanol-com-posing technologies, and the technology is very mature. In the mod-ern methanol-synthesizing production technology, the low-pressure methanol synthesis process is more widely used than the high- or mid- pressure processes because of the energy saving. ICI and the German Lurgi Company provide this technology for 70% of production facilities (Lou et al., 2006 ).
Dimethyl ether (DME), a hydrocarbon fuel that can be used to displace liquid petroleum gas (LPG) in vehicles, cooking stoves etc., can be syn-thesized from coal or biomass by methanol dehydration or direct syn-thesis. Methanol dehydration is called the “two-step DME process,” while direct synthesis is the “one-step process.” The two-step process offers some advantages, such as low temperature, high conversion ratio, and high selectivity, but the costs are too high and the process also has serious environmental problems, so it has been gradually phased out.
The one-step DME process uses two kinds of reactors: a gas-phase fixed bed and a slurry-phase bed. The slurry reactor offers a number of advan-tages: for example, although the DME synthesis reaction is highly exo-thermic and makes removing the heat of reaction difficult, in a slurry reactor, the heat of reaction is quickly absorbed by a solvent with a large heat capacity and high heat conductivity, and the temperature within the reaction vessel is easily controlled. In addition, there are fewer restrictions on the shape and strength of the catalyst in the slurry bed than in the fixed bed. Generally, the slurry bed could use coal-based syngas, which has a high DME productivity ratio, high selectivity, low energy use, and industrial scalability, with obvious economic and social benefits (Adachi et al., 2000 ; Lou and Wang, 2006 ).

Chapter 15 Energy Supply Systems
1143
Solid biomass is similar to coal in that it can be readily converted into liquids, gases, heat, or electricity. Many conversion technologies are mature for producing bioenergy carriers, while others are under devel-opment. The use of biomass products such as sugarcane bagasse, bark, or sawdust used for CHP in industrial, residential, and commercial uses is widespread globally and expanding. Co-firing of biomass with exist-ing fossil-fuel conversion technologies, particularly coal, to produce heat or electricity is a rapidly evolving field. Conversion to liquid biofuels has many routes with various conversion efficiencies, typically around 30–40% (Sims et al., 2010 ).
The energy converted from uranium or thorium is essentially all used to generate electricity, but with considerable residual heat (see Chapter 14 ), and thus the energy converted is usually only about 35% using current technology.
15.4.3 Transmission and Distribution
Solid fuels can be costly to transport by road, rail, or ship but less so if the energy density is high. Movement over long distances is usually not cost effective for biomass due to its aforementioned low energy density. It is thus usually utilized near its place of production and harvest (e.g., wood process residues, sugarcane bagasse, cereal straw, energy crops). Wood pellets are an exception as they have a higher energy density (16–18 GJ/t) and about 50 PJ/yr (0.05 EJ) are traded internationally (Zwart, 2010 ).
Coal, with its higher energy density (20–30 GJ/t) saw about 23 EJ of primary (thermal) energy transported between countries in 2006 (EIA, 2011 ), representing about 17% of world coal production. There is active movement of uranium ore and enriched uranium (much to Europe), since more than half is currently mined in Australia, Kazakhstan, and Canada (see Section 15.3.5 ) and of those only Canada now utilizes uranium energy. This is cost-effective owing to the very high energy density of uranium (80 TJ/kg in LWR fuel), one kg being equivalent, on average, to 3000 tonnes of coal.
An innovative technology is being developed to transport coal through a water-filled pipeline over long distances. This “coal log pipeline 7 ,” tech-nology has low water requirements and costs comparable to existing railways. The coal-to-water-mass ratio is three to one (Marrero, 2006 ).
Biomass is normally used locally, but transport for sale elsewhere of com-mercial firewood, wood chips, pellets, and liquid biofuels by truck, train, or boat is commonplace. The energy density is generally too low to pay for long-distance transportation, meaning conversion usually takes place near the source, although millions of tonnes of wood pellets are being shipped annually from the west coast of Canada to Europe. Bioenergy gases can be upgraded and transported in trucks or in natural gas pipelines as blends.
15.4.4 Storage
Storage of energy along any of the paths in Figure 15.1 is optional and may be desirable (but is not shown in the figure). Coal is often transported long distances and stockpiled at various points between the source and the user. Thus, coal piles come in many shapes and sizes, from the huge mul-tiline longitudinal piles frequently found at ports, to ring blending beds at large power plants, to simple conical or irregular piles common at indus-trial plants. Although many of the same issues that apply to most other bulk materials are encountered when storing coal, the risk of spontan-eous combustion makes it a special case. The US National Fire Protection Association (NFPA), in its publications NFPA 850 and 120, identifies the hazards associated with storing and handling of coal and the recommen-dations against these hazards. The NFPA recommends that storage struc-tures be made of non-combustible materials, and designed to minimize the surface area on which dust can settle. This includes the installation of cladding to reach underneath the building’s structural elements. However, because of coal’s propensity to heat spontaneously, ignition sources are almost impossible to eliminate, and any enclosed area where loose dust accumulates is at great risk. Furthermore, even a small conflagration can result in a catastrophic secondary explosion if the small event releases a much larger dust cloud (Geometrica, 2006 ).
If the biomass is seasonally produced, storage is essential if the feedstock is to be supplied to a bioenergy, biogas or biofuel conversion plant all year round. Using a mix of feedstocks in a plant could reduce the storage requirements. Wet feedstocks can be stored as silage but some energy content loss will occur naturally over time, as is also the case for stored dry feedstocks such as straw or woodchips but at a lower rate. Biomass storage can also lead to possible spontaneous combustion, for example bagasse. Liquid biofuels can deteriorate in energy properties over time since they have a biological base, and their cold properties can be prob-lematic for winter and aviation use. Biomass is usually used relatively soon after harvest, but when needed, storage is not an issue for solid or liquid biomass resources. Current trends indicate that investments in tech-nical processes for biomass conversion technologies can pay dividends in reduced costs of utilization (IPCC, 2007 ). Developing a bioenergy plant can be challenging, particularly in gaining resource consent and secur-ing long-term biomass supplies (IEA, 2007 ). Current concerns relating to providing sustainable biomass supplies, with minimal impacts from land-use change, related greenhouse-gas emissions, or water supplies, are being debated by several organizations, including the Global Bioenergy Partnership (GBEP, 2011 ).
15.4.5 Policy and Investment Considerations
15.4.5.1 Raw Materials
As international coal prices spiked in 2008, US coal prices tripled (Nelder, 2008 ). As Asian production and consumption of coal fell, local suppli-ers there suffered. The loss of China’s coal exports indirectly translated 7 Coal is pressed into logs and then fl oated through the pipeline.

Energy Supply Systems Chapter 15
1144
to higher demand for North American coal, driving its price upwards. Reduced output from foreign producers, along with record prices, has meant that more of US coal has been sent to buyers in Europe and in Asia than was the case in 2007.
Biomass resource costs delivered to the processing plant vary with source and location. Processing residues produced and used on site can be around US$1–2/GJ, or even negative, where for the “waste” bio-mass disposal costs have been avoided by using the resource. Collection and transport of residues from forests and crops are around US$4–6/GJ depending on transport distance, whereas biomass produced from dedi-cated energy crops can be double this or higher. Transporting biomass materials between locations can spread diseases, pests, and weeds, so some border controls may be advisable. However, such contamination risks can be avoided if sufficient heat for sterilization is generated when the biomass is processed into pellets, bio-oil, liquid fuels, etc. before it is transported. Policies to support biofuel production and use also need to take account of the fact that significant subsidies already exist for the fossil fuel industries (IEA, 2008a ), and that sustainable land use prac-tices, including carbon emissions from changes in land use, need careful assessment (Fritsche et al., 2010 ).
15.4.5.2 Final Product
Production costs of CTL appear competitive when crude oil is around US$35–45/bbl, assuming a coal price of US$1/GJ. Converting lignite at US$0.50/GJ close to the mine could compete with production costs of about US$30/bbl. The CTL process is less sensitive to feedstock prices than the gas-to-liquid (GTL) process, but the capital costs are much higher. An 80,000 bbl/day CTL installation would cost about US$5 bil-lion and would need at least 2–4 Gt of coal reserves available to be viable (IPCC, 2007 ).
Biomass resources converted to liquids or gases often require gov-ernment subsidies to make them cost-competitive. Exceptions to this are sugarcane-bagasse-ethanol, produced in Brazil, landfill gas from MSW, and biogas from sewage treatment systems using anaerobic digestion.
15.4.5.3 Policy Considerations
There are significant opportunities for technology to improve the efficiency and environmental performance of coal use. The key is to refine rather than burn coal. Coal refining depends on the conversion of coal under reducing conditions into a synthesis gas composed primarily of methane and carbon monoxide (see Section 15.8.2 ). This concentrated synthesis gas is purified of contaminants, and can be used either as a clean fuel for relatively high efficiency combustion turbine/combined-cycle power gen-eration, or as feedstock for synthetic petroleum, diesel, aviation fuel, and chemical production, as well as for hydrogen. These coal refineries would
most efficiently operate as flexible, around-the-clock facilities. Their syn-thesizing gas production would be selectively routed either to electricity generation or liquid fuel/chemical production, as market demands dictate. The necessary technology is well developed and has been demonstrated to be economically competitive under a variety of conditions worldwide.
The future investments needed by the whole coal industry are rather difficult to predict. However, it is possible to estimate them for some application technologies, especially for the main equipment compo-nents. This is also true of heat and power from bioenergy. The general flow of CTL technologies is described in Figure 15.3 (see also extensive discussion in Chapter 12 ).
Static system investment is calculated by adding up all the separate equipment costs. Each budgetary investment is estimated by plant cost indices and an exponential coefficient method. The overnight cost C, of a component having size S, is related to the cost Co, of a single unit of a reference component of similar size.
C C n Co S Soi i i if= = × × ( )∑∑ [ / ] (1)
where n = domestic factors and f = scale factor.
Table 15.1 gives the investment costs for the main equipment used in CTL technologies as one example. Parameters used for estimat-ing overnight capital costs (including installation, balance-of-plant, general facilities, engineering, overhead and contingencies) are in US 2002 $ 8 .
Nuclear power has been a technologically dependable choice for filling the gap between reducing dependence on fossil fuels and the deploy-ment of renewable energy. Recent developments in Japan have caused this belief to be reassessed. About 85% of the world’s nuclear power generation today is by reactors derived from designs originally devel-oped for naval use. Today, so-called “third-generation” reactor designs include greater design standardization, longer (60 years) operating life, reduced core melt potential, and higher fuel burn-up efficiency for less fuel use and waste. However, expansion will depend on resolving to public satisfaction several currently perceived limiting issues, including cost, waste, accident safety and proliferation.
Over the coming decades, two additional issues must be resolved if nuclear power is to fulfill its service capability. These are the quality and availability of waste repository space, and uranium resource avail-ability. “Fourth-generation” nuclear reactor systems are intended to shape this more robust global future for nuclear energy. For example, the Generation IV International Forum, an international govern-ment and industry task force, selected six such advanced systems.
8 To convert US 2002 $ into US 2005 $, multiply US 2002 $ value by 1.085.

Chapter 15 Energy Supply Systems
1145
These are: gas-cooled fast reactors, lead-cooled fast reactors, sodium-cooled fast reactors, molten salt reactors, supercritical water-cooled reactors, and very high-temperature gas reactors. Beyond these nuclear fission systems lies the relatively unlimited, but also unproven, poten-tial of nuclear fusion-based energy. For a more comprehensive discus-sion, see Chapter 14 .
15.5 Liquid Fuel Applications (including Petroleum and Biofuels)
15.5.1 Overview
Most of the world’s liquid fuels today are refined from conventional crude oil (petroleum) and used mainly in the transport sector, but liquid energy carriers made from unconventional deposits (heavy oil, oil sands, oil shale, coal-to-liquids, processing of various biomass feedstocks)
Coal pre-treatment
ASU
O2
Raw coal
Gasifier
Coal
Syngas cooler & scrub
Raw syngas(CO,H2,CO2,H2S,...)
WGSCO+H2O=CO2+H2
Syngas cleaning (H2S & CO2
removal)
Sulfur recovery
Liquid synthesize and distillation (FT/DME/MeOH)
H2SCO2
Clean syngas(CO,H2,...)
Air
N2
Water
S
Liquid fuel
Water
Figure 15.3 | The general fl ow of coal-to-liquid technologies.
Table 15.1 | Investment (US 2002 $) of main equipment used in CTL technologies.
Equipment or process Scaling parameter So Unit of So Co (M$) f
Coal storage, prep, handling Raw Coal feed 27.4 kg/s 29.10 0.67
Gasifi er + syngas cooler & scrub MAF 9 coal input (LHV) 697 MW 144.30 0.67
Air separation unit (O 2 at 1.05 bar) Pure O 2 produced 21.28 kg/s 40.40 0.5
O 2 compression (from 1.05 bar) Compression power 10.0 MW 6.30 0.67
N 2 compressor (GT NO x control) Compression power 10.0 MW 4.7 0.67
WGS reactors, heat exchangers MAF coal input (LHV) 1377 MW 39.80 0.67
Selexol H 2 S removal & stripping Sulfur input 81 t/d 33.6 0.67
Selexol CO 2 absorption, stripping Pure CO 2 captured 2064.4 mol/s 32.80 0.67
Sulfur recovery (Claus, SCOT) Sulfur input 29.3 mol/s 22.90 0.67
Fischer Tropsch reactor FT liquid produced 100 MW 73.5 1
DME recycling synthesize and distillation
Amount of feed gas (H/C=1)
8680 mol/s 87.37 0.65
MeOH recycling synthesize and distillation
Amount of feed gas (H/C=2)
10810 mol/s 81.77 0.65
Source: Tijmensen, 2000 ; Chiesa, 2003 ; Kreutz et al., 2005 ; Zhou et al., 2009 .
9 Moisture and ash free coal.

Energy Supply Systems Chapter 15
1146
are increasingly being made available in the marketplace where their promise is to reduce the very high dependence on conventional petrol-eum. Resulting GHG emissions (kgCO 2 -eq/km traveled) are higher for some alternatives and claims of reduced GHGs from using biofuels are being carefully scrutinized since land use changes are often involved. The utilization of liquid fuels is shown schematically in Figure 15.1 .
15.5.1.1 Petroleum
Of the world’s total final energy demand, 44% comes from petroleum ( Chapter 1 ). Most of the production comes from the Middle East (30%) and Russia (13%), while almost 50% of consumption is in the United States and Europe (BP, 2010 ). This results in a significant movement of oil from source to consumers, at a rate of over 50 Mbbl/day. Conventional oil resources are estimated at two trillion barrels, or enough to supply the world for over 60 years at present rates of consumption. However, consumption rates are expected to increase over time. About three times as much oil resources are estimated from unconventional reserves, but these are likely to cost more to extract, even with new technology.
15.5.1.2 Liquid Biofuels
Raw biomass materials can be broadly classified into wet or dry resources as well as liquids or solids. Solid dry sources are best used for thermo-chemical processes, and wet liquids and gases for biochemical conversion. A number of conversion processes are commercially avail-able to produce both bioethanol and biodiesel (triglyceride esters) as vehicle fuels. Other processes still under development include hydro-thermal gasification, enzymatic hydrolysis of lignocellulosic feedstocks, biodiesel hydrogenation and the production and use of algal oils.
15.5.2 Conversion
Petroleum is converted in a refinery to consumer products such as gas-oline, lubricating oil, or asphalt. Global refinery capacity utilization in 2008 was between 70 and 90% (BP, 2010 ). Because of demand centers, almost 28% of refinery throughputs are in Europe, whereas the United States accounts for almost 20%. Both these percentages are decreasing, but Asia Pacific countries account for 28% of throughput and this figure is rising. Most recent refinery additions have been in Asia, particularly in China, to meet this increasing demand for petroleum products.
Solid or liquid biomass feedstocks can be converted using numerous tech-nologies to provide more convenient energy carriers in the form of liquid fuels, such as methanol, ethanol, biodiesel, and bio-oil. Biomass feed-stocks with a high moisture-content are usually preferred for anaerobic digestion, pyrolysis, or biofuel production, although there is continuing interest in producing advanced biofuels from lignocellulosic feedstocks (Sims et al., 2010 ). The energy inputs, related carbon savings, and water
demands needed for biofuel vary with the process. High-energy input/output ratios (for example, corn ethanol processing when using coal-fired power and heat) can lead to limited GHG mitigation benefits. Stringent planning regulations, feedstock supply security and sustainable produc-tion can constrain biofuel plant developments (IEA, 2007 ).
15.5.3 Transmission and Distribution
Petroleum is moved, either as liquid crude oil or as refined products, pre-dominantly by pipeline, or, in the case of intercontinental transmission, in oil tankers. The petroleum that moves from the Middle East is mostly by ship and from the former Soviet Union is mostly by pipeline. Current oil markets and trade are shown in Figure 15.4 .
Liquid biofuels ranging from raw vegetable oils to highly refined liquid transport fuel blends can be transported in similar fashion, usually by road tanker or ship. Pipelines are also being planned for bioetha-nol. In Brazil for example, the company Uniduto Logistica has begun construction of a 600 km, US$800 million pipeline from S ã o Paolo to the port of Santos, being the first phase of a major network. In the United States, Magellan Midstream Partners and the biofuel producer Poet are together undertaking a feasibility study of a 2700 km pipeline from northwest Iowa to the New York harbor (IEA, 2008a ). At a cost of US$3.5 billion, it would collect ethanol produced in Iowa, South Dakota, Minnesota, Illinois, Indiana, and Ohio. Technical challenges include the corrosive nature of ethanol, its affinity for absorbing moisture, and how it might react with other products and substances within the pipeline. A dedicated ethanol line is therefore preferable, but at a relatively high cost per volume carried if the pipeline is not used to its full capacity.
15.5.4 Storage
Storage of vegetable oils and biofuels over time is problematic due to the biological origin of these materials, as well as their being hazardous and flammable. In general, the standard storage and handling procedures used for petroleum diesel can be used for biodiesel. Ideally, a clean, dark environment free of moisture is required, using storage tanks made from aluminum, steel, polyethylene, or polypropylene. Biodiesel corrodes copper, brass, lead, tin, and zinc, and therefore these metals should be avoided in all components.
For ethanol, some components and equipment used for storing and dis-pensing of conventional gasoline, as well as for internal combustion engines, do not have adequate compatibility with ethanol or gasoline-ethanol blends above E10. Hence, a range of national and state regula-tions exists (Wisconsin Department of Commerce, 2005 ).
Metals such as zinc, brass, or aluminum, commonly found in conven-tional fuel storage and dispensing systems, are incompatible with etha-nol. In addition, components made from natural rubber, polyurethane,

Chapter 15 Energy Supply Systems
1147
cork, certain adhesives, elastomers, and polymers used in flex piping, bushings, gaskets, meters, and filters may also degrade. If water is pre-sent, it can cause premature failure of components such as probes, line leak detectors, submersible pumps, fuel dispensers, piping, hoses, and nozzles. Being miscible with ethanol, it can result in phase separation of the blend. Storage in single-walled tanks can leak and condense, so lined- or double-walled underground storage tanks at service stations are usually necessary.
Emissions of liquid effluents or leachates from biofuel plants could affect watercourses, groundwater, and soils, and so need treatment before dis-posal to land or water. Policy drivers for biofuels are increasing and now exist in around 80 countries and states (REN21, 2011).
15.6 Gaseous Fuel Applications (Including Natural Gas and Biogas)
15.6.1 Overview
Natural gas is the cleanest burning of all fossil fuels, but known reserves are somewhat limited. However, recent successes in extracting gas from deep shale deposits using horizontal drilling techniques, especially in
North America, are releasing more resources worldwide. Estimates of future natural gas availability vary widely from hundreds to thousands of years. Such estimates depend on assumptions about the future rate of use, and the development of technology to drill for gas in more difficult geographical conditions. The utilization of gaseous fuels is shown sche-matically in Figure 15.1 . Methane can also be extracted from coal, peat, and oil shale as well as from organic materials, such as landfill gas or bio-gas. If these sources can be successfully exploited, the world’s methane supply will be extended another 500 or more years (see Chapter 7 ).
In 2007, the world’s proven reserves of natural gas were nearly 177 trillion cubic meters (Tm 3 ), of which 45 Tm 3 , or 25%, were in Russia ( Chapter 7 ). Following the depletion of cheap local gas, natural gas mar-kets will require larger investments to transport gas from more remote areas. A growing number of market participants, each with different institutional frameworks, leads to higher uncertainties and risks.
Exploration for gas is currently at a significantly lower degree of com-pleteness than for oil, with the exception of certain regions, such as North America. Thus, significant portions of the world’s conventional gas resources are yet to be discovered. Future gas exploration is anticipated in the Arctic domains, in fold-belt provinces, and in deep sedimentary basins. Results from recent hydrocarbon exploration,
Figure 15.4 | Current oil markets and trade. Source: BP, 2011 , data based on Cedigaz and GIIGNL.

Energy Supply Systems Chapter 15
1148
combined with new technological progress, suggest a high potential for future discoveries. Even though exploration in geological fold belts has contributed to past success, it has been focused on shallow-water locations that are the easiest to identify. Deepwater exploration has not been undertaken on any sizeable scale, leaving potential for future major discoveries.
The Arctic basins present a very high potential for gaseous hydrocar-bons, since the offshore area is underexplored. On-shore resources, even though more developed, also present significant potential. The remain-ing exploration potential could, in a favorable scenario, be of the same order as the resources already discovered.
15.6.2 Conversion
As production from the most developed gas fields enters the depletion stage, accelerating depletion rates and falling rig efficiency rates indicate that the gas resource base could be reaching maturity, though annual world production continues to increase (see Figure 7.11 , Chapter 7 ). In the past, natural gas recovered while extracting petroleum could not be profitably transported for sale and was simply flared at the oil field. This wasteful practice is now illegal in many countries. Oil and gas com-panies now recognize that revenue from the gas can often be achieved by conversion to liquefied natural gas (LNG), compressed natural gas (CNG), or other energy carriers easier to transport.
Producing biomethane from landfill gas collection and from anaerobic digestion of farm and food-processing wastes and dedicated green crops involve mature technologies, with the gas usually being used for heat and power at the local and community scale. After cleanup and compression, the gas can be used to power vehicles, if the engines are designed or converted as if running on CNG. DME produced from coal or biomass can be used in similar fashion to displace liquefied petrol-eum gas.
Synthesis gas can be produced from biomass (as well as from coal) via gasification, but cleaning the gas and removing tars remains a chal-lenge in some gasifier designs at both small (100 kW) and medium (20 MW) scales. Hydrogen can also be produced from biomass or fossil fuels as well as through water electrolysis. Direct conversion through reduction of water at high temperatures is also possible but a more costly option. Storage of small hydrogen molecules remains an issue, but their use through direct combustion or in fuel cells is reasonably well understood.
15.6.3 Transmission and Distribution
The major difficulty in transmitting natural gas and biomethane is their low density. Natural gas pipelines are presently impractical for trans-mission across oceans. The development of new technologies for gas
processing and transport, especially over greater distances ( Figure 15.5 ), to a certain extent remove “regional borders.” Biomethane can be pro-duced at high enough quality so that it can be injected into natural gas pipelines. The volume of the world’s LNG trade, including intercontinen-tal and spot markets, has been growing at 6–7% annually, faster than the growth of pipeline gas exports at 2–2.6% annually. This growth is expected to continue due to technological advances in gas liquefaction and LNG transport and utilization. This means that national and regional markets are no longer isolated from each other.
Capital intensity of LNG production has halved in the past decade, with high-capacity tankers now costing 50–60% less than 10 years ago. Additionally, demand for LNG has been enhanced by the importers’ drive to diversify supplies and the overall liberalization of the natural gas market. The pool of LNG exporters is currently limited to Indonesia, Algeria, Malaysia, Qatar, Trinidad and Tobago, Nigeria, and Australia, with Russia joining Atlantic and Pacific markets.
With 15 nations accounting for 84% of the world’s gas production, access to natural gas has become a significant factor in international economics and politics, and control over international gas pipelines is a major strategic factor. Natural gas is transmitted through various high-pressure pipelines, forming national and international gas-transmission networks connected to medium- and lower-pressure pipelines, operated by distribution companies that eventually reach end-users. Gas distribu-tion systems are the piping networks that deliver the gas to buildings and businesses, downstream of a city’s gate stations. The main problem in distribution systems is ensuring adequate maintenance and monitor-ing of the safety of these piping networks.
LNG ship carriers transport natural gas across oceans, while tank trucks can carry LNG or CNG over shorter distances. They may transport nat-ural gas directly to end-users, or to distribution points such as pipelines.
Figure 15.5 | Capacity versus distance for forms of natural gas transport. Pipe is gas pipeline, LNG: liquefi ed natural gas, CNG: compressed natural gas, GTW: gas to wire (electricity conversion in place), NGH: natural gas hydrate, and GTL: gas-to-liquids. Source: Gudmundsson and Mork, 2001 .

Chapter 15 Energy Supply Systems
1149
Additional facilities incur additional costs – for liquefaction or compres-sion at the production point, and then gasification or decompression at the end-use facility or for a pipeline.
The limited number of countries with a meaningful gas-pipeline export capacity includes Canada (92 Gm 3 in 2009), Russia (176 Gm 3 ), Norway (96 Gm 3 ), the Netherlands (50 Gm 3 ), Algeria (31 Gm 3 ), and the United Kingdom (12 Gm 3 ) (BP, 2010 ; see Figure 15.6 ).
Any future system development requires the continued creation of a gas infrastructure. This includes:
ensuring that the growth of LNG production, transportation, and •utilization facilities is faster than consumption, thus raising the LNG share of global gas consumption;
building intercontinental gas pipelines that, by 2020, should include •the Europe-Russia-Central Asia-North Africa network, Russia-Central Asia-China-Asia-Pacific network, a network covering much of Latin America, and the Australia part of an Oceania-Southeast Asia network;
shaping a single system of well-structured technological manage- •ment standards for gas-transport facilities to promptly reroute gas, including routine and emergency reserves, into regions in need, thus rendering the entire gas transport system more stable and reliable.
During the gas liquefaction process, impurities are removed, and heavy hydrocarbons separated. The material is cooled down until the gas liquefies and is then stored. The construction of a liquefaction plant is a critical factor in the LNG chain, taking the largest portion of overall costs. The power required for operation of a liquefaction plant can be up to 900 MW, as large as a thermal power station. Therefore, the costs of running the liquefaction plant represent a substantial part of the overall costs of the LNG chain, and depend on the energy efficiency of the plant. For example, the use of large axial compressors can reduce energy use by 15% compared with centrifugal compressors.
Significant cost reductions can also be obtained through economies of scale and more advanced technologies to generate electricity. In older plants, the power to drive the compressors is produced with steam tur-bines (with a thermodynamic efficiency at lower heating value (LHV) of about 30–35%), while more modern units use combined-cycle gas
Figure 15.6 | Current gas markets with transport by pipeline or as LNG. Source: BP, 2010 , data based on Cedigaz and GIIGNL.

Energy Supply Systems Chapter 15
1150
turbines (CCGT). Natural gas fuels the turbine, and the heat generated produces steam, which in turn drives a steam turbine. The overall con-version efficiency of CCGT can be around 50–60%.
While no floating liquefaction plants have yet been constructed, the concept and design is currently being developed. Such floating plants could exploit remote or stranded gas fields that are not economical for fixed platforms. Shorter construction times and the fact that they can be reused for other sites allow the costs of such plants to be spread over several projects. Floating liquefaction plants can also minimize environ-mental impacts on coasts. The main challenge they present is the carry-ing out of liquefaction, storage, and loading on a mobile platform, under changing weather and sea conditions.
Due to public opposition to LNG terminal construction and safety issues associated with the operation, two new concepts for a coastal recep-tion terminal have been developed. A structure resting on the seabed is constructed at depths ranging from 15–25 m, in a similar fashion to building offshore concrete production platforms. A floating storage and regasification unit (FSRU) is modeled on the floating production, stor-age, and off-loading unit from the upstream oil industry. FSRUs range from converted LNG tankers to terminals planned and built specifically for the purpose. Specially designed regasification vessels transport LNG, and then vaporize it to send it through a sub-sea pipeline at the destin-ation port.
Shipping efficiency is essential to reduce transportation costs. A typical carrier can transport 145,000–155,000 m 3 of LNG, which will become about 89–95 Mm 3 standard of natural gas when vaporized. LNG carriers are similar in size to aircraft carriers, but significantly smaller than very large crude oil tankers. Because LNG ships are extremely capital inten-sive, they cannot afford to have idle time.
LNG vessels usually do not have a liquefaction facility on board and use boil-off gas for propulsion at a maximum of about 0.15% of cargo volume a day. Because the gas cargo supplements the fuel oil, LNG tankers arrive at the destination port with less LNG than was loaded at the liquefaction plant. LNG tankers mainly use steam turbines as their propulsion system. Although the fuel efficiency is low, they can easily be adapted to use the boil-off gas because LNG carriers also normally retain a small percentage of the cargo (the “heel”) to cool the tanks down to the required temperatures before reloading.
The regasification terminal is usually the least capital-intensive link in the LNG supply chain and several systems are in operation today. Key selection factors are operational costs (fuel consumption, mainten-ance), environmental costs, rates of emissions, and availability of the equipment suppliers on the market. Climate and geographical con-straints are also important factors.
Gas quality and interchangeability are important issues because the gas regasified from LNG goes into the pipeline system. Also, the two
fastest growing importers, the United Kingdom and the United States, require gas caloric specifications that are lower than other traditional gas importers, such as Japan.
In June 2008, 80 LNG liquefaction trains at 19 sites in 15 countries had a total liquefaction capacity of 194 Mt/yr. By August 2008, 65 LNG regasi-fication facilities in 19 countries had a total capacity of 438 Mt/yr (599 Gm 3 /yr), and a total storage capacity of 28 Mm 3 of LNG (equivalent to 17.2 Gm 3 of natural gas).
Zero CO 2 emissions for LNG terminals can be achieved by avoiding fuel consumption for regasification. Using open rack vaporizers has been the most common option for many years. Air heat exchangers are also used when climatic conditions are favorable.
Energy integration with other industries saves energy and costs. These include: “cold/hot energy” exchanges at the power plant; direct use of cold energy for industrial processes, air liquefaction, and cryogenic proc-esses; and power production (direct expansion, Rankine cycle).
As the major gas consumption centers become more dependent on gas imports, LNG trade will play an increasing role as a transmitter of price signals between the regional markets of Europe, Asia Pacific, and North America. However, significant differences in the import structures among these markets are likely to remain until 2030 and beyond.
As Europe’s indigenous production declines, the resulting deficits will be supplied by both imports of LNG and pipeline gas. North America will predominantly rely on LNG to replace its falling production, and in the Asia Pacific region, rising demand will be met by increases in indigenous production along with LNG imports (but with increased intra-regional trade). The recent findings of large amounts of shale gas will affect this. LNG will fill the supply-demand gaps in all three main gas consumption regions, but the trade of pipeline gas will remain focused on Europe.
Although most natural gas imports to Europe will still be via pipeline under contracts until 2025 and beyond, several new LNG suppliers are expected to emerge. The ability of LNG suppliers to compete in down-stream markets is due to its cost-competitiveness with pipeline gas.
Historically, rising gas prices and technological developments have resulted in substantial cost reductions in the LNG business and have helped improve the competitiveness of LNG compared with pipeline gas. Between 1990 and 2000, liquefaction costs fell by 25% to 35% and shipping costs by 20% to 30%. However, more recently, this trend was reversed, with strong increases in steel prices and even stronger increases in the cost of constructing liquefaction plants.
Comparisons between the costs of gas pipeline transport onshore and offshore with the costs of LNG transport have been published since the late 1970s, when LNG transport first arose for the export of Algerian gas. A comparison included in the European Commission’s Energy

Chapter 15 Energy Supply Systems
1151
Sector Inquiry report (European Commission, 2007 ) was based on vary-ing throughputs of 10, 25, and 40 Gm 3 /yr; and for pipeline gas, (includ-ing capital expenditure related to laying pipelines on land and building gas compressor stations); and an LNG tanker of 135,000 m 3 .
This analysis between pipeline transport and LNG showed break-even gas-transport distances of 3000 km and 6500 km for projects of 10 Gm 3 /yr and 25 Gm 3 /yr, respectively, with shorter break-even distances for more difficult terrain, and substantially shorter break-even distances for off-shore pipelines.
Recent studies suggest that a single LNG train is cheaper than all other options when the distance is over 4500 km. With further cost reduc-tions, the break-even distance will become even shorter in the future. However, it must be kept in mind that choices between LNG and pipe-line transportation are rather the exception. North African and maybe Nigerian gas to Europe as well as Middle Eastern gas to Europe are the main cases where a choice is feasible, possibly together with some gas sent from the Gulf to Pakistan and India. Even in these cases, the distances are not the same, due to differences between the shipping route and the pipeline routing onshore. For Japan and North America, LNG remains the major gas import option. Possible pipeline projects for Japan would have to originate from regions that do not supply LNG. Similarly, most gas from Russia is located in the middle of the Eurasian continent and inevitably has to be transported by pipeline.
Gas transport costs for internationally traded gas can be critical. Pricing in a tight market is based on a netback value either derived from the replacement value of gas, or alternatively from the market price of gas in a deep and liquid market. Transport costs are eventually deducted from the revenue of the exporter. For an exporter, the main question is whether or not the net present value of the compensation it receives for the depletion of its resources is attractive. The transport costs are only one element among many for the resource owner to consider when making a decision on whether, how, and where to market its gas.
15.6.4 Storage
Gas is stored during periods of low demand, and withdrawn during peri-ods of peak demand. It is also used for a variety of secondary purposes, including:
balancing flow in pipelines; • leveling production over periods of fluctuating demand; • insuring against unforeseen events; and • meeting regulatory obligations regarding reliability. •
The capacity of underground gas storage (UGS) systems among coun-tries ( Table 15.2 ) is highest in the United States, followed by Russia, Ukraine, and Germany. Russia’s working gas volumes include long-term strategic reserves.
The working gas volume of regional UGS facilities in operation in 2004/2005 was 333 Gm³ (IGU, 2006 ). The most important type of gas storage is in depleted gas reservoirs, aquifer reservoirs, or salt cavern reservoirs. Each possesses distinct physical and economic characteristics
Table 15.2 | Number of underground storage facilities and working gas volumes (Mm 3 ) in 2004/2005 by nation.
NationsNo. of UGS Facilities
Total Installed Working Gas volume of UGS Facilities
10 6 m 3
USA 385 100,846
Russia* 22 93,533
Ukraine 13 31,880
Germany 42 19,179
Italy 10 17,415
Canada 49 14,820
France 15 11,643
Netherlands 3 5,000
Uzbekistan 3 4,600
Kazakhstan 3 4,203
Hungary 5 3,610
United Kingdom 4 3,267
Czech Republic 8 2,891
Austria 4 2,820
Latvia 1 2,300
Romania 5 2,300
Slovakia 2 2,198
Spain 2 1,981
Poland 6 1,556
Azerbaijan 2 1,350
Australia 4 934
Denmark 2 820
Belarus 2 750
China 1 600
Croatia 1 558
Belgium 1 550
Japan 4 542
Bulgaria 1 500
Ireland 1 210
Argentina 2 200
Armenia 1 110
Kyrgyzstan 1 60
Sweden 1 9
Total 606 333,235
*including long-term strategic reserves.
Source: IGU, 2006 .
Energy Supply Systems Chapter 15
1152
that govern its suitability for a given application. Most of the working-gas volume is installed in former oil and gas fields ( Figure 15.7 ), fol-lowed by aquifer structures, and caverns in salt. Abandoned mines and rock caverns are of little relevance on a world scale.
Depleted gas reservoirs are the most common form of storage. They are generally the cheapest to develop, operate, and maintain. Obviously, location is a very important factor in determining whether or not a depleted gas field makes an economically viable storage facility. Aquifer reservoirs can be used for natural-gas storage in some cases. Usually these facilities are operated on a single annual cycle as with depleted gas reservoirs. Salt formations are well suited to natural-gas storage. Salt caverns allow very little of the injected natural gas to escape from storage unless specifically extracted. A cavern is leached in the salt deposit.
15.6.5 Policy and Investment Considerations
Gas demand is still growing rapidly. It already provides 22% of all pri-mary energy (compared with only 10% in 1960). According to IEA esti-mates, its share may reach 25% before 2030. For the foreseeable future, natural gas will continue to be used primarily for direct residential and commercial heating and cooking, as well as for electric power gener-ation, and industrial heat processes. Power generation will continue to drive the gas market according to long-term forecasts. At the same time, new uses for gaseous fuels in new sectors (such as transport) could be achieved.
Methane is a diverse and flexible fuel which, when combusted, provides both heat and/or electricity. It can also be used in the transport sector in the form of CNG, LNG, or compressed or liquefied biomethane. The
use of CNG as a transport fuel is not new, but could continue to grow ( Figure 15.8 ), although improvements in electric vehicles may dampen any dramatic increase in CNG-powered engines. The relatively favorable environmental characteristics of combusting natural gas compared with coal and oil will certainly help it hold its position at the forefront of fossil-fuel consumption.
In countries with well-developed domestic gas markets, liberalization has privatized unbundled segments enabling consumers to choose suppliers through non-discriminatory, third-party access to gas transport systems. These policies have led to the prompt development of spot gas trading. Thus, terms of contracts have been gradually reduced, and their linkage to other energy carriers such as oil, has been replaced with a linkage to gas, with spot-market prices. The result for gas-supplying countries is negative, as it is now more difficult to guarantee returns on large-scale investments within the framework of extremely volatile spot prices. There is a real danger that this situation will destroy the financing tools for large capital-intensive projects that have developed in the last decades on the basis of long-term contracts. Nor does this situation encourage the huge investments necessary for infrastructure and production development. Participants in the gas market simply delay their investment decisions because of high uncertainty. The question of timely investments in gas project development has become more important than ever.
With institutional frameworks changing rapidly in gas-producing, -transit, and -consuming countries, there is a need for additional guar-antees of contract fulfillment. The mutual distrust of many market par-ticipants makes them protect their traditional territories, leading to energy nationalism and protectionism. Competition between national energy companies (representing mainly gas-producing countries), and international energy companies (representing gas-consuming countries) are increasing.
Methane CH4
Compressed Natural Gas
(CNG)
Liquefied Natural Gas(LNG)
Biomethane from Biogas
• Liquid
• Liquid to Compressed (LCNG)
• Gaseous
• Liquefied
Figure 15.8 | Methane as a diverse fuel. Sources: adapted from Matic, 2006 . Figure 15.7 | Working gas capacity distribution by underground storage types in 2005. Source: adapted from EIA, 2006 .

Chapter 15 Energy Supply Systems
1153
Gas pricing is still inconsistent: regional prices usually follow global oil prices with a slight delay. The market is currently divided into three main areas – North America, Europe, and the Asia Pacific – where dif-ferent infrastructures lead to different prices, supply scheduling, and pipeline/LNG supply percentages. In Asia Pacific, demand is met mainly by LNG, with a premium over European and American prices. Future liberalization of gas markets and streamlining of trading procedures will probably eliminate the premium. LNG tankers are helping to bring regional prices down.
Solid or liquid biomass feedstocks can be converted using numerous technologies to provide more convenient energy carriers in the form of gaseous fuels, such as biogas from anaerobic digestion, landfill gas, syn-thesis gas from gasification, or hydrogen (see Chapter 11 ). Biomethane (i.e., scrubbed biogas) can be used directly for a range of local applica-tions or injected into natural gas pipelines. The total market potential of biogas by 2020 has been estimated to be nearly 10 times the current biogas production of over 90 PJ/yr (IEA, 2007 ). Beneficial environmental impacts from the use of some biomass feedstocks include improving sewage treatment before discharging effluent and sludge to waterways or oceans, avoiding methane emissions from landfills, and reducing odors from direct application of animal wastes to land by first process-ing in a biogas plant.
Recovery of methane from modern biogas plants, following anaerobic digestion of the wet biomass feedstock, such as animal ( Figure 15.9 ), human, food, and organic wastes and green crops, has increased in recent years. More than 4500 installations (including sewage gas and landfill gas recovery plants) were operating in Europe alone in 2002. The moisture content of slurries and wet biomass feedstocks used with anaerobic digestion plants is usually less important than for combus-tion of solid biomass, because the feedstock is usually not transported long distances and will not deteriorate in the short time between pro-cessing. A lower total solids content of the feedstock liquid can have an adverse effect on the biogas plant efficiency, along with the additional costs of having to store larger feedstock volumes before processing takes place.
Biogas can be directly combusted to produce heat. It can also be fed into natural gas grids or distributed to filling stations for dedicated or dual gas-fueled vehicle engines, or for power generation. For these applica-tions, the biogas first requires scrubbing to remove any corrosive hydro-gen sulfide, and carbon dioxide where gas-storage volumes are limited resulting in fairly pure biomethane gas.
Because biomass tends to have relatively low-energy density (whether as a solid, liquid, or gaseous fuel), and is organic, the storage of large volumes can be more costly than equivalent fossil fuels. For example, biogas needs either large plastic or steel storage tanks, or to be com-pressed and stored in cylinders, both expensive options. Therefore, matching the biogas production rate to the energy demand is the rec-ommended approach to avoid storage costs.
Gasification of dry, solid biomass produces synthesis (producer) gas consisting mainly of CO and H 2 . Development of efficient biomass inte-grated gasification combined-cycle (BIGCC) systems is nearing com-mercial realization, but the challenges of gas cleanup, to remove tars and condensates, remain. Several pilot and demonstration projects have been evaluated with varying degrees of success. The gas pro-duced can be used in gas turbines, gas engines, or as feedstock for a range of liquid biofuels based on the Fischer-Tropsch process. Gas transport and storage are not usually problematic, because the gas can be converted onsite to produce heat, power, or liquid fuels as it is produced. Co-firing of biomass with coal in a gasification plant can provide increased efficiency and carbon mitigation, especially if linked with CCS, as can co-firing for heat and power generation. Torrefaction of biomass (bio-coal) using microwaves is reaching commercialization and could be co-fired (Rotawave, 2010 ). For an extensive discussion see Chapters 11 and 12 .
15.7 Heating and Cooling
District heating systems transfer and distribute heat from one or more heating or CHP plants to individual homes, institutions, and indus-trial consumers, primarily in urban areas. District-heating systems are based on mature technology with a high degree of reliability. The infra-structure to deliver heat is costly, but is cost-effective when utilized efficiently. Furthermore, efficiency depends on climate and whether the infrastructure already exists. For instance, the centralized systems in the largest communities in Finland have district heating in more than 90% of homes. More than 75% of district heating in Finland is produced by CHP. In Sweden, district heating is supplied by a combin-ation of CHP and large heat pumps. In 2008, 50 TWh district heating was produced, out of which 5.5 TWh was supplied by heat pumps and the majority of the rest (71%) from CHP fuelled mainly with woody biomass.
Figure 15.9 | Anaerobic digestion plant and biogas storage tank on a 4000-sow pig farming in South England using two gas engines (housed in the closed shed) to pro-vide electricity for the farm as well as low-grade heat for drying Lucerne horse feed as an ancillary farm operation. Source: courtesy of Ralph Sims.

Energy Supply Systems Chapter 15
1154
Major improvements in overall efficiency through CHP largely offset losses in transporting heat. In the case of heat applications in industrial processes, CHP loses less heat, as the heat transportation distances are short. Greenhouse-gas emissions are reduced because carbon-neutral wood residues and black liquor from pulp production are usually used to fuel CHP plants. In Japan, there are many cases where heating and cool-ing systems using heat pumps and/or induced heating have higher over-all efficiency and economy than a conventional steam-based system.
Insulation material used for heat transfer pipes is now being improved continually, allowing heat to be distributed over long distances with relatively lower losses. This will facilitate using surplus heat from power plants. Further improvements in the performance of district-heating sys-tems could develop low-temperature systems with reduced losses and more efficient operating conditions for CHP plants.
Efficiency improvements in end-use are a challenge to the district-heat-ing sector. New low-energy houses need very little heat and only at selected times, such as cold winter nights (Larsen and Petersen, 2005 ). Such houses might be self-sufficient with hot water and will be unre-liable consumers. In Europe, many of the district-heating systems are old and need upgrades and maintenance. General development in the electricity sector toward distributed generation works in two ways for the co-generated heat. On the one hand, generated heat is produced closer to the consumer, thereby reducing loss; on the other hand, the system gets more dispersed with smaller producers. As in the electricity sector, there is a compelling need to make the distribution system more intelligent, with closer links between producers and end-users. This is of utmost importance for the future development of sustainable heat-supply systems. Another step towards increased sustainability would be to combine district-heating systems with solar heating and heat storage, optimizing the total system.
Heating of water and building space using solar-thermal systems, ground-source heat pumps, as well as bioenergy (pellets or firewood) at the domestic and small business scale have rapidly growing markets (IEA, 2007 ). This is due to technological improvements and more competition, and brings the added benefit of increased reductions in greenhouse-gas emissions. Heating demands can be reduced by energy efficiency meas-ures such as insulation, temperature adjustment, behavioral changes, etc. There is also increasing use of heat pumps, air-to-air, and air-to-water.
District-cooling systems are analogous to district-heating systems. The cooling medium is normally water from lakes and the ocean extracted at a temperature of 6–10°C, with a temperature rise of about 10°C at the consumer end before its return to the source. A water-glycol or ice-slurry-water mixture is also used. Cooling energy is produced by compressors using electricity or by absorption machines using district heating from a CHP plant or solar energy, usually at the domestic scale.
The district-heating system might drive cooling systems during the summer. Heat-driven cooling machines might also offset part of the
electricity for air-conditioning, thus reducing the peak load of electricity in hotter areas of the world. Solar irradiation energy reaches its high-est level around early afternoon, as building-space cooling demands peak. More direct district cooling would require the circulation of chilled water to end-users. Presently, Helsinki and Turku in Finland are among a number of cities that integrate district cooling and heating. District cooling also makes it possible to prolong the utilization period of the maximum load in CHP plants.
15.8 Electricity
15.8.1 Overview
Electricity is the key to greater energy access and more energy for sus-tainable development across the world, and to increasing energy effi-ciency throughout the energy supply-chain. Figure 15.1 vividly shows the many sources used to generate electricity and its almost universal use. By mid-century, at least two-thirds of the world’s population will be concentrated in urban locations. This further underscores the import-ance of electricity as the primary carrier of energy from relatively remote production locations to these ever-growing urban population centers (Planck Foundation, 2009 ).
Electricity’s capacity to transform the broad array of raw energy resources most efficiently and precisely into useful goods and services, irrespective of scale, distinguishes it from all other energy forms. Electricity also ena-bles technological innovation and productivity growth – the lifeblood of a modern society. Electricity is indeed the equal-opportunity conversion, delivery, and end-use vehicle for all the world’s energy resources (EPRI, 2003b ; Yeager, 2007 ).
The profound impact of electricity on economic development and qual-ity of life indicates that governments around the world will continue to place a very high priority on supplying electrical service to their citizens. Today, the annual individual consumption of electricity ranges from zero to well over 10,000 kWh. The empirical dividing line between advanced and developing economies is about 2000 kWh of annual electricity consumption per person. The resulting “electrification gap” effectively excludes nearly half the world’s population from the potential benefits of a global economy.
Electrification offers the developing world an opportunity to “leapfrog” over the earlier, energy-intensive development of the West. For example, by 2050, if electricity provided even 40% of the world’s total energy, as opposed to the 20% put forward in business-as-usual projections, improve-ments in global sustainability would be profound. For example, relative to business-as-usual, there would likely be at least a two-thirds reduction in global carbon emissions, made possible through higher efficiency and low-carbon fuels, and the same reduction in global oil consumption, through the use of electric vehicles. Equally important is the potential for at least a 50% increase in developing the world’s economic output (IAC, 2007 ).

Chapter 15 Energy Supply Systems
1155
At the same time, the global electricity supply system is currently under-going fundamental changes in its infrastructure, associated not just with the rapidly increasing amounts of renewable energy, but also with the development of new production and end-use technologies. One change is an increase in the large number of distributed production units that are significantly smaller than traditional thermal power plants. This development will include low-voltage connections from micro-distrib-uted generation/CHP plants in individual households. Another important development is active control of this low-voltage demand, introducing a new method of providing flexibility in power balancing.
Parallel with this development is the increased use of information and communications technologies (ICT). The communications capabilities of electric devices are expanding rapidly, while also becoming less expen-sive. This introduces two-way communication with end-users, and is therefore an important enabling technology for future power systems. Advances in measurement technology and computational methods, e.g., for predicting weather, energy demand, and prices, create new ways to control the entire power system (Larsen and Petersen, 2009 ).
15.8.2 Conversion
Today’s electricity supply worldwide overwhelmingly depends on cen-tralized sources. These electricity-generating plants are designed and built to take maximum advantage of economies of scale and relatively low-cost fossil fuel (primarily coal) and hydropower. As has been the case with power delivery, short-term economics have restricted the application of innovative technology to improve the efficiency, security, and environmental performance of these centralized plants. The United States, for example, depends on thousands of centralized power plants, whose average age is approaching 40 years, because they still produce electricity at significantly lower economic cost than any newer alterna-tive, even though the resulting environmental cost can be high.
This structure and approach has made it very difficult to achieve sus-tainable global energy for development. The primary issue restricting progress is not technology per se, but rather the disruptive impact new technology may have on the long-established and deeply embedded status quo. In the face of rapidly growing quantity and quality demands, it is crucial that this institutional and cultural inertia is promptly resolved so that the significant opportunities currently available to improve elec-tricity generation are realized (Cicchetti and Long, 2003 ).
Increasing prices for petroleum and natural gas, along with concerns about CO 2 emissions, have contributed to increased interest in advanced coal-based power generation, including supercritical pulverized coal, circulating fluidized-bed combustion, and integrated gasification com-bined-cycle (IGCC) coal plants. With extensive positive experience in Europe, Japan, and Korea over the last decade, the superior efficiency and resulting improved environmental performance of supercritical plants makes them the generally preferred coal-fired power-generation
choice today. Over the long run, the key to meeting the challenges of using coal to generate electricity is to refine rather than burn. Coal refin-ing depends on the conversion of coal under reducing conditions into a synthesis gas composed principally of methane and carbon monox-ide. This concentrated synthetic gas can be purified of contaminants and used, either as a clean fuel for high-efficiency combustion turbine/combined-cycle electricity generation, or as a feedstock for synthetic petroleum and chemical production (see Chapters 12 and 13 ). This tech-nology is well developed and has been shown to be economically com-petitive with US$50/bbl, without consideration of the sizeable energy security and carbon-capture value that such plants provide (National Academy of Sciences, 2009 ). Ultimately, it may be feasible to extend coal refining through carbon capture and more advanced technologies, such as carbon reduction and increased nuclear and renewable energy, in order to achieve nearly zero-emission power generation. Demand side management (DSM) is today an increasingly cost and environmen-tally effective alternative to building new fossil fuel-fired peak gener-ation capacity. Strategically for example, as discussed in the Appendix 15.A and Chapters 8 – 10 , DSM through community aggregation and the decoupling of profits from electricity sales volume, also has the poten-tial to become a much larger contributor and to effectively become an “Energy Efficiency Power Station.”
The technology gap is also evident in nuclear power, preventing any realis-tically achievable strategy for the use of clean energy. A variety of advanced nuclear reactor, power-generation system designs are in various stages of development to address the four core issues of cost, safety, waste, and nuclear-weapon proliferation (see Section 15.3.5 and Chapter 14).
Renewable energy is also, potentially, a very important way of meeting global electrification needs in both rural and urban situations, depend-ing on whether or not current barriers to large-scale deployment can be overcome. Despite recent gains and over one third of new power gener-ation investments, renewable energy resources still only supply around 18% of the world’s electricity, mostly from hydropower. If renewable energy is to play a greater role in the power mix, it must be reliable for the electricity system operator to use. The many options of renew-able energy are technologically unrelated to each other, and, in terms of integration into present systems, each option has its own challenges. The implications for the electricity carrier and storage infrastructure are especially significant and urgent. Renewable energy power-plant cap-abilities, grid-planning and operation, energy and power management, and energy markets are each important to the large-scale integration of renewable energy at the system level (National Academy of Sciences, 2010 ). For further discussion on renewable energy, see Chapter 11 .
Large proportions of wind power and other variable renewable energy generation make constantly maintaining a supply-demand balance an even larger challenge. In such cases, the system’s flexibility in gener-ation, demand management, and intra-area transmission may need to be increased (IEA, 2009b ). The layout and basic structure of the grid, as well as operational practices, need to be adapted to manage the

Energy Supply Systems Chapter 15
1156
presence of large amounts of variable supply. An energy system with large-scale integration of renewable energy, particularly wind power, is expected to meet the same requirements for the security of sup-ply and economic efficiency as the current energy conversion and delivery systems, while delivering better environmental performance, especially with regard to CO 2 emissions and lessening dependence on fossil fuels.
Arguably the most effective mechanism to rapidly grow the renewable energy supply is locally distributed power generation. Policymakers have also set other objectives that are most effectively addressed by distributed generation (DG), since it can maximize efficiency and min-imize the need for new large-scale generation plants, and upgrading of the transmission and distribution infrastructure. DG includes the incorp-oration of combined heat, power, and cooling for end-users, who are then able to more effectively contribute to maintaining supply-demand balance ( Figure 15.10 ).
Isolated DG systems may be connected to the primary grid, or they may operate independently, as microgrids, or confined within a building. They are generally not centrally controlled, and with few exceptions at the present time, they cannot be switched on and off according to the needs of the grid – unless they incorporate energy conversion and stor-age. These current realizations of a possible “DG future” are attracting considerable interest (IEA, 2007 ).
The eventual goal of DG is to “reinvent” the grid itself. Instead of elec-tricity being produced in large central plants and transmitted in one direction, DG will provide end-users with the following benefits:
a degree of energy independence; • opportunities for local control to improve the security of supply; • financial optimization with energy markets; • equal or better power quality; and • a cleaner environment. •
The perceived benefits of distributed-electricity generation systems include increased reliability of service, improved power quality, the abil-ity to defer investment on extending the grid, and greater energy effi-ciency through better use of waste heat. Of these drivers, reliability of service is the most important and is linked with energy security. More and more consumers need uninterrupted electric power, yet many exist-ing grids cannot operate without occasional blackouts. Using DG as a backup power source can largely eliminate these blackouts. Finally, the redundancy offered by a DG network, with its intertwined multitude of generators, converters, and connections, will certainly enhance the security of the power system.
To provide a reliable electricity supply, DG based on a high proportion of renewable energy will depend on a number of support technologies. These will include energy storage and load management to deal with variable power from renewable energy sources such as wind turbines.
Once the concept is fully developed, DG, in addition to the obvious bene-fit of providing a cleaner environment, has the advantage that it is easy to add generating capacity as required, using local energy resources. The cost of such expansion is predictable over the life cycle of the generat-ing plant, regardless of price fluctuations and shortages that may affect some fossil fuels and/or uranium in the future.
As the technology and benefits associated with it become more widely available, DG will contribute to electrification in the developing world. In this bottom-up approach, electrification can occur at the village scale, using local, renewable energy-powered “microgrids”. The fundamen-tal concept of a microgrid can be summarized as an integrated energy system having multiple distributed generation sources and multiple electrical loads, operating either in connection to, or separate from, the existing bulk power grid. A microgrid is thus a small-scale version of the electricity grid that the majority of electricity consumers rely on for power service today. Perhaps the most compelling feature of a microgrid is the ability to separate and isolate itself – known as “islanding” – from the bulk power distribution system during brownouts or blackouts. These local power cooperatives provide consumers with direct access and market transparency that traditional top-down, centralized, electricity-supply systems lack. These microgrids also offer basic building blocks for developing world electricity system expansion in the most sustainable manner. As the number of end-users (and their electricity needs) steadily grows, local microgrids can be interconnected into a regional grid com-bining the best of both distributed and centralized electricity supplies (Energy Business Reports, 2008 ).
A global future with energy for sustainable development will depend on a wise combination of both centralized and distributed generation in a system that best captures the advantages of both. The optimal balance will depend on local circumstances and the employment to best advan-tage of state-of-the-art technological advancements throughout the supply chain. Only in this manner can all the world’s essential energy resources be made efficiently and cleanly available to serve the global population within this century.
15.8.3 Transmission and Distribution
The delivery of electricity depends on a system of overhead wires and underground cables, collectively called circuits or grids, which connect electrical loads with diverse sources of electric-power generation. This delivery and distribution system begins at the buss bar located at the gen-eration plant, and extends to end-user meters. Today’s delivery systems are largely based on technology developed in the first half of the 20th century. The strain on this aging analog, electromechanically controlled system is evident as it tries to keep pace with the precise power requirements of a digital economy – there is increasing circuit congestion, and the need for better system security. This translates into a large and growing gap between the performance capability of today’s outmoded bulk-electricity delivery systems and the needs and expectations of end-users.

Chapter 15 Energy Supply Systems
1157
Figure 15.10 | Overview of an intelligent energy system infrastructure noting fl exibility and distributed generation. Source: Larsen and Petersen, 2009 .

Energy Supply Systems Chapter 15
1158
The ultimate force pulling the transmission and distribution system into the 21st century is rapidly advancing technologies: specifically, intelli-gent electronic technologies that enable ever-broader consumer involve-ment in defining and controlling electricity-based needs. Historically, issues of reliability, security, quality, and availability have been meas-ured and dealt with in a fragmented manner. In the future, these issues must become a highly integrated set of design and operating criteria, meeting the requirements of consumers (Nahigian, 2008 ).
Today’s alternating current (AC) electricity delivery systems have two basic dimensions: high-voltage, long-distance transmission, and lower-voltage, local distribution. Throughout this process, voltage is raised or lowered by transformers to meet particular circumstances. Various techniques can increase the quantity of electricity carried on existing corridors. New conductors with carbon-fiber cores, for example, have higher current-carrying capacity. Because of their greater strength and lighter weight, they sag less at the line temperatures associated with high power-flow rates, and can operate continuously at temperatures above 100ºC. High Voltage Direct Current (HVDC) Light, an underground cable that moves huge amounts of power with very low losses over thousands of km, is also viewed favorably is under consideration for the European super grid (Galvin and Yeager, 2009 ). By doubling voltage, for example, one increases the power capacity of a transmission line by a factor of four. As load growth increases and the use of renewable power generation located far from the load center becomes more glo-bally dominant, there will be increasing demand for HVDC technology. HVDC technology may be the only effective means of increasing power flow on an existing AC transmission corridor (Gellings, 2011 ). Electric power companies, government agencies, and industry are collaborating on “high-temperature” (liquid nitrogen temperature), superconducting direct current (DC) cables. As the technical and cost issues related to these are resolved, they may triple the electricity-carrying capacity of today’s conventional conductors. Current technical issues include fault current susceptibility, reliability, and efficient use of cryogenics.
Renewable energy on a large scale represents a paradigm shift for the transmission and distribution system: the pacing issue is their natural variability. Because electricity supply and demand must be in constant balance, the carrier system or “grid” must be flexible, able to accom-modate the sudden loss of a generation resource or an unexpected increase in demand. For small amounts of non-hydro renewable energy on a system, this can be accommodated reasonably well. However, with continued growth in such renewable energy, particularly wind, the goal to accommodate a significant fraction, 20% or more, requires new solu-tions. This issue has been underscored by the experience of Vattenfall, which controls northeast Germany’s electricity transmission network, where the world’s greatest concentration of wind-energy generation is located. In order to accommodate the unpredictable availability of the wind resource, conventional power plants have been forced to cycle on and off inefficiently, and the company has had to make emergency elec-tricity purchases at high prices. Improved forecasting would help miti-gate the problem. So would designing the grid to be more flexible (IEA,
2008a ), integrating a wider portfolio of generation types (Awerbuch, 2006 ), and making loads responsive and active participants in power system operations. Building-integrated solar PV systems that compete with retail power prices can also have variability issues, whereas con-centrating solar power (CSP) systems, combined with thermal storage, can help to overcome variability during short periods of cloud cover or darkness (UNEP, 2007 ).
An additional consideration is the demand that renewable energy places on the carrier system for ancillary services, such as voltage and reactive power, which must be managed to ensure the stability of the carrier system. The European Wind Integration Study, produced in 2007 by the European Transmission System Operators, focused on these issues as the amount of installed European wind capacity increased from 41 GW in 2005 to an expected 67 GW in 2008 (ETSO, 2007 ).
Other major upgrades to the electricity carrier system are also necessary to meet ever-growing demands, and ensure sustainability, including:
extremely reliable delivery of high quality, “digital-grade” power, •needed by a growing number of end-uses (EPRI, 2003a );
availability of a wide range of “always-on, price smart” electricity- •related consumer and business services that stimulate the economy and offer consumers greater control over their energy usage and expenses;
a transmission and distribution infrastructure confidently protected •from natural and man-made threats, which can be quickly restored in the event of an interruption;
minimized environmental and societal impacts through the use •of much more energy-efficient equipment, distributed renewable energy resources, and CHP; and
improved economic productivity and growth, with decreased elec- •tricity intensity.
These demands, coupled with climate change concerns and increasingly involved consumers, are pushing the transmission and distribution infra-structure and its operators toward a technology and business model commonly known as “the smart grid revolution.” The terms “intelligent grid,” “smart grid,” or “digital energy” may best be understood as the overlaying of a unified digital electronic communications and control system on the entire electricity delivery infrastructure. The goal is to pro-vide the right information to the right entity (end-use devices, trans-mission and distribution controls, and consumers) at the right time to enable the right action to be taken – all at the speed of light.
The smart grid’s transmission and distribution system ( Figure 15.11 ) will constantly fine-tune itself to achieve and maintain an optimal state of

Chapter 15 Energy Supply Systems
1159
operation, while monitoring for potential problems that could interrupt service. When a potential problem is detected, appropriate corrective action will automatically be taken. This includes “intelligent islanding,” which can instantaneously separate the transmission and distribution sys-tem into self-sustaining parts, so as to maintain electricity supply under all conditions. The result is a system that optimally balances electricity supply and delivery, minimizes losses, is self-healing, and enables next-generation electricity supply, energy efficiency, and demand-response. First and foremost, it opens the door to a strong demand-side response to price signals, thereby reducing the need for peak generation, improving the use of capital, and affording better asset management throughout the entire energy chain – all with positive repercussions for the envir-onment. This smart delivery system can also pave the way to more rapid introduction of new, more energy-efficient, end-use technology.
Perhaps the most important ultimate attribute of a smart electricity-delivery system is its capacity to assimilate significant quantities of vari-able renewable energy. As the National Research Council has recently concluded, the current, electromechanically controlled, electricity deliv-ery system generally cannot reliably transport more than single-digit percentages of non-hydro, variable renewable energy without requir-ing self-defeating quantities of backup electricity generation or bulk-storage capacity, which is limited today to pumped hydropower (National Academy of Sciences, 2009 ). A green electricity system must
indeed be a smart electricity system and will incorporate the following basic technological modernization improvements (NETL, 2007 ):
Transitioning the electricity transmission and distribution system •from what is now typically a radial design to a true network will ensure absolute connectivity from electricity generation sources to end-uses.
Converting the transmission and distribution system from an electro- •mechanical to a comprehensive, digitally monitored, electronically controlled network will enable continuous, instantaneous two-way communication between electricity users and suppliers, so that all consumers have the ability to move from passive to active market-place participation.
Incorporating locally distributed energy and CHP resources will trans- •late into much higher efficiency and reliability, and much greater use of variable renewable energy.
All the elements of the smart grid are linked and in constant commu-nication to optimize performance. It is indeed a supreme irony that computers, sensors, and computational ability have transformed every major industry except electric power-generation, whose product is the lifeblood of the modern global economy.
Central Power Plant
Industrial Plant
Wind Farm
Solar Panels
Houses
Disturbance inthe Grid
Isolated Microgrid
Processors
Demand Management
Generators
Offices
Energy from small generators and solar panels can reduce overall demand on the grid.
Can shut off in response to frequency fluctuations. Use can be shifted to off-peak
times to save money.
Execute special protection schemes in microseconds.
Detect fluctuations and disturbances, and can signal for areas to be isolated.
Energy generated at off- peak times could be stored in batteries for later use.
Sensors
Storage
Figure 15.11 | An example of a Smart Grid, a network of integrated microgrids that can monitor and heal itself. Source: Amin, 2008 .

Energy Supply Systems Chapter 15
1160
Several specific technology-related capabilities are pacing the imple-mentation and full value operation of smart electricity-delivery systems (EPRI, 2010 ):
Operating models and system impact algorithms. Simulation tools •address the transient behavior of the modern grid incorporating renewable energy. These include improved operator visualization techniques, new training methodologies, and advanced simula-tion tools. Advanced simulations provide an accurate and complete understanding of grid behavior, as well as assisting system planners in designing reliable power-delivery systems.
Nanotechnology sensors. Fundamental to system reliability is the •comprehensive incorporation of sensors that instantaneously track conditions of the system. It is therefore surprising that nano-sensors based on magneto-resistance (the change of resistance in the pres-ence of a magnetic field) are still not widely used in electricity carrier systems. By comparison, 250 million such sensors are produced for the hard disk industry, at a cost of a few dollars per sensor.
Phasor measurement units (PMUs). PMUs are ideal for monitoring •and controlling the dynamic performance of a carrier system in meas-urement systems for wide geographic areas. By 2012, for example, China plans to have PMUs throughout its electricity carrier grids, including all 500 kV substations and all power plants of 300 MW and above. All PMUs are connected via private network, and per-formance signals are received within 40 milliseconds on average.
Standards and protocols for system interoperability. The lack of consist- •ent, open standards for comprehensive system communication among all automatic components, including distributed energy resources, leads to market fragmentation, a major deterrent to smart-grid pro-gress. The IEC 6/850 standard for substations is a valuable first step, but it falls short of addressing the interoperability requirements raised by the modernization of the entire electricity delivery system.
Cyber-security solutions. As the control system becomes more auto- •mated, cyber security becomes a pacing issue. Although numerous security products exist on the market today, each is designed to address a specific security concern and there is no “one-size-fits-all” solution. The security for this carrier control system must provide in-depth defense, by seamlessly integrating an array of technologies to ensure that the carrier is controlled safely, securely, and meets all reliability expectations at all times.
An additional advantage provided by smart-delivery systems is greater use of direct current. DC has several advantages for distribution net-works. DC-distributed links, for example, can supply power directly to digital devices at the customer’s site, and connect renewable energy resources, without the need for costly and inefficient individual DC-to-AC convertors. These DC-distributed links also increase reliability by redu-cing the spread of disturbances from one customer to another, while
enabling each facility to operate independently using distributed gener-ation and storage. Because of its cost-saving advantages, DC distribution is becoming more widely used, especially in high-technology facilities such as data centers. Several Japanese suppliers are actively marketing DC systems for broad commercial and residential applications. Portable computers, televisions, and game consoles are all powered by DC elec-tricity. Even washing machines, air conditioners, and fluorescent lamps convert AC into DC, and then convert it back to high-frequency AC with inverters.
Today’s bulk-electricity supply and delivery systems were typically designed and built with the primary objective of keeping pace with the rapid growth in demand associated with initial electrification. Those days are long over throughout the developed world, yet little has been done in most countries to update either the infrastructure or the busi-ness incentives to focus on efficiency and quality. The electricity meter, for example, still holds retail consumers hostage to an electricity sup-plier monopoly over which they have essentially no market leverage. Technology is available to break down this iron curtain meter, just as the internet transformed communications. And, like the internet, con-sumers, suppliers, and society alike will benefit from a differentiated, service-based market business model. The incentives should be to add maximum value to each electron, not to maximize the quantity of bulk electricity sold to captive consumers (Yeager, 2008 ).
One of the quickest and most effective ways to achieve the greatest con-sumer and community benefits from the smart grid is through the micro-grid – a small-scale, power-supply network, designed to provide power to a small community or a few buildings. Modern microgrids, utilizing smart grid technology, are an emerging distribution configuration. They offer significant economic and environmental benefits compared with the alternative of simply expanding the legacy electricity transmission and distribution systems. The benefits of microgrids include autonomy, stability, compatibility, flexibility, scalability, efficiency and economics. Microgrids can provide a superior match between electricity gener-ation and load. Thus, they have a low impact on the existing electricity delivery system, despite incorporating significant amounts of variable renewable energy resources, such as photovoltaics (PVs). Because small electricity generators are also close to the users in microgrids, any waste heat can be easily recovered, and total energy efficiencies in excess of 80% can be achieved. This compares very favorably with the 30% or less efficiency for a typical electricity-generation and delivery system today (Energy Business Reports, 2008 ).
A key feature of the microgrid is the seamless interconnection of sup-ply and demand. Particularly important here is the incorporation of buildings as suppliers, as well as users, of electricity. The sustainabil-ity implications here are profound because buildings are typically the largest users of electricity on a national scale, and thus also account for a large fraction of carbon emissions. Embedding intelligence into the physical fabric of each building allows all functions, appliances, and energy sources to “communicate” with one another, automatically

Chapter 15 Energy Supply Systems
1161
coordinating their activities for the greatest efficiency and economy. The result makes zero net-energy buildings a realistic goal in most regions of the world (Cheung and Wilshire, 2010 ; see also Chapter 10 ).
It is also becoming feasible to incorporate mobile electricity storage in the form of plug-in electric vehicles. Microgrids will enable an electricity delivery network strategy, where transportation can become an efficient energy-supply source, particularly during high-cost, peak-demand peri-ods. The essential enabling policy step to realize the full benefits of DG, microgrids and plug-in electric vehicles is time-of-use electricity pricing, which encourages consumers to be efficient and to take advantage of resulting savings.
In effect, the microgrid is a local electricity refinery, raising the reliabil-ity, efficiency, and quality of the electricity supply. Although a variety of microgrid ownership and operation alternatives are possible, micro-grids intrinsically lend themselves to local “co-operative” ventures, where consumers are also suppliers. Metering and billing arrangements are agreed on locally to reflect market needs within each microgrid. Microgrids can also take full advantage of currently commercial energy-storage technology, so as to accommodate rapid fluctuations in electri-city demand or supply.
Microgrid development in the United States has taken a somewhat different path from similar efforts in Japan and Europe. In the United States, the emphasis has been on compensating for the relatively poor reliability and power quality provided by the nation’s bulk-electricity supply system. This is in contrast to Europe and Japan, where incorpor-ating clean, distributed electricity generation has been emphasized. In other countries DG and microgrids are seen as a means of avoiding the costly upgrades of transmission lines that are nearing capacity limits due to increasing local demand. Microgrid development efforts in the United States have been led by the Consortium for Electricity Reliability Solutions (CERTS) and, more recently, the California Energy Commission (2008) and the Galvin Electricity Initiative (2010). Prototype microg-rid demonstrations range from the Fort Bragg military base in North Carolina to the Illinois Institute of Technology campus in Chicago. General Electric is also developing a Microgrid Energy Management framework to provide a unified control, protection, and energy man-agement platform.
In the EU, several major research efforts have been devoted to DG microgrids. Demonstration sites include Kathnos Island, Greece, and Mannheim-Wallstadt, Germany. Japan is also a leader in microgrid dem-onstration projects that generally emphasize ensuring that the variable power of distributed renewable energy does not degrade Japan’s out-standing electricity reliability and power quality.
In terms of the growing international concern regarding energy security and sustainability, modern microgrids are also attractive. In addition to providing a cost-effective approach to the modernization of transmission and distribution systems, they can be dispersed through the electricity
delivery system close to consumers, where they can protect against the failure of a large power plant or bulk-electricity transmission facility. They also diversify the energy resource base by incorporating distrib-uted renewable energy resources. However, clear policy and associated regulatory instruments are needed to capture the benefits of microgrids and to integrate them into existing electricity distribution networks. With a very high share of variable renewable energy sources, power balancing can become a huge challenge. Such a power-supply system would require the use of all potential balancing measures, including new transmission lines between regions, new flexible generating plants, demand-side management, energy storage, advanced weather forecast-ing, clear rules from the system operator, and the use of existing distrib-uted resources within the system.
End-users have the potential to contribute to system balancing. Several types of demand, notably electric heating and cooling systems, can be operated in a flexible manner that responds to signals from the power company. As the number of small-scale DG units increases, many of these can also be used in ways that help balance the system. Future storage technologies, such as electric vehicle batteries, also have the potential to act as flexible balancing measures.
Power systems are currently undergoing some fundamental changes in structure and operation. These changes are associated not only with the rapidly increasing amounts of renewable energy being connected to the system, but also with the development of new types of production and end-use technologies. One such change is a general increase in the number of distributed production units that are smaller in scale than traditional thermal power plants. This development will, in the future, include low-voltage connections from micro-CHP plants in individual households. On the low-voltage side, another important trend is the active control of demand, which introduces a new way to provide some of the necessary flexibility in power balancing (UNEP, 2007 ).
In parallel with this development is the increased use of Information and Communications Technologies (ICT). The communications capabilities of electric devices are expanding rapidly while also becoming cheaper. This enables a power system which incorporates two-way communication with end-users, and is therefore one of the most important enabling technologies for future power systems. Advances in measuring technol-ogy and advanced computational methods, e.g., for predicting weather, energy demand, and price, create new ways to control the entire power system (Larsen and Petersen, 2009 ).
Few countries have a comprehensive and coordinated set of policies and incentives to promote micro-grids. Subsidies for renewable dis-tributed generation, utility revenue decoupling, time-of-use pricing, and independent zero-energy districts all act as enablers for microgrid development.
Distributed generation comprises the cornerstone of the new microgrid paradigm. While CHP units will certainly play a role, the escalation of

Energy Supply Systems Chapter 15
1162
renewable distributed generation will be the focal point. The microgrid development model allows the ability to maximize value from private customer investments. By far the largest and most important renewable distributed generation technology is distributed photovoltaics. Germany in particular has set the most aggressive goal, aiming to generate 25% of its total electricity capacity from solar photovoltaics. This level of penetration will require microgrid-like controls and management. Small wind turbines are also becoming a more important energy asset ena-bled by microgrids. Micro-scale energy-storage systems, particularly bat-teries, complement intermittent renewable energy sources and are also considered a key immediate driver of microgrids. These storage systems offer clear economic benefits for renewable distributed generation. When the sun is shining or the wind is blowing, a storage system builds up the electricity reserve for sale or dispatch.
Since the interest in smart-grid technologies is in dramatic ascent, microgrids are attracting considerable attention from both policy and investment sectors. While much of Europe and Japan have upgraded their grid infrastructure, these countries have traditionally emphasized more aggressive policy support for the distributed generation tech-nologies that are driving the acceleration of microgrid developments. That said, Japan and Korea, two leaders for microgrid technology, enjoy power surpluses and therefore have limited need for microgrids today. However, within the next five years, the new generation of microgrid configurations is expected to be fully commercial, setting the stage for major global commercialization progress. Elsewhere around the world, Denmark and China are leaders in the microgrid market. An important economic advantage of microgrids is related to the payback period. Estimates of paybacks for microgrids range from two to five years. Renewable energy microgrids also offer increased co-benefits such as improved health, employment, rural development, system reliability and avoided transmission infrastructure, compared to traditional utility power, with non-renewable microgrids offering a benefit rate of three-to-five-fold over today’s basic grid services (Lovins and Cohen, 2010 ).
15.8.4 Storage
Unlike other energy forms, electricity cannot be easily stored in large quantities where hydro capacity is not available. Without storage, there is little flexibility in managing electricity production and deliv-ery, or in seamlessly linking electricity supply and end-use. Likewise, variable renewable energy resources are constrained in their abil-ity to enter the bulk-electricity market and keep pace with continu-ously changing demands. Advanced storage technologies promise to change the nature of electricity markets by providing much greater operational and financial flexibility, and enabling carrier systems to resolve system transients and bottlenecks. The critical pacing issue is the accelerated development and implementation of more cost-effective, higher-capacity storage options, including batteries, flywheels, supercapacitors, hydrogen, and superconducting systems. Today, most of these bulk-storage options are relatively unproven, and their value
proposition is complex and poorly understood (National Academy of Sciences, 2009 ).
Currently, the only battery commercially available for large-energy stor-age is the lead-acid battery. Advanced batteries being developed for large-scale applications, include nickel cadmium, sodium sulfur, sodium nickel chloride, lithium ion, and zinc bromine. Although considerable pro-gress is being made, these generally remain too expensive for large-scale applications. The first of these advanced batteries is anticipated to be fully commercialized in the very near future, and significant cost reduc-tions are expected as modular design and factory assembly become the norm, and production volumes increase substantially. Particularly not-able from a strategic perspective are the lithium-ion battery (for electric vehicles) and the sodium sulfur battery. Japan has demonstrated a total of more than 20 MW of energy storage using sodium sulfur batteries. In August 2003, the world’s largest battery energy-storage system began operating in Fairbanks, Alaska, using nickel-cadmium cells to generate 40 MW for up to seven minutes at an installed cost of US$35 million.
Over the long term, energy storage can potentially resolve the intermit-tency challenge of renewable energy. The types of storage under consid-eration range from pumped hydro and compressed air energy storage to advanced, stationary batteries. A notable example of wind-hydro syn-ergy is Denmark’s grid: this can absorb a great deal of wind because of its strong electricity transmission ties to the hydroelectric systems in Norway, Germany, and Sweden. In the absence of storage, the alterna-tive today is to locate conventional fossil-fired power generation near to the variable renewable energy resource. This, of course, diminishes the environmental value of the renewable energy resource and raises the competitive hurdle.
Energy carriers such as hydrogen and ethanol may become important in interconnection and the storage of energy from renewable energy sources, and they have the potential to provide the interface for renew-able energy sources to mobile users.
Hydrogen is an important implicit dimension of the ultimate “electri-fied world” scenario. The electro-hydrogen economy refers to hydrogen being generated from low-cost, clean, off-peak electricity generation, and stored and delivered as feedstock to fuel transportation, electricity generation, and industrial processes.
15.8.5 Policy and Investment Considerations
The transition to a greater use of locally distributed generation will increasingly make the local microgrid the design and operational focus of electricity supply systems, and the entire enterprise must be rede-signed accordingly. The 20th century principle that an electric utility is a vertically integrated, natural monopoly has been slowly evolving under the pressure of technological progress and deregulation. Unfortunately, much of the world is still laboring under an electricity regulatory

Chapter 15 Energy Supply Systems
1163
structure. This maintains an obsolete business model with incentives to simply produce and deliver more commodity electricity, rather than compensating suppliers based on the efficiency and reliability of their electricity services.
Market reform for electricity supply and delivery is a relatively new ini-tiative now being applied in a variety of situations throughout the devel-oped world. As a result, sufficient experience has been gained to begin to evaluate its advantages and disadvantages as a tool in achieving universal, sustainable, global electrification. The potential of decentral-ized competitive markets to match supply and demand most efficiently is a well-proven principle at the heart of the developed world’s commer-cial economic system; based on that success, it is rapidly becoming the standard for economic systems around the world.
Nonetheless, the application of market-based liberalization to the elec-tricity sector over the past decade has had mixed results. Particularly with regard to developing regions of the world, it is important to con-sider the lessons learned and the possible causes of this checkered per-formance. Does this simply reflect a learning curve, or are there some basic limitations in applying market reforms to the electricity sector? The reforms in place typically bear little resemblance to the theoret-ical, market-oriented ideal. Certainly, the critical values of electricity to economic prosperity and societal welfare make it unusually susceptible to political manipulation, irrespective of governmental structure or the level of economic development (Smil, 2005 ).
What then can be concluded about the role of market reform in facilitat-ing global electrification? Because surplus electricity supply is, by defin-ition, not a circumstance facing the developing world, it is doubtful that market reform as it has been widely applied in much of the developed world, will stimulate investment on the scale required. Certainly, its ini-tial applications have failed. Market reform is primarily a tool depend-ent on the more fundamental conditions of national performance. These include governmental and institutional stability, the rule of law, and sound fiscal policies. In the absence of these conditions, no amount of market reform is likely to make a difference. Where these conditions do exist, market reform can be valuable if applied to achieve its intended purpose – sustainable economic development and efficiency.
One interesting variation on market reform is the local market paradigm emerging in many rural regions of the developing world, where electrifi-cation is being initiated from the bottom-up, rather than the top-down, through village-scale microgrids under local management and control. These local cooperatives provide the direct consumer access and mar-ket transparency that top-down systems generally lack and – by virtue of their politically based institutions and commodity business culture – have great difficulty in achieving. The process of local rural electrification, whereby these distributed “PC-like” microgrids seek to network with each other to expand their capability, is also a fertile context for extend-ing the locally established market culture. All other factors being equal, perhaps the most important advantage in building markets from the
ground up, relative to reforming the status quo, is the more encouraging environment they may produce for both innovation and investment.
The lessons learned about what works and what does not show that nei-ther the central planning approach of the 1950s and 1960s, nor the min-imal government, free-market approach broadly advocated over the last 20 years will necessarily be successful. The most effective approaches to electrification will be led by the private sector in most cases, but with a stable governance framework that facilitates physical infrastructure and human capital investments, along with the social cohesion necessary for economic development and poverty reduction. Institutional devel-opment has too often been neglected in past policy discussions, but it is essential to achieve energy access and sustained poverty reduction. Successful development of this new paradigm will therefore depend on a robust, strategic public-private partnership for global development (Yeager, 2007 ).
Global electrification-related policies must become better at anticipat-ing and synthesizing the revolutionary, disruptive changes underway in demographics, technology, communications, and commerce, which are currently shaping global politics, and energy and overall security in the 21st century. Because of these changes, people’s aspirations – to exer-cise their free will and transform their lives – are rising in all corners of the globe. Policymakers must also recognize that progress is not auto-matic. The course of this century will be fraught with great risks. These must be wisely managed as we aim for the unambiguous goal of enab-ling universal wellbeing, a goal that must also be sustainable within our evolving civilization. A policy of universal electrification is the necessary energy foundation on which to resolve the pacing global “trilemma” of people, poverty, and pollution, and most importantly, to avoid failed aspirations that create intolerable levels of frustration, despair, and anger (see also Chapter 23 ). Failure is not an option and hope is not a strategy for addressing this global survival challenge (Patterson, 2009 ).
Impatience for immediate results that maximize short-term commer-cial returns is a lever of vulnerability impeding global electrification and modernization. Reviving the commitment to strategic investment in human and capital infrastructure is essential to sustainable global development and wellbeing, and the public-private partnerships and policies needed to realize this survival goal must be given renewed pri-ority. Integral to this priority is the urgent need to boost development and investment in advanced energy technologies. The lag time between research and large-scale commercial deployment is sobering, yet fund-ing for energy R&D continues to decline.
“Civilizations decline when they stop the application of surplus to new ways of doing things. In modern terms we say the rate of investment decreases. This happens because the social groups controlling the surplus have a vested interest in using it for non-productive but ego-satisfying purposes … which distribute the surpluses to consumption but do not provide more effective methods of production” (Huntington, 1998 ).
Energy Supply Systems Chapter 15
1164
15.9 Hydrogen
15.9.1 Overview
Hydrogen is a substance that may be used as an energy carrier and as a storage medium. Although hydrogen is the most abundant element in the universe, it does not exist in pure concentrations of its elemental form or as molecular hydrogen on earth. Hydrogen is abundant in the molecular structure of coal, petroleum, natural gas, biomass, and water and can be produced from these materials. Hence, hydrogen is not a source of energy, but energy is required to separate hydrogen from any of these hydrogen-containing materials. In principle, the energy source for the production of hydrogen may be any of the fossil fuels, nuclear, or renewable energy forms, although using nuclear or renewable energy enables a straightforward route to low-carbon and sustainable hydro-gen, although likely at some additional cost.
Hydrogen as a complimentary energy medium offers clear benefits to the world’s future energy economy. However, the potential for the hydrogen revolution still remains a speculative vision. Not the least of the challenges is the high energy-losses involved in producing hydro-gen, which means that this system demands plentiful, low-cost electri-city. The long-term goal is to achieve an emission-free energy system. Since the synthetic hydrogen energy carrier cannot be cleaner or more efficient than the energy from which it is produced, this means renew-able or nuclear energy. High temperature gas-cooled reactors with the ability to operate at core outlet temperatures of 850ºC or above could, for example, be used to drive a variety of thermal processes for hydro-gen as well as electricity production. Fuel cells are projected as the primary end-user for hydrogen with water as the byproduct. A mega-infrastructure in which liquid hydrogen pipelines also act as the cryo-genic vehicle for the superconducting, zero-resistance transmission of electricity is certainly an exciting opportunity for the second half of the 21st century.
Hydrogen can be used in the same way as other gaseous fuels in com-bustion, or in an engine for conventional power generation, such as automobile engines and power-plant turbines. The current use of hydro-gen engines is a relatively well-developed technology in the United States, with the space shuttle and unmanned engines. Vehicles with hydrogen-fueled internal combustion engines are now in the demon-stration phase. However, the highest value use of hydrogen is in fuel cells, which are relatively cleaner and more efficient than conventional technologies, including onsite generation for individual homes and for businesses. Hydrogen in a fuel cell produces electricity and water with zero greenhouse-gas emissions, and efficiencies greater than when hydrogen is used in an engine.
Fuel cells are in various stages of development and efficiencies are generally in the 40 to 50% range. Phosphoric-acid fuel cells are the most developed fuel cells for commercial use. Many stationary units have been installed to support the grid with reliable backup power,
and mobile units are powering buses and other large vehicles. Solid oxide and molten carbonate fuel cells operate at high temperatures and are therefore best in generating electricity in stationary, combined-cycle applications, and applications in which the excess heat can be used for cogeneration of electricity or as process heat. They are also a good fit for portable power and transportation applications, especially large trucks. Alkaline fuel cells have been used in military applications and space missions and are currently being tested for transportation applications. Polymer electrolyte membrane (PEM) fuel cells operate at low temperatures and are being demonstrated in transportation, stationary, and portable applications. Interest in PEM fuel cells has experienced a large upsurge over the past few years, and most major automobile manufacturers are developing fuel cell cars at the demon-stration stage.
Nearly all major automobile manufacturers have a hydrogen fuel vehicle program, with various targets for demonstration. The early fuel cell dem-onstrations will consist of fleets of between 10 to 150 vehicles. To limit initial capital investment, these early vehicles were deployed in fleets with a centralized or shared refueling infrastructure. Hydrogen-fueled internal combustion engine vehicles are generally viewed as a near-term, lower-cost option, which can foster the development of a hydro-gen infrastructure.
Stationary power production includes backup power units, grid man-agement, power for remote locations, stand-alone power plants, DG, and cogeneration (see, for example, USDOE, 2002 and USDOE, 2007 ). The industry for commercial fuel cells for stationary applications is still in its infancy. Most existing fuel-cell systems are being used in com-mercial settings and operate on hydrogen reformed onsite from natural gas. Extensive use in this setting would require widespread availability of hydrogen.
The development of hydrogen as an energy carrier and storage media requires the evolution of technology for a new infrastructure consisting of three system elements: (1) conversion; (2) transmission and distribu-tion; and (3) storage (see also Chapters 12 and 13 ).
15.9.2 Conversion
Hydrogen can be produced using any of the fossil fuels, nuclear power, or renewable energy, and be derived from any of the feedstock mate-rials coal, petroleum, natural gas, biomass, or water. Most hydrogen produced today in the United States is used for chemical production, petroleum refining, metal treating, and electrical applications. Thus, hydrogen is primarily used as a feedstock, intermediate chemical, or as a specialty chemical. Steam reforming of natural gas accounts for 95% of the hydrogen produced in the United States. The least costly route to produce hydrogen is steam reforming of natural gas and is carried out in large, centralized facilities with carbon dioxide as the principle byproduct (USDOE, 2002 ; 2007 ).

Chapter 15 Energy Supply Systems
1165
Challenges include:
high hydrogen conversion costs, • low demand inhibiting development of production, and • current technologies are not optimized for making hydrogen and •produce large quantities of carbon dioxide.
Research, development, and demonstrations are needed to provide innovative methods of economically producing hydrogen. There is a portfolio of existing commercial processes such as steam reform-ing, multi-fuel gasifiers, and electrolyzers, and on the development of advanced techniques such as biomass pyrolysis and nuclear water split-ting, photoelectrochemical electrolysis, and biological methods which are all promising options for the future. Renewable energy pathways offer a variety of carbon-free hydrogen that are generally longer-term but promising options ( Figure 15.12 ).
The paths forward are different for each of the hydrogen technology areas, but recommendations for policy actions include maintaining a stable research and development funding base, providing incentives for pilot and demonstration scale tests and operating facilities, and provid-ing market incentives as the technologies show promise.
15.9.3 Transmission and Distribution
A key element of the hydrogen-energy infrastructure is the delivery system that transports hydrogen from the point of conversion to end-use. For cur-rent applications, pipeline or trucks hauling high-pressure cylinders or cryo-genic tankers are used. Rail cars or barges ship a small amount. Pipelines are currently limited to a few areas of the United States and other OECD nations where large refineries and chemical plants are concentrated and are owned and operated by merchant hydrogen producers.
The vision for hydrogen transmission and distribution is a network or infrastructure to accommodate both centralized and decentralized
production facilities. Pipelines could transport hydrogen to high demand areas, and trucks and rail cars will distribute hydrogen to rural and other low demand areas. Onsite hydrogen conversion and distribution facilities could be built where demand is high enough to sustain operations.
The path forward is to enhance current transmission and distribution systems for safe and affordable operations through policy actions such as increasing research and development on delivery systems, develop-ing a cost analysis of hydrogen transmission and distribution systems, and providing incentives and funding for hydrogen delivery demonstra-tions, such as fueling stations and power parks, in order to evaluate the hydrogen infrastructure components.
15.9.4 Storage
Storage issues cut across the conversion, transmission and distribution, and energy end-use pathways for the use of hydrogen as an energy car-rier. Vehicle applications drive the development of safe, space-efficient, and cost-effective storage systems. However, other applications will benefit from all the technological advances made for these on-vehicle hydrogen storage systems (US DOE, 2002 ; 2007 ).
Hydrogen can be stored as a gas, liquid, or chemical compound. Technologies that are currently available permit the physical storage, delivery, and end-use conversion of gaseous or liquid hydrogen in tanks and pipeline systems. Compressed gaseous hydrogen storage is a mature technology and adequate vehicle range can be achieved, but with a sig-nificant volume and weight penalty. Liquid hydrogen requires less stor-age volume than gas, but requires cryogenic temperatures and associated insulated containers. The liquefaction of hydrogen is an energy-intensive process and results in energy losses up to approximately one-third of the energy content of the hydrogen. Other technologies in the early stage of development are reversible metal hydrides or absorption on carbon structures. Hydrogen is absorbed and released from these materials by relatively modest changes in temperature or pressure. Chemical hydrides are also being investigated as a hydrogen-storage alternative.
The vision for hydrogen storage is to achieve relatively lightweight, low cost, and low volume hydrogen-storage devices to meet the hydrogen-economy needs. Compressed hydrogen storage is a mature technology and adequate range can be achieved; however, an even better storage method would be desirable. Several automobile manufacturers are con-sidering liquid-hydrogen storage because of its good volumetric stor-age efficiency. However, the special handling requirements, long-term storage losses, and cryogenic liquefaction energy requirements currently detract from its commercial viability. Metal hydrides offer the advantage of lower-pressure storage, comfortable shapes, and reasonable volumet-ric-storage efficiency.
Before hydrogen can become an acceptable energy option for the con-sumer the technology must be made transparent to end-use, similar to
Renewable Energy
Heat Biomass
Mechanical Energy
Thermolysis
Hydrogen
Electricity
Electrolysis
Conversion
Photolysis
Figure 15.12 | Renewable paths to hydrogen.
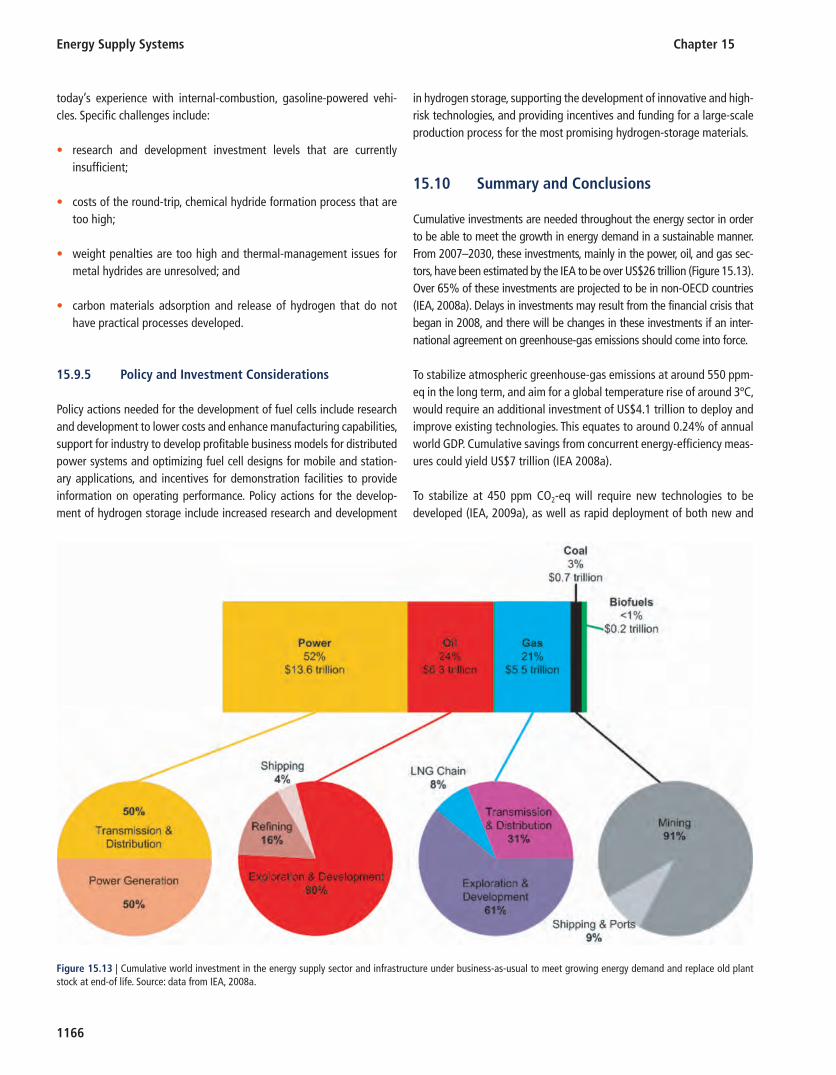
Energy Supply Systems Chapter 15
1166
today’s experience with internal-combustion, gasoline-powered vehi-cles. Specific challenges include:
research and development investment levels that are currently •insufficient;
costs of the round-trip, chemical hydride formation process that are •too high;
weight penalties are too high and thermal-management issues for •metal hydrides are unresolved; and
carbon materials adsorption and release of hydrogen that do not •have practical processes developed.
15.9.5 Policy and Investment Considerations
Policy actions needed for the development of fuel cells include research and development to lower costs and enhance manufacturing capabilities, support for industry to develop profitable business models for distributed power systems and optimizing fuel cell designs for mobile and station-ary applications, and incentives for demonstration facilities to provide information on operating performance. Policy actions for the develop-ment of hydrogen storage include increased research and development
in hydrogen storage, supporting the development of innovative and high-risk technologies, and providing incentives and funding for a large-scale production process for the most promising hydrogen-storage materials.
15.10 Summary and Conclusions
Cumulative investments are needed throughout the energy sector in order to be able to meet the growth in energy demand in a sustainable manner. From 2007–2030, these investments, mainly in the power, oil, and gas sec-tors, have been estimated by the IEA to be over US$26 trillion ( Figure 15.13 ). Over 65% of these investments are projected to be in non-OECD countries (IEA, 2008a ). Delays in investments may result from the financial crisis that began in 2008, and there will be changes in these investments if an inter-national agreement on greenhouse-gas emissions should come into force.
To stabilize atmospheric greenhouse-gas emissions at around 550 ppm-eq in the long term, and aim for a global temperature rise of around 3ºC, would require an additional investment of US$4.1 trillion to deploy and improve existing technologies. This equates to around 0.24% of annual world GDP. Cumulative savings from concurrent energy-efficiency meas-ures could yield US$7 trillion (IEA 2008a ).
To stabilize at 450 ppm CO 2 -eq will require new technologies to be developed (IEA, 2009a ), as well as rapid deployment of both new and
Figure 15.13 | Cumulative world investment in the energy supply sector and infrastructure under business-as-usual to meet growing energy demand and replace old plant stock at end-of life. Source: data from IEA, 2008a .

Chapter 15 Energy Supply Systems
1167
existing technologies (see Figure 15.10 ). An additional investment of US$2.7 trillion in more energy-efficient equipment, buildings, and appli-ances, together with US$2.4 trillion in low-carbon, power-generation capacity would be needed, in total equating to around 0.55% of annual world GDP by 2030. Cumulative savings would again help offset the investment costs. The GEA pathways estimates required investment needed to achieve less than 2°C compared with preindustrial times to be between US 2005 $68–87 trillion or US 2005 $1.7–2.2 trillion/yr or about 1.8–2.3% of global GDP (see Figure 17.26 , Chapter 17 ).
Different models and pathways all show the importance of investment in renewable and end-use technologies to reach climate targets. The IEA and GEA analyses show that investments in power-generation energy technologies are necessary for all fuels, but with less emphasis on coal and gas (other than CCS) and more on renewable and nuclear (IEA, 2009a ). The same investment strategy applies to end-use technologies, such as heating/cooling and conversion for transport fuels, biofuels, or hydrogen fuel cells. GEA pathways show in addition that the transform-ation toward the targets would be more cost-effective under pathways that focus on efficiency improvements.
15.11 Insights
In the 21st century, with a population approaching 10 billion people, it is essential that no energy resource be overlooked. By mid-century, at least two-thirds of the world’s population is projected to be con-centrated in urban locations (see Chapter 18 ). This underscores the importance of considering all sources of energy and their conversion, transmission, and perhaps most importantly, energy end-use efficiency improvements. With many and varied energy sources available, it is end-use utilizations of energy that have the most potential to achieve energy and energy-system sustainability.
In addition to energy sources, sustainable methods for conversion to carriers, along with transmission and distribution systems that can be employed for the most important end-uses, are crucial. This places particular emphasis on energy carriers to move energy from relatively remote production locations to growing urban population centers. Natural gas, as a lower-carbon fossil fuel and energy carrier, could in some situations be a bridge to the low-carbon future.
Electricity and hydrogen can be efficiently used and are critical to the availability of affordable and acceptable energy. Markets and the scale of international carbon trading will determine how much of each tech-nology is employed in each geographic region, when this happens, and how rapidly. Heat is important to industrial processes, as well as for residential and commercial uses, and should be employed wherever feasible.
Providing integrated storage systems for this energy is essential for mak-ing optimal use of the energy sources and carriers that exist. If affordable,
these energy-storage systems are key to achieving a sustainable system that is also economic and secure, and under minimum stress.
The entire energy grid for each system, from energy source through conver-sion to end-use must be optimized into smart grids. These will use the latest ICT in order to transition to a digital system that communicates between source and end-use continuously, employing all energy carriers and their transmission and distribution systems, heat, electricity, and hydrogen in a coordinated fashion. In this way, the operation of the entire energy system can be optimized to take advantage of the qualities, efficiencies, and prod-uctivity of each component. The production of hydrogen from surplus elec-tricity in off-peak periods, and its conversion back to electricity for lighting or mobility, is just one example; all combinations become possible.
The capacity for competitive markets to match supply and demand most efficiently is at the heart of the developed world’s economic system – and means that this model is rapidly becoming the standard for eco-nomic systems around the world. These markets will also most likely determine the future of decentralized grids worldwide.
In countries with well-developed energy markets, liberalization has often been imposed, along with privatization, unbundling, and enabling con-sumers to choose energy suppliers. This has led to spot-market energy trading, with the result that long-term contracts are less often the norm. The result for energy supplying countries is generally negative, as it becomes more difficult to ensure returns on large-scale investments. There is thus a threat of destroying the financing tools for large capital-intensive projects in the critical energy-supplying countries (see also Chapter 22 ).
15.11.1 Conclusions
The private sector will lead in developing and deploying most of the effect-ive approaches, but will need a stable governance framework, facilitation of physical infrastructure, capital investments, and the social cohesion neces-sary for economic development and poverty reduction, while protecting public health and the environment. Success depends on the implementa-tion of robust, global public-private partnerships that can achieve unpre-cedented cooperation and integration between governments, between businesses, and between governments and businesses. To have an effect on the changing and growing energy sector, this must happen rapidly.
In order to improve current energy systems, and their capacity to meet rapidly changing needs, it is essential to boost development and investment in advanced energy-sector technologies and integrated systems, from the energy source, through conversion and transmis-sion, to distribution and end-use. The lag time between research and large-scale commercial deployment is long, and funding for energy RD&D continues to decline worldwide. This trend should be reversed with enhanced cooperation between private businesses, between public agencies, as well as between the public and private sectors (see also Chapter 24 ).
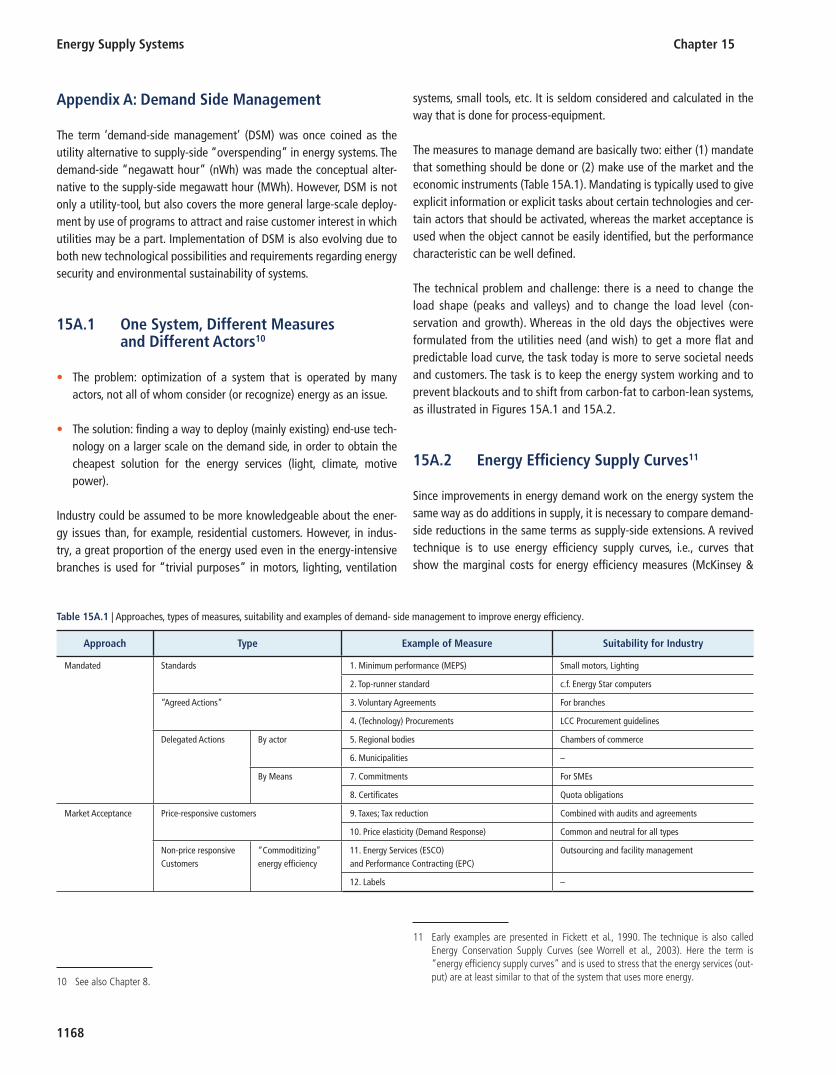
Energy Supply Systems Chapter 15
1168
Appendix A: Demand Side Management
The term ‘demand-side management’ (DSM) was once coined as the utility alternative to supply-side “overspending” in energy systems. The demand-side “negawatt hour” (nWh) was made the conceptual alter-native to the supply-side megawatt hour (MWh). However, DSM is not only a utility-tool, but also covers the more general large-scale deploy-ment by use of programs to attract and raise customer interest in which utilities may be a part. Implementation of DSM is also evolving due to both new technological possibilities and requirements regarding energy security and environmental sustainability of systems.
15A.1 One System, Different Measures and Different Actors 10
The problem: optimization of a system that is operated by many •actors, not all of whom consider (or recognize) energy as an issue.
The solution: finding a way to deploy (mainly existing) end-use tech- •nology on a larger scale on the demand side, in order to obtain the cheapest solution for the energy services (light, climate, motive power).
Industry could be assumed to be more knowledgeable about the ener-gy issues than, for example, residential customers. However, in indus-try, a great proportion of the energy used even in the energy-intensive branches is used for “trivial purposes” in motors, lighting, ventilation
systems, small tools, etc. It is seldom considered and calculated in the way that is done for process-equipment.
The measures to manage demand are basically two: either (1) mandate that something should be done or (2) make use of the market and the economic instruments (Table 15A.1). Mandating is typically used to give explicit information or explicit tasks about certain technologies and cer-tain actors that should be activated, whereas the market acceptance is used when the object cannot be easily identifi ed, but the performance characteristic can be well defi ned.
The technical problem and challenge: there is a need to change the load shape (peaks and valleys) and to change the load level (con-servation and growth). Whereas in the old days the objectives were formulated from the utilities need (and wish) to get a more fl at and predictable load curve, the task today is more to serve societal needs and customers. The task is to keep the energy system working and to prevent blackouts and to shift from carbon-fat to carbon-lean systems, as illustrated in Figures 15A.1 and 15A.2 .
15A.2 Energy Effi ciency Supply Curves 11
Since improvements in energy demand work on the energy system the same way as do additions in supply, it is necessary to compare demand-side reductions in the same terms as supply-side extensions. A revived technique is to use energy effi ciency supply curves, i.e., curves that show the marginal costs for energy effi ciency measures (McKinsey &
10 See also Chapter 8 .
Table 15A.1 | Approaches, types of measures, suitability and examples of demand- side management to improve energy effi ciency.
Approach Type Example of Measure Suitability for Industry
Mandated Standards 1. Minimum performance (MEPS) Small motors, Lighting
2. Top-runner standard c.f. Energy Star computers
“Agreed Actions” 3. Voluntary Agreements For branches
4. (Technology) Procurements LCC Procurement guidelines
Delegated Actions By actor 5. Regional bodies Chambers of commerce
6. Municipalities –
By Means 7. Commitments For SMEs
8. Certifi cates Quota obligations
Market Acceptance Price-responsive customers 9. Taxes; Tax reduction Combined with audits and agreements
10. Price elasticity (Demand Response) Common and neutral for all types
Non-price responsive Customers
“Commoditizing” energy effi ciency
11. Energy Services (ESCO) and Performance Contracting (EPC)
Outsourcing and facility management
12. Labels –
11 Early examples are presented in Fickett et al., 1990 . The technique is also called Energy Conservation Supply Curves (see Worrell et al., 2003 ). Here the term is “energy effi ciency supply curves” and is used to stress that the energy services (out-put) are at least similar to that of the system that uses more energy.

Chapter 15 Energy Supply Systems
1169
Company, 2010 ). Energy Effi ciency Cost (EEC) is calculated as the full cost of the alternatives minus the full cost of the reference solution di-vided by the annual energy savings, where:
Full cost includes annualized capital costs over the improvement •expected life-time (LCC)
The reference solution is often the installed one and does not carry •further capital costs
Changes in operating and maintenance costs are included in full costs, which also includes the cost for energy supply of each of the alter-natives. Transaction costs are not included. Subsidies are generally not included, but could be added, depending on the purpose of the calculation.
Changes in productivity can be added in this calculation. This normal-ly means a further reduction of the cost, since the basic assumption is that the pure energy services should be at least equal in the com-parison.
With this formulation all economically attractive alternatives have neg-ative costs.
The critique comprises two elements:
Even when a calculation can show good reasons, from the point of •view of the economic life-cycle, to undertake energy efficiency meas-ures, it can still make sense for a single company to hesitate. The com-pany may have severe difficulties and need to overlook the longer life-time of the alternative. On the other hand, they can make severe losses paying for wasted energy if they are too strict in their require-ments for pay-back.
Transaction costs and also costs for delivery of energy-efficiency •measures can be quickly and substantially lowered by the “market learning process”, when customers begin to demand the alterna-tive. A programmed DSM-activity can be very useful in this process.
DSM, as a form for programmed large-scale deployment, is a useful measure to both lower the transaction costs and to release the market learning that facilitates the dissemination of cost-effi cient technologies to the markets. The profi table effi ciency improvements (having negative costs) are often in the range of 20–50% of the energy use. The major part of these will remain locked in without DSM-programs.
15A.3 DSM Formats
The implementation and utilization of DSM will be different in different parts of the world. In some places governments will be the operation-al agent, in others utilities – in some cases regulated by governments and in others operation in the free market. In any case, it is important that governments set the rules, enforce them. Rules must also not be changed very often so as to attract capital investments.
An excellent overview of the implementation of DSM, with examples from different regions and from the perspective of various government, business and consumer interests, along with costs and benefi ts of vari-ous approaches, can be found in IEA ( 2008b ).
Figure 15A.1 | Load shape changes. Source: Gellings, 1982 .
StrategicConservation
StrategicLoad Growth
System shiftCarbon Fat
Carbon Lean
Figure 15A.2 | Load level changes. Source: Gellings, 1982 .

Energy Supply Systems Chapter 15
1170
References
Adachi , Y. , M. Komoto , I. Watanabe , Y. Ohno and K. Fujimoto , 2000 : Effective
Utilization of Remote Coal through Dimethyl Ether Synthesis . Fuel , 79 (3–4):
229 – 234 .
Amin , M. , 2008 : Interview with Massoud, Amin, “ Upgrading the Grid ” . Nature , 454 :
570 – 573 .
Awerbuch , S. , 2006 : Portfolio-Based Electricity Generation Planning: Policy
Implications for Renewables and Energy Security. Mitigation and Adaptation
Strategies for Global Change , 11 (3): 693 – 710 .
BP , 2010 : Statistical Review of World Energy 2010 . BP plc., London, UK .
BP, 2011 : Statistical Review of World Energy 2011 . BP plc., London, UK .
Cheung , A. and M. Wilshire , 2010 : White Paper from Consortium on Digital Energy
2009 – 2010 . Bloomberg New Energy Finance , London, UK .
Chiesa , P. , 2003 : Co-Production of Hydrogen, Electricity and Co2 from Coal Using
Commercially Ready Technology. Second Annual Conference on Carbon
Sequestration: Developing & Validating the Technology Base to Reduce Carbon
Intensity , Alexandria, VA, USA .
Chuang , A. , J. Hughes , M. McGranaghan and X. Mamo , 2008 : Integrating New
and Emerging Technologies into the California Smart Grid Infrastructure . CEC-
500-2008-047, Electric Power Research Institute (EPRI) and the California Energy
Commission , Palo Alto and Sacramento, CA, USA .
Cicchetti , C. J. and C. M. Long , 2003 : Restructuring Electricity Markets: A World
Perspective Post-California and Enron. Visions Communications , New York,
USA .
Dry , M. E. , 2002 : High Quality Diesel Via the Fischer – Tropsch Process – a Review.
Journal of Chemical Technology & Biotechnology , 77 (1): 43 – 50 .
EIA , 2006 : U.S. Underground Natural Gas Storage Developments: 1998 – 2005 .
Offi ce of Oil and Gas, Energy Information Administration , Washington, D.C.,
USA .
EIA , 2009 : International Energy Outlook 2009 . Report No. DOE/EIA-0484(2009),
United States Energy Information Administration (EIA) , Washington, D.C., USA .
EIA , 2011 : International Coal Imports and Exports . www.eia.doe.gov/emeu/inter-
national/coaltrade.html (accessed 28 February, 2011).
Energy Business Reports , 2008 : Microgrids Market Potential. Energy Business
Reports , Anthem, AZ, USA .
EPRI , 2003a : Electricity Technology Roadmap: Power Delivery and Markeys . Product
No. 1009321, Electric Power Research Institute , Palo Alto, CA, USA .
EPRI , 2003b : Electricity Technology Roadmap: Meeting the Critical Challenges of
the 21st Century – 2003 Summary and Synthesis . Product No. 1010929, Electric
Power Research Institute (EPRI) , Palo Alto, CA, USA .
EPRI , 2010 : Distributed Energy Storage Systems Testing and Evaluation 2010 Interim
Results . Product No. 1020079, Electric Power Research Institute , Palo Alto, CA,
USA .
ETSO , 2007 : The European Wind Integration Study (Ewis) Towards a Successful
Integration of Wind Power into European Electricity Grids, Phase 1 . Final Report,
European Transmission System Operators (ETSO) , Brussels, Belgium .
European Commission , 2007 : Energy Sector Inquiry . DG Competition Report,
SEC(2006) 1724, Energy, Basic Industries, Chemicals and Pharmaceuticals ,
Brussels, Belgium .
Fickett , A. P. , C. W. Gellings and A. B. Lovins , 1990 : Effi cient Use of Electricity.
Scientifi c American , 263 (3): 64 – 68, 71 – 74 .
Fritsche , U. R. , R. E. H. Sims and A. Monti , 2010 : Direct and Indirect Land-Use
Competition Issues for Energy Crops and Their Sustainable Production – an
Overview. Biofuels, Bioproducts and Biorefi ning , 4 (6): 692 – 704 .
Galvin , R. and K. Yeager with J. Stuller , 2009 : Perfect Power , McGraw-Hill , New
York , 37–38.
GBEP , 2011 : Global Bioenergy Partnership . Rome, Italy . http://www.globalbioenergy.
org/ .
Gellings , C. W. , 1982 : Load Shape and Level Changes . In H. Nilsson , Demand Side
Management (DSM) – A Renewed Tool for Sustainable Development in the 21st
Century (2007), FourFact, Stockholm , Sweden .
Gellings , C. , 2011 : Estimating the Costs and Benefi ts of the Smart Grid: A Preliminary
Estimate of the Investment Requirements and the Resultant Benefi ts of a Fully
Functioning Smart Grid , Electric Power Research Institute Technical Report ,
Product ID 1022519, Palo Alto, CA, USA , March 2011.
Geometrica , 2006 : Geodesic Domes for Storing Coal, Petcoke and Other Combustible
Bulk Materials . www.coalstorage.com/ (accessed 28 February, 2011).
Gudmundsson , J. S. and M. Mork , 2001 : Stranded Gas to Hydrate for Storage
and Transport. International Gas Research Conference , Amsterdam , the
Netherlands.
Huntington , S. P. , 1998 : The Clash of Civilizations and the Remaking of World Order.
Simon & Schuster , New York, USA .
IAC , 2007 : Lighting the Way – toward a Sustainable Energy Future. InterAcademy
Council (IAC) , Amsterdam , the Netherlands .
IAEA , 2005 : Thorium Fuel Cycle – Potential Benefi ts and Challenges . IAEA-
TECDOC-1350, International Atomic Energy Agency (IAEA) , Vienna, Austria .
IEA , 2007 : Renewables for Heating and Cooling – Untapped Potential . International
Energy Agency (IEA) of the Organisation for Economic Cooperation and
Development (OECD) , Paris, France .
IEA , 2008a : World Energy Outlook 2008 . International Energy Agency (IEA) of the
Organisation for Economic Cooperation and Development (OECD) , Paris, France .
IEA , 2008b : Implementing Agreement on Demand-Side Management Technologies
and Programmes . International Energy Agency (IEA) of the Organization for
Economic Cooperation and Development (OECD) , Paris, France .
IEA , 2008c : Empowering Variable Renewables – Options for Flexible Electricity
Systems . International Energy Agency (IEA) of the Organisation for Economic
Co-Operation and Development (OECD), Paris, France .
IEA , 2009a : World Energy Outlook 2009 . International Energy Agency (IEA) of the
Organisation for Economic Co-Operation and Development (OECD) , Paris,
France .
IEA , 2009b : From 1st to 2nd Generation Biofuel Technologies – an Overview of
Current Industry and Rd&D Activities . R. E. H. Sims , M. Taylor , J. N. Saddler and
W. Mabee , International Energy Agency (IEA) of the Organisation for Economic
Cooperation and Development (OECD) , Paris, France .
IGU , 2006 : Underground Storage of Gas . Report of Working Committee 2, Triennium
2003–2006, S. Khan , International Gas Union (IGU) , Oslo, Norway .
IPCC , 2007 : Mitigation of Climate Change . Contribution of working group III to the
Fourth Assessment report of the Intergovernmental Panel on Climate Change
(IPCC), B. Metz , O. R. Davidson , P. R. Bosch , R. Dave and L. A. Meyer , Cambridge
University Press , Cambridge, UK .
IPCC , 2011 : Special Report on Renewable Energy and Climate Change Mitigation.
Intergovernmental Panel on Climate Change (IPCC) and Cambridge University
Press , New York, USA and Cambridge, UK .

Chapter 15 Energy Supply Systems
1171
Kreutz , T. , R. Williams , S. Consonni and P. Chiesa , 2005 : Co-Production of
Hydrogen, Electricity and Co2 from Coal with Commercially Ready Technology.
Part B: Economic Analysis. International Journal of Hydrogen Energy , 30 (7):
769 – 784 .
Lange , J.-P. , 2001 : Methanol Synthesis: A Short Review of Technology Improvements.
Catalysis Today , 64 (1–2): 3 – 8 .
Larsen , H. and L. P. Petersen , Eds. 2005 : The Future Energy System – Distributed
Production and Use . Ris ø Energy Report 4. Ris ø National Laboratory for
Sustainable Energy, Technical University of Denmark , Roskilde, Denmark .
Larsen , H. and L. P. Petersen , 2009 : The Intelligent Energy System Infrastructure
for the Future. Ris ø Energy Report 8, Ris ø National Laboratory for Sustainable
Energy, Technical University of Denmark , Roskilde , Denmark .
Lehmann , J. , J. Gaunt and M. Rondon , 2006 : Bio-Char Sequestration in Terrestrial
Ecosystems – a Review. Mitigation and Adaptation Strategies for Global Change ,
11 (2): 395 – 419 .
Lou , L. W. and B. Wang , 2006 : Current Situation of Dme Synthesis Technology.
Guizhou Chemical Industry , 31 (4): 9 – 15 .
Lou , R. , R.-l. Xu and S.-l. Lou , 2006 : Application of Methanol Synthesis Reactor to
Large-Scale Plants . Applied Chemical Industry , 35 : 260 – 268 .
Lovins , A. B. and B. Cohen , 2010 : Renewables, Micropower, and the Transforming
Electricity Landscape . Report No. U10–08, Rocky Mountain Institute , Snowmass,
CO, USA .
Marrero , T. R. , 2006 : Long-Distance Transport of Coal by Coal Log Pipeline . Capsule
Pipline Research Center, University of Missouri , Columbia, MO, USA .
Matic , D. , 2006 : Global Opportunities for Natural Gas as a Transportation Fuel for
Today and Tomorrow. IGU Study Group – Natural Gas for Vehicles, World Gas
Conference International Gas Union (IGU) , Amsterdam, the Netherlands .
McKinsey & Company , 2010 : Greenhouse Gas Abatement Cost Curves . www.
mckinsey.com/clientservice/sustainability/costcurves.asp (accessed 23 March,
2011).
Moniz , E. J. , H. D. Jacoby and A. J. M. Meggs , 2010 : The Future of Natural Gas:
An Interdisciplinary Mit Study. Energy Initiative, Massachusetts Institute of
Technology , Cambridge, MA, USA .
Nahigian , K. R. , 2008 : The Smart Alternative: Securing and Strengthening Our
Nation’s Vulnerable Electric Grid . Advancing the Reform Agenda, Reform Brief,
The Reform Institute , Alexandria, VA .
National Academy of Sciences , 2009 : America’s Energy Future: Technology and
Transformation, the National Academies Energy Summit Report . National
Academies Press , Washington, D.C., USA .
National Academy of Sciences , 2010 : Electricity from Renewable Resources: Status,
Prospects, and Impediments . National Academies Press , Washington, D.C., USA .
NEA and IAEA , 2004 : Uranium 2003: Resources, Production and Demand . NEA
Report No. 5291, Nuclear Energy Agency (NEA) of the Organisation for Economic
Cooperation and Development (OECD) and the International Atomic Energy
Agency (IAEA) , Paris, France .
NEA , 2006 : Advanced Nuclear Fuel Cycles and Radioactive Waste Management
Nuclear Energy Agency (NEA) of the Organisation for Economic Cooperation
and Development (OECD) , Paris, France .
NEA and IAEA , 2008 : Uranium 2007: Resources, Production and Demand. Nuclear
Energy Agency (NEA) of the Organisation for Economic Cooperation and
Development (OECD) and the International Atomic Energy Agency (IAEA) , Paris,
France .
NEA and IAEA , 2010 : Uranium 2009: Resources, Production and Demand. Nuclear Energy
Agency (NEA) of the Organisation for Economic Cooperation and Development
(OECD) and the International Atomic Energy Agency (IAEA) , Paris, France .
Nelder , C. , 2008 : How to Play the China Coal Crisis . www.energyandcapital.com/
articles/coal-investment-stocks/747 (accessed 30 December, 2010).
NETL , 2007 : Barriers to Achieving the Modern Grid . The NETL Modern Grid
Initiative – Powering our 21st-Century Economy, United States National Energy
Technology Laboratory (NETL) for the United States Department of Energy (DOE) ,
Washington, D.C., USA .
Patterson , W. , 2009 : Keeping the Lights On. Earthscan , London, UK .
Pauluis , G. and L. Van den Durpel , 2001 : Trends in the Nuclear Fuel Cycle –
Economic, Environmental and Social Aspects . Facts and Opinions, NEA News
No. 19.2, Nuclear Energy Agency (NEA) of the Organisation for Economic
Cooperation and Development (OECD) , Paris, France .
Planck Foundation , 2009 : Situation 2009 . Global Resources Analysis Planck
Foundation , Washington, D.C., USA .
Rotawave , 2010 : “ Intelligent ” Energy System Set to Revolutionise the World’s
Biomass Fuel Supply Market . News Release, Ref: 0110, Rotawave Ltd ,
Aberdeen, UK .
Sims , R. E. H. , W. Mabee , J. N. Saddler and M. Taylor , 2010 : An Overview of Second
Generation Biofuel Technologies. Bioresource Technology , 101 (6): 1570 – 1580 .
Smil , V. , 2005 : Energy at the Crossroads: Global Perspectives and Uncertainties. MIT
Press , Cambridge, MA, USA .
Tijmensen , M. J. A. , 2000 : The Production of Fischer-Tropsch Liquids and Power
through Biomass Gasifi cation . NWS-E-2000-29, Science Technology Society,
Utrecht University , Utrecht .
UNEP , 2007 : Buildings and Climate Change – Status, Challenges, and Opportunities.
United Nations Environment Programme , New York, USA .
US DOE , 2002 : National Hydrogen Energy Roadmap . United States Department of
Energy (US DOE) , Washington, DC, USA .
US DOE , 2007 : Hydrogen, Fuel Cells & Infrastrucutre Technologies Program, Multi-
Year Research, Development and Demonstration Plan . www.hydrogen.energy.
gov (accessed 15 December, 2010).
WEC , 2010 : Survey of Energy Resources: Focus on Shale Gas. World Energy Council
(WEC) , London, UK .
Wisconsin Department of Commerce , 2005 : Ethanol Motor Fuel Storage Overview .
Reivsed Program Letter, Environmental & Regulatory Services, Wisconsin
Department of Commerce , Madison, WI .
WNN , 2009 : Thorium-Fuelled Exports Coming from India . WNN (World Nuclear
News) . London, UK .
Worrell , E. , J. A. Laitner , M. Ruth and H. Finman , 2003 : Productivity Benefi ts of
Industrial Energy Effi ciency Measures. Energy , 28 (11): 1081 – 1098 .
Yeager , K. , 2008 : Striving for Power Perfection. IEEE Power and Energy Magazine ,
6 (6): 28 – 35 .
Yeager , K. E. , 2007 : Electricity Enterprise: U.S., Prospects . Encyclopedia of Energy
Engineering and Technology . Taylor & Francis, London, UK .
Zhou , L., S. Hu , D. Chen , Y. Li , B. Zhu and Y. Jin , 2009 : Study on Systems Based on
Coal and Natural Gas for Producing Dimethyl Ether. Industrial & Engineering
Chemistry Research , 48 (8): 4101 – 4108 .
Zwart , R. , 2010 : Wood Pellets Markets and International Trade . Reference Document
for the 2nd Biomass Power and Trade Conference, Centre for Management and
Technology (CMT) , Rotterdam .