9/9/2011 bot 1 10:30 a.m. - penn state university - board ... · penn state investment council,...
TRANSCRIPT

9/9/2011 BOT 1
10:30 a.m. -
1. Roll Call
2. Approval of the Minutes of Previous Meeting
Will the Board of Trustees approve the minutes of the meeting of the Board held on July 15, 2011?
3. President's State-of-the-University Message
4. Informational Report on Research Activities
Henry C. Foley, Vice President for Research, Dean of the Graduate School, will offer a broadoverview of research activity at Penn State.
1:30 p.m. -
5. Reports from Standing Committees
Discussion of action and/or information items by the Standing Committees for consideration by theBoard of Trustees:
A. Committee on Campus Environment - Michael DiBerardinis, Chair
B. Committee on Educational Policy - David M. Joyner, Chair
C. Committee on Finance and Physical Plant - Linda B. Strumpf, Chair
1) Discussion of Consent Agenda Items Provided for Information or Approval ofthe Committee on Finance and Physical Plant:
Information Items - a) East Campus Low Pressure Steam Line Extension, University Parkb) Naming of Rooms, Portions of Buildings, and Plazasc) Status of Major Construction Programs and Borrowingd) Capital Budget Request for Fiscal Year 2012-2013e) Summary and Designation of Gifts Received by the University
Action Items -
f) Proposed Sale of Former Mellon Property to Church of Jesus Christ of LatterDay Saints, State College
g) Summary of Revisions to Existing Scholarships, Fellowships, Etc.h) Acknowledgments of Endowments and Other Major Commitments
(See Appendix I)

9/9/2011 BOT 2
5. Reports from Standing Committees (Continued)
C. Committee on Finance and Physical Plant - Linda B. Strumpf, Chair (Continued)
2) Proposed Naming of the New Level III Biosafety Laboratory the "Eva J. PellLaboratory for Advance Biological Research,'' University Park
The Facilities Naming Committee has recommended that the Board of Trusteesname the new Level III Biosafety Laboratory the "Eva J. Pell Laboratory forAdvanced Biological Research" in honor of the former Senior Vice President ofResearch and Dean of the Graduate School, Eva J. Pell, who as a scientist andadministrator for over 30 years, brought Penn State to the fore in the biologicalsciences. National Institutes of Health (NIH) funds are being used for thisconstruction.
Will the Committee on Finance and Physical Plant recommend to the Board ofTrustees adoption of the following resolution:
RESOLVED, That the new Level III Biosafety Laboratory atUniversity Park is named the "Eva J. Pell Laboratory for AdvancedBiological Research."
(See Appendix II)
3) Appointment of Non-University Employees to the Penn State InvestmentCouncil
In September 2000, Penn State's Board of Trustees established the Penn StateInvestment Council to provide direct oversight of the University's endowment andlong-term investment program. In accordance with the foregoing resolution, thePenn State Investment Council, appointed by the Board of Trustees, includes the:Senior Vice President for Finance and Business/Treasurer of the University (Chair);Executive Director, Office of Investment Management; and five to ninenon-University members (at least one of whom is a member of the Board ofTrustees). [In his capacity as Interim Senior Vice President for Finance andBusiness, it is noted that Gary C. Schultz will serve as chair of the Council; at suchtime as the Senior Vice President for Finance and Business is appointed,Mr. Schultz will resume his responsibilities as a non-University member of theCouncil.] The terms are staggered as follows:
2011 - Arthur D. Miltenberger, Vice President and Chief Financial Officer (Retired),R. K. Mellon & Sons (Ligonier, PA)J. David Rogers, Chief Executive Officer, J.D. Capital Management(Greenwich, CT)Gary Glynn, President and Chief Investment Officer, US Steel and CarnegiePension Fund (New York, NY)
2012 - Timothy J. Crowe, Managing Director, Anchor Point Capital LLC (CoralGables, FL)Edward R. Hintz, Jr., President, Hintz Capital Management, Inc. (Chatham,NJ)Gary C. Schultz, Senior Vice President for Finance and Business/TreasurerEmeritus, The Pennsylvania State University (State College, PA)

9/9/2011 BOT 3
5. Reports from Standing Committees (Continued)
C. Committee on Finance and Physical Plant - Linda B. Strumpf, Chair (Continued)
3) Appointment of Non-University Employees to the Penn State InvestmentCouncil (Continued)
2013 - Carmen Gigliotti, Managing Director, Private Equities of DuPont CapitalManagement (Wilmington, DE)Colleen Ostrowski, Vice President and Treasurer, ITT Corporation(Scarsdale, NY)Linda B. Strumpf, Chief Investment Officer (Retired), The HelmsleyCharitable Trust (New York, NY)
It is proposed to appoint J. David Rogers and Gary Glynn to membership with termsexpiring in 2014.
Will the Committee on Finance and Physical Plant recommend to the Board ofTrustees adoption of the following resolution:
RESOLVED, That J. David Rogers and Gary Glynn,non-University employees, are appointed to the Penn StateInvestment Council for terms ending in 2014.
4) Consideration of Request for 2012-2013 Appropriation for Operations
Will the Committee on Finance and Physical Plant recommend to the Board ofTrustees adoption of the following resolution:
RESOLVED, That the Officers of the University areauthorized to submit to the Legislature, appropriate departments,and offices of the Commonwealth of Pennsylvania, a StateAppropriation Request for fiscal year 2012-2013 in the amount of$293,689,000.
5) Capital Plan Update
Mr. Albert G. Horvath, Senior Vice President for Finance and Business/Treasurer,will provide an update for capital construction projects under consideration throughthe end of the current capital plan, FY 2012/13.
6) Update on the Status of Borrowing and Remaining Debt Capacity
In May 2007, the Board of Trustees authorized an increase in the long-termborrowing for the University. Updates are provided on an annual basis with respectto the status of borrowing and the remaining debt capacity.

9/9/2011 BOT 4
5. Reports from Standing Committees (Continued)
C. Committee on Finance and Physical Plant - Linda B. Strumpf, Chair (Continued)
7) Proposed Appointment of an Architect, Greater Philadelphia InnovationCluster Hub, Philadelphia Navy Yard Building 661 Retrofit, Philadelphia
The Subcommittee on Architect/Engineer Selection will make a report andrecommendation on the appointment of an architect for the Greater PhiladelphiaInnovation Cluster Hub, Philadelphia Navy Yard Building 661 Retrofit inPhiladelphia.
8) Proposed Appointment of an Architect, Old Main Renovations, University Park
The Subcommittee on Architect/Engineer Selection will make a report andrecommendation on the appointment of an architect for Old Main Renovations atUniversity Park.
9) Investment Review of Endowment and Similar Funds as of June 30, 2011
Appendix III is an informational report on the University’s Endowment and SimilarFunds as of June 30, 2011. A brief presentation will be made at the meeting.
(See Appendix III)
10) Photo Report on Selected Construction Projects
A photo report on the progress of selected construction projects will be presentedat the meeting.
6. Legal Matters
Cynthia A. Baldwin, Vice President and General Counsel, will present an informational report onUniversity legal matters and/or policies normally considered by a Standing Committee of the Board.
7. Recommendation for Approval to Grant Honorary Degrees
Will the Board of Trustees approve the following resolution:
RESOLVED, that the Board of Trustees approves the granting of theHonorary Doctorate of Humane Letters to Eric Thomas, M.D. and the granting of theHonorary Doctorate of Humane Letters to Dr. Gary Orfield at upcomingcommencement ceremonies.
8. Proposed Election of Officer
Dr. Graham B. Spanier, Secretary of the Board of Trustees, will nominate Gary C. Schultz(replacing Albert G. Horvath) as Treasurer of the Board of Trustees, effective September 12, 2011,to serve until the annual election in January 2012.
9. Announcements by the Chairman of the Board of Trustees

9/9/2011 - Consent Agenda F&PP
(Appendix I)- 1 -
1. East Campus Low Pressure Steam Line Extension, University Park
The University is planning to construct approximately 1,000 feet of low pressure steam piping extending fromnear East Area Locker Room to Bigler Road near the Millennium Science Complex. This new service willsupport future low pressure steam systems in this vicinity. The project cost estimate is $1,700,000.
(See Appendix I.1)
2. Naming of Rooms, Portions of Buildings and Plazas
The Facilities Naming Committee has made certain recommendations to the President on the naming ofrooms, portions of buildings and plazas. In accordance with the Policy on Naming University Facilities, theBoard of Trustees is hereby informed that the President has approved the following naming actions:
A. Several spaces within Moore Building as follows:
1) Conference Room, 250 Moore Building, for a gift from the estate of Harold H. and Harriet BBenjamin. The recognition plaque should read:
Harold H. and Harriet B. Benjamin Conference Room
2) Laboratory, 459 Moore Building, for a gift from Herschel and Eileen Leibowitz. Therecognition plaque should read:
Herschel W. and Eileen Wirtshafter Leibowitz Laboratory
3) Conference Room, 467 Moore Building, for a gift from Hellene Runtagh. The recognitionplaque should read:
Hellene Runtagh Conference Room
4) Advising Office. 125E Moore Building, for a gift from Margaret "Peg" West The recognitionplaque should read:
Margaret A. West, 1972, Advising Office
5) Laboratory, 607 Moore Building, for a gift from Gary and Linda Kaplan. The recognitionplaque should read:
Gary and Linda Kaplan Laboratory
B. Several spaces within the Sheetz Center for Entrepreneurial Excellence at Penn State Altoona asfollows:
1) Trading Room for a commitment from Michael and Gail Irwin. The recognition plaque shouldread:
Michael and Gail Irwin Family Trading Room
2) Conference Room (first floor) for a gift from Young, Oakes, Brown and Company. Therecognition plaque should read:
Young, Oakes, Brown and Company Conference Room
3) Lounge (first floor) for a gift-in-kind from the Hite Company. The recognition plaque shouldread:
Hite Company Lounge

9/9/2011 - Consent Agenda F&PP
(Appendix I)- 2 -
2. Naming of Rooms, Portions of Buildings and Plazas (Continued)
B. Several spaces within the Sheetz Center for Entrepreneurial Excellence at Penn State Altoona asfollows: (Continued)
4) Incubator (second Floor) for a commitment from the Students in Free Enterprise (SIFE)Business Advisory Board. The recognition plaque should read:
Students in Free Enterprise (SIFE) Business Advisory Board Business Incubator
5) Lounge/Dining Area (first floor) for a commitment from Phillip and Rosalind Sky and Neil andMarilyn Port families. The recognition plaque should read:
Port-Sky Lounge
6) Lobby (first floor), for a commitment from Don and Sherry Brett. The recognition plaqueshould read:
Brett Lobby
C. The engineering classroom, Room 322 at Penn State Lehigh Valley, for a commitment from Daniel L.Puchyr. The recognition plaque should read:
This laboratory named in recognition of generous support from Judy and Dan Puchyr
D. Rename the "South Annex" in the Bryce Jordan Center the "Basketball Practice Facility."
E. Several spaces in the Knowledge Commons, Pattee Library, as follows:
1) Quick Access Service Area for a gift from Joseph DiGiacomo. The recognition plaque shouldread:
Joseph DiGiacomo Quick Access Service Area
2) Atrium seating area for a gift from Cindy Joyce. The recognition plaque should read:
Cindy Joyce Atrium Seating
3) Atrium seating area for a gift from Virginia Todd Chapel. The recognition plaque should read:
In Memory of Bob and Loretta Todd Atrium Seating
3. Status of Major Construction Programs and Borrowing
(See Appendix I.2)
4. Capital Budget Request for Fiscal Year 2012-2013
Penn State has identified several projects as a priority and annually submits a list of those projects to theCommonwealth's Department of Education for further consideration by the Legislature. In order for theGovernor to release funds for capital projects, the projects must have prior authorization and approval by theLegislature. The Capital Budget Request consists of those projects for which the University is seekingauthorization for subsequent funding by the Governor.

9/9/2011 - Consent Agenda F&PP
(Appendix I)- 3 -
4. Capital Budget Request for Fiscal Year 2012-2013 (Continued)
For fiscal year 2012-2013, the University will submit a Capital Budget Request to the Commonwealth forauthorization of $187.6 million of which $159 million is for construction projects and the remaining$28.6 million is for original equipment.
(See Appendix I.3)
5. Summary and Designation of Gifts Received by the University
Appendix I.5 is a summary and designation of gifts received by the University during the period July 1, 2010through June 30, 2011.
(See Appendix I.4)
6. Proposed Sale of Former Mellon Property to Church of Jesus Christ of Latter Day Saints, State College
In July 1999, the University acquired approximately 1,100 acres of undeveloped land at various locationsthroughout Centre County, Pennsylvania, from the Mellon Family Trust and the Richard King MellonFoundation. The purchase resulted in the University acquiring six (6) tracts of land, comprised of sixteen (16)separately deeded parcels, for $3,800,000. Terms of this purchase do not obligate the University to retainthese tracts, and since that time the University has sold several parcels to various municipalities for public parkand recreation use.
The University has received a purchase offer for one such parcel, comprised of .254 undeveloped acreslocated in State College Borough, from the Corporation of the Presiding Bishop of the Church of Jesus Christof Latter Day Saints in the amount of $25,000.
RESOLVED, That the Board of Trustees approves the sale of .254 acres in StateCollege, Centre County, Pennsylvania, to the Corporation of the Presiding Bishop of theChurch of Jesus Christ of Latter Day Saints in the amount of $25,000.
BE IT FURTHER RESOLVED, That the Officers of the University are authorized anddirected to take such steps as are necessary to make effective this resolution.
(See Appendix I.5)
7. Summary of Revisions to Existing Scholarships, Fellowships, Etc. (For the period June 20, 2011through August 12, 2011)
Will the Committee on Finance and Physical Plant recommend to the Board of Trustees adoption of thefollowing resolution:
RESOLVED, That the conditions governing certain existing scholarships, fellowships,awards, and similar funds previously established at the University be revoked and that theOfficers of the University are authorized to put into effect the revised regulations as requestedby the donors.
8. Acknowledgments of Endowments and Other Major Commitments
The Committee on Finance and Physical Plant is advised that for the period June 20, 2011, throughAugust 12, 2011, 28 new funds totaling approximately $4,454,361 were accepted by the University, includingscholarships, fellowships, etc. All of these items conform to established University policies and regulations.

9/9/2011 - Consent Agenda F&PP
(Appendix I)- 4 -
8. Acknowledgments of Endowments and Other Major Commitments (Continued)
For the period May 1, 2011 through June 30, 2010, 48 major commitments were accepted by the Universitytotaling approximately $27,289,375.
Will the Committee on Finance and Physical Plant recommend to the Board of Trustees adoption of thefollowing resolutions:
RESOLVED, That the Board of Trustees gratefully acknowledges the generouscontributions of the many friends of the University in support of endowments, funds, and othermajor commitments as reported to the Committee on Finance and Physical Plant at itsmeeting of September 9, 2011.
FURTHER BE IT RESOLVED, That the Officers of the University are authorized toconvey the Board's appreciation to these generous benefactors who provide opportunitiesfor many students to receive a quality education.

(Appendix I.1) -1-
9/9/2011 F&PP
N
Un
iver
sity
Par
k
Eas
t C
amp
us
Lo
w P
ress
ure
Ste
am L
ine
Ext
ensi
on
Pol
lock
Roa
d
Bigler Road
University Drive
Mill
enni
um S
C
East Area
Locker Room
Hol
uba
Hal
l
Bry
ce J
orda
n C
ente
r

Aug
ust 3
1, 2
011
Bol
d -
Com
plet
ed, I
talic
s -
Pro
ject
ed
Bud
get C
omm
onw
ealth
Gift
Arc
h/En
gFi
nal P
lan
Star
t C
ompl
etio
n C
ampu
sPr
ojec
t Nam
eA
mou
ntFu
ndin
gA
mou
ntSe
lect
ion
App
rova
lD
ate
Dat
e
Alto
ona
Por
t Sky
Caf
é$5
,400
,000
$0$0
N/A
03/1
105
/12
08/1
2
Ber
ksG
aige
Tec
hnol
ogy
and
Bus
ines
s In
nova
tion
Bui
ldin
g$2
5,70
0,00
0$0
$3,0
00,0
0011
/07
01/1
004
/10
10/1
1
Chi
ldre
n's
Hos
pita
l$2
06,5
00,0
00$1
4,00
0,00
0$6
5,00
0,00
011
/05
11/0
903
/10
10/1
2
Sup
port
Ser
vice
s B
uild
ing
$19,
000,
000
$0$0
01/0
903
/10
06/1
011
/11
Bea
ver
Sta
dium
Sco
rebo
ard
Upg
rade
s$6
,800
,000
$0$0
07/1
111
/11
12/1
108
/12
Bea
ver
Sta
dium
N. E
nd Z
one
and
AD
A R
enov
atio
n$9
,898
,885
$0$0
N/A
09/1
012
/10
08/1
1
Bio
Beh
avio
ral H
ealth
Bui
ldin
g$4
8,10
0,00
0$4
0,00
0,00
0$0
01/0
807
/10
12/1
010
/12
Bio
logi
cal R
esea
rch
Labo
rato
ry
$23,
000,
000
$0$0
11/0
711
/10
09/1
112
/12
Ced
ar B
uild
ing
Ren
ovat
ions
$7,9
50,0
00$7
,140
,000
$003
/11
11/1
102
/12
08/1
3
Eas
t Cam
pus
Ste
am L
ine
$13,
500,
000
$11,
000,
000
$0N
/A03
/11
06/1
108
/12
Env
ironm
enta
l Im
prov
emen
ts B
FP
Inst
alla
tions
$8,1
20,0
00$7
,000
,000
$0N
/AN
/A06
/08
08/1
4
Ess
entia
l Ser
vice
s P
rogr
am$1
1,95
0,00
0$3
,000
,000
$0N
/AN
/A12
/05
12/1
4
Hen
ders
on S
outh
(P
hase
II)
$56,
500,
000
TB
D$0
01/0
8T
BD
TB
DT
BD
HU
B A
dditi
on$2
5,80
0,00
0$0
$003
/11
TB
DT
BD
TB
D
Peg
ula
Ice
Are
na$8
9,00
0,00
0$0
$89,
000,
000
11/1
001
/12
01/1
209
/13
IM B
uild
ing
Add
ition
$24,
000,
000
$0$0
01/1
1T
BD
TB
DT
BD
Moo
re B
uild
ing
Add
ition
$26,
100,
000
$23,
190,
000
$1,8
00,0
0007
/08
05/1
006
/10
12/1
1
Moo
re B
uild
ing
Ren
ovat
ion
Sta
ge$2
1,90
0,00
0$2
0,05
0,00
0$1
,200
,000
07/0
811
/11
02/1
208
/13
Pol
lock
Din
ing
Com
mon
s R
enov
atio
n$1
1,70
0,00
0$0
$0N
/A11
/10
01/1
108
/11
Sou
th F
rear
Ren
ovat
ions
$6,1
10,0
00$2
,460
,000
$0N
/A03
/11
05/1
101
/13
Sou
th H
alls
Ren
ovat
ions
(P
hase
I)$3
0,00
0,00
0$0
$003
/11
TB
DT
BD
TB
D
Ste
am P
rodu
ctio
n M
odifi
catio
ns$2
5,00
0,00
0$0
$001
/11
07/1
2T
BD
TB
D
Tra
nsfo
rmer
Rep
lace
men
t Pro
gram
$9,6
00,0
00$1
,000
,000
$0N
/AN
/A06
/07
12/1
3
Wat
er F
iltra
tion
Pla
nt$3
0,00
0,00
0$2
5,00
0,00
0$0
01/1
107
/12
06/1
206
/13
Wes
t Cam
pus
Chi
lled
Wat
er$1
1,90
0,00
0$6
,500
,000
$0N
/A03
/11
05/1
103
/12
Wes
t Pat
tee
Libr
ary
Ren
ovat
ions
$7,0
00,0
00$0
$7,0
00,0
00N
/A03
/11
05/1
112
/11
Sum
mar
y of
Uni
vers
ity L
ong-
Term
Deb
t - $
(000
) (ex
clud
ing
PCT)
Aut
horiz
ed B
orro
win
g St
atus
- $(
000)
(exc
ludi
ng P
CT)
$1,0
41,9
30B
orro
win
g A
utho
rity
per
May
200
7 B
oard
of T
rus
$600
,000
Cap
ital L
ease
s, B
onds
, & N
otes
Issu
ed
($31
2,08
7)
Fut
ure
Cap
italiz
ed L
ease
s &
Oth
er A
ntic
ipat
ed C
($6,
100)
Est
imat
ed A
utho
rity
Rem
aini
ng$2
81,8
13
BO
T M
ilest
ones
Her
shey
Uni
vers
ity P
ark
Con
stru
ctio
n is
app
roxi
mat
ely
12%
com
plet
e.
Con
stru
ctio
n is
app
roxi
mat
ely
10%
com
plet
e.
Con
stru
ctio
n is
app
roxi
mat
ely
30%
com
plet
e.
Pro
ject
pro
gram
is a
ppro
xim
atel
y 65
% c
ompl
ete.
Con
stru
ctio
n is
app
roxi
mat
ely
50%
com
plet
e.
Con
stru
ctio
n is
app
roxi
mat
ely
95%
com
plet
e.
STA
TU
S O
F M
AJO
R C
ON
STR
UC
TIO
N P
RO
GR
AM
S A
ND
BO
RR
OW
ING
( >
$5
Mill
ion
)
Con
stru
ctio
nPr
ojec
t Dat
a N
otes
Pro
ject
in d
esig
n.
Con
stru
ctio
n is
app
roxi
mat
ely
95%
com
plet
e.
On
HO
LD.
Con
stru
ctio
n is
app
roxi
mat
ely
70%
com
plet
e.
Est
imat
ed b
onds
, not
es a
nd c
apita
l lea
ses
as o
f Jun
e 30
, 201
1 (u
naud
ited)
Pro
ject
beg
inni
ng d
esig
n.
Con
stru
ctio
n ex
pect
ed to
sta
rt in
Sep
tem
ber
2011
.
Pro
ject
in d
esig
n.
On
HO
LD.
Pos
tpon
ed.
Pro
ject
pro
gram
is a
ppro
xim
atel
y 50
% c
ompl
ete.
Pro
ject
beg
inni
ng d
esig
n.
Con
stru
ctio
n is
app
roxi
mat
ely
95%
com
plet
e.
Pro
ject
in d
esig
n.
Con
stru
ctio
n is
app
roxi
mat
ely
35%
com
plet
e.
Pro
ject
in s
chem
atic
des
ign.
Pro
ject
in d
esig
n.
Con
stru
ctio
n is
app
roxi
mat
ely
90%
com
plet
e.
Pro
ject
pro
gram
is a
ppro
xim
atel
y 55
% c
ompl
ete.
Con
stru
ctio
n is
app
roxi
mat
ely
5% c
ompl
ete.
Pro
ject
in d
esig
n.
Pro
ject
in d
esig
n.
(Appendix I.2) -1-
9/9/2011 F&PP

TH
E P
EN
NS
YL
VA
NIA
ST
AT
E U
NIV
ER
SIT
Y
PR
OP
OS
ED
CA
PIT
AL
BU
DG
ET
RE
QU
ES
T F
OR
201
2-13
Pri
ori
ty
Am
ou
nt
Nu
mb
er
201
2-20
13 C
on
stru
ctio
n P
roje
cts
R
equ
este
d
1.
Cap
ital
Ren
ewal
, P
has
e V
(U
niv
ers
ity
Par
k)
$40
,000
,000
Thi
s pr
ojec
t is
par
t fiv
e of
an
effo
rt t
o m
ake
sign
ifica
nt c
ompr
ehen
sive
upg
rade
s to
the
bui
ldin
gs a
t U
nive
rsity
Par
k.
The
re a
re o
ver
600
bui
ldin
gs a
t th
e
Uni
vers
ity P
ark
Cam
pus
that
we
re c
onst
ruct
ed f
rom
the
ear
ly 1
900’
s th
roug
h th
e 19
70’s
. L
imite
d fu
ndin
g fo
r m
aint
enan
ce h
as a
llow
ed o
nly
for
the
supp
ort
of
com
pone
nt r
ep
lace
men
t of
alr
ead
y a
ntiq
uate
d s
yste
ms
and
pie
cem
eal i
mpr
ovem
ent
s, le
avin
g m
an
y of
the
old
er f
acili
ties
bare
ly a
ccep
tabl
e fo
r th
eir
prog
ram
s an
d oc
cup
ants
. T
his
proj
ect
will
allo
w t
he
Uni
vers
ity t
o re
plac
e, i
nsta
ll or
upg
rade
as
appr
opria
te s
yste
ms
in m
ajor
aca
dem
ic,
rese
arch
and
ad
min
istr
ativ
e
build
ings
acr
oss
cam
pus
that
we
re n
ot a
ddre
ssed
in th
e ot
her
phas
es o
f ren
ew
al.
Mos
t of
the
bu
ildin
gs h
ave
exc
eed
ed t
hei
r el
ectr
ical
cap
acity
an
d th
e l
ight
ing
and
wir
ing
is
old
an
d de
terio
ratin
g.
The
age
an
d e
xten
sive
use
of
mo
st o
f th
e pu
blic
bui
ldin
gs
is n
otic
eab
le i
n t
hat
floor
ing
is d
amag
ed,
ceili
ngs
are
sta
ined
, pa
int
and
oth
er i
nter
ior
finis
hes
are
cra
cke
d,
pee
ling
and
wo
rn,
and
pub
lic
rest
room
s ar
e di
ng
y.
Thi
s pr
ojec
t w
ill a
llow
the
Uni
vers
ity t
o ad
dres
s th
ese
item
s an
d w
ill p
rovi
de a
n op
port
unity
to
ad
dres
s va
ryin
g sa
fety
issu
es a
nd
ener
gy
effic
ienc
y an
d co
nser
vatio
n.
Wor
k m
ay in
clud
e co
nnec
tion
or u
pgra
des
to c
entr
al u
tility
sys
tem
s, s
uch
as c
hille
d w
ater
, w
ater
, ele
ctric
, et
c.
2.
Cap
ital
Ren
ew
al, P
has
e IV
(E
aste
rn R
egio
n C
amp
use
s)
$28,
000
,000
The
Com
mon
we
alth
Cam
puse
s ar
e n
ot e
xem
pt f
rom
cha
nge
s in
tec
hno
log
y, p
rogr
ams,
clie
nt e
xpec
tatio
ns,
safe
ty a
nd
bui
ldin
g co
des,
res
earc
h an
d
inst
ruct
iona
l d
eman
ds o
n th
eir
faci
litie
s.
Lim
ited
ma
inte
nan
ce f
und
ing
has
on
ly s
uppo
rted
com
pon
ent
repl
acem
ent
of
alre
ady
ant
iqua
ted
syst
ems,
allo
we
d
piec
emea
l im
prov
emen
ts a
nd b
arel
y ke
pt m
ost
of t
he o
lder
fac
ilitie
s ac
cept
able
for
the
pro
gram
s an
d oc
cupa
nts.
T
his
proj
ect,
pha
se t
hre
e of
a s
erie
s, w
ill
cont
inue
the
effo
rt a
t th
e U
nive
rsity
’s E
aste
rn R
egio
n C
ampu
ses
(Wor
thin
gton
Scr
anto
n, W
ilkes
-Bar
re,
Haz
leto
n, L
ehig
h V
alle
y, B
erks
, A
bing
ton,
Bra
ndyw
ine
and
Gre
at V
alle
y) t
o re
plac
e, i
nsta
ll or
upg
rade
ce
ntra
l h
eatin
g, v
entil
atio
n, m
ech
anic
al a
nd
air
con
ditio
nin
g sy
ste
ms
in m
ajor
aca
dem
ic,
rese
arch
an
d
adm
inis
trat
ive
bui
ldin
gs.
The
pro
ject
will
re
plac
e ro
of s
yste
ms,
up
grad
e or
rep
lace
bu
ildin
g st
ruct
ura
l an
d e
xter
ior
syst
ems,
ins
tall
or u
pgra
de t
o cu
rren
t bu
ildin
g co
des
, el
ectr
ical
and
oth
er u
tility
ser
vice
s, r
epa
ir m
ajor
bui
ldin
g e
ntra
nces
, pr
ovid
e ne
w e
nerg
y ef
ficie
nt w
indo
ws
an
d lig
htin
g s
yste
ms
and
repl
ace
antiq
uate
d w
ater
an
d p
lum
bin
g sy
stem
s.
Upg
rade
s an
d m
oder
niza
tion
to
inte
rior
bui
ldin
g fin
ish
es,
room
co
nfig
urat
ions
an
d re
st r
oom
fac
ilitie
s w
ill b
e co
mpl
eted
as
app
ropr
iate
. U
pgr
ades
or
new
con
stru
ctio
n to
cen
tral
po
wer
or
utili
ty p
lant
s w
ill b
e in
clud
ed a
s ne
cess
itate
d b
y th
e pr
ojec
t.
3.
Cap
ital
Ren
ew
al,
Ph
ase
IV (
Cen
tral
Reg
ion
Cam
pu
ses
) $2
8,0
00,0
00
The
Com
mon
we
alth
Cam
puse
s ar
e n
ot e
xem
pt f
rom
cha
nge
s in
tec
hno
log
y, p
rogr
ams,
clie
nt e
xpec
tatio
ns,
safe
ty a
nd
bui
ldin
g co
des,
res
earc
h an
d
inst
ruct
iona
l d
eman
ds o
n th
eir
faci
litie
s.
Lim
ited
ma
inte
nan
ce f
und
ing
has
on
ly s
uppo
rted
com
pon
ent
repl
acem
ent
of
alre
ady
ant
iqua
ted
syst
ems,
allo
we
d
piec
emea
l im
pro
vem
ent
s an
d b
arel
y ke
pt m
ost
of t
he o
lde
r fa
cilit
ies
acce
ptab
le f
or t
he
prog
ram
s a
nd o
ccup
ants
. T
his
pro
ject
, p
hase
thr
ee
of a
ser
ies,
will
co
ntin
ue t
he e
ffor
t at
the
Uni
vers
ity’s
Cen
tral
Reg
ion
Ca
mpu
ses
(Alto
ona
, M
ont
Alto
, H
arris
bur
g, S
chu
ylki
ll, Y
ork
and
Dic
kins
on
Sch
ool
of L
aw
-Car
lisle
) to
re
plac
e, in
stal
l or
upgr
ade
cent
ral h
eatin
g, v
entil
atio
n, m
ech
anic
al a
nd a
ir c
ondi
tioni
ng s
yste
ms
in m
ajor
aca
dem
ic,
rese
arch
and
adm
inis
trat
ive
build
ings
. T
he
proj
ect
will
rep
lace
roo
f sy
ste
ms,
upg
rad
e or
rep
lace
bui
ldin
g st
ruct
ura
l an
d e
xter
ior
syst
ems,
inst
all
or u
pgra
de t
o c
urre
nt b
uild
ing
cod
es,
elec
tric
al a
nd
othe
r ut
ility
ser
vice
s, r
epai
r m
ajor
bui
ldin
g e
ntra
nce
s, p
rovi
de n
ew
en
erg
y ef
ficie
nt w
ind
ow
s an
d lig
htin
g sy
stem
s a
nd r
epl
ace
antiq
uat
ed w
ater
an
d pl
umbi
ng
sy
stem
s.
Up
grad
es a
nd
mod
erni
zatio
n t
o in
terio
r bu
ildin
g f
inis
hes
, ro
om c
onfig
urat
ions
and
res
t ro
om f
aci
litie
s w
ill b
e c
ompl
ete
d as
app
ropr
iate
. U
pgr
ades
or
new
con
stru
ctio
n to
cen
tral
po
wer
or
utili
ty p
lant
s w
ill b
e in
clud
ed a
s ne
cess
itate
d by
the
pro
ject
.
(Appendix I.3) -1-
9/9/2011 F&PP

4.
Cap
ital
Ren
ew
al,
Ph
ase
IV (
Wes
tern
Reg
ion
Cam
pu
ses
) $2
8,0
00,0
00
The
Com
mon
wea
lth C
ampu
ses
are
not
exe
mpt
fro
m c
hang
es i
n te
chno
logy
, pr
ogra
ms,
clie
nt e
xpec
tatio
ns,
safe
ty a
nd b
uild
ing
code
s, r
esea
rch
and
in
stru
ctio
nal
dem
ands
on
thei
r fa
cilit
ies.
L
imite
d m
ain
ten
ance
fun
din
g h
as o
nly
sup
port
ed c
omp
onen
t re
plac
eme
nt o
f al
read
y a
ntiq
uate
d sy
stem
s, a
llow
ed
pi
ecem
eal
imp
rove
me
nts
and
bar
ely
kept
mos
t of
the
old
er
faci
litie
s ac
cept
able
for
th
e pr
ogra
ms
and
occ
upan
ts.
Thi
s pr
oje
ct,
pha
se t
hre
e of
a s
erie
s, w
ill
cont
inue
the
effo
rt a
t th
e U
nive
rsity
’s W
est
ern
Reg
ion
Ca
mpu
ses
(Eri
e, S
hen
ango
, D
uB
ois,
Be
aver
, N
ew
Ken
sing
ton,
Gre
ater
Alle
ghen
y an
d F
aye
tte)
to
repl
ace,
inst
all o
r up
grad
e ce
ntra
l hea
ting,
ven
tilat
ion,
mec
han
ical
and
air
con
ditio
ning
sys
tem
s in
maj
or a
cade
mic
, res
ear
ch a
nd a
dmin
istr
ativ
e bu
ildin
gs.
The
pr
ojec
t w
ill r
epla
ce r
oof
syst
em
s, u
pgra
de
or r
epla
ce b
uild
ing
stru
ctur
al a
nd
ext
erio
r sy
stem
s, in
sta
ll or
upg
rade
to
cur
rent
bui
ldin
g c
odes
, el
ectr
ical
an
d ot
her
utili
ty s
ervi
ces,
rep
air
maj
or b
uild
ing
ent
ran
ces,
pro
vide
ne
w e
ner
gy
effic
ient
win
do
ws
and
light
ing
syst
ems
and
re
plac
e an
tiqu
ated
wat
er a
nd
plum
bin
g
syst
ems.
U
pgr
ades
an
d m
oder
niza
tion
to
inte
rior
build
ing
fin
ish
es,
room
con
figur
atio
ns a
nd r
est
room
fa
cilit
ies
will
be
com
ple
ted
as a
ppro
pria
te.
Up
grad
es o
r ne
w c
onst
ruct
ion
to c
entr
al p
ow
er o
r ut
ility
pla
nts
will
be
incl
uded
as
nece
ssita
ted
by t
he p
roje
ct.
5.
Dis
aste
r R
eco
very
/Bu
sin
ess
Co
nti
nu
ity
Dat
a C
ente
r (l
oca
tio
n t
o b
e d
eter
min
ed)
$35,
000,
000
T
he U
nive
rsity
has
be
enas
sess
ing
its b
usin
ess
cont
inui
ty v
uln
erab
ility
in t
he e
vent
of
a ca
tast
roph
ic lo
ss o
f co
mpu
ter
data
an
d sy
stem
s at
Uni
vers
ity P
ark.
To
addr
ess
this
co
ncer
n, c
ons
ulta
nts
have
rec
om
men
ded
th
e de
velo
pmen
t o
f a
mirr
or s
ite t
hat
can
be
fully
ope
ratio
nal i
n m
omen
ts if
suc
h an
eve
nt s
ho
uld
occu
r.
The
faci
lity
nee
ds to
be
with
in a
n ap
pro
xim
ate
sixt
y-m
ile d
ista
nce
of th
e U
niv
ersi
ty P
ark
Cam
pus.
T
his
proj
ect
will
inc
lud
e th
e a
cqui
sitio
n of
an
app
ropr
iate
site
in
the
serv
icea
ble
are
a th
at c
an b
e re
adi
ly d
eve
lop
ed t
o m
eet
the
nee
ds
of t
his
typ
e o
f fa
cilit
y.
The
faci
lity
will
hou
se s
erve
r ra
cks
to a
ccom
mod
ate
the
curr
ent n
eeds
of t
he U
nive
rsity
and
allo
w f
or e
xpan
sion
as
the
nee
d ar
ises
. T
he s
ite w
ill a
ccom
mod
ate
outs
ide
supp
ort
spac
e an
d e
qui
pmen
t. O
ther
item
s in
clu
ded
in t
he
proj
ect
are
ext
ensi
on o
f an
y an
d a
ll ut
ilitie
s to
th
e si
te,
cle
aran
ce/d
emol
ition
of
an
y e
xist
ing
stru
ctur
es,
park
ing
and
acce
ss r
oads
, sp
ecia
lized
sec
urity
sys
tem
s, a
nd u
nint
erru
pted
po
wer
sys
tem
s (U
PS
) fo
r ba
ckup
po
we
r se
rvic
e in
the
eve
nt o
f ut
ility
po
we
r ou
tage
.
2012
-13
To
tal
Co
nst
ruct
ion
Pro
ject
s $1
59,
000,
000
(Appendix I.3) -2-
9/9/2011 F&PP

TH
E P
EN
NS
YL
VA
NIA
ST
AT
E U
NIV
ER
SIT
Y
PR
OP
OS
ED
CA
PIT
AL
BU
DG
ET
RE
QU
ES
T F
OR
201
2-13
Pri
ori
ty
Am
ou
nt
Nu
mb
er
2012
-201
3 O
rig
inal
Eq
uip
men
t
Req
ues
ted
1.C
apita
l Re
new
al, P
hase
V (
Uni
vers
ity P
ark)
$
6,00
0,0
00
2.C
apita
l Ren
ew
al, P
hase
IV (
Eas
tern
Re
gion
Cam
puse
s)
$ 4,
200,
000
3.C
apita
l Re
new
al, P
hase
IV (
Cen
tral
Reg
ion
Cam
pus
es)
$ 4,
200,
000
4.C
apita
l Ren
ew
al, P
hase
IV (
Wes
tern
Reg
ion
Cam
puse
s)
$ 4,
200,
000
5.D
isas
ter
Rec
over
y/B
usin
ess
Con
tinui
ty D
ata
Cen
ter
(loca
tion
to b
e de
term
ined
)
$
10,0
00,0
00
20
12-1
3 T
ota
l O
rig
inal
Eq
uip
men
t $
2
8,60
0,00
0
20
12-
13 T
OT
AL
RE
QU
ES
TE
D
$ 18
7,6
00,0
00
(Appendix I.3) -3-
9/9/2011 F&PP

Gift
sD
olla
rsG
ifts
Dol
lars
Gift
sD
olla
rsG
ifts
Dol
lars
AL
UM
NI
129,
705
131,
421,
878
128,
378
65,2
58,5
801,
327
66,1
63,2
9812
8,37
865
,258
,580
FR
IEN
DS
159,
053
39,1
15,4
5915
3,32
336
,533
,747
5,73
02,
581,
712
153,
323
36,5
33,7
47
CO
RP
OR
AT
ION
S13
,943
53,1
08,8
1613
,346
53,5
39,1
6059
7(4
30,3
44)
13,3
4653
,539
,160
FO
UN
DA
TIO
NS
1,90
230
,474
,260
1,34
331
,800
,701
559
(1,3
26,4
41)
1,34
331
,800
,701
OR
GA
NIZ
AT
ION
S3,
421
20,7
11,6
283,
220
16,5
18,6
1020
14,
193,
018
3,22
016
,518
,610
TO
TA
LS
308,
024
$274
,832
,041
299,
610
$203
,650
,798
8,41
4$7
1,18
1,24
329
9,61
0$2
03,6
50,7
98
(7/0
1/09
- 6
/30/
10)
Yea
r-T
o-D
ate
Yea
r-T
o-D
ate
Yea
r-T
o-D
ate
(As
of 6
/30/
11)
(As
of 6
/30/
10)
(Fro
m 2
010
- 20
11)
TH
RO
UG
H J
UN
E 2
011
Thi
s Y
ear
Last
Yea
rC
hang
eLa
st F
isca
l Yea
r G
rand
Tot
als
TH
E P
EN
NS
YL
VA
NIA
ST
AT
E U
NIV
ER
SIT
Y
OF
FIC
E O
F U
NIV
ER
SIT
Y D
EV
EL
OP
ME
NT
YE
AR
TO
DA
TE
RE
PO
RT
- A
LL
SO
UR
CE
S
TY
PE
DO
NO
R R
EP
OR
T (
GIF
TS
)

Gift
sD
olla
rsG
ifts
Dol
lars
Gift
sD
olla
rsG
ifts
Dol
lars
UN
RE
ST
RIC
TE
D8,
492
1,03
8,85
38,
354
1,44
6,75
713
8(4
07,9
04)
8,35
41,
446,
757
AC
AD
EM
IC D
IVIS
ION
S18
,324
5,20
6,15
619
,398
5,36
0,18
0(1
,074
)(1
54,0
24)
19,3
985,
360,
180
FA
CU
LT
Y R
ES
OU
RC
ES
545
26,6
66,7
9765
411
,827
,681
(109
)14
,839
,116
654
11,8
27,6
81R
ES
EA
RC
H4,
071
34,9
60,6
824,
070
43,9
42,0
861
(8,9
81,4
04)
4,07
043
,942
,086
PU
BL
IC S
VC
& E
XT
22,9
954,
669,
058
23,4
564,
187,
259
(461
)48
1,79
923
,456
4,18
7,25
9L
IBR
AR
Y1,
718
290,
800
1,99
238
6,31
3(2
74)
(95,
513)
1,99
238
6,31
3P
HY
S. P
LA
NT
MA
INT
.17
730
,908
200
13,0
16(2
3)17
,892
200
13,0
16S
TU
DE
NT
AID
51,1
6160
,422
,491
46,9
4139
,897
,817
4,22
020
,524
,674
46,9
4139
,897
,817
S
CH
OLA
RS
HIP
S15
,595
33,9
69,1
7113
,944
23,2
92,0
231,
651
10,6
77,1
4813
,944
23,2
92,0
23
ST
UD
EN
T L
OA
NS
176
1,05
0,55
837
4,20
013
91,
046,
358
374,
200
G
RA
DU
AT
E F
ELL
OW
SH
IPS
778
4,05
8,76
573
31,
528,
081
452,
530,
684
733
1,52
8,08
1
AT
HLE
TIC
GR
T-I
N-A
ID34
,612
21,3
43,9
9732
,227
15,0
73,5
132,
385
6,27
0,48
432
,227
15,0
73,5
13P
RO
P/B
LD
GS
/EQ
UIP
8,71
376
,384
,690
8,90
247
,135
,072
(189
)29
,249
,618
8,90
247
,135
,072
OT
HE
R P
UR
PO
SE
S19
1,82
865
,161
,606
185,
643
49,4
54,6
176,
185
15,7
06,9
8918
5,64
349
,454
,617
TO
TA
LS
308,
024
$274
,832
,041
299,
610
$203
,650
,798
8,41
4$7
1,18
1,24
329
9,61
0$2
03,6
50,7
98
(7/0
1/09
- 6
/30/
10)
Yea
r-T
o-D
ate
Yea
r-T
o-D
ate
Yea
r-T
o-D
ate
(As
of 6
/30/
11)
(As
of 6
/30/
10)
(Fro
m 2
010
- 20
11)
TH
RO
UG
H J
UN
E 2
011
Thi
s Y
ear
Last
Yea
rC
hang
eLa
st F
isca
l Yea
r G
rand
Tot
als
YE
AR
TO
DA
TE
RE
PO
RT
- A
LL
SO
UR
CE
SP
UR
PO
SE
OF
GIF
T

Gift
sD
olla
rsG
ifts
Dol
lars
Gift
sD
olla
rsG
ifts
Dol
lars
AB
ING
TO
N1,
354
400,
644
1,21
260
6,45
814
2(2
05,8
14)
1,21
260
6,45
8A
GR
ICU
LT
UR
AL
SC
IEN
CE
S4,
907
7,91
9,73
85,
054
10,0
01,7
94(1
47)
(2,0
82,0
56)
5,05
410
,001
,794
AL
TO
ON
A2,
343
1,69
7,80
32,
045
2,26
4,22
329
8(5
66,4
20)
2,04
52,
264,
223
AR
TS
& A
RC
HIT
EC
TU
RE
7,11
117
,704
,577
6,91
67,
963,
645
195
9,74
0,93
26,
916
7,96
3,64
5B
EA
VE
R98
243
7,48
691
852
5,99
064
(88,
504)
918
525,
990
BE
HR
EN
D3,
682
6,62
7,32
93,
637
4,86
1,25
845
1,76
6,07
13,
637
4,86
1,25
8B
ER
KS
1,69
339
1,38
386
130
7,29
583
284
,088
861
307,
295
BR
AN
DY
WIN
E69
721
9,96
968
62,
866,
895
11(2
,646
,926
)68
62,
866,
895
CO
MM
UN
ICA
TIO
NS
1,62
41,
841,
389
1,60
71,
931,
400
17(9
0,01
1)1,
607
1,93
1,40
0D
ICK
INS
ON
SC
HO
OL
OF
LA
W89
080
8,83
498
97,
372,
746
(99)
(6,5
63,9
12)
989
7,37
2,74
6D
UB
OIS
1,00
132
4,98
01,
157
319,
894
(156
)5,
086
1,15
731
9,89
4E
AR
TH
& M
INE
RA
L S
CIE
NC
ES
3,77
413
,604
,867
4,05
813
,961
,403
(284
)(3
56,5
36)
4,05
813
,961
,403
TH
E E
BE
RL
Y C
OL
LE
GE
OF
SC
IEN
CE
5,50
65,
836,
682
5,70
54,
653,
661
(199
)1,
183,
021
5,70
54,
653,
661
ED
UC
AT
ION
4,84
03,
034,
634
4,94
81,
349,
337
(108
)1,
685,
297
4,94
81,
349,
337
ED
UC
AT
ION
AL
EQ
UIT
Y60
447
8,99
041
164
2,29
119
3(1
63,3
01)
411
642,
291
EN
GIN
EE
RIN
G10
,659
18,8
20,7
6811
,246
22,6
73,2
02(5
87)
(3,8
52,4
34)
11,2
4622
,673
,202
FA
YE
TT
E, T
HE
EB
ER
LY
CA
MP
US
546
433,
174
577
864,
930
(31)
(431
,756
)57
786
4,93
0G
RE
AT
VA
LL
EY
511
87,0
6559
625
9,76
2(8
5)(1
72,6
97)
596
259,
762
GR
EA
TE
R A
LL
EG
HE
NY
1,21
840
7,95
279
241
2,99
642
6(5
,044
)79
241
2,99
6H
AR
RIS
BU
RG
3,37
189
0,27
13,
135
1,79
0,03
523
6(8
99,7
64)
3,13
51,
790,
035
HA
ZL
ET
ON
859
433,
564
816
716,
659
43(2
83,0
95)
816
716,
659
HE
AL
TH
& H
UM
AN
DE
VE
LO
PM
EN
T5,
898
10,5
40,3
636,
013
6,31
8,73
2(1
15)
4,22
1,63
16,
013
6,31
8,73
2H
ER
SH
EY
124,
037
35,2
56,8
4312
1,79
533
,551
,278
2,24
21,
705,
565
121,
795
33,5
51,2
78IN
FO
RM
AT
ION
SC
IEN
CE
S &
TE
CH
NO
LO
GY
507
2,25
4,01
947
11,
237,
756
361,
016,
263
471
1,23
7,75
6IN
TE
RC
OL
LE
GIA
TE
AT
HL
ET
ICS
40,2
8383
,000
,518
36,8
4829
,875
,868
3,43
553
,124
,650
36,8
4829
,875
,868
LE
HIG
H V
AL
LE
Y62
011
7,65
449
711
9,11
112
3(1
,457
)49
711
9,11
1L
IBE
RA
L A
RT
S5,
989
19,5
25,0
206,
324
10,9
84,0
55(3
35)
8,54
0,96
56,
324
10,9
84,0
55M
ON
T A
LT
O1,
339
733,
466
1,51
861
3,12
2(1
79)
120,
344
1,51
861
3,12
2N
EW
KE
NS
ING
TO
N74
837
6,49
374
766
1,66
61
(285
,173
)74
766
1,66
6O
UT
RE
AC
H25
,078
6,55
1,95
125
,638
5,67
8,09
2(5
60)
873,
859
25,6
385,
678,
092
RE
SE
AR
CH
& G
RA
DU
AT
E S
CH
OO
L36
71,
026,
037
432
3,59
1,94
9(6
5)(2
,565
,912
)43
23,
591,
949
SC
HR
EY
ER
HO
NO
RS
CO
LL
EG
E
1,74
24,
948,
194
1,52
02,
421,
245
222
2,52
6,94
91,
520
2,42
1,24
5S
CH
UY
LK
ILL
985
592,
515
956
312,
835
2927
9,68
095
631
2,83
5S
HE
NA
NG
O
666
250,
453
709
357,
700
(43)
(107
,247
)70
935
7,70
0T
HE
SM
EA
L C
OL
LE
GE
OF
BU
SIN
ES
S8,
667
7,58
2,03
68,
768
7,01
3,60
3(1
01)
568,
433
8,76
87,
013,
603
ST
UD
EN
T A
FF
AIR
S9,
084
1,00
2,79
03,
396
732,
474
5,68
827
0,31
63,
396
732,
474
UN
DE
RG
RA
DU
AT
E E
DU
CA
TIO
N2,
638
5,44
4,28
22,
223
3,38
9,89
141
52,
054,
391
2,22
33,
389,
891
UN
IVE
RS
ITY
LIB
RA
RIE
S4,
545
2,09
0,60
14,
933
2,11
6,66
2(3
88)
(26,
061)
4,93
32,
116,
662
UN
IVE
RS
ITY
WID
E13
,396
9,08
3,58
916
,288
5,64
3,91
9(2
,892
)3,
439,
670
16,2
885,
643,
919
WIL
KE
S-B
AR
RE
1,
102
381,
783
1,11
91,
289,
800
(17)
(908
,017
)1,
119
1,28
9,80
0W
OR
TH
ING
TO
N S
CR
AN
TO
N96
698
5,56
089
494
7,52
172
38,0
3989
494
7,52
1Y
OR
K1,
195
685,
775
1,15
544
7,64
540
238,
130
1,15
544
7,64
5
TO
TA
L30
8,02
4$2
74,8
32,0
4129
9,61
0$2
03,6
50,7
988,
414
$71,
181,
243
299,
610
$203
,650
,798
(As
of 6
/30/
11)
(As
of 6
/30/
10)
(Fro
m 2
010
- 20
11)
(7/0
1/09
- 6
/30/
10)
Thi
s Y
ear-
To-
Dat
eLa
st Y
ear-
To-
Dat
eC
hang
e in
YT
D T
otal
sLa
st F
isca
l Yea
r G
rand
Tot
als

Endowment & Similar Funds Investment Review for Fiscal 2011 Submitted September 2011
This cover page provides a summary overview of the Pennsylvania State University Endowment and Similar Funds for Fiscal Year 2011. The second page summarizes Endowment-related data that is discussed on the remaining pages, along with in depth Endowment performance analysis.
Executive Overview Endowment Performance
Annualized net investment returns for the Penn State University Endowment (adjusted for the impact of gifts and spending, and after external investment management expenses) are shown below for periods ending June 30, 2011:
Fiscal 11 3 Years 5 Years 10 Years
23.2% 3.9% 5.9% 6.5%
Endowment & Similar Funds Market Value (pg 3)
Penn State University’s Endowment was valued at $1,708 million as of June 30, 2011, with an additional $123 million in Similar Funds. Review of Investment Markets (pg 4)
The graph below compares respective returns for 12-months ending June 30, 2010 and 2011 for the S&P 500, MSCI All Country World (ACW) ex-US, 91-day US Treasury Bills, Barclays Aggregate Bond, and publicly-traded Real Estate Investment Trusts (REITs) Indexes. As shown below, both US and non-US public equity returns for fiscal 2011 outpaced their 2010 performances, while domestic real estate (REITs) again outperformed other asset classes. For both years, bonds were positive while T-Bill returns were again negligible.
Investment Diversification and Asset Mix (pg 5)
At fiscal year-end, 59% of Endowment assets were invested in public equities (domestic and foreign), 17% in fixed income/cash, and 24% in private capital partnerships (venture capital, private buyouts, real estate, and natural resources).
Comparative Fund Performance (pg 6)
Penn State’s Endowment returned 23.2% net for the year ending June 30, 2011 versus 22.5% for the Passive Policy Portfolio, largely due to strong public equity manager performance relative to passive benchmarks. The Endowment’s 3- and 5-yr relative performance was slightly better than respective passive benchmarks.
Endowment Liquidity (pg 7)
With approximately one-half of its assets convertible to cash in a matter of days, the Endowment maintains adequate liquidity to satisfy anticipated cash requirements.
Endowment Performance and Spending (pg 8)
The Penn State Endowment’s average annual net returns of 6.5% and 8.8% over the last 10 and 20 years, respectively, have allowed the Endowment to maintain inflation-adjusted spending while achieving long-term intergenerational equity.
14.4 10.9
0.29.5
53.9
30.7 30.3
0.2 3.9
34.1
S&P World Ex US Tbills Bonds REITs
2010
2011
Investment Market Returns Fiscal Years Ending June 30
9/9/2011 F&PP
(Appendix III) - 1 -

5-Year Endowment Facts and Figures
Penn State Investment Council (PSIC) Meetings
August 13, 2010:
Committing $15 million to Wellspring Capital Partners V, L.P. October 29, 2010:
Maintain Penn State’s Endowment spending at a 4.5% annual rate. Committing $10 million to Yorktown Energy IX, L.P. Committing $15 million to EnCap Energy VIII, L.P.
December 12, 2010:
Committing $15 million to Oaktree Real Estate Opportunities Fund V, L.P. March 17, 2011:
Committing $4M to IDG Accel China Growth Fund III, L.P. Committing $6M to IDG Accel China Capital Fund II, L.P.
June 24, 2011:
Committing $3M to Accel Growth Fund II, L.P. Committing $2M to Accel XI, L.P Committing $10M to Emergence Capital Partners III, L.P. Committing $10M to GSR Ventures IV, L.P.
Please note that commitments made to Limited Partnerships (LPs) are not immediately invested and are called (paid in) over several years until commitment is satisfied, except as noted.
----———-—— Annual Periods Ending June 30 —————---- 2011 2010 2009 2008 2007 Investment Performance Endowment1 23.2% 14.3% -20.1% -1.9% 21.2% (annualized net returns) Market Values ($ millions) Endowment1 1,708.4 1,341.5 1,183.9 1,487.9 1,538.7 Similar Funds2 122.7 97.6 97.4 127.7 131.5 Endowment and Similar Funds 1,831.1 1,439.1 1,281.3 1,615.6 1,670.2 Gifts & Other Additions ($ mils) 136.3 62.5 61.2 47.8 55.2 Current Spending ($ mils) 66.0 63.4 65.1 60.4 58.3 1) Endowment assets over which Penn State’s Office of Investment Management (OIM) has investment responsibility, as approved by the Penn State Investment Council (PSIC).
2) Similar Funds — includes donor-restricted and deferred gifts, plus funds in transit to Endowment.
9/9/2011 F&PP
(Appendix III) - 2 -
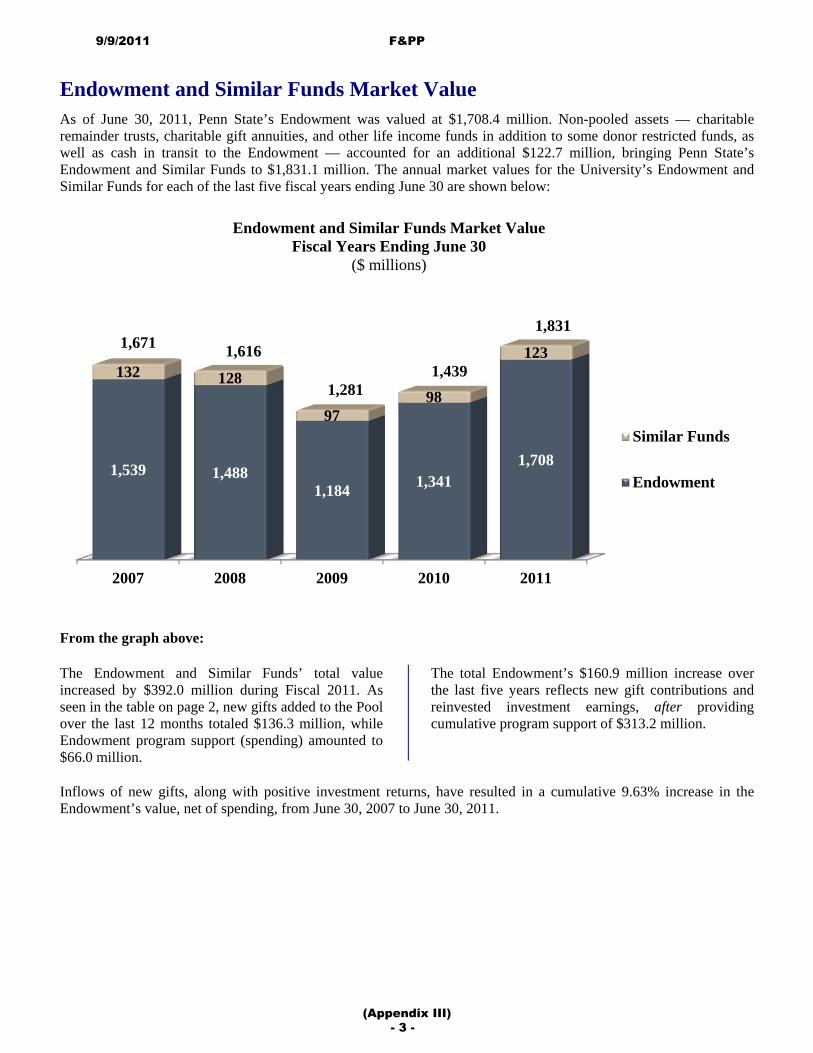
Endowment and Similar Funds Market ValueAs of June 30, 2011, Penn State’s Endowment was valued at $1,708.4 million. Non-pooled assets — charitable remainder trusts, charitable gift annuities, and other life income funds in addition to some donor restricted funds, as well as cash in transit to the Endowment — accounted for an additional $122.7 million, bringing Penn State’s Endowment and Similar Funds to $1,831.1 million. The annual market values for the University’s Endowment and Similar Funds for each of the last five fiscal years ending June 30 are shown below:
From the graph above:
The Endowment and Similar Funds’ total value increased by $392.0 million during Fiscal 2011. As seen in the table on page 2, new gifts added to the Pool over the last 12 months totaled $136.3 million, while Endowment program support (spending) amounted to $66.0 million.
The total Endowment’s $160.9 million increase over the last five years reflects new gift contributions and reinvested investment earnings, after providing cumulative program support of $313.2 million.
Inflows of new gifts, along with positive investment returns, have resulted in a cumulative 9.63% increase in the Endowment’s value, net of spending, from June 30, 2007 to June 30, 2011.
2007 2008 2009 2010 2011
1,539 1,4881,184 1,341
1,708
132 128
9798
123
Similar Funds
Endowment
1,671 1,616
1,281 1,439
Endowment and Similar Funds Market Value Fiscal Years Ending June 30
($ millions)
1,831
9/9/2011 F&PP
(Appendix III) - 3 -

Review of Investment Markets in Fiscal 2011 Following a year of strong double-digit gains, equities in Fiscal 2011 again handily outperformed fixed income returns, while non-US indexes generally lagged domestic equity markets. The performance of investment markets that directly impact Penn State University’s Endowment is discussed below. US Equities
The S&P 500 returned 30.7% for the 12 months ending June 30, 2011, compared to 14.4% for Fiscal 2010, while the large-cap biased Dow Jones Industrial Index returned 30.4% and 18.9%, respectively. Small-capitalization stocks, as measured by the Russell 2000 Index, returned 37.4% versus 21.5% last year. The Nasdaq Index’s 31.5% return was comparable to the broad domestic indexes in fiscal 2011, and exceeded its 2010 return of 14.9%. Non-US Equities
Equities outside the United States generally matched those in the US as the Morgan Stanley All Country World (ACW) Index ex-US returned 30.3% for the 12-month period ending June 30, 2011. This was well above its Fiscal 2010 return of 10.9%. Emerging market equities in developing countries returned 28.2% over the last 12 months, somewhat above their 23.5% return in Fiscal 2010. Fixed Income
Barclays Capital Aggregate Bond Index (various maturities of US Government and non-government domestic bonds) returned 3.9% in Fiscal 2011 versus 9.5% in 2010. US Treasury Bonds returned -1.1% in Fiscal 2011 versus 12.0% a year earlier.
For Fiscal 2011, 91-day Treasury Bills again earned 0.2% and Treasury Inflation Protected Securities (TIPS) returned 7.7% in Fiscal 2011 compared to 9.5% in Fiscal 2010. Real Estate
Publicly-traded Real Estate Investment Trusts (REITs) returned 34.1% for the Fiscal year ended June 2011 compared to 53.9% in 2010. Privately-held real estate investment partnerships, as measured by the largely commercial property NCREIF Index, rebounded to earn 16.0% in Fiscal 2011 compared to -9.6% in 2010. Alternatives
Private Equity Buyouts and Venture Capital increased as well, averaging returns of 21.3% and 18.4%, respectively, for the 12 months ending March 31, 2011 (private capital partnerships are reported on a 3-month lag). In the previous 12-month period ending March 31, 2010, Private Equity returned 22.5%, while Venture Capital was at 6.4%. By comparison, the Russell 2000 Index of small-capitalization stocks returned 25.8% for the 12 months ending March 31, 2011 and 62.8% for the year ending March 31, 2010.
Economic and Market Outlook
In the 12 months ending June 30, 2011, global equity markets continued the rally that began in March of 2008. However, unlike 2009, US equities lead the world indexes. Fixed income markets provided a fourth consecutive year of positive returns, as the Federal Reserve continued to hold down interest rates to alleviate credit market distress brought on by the decline in housing prices and the accompanying deleveraging. Looking ahead, expectations for domestic corporate profits have brightened in the face of improving credit concerns and a recovering economy.
Penn State’s well-diversified endowment portfolio — consisting of public equities, private partnerships, bonds, and hedge funds in addition to inflation-sensitive “real assets” — continues to be the most appropriate investment approach for long-term growth and sustainable spending.
9/9/2011 F&PP
(Appendix III) - 4 -

Investment Diversification and Asset Mix
Asset allocation is a primary determinant of investment performance and risk control. The Endowment’s asset mix combines three very broad asset categories - public equities, private capital, and fixed income - to maximize potential returns, while tempering volatility. Reflecting a desire to support generous spending and the need to preserve purchasing power in light of changing market and economic conditions, the Penn State Investment Council (PSIC) regularly reviews the Endowment’s investment policy.
In the graph below, the three macro categories – public equities, fixed income, and private capital – are shown in the outermost ring with their June 30, 2011 allocations of 59%, 17%, and 24%, respectively.
At a more granular level, the Endowment’s diversified portfolio includes a variety of asset classes that comprise the three macro categories, as shown by the slices within the inner pie (percentages are rounded):
59% in Public Equities includes publicly-traded US (37%) and non-US (14%) common stocks, and equity-oriented hedge funds (8%).
17% in Fixed Income includes 13% in nominal bonds (largely US government bonds), 3% in Global Treasury Inflation Protected Securities (Global TIPS), and 1% in an absolute-return hedge fund.
24% in Private Capital includes the following private partnerships: 14% private equity (venture capital, leveraged buy-outs, distressed-debt), and 10% in real assets (private and public real estate, and energy).
The individual asset classes above represent market values as of June 30, 2011; however, the percentages fluctuate over time depending on market trends and allocations approved by the Penn State Investment Council. The approximately 83% currently allocated to public equities and private capital is intended to take advantage of capital growth and purchasing power protection offered by equity-type investments. On the other hand, the 17% invested in fixed income is intended to provide diversification and stability during times of market turbulence.
Private Capital
Fixed Income
Public Equities
USEQUITY
37%
NON-US EQUITY
14%EQUITYHF8%
FI HF1%
NOMINAL BONDS
13%
GLOBALTIPS3%
REITS2%
REAL8%
VC\LBO14%
9/9/2011 F&PP
(Appendix III) - 5 -

Endowment Performance Compared to Passive Portfolio The Endowment’s investment performance is measured against a hypothetical Passive Portfolio, comprised of three broad asset categories: Public Equities, Private Capital, and Fixed Income. This passive portfolio serves as a blended benchmark against which the performance of the actual, actively-managed Endowment is monitored. In the table below, the respective static weightings of the three major asset categories, along with respective sub categories, are associated with corresponding market benchmarks to generate Passive Portfolio returns over 1-, 3-, and 5-year horizons:
- Annualized Benchmark Returns -
Asset Class Benchmark Weighting 1 Year 3 Years 5 Years
Public Equities (listed on stock exchanges)
US Equities S&P 500 Index 40% 30.7 3.3 2.9
Non-US Equities All Country World ex US Index 15 30.3 0.1 4.1
Private Capital (non-marketable alternatives)
Private Equity CA Private Equity Composite 15% 21.3 4.3 10.4
Venture Capital CA Venture Capital Composite 5 18.4 1.4 5.9
Private Real Estate NCREIF Index 5 16.0 -3.6 3.7
Fixed Income/Cash
Total US Bonds Barclays Aggregate Bonds 20% 3.9 5.9 5.8
Total Passive Portfolio (net) 100% 22.5% 3.2% 5.1% Note: the above categories / sub-categories are very broad and are assumed to be constant over the entire 5-yr period, much like a traditional balanced portfolio. As shown on the previous page, the actual endowment portfolio is comprised of several separate portfolios whose periodic weights vary as a result of fluctuating market returns.
As shown above, Penn State’s Endowment returned 23.2% net for Fiscal 2011, surpassing the 22.5% return of the Passive Portfolio. For the trailing 3- and 5-years, the Passive Portfolio would have realized annualized returns of 3.2% and 5.1%, respectively.
By comparison, the Endowment’s actual 3- and 5-year returns outperformed in each period, netting 3.9% and 5.9%, respectively. Overall, this shows that the Endowment’s investment managers augmented the performance relative to passive benchmarks.
The Passive Portfolio provides a guidepost to help achieve long-term results that are consistent with the twin objectives of purchasing-power preservation, along with stable endowment spending. The Endowment’s performance varies from the static Passive Portfolio as a consequence of several factors, including but not limited to the following: timing of cash-flows into and out of the Endowment, tactical shifts in asset mix, and individual investment manager performance.
22.5%
3.2%5.1%
23.2%
3.9%5.9%
Passive Portfolio
PSU Endowment
1 Year 3 Year 5 Year
Penn State Endowment vs Passive Portfolio
9/9/2011 F&PP
(Appendix III) - 6 -

Endowment Liquidity The financial crisis that erupted in 2008 was characterized, among other considerations, by lack of liquidity. Many institutions were unable to meet current obligations due to lack of available cash. This was exacerbated by their inability to readily convert some assets to cash because of reduced trading volumes in some financial instruments.
In the graph below, Endowment assets are classified according to how quickly they can be converted to cash. Most securities listed on exchanges or traded over-the-counter, and held at our custodian bank in separately managed accounts, can be liquidated on a daily basis (typically 1- and 3-day settlement for bonds and stocks, respectively). Commingled portfolios, i.e., collectively-managed investment pools of publicly-traded securities, are eligible for purchase or sale at least once a month. Hedge fund partnerships are typically open for at least partial liquidation once a year, with some having more and/or less frequent liquidity “windows.” Non-marketable partnerships are considered illiquid primarily because of the inherent inability of limited partners to transact at will.
Observations from the blue (left) bars of each of the four pairs above for the period ending June 30, 2011:
51% percent of Endowment assets are invested in stocks and bonds that can be converted to cash in a matter of days. Of this, about 2% is held in money market accounts, along with approximately 5% in “securitized cash” (i.e., fully collaterized equities/treasuries futures), to minimize the possibility that other assets will need to be liquidated to satisfy day-to-day and/or unforeseen cash requirements.
Commingled portfolios, primarily non-US public equity portfolios, comprise 16% of Endowment assets and can be converted to cash monthly or sooner.
9% of Endowment assets are invested in six hedge fund partnerships and can be at least partially converted to cash annually or in some cases quarterly.
24% percent of Endowment assets are invested in 90 different partnerships or other non-marketable assets investments which are conservatively considered illiquid because of uncertain timing of future cash flows.
The foregoing indicates that the Endowment maintains sufficient liquidity to satisfy anticipated cash requirements. Increased Liquidity and Investment Performance
As shown above, the liquidity profile of Penn State’s Endowment changed slightly from the end of Fiscal 2010 (tan bars) to the end of Fiscal 2011 (blue bars). Daily liquidity increased from 50% to 51% Meanwhile, monthly liquidity increased from 15% to 16% while yearly remained flat at 9%. Illiquid non-marketable alternative assets decreased from 26% to 24% of Endowment assets in Fiscal 2011. Overall, this decreased current liquidity helped the Endowment take advantage improving equity markets worldwide.
9/9/2011 F&PP
(Appendix III) - 7 -

Endowment Investment Return (8.8% per yr)
Program Support
Inflation (HEPI)
Real Growth
Cumulative 20-year Returns
Long-Term Endowment Growth and Spending
In the chart below, the top line represents the cumulative net investment return of the Penn State Endowment over the last 20 years. The layers illustrate investment return apportioned to program support (spending) and inflation (as measured by the Higher Education Price Index [HEPI]), with the remaining residual representing net, real (inflation-adjusted) growth.
The Endowment’s primary investment goal is to earn a long-term rate of return sufficient to support current spending and to preserve future purchasing power. This two-pronged objective is illustrated by apportioning total nominal (i.e., before adjusting for inflation) investment return (top line above) into discrete layers, representing program support and inflation, along with a residual layer corresponding to net real growth. Because investment returns periodically fluctuate (illustrated by the jagged topography above), real growth, which nets out program support and inflation from total endowment return, oscillates across the horizontal “intergenerational equity” line. While market fluctuations have caused the growth layer to swing positive and negative, “intergenerational equity” has largely been achieved.
Two Very Different Decades of Market Performance
The variable nature of investment returns is characterized in the below table which bifurcates the last 20 years into two successive 10-year periods, whose respective investment returns differed widely. The 10 years ending June 2001 (second row) benefitted from an extended equity bull market, while the 10 years ending June 2011 (first row) suffered two large sell-offs in equities, as shown by the S&P 500’s significant return disparities (left column, last row) below:
10-Year Periods ----------- Annual Nominal Returns ----------- ------ Annual Real Returns ------ Ending June 30 S&P 500 Bond Index Endowment HEPI S&P Bonds Endowment 2001 to 2011 2.7% 5.8% 6.5% 3.1% -0.4% 2.7% 3.4% 1991 to 2001 15.1 7.9 11.3 3.3 11.8 4.6 8.0 Diff (percentage points) -12.4%p -2.1%p -4.8%p -0.2%p -12.2%p -1.9%p -4.6%p As shown by the negative differentials in the last row above, investment returns for the most recent 10 years lagged those for the previous 10 years in every instance. Owing to the severity of two bear markets, the S&P 500’s 2.7% annualized nominal return for the 10-year period ending June 2011 trailed its 15.1% pace for the 10-year period ending June 2001 by a remarkable 12.4%p (percentage points). Over the same two periods, the respective return difference for bonds (Barclays Aggregate Bond Index) was -2.1%p and for the Endowment was -4.9%p, net of fees.
On an inflation-adjusted basis relative to HEPI (boxed column in above table), the Endowment’s net real return difference was -4.6%p, compared to real differences of -12.2%p for stocks and -1.9%p for bonds (last row of the right three columns above). Over the past decade, decreased public equity exposure along with increased “alternative investments” has enabled the Endowment to outperform both stocks and bonds (nominal and real) for the 10 years ending June 2011, when overall investment returns were substantially lower than the prior 10-year period.
9/9/2011 F&PP
(Appendix III) - 8 -

(Appendix II) -1-
9/9/2011 F&PP
Uni
vers
ity P
ark
NEv
a J.
Pel
l Lab
orat
ory
for
Adv
ance
d B
iolo
gica
l Res
earc
h

(Appendix I.5) -1-
9/9/2011 F&PP
N
Stat
e C
olle
ge
Form
er M
ello
n Pr
oper
ty

(Appendix I.5) -2-
9/9/2011
F&PP
N
Stat
e C
olle
ge
Form
er M
ello
n Pr
oper
ty P
arce
l to
be s
old
Chu
rch
of L
atte
r Day
Sai
nts
PSU
Pro
pert
y
PSU
Pro
pert
y
Stat
e Col
lege
Bor
ough
Ferg
uson
Tow
nshi
p