a a report
TRANSCRIPT

Approved January 18, 2012 TOC-1
Approved Assessment Report: Toronto and Region Source Protection Area
Table of ConTenTs
DaTa sourCes anD analysis
a DaTa sourCes anD analysis ....................................................................................a-1
A1.1 Data Sources Matrix ................................................................................................................................. A-1 A1.2 Monitoring Data Sources ......................................................................................................................... A-1 A1.2.1 Stream Flow Gauging ..................................................................................................................... A-8 A1.2.2 Precipitation/Meteorological Gauging ......................................................................................... A-8 A1.2.3 Snow Cover Monitoring ................................................................................................................. A-8 A1.2.4 Groundwater Monitoring ............................................................................................................... A-8 A1.2.5 Surface Water Quality................................................................................................................... A-22 A1.2.6 Low-Flow Stream Flow Surveys .................................................................................................. A-30 A1.2.7 Biological Monitoring ................................................................................................................... A-31 A1.2.8 Coastal Wetland Monitoring ........................................................................................................ A-34 A1.3 Information Management System ......................................................................................................... A-36 A1.4 Methods of Analysis ................................................................................................................................ A-37 A1.5 Surface Water Quality Data Analysis and Reporting ........................................................................... A-37 A1.5.1 Exploratory Analysis .................................................................................................................... A-37 A1.5.2 Statistical Analysis......................................................................................................................... A-38 A1.5.3 Reporting Results .......................................................................................................................... A-38 A1.6 Groundwater Quality Data Analysis and Reporting ............................................................................ A-38 A1.6.1 Data Compilation .......................................................................................................................... A-38 A1.6.2 Data Analysis ................................................................................................................................. A-38 A1.6.3 Analysis of Trends at Each Monitoring Well ............................................................................. A-39 A1.6.4 Aquifer Characterization .............................................................................................................. A-39 A1.7 Limitations: Data, Assumptions, and Methods .................................................................................... A-39 A1.7.1 Filling Data Gaps ........................................................................................................................... A-40 A1.7.2 Method Limitations....................................................................................................................... A-41
lisT of Tables
Table A-1: Data Sources for the Assessment Report............................................................................................ A-2Table A-2: Monitoring Databases and Data Descriptions .................................................................................... A-6Table A-3: TRCA/ Provincial Stream Gauge Network ......................................................................................... A-9Table A-4: TRCA Climate Stations ........................................................................................................................ A-14Table A-5: Snow Course Locations ....................................................................................................................... A-21Table A-6: Groundwater Monitoring Locations ................................................................................................. A-21Table A-7: Current Surface Water Quality Sites ................................................................................................. A-22Table A-8: Historical Surface Water Quality Sites .............................................................................................. A-24Table A-9: Low Flow Index Monitoring Stations ................................................................................................ A-31Table A-10: TRCA O.S.A.P Monitoring Sites ....................................................................................................... A-32Table A-11: Durham Region Coastal Wetland Monitoring Project locations ................................................... A-35Table A-12: Data Gaps ........................................................................................................................................... A-40Table A-13: Knowledge Gaps ................................................................................................................................ A-40
Approved January 18, 2012A-1
Appendix A: Data Sources and Analysis
a DaTa sourCes anD analysis
a1.1 DaTa sourCes MaTrix
To organize the data sources required for preparation of the Assessment Report, the province has developed an Excel file called the Source Water Protection (SWP) Data Requirements Matrix. The matrix is intended to:
• Provide a complete list of available data sets for SWP,
• Help inventory and evaluate local data,
• Help identify data gaps,
• Facilitate data request process; and,
• Facilitate communications around data between neighbouring Conservation Authorities and their SWP watershed region.
The matrix includes data set names, data descriptions, data access, data sources, and links to metadata. The file also includes a list of data sources required to build particular maps. Requests for data have been made by Toronto and Region Conservation (TRCA) staff to the province and the upper tier municipalities. TRCA staff maintains an inventory of the data and metadata received to date.
a1.2 MoniToring DaTa sourCes
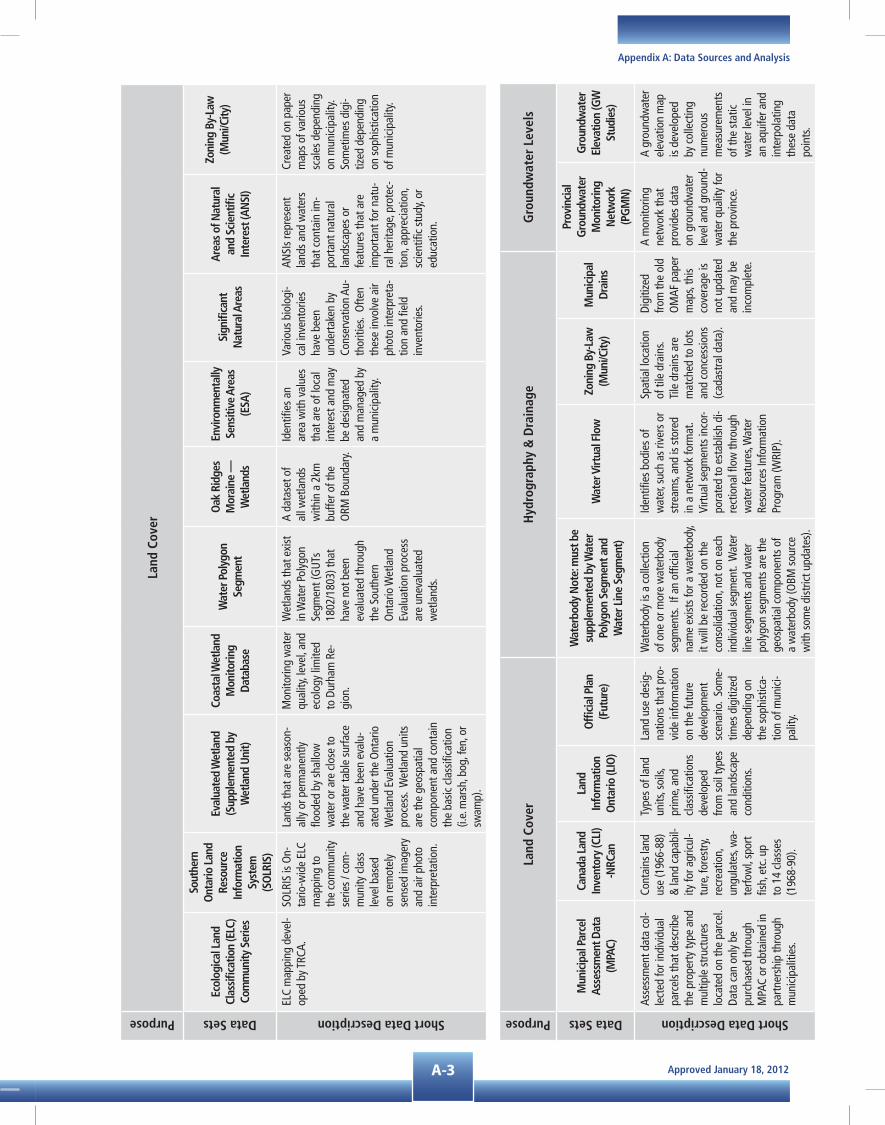
TRCA’s monitoring networks provide an ongoing source of data that support numerous programs, including Drinking Water Source Water Protection. TRCA’s monitoring databases that are relevant to source water protection planning are summarized in Table a-1, which includes data type, status, and spatial coverage and Table a-2 describes other monitoring databases. TRCA’s monitoring network incorporates both provincial and federal monitoring partnership programs. This monitoring network collects information pertaining, but not limited to, the following data types:
• Climate (Environment Canada, TRCA, as well as the regional municipalities)
• Precipitation; and,
• Temperature.
• Surface water (Environment Canada, TRCA)
• Continuous stream gauges,
• Low flow measurements; and,
• Surface water quality (Provincial Water Quality Monitoring Network – PWQMN.
• Groundwater (TRCA, Municipalities)
• Water levels; and,
• Quality.
Other monitoring programs, such as aquatic ecosystem studies conducted by the province and conservation authorities, also contributed to the development the Assessment Report. Surface water quality is important to the overall monitoring of watershed health, and is necessary to determine chemical loadings to Lake Ontario, the source of water supply for the majority of the population.

Approved January 18, 2012 A-2
Approved Assessment Report: Toronto and Region Source Protection Area
Tabl
e a
-1:
Dat
a so
urce
s fo
r th
e a
sses
smen
t r
epor
t Purpose
Boun
dari
es
Data Sets
Wat
er R
esou
rces
In
form
atio
n Pr
ogra
m (W
RIP)
Land
Ow
ners
hip
Wat
ersh
ed,
Qua
tern
ary
Mun
icip
al
Boun
dary
Prov
inci
al D
igita
l El
evat
ion
Mod
el
(DEM
) —
Tile
d
Prov
inci
al D
EM —
Tile
d (V
ersio
n 2)
Ort
ho/D
TM
DEM
Loca
l DEM
(M
unic
ipal
ities
—
Ort
hos)
Rive
r Cro
ss
Sect
ions
Short Data Description
Iden
tifies
the
asso
-ci
ated
Con
serv
atio
n Au
thor
ities
wor
king
co
oper
ativ
ely
on
Sour
ce W
ater
Pro
-te
ctio
n ob
ject
ives
.
Iden
tifies
ow
ners
hip
and
gene
ral u
se o
f the
land
. It
incl
udes
cro
wn
land
, priv
ate
land
, and
fede
ral l
and
(e.g
., In
dian
Res
erve
s).
Indi
an
Rese
rves
and
oth
er fe
dera
l la
nds
wer
e de
rived
from
th
e O
ntar
io B
ase
Map
ping
(O
BM).
A fo
urth
leve
l dr
aina
ge a
rea.
Th
ey a
re s
ubdi
vi-
sions
of t
ertia
ry
wat
ersh
eds.
Exte
nts
of th
e fo
llow
ing
mun
ici-
pal u
nits
:
1) U
pper
Tier
M
unic
ipal
ities
,
2) L
ower
Tier
M
unic
ipal
ities
.
A DE
M ra
ster
dat
a se
t tha
t cov
ers
the
Prov
ince
of O
ntar
io.
DEM
that
pro
vide
s gr
eate
r el
evat
ion
info
rmat
ion
whe
re
Digi
tal T
erra
in M
odel
s (D
TM),
SPOT
hei
ghts
, and
con
stan
t la
ke e
leva
tions
are
inco
rpo-
rate
d.
A DE
M g
ener
-at
ed fr
om th
e 20
02 o
rthop
ho-
togr
aphy
pro
ject
fo
r Sou
ther
n O
ntar
io.
DEM
pro
duct
s de
velo
ped
inde
pend
ently
of
fede
ral/p
rovi
ncia
l go
vern
men
t in
itiat
ives
.
Cros
s se
ctio
n da
ta th
at in
-cl
udes
dep
th a
nd
posit
ion
of ri
vers
an
d st
ream
s.
Purpose
Soils
& G
eolo
gyCe
nsus
Data Sets
ELC
Aggr
egat
e Ex
trac
tion
CAN
SIS
- Ont
ario
Soi
l Su
rvey
sG
eolo
gica
l Sur
vey
of C
anad
a (G
SC)
Phys
iogr
aphy
of
Sou
ther
n O
ntar
ioCe
nsus
of A
gric
ultu
reCe
nsus
of P
opul
atio
n
Short Data Description
Digi
tized
from
air
phot
os.
Show
s th
e bo
unda
ry o
f act
ual
extra
ctio
n at
the
time
of p
hoto
g-ra
phy.
Soil
surv
eys
gene
rate
d m
ainl
y fo
r agr
icul
tura
l ar
eas
acro
ss O
ntar
io, a
ll ho
used
with
in th
e Ca
-na
dian
Soi
ls In
form
atio
n Sy
stem
(CAN
SIS)
. Da
ta
are
avai
labl
e by
cou
nty.
Surfi
cial
dep
osit
type
s, m
ater
ial
type
s, an
d ge
o-lo
gica
l fea
ture
s (e
.g.,
drum
lins,
eske
rs, h
um-
moc
ky m
orai
ne,
hum
moc
ky
glac
ioflu
vial
).
Upda
ted
surfi
cial
ge
olog
y m
appi
ng fo
r th
e O
RM b
ased
on
new
fiel
dwor
k an
d ae
rial p
hoto
grap
hic
inte
rpre
tatio
n,
com
plem
ente
d by
ar
chiv
al fi
eld
data
.
The
dist
ribut
ion
of
bedr
ock
units
and
ge
olog
ical
rock
ty
pes.
Seam
less
co
vera
ge o
f be
droc
k to
pog-
raph
y an
d se
di-
men
t thi
ckne
ss
surfa
ces.
Maj
or p
hysio
-gr
aphi
c un
its
incl
ude,
am
ong
othe
rs, t
ill p
lain
s, til
l mor
aine
s, sa
nd p
lain
s, ka
me
mor
aine
s, an
d gl
acia
l sp
illw
ays.
Desc
ribes
the
agric
ultu
re
indu
stry
(e.g
., nu
mbe
r an
d ty
pe o
f far
ms,
farm
op
erat
or c
hara
cter
istic
s, an
d la
nd m
anag
emen
t pr
actic
es).
Data
are
tied
to
spa
tial C
ensu
s Are
a bo
unda
ries.
2006
pop
ulat
ion
and
dwel
ling
coun
ts a
s w
ell
as in
form
atio
n re
gard
ing
dem
ogra
phic
, soc
ial,
and
econ
omic
cha
ract
erist
ics.
Data
are
tied
to s
patia
l ce
nsus
are
a bo
unda
ries.
Approved January 18, 2012A-3
Appendix A: Data Sources and Analysis
Purpose
Land
Cov
er
Data Sets
Ecol
ogic
al L
and
Clas
sifica
tion
(ELC
) Co
mm
unity
Ser
ies
Sout
hern
O
ntar
io L
and
Reso
urce
In
form
atio
n Sy
stem
(S
OLR
IS)
Eval
uate
d W
etla
nd
(Sup
plem
ente
d by
W
etla
nd U
nit)
Coas
tal W
etla
nd
Mon
itorin
g Da
taba
se
Wat
er P
olyg
on
Segm
ent
Oak
Rid
ges
Mor
aine
—W
etla
nds
Envi
ronm
enta
lly
Sens
itive
Are
as
(ESA
)
Sign
ifica
nt
Nat
ural
Are
as
Area
s of N
atur
al
and
Scie
ntifi
c In
tere
st (A
NSI
)
Zoni
ng B
y-La
w
(Mun
i/City
)
Short Data Description
ELC
map
ping
dev
el-
oped
by T
RCA.
SOLR
IS is
On-
tario
-wid
e EL
C m
appi
ng to
th
e co
mm
unity
se
ries
/ com
-m
unity
cla
ss
leve
l bas
ed
on re
mot
ely
sens
ed im
ager
y an
d ai
r pho
to
inte
rpre
tatio
n.
Land
s th
at a
re s
easo
n-al
ly o
r per
man
ently
flo
oded
by
shal
low
w
ater
or a
re c
lose
to
the
wat
er ta
ble
surfa
ce
and
have
bee
n ev
alu-
ated
und
er th
e O
ntar
io
Wet
land
Eva
luat
ion
proc
ess.
Wet
land
uni
ts
are
the
geos
patia
l co
mpo
nent
and
con
tain
th
e ba
sic c
lass
ifica
tion
(i.e.
mar
sh, b
og, f
en, o
r sw
amp)
.
Mon
itorin
g w
ater
qu
ality
, lev
el, a
nd
ecol
ogy
limite
d to
Dur
ham
Re-
gion
.
Wet
land
s th
at e
xist
in
Wat
er P
olyg
on
Segm
ent (
GUT
s 18
02/1
803)
that
ha
ve n
ot b
een
eval
uate
d th
roug
h th
e So
uthe
rn
Ont
ario
Wet
land
Ev
alua
tion
proc
ess
are
unev
alua
ted
wet
land
s.
A da
tase
t of
all w
etla
nds
with
in a
2km
bu
ffer o
f the
O
RM B
ound
ary.
Iden
tifies
an
area
with
val
ues
that
are
of l
ocal
in
tere
st a
nd m
ay
be d
esig
nate
d an
d m
anag
ed b
y a
mun
icip
ality
.
Vario
us b
iolo
gi-
cal i
nven
torie
s ha
ve b
een
unde
rtake
n by
Co
nser
vatio
n Au
-th
oriti
es.
Ofte
n th
ese
invo
lve
air
phot
o in
terp
reta
-tio
n an
d fie
ld
inve
ntor
ies.
ANSI
s re
pres
ent
land
s an
d w
ater
s th
at c
onta
in im
-po
rtant
nat
ural
la
ndsc
apes
or
feat
ures
that
are
im
porta
nt fo
r nat
u-ra
l her
itage
, pro
tec-
tion,
app
reci
atio
n,
scie
ntifi
c st
udy,
or
educ
atio
n.
Crea
ted
on p
aper
m
aps
of v
ario
us
scal
es d
epen
ding
on
mun
icip
ality
. So
met
imes
dig
i-tiz
ed d
epen
ding
on
sop
hist
icat
ion
of m
unic
ipal
ity.
Purpose
Land
Cov
erH
ydro
grap
hy &
Dra
inag
eG
roun
dwat
er L
evel
s
Data Sets
Mun
icip
al P
arce
l As
sess
men
t Dat
a (M
PAC)
Cana
da L
and
Inve
ntor
y (C
LI)
-NRC
an
Land
In
form
atio
n O
ntar
io (L
IO)
Offi
cial
Pla
n (F
utur
e)
Wat
erbo
dy N
ote:
mus
t be
supp
lem
ente
d by
Wat
er
Poly
gon
Segm
ent a
nd
Wat
er L
ine
Segm
ent)
Wat
er V
irtua
l Flo
wZo
ning
By-
Law
(M
uni/C
ity)
Mun
icip
al
Drai
ns
Prov
inci
al
Gro
undw
ater
M
onito
ring
Net
wor
k (P
GM
N)
Gro
undw
ater
El
evat
ion
(GW
St
udie
s)
Short Data Description
Asse
ssm
ent d
ata
col-
lect
ed fo
r ind
ivid
ual
parc
els
that
des
crib
e th
e pr
oper
ty ty
pe a
nd
mul
tiple
stru
ctur
es
loca
ted
on th
e pa
rcel
. Da
ta c
an o
nly
be
purc
hase
d th
roug
h M
PAC
or o
btai
ned
in
partn
ersh
ip th
roug
h m
unic
ipal
ities
.
Cont
ains
land
us
e (1
966-
88)
& la
nd c
apab
il-ity
for a
gric
ul-
ture
, for
estry
, re
crea
tion,
un
gula
tes,
wa-
terfo
wl,
spor
t fis
h, e
tc. u
p to
14
clas
ses
(196
8-90
).
Type
s of
land
un
its, s
oils,
pr
ime,
and
cl
assifi
catio
ns
deve
lope
d fro
m so
il ty
pes
and
land
scap
e co
nditi
ons.
Land
use
des
ig-
natio
ns th
at p
ro-
vide
info
rmat
ion
on th
e fu
ture
de
velo
pmen
t sc
enar
io.
Som
e-tim
es d
igiti
zed
depe
ndin
g on
th
e so
phist
ica-
tion
of m
unic
i-pa
lity.
Wat
erbo
dy is
a c
olle
ctio
n of
one
or m
ore
wat
erbo
dy
segm
ents
. If
an o
ffici
al
nam
e ex
ists
for a
wat
erbo
dy,
it w
ill b
e re
cord
ed o
n th
e co
nsol
idat
ion,
not
on
each
in
divi
dual
seg
men
t. W
ater
lin
e se
gmen
ts a
nd w
ater
po
lygo
n se
gmen
ts a
re th
e ge
ospa
tial c
ompo
nent
s of
a
wat
erbo
dy (O
BM s
ourc
e w
ith s
ome
dist
rict u
pdat
es).
Iden
tifies
bod
ies
of
wat
er, s
uch
as ri
vers
or
stre
ams,
and
is st
ored
in
a n
etw
ork
form
at.
Virtu
al s
egm
ents
inco
r-po
rate
d to
est
ablis
h di
-re
ctio
nal fl
ow th
roug
h w
ater
feat
ures
, Wat
er
Reso
urce
s In
form
atio
n Pr
ogra
m (W
RIP)
.
Spat
ial l
ocat
ion
of ti
le d
rain
s. Ti
le d
rain
s ar
e m
atch
ed to
lots
an
d co
nces
sions
(c
adas
tral d
ata)
.
Digi
tized
fro
m th
e ol
d O
MAF
pap
er
map
s, th
is co
vera
ge is
no
t upd
ated
an
d m
ay b
e in
com
plet
e.
A m
onito
ring
netw
ork
that
pr
ovid
es d
ata
on g
roun
dwat
er
leve
l and
gro
und-
wat
er q
ualit
y fo
r th
e pr
ovin
ce.
A gr
ound
wat
er
elev
atio
n m
ap
is de
velo
ped
by c
olle
ctin
g nu
mer
ous
mea
sure
men
ts
of th
e st
atic
w
ater
leve
l in
an a
quife
r and
in
terp
olat
ing
thes
e da
ta
poin
ts.

Approved January 18, 2012 A-4
Approved Assessment Report: Toronto and Region Source Protection Area
Tab
le a
-1:
Dat
a so
urce
s fo
r th
e a
sses
smen
t r
epor
t (C
ontinu
ed)
Purpose
Clim
ate
Wat
er W
ithd
raw
als
Infr
astr
uctu
re —
Wat
er
Data Sets
CA G
auge
Sta
tions
Atm
osph
eric
En
viro
nmen
t Se
rvic
e (A
ES)
Perm
it To
Take
Wat
er (P
TTW
) —
C o
f A D
atab
ase
Wat
er W
ell
Info
rmat
ion
Syst
em (W
WIS
)
Wat
er W
ell
Info
rmat
ion
Syst
em (W
WIS
) —
Impr
oved
Stor
m
Sew
ers a
nd/
or C
ombi
ned
Sew
ers a
nd
Out
flow
s
Ont
ario
Wat
er
Trea
tmen
t Pl
ants
(WTP
)
Ont
ario
Sew
age
Trea
tmen
t Pla
nts
(STP
)W
ater
Str
uctu
reDa
ms
Short Data Description
Met
eoro
logi
cal
data
col
lect
ed b
y lo
cal m
unic
ipal
ities
an
d TR
CA.
Prov
ides
fo
reca
sts
and/
or w
arni
ngs
of p
ossib
le
wea
ther
-rela
t-ed
em
erge
n-ci
es.
MO
E Pe
rmit
to Ta
ke W
ater
da
taba
se o
f per
mitt
ed w
ater
ta
king
s (>
50,
000
litre
s/da
y)
from
sur
face
and
gro
undw
a-te
r sou
rces
, sup
plem
ente
d w
ith T
RCA
wat
er u
se a
sses
s-m
ent s
urve
y da
ta
Geo
refe
renc
ed
wel
ls, in
clud
ing
grou
ndw
ater
w
ells,
test
wel
ls,
and
aban
done
d w
ells.
New
and
pre
viou
s sp
atia
l and
tabu
lar
data
base
impr
ove-
men
ts a
re b
eing
in
corp
orat
ed in
to
the
WW
IS d
ata.
Cond
uits
for
stor
mw
ater
w
ithin
mun
ici-
pally
ser
vice
d ar
eas.
Loca
tion
of
wat
er tr
eatm
ent
plan
ts in
Ont
ario
ba
sed
on a
com
-pi
latio
n of
199
7 an
d 20
00 M
OE
data
sets
.
Loca
tion
of s
ew-
age
treat
men
t pl
ants
in O
ntar
io
base
d on
a c
om-
pila
tion
of 1
997
and
2000
MO
E da
tase
ts.
Man
-mad
e st
ruc-
ture
s ins
ide
a w
a-te
rbod
y. M
inim
al
desc
riptiv
e de
tail
prov
ided
.
Man
-mad
e st
ruct
ures
in
side
a w
ater
body
un
der M
NR
juris
dict
ion.
Purpose
Gro
undw
ater
Qua
lity
Surf
ace
Wat
er Q
ualit
yVu
lner
abili
ty
Data Sets
Prov
inci
al
Gro
undw
ater
M
onito
ring
Net
wor
k (P
GM
N)
Wat
er W
ell
Info
rmat
ion
Syst
em
(WW
IS)
Site
Sca
le
Mon
itorin
g
Mic
robi
olog
ical
Sa
mpl
ing
&
Anal
ysis
OM
AF W
ater
Q
ualit
y St
udy
Prov
inci
al
Wat
er Q
ualit
y M
onito
ring
Net
wor
k (P
WQ
MN
)
Loca
l CA
Sa
mpl
ing
Ont
ario
Ben
thic
Bi
omon
itorin
g N
etw
ork
(OBB
N)
Prov
inci
al
Wat
er Q
ualit
y M
onito
ring
Net
wor
k (P
WQ
MN
)
Prov
inci
al
Gro
undw
ater
M
onito
ring
Net
wor
k (P
GM
N)
CA W
ater
Q
ualit
y M
onito
ring
Short Data Description
A pr
ovin
ce-w
ide
mon
itorin
g ne
twor
k th
at p
rovi
des
data
on
gro
undw
ater
le
vels
and
qual
ity.
TRCA
has
mul
tiple
da
ta p
oint
s fo
r six
w
ells,
and
bas
elin
e da
ta fo
r all
23
wel
ls.
Lim
ited
data
on
wat
er q
ual-
ity p
rovi
ded
for
som
e of
the
wel
ls in
the
WW
IS. P
rimar
-ily
for w
ells
affe
cted
by
salt,
met
hane
, et
c.
Varie
s ac
cord
-in
g to
term
s of
re
fere
nce
for t
he
cont
amin
ated
sit
e st
udie
s (e
.g.,
mun
icip
al la
nd-
fills,
pet
role
um
sites
, and
gas
st
atio
ns).
For h
ealth
-re
late
d w
ater
qu
ality
inci
dent
s th
at in
volv
e m
icro
biol
ogi-
cal d
etec
tions
. G
ener
ally
test
sa
mpl
es b
roug
ht
in b
y th
e pu
blic
fro
m p
rivat
e w
ells.
Gen
eral
ly, b
ottle
te
stin
g th
roug
h ac
cred
ited
labo
ra-
torie
s. V
arie
s on
a
site-
to-s
ite b
asis.
Av
aila
ble
in h
ard
copy
onl
y.
Wat
er q
ualit
y sa
mpl
e co
llec-
tions
that
are
un
derta
ken
acro
ss th
e pr
ovin
ce a
t ap
prox
imat
ely
two
hund
red
sites
.
Loca
l wat
er
sam
ples
an
d fie
ld/la
b te
sts.
Mon
itors
the
stat
e of
org
an-
isms
livin
g in
or
on th
e bo
ttom
of
wat
erbo
dies
.
Wat
er q
ualit
y sa
mpl
e co
llec-
tions
und
erta
ken
acro
ss th
e pr
ovin
ce a
t ap-
prox
imat
ely
two
hund
red
sites
.
Desig
ned
to
prov
ide
good
qu
ality
dat
a (c
urre
nt a
nd
hist
oric
al) o
n ge
olog
ical
/ st
ratig
raph
ic
grou
ndw
ater
le
vel a
nd
grou
ndw
ater
qu
ality
for t
he
prov
ince
.
TRCA
col
-le
cts
wat
er
sam
ples
and
co
nduc
ts
som
e fie
ld a
nd
lab
test
s.
Sam
ples
are
se
nt to
an
accr
edite
d la
bora
tory
fo
r ad-
ditio
nal
test
ing.

Approved January 18, 2012A-5
Appendix A: Data Sources and Analysis
Purpose
Gro
undw
ater
Ele
vati
on (G
W S
tudi
es)
Gro
undw
ater
Data Sets
CA G
auge
St
atio
ns
Wat
er S
urve
y of
Can
ada
(WSC
)/HYD
AT
— d
aily
Wat
er S
urve
y of
Ca
nada
(WSC
)/HY
DAT
—
hour
ly
Base
flow
(CAs
/Pr
ivat
e)En
hanc
ed F
low
Di
rect
ion
(EFD
IR)
CA M
appe
d Aq
uife
r Re
char
ge/
Disc
harg
e Ar
eas
3-D
Map
ping
fo
r Aqu
ifer
Dist
ribut
ion
and
Thic
knes
s
Wat
er W
ell
Info
rmat
ion
Syst
em (W
WIS
)
Hist
oric
al S
trea
m
Map
ping
Pote
ntia
l Spr
ings
in
the
ORM
, Sou
ther
n O
ntar
io fr
om A
eria
l Th
erm
ogra
phy
Short Data Description
Gau
ge d
ata
stor
ed in
M
S Ac
cess
da
taba
se
(Env
iroba
se).
Conv
ersio
n to
SQ
L un
derw
ay.
Daily
mea
sure
s of
rive
r flow
an
d re
cord
s of
lake
/rive
r le
vels.
Hour
ly m
easu
res
of ri
ver fl
ow a
nd
reco
rds
of la
ke/
river
leve
ls.
Capt
ured
by
vari-
ous
met
hodo
lo-
gies
dep
endi
ng
on a
utho
rity
(e.g
. Pa
nel M
etho
d,
Culv
ert M
etho
d,
or B
ucke
t M
etho
d).
A flo
w-c
orre
cted
flow
di
rect
ion
grid
bas
ed o
n m
appe
d hy
drog
raph
y ba
sed
on th
e Pr
ovin
cial
DE
M.
A fu
ndam
enta
l da
tase
t for
Arc
Hydr
o an
d th
eref
ore
a re
com
men
d-ed
dat
aset
for S
ourc
e W
ater
Pro
tect
ion.
Rech
arge
ar
eas
are
whe
re
prec
ipita
tion
read
ily in
filtra
tes
an a
quife
r. Di
s-ch
arge
are
as a
re
whe
re g
roun
d-w
ater
is re
leas
ed
to th
e su
rface
.
The
York
-Pee
l-Du
rham
-Tor
onto
G
roun
dwat
er
Man
agem
ent
Stud
y te
am h
as
prep
ared
inte
r-pr
eted
sur
face
s fo
r bot
h aq
uife
rs
and
aqui
tard
s.
Geo
refe
renc
ed
wel
ls, in
clud
ing
grou
ndw
ater
w
ells,
test
wel
ls,
and
aban
done
d w
ells.
New
and
pr
evio
us s
patia
l an
d ta
bula
r da
taba
se.
Hist
oric
al
stre
am m
appi
ng
com
plet
ed b
y TR
CA s
taff.
Dat
a ex
ists
in v
aryi
ng
form
ats.
Data
ext
ract
ed fr
om
ther
mal
infra
red
imag
es
show
ing
a co
ntra
st in
su
rface
tem
pera
ture
s.
War
m a
reas
on
the
ther
-m
al im
age
coin
cide
with
po
rtion
s of
stre
ams
and
may
indi
cate
sig
nific
ant
grou
ndw
ater
disc
harg
e lo
catio
ns.
Purpose
Thre
ats
& C
onta
min
ants
Fish
erie
s D
ata
Data Sets
Cem
eter
ies
Win
dshi
eld
Surv
ey
Petr
oleu
m
Wel
lsW
aste
Disp
osal
Site
Unse
rvic
ed
Area
s
Ont
ario
Str
eam
As
sess
men
t Pr
otoc
ol (O
SAP)
Aqua
tic R
esou
rce
Mon
itorin
g
Prog
ram
(ARM
P)Aq
uatic
Res
ourc
e Ar
ea (A
RA)
Short Data Description
A w
inds
hiel
d su
rvey
was
con
-du
cted
in w
ellh
ead
prot
ectio
n ar
eas
to
iden
tify
pote
ntia
l co
ntam
inan
t so
urce
s, in
clud
ing
cem
eter
ies.
LIO
cla
ss:
Petro
leum
Wel
l. Fu
ll de
tails
in
the
Ont
ario
O
il, G
as, a
nd
Salt
Reso
urce
s Li
brar
y.
A sit
e de
dica
ted
to th
e sy
stem
atic
des
truct
ion,
tra
nsfo
rmat
ion,
bur
ial,
or
stor
age
of w
aste
mat
eria
l. TR
CA s
taff
has
upda
ted
the
info
rmat
ion
since
the
initi
al N
RVIS
load
.
Area
s th
at d
o no
t ha
ve m
unic
ipal
se
wag
e an
d/or
and
wat
er
serv
ices
.
Fiel
d da
ta s
uch
as
spec
ies,
tem
pera
-tu
re, h
abita
t, ge
o-m
orph
olog
y, an
d ba
seflo
w s
tore
d in
the
HABP
ROG
S da
taba
se.
Data
from
a v
arie
ty o
f sou
rces
re
gard
ing
past
and
pre
sent
con
di-
tions
of t
his
syst
em. T
he re
sults
of
the
field
pro
gram
are
pre
sent
ed
to a
sses
s cu
rrent
con
ditio
n/he
alth
of t
he w
ater
shed
’s aq
uatic
re
sour
ces.
ARA
desc
ribes
an
area
of a
wat
er-
body
(e.g
., id
entifi
es th
e th
erm
al
regi
mes
for a
stre
am a
nd p
hysic
al
char
acte
ristic
s of
the
wat
er).
ARA
Li
ne S
egm
ent a
nd A
RA P
olyg
on
Segm
ent a
re th
e ge
ospa
tial
com
pone
nts
of th
e AR
A.
Ther
mal
cla
ssifi
ca-
tion
of s
tream
s an
d w
ater
bodi
es.

Approved January 18, 2012 A-6
Approved Assessment Report: Toronto and Region Source Protection Area
Tabl
e a
-2:
Mon
itor
ing
Dat
abas
es a
nd D
ata
Des
crip
tion
s
Dat
abas
e N
ame
Dat
a
Type
Form
atPe
riod
of R
ecor
dCo
vera
ge A
rea
Reco
rdin
g/Co
llect
ion
Freq
uenc
y
Dur
ham
Reg
ion
Coas
tal
Wet
land
s M
onit
orin
g D
atab
ase
Wat
er le
vels
exce
l20
03 –
pre
sent
5 co
asta
l wet
land
sCo
ntin
uous
read
ings
Wat
er te
mpe
ratu
reex
cel
2003
– p
rese
nt5
coas
tal w
etla
nds
Cont
inuo
us re
adin
gs
Sedi
men
t qua
lity
acce
ss20
028
coas
tal w
etla
nds
5-ye
ar ro
tatio
n co
llect
ion
Fish
com
mun
ityac
cess
2003
– p
rese
nt8
coas
tal w
etla
nds
Mon
thly
col
lect
ion
Inve
rtebr
ate
acce
ss20
03 –
pre
sent
8 co
asta
l wet
land
sM
onth
ly c
olle
ctio
n
Subm
erge
d pl
ants
acce
ss20
03 –
pre
sent
8 co
asta
l wet
land
sM
onth
ly c
olle
ctio
n
Wet
land
Eva
luat
ion
Dat
abas
eM
NR
eval
uatio
n re
ports
pape
r20
0515
wet
land
s5
year
rota
tion
ARM
P Bi
o-M
onit
orin
g D
atab
ase
Wat
er Q
ualit
y In
dex
valu
es (W
QI),
sta
tus
and
syst
em ty
peex
cel
1996
– 2
004
(term
inat
ed)
ARM
PS p
er w
ater
shed
One
col
lect
ion
per s
ite p
er A
RMP
Wat
er te
mpe
ratu
reex
cel
1996
– 2
004
(term
inat
ed)
ARM
PS p
er w
ater
shed
One
col
lect
ion
per s
ite p
er A
RMP
OSA
P Bi
o-M
onit
orin
g D
atab
ase
Ont
ario
Stre
am A
sses
smen
t Pro
toco
lsac
cess
Initi
ated
200
514
9 sit
esva
riabl
e
Spec
ies
Dat
abas
eTe
rrest
rial s
peci
es a
ttrib
utes
acce
ss20
03 –
pre
sent
Juris
dict
ion
Seas
onal
col
lect
ion
Regi
onal
Mon
itor
ing
Net
wor
k D
atab
ases
Gro
undw
ater
qua
lity
(TRC
A/PG
MN
)ac
cess
2001
– p
rese
nt23
site
s; lim
ited
data
for a
ll bu
t 6
sites
.1
sam
ple
colle
cted
per
site
per
yea
r for
6 s
ites.
Ad
ditio
nal s
ites
adde
d fo
r 200
9.
Man
ual g
roun
dwat
er le
vel
mea
sure
men
ts
(TRC
A/PG
MN
)ac
cess
2001
– p
rese
nt9
sites
in 2
001,
incr
ease
d to
22
sites
cur
rent
lyPe
riodi
c m
anua
l m
easu
rem
ents
to v
erify
hou
rly
data
Auto
mat
ed g
roun
dwat
er le
vel
mea
sure
men
ts(T
RCA/
PGM
N)
acce
ss20
01 –
pre
sent
9 sit
es in
200
1, in
crea
sed
to 2
2 sit
es c
urre
ntly
Hour
ly re
adin
gs
Surfa
ce w
ater
qua
lity
(TRC
A/PW
QM
N)
acce
ss19
65 –
pre
sent
19 s
ites
Mon
thly
col
lect
ion
at P
WQ
MN
site
s; tw
o sa
mpl
es
colle
cted
per
yea
r at T
RCA
sites
;

Approved January 18, 2012A-7
Appendix A: Data Sources and Analysis
Dat
abas
e N
ame
Dat
a
Type
Form
atPe
riod
of R
ecor
dCo
vera
ge A
rea
Reco
rdin
g/Co
llect
ion
Freq
uenc
y
Regi
onal
Mon
itor
ing
Net
wor
k D
atab
ases
Surfa
ce w
ater
flow
sac
cess
1959
– p
rese
nt d
epen
ding
on
stat
ion
63 g
auge
s cu
rrent
ly in
all
TRSP
A w
ater
shed
sCo
ntin
uous
gau
ges
inst
alle
d an
d m
aint
aine
d by
W
ater
Sur
vey
of C
anad
a pl
us T
RCA
Rain
fall
and
clim
ate
stat
ions
ac
cess
1936
– p
rese
nt97
act
ive
loca
tions
by T
RCA,
AE
S, m
unic
ipal
ities
Cont
inuo
us –
see
Tabl
e A-
3
Snow
pac
kac
cess
1998
– p
rese
nt12
loca
tions
Bi-w
eekl
y –
seas
onal
Low
flow
s (T
RSPA
)ac
cess
2000
- pr
esen
t68
site
s4
– 6
mea
sure
men
ts p
er in
dex
site
per y
ear. A
d-di
tiona
l sin
gle
year
mea
sure
men
ts
Low
flow
s (Y
PDT)
e:DA
T20
0246
site
s1
mea
sure
men
t per
site
Stre
am m
orph
olog
ye:
DAT
2002
46 s
ites
1 m
easu
rem
ent p
er s
ite
Site
loca
tions
acce
ssCu
rrent
All s
ites
As a
dded
/rem
oved
Fiel
d no
tes
exce
l20
01 -
pres
ent
Mos
t site
sAs
requ
ired
PTTW
Dat
abas
ePo
tent
ial c
onta
min
ant t
hrea
ts, l
ocat
ions
, and
at
tribu
tes
acce
ss20
02 -
pres
ent
628
wat
er u
sers
in T
RCA’
s Wat
er
Use
Asse
ssm
ent d
atab
ase
As Id
entifi
ed
YPD
T D
atab
ase
Subs
urfa
ce/w
ell d
ata
acce
ss19
50s
– pr
esen
tJu
risdi
ctio
nAs
iden
tified
Clim
atic
dat
aac
cess
1960
s –
pres
ent
Juris
dict
ion
As id
entifi
ed
Surfa
ce w
ater
dat
aac
cess
1960
s –
pres
ent
Juris
dict
ion
As id
entifi
ed
PTTW
dat
aac
cess
2002
– p
rese
ntJu
risdi
ctio
nAs
iden
tified

Approved January 18, 2012 A-8
Approved Assessment Report: Toronto and Region Source Protection Area
a1.2.1 stream flow gauging
Stream gauge data are required for water budgets, assimilative capacity studies, water takings, aquatic studies, and recharge and discharge analyses. Total flows, base flows, mean daily flows, and mean monthly flow information is derived from the raw level data and stream section and profile survey information.
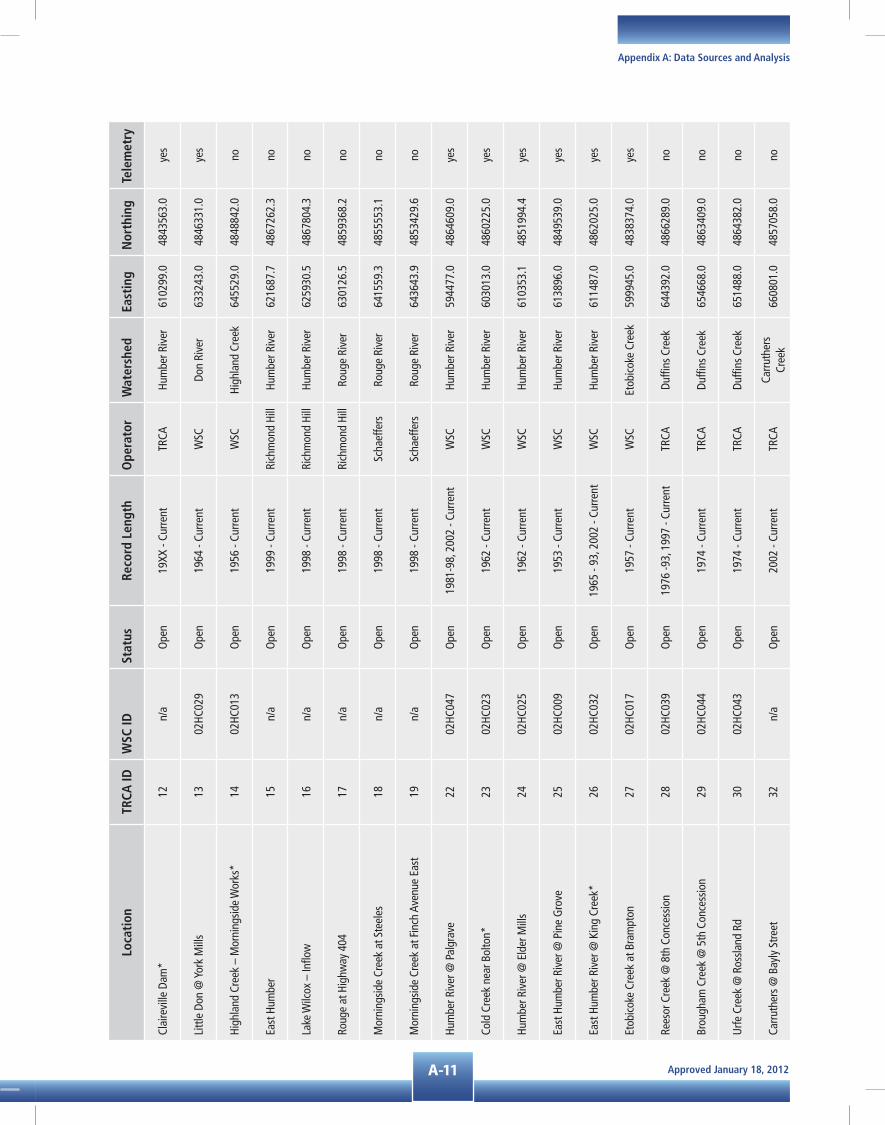
There are 63 active or “open” stations (Table a-3), which include both Environment Canada’s Water Survey of Canada (WSC) and TRCA stations.
a1.2.2 Precipitation/Meteorological gauging
Monitoring and measuring precipitation is a fairly simple process. One must obtain an accurate sample of the precipitation falling at the location of the gauge and have sufficient spatial coverage throughout the watershed to permit accurate estimates of the volume of water falling on a watershed. This information is currently compared with runoff volumes and quantitative hydrologic forecasting. Two types of climate station measurement locations operate within the watershed rain gauges, and complete climate stations. Some of each are operated and maintained by TRCA, while others are maintained by the Atmospheric Environment Service (AES) or TRCA’s municipal partners. These climate stations, most of which comprise tipping bucket rain gauges, are summarized on Table a-4. The data are collected by AES and are available from the Environment Canada website.
a1.2.3 snow Cover Monitoring
TRCA operates and maintains snow course surveys at twelve locations, with ten measurement sites per location. These locations are identified in Table a-5. A snow course location consists of a series of numbered posts driven into the ground 30 metres apart, usually in a straight line. The water content is calculated based on the weight of the snow in a core sampler. One ounce of snow in the sampler contains the equivalent of one inch of water. Snow course measurements are taken twice monthly, from December to May.
a1.2.4 groundwater Monitoring
In partnership with the MOE, TRCA operates and maintains a network of 22 groundwater monitoring wells located throughout the watershed (Table a-6). Loggers were installed in the monitoring wells from 2000 to 2003 and automatically record water levels and temperature. Dataloggers measure absolute pressure (water pressure + atmospheric pressure), expressed in centimetres of water column.
The data are downloaded and sent electronically to the MOE Provincial Groundwater Monitoring Information System database (PGMIS). The data are locally exported from PGMIS into the YDPT database using a SITEFX (specialized software) interface. TRCA staff is required to perform QA/QC activities to verify the continued accuracy of the data. Water levels are periodically measured manually to ensure that the automated systems are functioning correctly. QA/QC activities for all TRCA wells have not been completed at this time. Efforts are being made to align non-SWP funded program deliverables to support SWP analytical requirements.
Water samples are collected from selected wells in the fall each year and are analyzed routinely for general chemistry and metals. Baseline water quality samples have been taken from every well in the network. Data from five wells are provided by either the MOE (Stouffville 700) or York Region (MW-2, 9, and 26; STO-18-87).
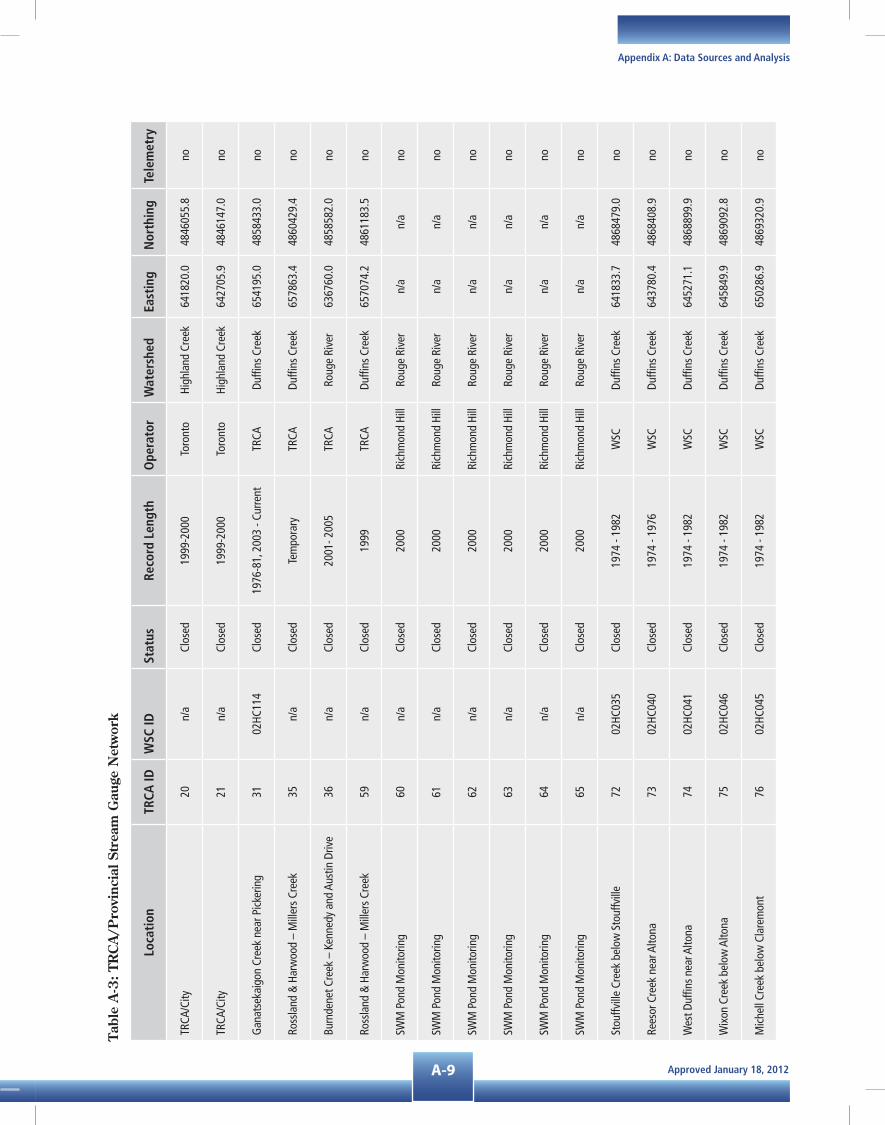
Approved January 18, 2012A-9
Appendix A: Data Sources and Analysis
Tabl
e a
-3:
TrC
a/P
rovi
ncia
l str
eam
gau
ge n
etw
ork
Loca
tion
TRCA
IDW
SC ID
Stat
usRe
cord
Len
gth
Ope
rato
rW
ater
shed
East
ing
Nor
thin
gTe
lem
etry
TRCA
/City
20n/
aCl
osed
1999
-200
0To
ront
oHi
ghla
nd C
reek
6418
20.0
4846
055.
8no
TRCA
/City
21n/
aCl
osed
1999
-200
0To
ront
oHi
ghla
nd C
reek
6427
05.9
4846
147.
0no
Gan
atse
kaig
on C
reek
nea
r Pic
kerin
g31
02HC
114
Clos
ed19
76-8
1, 2
003
- Cur
rent
TRCA
Duffi
ns C
reek
6541
95.0
4858
433.
0no
Ross
land
& H
arw
ood
– M
iller
s Cr
eek
35n/
aCl
osed
Tem
pora
ryTR
CADu
ffins
Cre
ek65
7863
.448
6042
9.4
no
Burn
dene
t Cre
ek –
Ken
nedy
and
Aus
tin D
rive
36n/
aCl
osed
2001
- 200
5TR
CARo
uge
Rive
r63
6760
.048
5858
2.0
no
Ross
land
& H
arw
ood
– M
iller
s Cr
eek
59n/
aCl
osed
1999
TRCA
Duffi
ns C
reek
6570
74.2
4861
183.
5no
SWM
Pon
d M
onito
ring
60n/
aCl
osed
2000
Rich
mon
d Hi
llRo
uge
Rive
rn/
an/
ano
SWM
Pon
d M
onito
ring
61n/
aCl
osed
2000
Rich
mon
d Hi
llRo
uge
Rive
rn/
an/
ano
SWM
Pon
d M
onito
ring
62n/
aCl
osed
2000
Rich
mon
d Hi
llRo
uge
Rive
rn/
an/
ano
SWM
Pon
d M
onito
ring
63n/
aCl
osed
2000
Rich
mon
d Hi
llRo
uge
Rive
rn/
an/
ano
SWM
Pon
d M
onito
ring
64n/
aCl
osed
2000
Rich
mon
d Hi
llRo
uge
Rive
rn/
an/
ano
SWM
Pon
d M
onito
ring
65n/
aCl
osed
2000
Rich
mon
d Hi
llRo
uge
Rive
rn/
an/
ano
Stou
ffvill
e Cr
eek
belo
w S
touf
fvill
e72
02HC
035
Clos
ed19
74 -
1982
WSC
Duffi
ns C
reek
6418
33.7
4868
479.
0no
Rees
or C
reek
nea
r Alto
na73
02HC
040
Clos
ed19
74 -
1976
WSC
Duffi
ns C
reek
6437
80.4
4868
408.
9no
Wes
t Duf
fins
near
Alto
na74
02HC
041
Clos
ed19
74 -
1982
WSC
Duffi
ns C
reek
6452
71.1
4868
899.
9no
Wix
on C
reek
bel
ow A
ltona
7502
HC04
6Cl
osed
1974
- 19
82W
SCDu
ffins
Cre
ek64
5849
.948
6909
2.8
no
Mic
hell
Cree
k be
low
Cla
rem
ont
7602
HC04
5Cl
osed
1974
- 19
82W
SCDu
ffins
Cre
ek65
0286
.948
6932
0.9
no

Approved January 18, 2012 A-10
Approved Assessment Report: Toronto and Region Source Protection Area
Loca
tion
TRCA
IDW
SC ID
Stat
usRe
cord
Len
gth
Ope
rato
rW
ater
shed
East
ing
Nor
thin
gTe
lem
etry
Maj
or C
reek
abo
ve G
reen
Riv
er77
02HC
037
Clos
ed19
74 -
1976
WSC
Duffi
ns C
reek
6451
48.4
4863
182.
7no
Wes
t Duf
fins
@ G
reen
Riv
er78
02HC
026
Clos
ed63
-68,
70-
73, 7
4-88
WSC
Duffi
ns C
reek
6458
67.5
4862
709.
2no
Gan
atse
kiag
on C
reek
nea
r Bro
ugha
m79
02HC
042
Clos
ed19
74 -
1976
WSC
Duffi
ns C
reek
6491
47.0
4863
656.
2no
Urfe
nea
r Bro
ugha
m80
02HC
043
Clos
ed19
74 -
1976
WSC
Duffi
ns C
reek
6514
44.5
4864
410.
4no
Brou
gham
@ B
roug
ham
8102
HC04
4Cl
osed
1974
- 19
76W
SCDu
ffins
Cre
ek65
1918
.048
6453
3.1
no
Wes
t Duf
fins
near
Pic
kerin
g82
02HC
106
Clos
ed19
65 -
1988
WSC
Duffi
ns C
reek
6540
57.7
4856
992.
0no
Duffi
ns C
reek
@ A
jax-
wes
t83
02HC
049
Clos
ed19
89-1
991
WSC
Duffi
ns C
reek
6558
29.0
4857
325.
3no
Wes
t Hum
ber @
Hig
hway
71
02HC
031
Ope
n19
65 -
Curre
ntW
SCHu
mbe
r Riv
er60
6343
.048
4587
3.0
yes
Don
Rive
r @ To
dmor
den
202
HC02
4O
pen
1962
- Cu
rrent
WSC
Don
Rive
r63
2064
.048
3828
4.0
yes
Etob
icok
e @
QEW
*3
02HC
030
Ope
n19
66 -
Curre
ntW
SCEt
obic
oke
Cree
k61
6520
.048
2866
0.0
yes
Wes
t Duf
fins
abov
e G
reen
Riv
er4
02HC
038
Ope
n19
74 -
Curre
ntW
SCDu
ffins
Cre
ek64
6170
.048
6410
2.0
yes
Duffi
ns C
reek
abo
ve P
icke
ring
502
HC01
9O
pen
1960
- Cu
rrent
WSC
Duffi
ns C
reek
6558
88.0
4861
628.
0ye
s
Duffi
ns a
t Aja
x6
02HC
049
Ope
n19
89 -
Curre
ntW
SCDu
ffins
Cre
ek65
6251
.048
5690
9.0
yes
Mim
ico
@ Is
lingt
on7
02HC
033
Ope
n19
65 -
Curre
ntW
SCM
imic
o Cr
eek
6193
94.0
4833
768.
0ye
s
Hum
ber R
iver
@ W
esto
n Ro
ad*
802
HC00
3O
pen
1945
- Cu
rrent
WSC
Hum
ber R
iver
6192
15.0
4839
500.
0ye
s
Blk
Cree
k @
Sca
rlett
Road
902
HC02
7O
pen
1966
- Cu
rrent
WSC
Hum
ber R
iver
6205
71.0
4836
774.
0ye
s
Wes
t Don
@ Y
ork
Mill
s*
1002
HC00
5O
pen
1945
- Cu
rrent
WSC
Don
Rive
r62
8585
.048
4425
5.0
yes
G. R
oss
Lord
Dam
11n/
aO
pen
1973
- Cu
rrent
TRCA
Don
Rive
r62
3798
.048
4771
1.0
yes
Approved January 18, 2012A-11
Appendix A: Data Sources and Analysis
Loca
tion
TRCA
IDW
SC ID
Stat
usRe
cord
Len
gth
Ope
rato
rW
ater
shed
East
ing
Nor
thin
gTe
lem
etry
Clai
revi
lle D
am*
12n/
aO
pen
19XX
- Cu
rrent
TRCA
Hum
ber R
iver
6102
99.0
4843
563.
0ye
s
Littl
e Do
n @
Yor
k M
ills
1302
HC02
9O
pen
1964
- Cu
rrent
WSC
Don
Rive
r63
3243
.048
4633
1.0
yes
High
land
Cre
ek –
Mor
ning
side
Wor
ks*
1402
HC01
3O
pen
1956
- Cu
rrent
WSC
High
land
Cre
ek64
5529
.048
4884
2.0
no
East
Hum
ber
15n/
aO
pen
1999
- Cu
rrent
Rich
mon
d Hi
llHu
mbe
r Riv
er62
1687
.748
6726
2.3
no
Lake
Wilc
ox –
Inflo
w
16n/
aO
pen
1998
- Cu
rrent
Rich
mon
d Hi
llHu
mbe
r Riv
er62
5930
.548
6780
4.3
no
Roug
e at
Hig
hway
404
17n/
aO
pen
1998
- Cu
rrent
Rich
mon
d Hi
llRo
uge
Rive
r63
0126
.548
5936
8.2
no
Mor
ning
side
Cree
k at
Ste
eles
18n/
aO
pen
1998
- Cu
rrent
Scha
effe
rsRo
uge
Rive
r64
1559
.348
5555
3.1
no
Mor
ning
side
Cree
k at
Fin
ch A
venu
e Ea
st19
n/a
Ope
n19
98 -
Curre
ntSc
haef
fers
Roug
e Ri
ver
6436
43.9
4853
429.
6no
Hum
ber R
iver
@ P
algr
ave
2202
HC04
7O
pen
1981
-98,
200
2 - C
urre
ntW
SCHu
mbe
r Riv
er59
4477
.048
6460
9.0
yes
Cold
Cre
ek n
ear B
olto
n*23
02HC
023
Ope
n19
62 -
Curre
ntW
SCHu
mbe
r Riv
er60
3013
.048
6022
5.0
yes
Hum
ber R
iver
@ E
lder
Mill
s24
02HC
025
Ope
n19
62 -
Curre
ntW
SCHu
mbe
r Riv
er61
0353
.148
5199
4.4
yes
East
Hum
ber R
iver
@ P
ine
Gro
ve25
02HC
009
Ope
n19
53 -
Curre
ntW
SCHu
mbe
r Riv
er61
3896
.048
4953
9.0
yes
East
Hum
ber R
iver
@ K
ing
Cree
k*26
02HC
032
Ope
n19
65 -
93, 2
002
- Cur
rent
WSC
Hum
ber R
iver
6114
87.0
4862
025.
0ye
s
Etob
icok
e Cr
eek
at B
ram
pton
2702
HC01
7O
pen
1957
- Cu
rrent
WSC
Etob
icok
e Cr
eek
5999
45.0
4838
374.
0ye
s
Rees
or C
reek
@ 8
th C
once
ssio
n28
02HC
039
Ope
n19
76 -9
3, 1
997
- Cur
rent
TRCA
Duffi
ns C
reek
6443
92.0
4866
289.
0no
Brou
gham
Cre
ek @
5th
Con
cess
ion
2902
HC04
4O
pen
1974
- Cu
rrent
TRCA
Duffi
ns C
reek
6546
68.0
4863
409.
0no
Urfe
Cre
ek @
Ros
sland
Rd
3002
HC04
3O
pen
1974
- Cu
rrent
TRCA
Duffi
ns C
reek
6514
88.0
4864
382.
0no
Carru
ther
s @
Bay
ly S
treet
32n/
aO
pen
2002
- Cu
rrent
TRCA
Carru
ther
s Cr
eek
6608
01.0
4857
058.
0no

Approved January 18, 2012 A-12
Approved Assessment Report: Toronto and Region Source Protection Area
Loca
tion
TRCA
IDW
SC ID
Stat
usRe
cord
Len
gth
Ope
rato
rW
ater
shed
East
ing
Nor
thin
gTe
lem
etry
Littl
e Ro
uge
Nea
r Loc
ust H
ill*
3302
HC02
8O
pen
1964
- Cu
rrent
WSC
Roug
e Ri
ver
6433
13.0
4863
176.
0ye
s
Roug
e Ri
ver n
ear M
arkh
am*
3402
HC02
2O
pen
1961
- Cu
rrent
WSC
Roug
e Ri
ver
6419
60.0
4857
663.
0ye
s
Uppe
r Hum
ber @
Hig
hway
938
02HC
057
Ope
n20
05 -
Curre
ntW
SCHu
mbe
r Riv
er58
9223
.048
6916
8.0
yes
Cent
revi
lle C
reek
nea
r Alb
ion*
3902
HC05
1O
pen
2005
- Cu
rrent
WSC
Hum
ber R
iver
5935
58.0
4864
120.
0ye
s
Hum
ber @
Gor
eway
Roa
d41
n/a
Ope
n20
02 -
Curre
ntTR
CAHu
mbe
r Riv
er60
4266
.048
4697
1.0
no
Ger
man
Mill
s at
Hig
hway
744
n/a
Ope
n20
01 -
Curre
ntRi
chm
ond
Hill
Don
Rive
r62
8377
.348
5543
2.1
no
Tayl
or C
reek
45n/
aO
pen
2004
- Cu
rrent
TRCA
Don
Rive
r63
4709
.048
4008
4.0
no
High
land
Cre
ek –
Mal
vern
Bra
nch
46n/
aO
pen
2003
- Cu
rrent
TRCA
High
land
Cre
ek64
2291
.048
5097
1.0
no
Littl
e Ro
uge
near
Dic
kson
s Hi
ll48
02HC
053
Ope
n20
02 -
Curre
ntW
SCRo
uge
Rive
r63
7946
.048
6505
7.0
yes
Pine
Cre
ek a
t Rad
om51
n/a
Ope
n20
00 -
Curre
ntTR
CAFr
ench
man
’s Ba
y65
3715
.048
5429
7.0
no
Kros
no C
reek
at S
andy
Bea
ch R
oad
52n/
aO
pen
2000
- Cu
rrent
TRCA
Fren
chm
an’s
Bay
6548
38.0
4854
106.
0no
Mic
hell
Cree
k –
Clar
emon
t CA
53n/
aO
pen
2001
- Cu
rrent
TRCA
Duffi
ns C
reek
6536
91.0
4868
213.
0no
East
Duf
fin C
reek
– C
lare
mon
t CA
54
n/a
Ope
n20
01 -
Curre
ntTR
CADu
ffins
Cre
ek65
3994
.048
6808
4.0
no
Petti
coat
Cre
ek C
onse
rvat
ion
Area
n/a
Ope
n20
01 -
Curre
ntTR
CAPe
ttico
at C
reek
6520
03.0
4851
818.
0no
Mim
ico
Cree
k –
Wild
woo
d Pa
rk55
n/a
Ope
n20
03 -
Curre
ntTR
CAM
imic
o Cr
eek
6103
48.0
4840
698.
0no
Roug
e W
est –
Egl
in E
ast
57n/
aO
pen
2001
- Cu
rrent
Rich
mon
d Hi
llRo
uge
Rive
r62
6764
.048
6191
1.0
no
Lake
Wilc
ox G
auge
– o
utflo
w58
n/a
Ope
n19
98 -
Curre
ntRi
chm
ond
Hill
Hum
ber R
iver
6249
39.5
4867
231.
3no
Roug
e Ea
st66
n/a
Ope
n20
00 -
Curre
ntRi
chm
ond
Hill
Roug
e Ri
ver
6294
61.1
4860
387.
2no

Approved January 18, 2012A-13
Appendix A: Data Sources and Analysis
Loca
tion
TRCA
IDW
SC ID
Stat
usRe
cord
Len
gth
Ope
rato
rW
ater
shed
East
ing
Nor
thin
gTe
lem
etry
Don
Rive
r Eas
t @ Th
ornh
ill68
02HC
056
Ope
n20
05 -
Curre
ntW
SCDo
n Ri
ver
6255
33.0
4853
870.
0no
Plun
kett
Cree
k70
n/a
Ope
n20
04 -
Curre
ntTR
CAHu
mbe
r Riv
er61
2501
.048
4812
7.0
no
Gan
etse
kiag
on C
reek
71n/
aO
pen
2003
- Cu
rrent
TRCA
Duffi
ns C
reek
6538
61.0
4858
804.
0no
Beav
er C
reek
at H
ighw
ay 4
0484
n/a
Ope
n20
06 -
Curre
ntRi
chm
ond
Hill
Roug
e Ri
ver
6305
63.0
4857
068.
0no
Sprin
g Cr
eek
89n/
aO
pen
2003
- Cu
rrent
TRCA
Etob
icok
e Cr
eek
6068
56.0
4838
498.
0no
Etob
icok
e Cr
eek
@ D
erry
& D
ixie
90n/
aO
pen
2003
- Cu
rrent
TRCA
Etob
icok
e Cr
eek
6067
43.0
4836
865.
0no
Mor
ning
side
Trib
utar
y91
n/a
Ope
n20
03 –
200
4Sc
haef
fers
Roug
e Ri
ver
6425
21.8
4854
770.
0no
Wes
t Don
Riv
er @
Duf
ferin
& S
teel
es93
n/a
Ope
n20
05 -
Curre
ntTR
CADo
n Ri
ver
6229
08.0
4850
018.
0tb
d
Wes
t Duf
fins
@ H
ighw
ay 7
95n/
aO
pen
2005
- Cu
rrent
TRCA
Duffi
ns C
reek
6460
80.0
4862
510.
0n/
a
High
land
Cre
ek @
Bel
lam
y an
d La
wre
nce
97n/
aO
pen
2005
- Cu
rrent
WSC
High
land
Cre
ek64
2157
.048
4594
2.0
yes
Blac
k Cr
eek
@ S
teel
es
98n/
aO
pen
2006
- Cu
rrent
TRCA
Hum
ber R
iver
6190
46.0
4848
181.
0tb
d
Stou
ffvill
e Da
m*
99n/
aO
pen
2005
- Cu
rrent
TRCA
Duffi
ns C
reek
6403
47.0
4870
869.
0tb
d
Miln
e Da
m10
0n/
aO
pen
2005
- Cu
rrent
TRCA
Roug
e Ri
ver
6419
60.0
4858
582.
0tb
d
East
Don
at H
ighw
ay 7
101
n/a
Ope
n20
06 -
Curre
ntRi
chm
ond
Hill
Don
Rive
r62
4885
.048
5446
2.0
no
Roug
e @
Hig
hway
710
4n/
aO
pen
2006
- Cu
rrent
TRCA
Roug
e Ri
ver
n/a
n/a
tbd
Blac
k Cr
eek
at W
ilson
/401
105
n/a
Ope
n20
06 -
Curre
ntTR
CAHu
mbe
r Riv
ern/
an/
atb
d

Approved January 18, 2012 A-14
Approved Assessment Report: Toronto and Region Source Protection Area
Tabl
e a
-4:
TrC
a C
limat
e st
atio
ns
TRCA
Gau
ge N
ame
Ow
ner
Stat
usTe
lem
etry
East
ing
(N83
)N
orth
ing
(N83
)G
auge
Typ
eH
isto
rica
l Rec
ord
Leng
thSe
ason
al /
Year
Rou
nd
Butto
nvill
e Ai
rpor
t AE
Sop
enno
6302
77.6
4857
494.
1
1985
- Cu
rrent
year
roun
d
Duffe
rin O
ffice
AES
open
no62
3279
.648
4886
7.1
Tipp
ing
Buck
etn/
ase
ason
al
Pear
son
Inte
rnat
iona
l Airp
ort
AES
open
no61
2653
.948
3648
0.8
Tipp
ing
Buck
et19
36 -
Curre
nt y
ear r
ound
Toro
nto
Isla
nd A
irpor
t AE
Scl
osed
no62
9097
.448
3185
5.5
19
56 -
2006
seas
onal
Trin
ityAE
Sop
enno
6292
99.7
4836
396.
5Ti
ppin
g Bu
cket
n/a
seas
onal
Albi
on
City
of T
oron
toop
enno
6141
37.2
4844
028.
6
1979
- Cu
rrent
yea
r rou
nd
Anca
ster
CC
City
of T
oron
toop
enno
6228
52.5
4843
314.
6Ti
ppin
g Bu
cket
1991
- Cu
rrent
seas
onal
Berin
gCi
ty o
f Tor
onto
open
no61
8353
.448
3254
6.9
19
79 -
Curre
nt y
ear r
ound
Berm
onds
ey Y
ard
City
of T
oron
toop
enno
6351
04.7
4842
538.
2Ti
ppin
g Bu
cket
1991
- Cu
rrent
seas
onal
Boot
hCi
ty o
f Tor
onto
open
no63
3339
4834
809.
1Ti
ppin
g Bu
cket
1979
- Cu
rrent
year
roun
d
Brow
nCi
ty o
f Tor
onto
open
no62
9178
.748
3698
7.9
Tipp
ing
Buck
et19
79 -
Curre
ntye
ar ro
und
Cast
lefie
ldCi
ty o
f Tor
onto
open
62
3545
.748
4105
6.8
20
01 -
Curre
nt y
ear r
ound
Cent
ral
City
of T
oron
toop
enno
6272
51.1
4834
978.
2Ti
ppin
g Bu
cket
1979
- Cu
rrent
year
roun
d
Chur
chCi
ty o
f Tor
onto
open
no63
0651
.348
3574
5Ti
ppin
g Bu
cket
1979
- Cu
rrent
year
roun
d
Cum
mer
Are
naCi
ty o
f Tor
onto
open
no63
0916
.848
5088
8.5
Tipp
ing
Buck
et19
91 -
Curre
ntse
ason
al
Dow
nsvi
ew A
rena
City
of T
oron
toop
enno
6200
21.4
4841
863.
2Ti
ppin
g Bu
cket
1991
- Cu
rrent
seas
onal

Approved January 18, 2012A-15
Appendix A: Data Sources and Analysis
TRCA
Gau
ge N
ame
Ow
ner
Stat
usTe
lem
etry
East
ing
(N83
)N
orth
ing
(N83
)G
auge
Typ
eH
isto
rica
l Rec
ord
Leng
thSe
ason
al /
Year
Rou
nd
Earle
Bal
es C
CCi
ty o
f Tor
onto
open
no62
5949
.448
4576
7.7
Tipp
ing
Buck
et19
91 -
Curre
ntse
ason
al
Elle
smer
e Ya
rdCi
ty o
f Tor
onto
open
no63
9149
4847
751.
9Ti
ppin
g Bu
cket
1999
- Cu
rrent
seas
onal
Emer
y Yar
dCi
ty o
f Tor
onto
open
no61
6668
.948
4607
4.3
Tipp
ing
Buck
et19
91 -
Curre
ntse
ason
al
Finc
h Ya
rdCi
ty o
f Tor
onto
open
no62
2658
.348
4720
8.9
Tipp
ing
Buck
et19
91 -
Curre
ntse
ason
al
Fore
st H
illCi
ty o
f Tor
onto
open
no62
7844
.748
3890
3.1
Tipp
ing
Buck
et19
79 -
Curre
ntye
ar ro
und
Gre
enw
ood
City
of T
oron
toop
enno
6344
37.2
4837
308.
6Ti
ppin
g Bu
cket
1979
- Cu
rrent
year
roun
d
High
land
Cre
ek Tr
eatm
ent P
lant
City
of T
oron
toop
enno
6495
59.5
4848
169.
7Ti
ppin
g Bu
cket
1995
- Cu
rrent
yea
r rou
nd
How
ard
City
of T
oron
toop
enno
6248
55.7
4834
274.
7Ti
ppin
g Bu
cket
1979
- Cu
rrent
year
roun
d
Kew
Bea
ch
City
of T
oron
toop
enno
6367
80.7
4836
487.
9Ti
ppin
g Bu
cket
1979
- Cu
rrent
year
roun
d
Kim
berly
City
of T
oron
toop
enno
6370
72.9
4838
011.
3Ti
ppin
g Bu
cket
1979
- Cu
rrent
year
roun
d
Kipl
ing
City
of T
oron
toop
enno
6193
46.7
4829
268
19
79 -
Curre
nt y
ear r
ound
Mai
n Tr
eatm
ent P
lant
City
of T
oron
tocl
osed
no64
2772
.948
4165
8.7
grad
uate
d cy
linde
r19
86 -
2000
year
roun
d
Mar
tin G
rove
City
of T
oron
toop
enno
6144
52.3
4837
390.
7
1979
- Cu
rrent
yea
r rou
nd
Mar
yval
e Pu
blic
Sch
ool
City
of T
oron
toop
enno
6357
90.2
4847
340
Tipp
ing
Buck
etn/
ase
ason
al
Mc
Nic
oll a
nd K
enne
dyCi
ty o
f Tor
onto
open
no63
7171
.748
5060
5.6
Tipp
ing
Buck
etn/
ase
ason
al
Mitc
hell
Fiel
d CC
City
of T
oron
toop
enno
6277
38.1
4848
231
Tipp
ing
Buck
et19
91 -
Curre
ntse
ason
al
Mor
ning
side
Yard
City
of T
oron
toop
enno
6454
40.2
4850
241
Tipp
ing
Buck
et20
04 -
Curre
ntse
ason
al

Approved January 18, 2012 A-16
Approved Assessment Report: Toronto and Region Source Protection Area
TRCA
Gau
ge N
ame
Ow
ner
Stat
usTe
lem
etry
East
ing
(N83
)N
orth
ing
(N83
)G
auge
Typ
eH
isto
rica
l Rec
ord
Leng
thSe
ason
al /
Year
Rou
nd
Nas
hden
e Ya
rdCi
ty o
f Tor
onto
open
no64
0713
.748
5336
7.9
Tipp
ing
Buck
et20
04 -
Curre
ntse
ason
al
Nor
th To
ront
o Ci
ty o
f Tor
onto
open
no62
9063
.648
4087
9.6
Tipp
ing
Buck
et19
79 -
Curre
ntye
ar ro
und
Old
Wes
ton
City
of T
oron
toop
enno
6237
31.4
4836
822
Tipp
ing
Buck
etn/
aye
ar ro
und
Orio
le Y
ard
City
of T
oron
toop
enno
6314
27.8
4847
403.
1Ti
ppin
g Bu
cket
n/a
seas
onal
Prov
iden
ce V
illa
City
of T
oron
tocl
osed
no63
8261
.748
4141
4.4
Tipp
ing
Buck
etn/
ase
ason
al
Rich
view
City
of T
oron
toop
enno
6177
38.8
4837
339.
7
1979
- Cu
rrent
yea
r rou
nd
St A
ugus
tine
Sem
inar
yCi
ty o
f Tor
onto
open
no64
1969
.148
4195
3.1
Tipp
ing
Buck
etn/
ase
ason
al
Swan
sea
City
of T
oron
toop
enno
6228
03.2
4833
428.
6Ti
ppin
g Bu
cket
1979
- Cu
rrent
year
roun
d
Thor
nclif
feCi
ty o
f Tor
onto
open
no63
2870
.448
4178
3st
anda
rd c
onic
al20
01 -
Curre
ntye
ar ro
und
Toro
nto
Isla
nd A
irpor
t Ci
ty o
f Tor
onto
open
no62
9562
.748
3219
9.5
Tipp
ing
Buck
et19
79 -
Curre
ntye
ar ro
und
Toro
nto
Zoo
City
of T
oron
toop
enno
6463
30.2
4853
543.
9Ti
ppin
g Bu
cket
1994
- Cu
rrent
seas
onal
Cent
re a
nd B
athu
rst
City
of V
augh
anop
enno
6243
0948
5248
8.1
Tipp
ing
Buck
et19
98 -
Curre
ntye
ar ro
und
Islin
gton
and
Rut
herfo
rdCi
ty o
f Vau
ghan
open
no61
2841
.248
5246
7.7
Tipp
ing
Buck
et19
98 -
Curre
ntye
ar ro
und
Keel
e an
d M
ajor
Mac
kenz
ieCi
ty o
f Vau
ghan
open
no61
9035
4857
312.
6Ti
ppin
g Bu
cket
1998
- Cu
rrent
year
roun
d
Cher
ryw
ood
Tran
sfor
mer
Sta
tion
Ont
ario
Hyd
roop
enno
6515
20.1
4855
974.
4Ti
ppin
g Bu
cket
n/a
year
roun
d
Bram
alea
Roa
d Pe
el R
egio
nop
enye
s60
3433
4841
331.
7Ti
ppin
g Bu
cket
1995
- Cu
rrent
seas
onal
Brita
nnia
Roa
d W
est
Peel
Reg
ion
open
yes
6030
4448
2793
2.8
Tipp
ing
Buck
et19
95 –
Cur
rent
year
roun
d

Approved January 18, 2012A-17
Appendix A: Data Sources and Analysis
TRCA
Gau
ge N
ame
Ow
ner
Stat
usTe
lem
etry
East
ing
(N83
)N
orth
ing
(N83
)G
auge
Typ
eH
isto
rica
l Rec
ord
Leng
thSe
ason
al /
Year
Rou
nd
Dixi
e Ro
ad
Peel
Reg
ion
open
yes
6129
53.7
4829
981
Tipp
ing
Buck
et19
95 –
Cur
rent
seas
onal
East
Ave
nue
Peel
Reg
ion
open
yes
6160
03.3
4825
235.
1Ti
ppin
g Bu
cket
1995
- Cu
rrent
seas
onal
Falb
ourn
e St
reet
Pe
el R
egio
nop
enye
s60
6607
4830
281.
9Ti
ppin
g Bu
cket
1995
- Cu
rrent
year
roun
d
Fir T
ree
Peel
Reg
ion
open
yes
6076
79.7
4838
382.
9Ti
ppin
g Bu
cket
1995
– C
urre
ntse
ason
al
Huro
ntar
io R
oad
Peel
Reg
ion
open
yes
6019
76.2
4834
688
Tipp
ing
Buck
et19
95 -
Curre
ntse
ason
al
Lake
shor
e Ro
adPe
el R
egio
nop
enye
s61
2378
.548
1658
5.9
Tipp
ing
Buck
et19
95 –
Cur
rent
year
roun
d
Miss
issau
ga V
alle
y Bl
vd
Peel
Reg
ion
open
yes
6109
79.2
4828
011.
4Ti
ppin
g Bu
cket
1995
– C
urre
ntse
ason
al
Old
Kin
g Ro
adPe
el R
egio
nop
enye
s60
2083
.848
5930
0.6
Tipp
ing
Buck
et19
95 -
Curre
ntse
ason
al
Ore
nda
Road
Pe
el R
egio
nop
enye
s60
1368
.448
3915
4.6
Tipp
ing
Buck
et19
95 -
Curre
ntse
ason
al
Que
en S
treet
Peel
Reg
ion
open
yes
5990
65.2
4836
048.
1Ti
ppin
g Bu
cket
1995
- Cu
rrent
seas
onal
Sand
alw
ood
Park
way
Peel
Reg
ion
open
yes
5965
8548
4118
8.6
Tipp
ing
Buck
et19
95 -
Curre
ntse
ason
al
Sout
h Co
mm
onPe
el R
egio
nop
enye
s60
7798
.448
2061
5.5
Tipp
ing
Buck
et19
95 –
Cur
rent
year
roun
d
Trus
cott
Peel
Reg
ion
open
yes
6092
98.9
4818
451.
8Ti
ppin
g Bu
cket
1995
– C
urre
ntye
ar ro
und
Will
iam
s Pa
rkw
ay
Peel
Reg
ion
open
yes
6043
42.6
4844
193.
6Ti
ppin
g Bu
cket
1995
- Cu
rrent
seas
onal
Wol
feda
le R
oad
Peel
Reg
ion
open
yes
6088
12.9
4825
808.
4Ti
ppin
g Bu
cket
1995
– C
urre
ntye
ar ro
und
48th
& 1
6th
Tow
n of
M
arkh
amop
enno
6389
50.8
4861
362.
1Ti
ppin
g Bu
cket
n/a
seas
onal
John
Stre
et F
HTo
wn
of
Mar
kham
open
no62
8658
4853
147.
4Ti
ppin
g Bu
cket
1996
- Cu
rrent
seas
onal

Approved January 18, 2012 A-18
Approved Assessment Report: Toronto and Region Source Protection Area
TRCA
Gau
ge N
ame
Ow
ner
Stat
usTe
lem
etry
East
ing
(N83
)N
orth
ing
(N83
)G
auge
Typ
eH
isto
rica
l Rec
ord
Leng
thSe
ason
al /
Year
Rou
nd
Rugg
les A
ve
Tow
n of
M
arkh
amop
enno
6266
29.1
4854
552.
8Ti
ppin
g Bu
cket
1996
- Cu
rrent
seas
onal
Unio
nvill
e FH
Tow
n of
M
arkh
amop
enno
6358
81.5
4859
568.
9Ti
ppin
g Bu
cket
1996
- Cu
rrent
seas
onal
Yong
e an
d Ki
ng R
oad
Tow
n of
Ric
h-m
ond
Hill
open
no62
3859
.748
6667
7.2
n/
a y
ear r
ound
Ajax
Wor
ks Y
ard
TRCA
open
no65
8832
4855
761
Tipp
ing
Buck
et20
03 -
Curre
ntse
ason
al
Albi
on H
ills
CA
TRCA
open
no59
3103
4864
192
Tipp
ing
Buck
et20
04 -
Curre
ntse
ason
al
Alex
Duf
f Mem
oria
l Poo
lTR
CAop
enno
6272
2748
3587
1Ti
ppin
g Bu
cket
2005
- Cu
rrent
seas
onal
Boyd
Fie
ld C
entre
TRCA
clos
edno
6119
0848
5388
0Ti
ppin
g Bu
cket
2002
- 20
09
seas
onal
Bruc
e’s
Mill
CA
TRCA
open
no63
3059
4867
308
Tipp
ing
Buck
et20
02 -
Curre
ntse
ason
al
Cent
revi
lle C
reek
TRCA
clos
edye
s59
3558
4864
120
wei
ghin
g ga
uge
n/a
year
roun
d
Clai
revi
lle D
amTR
CAop
enno
6099
6448
4410
4Ti
ppin
g Bu
cket
2001
- Cu
rrent
seas
onal
Clar
emon
t CA
TRCA
open
no65
4490
4868
058
Tipp
ing
Buck
et20
02 -
Curre
ntse
ason
al
Don
Rive
r at Y
ork
Mill
sTR
CAcl
osed
yes
6285
8548
4425
5Ti
ppin
g Bu
cket
2003
- 20
10se
ason
al
Duffe
rin R
eser
voir
TRCA
open
no62
2278
4854
337
Tipp
ing
Buck
et20
05 -
Curre
ntse
ason
al
Etob
icok
e Cr
eek
near
QEW
TRCA
open
yes
6165
2048
2866
0Ti
ppin
g Bu
cket
2005
- Cu
rrent
seas
onal
Gle
n Ha
ffy C
ATR
CAop
enno
5840
2348
6551
4Ti
ppin
g Bu
cket
2002
- Cu
rrent
seas
onal
Goo
dwoo
d Pu
mpi
ng S
tatio
nTR
CAop
enno
6443
2348
7701
3Ti
ppin
g Bu
cket
2004
- Cu
rrent
seas
onal
Hear
t Lak
e CA
TR
CAop
enno
5974
6248
4363
6Ti
ppin
g Bu
cket
2002
- Cu
rrent
seas
onal

Approved January 18, 2012A-19
Appendix A: Data Sources and Analysis
TRCA
Gau
ge N
ame
Ow
ner
Stat
usTe
lem
etry
East
ing
(N83
)N
orth
ing
(N83
)G
auge
Typ
eH
isto
rica
l Rec
ord
Leng
thSe
ason
al /
Year
Rou
nd
Kenn
edy
Pum
p St
atio
nTR
CAop
enno
n/a
n/a
Tipp
ing
Buck
et20
06 -
Curre
ntse
ason
al
King
and
Alb
ion-
Vaug
han
TRCA
open
no60
3013
4860
225
Tipp
ing
Buck
et20
06 -
Curre
ntse
ason
al
King
Cre
ek @
Mill
Roa
d TR
CAop
enye
s61
1487
4862
025
Tipp
ing
Buck
et20
03 -
Curre
ntse
ason
al
Laid
law
Bus
Dep
otTR
CAop
enno
5997
2148
5007
2Ti
ppin
g Bu
cket
2005
- Cu
rrent
seas
onal
Law
renc
e Av
enue
and
Wes
ton
Road
TRCA
clos
edye
s61
9215
4839
500
Tipp
ing
Buck
et20
05 -
2009
seas
onal
Lloy
d Ha
m F
arm
TRCA
clos
edno
6406
5248
6403
8Ti
ppin
g Bu
cket
2004
- 20
05se
ason
al
Mill
ers
Cree
k St
atio
nTR
CAcl
osed
no65
7300
4862
132.
9Ti
ppin
g Bu
cket
1999
- 20
00se
ason
al
Miss
issau
ga W
orks
Yar
dTR
CAop
enno
6079
9148
3845
0Ti
ppin
g Bu
cket
2005
- Cu
rrent
seas
onal
Mor
ning
side
Wor
ks Y
ard
TRCA
open
yes
6455
2948
4884
2Ti
ppin
g Bu
cket
2005
- Cu
rrent
seas
onal
Petti
coat
Cre
ek C
A TR
CAop
enno
6517
0348
5181
1Ti
ppin
g Bu
cket
2003
- Cu
rrent
seas
onal
Pick
erin
g Ci
ty H
all
TRCA
clos
edno
6536
0848
5527
0Ti
ppin
g Bu
cket
2001
- 20
04se
ason
al
Rees
or n
ear H
ighw
ay 7
TRCA
open
yes
6433
1348
6317
6Ti
ppin
g Bu
cket
2005
- Cu
rrent
seas
onal
Roug
e Ri
ver a
t 14t
hTR
CAcl
osed
yes
6419
6048
5766
3Ti
ppin
g Bu
cket
2003
- 20
07se
ason
al
St. W
ilfrid
Sch
ool
TRCA
clos
edno
6541
7748
5870
1Ti
ppin
g Bu
cket
2002
- 20
07se
ason
al
Stou
ffvill
e Da
mTR
CAop
enno
6403
4748
7086
9Ti
ppin
g Bu
cket
2005
- Cu
rrent
seas
onal
Stou
ffvill
e W
PCP
TRCA
clos
edno
6408
81.9
4869
846.
7Ti
ppin
g Bu
cket
2002
seas
onal
Sue
Gra
nge
Farm
TRCA
open
no58
9843
4847
840
Tipp
ing
Buck
et20
05 -
Curre
ntse
ason
al

Approved January 18, 2012 A-20
Approved Assessment Report: Toronto and Region Source Protection Area
TRCA
Gau
ge N
ame
Ow
ner
Stat
usTe
lem
etry
East
ing
(N83
)N
orth
ing
(N83
)G
auge
Typ
eH
isto
rica
l Rec
ord
Leng
thSe
ason
al /
Year
Rou
nd
Tow
n of
Cal
edon
Pum
ping
Sta
tion
TRCA
open
no59
1256
4857
875
Tipp
ing
Buck
et20
02 -
Curre
ntse
ason
al
TRCA
Hea
d O
ffice
TRCA
open
yes
6196
2348
4752
3Ti
ppin
g Bu
cket
2003
- Cu
rrent
seas
onal
York
Pum
ping
Sta
tion
TRCA
open
no62
2489
4863
741
Tipp
ing
Buck
et20
04 -
Curre
ntse
ason
al
York
Reg
ion
Wor
ks Y
ard
TRCA
open
no62
9933
4860
292
Tipp
ing
Buck
et20
04 -
Curre
ntse
ason
al
U of
T –
Sca
rbor
ough
Cam
pus
Univ
ersit
y of
To
ront
o op
enno
6454
64.1
4849
498.
5Ti
ppin
g Bu
cket
1996
- Cu
rrent
year
roun
d
Hum
ber
York
Reg
ion
open
no61
4285
4846
657
20
05 -
Curre
nt y
ear r
ound
Lesli
e Pu
mpi
ng S
tatio
nYo
rk R
egio
nop
enno
6301
65.5
4851
895.
3Ti
ppin
g Bu
cket
1995
- Cu
rrent
seas
onal
McC
owan
and
16t
hYo
rk R
egio
nop
enno
6378
31.1
4861
135.
3Ti
ppin
g Bu
cket
1995
- Cu
rrent
seas
onal
Pugs
ley
York
Reg
ion
clos
edno
6263
22.5
4859
254.
6Ti
ppin
g Bu
cket
n/a
seas
onal
Stou
ffvill
e W
orks
York
Reg
ion
open
no64
1612
.848
7152
0Ti
ppin
g Bu
cket
1995
- Cu
rrent
seas
onal

Approved January 18, 2012A-21
Appendix A: Data Sources and Analysis
Table a-5: snow Course locations
Station Watershed LocationRecord Frequency
(Nov-May)Period of Record
2307 Etobicoke Heart Lake Conservation Area Bi-weekly 1998 - Present
2302 Humber Cold Creek Stream Gauge Bi-weekly 2003 - 2004
2301 Humber Albion Hills Farm Bi-weekly 2004 - Present
2304 Humber Boyd Conservation Area Bi-weekly 2004 - Present
2303 Humber Claireville Dam Bi-weekly 2005 - Present
2310 Don G.Ross Lord Park Bi-weekly 1998 - Present
2309 Rouge Milne Conservation Park Bi-weekly 1998 - Present
2308 Rouge Bruce's Mill Range Bi-weekly 2004 - Present
2305 Duffins Claremont Shop Bi-weekly 2004 - 2009
2312 Duffins Greenwood Conservation Area Bi-weekly 1998 - Present
2311 Duffins Glen Major Forest Bi-weekly 2005 - Present
2306 Duffins Stouffville Dam Bi-weekly 2003 - 2004
Note: Parameters measured at each location include snow depth and water equivalency
Table a-6: groundwater Monitoring locations
Watershed Subwatershed Well Name Data Source Aquifer Period of Record
Etobicoke ET04W021-1 PGMN Oak Ridges Jun 01 - Sep 08
W366-1 PGMN Oak Ridges Sep 03 - Aug 07
Humber
HU01 W325-1 PGMN Scarborough Sep 03 - Aug 07
HU03 W367-1 PGMN Oak Ridges Sep 03 - Aug 07
HU06 W075-1 PGMN Thorncliffe Oct 01 - Aug 07
HU08W061-1 PGMN Scarborough Jul 01 - Aug 07
W060-1 PGMN Thorncliffe Jul 01 - Aug 07
HU10W327-3 PGMN Thorncliffe Jul 03 - Mar 07
W327-4 PGMN Scarborough Jul 03 - Aug 07
HU11W329-1 PGMN Oak Ridges Sep 03 - Jan 07
W330-1 PGMN Thorncliffe Feb 04 - Aug 07
HU12 W328-1 PGMN Bedrock Jul 03 - Jul 07
Don DO04 W017-2 PGMN Scarborough Aug 01 - Jun 08

Approved January 18, 2012 A-22
Approved Assessment Report: Toronto and Region Source Protection Area
Watershed Subwatershed Well Name Data Source Aquifer Period of Record
Rouge
RO02 Stouffville 700 MOE Oak Ridges Jun 03- Jul 07
RO03MW-09 Municipal Thorncliffe Jun 00- Aug 07
MW-02 Municipal Scarborough Jun 00- Aug 07
RO04 W382-1 PGMN Oak Ridges Feb 07 - Jul 07
RO05 W059-1 PGMN Oak Ridges Jul 01 - Jul 07
RO06 MW-26 Municipal Thorncliffe Mar 03- Aug 07
RO07 W006-1 PGMN Oak Ridges Jun 01 - Aug 07
Duffins
DU03
W326-2 PGMN Shallow Jul 03 – Oct 08
W326-3 PGMN Thorncliffe Jul 03 – Jul 08
W045-1 PGMN Scarborough Jun 01- Aug 07
DU04
W012-1 PGMN Shallow Jun 01- Aug 07
W011-1 PGMN Thorncliffe Jun 01- Aug 07
W010-1 PGMN Scarborough Jun 01- Aug 07
a1.2.5 surface Water Quality
Chemical and physical characteristics of surface water quality across the TRCA watersheds are monitored through the Provincial Surface Water Quality Monitoring Network (PWQMN). TRCA participates in this program by collecting monthly samples from April through November. The samples are analyzed for a range of water quality indicators, including temperature, Ph, conductivity, turbidity, suspended solids, major ions, nutrients, metals, and pesticides, in order to screen overall water quality. TRCA staff currently monitors 38 PWQMN stations located at watershed and subwatershed outlets (Table a-7). Historical data sets have existed for each site extending back to the early 1960s, though significant gaps in the dataset have been identified (Table a-8).
Table a-7: Current surface Water Quality sites
MOE Station ID
TRSPA IDCreek/
WatershedEasting Northing First Last Frequency Operator
E14.9 06008000702 Etobicoke Creek 606440 4836994 1965 2009 monthly PWQMN
E2.8 06008000602 Etobicoke Creek 616234 4829016 2002 2009 monthly PWQMN
M1.4 Mayfield Etobicoke Creek 595028 4843488 1973 2009 monthly RWMP
n/a MM003WM Mimico Creek 613849 4837916 2006 2009 monthly City of Toronto
M1.4 06008200302 Mimico Creek 621585 4831713 1994 2009 monthly PWQMN
HW16.9 06008300202 Humber River 610869 4843350 1966 2009 monthly City of Toronto
HB5.6 06008301202 Humber River 620488 4836845 1974 2009 monthly City of Toronto
n/a HU010WM Humber River 615027 4844744 2006 2009 monthly City of Toronto
n/a HU1RWMP Humber River 618678 4848311 2006 2009 monthly City of Toronto

Approved January 18, 2012A-23
Appendix A: Data Sources and Analysis
MOE Station ID
TRSPA IDCreek/
WatershedEasting Northing First Last Frequency Operator
H35.0 06008300902 Humber River 602980 4860243 1969 2009 monthly PWQMN
H42.5 06008301802 Humber River 596071 4864366 1975 2009 monthly PWQMN
H2.9 06008301902 Humber River 621663 4834265 1979 2009 monthly PWQMN
HW22.0 06008310302 Humber River 606385 4845870 2002 2009 monthly PWQMN
H43.9 06008310402 Humber River 593560 4864112 2002 2009 monthly PWQMN
HE20.7 06008300402 Humber River 614148 4850423 1965 2009 monthly RWMP
H23.9 06008302002 Humber River 610386 4851861 1996 2009 monthly RWMP
DE17.9 06008500302 Don River 628954 4851256 1966 2009 monthly City of Toronto
DW20.6 06008500402 Don River 622014 4851207 1966 2009 monthly City of Toronto
n/a DM 6.0 Don River 634378 4840251 2001 2009 monthly City of Toronto
n/a DN008WM Don River 630236 4850889 2006 2009 monthly City of Toronto
D4.5 06008501402 Don River 632000 4838576 1979 2009 monthly PWQMN
Hi2.5 06009400202 Highland Creek 647429 4849056 1972 2009 monthly City of Toronto
n/a RG008WM Rouge River 641985 4857669 1968 2009 monthly City of Toronto
RL9.0 RG007WM Rouge River 644300 4857816 1972 2009 monthly City of Toronto
R4.2 06009701302 Rouge River 648243 4852830 1973 2009 monthly City of Toronto
RL4.1 06009701102 Rouge River 648007 4852511 1973 2009 monthly PWQMN
RB20.1 06009701802 Rouge River 634680 4861770 2002 2009 monthly PWQMN
R18.4 97777 Rouge River 634214 4856823 2001 2009 monthly RWMP
RL17.4 97999 Rouge River 640589 4863887 1972 2009 monthly RWMP
Du2.4 06010400102 Duffins Creek 657579 4855880 1964 2009 monthly PWQMN
DuE17.5 06010400802 Duffins Creek 650372 4869299 1972 2009 monthly PWQMN
DuW5.3 Brock Ridge Duffins Creek 654656 4857115 1973 2009 monthly RWMP
DuE6.8 Paulyn Park Duffins Creek 655458 4859419 1973 2009 monthly RWMP
DuE15.4 7th Concession Duffins Creek 653641 4868158 1973 2009 monthly RWMP
DuW19.3 8th Concession Duffins Creek 644191 4866462 1973 2009 monthly RWMP
C2.8 Shoal PointCarruthers
Creek660850 4856972 2002 2009 monthly RWMP
n/a PT001WM Petticoat Creek 652005 4851804 2009 2009 monthly RWMP
n/a FB003WMFrenchman's
Bay653663 4854406 2009 2009 monthly RWMP

Approved January 18, 2012 A-24
Approved Assessment Report: Toronto and Region Source Protection Area
Table a-8: Historical surface Water Quality sites
MOE Station
IDTRSPA ID
Creek/Watershed
Easting Northing First Last Frequency Operator
E14.9 06008000702 Etobicoke Creek 606440 4836994 1965 2009 monthly PWQMN
E2.8 06008000602 Etobicoke Creek 616234 4829016 2002 2009 monthly PWQMN
E28.2 Mayfield Etobicoke Creek 595028 4843488 1973 2009 monthly RWMP
M1.4 06008200302 Mimico Creek 621585 4831713 1994 2009 monthly PWQMN
HW16.9 06008300202 Humber River 610869 4843350 1966 2009 monthly City of Toronto
HB5.6 06008301202 Humber River 620488 4836845 1974 2009 monthly City of Toronto
H35.0 06008300902 Humber River 602980 4860243 1969 2009 monthly PWQMN
H42.5 06008301802 Humber River 596071 4864366 1975 2009 monthly PWQMN
H2.9 06008301902 Humber River 621663 4834265 1979 2009 monthly PWQMN
HW22.0 06008310302 Humber River 606385 4845870 2002 2009 monthly PWQMN
H43.9 06008310402 Humber River 593560 4864112 2002 2009 monthly PWQMN
HE20.7 06008300402 Humber River 614148 4850423 1965 2009 monthly RWMP
H23.9 06008302002 Humber River 610386 4851861 1996 2009 monthly RWMP
DE17.9 06008500302 Don River 628954 4851256 1966 2009 monthly City of Toronto
DW20.6 06008500402 Don River 622014 4851207 1966 2009 monthly City of Toronto
D4.5 06008501402 Don River 632000 4838576 1979 2009 monthly PWQMN
Hi2.5 06009400202 Highland Creek 647429 4849056 1972 2009 monthly City of Toronto
n/a RG008WM Rouge River 641985 4857669 1968 2009 monthly City of Toronto
RL9.0 RG007WM Rouge River 644300 4857816 1972 2009 monthly City of Toronto
R4.2 06009701302 Rouge River 648243 4852830 1973 2009 monthly City of Toronto
RL4.1 06009701102 Rouge River 648007 4852511 1973 2009 monthly PWQMN
RB20.1 06009701802 Rouge River 634680 4861770 2002 2009 monthly PWQMN
Du2.4 06010400102 Duffins Creek 657579 4855880 1964 2009 monthly PWQMN
DuE17.5 06010400802 Duffins Creek 650372 4869299 1972 2009 monthly PWQMN
DuW5.3 Brock Ridge Duffins Creek 654656 4857115 1973 2009 monthly RWMP
DuE6.8 Paulyn Park Duffins Creek 655458 4859419 1973 2009 monthly RWMP
DuE15.4 7th Concession Duffins Creek 653641 4868158 1973 2009 monthly RWMP
DuW19.3 8th Concession Duffins Creek 644191 4866462 1973 2009 monthly RWMP
C2.8 Shoal PointCarruthers
Creek660850 4856972 2002 2009 monthly RWMP
n/a 06008000502 Etobicoke Creek 617474 4827078 3/15/2000 11/10/2000 n/a(inactive
PWQMN site)
n/a 06008301302 Humber River 589218 4869178 4/4/1974 8/29/1974 n/a(inactive
PWQMN site)
n/a 06008301502 Humber River 612730 4842578 4/3/1974 8/2/1974 n/a(inactive
PWQMN site)

Approved January 18, 2012A-25
Appendix A: Data Sources and Analysis
MOE Station
IDTRSPA ID
Creek/Watershed
Easting Northing First Last Frequency Operator
n/a 06008301602 Humber River 612740 4842583 4/3/1974 8/2/1974 n/a(inactive
PWQMN site)
n/a 06008310102 Humber River 619195 4839504 3/11/1983 3/11/1983 n/a(inactive
PWQMN site)
n/a 06008310202 Humber River 622835 4832723 3/15/2000 11/10/2000 n/a(inactive
PWQMN site)
n/a 06008500802 Don River 626204 4858973 1/17/1966 1/28/1966 n/a(inactive
PWQMN site)
n/a 06008501802 Don River 632700 4835191 3/15/2000 11/10/2000 n/a(inactive
PWQMN site)
n/a 06010405002 Duffins Creek 652104 4864327 4/8/1980 12/18/1980 n/a(inactive
PWQMN site)
n/a 06010405502 Duffins Creek 655901 4861642 7/31/1995 8/22/1995 n/a(inactive
PWQMN site)
n/a 06010406902 Duffins Creek 647411 4871764 8/21/1995 8/21/1995 n/a(inactive
PWQMN site)
n/a 06010407002 Duffins Creek 649002 4872314 8/21/1995 8/21/1995 n/a(inactive
PWQMN site)
n/a 06010407102 Duffins Creek 649669 4872547 8/21/1995 8/21/1995 n/a(inactive
PWQMN site)
n/a 06010408002 Duffins Creek 641956 4872776 8/17/1995 8/17/1995 n/a(inactive
PWQMN site)
n/a 06010408102 Duffins Creek 649549 4869119 8/21/1995 8/21/1995 n/a(inactive
PWQMN site)
n/a 06010408202 Duffins Creek 649398 4869563 8/21/1995 8/21/1995 n/a(inactive
PWQMN site)
n/a 06010408302 Duffins Creek 652779 4868123 8/22/1995 8/22/1995 n/a(inactive
PWQMN site)
n/a 06010408402 Duffins Creek 652631 4868535 8/21/1995 8/21/1995 n/a(inactive
PWQMN site)
n/a 06010408502 Duffins Creek 653974 4867664 8/21/1995 8/21/1995 n/a(inactive
PWQMN site)
n/a 06010408602 Duffins Creek 645040 4863213 8/18/1995 8/18/1995 n/a(inactive
PWQMN site)
n/a 06010408902 Duffins Creek 646431 4871746 8/18/1995 8/18/1995 n/a(inactive
PWQMN site)
n/a 06010409102 Duffins Creek 657850 4858083 8/23/1995 8/23/1995 n/a(inactive
PWQMN site)
n/a 06010409602 Duffins Creek 654966 4864290 8/22/1995 8/22/1995 n/a(inactive
PWQMN site)
n/a 06010409702 Duffins Creek 649874 4859626 8/24/1995 8/24/1995 n/a(inactive
PWQMN site)
n/a 06010410202 Duffins Creek 654121 4863860 8/23/1995 8/23/1995 n/a(inactive
PWQMN site)
n/a 06010410302 Duffins Creek 646268 4871461 8/18/1995 8/18/1995 n/a(inactive
PWQMN site)
n/a 06010410402 Duffins Creek 651330 4858408 8/24/1995 8/24/1995 n/a(inactive
PWQMN site)

Approved January 18, 2012 A-26
Approved Assessment Report: Toronto and Region Source Protection Area
MOE Station
IDTRSPA ID
Creek/Watershed
Easting Northing First Last Frequency Operator
n/a 06010410502 Duffins Creek 651290 4858750 8/24/1995 8/24/1995 n/a(inactive
PWQMN site)
n/a 06010410602 Duffins Creek 649310 4859546 8/24/1995 8/24/1995 n/a(inactive
PWQMN site)
n/a 06010410702 Duffins Creek 649536 4859455 8/24/1995 8/24/1995 n/a(inactive
PWQMN site)
n/a 06010410802 Duffins Creek 640974 4869724 8/17/1995 8/17/1995 n/a(inactive
PWQMN site)
n/a 06010410902 Duffins Creek 650130 4859270 8/24/1995 8/24/1995 n/a(inactive
PWQMN site)
n/a 06010411902 Duffins Creek 646133 4875270 8/30/1995 8/30/1995 n/a(inactive
PWQMN site)
n/a 06010412102 Duffins Creek 646054 4875220 8/30/1995 8/30/1995 n/a(inactive
PWQMN site)
n/a 06008302102 Humber River 613384 4852770 8/28/1995 8/26/1996 n/a(inactive
PWQMN site)
n/a 06008304502 Humber River 603766 4862233 8/30/1995 9/10/1996 n/a(inactive
PWQMN site)
n/a 06008304702 Humber River 616602 4842900 8/29/1995 8/13/1996 n/a(inactive
PWQMN site)
n/a 06008304802 Humber River 610180 4854350 8/29/1995 8/14/1996 n/a(inactive
PWQMN site)
n/a 06008305602 Humber River 588963 4865305 8/30/1995 8/13/1996 n/a(inactive
PWQMN site)
n/a 06008500702 Don River 626251 4858868 10/28/1965 1/31/1966 n/a(inactive
PWQMN site)
n/a 06008501202 Don River 626297 4857041 10/18/1966 7/6/1967 n/a(inactive
PWQMN site)
n/a 06009701502 Rouge River 645007 4858864 5/31/1973 8/27/1974 n/a(inactive
PWQMN site)
n/a 06009701602 Rouge River 643223 4863213 5/31/1973 8/27/1974 n/a(inactive
PWQMN site)
n/a 06009701702 Rouge River 641079 4863479 5/31/1973 8/27/1974 n/a(inactive
PWQMN site)
n/a 06010401902 Duffins Creek 651842 4858352 5/30/1973 8/28/1974 n/a(inactive
PWQMN site)
n/a 06010404502 Duffins Creek 648371 4860362 5/31/1973 8/11/1974 n/a(inactive
PWQMN site)
n/a 06010405602 Duffins Creek 653089 4861899 7/31/1995 9/18/1996 n/a(inactive
PWQMN site)
n/a 06010405702 Duffins Creek 652568 4862680 7/31/1995 9/18/1996 n/a(inactive
PWQMN site)
n/a 06010405902 Duffins Creek 643534 4867490 7/31/1995 8/14/1996 n/a(inactive
PWQMN site)
n/a 06010406002 Duffins Creek 642308 4867924 7/31/1995 8/14/1996 n/a(inactive
PWQMN site)
n/a 06010406102 Duffins Creek 641845 4868442 7/31/1995 8/14/1996 n/a(inactive
PWQMN site)
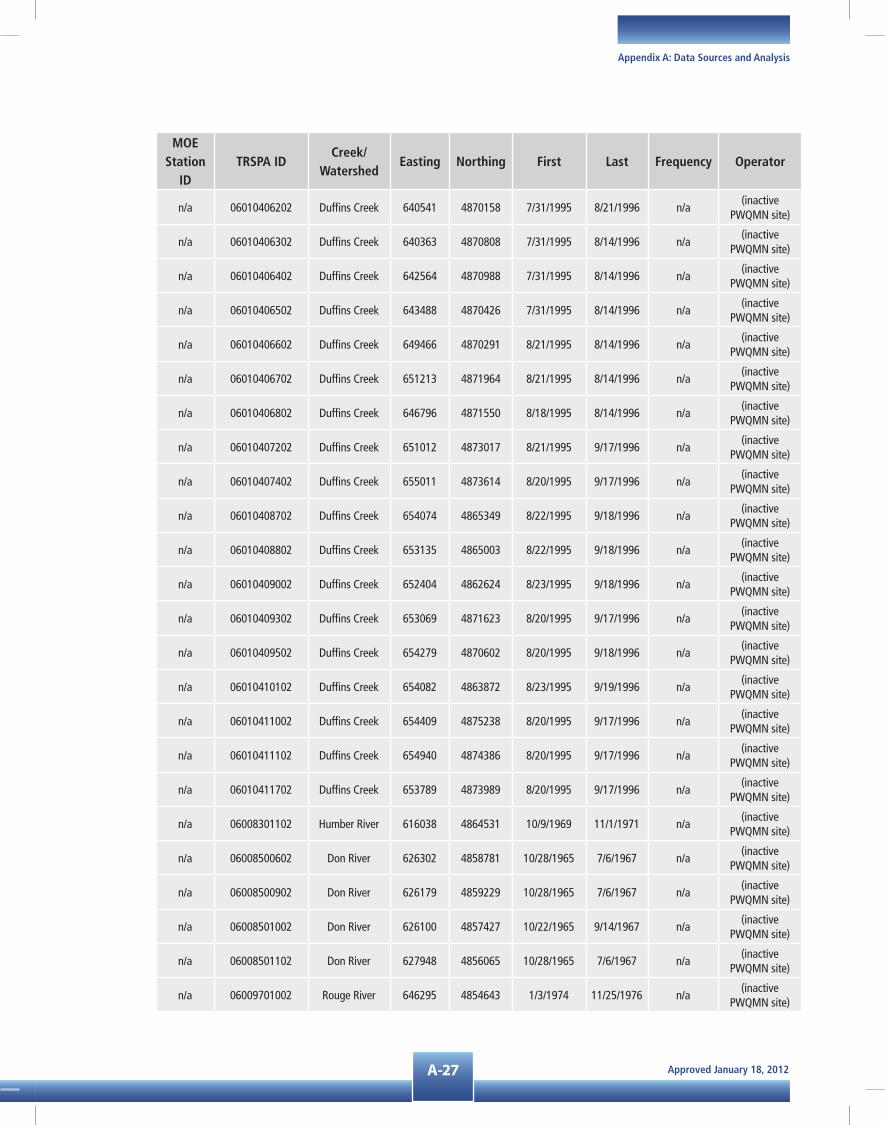
Approved January 18, 2012A-27
Appendix A: Data Sources and Analysis
MOE Station
IDTRSPA ID
Creek/Watershed
Easting Northing First Last Frequency Operator
n/a 06010406202 Duffins Creek 640541 4870158 7/31/1995 8/21/1996 n/a(inactive
PWQMN site)
n/a 06010406302 Duffins Creek 640363 4870808 7/31/1995 8/14/1996 n/a(inactive
PWQMN site)
n/a 06010406402 Duffins Creek 642564 4870988 7/31/1995 8/14/1996 n/a(inactive
PWQMN site)
n/a 06010406502 Duffins Creek 643488 4870426 7/31/1995 8/14/1996 n/a(inactive
PWQMN site)
n/a 06010406602 Duffins Creek 649466 4870291 8/21/1995 8/14/1996 n/a(inactive
PWQMN site)
n/a 06010406702 Duffins Creek 651213 4871964 8/21/1995 8/14/1996 n/a(inactive
PWQMN site)
n/a 06010406802 Duffins Creek 646796 4871550 8/18/1995 8/14/1996 n/a(inactive
PWQMN site)
n/a 06010407202 Duffins Creek 651012 4873017 8/21/1995 9/17/1996 n/a(inactive
PWQMN site)
n/a 06010407402 Duffins Creek 655011 4873614 8/20/1995 9/17/1996 n/a(inactive
PWQMN site)
n/a 06010408702 Duffins Creek 654074 4865349 8/22/1995 9/18/1996 n/a(inactive
PWQMN site)
n/a 06010408802 Duffins Creek 653135 4865003 8/22/1995 9/18/1996 n/a(inactive
PWQMN site)
n/a 06010409002 Duffins Creek 652404 4862624 8/23/1995 9/18/1996 n/a(inactive
PWQMN site)
n/a 06010409302 Duffins Creek 653069 4871623 8/20/1995 9/17/1996 n/a(inactive
PWQMN site)
n/a 06010409502 Duffins Creek 654279 4870602 8/20/1995 9/18/1996 n/a(inactive
PWQMN site)
n/a 06010410102 Duffins Creek 654082 4863872 8/23/1995 9/19/1996 n/a(inactive
PWQMN site)
n/a 06010411002 Duffins Creek 654409 4875238 8/20/1995 9/17/1996 n/a(inactive
PWQMN site)
n/a 06010411102 Duffins Creek 654940 4874386 8/20/1995 9/17/1996 n/a(inactive
PWQMN site)
n/a 06010411702 Duffins Creek 653789 4873989 8/20/1995 9/17/1996 n/a(inactive
PWQMN site)
n/a 06008301102 Humber River 616038 4864531 10/9/1969 11/1/1971 n/a(inactive
PWQMN site)
n/a 06008500602 Don River 626302 4858781 10/28/1965 7/6/1967 n/a(inactive
PWQMN site)
n/a 06008500902 Don River 626179 4859229 10/28/1965 7/6/1967 n/a(inactive
PWQMN site)
n/a 06008501002 Don River 626100 4857427 10/22/1965 9/14/1967 n/a(inactive
PWQMN site)
n/a 06008501102 Don River 627948 4856065 10/28/1965 7/6/1967 n/a(inactive
PWQMN site)
n/a 06009701002 Rouge River 646295 4854643 1/3/1974 11/25/1976 n/a(inactive
PWQMN site)

Approved January 18, 2012 A-28
Approved Assessment Report: Toronto and Region Source Protection Area
MOE Station
IDTRSPA ID
Creek/Watershed
Easting Northing First Last Frequency Operator
n/a 06010405202 Duffins Creek 654074 4865349 5/20/1980 6/21/1984 n/a(inactive
PWQMN site)
n/a 06009700802 Rouge River 644360 4860778 10/2/1972 12/14/1977 n/a(inactive
PWQMN site)
n/a 06009400102 Highland Creek 649292 4847680 12/3/1964 11/16/1971 n/a(inactive
PWQMN site)
n/a 06009700102 Rouge River 651395 4850769 12/3/1964 11/16/1971 n/a(inactive
PWQMN site)
n/a 06008300802 Humber River 617672 4840818 5/27/1987 8/13/1996 n/a(inactive
PWQMN site)
n/a 06008310002 Humber River 614325 4846472 3/10/1983 8/14/1996 n/a(inactive
PWQMN site)
n/a 06010400302 Duffins Creek 657880 4855149 3/5/1968 12/21/1981 n/a(inactive
PWQMN site)
n/a 06010405102 Duffins Creek 653913 4864162 5/20/1980 8/14/1996 n/a(inactive
PWQMN site)
n/a 06009701202 Rouge River 644760 4854290 5/31/1973 10/23/1990 n/a(inactive
PWQMN site)
n/a 06009700602 Rouge River 644675 4856600 10/2/1972 10/23/1990 n/a(inactive
PWQMN site)
n/a 06008501302 Don River 631739 4837665 10/19/1972 4/25/1991 n/a(inactive
PWQMN site)
n/a 06010404602 Duffins Creek 653836 4860709 2/26/1976 9/18/1996 n/a(inactive
PWQMN site)
n/a 06010404702 Duffins Creek 651480 4864395 2/25/1976 9/18/1996 n/a(inactive
PWQMN site)
n/a 06010404802 Duffins Creek 651902 4864551 2/25/1976 9/18/1996 n/a(inactive
PWQMN site)
n/a 06010404902 Duffins Creek 649429 4863727 2/25/1976 9/18/1996 n/a(inactive
PWQMN site)
n/a 06008301702 Humber River 603801 4849294 3/24/1975 8/14/1996 n/a(inactive
PWQMN site)
n/a 06010401302 Duffins Creek 653832 4856973 6/3/1974 8/21/1996 n/a(inactive
PWQMN site)
n/a 06010401502 Duffins Creek 644396 4866297 6/3/1974 8/14/1996 n/a(inactive
PWQMN site)
n/a 06010401602 Duffins Creek 643796 4868370 6/3/1974 8/14/1996 n/a(inactive
PWQMN site)
n/a 06010401702 Duffins Creek 645289 4868873 6/3/1974 8/14/1996 n/a(inactive
PWQMN site)
n/a 06010401802 Duffins Creek 645880 4869071 6/3/1974 8/14/1996 n/a(inactive
PWQMN site)
n/a 06010402402 Duffins Creek 654210 4858430 6/3/1974 9/18/1996 n/a(inactive
PWQMN site)
n/a 06008000302 Etobicoke Creek 614077 4832624 10/19/1972 5/3/1995 n/a(inactive
PWQMN site)
n/a 06008300502 Humber River 603030 4860055 5/17/1965 10/4/1988 n/a(inactive
PWQMN site)
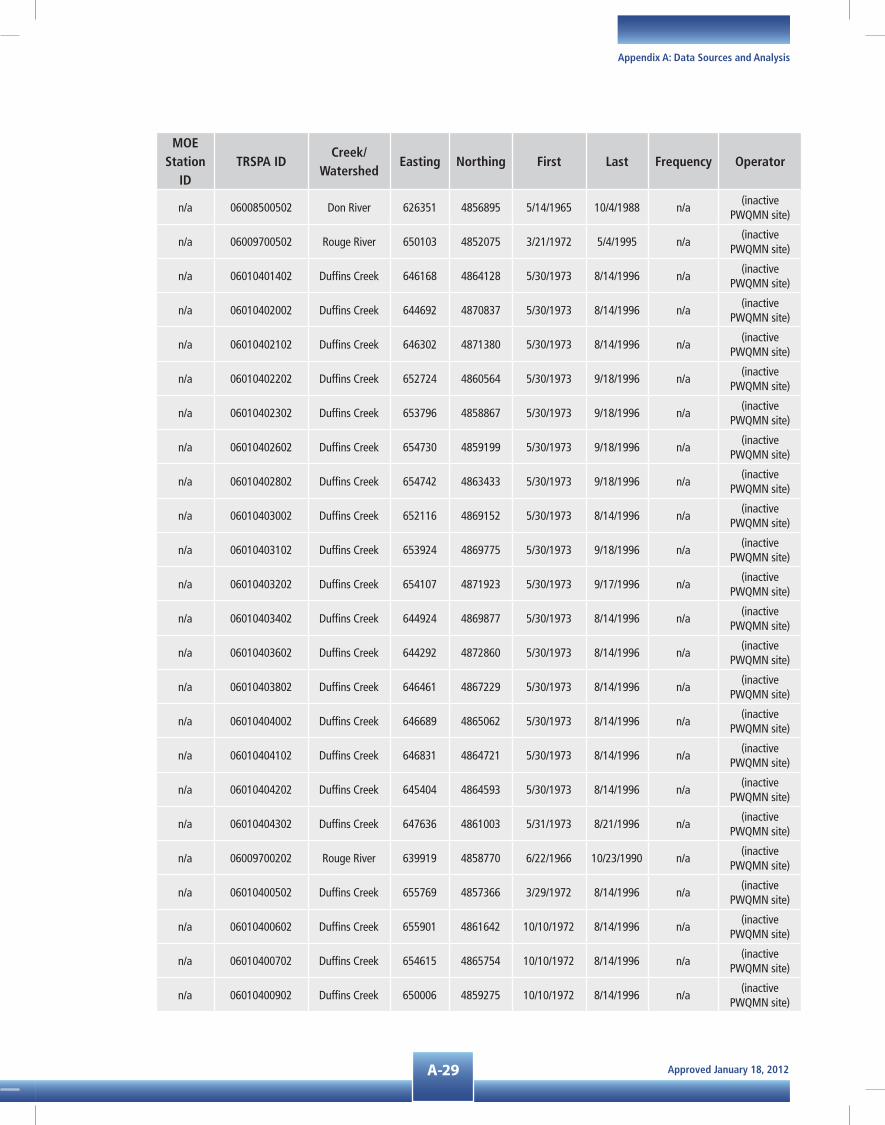
Approved January 18, 2012A-29
Appendix A: Data Sources and Analysis
MOE Station
IDTRSPA ID
Creek/Watershed
Easting Northing First Last Frequency Operator
n/a 06008500502 Don River 626351 4856895 5/14/1965 10/4/1988 n/a(inactive
PWQMN site)
n/a 06009700502 Rouge River 650103 4852075 3/21/1972 5/4/1995 n/a(inactive
PWQMN site)
n/a 06010401402 Duffins Creek 646168 4864128 5/30/1973 8/14/1996 n/a(inactive
PWQMN site)
n/a 06010402002 Duffins Creek 644692 4870837 5/30/1973 8/14/1996 n/a(inactive
PWQMN site)
n/a 06010402102 Duffins Creek 646302 4871380 5/30/1973 8/14/1996 n/a(inactive
PWQMN site)
n/a 06010402202 Duffins Creek 652724 4860564 5/30/1973 9/18/1996 n/a(inactive
PWQMN site)
n/a 06010402302 Duffins Creek 653796 4858867 5/30/1973 9/18/1996 n/a(inactive
PWQMN site)
n/a 06010402602 Duffins Creek 654730 4859199 5/30/1973 9/18/1996 n/a(inactive
PWQMN site)
n/a 06010402802 Duffins Creek 654742 4863433 5/30/1973 9/18/1996 n/a(inactive
PWQMN site)
n/a 06010403002 Duffins Creek 652116 4869152 5/30/1973 8/14/1996 n/a(inactive
PWQMN site)
n/a 06010403102 Duffins Creek 653924 4869775 5/30/1973 9/18/1996 n/a(inactive
PWQMN site)
n/a 06010403202 Duffins Creek 654107 4871923 5/30/1973 9/17/1996 n/a(inactive
PWQMN site)
n/a 06010403402 Duffins Creek 644924 4869877 5/30/1973 8/14/1996 n/a(inactive
PWQMN site)
n/a 06010403602 Duffins Creek 644292 4872860 5/30/1973 8/14/1996 n/a(inactive
PWQMN site)
n/a 06010403802 Duffins Creek 646461 4867229 5/30/1973 8/14/1996 n/a(inactive
PWQMN site)
n/a 06010404002 Duffins Creek 646689 4865062 5/30/1973 8/14/1996 n/a(inactive
PWQMN site)
n/a 06010404102 Duffins Creek 646831 4864721 5/30/1973 8/14/1996 n/a(inactive
PWQMN site)
n/a 06010404202 Duffins Creek 645404 4864593 5/30/1973 8/14/1996 n/a(inactive
PWQMN site)
n/a 06010404302 Duffins Creek 647636 4861003 5/31/1973 8/21/1996 n/a(inactive
PWQMN site)
n/a 06009700202 Rouge River 639919 4858770 6/22/1966 10/23/1990 n/a(inactive
PWQMN site)
n/a 06010400502 Duffins Creek 655769 4857366 3/29/1972 8/14/1996 n/a(inactive
PWQMN site)
n/a 06010400602 Duffins Creek 655901 4861642 10/10/1972 8/14/1996 n/a(inactive
PWQMN site)
n/a 06010400702 Duffins Creek 654615 4865754 10/10/1972 8/14/1996 n/a(inactive
PWQMN site)
n/a 06010400902 Duffins Creek 650006 4859275 10/10/1972 8/14/1996 n/a(inactive
PWQMN site)

Approved January 18, 2012 A-30
Approved Assessment Report: Toronto and Region Source Protection Area
MOE Station
IDTRSPA ID
Creek/Watershed
Easting Northing First Last Frequency Operator
n/a 06010401002 Duffins Creek 646069 4862567 10/10/1972 8/21/1996 n/a(inactive
PWQMN site)
n/a 06010401102 Duffins Creek 640971 4869738 10/10/1972 8/21/1996 n/a(inactive
PWQMN site)
n/a 06010401202 Duffins Creek 640012 4872146 10/10/1972 8/14/1996 n/a(inactive
PWQMN site)
n/a 06008200202 Mimico Creek 615334 4836534 10/19/1972 4/22/1997 n/a(inactive
PWQMN site)
n/a 06008301002 Humber River 610184 4862206 9/26/1969 8/14/1996 n/a(inactive
PWQMN site)
n/a 06008500202 Don River 626387 4846114 8/18/1965 12/2/1993 n/a(inactive
PWQMN site)
n/a 06008200102 Mimico Creek 622480 4831009 10/28/1964 11/1/1994 n/a(inactive
PWQMN site)
n/a 06008300702 Humber River 616066 4858668 3/4/1966 8/15/1996 n/a(inactive
PWQMN site)
n/a 06009701402 Rouge River 642465 4855862 5/31/1973 9/30/2003 n/a(inactive
PWQMN site)
n/a 06010400202 Duffins Creek 655089 4863548 6/22/1966 8/20/1996 n/a(inactive
PWQMN site)
n/a 06010700102Carruthers
Creek661492 4855140 12/3/1964 12/15/1994 n/a
(inactive PWQMN site)
n/a 06008300602 Humber River 615862 4857805 11/22/1965 8/14/1996 n/a(inactive
PWQMN site)
n/a 6008301402 Humber River 602514 4852850 4/17/1974 3/29/2005 n/a(inactive
PWQMN site)
n/a 06008500102 Don River 633282 4834411 12/3/1964 5/2/1995 n/a(inactive
PWQMN site)
n/a 06008300102 Humber River 623155 4832250 10/28/1964 9/7/1996 n/a(inactive
PWQMN site)
n/a 06008000102 Etobicoke Creek 617345 4827245 10/28/1964 4/21/1997 n/a(inactive
PWQMN site)
n/a 06009900102 Petticoat Creek 648912 4855136 5/31/1973 6/23/2009 n/a(inactive
PWQMN site)
n/a 06008300302 Humber River 613365 4848426 5/17/1965 8/24/2004 n/a(inactive
PWQMN site)
a1.2.6 low-flow stream flow surveys
TRCA is working with the Ministry of Natural Resources and the Ministry of the Environment on the Low Water Response Program. This program monitors rainfall and streamflow within the creeks of TRCA’s watersheds. The Authority has also undertaken a stream baseflow assessment program. The main objective of this work is to obtain baseflow information to help develop a long-term baseflow monitoring network using a predetermined distribution of measurement sites. These data are also necessary for model calibration in water budgeting exercises, a necessary component for Source Water Protection activities.

Approved January 18, 2012A-31
Appendix A: Data Sources and Analysis
Table a-9 lists the index sites where streamflow measurements are taken annually. A more comprehensive list of sites (about 1200 locations) has been surveyed once. The annual index field program measures flows taken over spring/summer/fall seasons. Field flow measurements are generally taken at stream crossings and stream gauge stations. These measurements represent a significant source of information that supports aquatic studies, groundwater discharge, and water budgets, including numerical model calibration.
a1.2.7 biological Monitoring
Biological sampling measures ecological effects, whereas sampling for chemical and physical parameters measures stressors (i.e., environmental contamination). Though source water protection technical guidelines do not directly link the assessment and protection of drinking water to biological assessment, it is recognized that the various components of the watershed are closely linked. Protecting source water is important to the biological health of the watershed, and biological indicators are fundamental in protecting source water. TRCA’s biological surveys involve sampling creatures, such as benthic macroinvertebrates and fish, found living within the aquatic environment. Benthic macroinvertebrates make good health indicators of aquatic ecosystems because
• They generally have limited mobility, which makes them vulnerable to many creek stresses that may occur,
• They have short life cycles,
• They are easily collected and identified; and,
• Their spatial distribution across the watershed is good.
The Ontario Stream Assessment Protocol (OSAP) contains a series of standardized methodologies for identifying sites, evaluating benthic macroinvertebrates, fish communities, physical habitat and water temperatures in wadeable streams (Table a-10). The OSAP provides standardized methods that ensure data repeatability. Use of these standard methodologies allows data to be shared, used for multiple purposes and stored in a common database.
Table a-9: low flow index Monitoring stations
Site Easting Northing Watershed Site Easting Northing Watershed
EC 25 595030 4843482 Etobicoke lwd001 633779 4841028 Don
EC 67 605451 4839049 Etobicoke lwd026 624132 4848401 Don
EC 79 614246 4830169 Etobicoke TM006 637716 4839714 Don
EC 92 613603 4833331 Etobicoke UED001 629393 4850780 Don
M01 602629 4843968 Mimico HC006 648955 4848711 Highland
M06 610152 4841553 Mimico HC009 648186 4847729 Highland
HUM 109 611768 4850621 Humber HC012 648280 4848525 Highland
HUM 148 600520 4859203 Humber HC015B 645315 4848697 Highland
HUM 168 593288 4865289 Humber HC027 642188 4845973 Highland
HUM 194 613001 4844691 Humber HC028 643541 4849404 Highland
HUM 200 616442 4842859 Humber pc001 652135 4851859 Petticoat
HUM 38 613762 4849493 Humber pc007 648910 4855139 Petticoat
HUM 400 619657 4838490 Humber fb001 652968 4853997 Frenchman’s Bay

Approved January 18, 2012 A-32
Approved Assessment Report: Toronto and Region Source Protection Area
Site Easting Northing Watershed Site Easting Northing Watershed
HUM 401 616953 4845252 Humber fb002 653014 4854040 Frenchman’s Bay
HUM 402 612498 4848107 Humber fb003 653701 4854105 Frenchman’s Bay
HUM 44 612652 4854670 Humber fb005 654858 4854068 Frenchman’s Bay
HUM 45 611575 4855280 Humber br001 635017 4859709 Rouge
HUM 57 611473 4862014 Humber bz001 634113 4859369 Rouge
HUM 58 610175 4862204 Humber lt004 648190 4852787 Rouge
HUM 66 620482 4836847 Humber lt048 638689 4867409 Rouge
HUM 86 621670 4834267 Humber lw003 647926 4852541 Rouge
HUM 90 619004 4836885 Humber mb001 639724 4858841 Rouge
HUM 93 618284 4840148 Humber ur001 632876 4856526 Rouge
HUM 95 616192 4841813 Humber D-001 643487 4870429 Duffins
MH072 602683 4860817 Humber D-065 650373 4869303 Duffins
MH183 593893 4864607 Humber D-076 653977 4867670 Duffins
WH003 608572 4845382 Humber D-139 655895 4861650 Duffins
WH004 608964 4845503 Humber D-146 650016 4859280 Duffins
WH023 604959 4846240 Humber D-147 653808 4858869 Duffins
WH024 604204 4846973 Humber D-148 654736 4859204 Duffins
WH999 606250 4846807 Humber D-158 641854 4868446 Duffins
GM001 630785 4851296 Don C 08 657977 4863340 Carruthers
LD006 632912 4839805 Don C 11 659516 4860768 Carruthers
LE004 635426 4841131 Don C 13 660848 4856971 Carruthers
Table a-10: TrCa o.s.a.P Monitoring sites
Site Easting Northing Watershed Site Easting Northing Watershed
CC001WM 661121 4855576 Carruthers HL011WM 637340 4849639 Highland
CC002WM 660268 4858861 Carruthers HU001WM 612659 4854231 Humber
CC003WM 658930 4863523 Carruthers HU002WM 607384 4857019 Humber
DF001WM 657593 4855822 Duffins HU003WM 621589 4834352 Humber
DF002WM 657173 4857428 Duffins HU004WM 619540 4836843 Humber
DF003WM 654508 4856983 Duffins HU005WM 618707 4838788 Humber
DF004WM 653852 4858725 Duffins HU006WM 622420 4838204 Humber
DF005WM 654763 4858973 Duffins HU007WM 617985 4840192 Humber
DF006WM 655883 4860987 Duffins HU008WM 617238 4841693 Humber
DF007WM 653744 4860811 Duffins HU009WM 616778 4842969 Humber
DF008WM 652736 4860492 Duffins HU010WM 614924 4844734 Humber

Approved January 18, 2012A-33
Appendix A: Data Sources and Analysis
Site Easting Northing Watershed Site Easting Northing Watershed
DF009WM 650000 4859273 Duffins HU011WM 612842 4847385 Humber
DF010WM 649124 4859367 Duffins HU012WM 614003 4847239 Humber
DF011WM 645848 4862667 Duffins HU013WM 606253 4845918 Humber
DF012WM 646124 4864111 Duffins HU014WM 605098 4848563 Humber
DF013WM 644206 4866417 Duffins HU015WM 602928 4847895 Humber
DF014WM 641811 4868439 Duffins HU016WM 601851 4847187 Humber
DF015WM 645280 4868850 Duffins HU017WM 593632 4846522 Humber
DF016WM 643456 4870436 Duffins HU018WM 608561 4849985 Humber
DF017WM 644287 4872830 Duffins HU019WM 609690 4851277 Humber
DF018WM 654862 4863414 Duffins HU020WM 615016 4857089 Humber
DF019WM 653999 4867721 Duffins HU021WM 612371 4856262 Humber
DF020WM 650275 4869239 Duffins HU022WM 609765 4859761 Humber
DF021WM 654678 4873462 Duffins HU023WM 610233 4861996 Humber
DN001WM 631839 4837534 Don HU024WM 611315 4861789 Humber
DN002WM 634764 4840068 Don HU025WM 620131 4866530 Humber
DN003WM 638455 4841069 Don HU026WM 603015 4860198 Humber
DN004WM 639755 4842299 Don HU027WM 603591 4861940 Humber
DN005WM 634766 4842278 Don HU028WM 601793 4861776 Humber
DN006WM 632976 4846513 Don HU029WM 598529 4859919 Humber
DN007WM 630918 4848580 Don HU030WM 597058 4859635 Humber
DN008WM 630235 4850873 Don HU031WM 593659 4860857 Humber
DN009WM 630745 4853913 Don HU032WM 592216 4858545 Humber
DN010WM 629293 4854276 Don HU033WM 594115 4864598 Humber
DN011WM 626278 4858242 Don HU034WM 592783 4865359 Humber
DN012WM 633790 4841000 Don HU035WM 588848 4864881 Humber
DN013WM 632679 4842241 Don HU036WM 591433 4868401 Humber
DN014WM 631615 4842129 Don HU037WM 587110 4868549 Humber
DN015WM 628077 4844774 Don HU038WM 583289 4867522 Humber
DN016WM 622615 4850449 Don MM001WM 622398 4831011 Mimico
DN017WM 621256 4852568 Don MM002WM 617833 4834609 Mimico
DN018WM 618451 4854086 Don MM003WM 613832 4837911 Mimico
DN019WM 618574 4856472 Don MM004WM 609794 4841708 Mimico
DN020WM 628121 4853039 Don MM005WM 608657 4840085 Mimico
DN021WM 626437 4853013 Don PT001WM 651987 4851798 Petticoat
DN022WM 623729 4855642 Don PT002WM 649492 4854411 Petticoat
DN023WM 624573 4856474 Don PT003WM 649025 4855400 Petticoat

Approved January 18, 2012 A-34
Approved Assessment Report: Toronto and Region Source Protection Area
Site Easting Northing Watershed Site Easting Northing Watershed
EC001WM 617505 4827026 Etobicoke PT004WM 647273 4856586 Petticoat
EC002WM 615805 4829373 Etobicoke RG001WM 648483 4852831 Rouge
EC003WM 615445 4832002 Etobicoke RG002WM 647983 4852454 Rouge
EC004WM 613846 4833123 Etobicoke RG003WM 645361 4852367 Rouge
EC005WM 610140 4835534 Etobicoke RG004WM 643432 4853479 Rouge
EC006WM 607745 4835482 Etobicoke RG005WM 641511 4855511 Rouge
EC007WM 607099 4836727 Etobicoke RG006WM 644736 4854274 Rouge
EC008WM 603544 4836301 Etobicoke RG007WM 644249 4857809 Rouge
EC009WM 605493 4838941 Etobicoke RG008WM 641983 4857650 Rouge
EC010WM 600414 4843094 Etobicoke RG009WM 640592 4858859 Rouge
EC011WM 599030 4838985 Etobicoke RG010WM 639829 4858986 Rouge
EC012WM 595142 4843473 Etobicoke RG011WM 640693 4863593 Rouge
EC013WM 592816 4844601 Etobicoke RG012WM 637631 4866976 Rouge
EC014WM 592483 4843057 Etobicoke RG013WM 637131 4865731 Rouge
FB001WM 652478 4854437 Frenchman's Bay RG014WM 637095 4866273 Rouge
FB002WM 652737 4853827 Frenchman's Bay RG015WM 635052 4859699 Rouge
FB003WM 653655 4854367 Frenchman's Bay RG016WM 634341 4859301 Rouge
FB004WM 654975 4853937 Frenchman's Bay RG017WM 633024 4859990 Rouge
HL001WM 649487 4848106 Highland RG018WM 631467 4862594 Rouge
HL002WM 647813 4848741 Highland RG019WM 633477 4865486 Rouge
HL003WM 644806 4847677 Highland RG020WM 633873 4856414 Rouge
HL004WM 644561 4848686 Highland RG021WM 632687 4856699 Rouge
HL005WM 642727 4849327 Highland RG022WM 629166 4860184 Rouge
HL006WM 642794 4850383 Highland RG023WM 629445 4860190 Rouge
HL007WM 640119 4850188 Highland RG024WM 627595 4860793 Rouge
HL008WM 641439 4852384 Highland RG025WM 626888 4863281 Rouge
HL009WM 641804 4845601 Highland RG026WM 627881 4863600 Rouge
HL010WM 641345 4846335 Highland
a1.2.8 Coastal Wetland Monitoring
The Durham Region Coastal Wetland Monitoring Project is designed as a long-term program that will assess the health of 15 wetlands along the north shore of Lake Ontario in Durham Region (Table a-11). Five of these wetlands are in TRSPA’s jurisdiction.
To standardize the collection of biological and physical data among the partner organizations, a Methodology Handbook was developed by Environment Canada and the Central Lake Ontario Conservation Authority and fieldwork began in the spring of 2002.
Water levels in the Great Lakes have been recorded by the Canadian Hydrographic Service since 1860. These
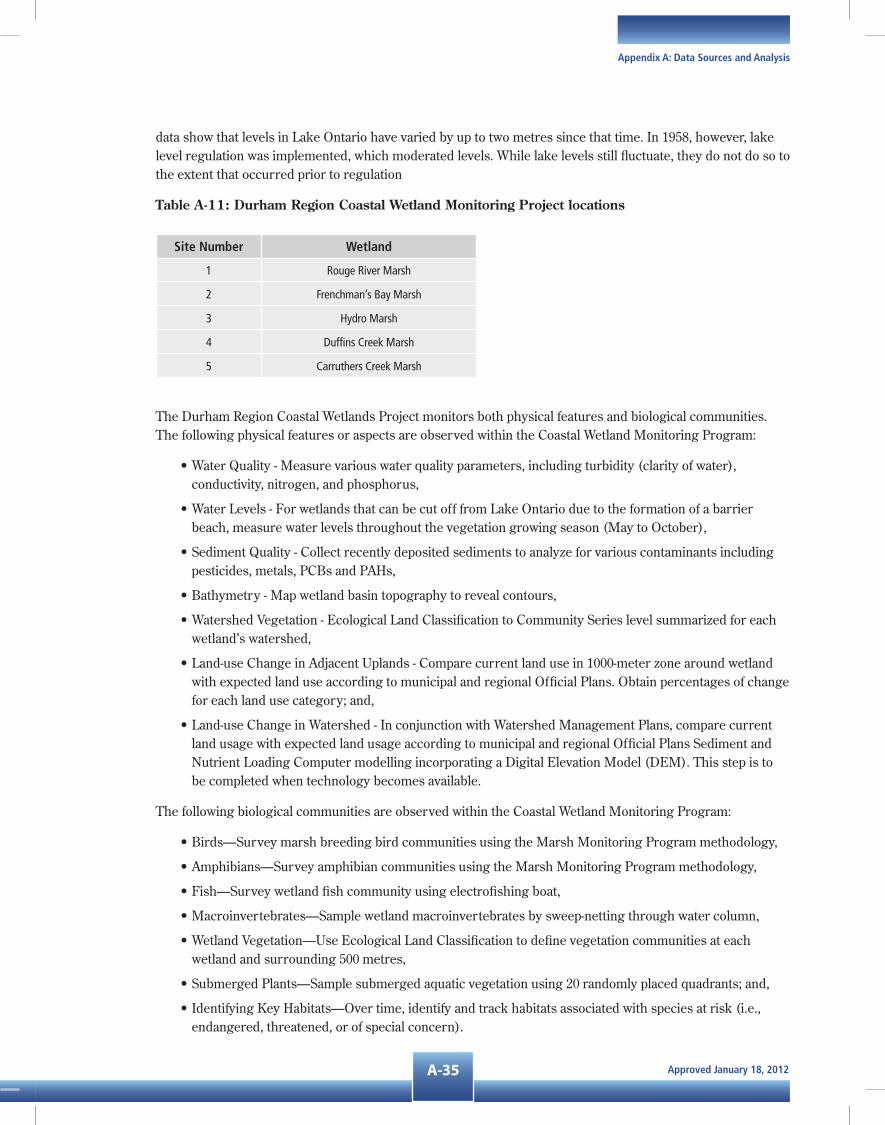
Approved January 18, 2012A-35
Appendix A: Data Sources and Analysis
data show that levels in Lake Ontario have varied by up to two metres since that time. In 1958, however, lake level regulation was implemented, which moderated levels. While lake levels still fluctuate, they do not do so to the extent that occurred prior to regulation
Table a-11: Durham region Coastal Wetland Monitoring Project locations
Site Number Wetland
1 Rouge River Marsh
2 Frenchman’s Bay Marsh
3 Hydro Marsh
4 Duffins Creek Marsh
5 Carruthers Creek Marsh
The Durham Region Coastal Wetlands Project monitors both physical features and biological communities. The following physical features or aspects are observed within the Coastal Wetland Monitoring Program:
• Water Quality - Measure various water quality parameters, including turbidity (clarity of water), conductivity, nitrogen, and phosphorus,
• Water Levels - For wetlands that can be cut off from Lake Ontario due to the formation of a barrier beach, measure water levels throughout the vegetation growing season (May to October),
• Sediment Quality - Collect recently deposited sediments to analyze for various contaminants including pesticides, metals, PCBs and PAHs,
• Bathymetry - Map wetland basin topography to reveal contours,
• Watershed Vegetation - Ecological Land Classification to Community Series level summarized for each wetland’s watershed,
• Land-use Change in Adjacent Uplands - Compare current land use in 1000-meter zone around wetland with expected land use according to municipal and regional Official Plans. Obtain percentages of change for each land use category; and,
• Land-use Change in Watershed - In conjunction with Watershed Management Plans, compare current land usage with expected land usage according to municipal and regional Official Plans Sediment and Nutrient Loading Computer modelling incorporating a Digital Elevation Model (DEM). This step is to be completed when technology becomes available.
The following biological communities are observed within the Coastal Wetland Monitoring Program:
• Birds—Survey marsh breeding bird communities using the Marsh Monitoring Program methodology,
• Amphibians—Survey amphibian communities using the Marsh Monitoring Program methodology,
• Fish—Survey wetland fish community using electrofishing boat,
• Macroinvertebrates—Sample wetland macroinvertebrates by sweep-netting through water column,
• Wetland Vegetation—Use Ecological Land Classification to define vegetation communities at each wetland and surrounding 500 metres,
• Submerged Plants—Sample submerged aquatic vegetation using 20 randomly placed quadrants; and,
• Identifying Key Habitats—Over time, identify and track habitats associated with species at risk (i.e., endangered, threatened, or of special concern).

Approved January 18, 2012 A-36
Approved Assessment Report: Toronto and Region Source Protection Area
a1.3 inforMaTion ManageMenT sysTeM
One of the key elements of any Monitoring Program is the data that are collected. As such, the storage, security and retrieval of the data are extremely important. In 2001, the TRCA contracted a consultant to develop a relational database (TRCA Envirobase) to house all of the various environmental data collected through this and other programs of the TRCA. This relational database also has the ability to link various data sets that are currently available. Updates to the relational database have been completed in subsequent years including the addition of a sediment quality and fluvial geomorphology component.
Additional customization of the TRCA’s database structure along with data entry is on-going. Changes to the corporate IT/Network structure in the near future will enable more effective sharing and use of the relational database by staff. In 2005-06, a review of the existing database and data requirements specific to the Source Protection Planning (SPP) process was undertaken. Based on this review, the following specific actions have been initiated and/or completed:
• Identify the data input/output routine and developed the data input/output template;
• Update the database model with the addition of data requirements,
• Upload new water quality data from various sources (i.e., MOE, City of Toronto, private laboratories),
• QA/QC check and data update, including identification of duplicate records,
• Development and design of a new database model to integrate the datasets; and,
• Design of a user-friendly interface application to allow staff to query the data quickly.
TRCA has developed an internal GIS system based on the ARC GIS platform to access the information in Envirobase as well as the other datasets. This system has been populated with layers for such features as (but not limited to):
• High resolution aerial photography,
• Watercourses,
• Land use,
• Transportation network,
• TRCA property,
• Topography,
• Physiography,
• Surficial Geology,
• Hydrology,
• Wetlands,
• Aquatic habitat and species data; and,
• Terrestrial Natural Heritage data.
Source protection funding from the MOE has permitted the TRCA to expand its GIS capabilities, and begin migration to the ARCHYDRO platform. This platform has added capabilities to incorporate hydrologic information and calculations into the GIS environment.

Approved January 18, 2012A-37
Appendix A: Data Sources and Analysis
a1.4 MeTHoDs of analysis
The Assessment Report includes a description of the local watershed area that was developed by compiling all the available information about the area. It will include topics such as watershed features, the water quality, the wells and intakes that draw drinking water, and the natural and human-made influences. Maps were produced to provide a visualization of the watershed. This information-gathering process will be iterative and continuous and will occur wherever possible to enhance the available data.
The watershed features include topography, physiography, geology, hydrology (surface water flow system) and hydrogeology (groundwater flow system), ecology, naturally vegetated areas, and climate. This information provides the background necessary for a more in-depth analysis in subsequent phases of the Assessment Report, including the Water Budget and Stress Assessment, the Vulnerability Analysis, and the Summary of Threats and Issues.
The water quality conditions and long-term trends in the watershed were identified. Maps and graphics are used to illustrate these trends. The objective was to describe the quality of surface water and groundwater using existing information and to determine whether the water quality is improving, deteriorating, or remaining constant.
The current water use was inventoried, as were historical takings, to illustrate where most of the water is going and at what times during the year. The inventory estimated population growth in the watershed area, which has a significant impact on future water demands.
The SPA also identified land-use activities that are known to pose a threat to the quality or quantity of drinking water to determine human and ecological impacts.
A Watershed Characterization Report has been prepared for the Source Protection Areas (Toronto and Region Conservation Authority, March, 2007). Workshops involving the Conservation Authority and municipal partners were held in late 2006 and early 2007 to review the contents of earlier versions of these reports. The most recent versions include edits and updates that are the result of the comments provided. The province has established a panel to review the Watershed Characterization Reports. Comments from this review panel were received on January 8, 2008, and were incorporated into the final Assessment Report.
a1.5 surfaCe WaTer QualiTy DaTa analysis anD rePorTing
The analysis and reporting of surface water quality data were accomplished in three steps:
• Exploratory analysis,
• Statistical analysis; and,
• Reporting results.
a1.5.1 exploratory analysis
The first step involves plotting water quality observations to visually examine the attributes of the data (e.g., outliers and data entry errors). Each water quality observation is represented as a single point or dot. The y-axis (the dependent axis) is the concentration of a water quality parameter, and the x-axis (the independent axis) is time, usually represented as months or years. Specifically, a plot of water quality results against time allows for the
• Observation of seasonal and annual trends,
• Identification of anomalous results and potential errors,

Approved January 18, 2012 A-38
Approved Assessment Report: Toronto and Region Source Protection Area
• Comparison of results to water quality criteria (e.g., Provincial Water Quality Objectives, Canadian Water Quality Guidelines),
• Observation of changes in water quality over time,
• Identification of missing periods of record (data gaps); and,
• Identification of biases introduced by the timing of water quality measurements.
a1.5.2 statistical analysis
The second step in the analysis of surface water quality data involves the selection and application of statistical tests to establish the significance of differences, trends, and relationships that were identified in the exploration of the data.
a1.5.3 reporting results
The third step involves the use of graphics such as maps and boxplots to present selected results in a format consistent with the information needs and technical knowledge of the target audience. Results that are selected for reporting should describe the prevailing surface water quality conditions in the watershed.
a1.6 grounDWaTer QualiTy DaTa analysis anD rePorTing
a1.6.1 Data Compilation
Groundwater quality data may be available from a wide variety of sources, including
• The Provincial Groundwater Monitoring Network (PGMN),
• Private well sampling,
• Municipal water sampling programs;,
• Health departments; and,
• Other groundwater studies.
a1.6.2 Data analysis
The assemblage and integration of information that will provide an understanding of groundwater quality on watershed basis can be performed a number of ways, including
> The assemblage of GIS layers,
> The construction of binary plots,
> The construction of maps and cross sections,
> The construction of vertical and horizontal iso-chemical contour maps,
> The construction of groundwater quality diagrams (e.g., Durov, Piper, Stiff, rose),
> The construction of chemical concentration versus time plots,
> The preparation of tables that compare water quality concentrations to water quality criteria (e.g., Ontario Drinking Water Standards, Provincial Water Quality Standards), and
> The use of statistical methods.
Approved January 18, 2012A-39
Appendix A: Data Sources and Analysis
Parameters that exceed the standard can be highlighted, as some parameters naturally exceed water quality standards. Naturally elevated parameters can be present due to the geological materials in the area, the recharge environment, or other factors.
a1.6.3 analysis of Trends at each Monitoring Well
Time versus concentration plots can help determine whether levels of water quality are changing. Time-concentration plots are generated from water quality data for one parameter, usually in one monitoring well, with time across the x-axis, and the concentration for that parameter along the y-axis. Statistical trend analysis packages (e.g., packages built into Excel) can be used to determine if there is a trend.
Alternatively, the data can be visually interpreted to determine whether there is a trend. Trends usually occur over a longer term, though there may be a blip or short-term spike in concentration indicating a short-term event, such as a spill or controlled release into the environment. Trends can also occur seasonally or cyclically. Seasonal or cyclic trends occur where water quality fluctuates through seasons or through wet or dry years.
Where water quality impairments have been identified in a watershed (i.e., concerns, known contamination), the parameters typical for those impairments can also be evaluated through time-concentration plots to determine whether the trends are increasing or decreasing. Trend analysis can provide an indication of contamination, changes in groundwater recharge, a connection to surface water, or general changes within an aquifer. Significant increasing or decreasing trends should be identified in the individual monitoring wells. By doing this, we can identify areas where water quality is influenced by surface activities, including precipitation, and therefore may be more vulnerable to surface activities.
a1.6.4 aquifer Characterization
Groundwater quality data was also analyzed on a watershed basis to look for larger-scale trends in water quality. Monitoring wells from similar aquifer units can be grouped to determine the typical maximum, minimum, and average water quality ranges for the aquifer units. Where little information is available to determine whether monitoring wells are in the same aquifer, water quality data can be compared through piper diagrams, stiff diagrams, rose diagrams, and other geochemistry tools to determine whether water samples are of a similar nature, and potentially of similar origin.
a1.7 liMiTaTions: DaTa, assuMPTions, anD MeTHoDs
Database management that relates to the structure or approach were developed for each of the CA partners and the CTC Watershed Region to manage data. Currently, a three-database system is being considered within the overall database management system. This system includes
• Internal relational databases that house aquatic ecosystem and stream survey information conducted by CLOSPA,
• The CAMC-YPDT (Conservation Authority Moraine Coalition–York Peel Durham Toronto Oak Ridges Moraine groundwater study) database that includes subsurface information (e.g., boreholes, wells, water levels, chemistry); and,
• The contaminant inventory database, to be provided by the province.
Data that are undergoing refinement have been identified for source protection planning purposes and are summarized in Table a-12 and Table a-13.

Approved January 18, 2012 A-40
Approved Assessment Report: Toronto and Region Source Protection Area
Table a-12: Data gaps
ComponentData Set Name or
SourceData Problem Comment
GIS DatabaseTRCA/external data sources
Requires updateInternal GIS data, grids, shape file reorganization. Metadata track-ing system to be developed.
Rating Tables within Hydrologic Database
TRCA - Engineering de-partment hydraulic data
Requires update Updated for WSC sites annually.
Integrated Hydro-logic Database
TRCA’s hydrologic data Requires update
Data currently exists in various formats. Need to develop a consis-tent format and relational database to maintain data relating to climate, rating curves, water levels, streamflow, spot baseflow, and water quality measurements.
York-Peel-Durham-Toronto (YPDT) Hydrogeologic Database
Various data sources Requires updateNot all monitoring locations or data entered—continually being updated with various data sets. Database management required. Multi-user access to be applied over a networked environment.
Table a-13: Knowledge gaps
Continued groundwater level and chemistry monitoring and analysis involving both PGMN wells and municipal partner monitoring wells (where data are provided).
Low-flow streamflow surveys (quality and quantity) to characterize discharge zones and associated water quality. These surveys are also useful to delineate zones that may be impacted by human activities.
Overland and streamflow travel time studies to be able to address possible spills response protocol and actions.
Enhance the continuous streamflow gauge network and update data regarding discharge to streams.
Update and verify outdated or missing water use data including Permit to Take Water (PTTW) information.
Development of acceptable water use targets to protect both the resource and the aquatic ecosystem.
Need for additional water quality monitoring sites.
Need for additional climatic sites/data monitoring.
Development of the ESRI ArcHydro data model.
Overland and streamflow travel time studies to be able to address possible spills response protocol and actions.
a1.7.1 filling Data gaps
Future watershed planning work will aim to develop and refine the overall database management system using the following methods:
• Preparing and refining land classification maps,
• Monitoring and analyzing groundwater level and chemistry involving both PGMN wells and municipal partner monitoring wells,
• Reviewing low-flow streamflow surveys (quality and quantity) to characterize discharge zones and associated water quality and to delineate zones that may be impacted by human activities,
• Reviewing overland and streamflow travel time studies to be able to address possible spills response protocol and actions,

Approved January 18, 2012A-41
Appendix A: Data Sources and Analysis
• Enhancing the continuous streamflow gauge network and updating data regarding discharge to streams,
• Enhancing the coverage of climate data,
• Updating and verifying outdated or missing water using data including Permit to Take Water (PTTW) information; and,
• Preparing a contaminant source database and associated risk to drinking water provided by each potential source.
Priority gaps that need to be addressed as part of ongoing watershed planning initiatives include:
• Further development and promotion of the existing Clean Water Stewardship Program and Rural Clean Water Program, which supports well upgrades and abandonment, nutrient management best management practices, and land restoration initiatives on private lands—all efforts that help remove potential pathways for contaminants,
• Need for additional water quality monitoring sites,
• Need for additional streamflow monitoring and climatic sites,
• Development of the ESRI ArcHydro data model; and,
• Further estimates of water surplus (Thornthwaite methodology).
a1.7.2 Method limitations
Knowledge gaps relate to analysis and tool development to estimate and/or refine the water quality and quantity estimates and understand how the surface and groundwater flow systems operate. These tools enable us to predict the impact of potential future changes, such as increased municipal supply from groundwater due to climate change.
Priority knowledge gaps that need to be addressed include:
• Refinement of aquifer characterization and flow system understanding, including the orientation of bedrock valley systems and significant area recharge and discharge mapping,
• Development of surface water modelling capabilities,
• Refinement of a three-dimensional groundwater flow modelling tool,
• Refinement of the interaction of the surface water and groundwater flow models;
• Development of acceptable water use targets to protect both the resource and the aquatic ecosystem; and,
• Development of methodology and tools to provide spills response analysis that will involve all pathways, including overland flow, stream travel, and groundwater flow, including the unsaturated zone transport

Approved January 18, 2012
Table of ConTenTsWaTershed CharaCTerizaTion
b1 MeThodoloGY and GaPs ..................................................................................... b1-1
B1.1 Background ............................................................................................................................................. B1-1 B1.2 Quality Assurance/Quality Control ...................................................................................................... B1-1 B1.2.1 Document Preparation ........................................................................................................................ B1-1 B1.2.2 Internal Review .................................................................................................................................... B1-2 B1.2.3 External Review ................................................................................................................................... B1-2 B1.3 Knowledge and Data Gaps ..................................................................................................................... B1-2 B1.3.1 The Physical Description .................................................................................................................... B1-2 B1.3.2 Hydrology ............................................................................................................................................. B1-3 B1.3.3 Water Quantity (Water Use) ............................................................................................................... B1-4 B1.3.4 Water Quality ....................................................................................................................................... B1-4 B1.3.5 Naturally Vegetated Areas .................................................................................................................. B1-5 B1.3.6 Aquatic Ecology ................................................................................................................................... B1-6 B1.3.7 Human Characterization ..................................................................................................................... B1-6
b2 sUrfaCe WaTer QUaliTY doCUMenTaTion ........................................................ b2-1
b3 GroUndWaTer QUaliTY doCUMenTaTion .......................................................... b3-1
b4 MUniCiPal WaTer QUaliTY doCUMenTaTion ..................................................... b4-1
lisT of Tables
Table B-1: Summary of Watershed Characterization Data Gaps .............................................................................7
TOC-1
Approved Assessment Report: Toronto and Region Source Protection Area

Approved January 18, 2012B1-1
Appendix B: Watershed Characterization
b1 MeThodoloGY and GaPs
b1.1 baCKGroUnd
This Appendix includes the methodology for the preparation of the Watershed Characterization portion of the Assessment Report. It includes quality assurance and quality control procedures that were adhered to as well as knowledge or data gaps that were identified.
The data and mapping in the Watershed Characterization Report were the result of compilations of existing watershed information available to TRCA as of late 2009. The data sources are described in detail in Appendix A of the Assessment Report. The work was heavily dependent on the technical work and reporting for watershed plans completed under the Oak Ridges Moraine Conservation Plan. TRCA minimized duplication of efforts by seconding key technical staff on an as-needed basis from the watershed planning tasks to the source water protection effort. Key areas of overlap included:
•NaturalHeritage,
•LandUse,
•Physiographyandtopography,
•Hydrologyandhydrogeology;and,
•Surface water and groundwater quality.
The main goal of TRCA’s source water protection staff was to take the outputs of watershed plans in these key areas and make the data and mapping as consistent as possible across the entire TRCA jurisdiction. This was a significantchallengebecausemostdatacollection,mapping,andanalysishadbeenconductedonawatershedbasis,andsignificantedgemappingissueswereidentified.ThemapsandanalysisincludedintheWatershedCharacterizationReportrepresentTRCA’sbesteffortstodateonmaintainingconsistent,geo-referenceddataacross both political and watershed boundaries.
The data gaps identified in this appendix were identified by TRCA staff as they reviewed and summarized theavailableinformationonTRCA’swatersheds.ThiswasthefirsteffortofitskindforTRCA,intermsofbreadth of disciplines and the geographic areas covered. TRCA recognizes that the data gaps described in this appendix will that filling these gaps will not necessarily be filled through the Source Protection Program. Rather,itisexpectedthatmostwillbeaddressedovertimethroughongoingoperationsattheConservationAuthority,withthesupportofourmunicipalpartners.Asnewinformationiscollected,itwillbesavedforincorporation into future source protection documentation.
b1.2 QUaliTY assUranCe/QUaliTY ConTrol
b1.2.1 document Preparation
The first step in quality assurance involves collecting reliable data. The TRCA uses qualified field staff that has been trained in the use of the sophisticated field instruments now available such as real-time chemistry analysers and electro-magnetic flow meters. Our field staff follows provincially accepted protocols such as the Hinton Low Flow measurement protocol and Ontario Stream Assessment Protocol.
Weemployqualifiedprofessionalplanners,engineers,andscientiststoreviewandanalysethefielddata.Expertconsultantsandprovincialagencyexperts(i.e.,MinistryofNaturalResources)forspecializedfunctionssuchasremotesensingandmodellingsupplementthisstaff.Inaddition,federal(i.e.,GeologicalSurveyofCanada)andprovincial(i.e.,OntarioGeologicalSurvey)expertshavebeenconsultedinthepreparation of geologic layers and mapping.
The spatial data have been reviewed along with the associated metadata by TRCA’s GIS staff to ensure that the information provided is represented accurately on the individual maps.

Approved January 18, 2012 B1-2
Approved Assessment Report: Toronto and Region Source Protection Area
b1.2.2 internal review
TRCAtechnicalstaff,aspartofourregionalmonitoringprogramandwatershedplanningprocesses,hasreviewedthepertinentdatasetsusedinthepreparationofthisreport.Inaddition,supervisorshavereviewedthis document to ensure data from other projects have been properly incorporated. Senior staff has reviewed the report for logic and consistency.
b1.2.3 external review
The final step in TRCA’s QA/QC process is external review by both the public and our partners. The draft versionofthisreportwasissuedtomunicipalstaffforreview,andatwodayworkshopwasconductedinSeptember 2006 to facilitate receipt of review comments. This report includes revisions to the draft report suggested by both the internal and external review teams.
b1.3 KnoWledGe and daTa GaPs
Significant efforts have been made by all levels of government and the TRCA to collect and interpret environmentaldataforourwatersheds.However,inthedevelopmentofthisreport,dataandknowledgegapswith respect to watershed characterization have been identified. A key task for the TRCA and the Source waterProtectionCommittee(SPC),whenformed,willbetofillthesegapsforinclusionintheAssessmentReport. It is important that these gaps be identified now so that the required information can be obtained in a timelymanner,andissuanceoftheAssessmentReportwillnotbedelayed.
b1.3.1 The Physical description
data Gaps
TheTRCAnowhasextensivegeologicdatasetsfromtheYPDTinitiative.However,therearenewwaterwellsthat have been entered into the WWIS database that have not yet been incorporated into the YPDT dataset. These will be added as they become available.
Knowledge Gaps
Our knowledge of the subsurface will always be imperfect. Given that it is not practical to install deep wells to fullypenetratetheoverburdenmaterialsinaregulargridacrosstheTRCA’sjurisdiction,othermethodssuchas seismic surveys and gravity surveys are required to better define the complex geologic layering across thislargearea.TheYPDTinitiativehasbegunworkinthisimportantarea,butonlylimitedareashavebeencoveredtodate(i.e.,Caledon).
Approved January 18, 2012B1-3
Appendix B: Watershed Characterization
b1.3.2 hydrology
data Gaps
Longtermbaseflowdata,withmultipleyearsofdatasetswithinawatershedareessentialinthedevelopmentof defensible water budgets. The existing baseline data have significant temporal and spatial gaps. Data sets fromotherpartners(i.e.,GSCdatafrom1996/1997intheRougeRiver),maybeusefulincontributingtoshorttermimpactassessmentandourunderstandingofthewatersheds,butareinadequatefordeterminingthelong-term effects associated with groundwater/surface water interactions.
A further fifteen stream gauges have been identified for installation throughout the TRCA jurisdiction to obtain the necessary data required to refine and expand our existing hydrologic datasets and models. Municipal stormwaterinformationincludingdetails,suchassewershedmappingandCSOoutfall/crossconnectionlocations,shouldbeincludedwithinGISlayersforfullinterpretationofflowsandwaterquality.
The PGMN currently comprises 22 wells in TRCA’s nine watersheds. Although there is not a scientific formulatodeducetheoptimalnumberofwells,witheighthydrogeologiclayersandthreeregionalaquifersystemsinthegroundwatermodel,theexistingnetworkisclearlyinsufficienttoassessgroundwaterflowpathsandtrends.Evenhavingonewellperlayerperwatershedwouldrequireover70wells,whichwouldrequire tripling of the size of the network. The actual number of wells required and their locations will be dependent on detailed analysis of the existing data and review of potential existing wells.
PGMNdatacanbesupplementedbygroundwatersamplingconductedbytheRegionalMunicipalitiesofPeel,York,andDurham,butintegrationofthosedatasetsintoTRCA’sdatabasesisongoing.
Knowledge Gaps
Asstatedabove,ourknowledgeofsubsurfaceconditionswillalwaysbeimperfectandlimited,sinceitisnotpossible to view either the soil or rock strata or the water that flows through them. The intent of the York-Peel-Durham-Torontogroundwatermanagementstudyistocombineavarietyofmethodsofinvestigation(i.e.,highqualityboreholes,surfaceanddownholegeophysics)withrigorousscientificinterpretationbyqualifiedgeoscientists. This work is supported by the participating regional municipalities and will serve to improve our hydrogeologic understanding in this complex hydrogeologic regime.
The TRCA needs a continuous surface water budget model for each watershed that is consistent with neighbouring watersheds. Additional parameters and functions should be added to the existing hydrologic models,includingGIScapabilitiesandauser-friendlygraphicalinterface.Thewaterbudgetanalyses,combined with hydrologic modelling should also be applied to advance the understanding of the basin response and the emerging trends within each of the nine watersheds. Modelling of the municipal stormwater system and linking of the surface water model with the three dimensional groundwater flow model will be necessary to fully understand conditions within the watersheds.
AConservationOntarioinitiativetodevelopaprotocolforinstreamflowrequirementsisurgentlyneeded,andisakeyknowledgegap.TRCAiscurrentlymanagingbaseflowconsiderationsusingavailableinformation,whichisnotextensive,particularlyintheheadwaterareas.Acomprehensive,province-wideprotocol/methodology for determining minimum instream flows is necessary to protect baseflows and the dependent ecosystems.

Approved January 18, 2012 B1-4
Approved Assessment Report: Toronto and Region Source Protection Area
b1.3.3 Water Quantity (Water Use)
data Gaps
Historically,actualwithdrawalsbyindividualusershavenotoftenbeenmonitoredonceapermithasbeenissued.Withtheexceptionofmajormunicipalwells,loggingofwithdrawalratesandtimeperiodsarenotgenerallypubliclyavailable,wheremonitored.Inthepast,usershaveusuallyrequestedpermitsformorethantheywillrequire,asaprecautionagainstpotentialpermitviolations.Thereforeestimatesofwaterusagebasedon the PTTW database typically overestimate withdrawals by a significant margin.
TheMOEhasrecentlyrevisedtheirPTTWrequirements,andnowrequiresmonitoringofallwithdrawalactivities,andreportingofthedataonanannualbasis.Oncethisinformationbeginstoaccumulate,itwillprovidewithdrawaldetailssimilartotheinformationcompiledthroughthewaterusesurveys.Inaddition,thiswillgenerateinformationregardingtherealistictiming/durationofindividualwithdrawals,whichiscurrentlyunknown.
The TRCA is also expecting data from the municipal partners with respect to the locations and pumping rates of surface water intakes and the pumping rates over time for the municipal wells.
b1.3.4 Water Quality
data Gaps
Waterqualitysamplinghaslargelybeenbasedongrabsamplesatpresettimes,whichresultsinadiversityofflowconditionsbeingsampled,butarenotnecessarilyrepresentativeofwetordryweatherconditions.Inourjurisdiction,likemost,waterqualityissignificantlyinfluencedbywetweatherconditionsandtoofeweffortshavebeenmadetodocumenttherangeofwaterqualityoccurringunderwetweather,andforwhatduration.Thecurrent3-yearMOELakeOntarioTributaryPriorityPollutantMonitoringProgram,initiatedin2003,willhelp to provide some data for all but the Duffins and Carruthers Creek watersheds.
Microbialdata,particularlyforE.coliislimited.Thisparameterisnotcollectedandanalysedbysomepartners. A laboratory methodology issue has been identified by TRCA staff that further reduces available E. coli data in the Regional Monitoring Database.
Surface water quality data at some stations is missing from the mid-1990s to the early 2000s due to changes to and/or discontinuation of monitoring programs. There is also a need to integrate water quality data from municipal partners into TRCA’s database.
Sampling of the wells in the provincial groundwater monitoring network did not commence until late 2003. Therefore,thereisasignificantlackofhistoricaldata.Thisgapcanbeaddressedbyincorporatingdatafromourmunicipalpartners(i.e.,RegionsofPeelandYork)andlargerstakeholders(i.e.,OntarioRealtyCorporation)anddataminingfromtheMOE(i.e.,landfillreports),anddevelopmentreportsheldinTRCA’sarchives.Workhasbegunonalloftheseinitiatives,andwillcontinuethroughtheremainderof2006.Thiswillensure that there is good geospatial data behind the maps that are produced.
Data on organic compounds are limited to a few stations. Not all organic compounds of concern for drinking waterareanalyzedandthesourcesofsomecontaminants(e.g.,E.coli)arenotwellunderstood.Thehealthriskofcertainchemicals(e.g.,pharmaceuticalproducts)foundattraceconcentrationsindrinkingwaterisnotyet well understood. Monitoring of these ‘exotic’ chemicals in the TRCA jurisdiction is also very limited. In general,programsthatmonitorbacteriologicalvariablesinsurfacewaterneedtobeexpandedandrevisedtoimprove the overall level of confidence in the data collected.

Approved January 18, 2012B1-5
Appendix B: Watershed Characterization
SpillsofvaryingquantityandtoxicityarerelativelyfrequentintheTRCA’sjurisdiction,giventhenumberofcommercial/industriallanduses,andtheextensiveroadnetwork.Thenature,sourceandlocationofthesespills needs to be better characterized. There also needs to be a detailed evaluation that the potential threat spills of different types may pose to drinking water and watershed ecosystem health more generally.
Formanagementpurposes,theTRCAneedstobetterunderstandtherelativeimportanceofdifferentenvironmentalcompartments(atmosphericdeposition,soils,streamsediments,surfacewater,andgroundwater)towaterpollution(e.g.,nitrate,mercury).Wealsorequiremunicipalstormwaterinformation,suchassewershedmappingandcombinedseweroutfall/crossconnectionlocations.Basedonthedata,modelling of the municipal stormwater system is also required.
Knowledge Gaps
Overall,TRCA’sexistingsurfacewatermonitoringnetworkisadequatebutitneedstobeadjustedorfocused to provide the means to assess the links from potential sources of impact via pathways to sensitive receptors.AdditionalanalysisofadditionaldatasetsisneededbeyondthetraditionalPWQMN,CityofToronto and TRCA processes.
There is a strong need to re-evaluate the current “spatial” network of (partner) water quality sites with respect to source protection planning to determine if the geographic coverage or scale is appropriate.
b1.3.5 naturally Vegetated areas
Terrestrial systems provide evidence for the relationships between surface water and groundwater. Vegetationcommunitiescanidentifylocalareasofgroundwaterrechargeanddischarge,whichcanbeused to flag vulnerable areas. Site specific vegetation community identification is not complete across our entire jurisdiction to provide support to the baseflow and groundwater analyses. TRCA annually inventories approximately1000haofnaturalareastocontributetothisknowledge,buttherateofinventoryprogressis not sufficient to identify all natural areas and their significance for water management in time for the Assessment Report.
data Gaps
The data for riparian cover are not complete for the entire jurisdiction and some is out of date. There is a need to update this information for all the watersheds in the jurisdiction in a consistent fashion with the most current data.
Inadditiontotheremotelysensedlandscapeleveldataitisimportanttohavesitelevel,EcologicalLandClassification (ELC) to vegetation type and species to confirm the vegetation and thus habitat characteristics. Currently about 50% of the natural areas have been field inventoried.
There is a need to establish a sampling regime that will detect changes in naturally vegetated areas over time thatincludesparametersthatwillassistindeterminingtheirresponsestomatrixinfluences,climatechange,recreational uses etc.
Knowledge Gaps
It has always been intuitive that higher quality terrestrial habitat provides a higher function in terms of its sourcewaterprotectionbenefits(naturalhydrologiccycle,waterquality/quantity).Theresearchinthisfieldis minimal and a much better understanding of these relationships is required.

Approved January 18, 2012 B1-6
Approved Assessment Report: Toronto and Region Source Protection Area
b1.3.6 aquatic ecology
data Gaps
Historicalspeciessamplingdataisrequiredforseveralwatersheds(Duffins,Humber,CarruthersandPetticoat) to help establish baseline aquatic conditions. Additional fisheries collections for non-sampled stream reaches across the TRCA jurisdiction are required to establish a complete record of the fish communities currently present. Mussel species and habitat should be identified across the TRCA jurisdiction. Continuous temperaturedataareneededforallwatercourseswithinseveralwatersheds(Humber,CarruthersandEtobicoke).
Knowledge Gaps
A watercourse temperature classification and analysis system is required for continuous water temperature datathatnotonlyenhancesfishhabitatidentification,butcanalsospeaktothermalimpactstostreamhabitatbecauseofcurrentdevelopmentpractices,e.g.,stormwatermanagementpondsandchangesinimperviousness.
TRCA needs detailed life history information for many fish species and their related sensitivities to various waterqualityandquantityparameters.Inaddition,integrationoffishandaquaticspeciesinformationwithwaterquality,hydrology,sourcewater,andlandcoverdataarerequiredtopredictfuturedevelopmentimpacts.
Species-level benthic invertebrate statistical analysis is required to help quantify change over time at the regional scale as well as direct management at the site or reach level. Little information on the impacts of specific aquatic invasive species on the riverine aquatic ecosystem is currently available. Such data would assist in the prioritization of mitigation programs. A strategic monitoring program is needed to determine baseflowrequirementsofbrooktrout,animportantindicatorspeciesofecosystemhealth.
b1.3.7 human Characterization
data Gaps
The human characterization data gaps include municipal and private communal wastewater treatment facilities andoutfalllocationsfromtheMOE,currentandhistoricaggregateextractionsitesfromtheMNR,andbrownfieldlocationsfromtheMOE,seeTable b-1.
Knowledge Gaps
Land Use Mapping has been assembled from various watershed plans from various municipal partners in different years. The TRCA needs to review the map product for land use and ensure that the data are current and that the land use categories are consistent. The only other significant knowledge gap associated with human characterization is an analysis of the potential chemical and microbiological impacts from commercial and industrial land uses and wastewater treatment facilities.

Approved January 18, 2012B1-7
Appendix B: Watershed Characterization
Table b-1: summary of Watershed Characterization data Gaps
Watershed Characterization
DeliverableData Set Name Data Gap Problem Comment
The Physical Descrip-tion
YPDT New wells which are not incor-porated into WWIS database
Ongoing data management.
Hydrology
Hydrological Data Sets Need consistent baseline dataset across TRCA jurisdic-tion, specifically in ungauged reaches/watersheds
The existing baseline data has significant gaps and previ-ous dataset available from other sources (i.e.: GSC data from 1996/1997 in the Rouge River) are useful for assess-ing the acute impacts of human activities (withdrawals, new dams, dewatering etc.) but are inadequate for deter-mining the long term effects associated with geology.
Stream gauges Further 15 gauges recom-mended
Locations yet to be determined.
PGMN Wells Current 22 wells inadequate to assess flow paths and trends
TRCA staff working with municipal partners and others to find new monitoring wells for inclusion into the network.
Water Quantity
PTTW Actual Withdraw-als Data
Reported usage of Phase I & II water takings
Some data available for the Tier 3 study; more expected as the database matures.
Water Level Monitoring by Regional Partners
There are wide areas with gaps or lack of historical data for interpretation.
Tier 3 study underway. Ongoing PGMN monitoring will help.
Flowing Wells Need to identify existing flowing wells.
Target areas for education, restoration and improve-ments.
Consistent Water Budget Analysis
Comprehensive water budget analyses are required for all nine watersheds within the TRCA
Additional parameters and functions should be added to the existing water budget models including GIS capabili-ties and a user-friendly graphical interface. The water budget analyses, combined with hydrologic modelling should also be applied to advance the understanding of the basin response and the emerging trends within each of the nine watersheds. Modelling of the municipal stormwater system may be necessary to fully understand conditions within the watersheds.
Envirobase Requires further development and enhancement.
ESRI ArcHydro data model has been identified as accept-able tool.
Sewershed and outfall mapping
Municipal GIS layers of sewersheds and CSO outfall/cross connection data currently unavailable
Municipal stormwater information including details such as sewershed mapping and CSO outfall / cross connec-tion locations should be included within GIS layers for full interpretation of flows and water quality.

Approved January 18, 2012 B1-8
Approved Assessment Report: Toronto and Region Source Protection Area
Watershed Characterization
DeliverableData Set Name Data Gap Problem Comment
Water Quality
Wet Weather Water Quality
Limited datasets available Need more “wet weather” surface water quality data.
Microbial Data (specifi-cally E. coli)
Laboratory testing issues re-duced utility of existing data
This parameter is not collected or analysed by some partners.
Surface Water Quality Data (mid 1990’s – 2000)
Gaps in record Changes and / or discontinuation of monitoring programs created data gap for this time period
Municipal Groundwa-ter Quality Data
Need to integrate water quality data from municipal partners into TRCA database
Ongoing data management issue.
PGMN Water Quality Limited historic data Quality sampling did not begin until recently (2003). Po-tential for significant MOE regional office data.- landfills
Organic Compounds Data limited to small number of stations
Programs which monitor bacteriological variable and “ex-otic” chemicals need to be expanded.
Spills Information Limited data regarding the na-ture, source and location of spills
Naturally Vegetated Areas
Riparian Cover Updates required for jurisdic-tional coverage
Ecological Land Clas-sification (ELC)
Currently approximately 50% of natural areas are inventoried
Sampling Regime Development / enhancement of sampling methods
Current sampling does not provide a strong indication or direct evidence of the many influences urbanization is having on vegetation communities and local flora and fauna. Monitoring needs to expand to fill these informa-tion gaps.
Aquatic Ecology
Baseline Historic Spe-cies Sampling
Limited historic data in the Duffins, Humber, Carruthers and Petticoat watersheds.
TRCA does not have complete jurisdictional coverage, gaps exist in unsampled watercourses.
Identification of Mussel Species
To coincide with presence / absence and abundance surveys
Continuous Tempera-ture Data
Required for all watercourses in select watersheds (Humber, Carruthers and Etobicoke)
Human Characteriza-tion
Municipal and Private Treatment Facilities and Outfalls
Mapping and/or GIS layers required from MOE
Land Use Mapping Map requires verification to ensure consistent date (i.e., 2002) for mapping across TRCA’s jurisdiction
Mapping has been assembled from watershed plans in different years. Need to examine SOLRIS data for suit-ability.
Current and Historic Aggregate Extraction Locations
Mapping and/or GIS layers required from MNR
Brownfield Locations Mapping and/or GIS layers required from MOE

Approved January 18, 2012B2-1
Appendix B: Watershed Characterization
b2 sUrfaCe WaTer QUaliTY doCUMenTaTion
The attached report was prepared by TRCA staff and documents the surface water quality across the TRSPA based on output from the Regional Monitoring Program. This sampling program is funded by the Province of Ontario,TRCA’sregionalmunicipalities,andtheCityofToronto.
Source Water Protection: Surface Water Quality Update
November 2009
Watershed Monitoring and Reporting Section Ecology Division

Approved January 18, 2012 B2-2
Approved Assessment Report: Toronto and Region Source Protection Area
Report prepared by: Angela Wallace, Watershed Monitoring and Reporting Section, Ecology Division
Reviewed by: Scott Jarvie, Manager Watershed Monitoring and Reporting, Ecology Division Tim VanSeters, Manager Sustainable Technologies Section, Ecology Division Don Ford, Manager Geoenvironmental, Ecology Division Deborah Martin-Downs, Director, Ecology Division
This report may be referenced as: Toronto and Region Conservation Authority (TRCA). 2009. Source Water Protection: Surface Water Quality Update. 53 pp.

Approved January 18, 2012B2-3
Appendix B: Watershed Characterization
i
Table of Contents
Page
1. Introduction......................................................................................................... 1 1.1 Data Sources ................................................................................................................1 1.2 Indicator Variables ........................................................................................................3
2. Data Analysis ...................................................................................................... 5 2.1 Current Conditions .......................................................................................................6
2.1.1 Total Suspended Solids ................................................................................................. 7 2.1.2 Chloride .......................................................................................................................... 8 2.1.3 Total Phosphorus ......................................................................................................... 10 2.1.4 Nitrogen Compounds................................................................................................... 12 2.1.5 E. coli ............................................................................................................................ 16 2.1.6 Copper.......................................................................................................................... 17 2.1.7 Iron................................................................................................................................ 19 2.1.8 Nickel ............................................................................................................................ 20 2.1.9 Zinc ............................................................................................................................... 21 2.1.10 Pesticides ..................................................................................................................... 22
2.2 Trends.........................................................................................................................24 2.2.1 By Parameter ................................................................................................................ 24 2.2.2 By Watershed Mouths .................................................................................................. 28
3. Summary ........................................................................................................... 34
4. References ........................................................................................................ 37 List of Figures Figure 1: Current PWQMN/RWMP Water Quality Monitoring Station Locations......................................... 2 Figure 2. Example box plot graphic ......................................................................................................... 5 Figure 3. TSS concentrations (mg/L) across the TRCA jurisdiction (2003-2007) .................................... 7 Figure 4. Median TSS concentrations (2003-2007) in relation to urban land cover ................................ 8 Figure 5. Chloride concentrations (mg/L) across the TRCA jurisdiction (2003-2007) ........................... 10 Figure 6. Median chloride concentrations (2003-2007) in relation to urban land cover ........................ 10 Figure 7. Phosphorus concentrations (mg/L) across the TRCA jurisdiction (2003-2007) ..................... 11 Figure 8. Median total phosphorus concentrations (2003-2007) in relation to urban land cover.......... 12 Figure 9. Nitrate concentrations (mg/L) across the TRCA jurisdiction (2003-2007) .............................. 13 Figure 10. Median nitrate concentrations (2003-2007) in relation to urban land cover ........................... 13 Figure 11. Nitrite concentrations (mg/L) across the TRCA jurisdiction (2003-2007)................................ 14 Figure 12. Median nitrite concentrations (2003-2007) in relation to urban land cover ............................ 14 Figure 13. Unionized ammonia concentrations (mg/L) across the TRCA jurisdiction (2003-2007)......... 15 Figure 14. Median unionized ammonia concentrations (2003-2007) in relation to urban land
cover ........................................................................................................................................ 15 Figure 15. E. coli concentrations (mg/L) across the TRCA jurisdiction (2003-2007) ............................... 17 Figure 16. Median E. coli counts (2003-2007) in relation to urban land cover ........................................ 17 Figure 17. Copper concentrations (μg/L) across the TRCA jurisdiction (2003-2007).............................. 18 Figure 18. Median copper concentrations (2003-2007) in relation to urban land cover.......................... 19

Approved January 18, 2012 B2-4
Approved Assessment Report: Toronto and Region Source Protection Area
Table o f Contents
ii
Figure 19. Iron concentrations (μg/L) across the TRCA jurisdiction (2003-2007).................................... 19 Figure 20. Median iron concentrations (2003-2007) in relation to urban land cover............................... 20 Figure 21. Nickel concentrations (μg/L) in the TRCA jurisdiction (2003-2007) ........................................ 21 Figure 22. Zinc concentrations (μg/L) across the TRCA jurisdiction (2003-2007) ................................... 22 Figure 23. Median zinc concentrations (2003-2007) in relation to urban land cover............................... 22 Figure 24. Chloride concentrations (mg/L) over time............................................................................... 26 Figure 25. Total phosphorus concentrations (mg/L) over time............................................................... 26 Figure 26. Total suspended solids (TSS) concentration (mg/L) over time .............................................. 28 Figure 27. Total suspended solids (TSS) concentrations for the mouths of the Humber River
(83019), Don River (85014), Highland Creek (94002), and Duffins Creek (104001) over time.................................................................................................................................. 29
Figure 28. Median total suspended solids (TSS) trend over time at the mouths of the Humber River, Don River, Highland Creek, and Duffins Creek............................................................. 29
Figure 29. Chloride concentrations for the mouth of the Humber River, Don River, Highland Creek, Rouge River and Duffins Creek over time.................................................................... 30
Figure 30. Median chloride trends over time at the mouths of the Humber River (83019), Don River (85014), Highland Creek (94002), Rouge River (97011), and Duffins Creek (104011) .................................................................................................................................. 31
Figure 31. Total phosphorus concentrations for the mouth of the Humber River (83019), Don River (85014), Highland Creek (94002), Rouge River (97011) and Duffins Creek (104001) over time................................................................................................................... 32
Figure 32. Median total phosphorus trends over time at the mouths of the Humber River, Don River, Highland Creek, Rouge River, and Duffins Creek......................................................... 33
List of Tables Table 1. Standard suite of water quality parameters analyzed for stream samples ............................... 3 Table 2. Significance, sources and guidelines for key surface water parameters.................................. 4 Table 3. Chloride trend analyses over time........................................................................................... 25 Table 4. Total phosphorus trend analyses over time............................................................................ 27 Table 5. Total suspended solids (TSS) trend analyses over time......................................................... 27 Table 6. Mann-Kendall and regression statistics for TSS trend analysis.............................................. 29 Table 7. Mann-Kendall and regression statistics for chloride trend analysis based on median
values at 5-year intervals ......................................................................................................... 31 Table 8. Mann-Kendall and regression statistics for total phosphorus trend analysis based on
median values at 5-year intervals ............................................................................................ 33 Appendices A. Surface Water Quality Site Descriptions

Approved January 18, 2012B2-5
Appendix B: Watershed Characterization
SS uu rr ff aa cc ee WW aa tt ee rr QQ uu aa ll ii tt yy UU pp dd aa tt eeNovember 2009
1
1. Introduction
This report provides a summary of the surface water quality across TRCA’s jurisdiction. Both trends over time and spatial variations in water quality are described. Where applicable, water quality results are compared to numerical objectives (e.g. Provincial Water Quality Objectives) to determine if surface water quality within the jurisdiction is meeting these targets. 1.1 Data Sources
Provincial Water Quality Monitoring Network/Regional Watershed Monitoring Program The Ontario Ministry of the Environment (OMOE) Provincial Water Quality Monitoring Network (PWQMN) was started in 1964 to collect surface water quality information from rivers and streams at strategic locations throughout Ontario. Over time, stations were added and discontinued in response to changing OMOE and program-specific needs (OMOE 2003). Previously, the OMOE monitored water quality throughout the Toronto region but the PWQMN program was substantially scaled back due to funding issues in the 1990s. Only two stations continued to operate in the Toronto region (06008501402 at the mouth of the Don River, 06008301902 at the mouth of the Humber River). In 2002, TRCA began sampling 11 additional stations as part of the PWQMN, for a total of 13 PWQMN stations in the Toronto Region. The 11 stations are sampled eight times per year on a monthly basis during the ice-free period. Up until the end of 2008, the other two PWQMN stations were sampled by OMOE staff on a minimum bi-weekly basis (and often more frequently), year round. A standard set of water quality indicators (Table 1) is monitored at each PWQMN station, including chloride, nutrients, suspended solids, trace metals and other general chemistry parameters. Disease-causing substances, pesticides and other contaminants are monitored in detailed water quality surveys in priority watersheds. In addition to the PWQMN stations, TRCA collects water quality samples as part of the Regional Watershed Monitoring Program (RWMP). The RWMP is a comprehensive ecological monitoring program which monitors aquatic habitat and fish community, terrestrial habitats, communities and species, surface water quality and quantity, fluvial geomorphology, groundwater quality and quantity and West Nile virus mosquito vector monitoring. Since 2002, TRCA has partnered with the City of Toronto to monitor 23 additional surface water quality stations for a total of 36 stations (PWQMN+RWMP) in the TRCA’s region (Figure 1). Station location information is provided in Appendix A. The number of stations in each watershed is proportional to the size of the watershed. These sites are sampled for the same standard set of water quality indicators used by the PWQMN (Table 1). In 2004, the TRCA increased its water quality sampling frequency to be year round. This includes sampling the nine PWQMN stations during the four months not covered under the agreement with the OMOE. The RWMP also collects E. coli samples from all sites (both RWMP and PWQMN) year round which are analyzed by a private laboratory.

Approved January 18, 2012 B2-6
Approved Assessment Report: Toronto and Region Source Protection Area
SSuu
rr ffaa
ccee
WWaa
tt eerr
QQuu
aall ii
tt yyUU
ppdd
aatt ee
No
vem
ber
200
9
SSuu
rr ffaa
ccee
WWaa
tt eerr
QQuu
aall ii
tt yyUU
ppdd
aatt ee
2
No
vem
ber
200
9
Fig
ure
1: C
urre
nt P
WQ
MN
/RW
MP
Wat
er Q
ualit
y M
oni
tori
ng S
tatio
n Lo
catio
ns
Fig
ure
1: C
urre
nt P
WQ
MN
/RW
MP
Wat
er Q
ualit
y M
oni
tori
ng S
tatio
n Lo
catio
ns
2

Approved January 18, 2012B2-7
Appendix B: Watershed Characterization
SS uu rr ff aa cc ee WW aa tt ee rr QQ uu aa ll ii tt yy UU pp dd aa tt eeNovember 2009
3
In the spring of 2009, two water quality stations were added to the RWMP in the Petticoat Creek and Frenchman’s Bay watersheds. Due to laboratory upgrades at the City of Toronto, RWMP samples are currently (April 2009 onwards) being sent to York-Durham Environmental laboratory during the interim.
Table 1. Standard suite of water quality parameters analyzed for stream samples
Temperature, Water Biochemical Oxygen Demand
Solids, Suspended
Solids, Dissolved
Conductivity Hardness Magnesium Dissolved Oxygen
Sodium Calcium Chloride Potassium
General Chemistry
Alkalinity Turbidity pH
Microbiological Escherichia coli
Aluminum Barium Beryllium Cadmium Chromium Cobalt Copper Iron Lead Manganese Molybdenum Nickel
Metals
Strontium Titanium Vanadium Zinc Nitrogen, Total Kjeldahl
Phosphorus, Total Phosphate Ammonia Nutrients
Nitrate Nitrite Note: Additional parameters may be analyzed on a site/project specific basis
Pesticide Data Pesticide data is not collected as part of TRCA’s routine water quality monitoring (i.e. RWMP). The report Occurrence of Lawn Care and Agricultural Pesticides in the Don and Humber River Watersheds (1998-2002) (EC et al. 2008b) summarizes results from several sites in the Don and Humber River watersheds during both baseflow and rainfall events from 1998 through 2002. 1.2 Indicator Variables
Surface water quality parameters were selected for analysis based on their relevance to common water use concerns. Table 2 outlines the indicator parameters, its sources as well as the effects on the aquatic environment, and the applicable water quality guidelines for comparison.

Approved January 18, 2012 B2-8
Approved Assessment Report: Toronto and Region Source Protection Area
SS uu rr ff aa cc ee WW aa tt ee rr QQ uu aa ll ii tt yy UU pp dd aa tt eeNovember 2009
4
Table 2. Significance, sources and guidelines for key surface water parameters
Parameter Significance Sources (examples) Guideline
Total Suspended Solids (TSS)
TSS represents the amount of particulate matter (e.g. silt, clay, organic and inorganic matter, etc) suspended in water. TSS can act as a transport vector for contaminants (e.g. metals). Elevated concentrations of TSS can affect aquatic organisms such as fish by reducing water clarity which can inhibit the ability of aquatic organisms to find food. TSS can cause clogging and abrasion of fish gills. TSS can cause habitat changes such as smothering fish spawning and nursery areas.
• Construction sites • Farm fields • Lawns and gardens • Eroding stream
channels • Grit accumulation on
roads
CWQG1: 30 mg/L (background + 25 mg/L)
Total Phosphorus
At elevated concentrations, phosphorus can have unfavourable effects on receiving waters such as eutrophication (enrichment of a waterbody with nutrients). Phosphorus stimulates plant and algae productivity and biomass. Past a certain point, this can cause reduced biodiversity, changes in the dominant biota, decreases in ecologically sensitive species, increases in tolerant species, anoxia, and increases in toxins (e.g. cyanobacteria).
• Fertilizers • Animal wastes • Sanitary sewage
Interim PWQO2: 0.03 mg/L
Nitrogen Compounds
Nitrogen compounds (nitrate, nitrite, unionized ammonia) are nutrients with sources and effects similar to phosphorus. Nitrite and unionized ammonia can be potentially toxic to aquatic organisms. The toxicity of unionized ammonia is dependent on pH and water temperature.
• Industrial discharge • Septic tanks • Agricultural runoff • Urban runoff • Fertilizers • Landfill leachate
CWQG1: 2.93 mg/L for nitrate PWQO: 0.02 mg/L for unionized ammonia
Chloride Chloride can be toxic to aquatic organisms with acute effects at high concentrations and chronic effects at lower concentrations.
• Road salt application • Fertilizers • Wastewater treatment • Industrial discharge
BC MOE3: 150 mg/L
Escherichia coli (E. coli)
E. coli are a large and diverse group of bacteria that are commonly found in the intestines of warm-blooded animals. E. coli are used to indicate the presence of fecal waste in water. Some strains of E. coli can cause human illness (e.g. diarrhea, urinary tract infections).
• Illegal sewer connections
• Combined sewer overflows (CSO)
• Inputs from wildlife, livestock and domestic animals
• Organic fertilizers
PWQO: 100 CFU/100 mL
Metals
Several heavy metals are toxic to fish and other aquatic organisms at varying concentrations. Most metals enter waterways though surface runoff. Metals bind to sediment and can affect fish (e.g. clogging of gills) and benthic invertebrates (e.g. habitat changes, smothering food sources).
• Urban runoff • Industrial discharge • Sewage treatment • Pesticides • Fertilizers • Atmospheric
deposition
PWQO: • Copper – 5
μg/L (interim) • Iron – 300
μg/L • Nickel – 25
μg/L • Zinc – 20 μg/L
(interim)
Pesticides
Pesticides consist of various compounds used to control unwanted pests such as weeds and insects. The most obvious effect of pesticides on fish and other wildlife is acute poisoning. Certain pesticides can affect the reproductive potential of certain fish and wildlife. Pesticides can cause health effects in humans such as reproductive effects and cancer.
• Insecticides • Herbicides • Fungicides
CWQG/PWQO: • MCPP – 4
μg/L • Diazinon –
0.08 μg/L • 2,4-D – 4 μg/L
1CWQG = Canadian Water Quality Guideline 2PWQO = Provincial Water Quality Objective 3BC MOE = British Columbia Ministry of the Environment

Approved January 18, 2012B2-9
Appendix B: Watershed Characterization
SS uu rr ff aa cc ee WW aa tt ee rr QQ uu aa ll ii tt yy UU pp dd aa tt eeNovember 2009
5
2. Data Analysis Statistical analysis was completed using JMP 8.0 (SAS Institute, Carrey, North Carolina). When results were below the laboratory detection limit (trace amounts), these values were set conservatively at the laboratory detection for analysis purposes. The OMOE (2003) recommends that for statistical summaries of routine monitoring data a minimum sample size of 30 or greater. Sampling results are presented in box plots (e.g. Figure 2) which summarize the distribution of samples for each site. The ends of the box are the 25th and 75th quartiles. The difference between the quartiles is the interquartile range. The line across the middle of the box identifies the median sample value. “Whiskers” extend from the ends of the box to the outermost data point which is not considered an outlier (upper quartile+1.5*(interquartile range), lower quartile-1.5*(interquartile range)). Sampling stations are arranged along the x-axis by watershed (west to east) from headwaters to outlet.
7.8
8
8.2
8.4
8.6
Objective
Con
cent
ratio
n (u
nits
)
80002 80004 80006
Station
75th quantile
Water quality objective (e.g. PWQO)
median 25th quantile
“whisker”
Figure 2. Example box plot graphic
Surface water quality results were compared to the Provincial Water Quality Objectives (PWQO; OMOEE 1994). The PWQO are a set of numerical and narrative criteria which serve as chemical and physical indicators representing a satisfactory level for surface waters which is protective of all forms of aquatic life and all aspects of the aquatic life cycles during indefinite exposure to the water. There are also some PWQO which are set for the protection of recreational water uses based on public health and aesthetic considerations. When PWQO were not available, other objectives such as the Canadian Council of Ministers of the Environment (CCME) Canadian Water Quality Guidelines for the Protection of Aquatic (CWQG; CCME 2007) were used. The relationships between median surface water quality results and urban (urban + urbanizing) land cover were also examined using regression analysis. The percentages of rural, urbanizing and urban land cover in the upstream catchment were determined using a Geographic Information System (GIS). Urban land cover was based on 2002 orthoimagery, urbanizing land cover was based on various regional Official Plans (2002-2004) and rural land cover was the remaining areas.

Approved January 18, 2012 B2-10
Approved Assessment Report: Toronto and Region Source Protection Area
SS uu rr ff aa cc ee WW aa tt ee rr QQ uu aa ll ii tt yy UU pp dd aa tt eeNovember 2009
6
For sites where historical data were available, analysis was completed using Mann-Kendal non-parametric test to determine if temporal trends were significant. The Mann-Kendall test is a non-parametric test for identifying trends in time series data. The test compares the relative magnitude of sample data rather than the data values themselves (Gilbert, 1987). The data values are evaluated as an ordered time series. Each value is compared to each subsequent data values. The initial value of the Mann-Kendall statistic, S, is assumed to be zero (e.g., no trend). If a value from a later time period is higher than a value from an earlier time period, S is incremented by one. On the other hand, if the value from a later time period is lower than a value sampled earlier, S is decremented by one. The net result of all such increments and decrements yields the final value of S. For example, a very high positive value of S is an indicator of an increasing trend, and a very low negative value indicates a decreasing trend. Because of the wide range of water quality values (i.e. includes baseflow, low flow and storm events), a significance level (α) of 0.1 was used to determine if temporal trends were significant. The alpha level (α, or significance level) indicates the odds that the observed result is due to chance. If a test of significance gives a p-value lower than the α-level, the null hypothesis (i.e. no difference between what is being tested) is rejected. For example, if the p-value for a Mann-Kendall test is 0.07, the p-value is less than the significance level (α=0.1), and the result is statistically significant. 2.1 Current Conditions
With the exception of the pesticide data, surface water quality results are for the 5-year period from 2003-2007. The pesticide data is for 1998-2002. Results are presented using RWMP station names which are often a derivative of the (current/historic) 11-digit OMOE PWQMN name. For example, PWQMN station 06008000202 is presented as station 80002. Stations which do not have corresponding PWQMN names have text names rather than numeric codes. Summary maps are presented in Appendix B. It is important to note that samples were collected on varying field dates, under a variety of weather conditions, and analyzed at several laboratories. Water quality samples collected as part of the PWQMN/RWMP are collected independent of weather conditions. Monthly water quality data should represent the range of water quality conditions that affect the aquatic system (e.g. streamflow conditions including snowmelt, runoff from rain events of varying magnitude and baseflow conditions during varying seasons). By proportion, low flow conditions predominate the samples, therefore, by using five years of monthly water quality data, median values should represent ambient water quality conditions. Since specific wet-weather events are not targeted, contaminant concentrations presented in this report may be significantly lower than what would be measured during a storm event. Urban runoff can contain high concentrations of contaminants (e.g. sediments, nutrients, road salts, heavy metals, petroleum products, bacteria) which are washed off impervious surfaces such as roads and parking lots. Agricultural runoff can also contain high levels of contaminants such a sediment, pesticides, nutrients and bacteria. In addition, winter water quality samples were not collected in 2003, collected periodically from 2004-2005 and collected monthly from 2006-2007. Therefore, interpretation of water quality results presented in this report should consider the above noted limitations regarding the frequency and timing of sample collections.
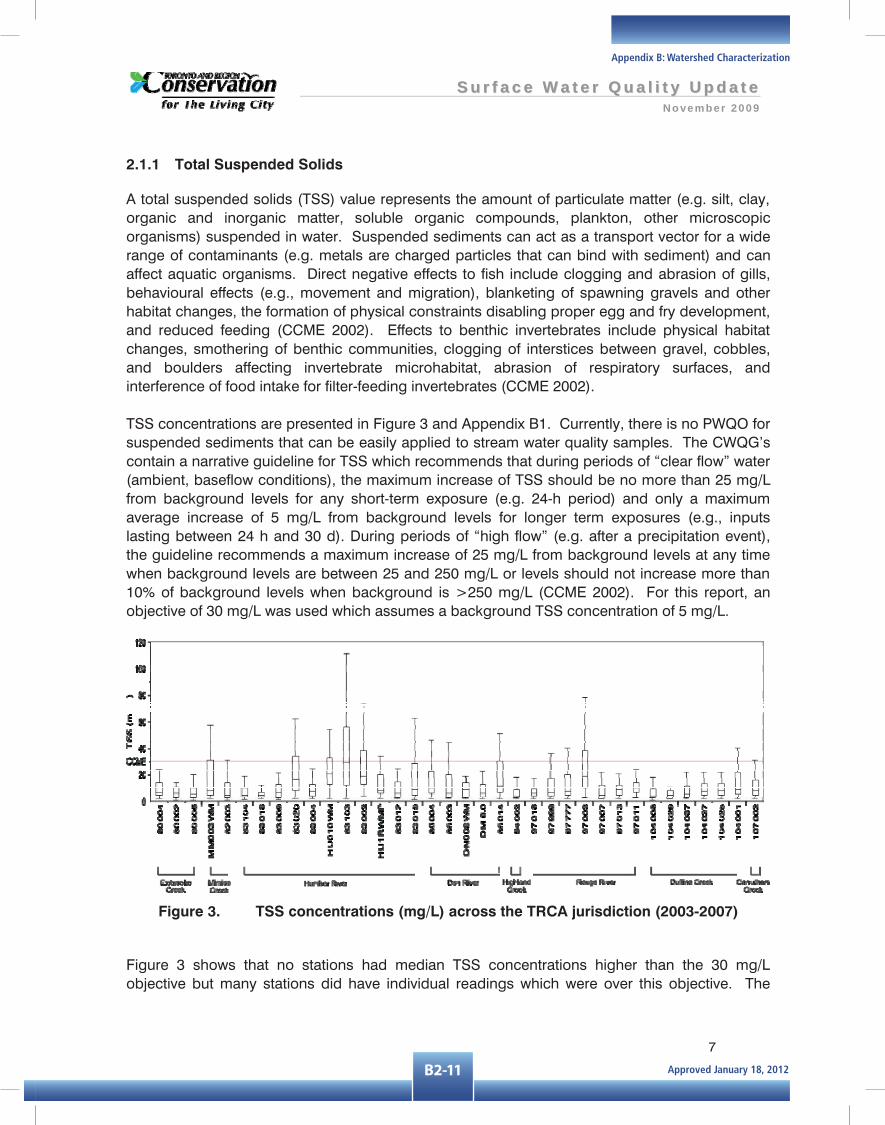
Approved January 18, 2012B2-11
Appendix B: Watershed Characterization
SS uu rr ff aa cc ee WW aa tt ee rr QQ uu aa ll ii tt yy UU pp dd aa tt eeNovember 2009
7
2.1.1 Total Suspended Solids
A total suspended solids (TSS) value represents the amount of particulate matter (e.g. silt, clay, organic and inorganic matter, soluble organic compounds, plankton, other microscopic organisms) suspended in water. Suspended sediments can act as a transport vector for a wide range of contaminants (e.g. metals are charged particles that can bind with sediment) and can affect aquatic organisms. Direct negative effects to fish include clogging and abrasion of gills, behavioural effects (e.g., movement and migration), blanketing of spawning gravels and other habitat changes, the formation of physical constraints disabling proper egg and fry development, and reduced feeding (CCME 2002). Effects to benthic invertebrates include physical habitat changes, smothering of benthic communities, clogging of interstices between gravel, cobbles, and boulders affecting invertebrate microhabitat, abrasion of respiratory surfaces, and interference of food intake for filter-feeding invertebrates (CCME 2002). TSS concentrations are presented in Figure 3 and Appendix B1. Currently, there is no PWQO for suspended sediments that can be easily applied to stream water quality samples. The CWQG’s contain a narrative guideline for TSS which recommends that during periods of “clear flow” water (ambient, baseflow conditions), the maximum increase of TSS should be no more than 25 mg/L from background levels for any short-term exposure (e.g. 24-h period) and only a maximum average increase of 5 mg/L from background levels for longer term exposures (e.g., inputs lasting between 24 h and 30 d). During periods of “high flow” (e.g. after a precipitation event), the guideline recommends a maximum increase of 25 mg/L from background levels at any time when background levels are between 25 and 250 mg/L or levels should not increase more than 10% of background levels when background is >250 mg/L (CCME 2002). For this report, an objective of 30 mg/L was used which assumes a background TSS concentration of 5 mg/L.
Figure 3. TSS concentrations (mg/L) across the TRCA jurisdiction (2003-2007)
Figure 3 shows that no stations had median TSS concentrations higher than the 30 mg/L objective but many stations did have individual readings which were over this objective. The

Approved January 18, 2012 B2-12
Approved Assessment Report: Toronto and Region Source Protection Area
SS uu rr ff aa cc ee WW aa tt ee rr QQ uu aa ll ii tt yy UU pp dd aa tt eeNovember 2009
8
highest median TSS concentrations were in the Humber and Rouge River watersheds. Stations 83103, HU010WM, 83002, 83020 are located in the mid-reaches of the Humber River watershed near or just north of Highway 7. This area underwent (and continues to undergo) large scale development (change from agricultural to urban) which may have contributed to the sediment in the streams. Station 97003 is located in the Little Rouge subwatershed. Sources of suspended sediment in at this station may include agriculture, in-stream erosion, and development (e.g. Town of Stouffville). The predominance of highly erodible soils at these stations may also influence TSS concentrations. There was no significant relationship between TSS and urban land cover (F=0.14, p=0.71) as shown in Figure 4. Finkenbine et al. (2000) found that the age of urban land use may influence sediment loads (e.g. sediment loads may decline in streams draining older urban areas).
0
5
10
15
20
25
30
0 10 20 30 40 50 60 70 80 90 100
Med
ian TSS Co
ncen
tration (m
g/L)
% Urban Land Cover
Note: % Urban land cover = urban + urbanizing land use
Figure 4. Median TSS concentrations (2003-2007) in relation to urban land cover
2.1.2 Chloride
Chloride can be toxic to aquatic organisms with acute affects at high concentrations and chronic effects (e.g. growth, reproduction) at lower concentrations (OMOE 2003). Chloride in our waterways is due to the use of road salts which are mainly used as de-icing and anti-icing agents during winter road maintenance. The predominant chloride salt used as a de-icer in North America is sodium chloride, which is composed of about 40% sodium and 60% chloride by weight. Trace elements, including trace metals, may represent up to 5% of the total salt weight. Additional sources of chloride include waterwater treatment, industry discharge and fertilizers (OMOE 2003). Natural background concentrations of chloride in water are generally no more than a few milligrams per litre, with some local or regional instances of higher natural salinity (EC & HC 2001). Chloride is a highly soluble and mobile ion that does not volatilize or easily precipitate or adsorb onto surfaces of particulates. Road salts enter the environment through runoff/melt-water, losses at salt storage and snow disposal sites, or from the release of salts stored in surface soils. There are no major removal mechanisms, such as volatilization, degradation (photodegradation,

Approved January 18, 2012B2-13
Appendix B: Watershed Characterization
SS uu rr ff aa cc ee WW aa tt ee rr QQ uu aa ll ii tt yy UU pp dd aa tt eeNovember 2009
9
biodegradation), sorption (to particulates) or oxidation, that would remove the salts from surface waters. Because chloride ions are persistent and are entrained in the hydrological cycle, all chloride ions applied to roadways as road salts and/or released from storage yards or snow disposal sites can be expected to be ultimately found in surface water. Presently, there is no Provincial or Canadian water quality guideline for chloride. A comprehensive five-year scientific assessment by Environment Canada and Health Canada (EC & HC 2001) determined that in sufficient concentrations, road salts pose a risk to plants, animals and the aquatic environment. The report noted that an estimated 5% of aquatic species would be affected (median lethal concentration) at chloride concentrations of about 210 mg/L, and 10% of species would be affected at chloride concentrations of about 240 mg/L. It also noted that changes in populations or community structure can occur at lower concentrations. The British Columbia Ministry of the Environment (BC MOE) has a chloride guideline which states that the average concentration of chloride (mg/L as NaCl) should not exceed 150 mg/L (based on an arithmetic mean computed from five samples collected over a 30-day period) to protect freshwater aquatic life from acute and lethal effects, the maximum concentration of chloride (mg/L as NaCl) at any time should not exceed 600 mg/L (BC MOE 2003). The 150 mg/L value includes a safety factor of five because chronic effects data in the literature are limited and the 600 mg/L acute value includes a safety factor of two because of the relative strength of the data set. Nationally, water quality is summarized as part of the Canadian Environmental Sustainability Indicators (CESI) report series (e.g. EC et al. 2008) produced by the Government of Canada (Environment Canada, Statistics Canada, Health Canada). The CESI report authors have interpreted the aforementioned studies and used an objective of 150 mg/L to protect aquatic life (EC 2005). An objective concentration of 150 mg/L was used for this report. Chloride concentrations for the 5-year period of 2003-2007 are presented in Figure 5 and Appendix B2. Only limited winter sampling was conducted for this period. There is also limited data on small order streams which have low dilution potential due to their limited volume. Keeping these data limitations in mind, the chloride concentrations presented in Figure 5 suggest that only the Duffins Creek and Carruthers Creek watersheds are meeting the 150 mg/L chloride objective. In general, chloride concentrations are highest near the outlets of the systems and decrease toward the headwaters. Seven sites (80006, MM003WM, 82003, HU1RWMP, 83012, DM 6.0, 94002) had over 90% of the samples collected exceed the objective of 150 mg/L. Six sites (80006, 82003, DM 6.0, 94002, 97011, HU1RWMP) had maximum individual concentrations greater than 5000 mg/L. Of the 36 sites sampled, the 75th percentile at 11 sites (30%) was greater than the 600 mg/L upper limit suggested by the BC MOE. This includes two sites (82003: mouth of Mimico Creek, HU1RWMP: mid-Humber River) which had median concentrations above the suggested 600 mg/L upper limit. Six sites (83018, 83009, 97018, 104008, 104029, 104025) had maximum concentrations below 150 mg/L. These stations are located in the upper reaches of the Humber River, Rouge River and Duffins Creek.
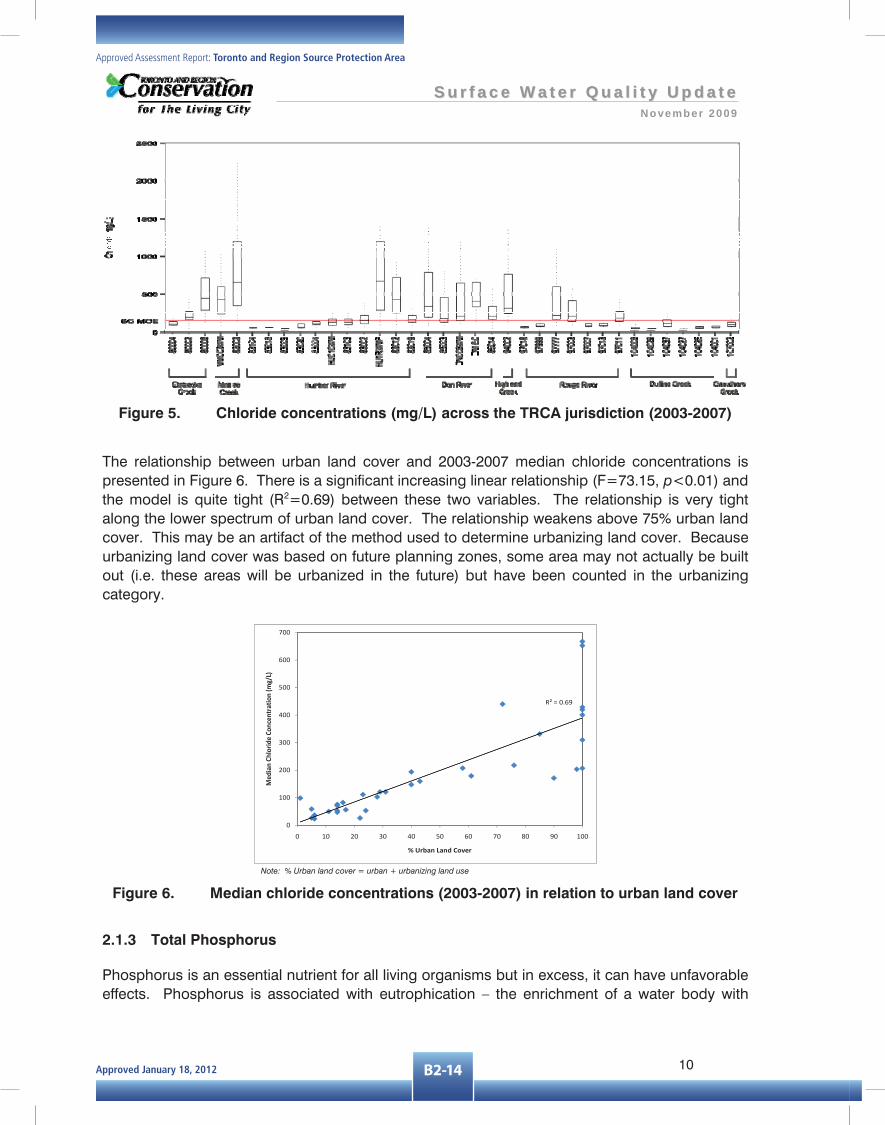
Approved January 18, 2012 B2-14
Approved Assessment Report: Toronto and Region Source Protection Area
SS uu rr ff aa cc ee WW aa tt ee rr QQ uu aa ll ii tt yy UU pp dd aa tt eeNovember 2009
10
Figure 5. Chloride concentrations (mg/L) across the TRCA jurisdiction (2003-2007)
The relationship between urban land cover and 2003-2007 median chloride concentrations is presented in Figure 6. There is a significant increasing linear relationship (F=73.15, p<0.01) and the model is quite tight (R2=0.69) between these two variables. The relationship is very tight along the lower spectrum of urban land cover. The relationship weakens above 75% urban land cover. This may be an artifact of the method used to determine urbanizing land cover. Because urbanizing land cover was based on future planning zones, some area may not actually be built out (i.e. these areas will be urbanized in the future) but have been counted in the urbanizing category.
R² = 0.69
0
100
200
300
400
500
600
700
0 10 20 30 40 50 60 70 80 90 100
Med
ian Ch
lorid
e Co
ncen
tration (m
g/L)
% Urban Land Cover
Note: % Urban land cover = urban + urbanizing land use
Figure 6. Median chloride concentrations (2003-2007) in relation to urban land cover
2.1.3 Total Phosphorus
Phosphorus is an essential nutrient for all living organisms but in excess, it can have unfavorable effects. Phosphorus is associated with eutrophication – the enrichment of a water body with
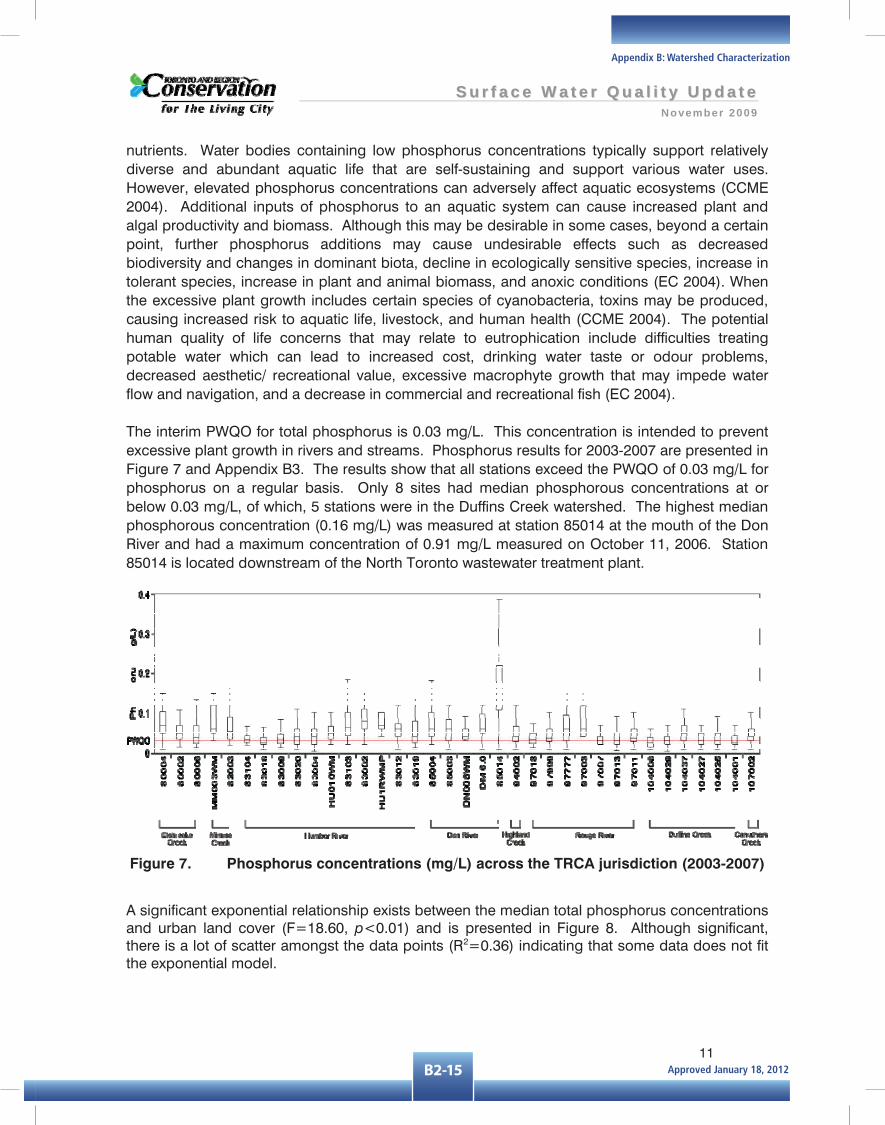
Approved January 18, 2012B2-15
Appendix B: Watershed Characterization
SS uu rr ff aa cc ee WW aa tt ee rr QQ uu aa ll ii tt yy UU pp dd aa tt eeNovember 2009
11
nutrients. Water bodies containing low phosphorus concentrations typically support relatively diverse and abundant aquatic life that are self-sustaining and support various water uses. However, elevated phosphorus concentrations can adversely affect aquatic ecosystems (CCME 2004). Additional inputs of phosphorus to an aquatic system can cause increased plant and algal productivity and biomass. Although this may be desirable in some cases, beyond a certain point, further phosphorus additions may cause undesirable effects such as decreased biodiversity and changes in dominant biota, decline in ecologically sensitive species, increase in tolerant species, increase in plant and animal biomass, and anoxic conditions (EC 2004). When the excessive plant growth includes certain species of cyanobacteria, toxins may be produced, causing increased risk to aquatic life, livestock, and human health (CCME 2004). The potential human quality of life concerns that may relate to eutrophication include difficulties treating potable water which can lead to increased cost, drinking water taste or odour problems, decreased aesthetic/ recreational value, excessive macrophyte growth that may impede water flow and navigation, and a decrease in commercial and recreational fish (EC 2004). The interim PWQO for total phosphorus is 0.03 mg/L. This concentration is intended to prevent excessive plant growth in rivers and streams. Phosphorus results for 2003-2007 are presented in Figure 7 and Appendix B3. The results show that all stations exceed the PWQO of 0.03 mg/L for phosphorus on a regular basis. Only 8 sites had median phosphorous concentrations at or below 0.03 mg/L, of which, 5 stations were in the Duffins Creek watershed. The highest median phosphorous concentration (0.16 mg/L) was measured at station 85014 at the mouth of the Don River and had a maximum concentration of 0.91 mg/L measured on October 11, 2006. Station 85014 is located downstream of the North Toronto wastewater treatment plant.
Figure 7. Phosphorus concentrations (mg/L) across the TRCA jurisdiction (2003-2007)
A significant exponential relationship exists between the median total phosphorus concentrations and urban land cover (F=18.60, p<0.01) and is presented in Figure 8. Although significant, there is a lot of scatter amongst the data points (R2=0.36) indicating that some data does not fit the exponential model.

Approved January 18, 2012 B2-16
Approved Assessment Report: Toronto and Region Source Protection Area
SS uu rr ff aa cc ee WW aa tt ee rr QQ uu aa ll ii tt yy UU pp dd aa tt eeNovember 2009
12
R² = 0.36
0
0.02
0.04
0.06
0.08
0.1
0.12
0.14
0.16
0 10 20 30 40 50 60 70 80 90 100
Med
ian To
tal Pho
spho
rus Co
ncen
tration (µg/L)
% Urban Land Cover
Note: % Urban land cover = urban + urbanizing land use
Figure 8. Median total phosphorus concentrations (2003-2007) in relation to urban land cover
2.1.4 Nitrogen Compounds
In the majority of water bodies, phosphorus is normally the limiting nutrient for algal growth but nitrogen compounds can also play a role in the eutrophication process. Three nitrogen compounds are analyzed as part of the PWQMN/RWMP: nitrate (NO3), nitrite (NO2) and total ammonia (NH3 + NH4
+). Anthropogenic discharges of nitrogen can include municipal and industrial wastewaters, septic tanks, agricultural runoff, feedlot discharges, urban runoff, lawn fertilizers, landfill leachate, nitric oxide and nitrogen dioxide from vehicular exhaust, and storm sewer overflow (CCME 2003). Natural sources of ammonia include the decomposition or breakdown of organic waste matter, gas exchange with the atmosphere, forest fires, animal waste, human breath, the discharge of ammonia by biota, and nitrogen fixation processes (CCME 2003). Nitrate serves as the primary source of nitrogen for aquatic plants in well oxygenated systems, and as nitrate levels increase, there is an increasing risk of algal blooms and eutrophication in surface waters. Nitrite and unionized ammonia can be toxic to fish and other aquatic organisms at relatively low concentrations. Nitrate results are presented in Figure 9 and Appendix B4. CESI (EC et al. 2008) interpreted the interim CWQG for nitrate as 2.93 mg/L (EC 2005). All stations had median water quality values below the 2.93 mg/L objective. Several sites had individual sampling points which were above the objective. In particular, Station DM 6.0 at the outlet of Taylor-Massey Creek in the Don River watershed had the highest median nitrate value at 2.34 mg/L followed by station 104037 in Mitchell’s Creek (Duffins Creek watershed) with a median value of 2.06 mg/L. The reason for the high nitrate levels at DM 6.0 are unclear but Station 104037 is located less than 1 km downstream from John Evelyns Golf Club which may be influencing the nitrate concentrations at this station. Some of the nitrate values may be exaggerated as samples analyzed at the City of Toronto laboratory with nitrate concentrations greater than 1 mg/L were determined to be elevated in comparison to other laboratories when split sampling results were compared (TRCA, unpublished data).
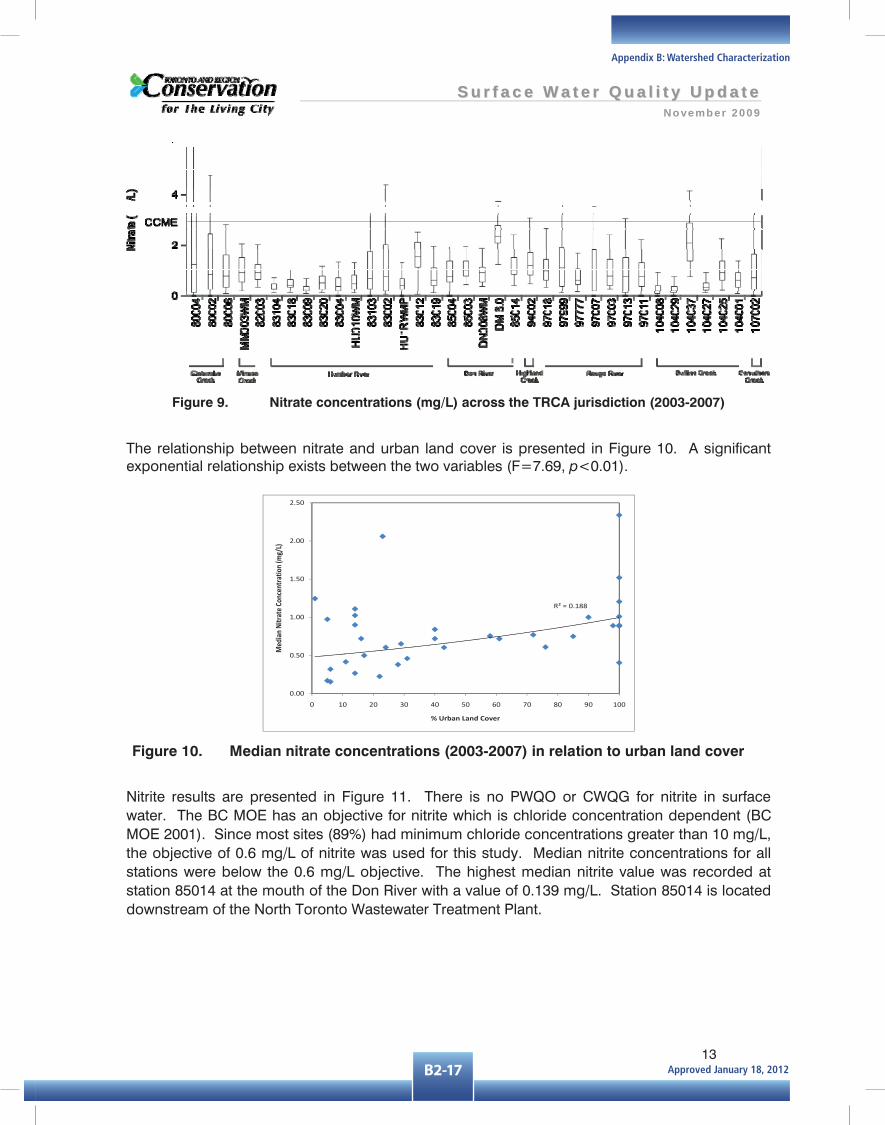
Approved January 18, 2012B2-17
Appendix B: Watershed Characterization
SS uu rr ff aa cc ee WW aa tt ee rr QQ uu aa ll ii tt yy UU pp dd aa tt eeNovember 2009
13
Figure 9. Nitrate concentrations (mg/L) across the TRCA jurisdiction (2003-2007)
The relationship between nitrate and urban land cover is presented in Figure 10. A significant exponential relationship exists between the two variables (F=7.69, p<0.01).
R² = 0.188
0.00
0.50
1.00
1.50
2.00
2.50
0 10 20 30 40 50 60 70 80 90 100
Med
ian Nitrate Co
ncen
tration (m
g/L)
% Urban Land Cover
Figure 10. Median nitrate concentrations (2003-2007) in relation to urban land cover
Nitrite results are presented in Figure 11. There is no PWQO or CWQG for nitrite in surface water. The BC MOE has an objective for nitrite which is chloride concentration dependent (BC MOE 2001). Since most sites (89%) had minimum chloride concentrations greater than 10 mg/L, the objective of 0.6 mg/L of nitrite was used for this study. Median nitrite concentrations for all stations were below the 0.6 mg/L objective. The highest median nitrite value was recorded at station 85014 at the mouth of the Don River with a value of 0.139 mg/L. Station 85014 is located downstream of the North Toronto Wastewater Treatment Plant.

Approved January 18, 2012 B2-18
Approved Assessment Report: Toronto and Region Source Protection Area
SS uu rr ff aa cc ee WW aa tt ee rr QQ uu aa ll ii tt yy UU pp dd aa tt eeNovember 2009
14
Figure 11. Nitrite concentrations (mg/L) across the TRCA jurisdiction (2003-2007)
The relationship between nitrite and urban land cover is presented in Figure 12. A strongly significant exponential relationship exists between the two variables (F=100.78, p<0.01).
R² = 0.758
0.00
0.02
0.04
0.06
0.08
0.10
0.12
0.14
0.16
0 10 20 30 40 50 60 70 80 90 100
Med
ian Nitrite
Con
centratio
n (m
g/L)
% Urban Land Cover
Figure 12. Median nitrite concentrations (2003-2007) in relation to urban land cover
Unionized ammonia is the only nitrogen compound which has a PWQO (0.02 mg/L). Unionized ammonia concentrations are presented in Figure 13 and Appendix B6. Unionized ammonia values are calculated from total ammonia values and depend on the pH and temperature of the water. Raising pH by one unit can cause the unionized ammonia concentration to increase nearly tenfold, while a 5°C temperature increase can cause an increase of 40-50% (CCME 2000). The median and 75th percentile of unionized ammonia concentrations at almost all stations were less than the PWQO. However, one station at the mouth of the Don River (85014) had significantly higher concentrations unionized ammonia. The median unionized ammonia concentration at this station was 0.06 mg/L which exceeds the PWQO of 0.02 mg/L. Station 85014 is located approximately 1.5 km downstream from the North Toronto Wastewater Treatment Plant. Several studies have determined that concentrations greater than 0.04 mg/L (CCME 2000) can cause pathological lesions in the gills, tissue degradation in the kidneys and

Approved January 18, 2012B2-19
Appendix B: Watershed Characterization
SS uu rr ff aa cc ee WW aa tt ee rr QQ uu aa ll ii tt yy UU pp dd aa tt eeNovember 2009
15
reduction in growth and reproduction in fish. The median concentration at station 85014 exceeded 0.04 mg/L of unionized ammonia and individual sampling concentrations often exceeded more than 5 times this amount.
Figure 13. Unionized ammonia concentrations (mg/L) across the TRCA jurisdiction
(2003-2007)
The relationship between unionized ammonia and urban land cover is presented in Figure 14. The median concentration for Station 85014 located at the mouth of the Don River was removed from analysis because it was an obvious outlier. A significant exponential relationship exists between the two variables (F=18.71, p<0.01).
R² = 0.41
0
0.001
0.002
0.003
0.004
0.005
0.006
0.007
0 10 20 30 40 50 60 70 80 90 100
Med
ian Union
ized
Ammon
ia Con
centration
(mg/L)
% Urban Land Cover
Note: % Urban land cover = urban + urbanizing land use
Figure 14. Median unionized ammonia concentrations (2003-2007) in relation to urban land cover

Approved January 18, 2012 B2-20
Approved Assessment Report: Toronto and Region Source Protection Area
SS uu rr ff aa cc ee WW aa tt ee rr QQ uu aa ll ii tt yy UU pp dd aa tt eeNovember 2009
16
2.1.5 E. coli
Escherichia coli (E. coli) are a large and diverse group of bacteria that are commonly found in the intestines of warm blooded animals. Although most strains of E. coli are harmless, others can cause human illness (e.g. diarrhea, urinary tract infections, respiratory illness, pneumonia) (CDC 2008). E. coli are often used to indicate the presence of fecal wastes and other harmful bacteria in lakes and streams. Bacteria enters waterways via a variety of sources including sewer systems (e.g. combined sewer overflows), septic systems, wildlife, livestock, pets, waterfowl, and organic fertilizers. E. coli results are presented in Figure 15 and Appendix B7. Samples were collected for the entire 2003-2007 period but it was determined that laboratory error overestimated E. coli counts from July 2003 through to May 2006 and therefore these data were not included in the analysis. The PWQO for E. coli is 100 colony forming units (CFU) per 100 mL. The PWQO for E. coli is a recreational water quality guideline for swimming. It is based upon a geometric mean of at least five samples per site taken within a one month period. Only one sample was collected monthly for this program and therefore median results are presented rather than geometric means. Maximum E. coli values were capped at 20000 CFU for analysis as this was the maximum value counted by one of the laboratories. This suggests that some sites may have higher median E. coli values than what are presented in Figure 15. In general, E. coli concentrations were lowest in the headwaters and increased downstream toward the stream outlets. Median E. coli levels at 89% of the sites monitored were above the PWQO of 100 CFU/100 mL. The highest E. coli concentrations were measured in the Don River watershed and high concentrations of E. coli were also found near the mouths of the other watersheds. Samples in the Don watershed and older urbanized portions of the Humber, Etobicoke and Mimico watersheds often receive untreated stormwater and some areas also have combined sewer overflow (CSO) sewer systems. Sanitary sewage and stormwater runoff are conveyed in a single pipe. This means that during precipitation events, the pipe can exceed capacity and flow directly into the river or waterfront. Four sites (83018, 83004, 97013, 104029) had median E. coli values less than the 100 CFU/100 mL objective. With the exception of 97013, these sites were located in the upper reaches of the Humber River and Duffins Creek watersheds. Station 97013 is located at the outlet of the Little Rouge Creek subwatershed, not far upstream from the mouth of the main Rouge River.

Approved January 18, 2012B2-21
Appendix B: Watershed Characterization
SS uu rr ff aa cc ee WW aa tt ee rr QQ uu aa ll ii tt yy UU pp dd aa tt eeNovember 2009
17
Figure 15. E. coli concentrations (mg/L) across the TRCA jurisdiction (2003-2007)
The relationship between urban land cover and median E. coli counts is presented in Figure 16. A significant exponential relationship exists between the two variables (F=57.25, p<0.001). Areas with high levels of urban land cover usually have much higher counts of E. coli than areas with lower levels of urbanization.
R² = 0.63
0
500
1000
1500
2000
2500
0 10 20 30 40 50 60 70 80 90 100
Med
ian E. coli Cou
nts (CFU
/100
mL)
% Urban Landuse
Note: % Urban land cover = urban + urbanizing land use
Figure 16. Median E. coli counts (2003-2007) in relation to urban land cover
2.1.6 Copper
Copper is an essential trace element that can be toxic to aquatic biota at elevated concentrations. It enters aquatic systems through aerial deposition or surface runoff. Sources of copper include the weathering of copper minerals and numerous sources from human activities (e.g. copper pipe, metal alloys, wiring, fungicides and insecticides). Copper strongly adsorbs to particulate matter (e.g. soil particles), and tends to accumulate in sediments. Because a variety of organisms live in, or are in contact with, the stream bed, sediments act as an important route of exposure to aquatic organisms (CCME 1999a). High levels of copper in the aquatic environment are usually found in more urbanized and industrial areas (OMOE 2003).

Approved January 18, 2012 B2-22
Approved Assessment Report: Toronto and Region Source Protection Area
SS uu rr ff aa cc ee WW aa tt ee rr QQ uu aa ll ii tt yy UU pp dd aa tt eeNovember 2009
18
Copper results are presented in Figure 17 and Appendix B8. The median results for most stations are below the interim PWQO of 5 μg/L. Three stations (MM003WM, HU1RWMP, 83012) had median copper concentrations exceeding the PWQO. MM003WM is located downstream of Pearson International Airport and HU1RWMP and 83012 are located in the Black Creek subwatershed which is part of the Humber River watershed. Three stations (DN008WM, DM6.0, 85014) in the Don River watershed had median concentrations at or approaching the PWQO. The lowest median copper concentrations were recorded at station 83104 and 97018 which are located in the headwaters of the Humber River and Rouge River, respectively.
Figure 17. Copper concentrations (μg/L) across the TRCA jurisdiction (2003-2007)
The relationship between median copper concentrations and urban land cover are shown in Figure 18. There is a strong, significant increasing linear relationship between median copper concentrations and urban land cover (F=84.36, p<0.01). Much of the copper found in aquatic systems comes from human activities. This is evident in Figure 18 as the concentration of copper in streams increases significantly with increasing urban land cover.
R² = 0.72
0
1
2
3
4
5
6
7
8
0 10 20 30 40 50 60 70 80 90 100
Med
ian Co
pper Con
centration
(µg/L)
% Urban Land Use
Note: % Urban land cover = urban + urbanizing land use
SS uu rr ff aa cc ee WW aa tt ee rr QQ uu aa ll ii tt yy UU pp dd aa tt eeNovember 2009
19
Figure 18. Median copper concentrations (2003-2007) in relation to urban land cover
2.1.7 Iron
Iron is required for all forms of life but it can be potentially toxic at high concentrations. The relationship between the insoluble and soluble forms (bioavailable) depends on several factors including pH, dissolved oxygen, dissolved and total organic carbon, humic and other organic substances, exposure to light and chloride concentrations (BC MOE 2008). Anthropogenic sources of iron include mining activities, water purification and sewage treatment, pesticides, and fertilizers. Iron bound to other substances (e.g. sediment) can affect aquatic ecosystems. In fish, the clogging of gills which reduces respiratory potential and therefore overall survival can be caused by iron. It can also decrease the number of benthic invertebrates (which serve as the food supply for fish) directly or through changes to aquatic habitat. Iron results are presented in Figure 19 and Appendix B9. Several sites (13) had median iron concentration above the PWQO of 300 μg/L. Highland Creek, Duffins Creek and Carruthers Creek did not have any sites where the median iron concentration exceeded the PWQO. The highest median iron concentration was measured at HU010WM with a concentration of 710 μg/L. The majority of the other sites which exceeded the PWQO were located in the mid to lower reaches of the watersheds.
Figure 19. Iron concentrations (μg/L) across the TRCA jurisdiction (2003-2007)
The relationship between median iron concentrations and urban land cover is presented in Figure 20. There is a significant exponential relationship between these two variables (F=8.56, p<0.01) but there is quite a bit of scatter in the data (R2=0.21) indicating that the model does not fit all data points.
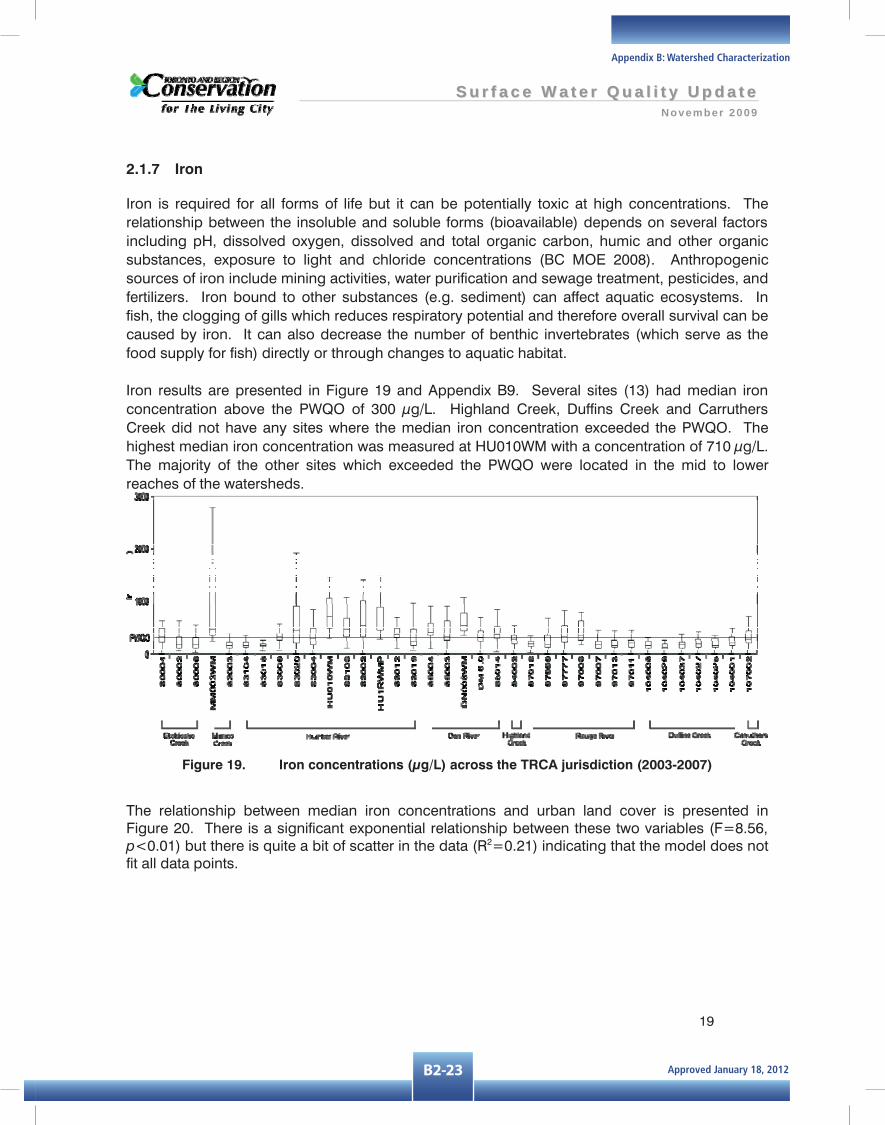
Approved January 18, 2012B2-23
Appendix B: Watershed Characterization
SS uu rr ff aa cc ee WW aa tt ee rr QQ uu aa ll ii tt yy UU pp dd aa tt eeNovember 2009
19
Figure 18. Median copper concentrations (2003-2007) in relation to urban land cover
2.1.7 Iron
Iron is required for all forms of life but it can be potentially toxic at high concentrations. The relationship between the insoluble and soluble forms (bioavailable) depends on several factors including pH, dissolved oxygen, dissolved and total organic carbon, humic and other organic substances, exposure to light and chloride concentrations (BC MOE 2008). Anthropogenic sources of iron include mining activities, water purification and sewage treatment, pesticides, and fertilizers. Iron bound to other substances (e.g. sediment) can affect aquatic ecosystems. In fish, the clogging of gills which reduces respiratory potential and therefore overall survival can be caused by iron. It can also decrease the number of benthic invertebrates (which serve as the food supply for fish) directly or through changes to aquatic habitat. Iron results are presented in Figure 19 and Appendix B9. Several sites (13) had median iron concentration above the PWQO of 300 μg/L. Highland Creek, Duffins Creek and Carruthers Creek did not have any sites where the median iron concentration exceeded the PWQO. The highest median iron concentration was measured at HU010WM with a concentration of 710 μg/L. The majority of the other sites which exceeded the PWQO were located in the mid to lower reaches of the watersheds.
Figure 19. Iron concentrations (μg/L) across the TRCA jurisdiction (2003-2007)
The relationship between median iron concentrations and urban land cover is presented in Figure 20. There is a significant exponential relationship between these two variables (F=8.56, p<0.01) but there is quite a bit of scatter in the data (R2=0.21) indicating that the model does not fit all data points.

Approved January 18, 2012 B2-24
Approved Assessment Report: Toronto and Region Source Protection Area
SS uu rr ff aa cc ee WW aa tt ee rr QQ uu aa ll ii tt yy UU pp dd aa tt eeNovember 2009
20
R² = 0.21
0
100
200
300
400
500
600
700
800
0 10 20 30 40 50 60 70 80 90 100
Med
ian Iron
Con
centration
(µg/L)
% Urban Land Cover
Note: % Urban land cover = urban + urbanizing land use
Figure 20. Median iron concentrations (2003-2007) in relation to urban land cover
2.1.8 Nickel
Nickel is an abundant element and is a naturally occurring chemical element, related to iron. It is naturally found in soils, waters, and foods, and is emitted from volcanoes. The metal is used extensively in corrosion-resistant alloys, such as stainless steel (US EPA 2006). Nickel is commonly alloyed with iron, copper, chromium, aluminum and zinc. Alloys are used in the making of metal coins and jewellery and, in industry, for making metal items. Nickel and nickel compounds are used for nickel electroplating, to colour ceramics, to make batteries, for permanent magnet materials, and as catalysts. Nickel is one of the most mobile of the heavy metals in the aquatic environment. The mobility of nickel is controlled largely by the capability of various sorbents (e.g. sediment, organic material) to bind with it and remove it from solution. Very small amounts of nickel have been shown to be essential for normal growth and reproduction in some species of animals but can be toxic at high concentrations. Nickel toxicity to aquatic organisms is determined by water hardness - the softer the water, the higher the toxicity.
Nickel results are presented in Figure 21 and Appendix B10. In a recent split sample comparison of various laboratories, results from the City of Toronto laboratory were significantly higher than other laboratories (TRCA, unpublished data), therefore, the data should be interpreted with caution. Despite the laboratory issues, all stations had median nickel concentrations lower than the PWQO of 25 μg/L. Because of the differing minimum detection limits, the relationship between median nickel concentrations and urban land cover was not analyzed.

Approved January 18, 2012B2-25
Appendix B: Watershed Characterization
SS uu rr ff aa cc ee WW aa tt ee rr QQ uu aa ll ii tt yy UU pp dd aa tt eeNovember 2009
21
Figure 21. Nickel concentrations (μg/L) in the TRCA jurisdiction (2003-2007)
2.1.9 Zinc
Zinc is an essential trace element that is toxic to aquatic organisms at elevated levels causing increased behavioural changes and mortality as well as decreased benthic invertebrate diversity and abundance (OMOE 2003). Zinc can enter aquatic systems through aerial deposition or surface runoff. The primary use of zinc is for galvanized products for the automotive and construction industry. Sources of anthropogenic zinc include electroplaters, smelting and ore processing, domestic and industrial sewage, combustion of solid wastes and fossil fuels, corrosion of zinc alloy and galvanized surfaces and soil erosion (OMOE 2003). Aquatic organisms are exposed to both particulate and dissolved (bioavailable) forms of zinc. Zinc has a strong affinity for aquatic particles (especially organic matter) and tends to accumulate in bed sediments. A wide variety of organisms live in contact with the sediments of aquatic systems. Sediments therefore act as an important route of exposure to zinc for aquatic organisms (CCME 1999b). Zinc results are presented in Figure 22 and Appendix B11. Three stations (MM003WM, HU1RWMP, 83012) had median zinc concentration above the interim PWQO of 20 μg/L. MM003WM is located in the Mimico Creek watershed, immediately downstream of the Pearson International Airport. HU1RWMP and 83012 are located in the Black Creek subwatershed within the Humber River watershed.

Approved January 18, 2012 B2-26
Approved Assessment Report: Toronto and Region Source Protection Area
SS uu rr ff aa cc ee WW aa tt ee rr QQ uu aa ll ii tt yy UU pp dd aa tt eeNovember 2009
22
Figure 22. Zinc concentrations (μg/L) across the TRCA jurisdiction (2003-2007)
A significant increasing linear relationship exists between median zinc concentrations and urban land cover (F=26.31, p<0.01) and is shown in Figure 23. As urban land cover increases, the amount of zinc in the aquatic system also increases.
R² = 0.44
0
5
10
15
20
25
30
35
40
45
0 10 20 30 40 50 60 70 80 90 100
Med
ian Zinc Co
ncentration (µ
g/L)
% Urban Land Cover
Note: % Urban land cover = urban + urbanizing land use
Figure 23. Median zinc concentrations (2003-2007) in relation to urban land cover
2.1.10 Pesticides
A pesticide is any substance or mixture of substances intended for preventing, destroying, repelling, or mitigating any pest. Though often misunderstood to refer only to insecticides, the term pesticide also applies to herbicides, fungicides, and various other substances used to control pests. Examples of beneficial uses of pesticides include: disease prevention (e.g. killing of vector species (e.g. mosquitoes) which can transmit potentially deadly diseases such as West Nile virus, yellow fever, and malaria) and increased agricultural crop yield. Although there are
Approved January 18, 2012B2-27
Appendix B: Watershed Characterization
SS uu rr ff aa cc ee WW aa tt ee rr QQ uu aa ll ii tt yy UU pp dd aa tt eeNovember 2009
23
benefits to the use of pesticides, there are also drawbacks, such as potential toxicity to humans and other animals.
Pesticide samples for the Don River and Humber River were collected from 1998-2002 as part of the Occurrence of Lawn Care and Agricultural Pesticides in the Don and Humber River Watersheds (1998-2002) report (EC et al. 2008). Four sites were sampled in each of the watersheds with a total of 262 samples collected over the 5-year period. Sampling frequency varied from year to year and of the 262 samples, 139 samples were described as dry events and 123 samples were wet events. Samples were analyzed at the University of Guelph for phenoxy acid herbicides, organophosphorus insecticides and carbamate pesticides. Many of these pesticides are used in both lawn care and agricultural pest control programs. In addition, samples were also analyzed for triazine herbicides which are used exclusively in agriculture.
Eleven pesticides and one metabolite were detected in surface waters of the Don and Humber Rivers or their tributaries. These included 2,4-D, atrazine, bromacil, carbofuran, chlorpyrifos, cypermethrin, diazinon, dicamba, MCPP, metolachlor, metribuzin, and an atrazine metabolite (des-ethyl atrazine). Approximately 72% of samples contained at least one pesticide attributed to lawn care. Water quality criteria (CWQG or PWQO) were exceeded for four pesticides: diazinon, atrazine, carbofuran, and chlorpyrifos. Diazinon exceeded the PWQO for 28% of the samples taken. For the other three pesticides, less than 1% of the samples taken exceeded their respective objectives. Since diazinon was the pesticide most frequently detected above its water quality criteria, it can be suggested that the occurrence of this pesticide could have the greatest potential to impact the health of aquatic organisms. Statistical analysis showed that concentrations and frequency of detection of pesticides were not significantly different between the upstream and downstream locations on the Don and Humber Rivers with the exception of atrazine in the Humber River watershed. Atrazine, which is used only in agriculture, was significantly elevated in the Humber River watershed at upstream locations compared to downstream locations. Atrazine was also found at statistically significant higher concentrations and more frequently in the Humber River watershed compared to the Don River watershed. The difference in watersheds may reflect land use patterns as the Humber River has more agricultural area than the Don River. Diazinon was the only pesticide to be detected more frequently during wet events compared to dry events. Several regulatory changes have come into effect since this study was conducted. Sale of diazinon was ended in 2004 by the Pest Management Regulatory Agency of Health Canada. Use of the product was allowed for one year after the end of sales, therefore, 2006 was the first year where diazinon was no longer in use for urban lawn care. The City of Toronto passed a municipal by-law that restricts the use of pesticides by both homeowners and professional applicators for cosmetic purposes (except under circumstances of infestations) in 2004 and the Province of Ontario passed a cosmetic pesticides ban in March 2009 which came into effect in April 2009. The provincial ban prohibits the use of pesticides for cosmetic purposes on lawns, vegetable and ornamental gardens, patios, driveways, cemeteries, and in parks and school yards. There are no exceptions for pest infestations (insects, fungi or weeds) in these areas, as

Approved January 18, 2012 B2-28
Approved Assessment Report: Toronto and Region Source Protection Area
SS uu rr ff aa cc ee WW aa tt ee rr QQ uu aa ll ii tt yy UU pp dd aa tt eeNovember 2009
24
lower risk pesticides, biopesticides and alternatives to pesticides exist. More than 250 pesticide products are banned for sale and over 80 pesticide ingredients are banned for cosmetic uses (OMOE 2009) 2.2 Trends
The following section examines historical water quality trends within the TRCA’s jurisdiction. The trend analysis is broken down into two sections: trends by parameter and trends at sentinel sites (river mouths). In both cases, data for chloride, total phosphorus and TSS are presented. Results for metals are not presented due to changes in analytical laboratory methodologies over time. Trend analysis was completed using the Mann-Kendall non-parametric test with a significance level of p<0.1. 2.2.1 By Parameter
Data were broken down into 5-year intervals (beginning at 2007 and working backwards) and median values for the 5-year intervals are presented. Sites with data for four or more time periods are presented. Trends were analyzed using the Mann-Kendall test with significance set as p<0.1. Chloride Trend analysis data for chloride is presented in Table 3 and Figure 24. All stations (12 of 12) showed an increasing trend for chloride concentrations (S>0) with 7 of the 12 stations having a statistically significant increasing trend. There were four stations with sufficient data in the Humber River watershed. The sites range from the mouth of the Humber River to mid-way up the watershed. All sites showed an increasing trend for chloride with the trends at stations 83002 and 83004 being significant. These stations are located in the middle of the watershed. Station 83012, located at the mouth of the Black Creek, had the highest chloride concentrations of all the stations during each time period monitored. Median chloride values ranged from 276-429 mg/L from 1974-2007. These values are 4 to 7 times higher than other stations in the watershed and 8 to 15 times the median concentrations in the other watersheds sampled. Three stations in the Don River watershed had sufficient surface water quality data for trend analysis. Two stations (85003, 85004) are located in the middle of the watershed and one station (85014) is located at the mouth of the Don River. All three stations showed an increasing trend in median chloride concentrations over time but the trends were not significant. Station 85004 showed a major increase in median chloride concentrations during the 2003-2007 sampling period. From 1968-1987, median chloride concentrations were less than 165 mg/L but the median chloride concentration more than doubled during the 2003-2007 sampling period to over 300 mg/L. This site is downstream of the Canadian Pacific Rail Vaughan Intermodal Terminal which opened in 1991 and underwent a major expansion in 2001 (Old Time Trains 2009). In addition, the area has undergone considerable urbanization over the past few decades.
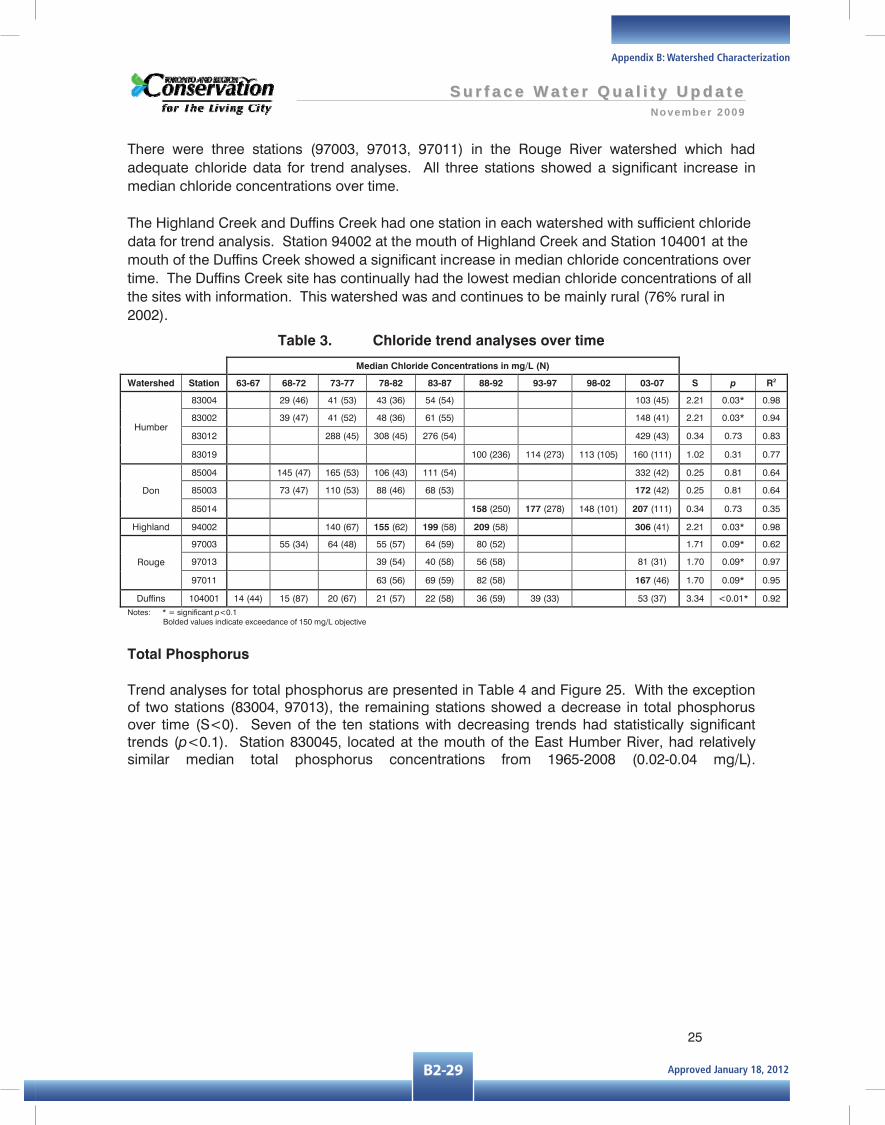
Approved January 18, 2012B2-29
Appendix B: Watershed Characterization
SS uu rr ff aa cc ee WW aa tt ee rr QQ uu aa ll ii tt yy UU pp dd aa tt eeNovember 2009
25
There were three stations (97003, 97013, 97011) in the Rouge River watershed which had adequate chloride data for trend analyses. All three stations showed a significant increase in median chloride concentrations over time. The Highland Creek and Duffins Creek had one station in each watershed with sufficient chloride data for trend analysis. Station 94002 at the mouth of Highland Creek and Station 104001 at the mouth of the Duffins Creek showed a significant increase in median chloride concentrations over time. The Duffins Creek site has continually had the lowest median chloride concentrations of all the sites with information. This watershed was and continues to be mainly rural (76% rural in 2002).
Table 3. Chloride trend analyses over time
Median Chloride Concentrations in mg/L (N)
Watershed Station 63-67 68-72 73-77 78-82 83-87 88-92 93-97 98-02 03-07 S p R2
83004 29 (46) 41 (53) 43 (36) 54 (54) 103 (45) 2.21 0.03* 0.98
83002 39 (47) 41 (52) 48 (36) 61 (55) 148 (41) 2.21 0.03* 0.94
83012 288 (45) 308 (45) 276 (54) 429 (43) 0.34 0.73 0.83 Humber
83019 100 (236) 114 (273) 113 (105) 160 (111) 1.02 0.31 0.77
85004 145 (47) 165 (53) 106 (43) 111 (54) 332 (42) 0.25 0.81 0.64
85003 73 (47) 110 (53) 88 (46) 68 (53) 172 (42) 0.25 0.81 0.64 Don
85014 158 (250) 177 (278) 148 (101) 207 (111) 0.34 0.73 0.35
Highland 94002 140 (67) 155 (62) 199 (58) 209 (58) 306 (41) 2.21 0.03* 0.98
97003 55 (34) 64 (48) 55 (57) 64 (59) 80 (52) 1.71 0.09* 0.62
97013 39 (54) 40 (58) 56 (58) 81 (31) 1.70 0.09* 0.97 Rouge
97011 63 (56) 69 (59) 82 (58) 167 (46) 1.70 0.09* 0.95
Duffins 104001 14 (44) 15 (87) 20 (67) 21 (57) 22 (58) 36 (59) 39 (33) 53 (37) 3.34 <0.01* 0.92 Notes: * = significant p<0.1
Bolded values indicate exceedance of 150 mg/L objective
Total Phosphorus Trend analyses for total phosphorus are presented in Table 4 and Figure 25. With the exception of two stations (83004, 97013), the remaining stations showed a decrease in total phosphorus over time (S<0). Seven of the ten stations with decreasing trends had statistically significant trends (p<0.1). Station 830045, located at the mouth of the East Humber River, had relatively similar median total phosphorus concentrations from 1965-2008 (0.02-0.04 mg/L).
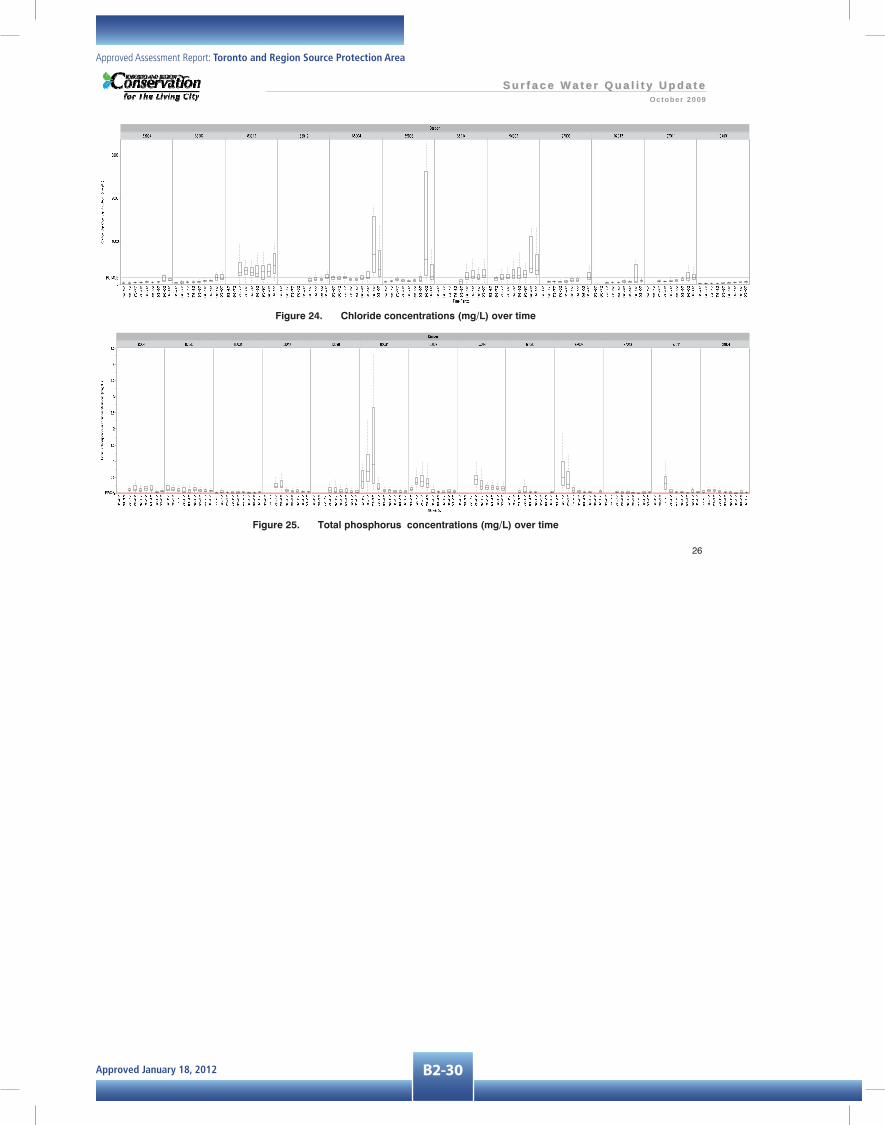
Approved January 18, 2012 B2-30
Approved Assessment Report: Toronto and Region Source Protection Area
SS uu rr ff aa cc ee WW aa tt ee rr QQ uu aa ll ii tt yy UU pp dd aa tt eeOctober 2009
26
Figure 24. Chloride concentrations (mg/L) over time
Figure 25. Total phosphorus concentrations (mg/L) over time

Approved January 18, 2012B2-31
Appendix B: Watershed Characterization
SS uu rr ff aa cc ee WW aa tt ee rr QQ uu aa ll ii tt yy UU pp dd aa tt eeOctober 2009
27
The East Humber subwatershed continues to be mainly agricultural and the total phosphorus concentrations may not have decreased over time due to the use of fertilizers in this area. Station 97013 located at the mouth of Little Rouge Creek, near the outlet of the Rouge River, showed a slight increasing trend over time but the trend was not significant. The median chloride concentrations at this site were quite similar over time ranging from 0.02 to 0.03 mg/L. The majority of the median values are above the PWQO of 0.03 mg/L. In general, total phosphorous concentrations have decreased over time. Most stations are currently only slightly above the PWQO with three stations (97013, 97011, 104001) at the PWQO. Station 85014 near the mouth of the Don River is an exception to this. The median total phosphorous concentration for 2003-2007 was 0.15 mg/L which is 5 times the PWQO. Station 85014 is located downstream of the North Toronto wastewater treatment plant.
Table 4. Total phosphorus trend analyses over time
Median Total Phosphorus Concentrations in mg/L (N) Watershed Station 63-67 68-72 73-77 78-82 83-87 88-92 93-97 98-02 03-07 S p R2 Etobicoke 80004 0.10 (47) 0.12 (37) 0.09 (54) 0.07 (56) -1.02 0.30 0.71
83002 0.14 (47) 0.11 (52) 0.07 (45) 0.09 (55) 0.08 (62) -1.23 0.22 0.42 83004 0.04 (46) 0.02 (53) 0.03 (45) 0.02 (54) 0.04 (66) 0.00 1.00 0.13 83012 0.23 (45) 0.23 (46) 0.08 (55) 0.06 (65) -1.70 0.09* 0.68
Humber
83019 0.08 (116) 0.07 (108) 0.06 (263) 0.05 (272) 0.04 (106) 0.04 (134) -2.25 0.02* 0.94 85004 0.69 (47) 0.89 (53) 0.17 (43) 0.09 (54) 0.06 (60) -1.71 0.09* 0.53 85003 0.34 (47) 0.38 (54) 0.31 (46) 0.05 (53) 0.06 (62) -1.22 0.22 0.65 Don
85014 0.43 (114) 0.23 (102) 0.18 (267) 0.19 (275) 0.16 (101) 0.15 (121) -2.25 0.02* 0.66 Highland 94002 0.04 (67) 0.07 (62) 0.03 (57) 0.03 (58) 0.04 (60) -0.73 0.46 0.10
97003 0.50 (35) 0.28 (48) 0.10 (57) 0.06 (59) 0.05 (52) -2.20 0.03* 0.85 97013 0.03 (59) 0.02 (55) 0.02 (59) 0.03 (58) 0.03 (49) 0.73 0.46 0.43 Rouge
97011 0.32 (62) 0.06 (56) 0.04 (59) 0.03 (58) 0.03 (67) -1.71 0.09* 0.41 Duffins 104001 0.05 (45) 0.09 (88) 0.09 (67) 0.07 (57) 0.04 (58) 0.03 (59) 0.02 (34) 0.03 (40) -1.86 0.06* 0.54
Notes: * = significant p<0.1
Bolded values indicate exceedance of 0.03 mg/L objectiveTotal Suspended Solids Trend analyses for TSS concentrations are presented in Table 5 and Figure 26. With the exception of one site (85003), the remaining stations showed a decreasing trend in TSS concentrations (S<0). Station 83019 at the mouth of the Humber River and Station 85014 at the mouth of the Don River both had statistically significant decreasing trends in TSS concentrations.
Table 5. Total suspended solids (TSS) trend analyses over time
Median TSS Concentrations in mg/L (N)
Watershed Station 63-67 68-72 73-77 78-82 83-87 88-92 93-97 98-02 03-07 S p R2
Humber 83019 24 (114) 23 (107) 19 (266) 20 (272) 10 (104) 8 (109) -2.25 0.02* 0.85
85004 30 (47) 35 (45) 10 (43) 0.00 1.00 0.90
85003 20 (47) 28 (46) 25 (31) 6 (43) -0.34 0.73 0.73 Don
85014 22 (113) 18 (101) 17 (254) 14 (278) 11 (99) 11 (108) -2.25 0.02* 0.94
Highland 94002 22 (56) 24 (59) 7 (56) 9 (54) 4 (43) -1.22 0.22 0.68
Duffins 104001 20 (45) 19 (87) 22 (63) 20 (36) 9 (36) -0.49 0.62 0.79
Notes: * = significant p<0.1 Bolded values indicate exceedance of 30 mg/L objective

Approved January 18, 2012 B2-32
Approved Assessment Report: Toronto and Region Source Protection Area
SS uu rr ff aa cc ee WW aa tt ee rr QQ uu aa ll ii tt yy UU pp dd aa tt eeOctober 2009
28
Figure 26. Total suspended solids (TSS) concentration (mg/L) over time
2.2.2 By Watershed Mouths
Data (n>30 for 5-year intervals) were available for five sites located at the mouths of Humber River (83019), Don River (85014), Highland Creek (94002), Rouge River (97011) and Duffins Creek (104001). Watershed mouths are important sentinel sites because the incorporate the water quality of all the incoming tributaries at a single point before the water enters Lake Ontario.
Total Suspended Solids
TSS results are the mouths of the Humber River, Don Diver, Highland Creek and Duffins Creek are presented in Figure 27. All stations had median values below the CCME derived guideline of 30 mg/L for all time periods. All stations showed decreasing trend in TSS concentrations over time (Figure 28) but only the Humber and Don River mouths trends were statistically significant (Table 6). The non-significant trend at the Duffins Creek site was most likely due to the lack of data from 1983-2002.

Approved January 18, 2012B2-33
Appendix B: Watershed Characterization
SS uu rr ff aa cc ee WW aa tt ee rr QQ uu aa ll ii tt yy UU pp dd aa tt eeOctober 2009
29
Figure 27. Total suspended solids (TSS) concentrations for the mouths of the Humber
River (83019), Don River (85014), Highland Creek (94002), and Duffins Creek (104001) over time
Table 6. Mann-Kendall and regression statistics for TSS trend analysis
Mann-Kendall Regression Watershed Station S p R2
Humber River 83019 -2.25 0.02* 0.85 Don River 85014 -2.25 0.02* 0.94 Highland Creek 94002 -1.22 0.22 0.68 Duffins Creek 104001 -0.49 0.62 0.81
* = significant (p<0.1)
R² = 0.845
0
5
10
15
20
25
30
1980 1985 1990 1995 2000 2005 2010
Med
ian
TSS
(mg/
L)
Year
Station 83019 - Humber River
R² = 0.940
0
5
10
15
20
25
30
1980 1985 1990 1995 2000 2005 2010
Med
ian
TSS
(mg/
L)
Year
Station 85014 - Don River
R² = 0.675
0
5
10
15
20
25
30
1975 1980 1985 1990 1995 2000 2005 2010
Med
ian
TSS
(mg/
L)
Year
Station 94002 - Highland Creek
R² = 0.807
0
5
10
15
20
25
30
1960 1970 1980 1990 2000 2010
Med
ian
TSS
(mg/
L)
Year
Station 104001 - Duffins Creek
Note: Y-axis values differ amongst stations
Figure 28. Median total suspended solids (TSS) trend over time at the mouths of the Humber River, Don River, Highland Creek, and Duffins Creek

Approved January 18, 2012 B2-34
Approved Assessment Report: Toronto and Region Source Protection Area
SS uu rr ff aa cc ee WW aa tt ee rr QQ uu aa ll ii tt yy UU pp dd aa tt eeOctober 2009
30
Chloride
Chloride results are presented in Figure 29 for the mouths of the Humber River (83019), Don River (85014), Highland Creek (94002), Rouge River (97011), and Duffins Creek (104001). All five stations showed an increasing trend in chloride concentrations (Figure 30). Highland Creek, Rouge River and Duffins Creek all had statistically significant increasing trends. The lack of significance at the Humber River and Don River sites is most likely due to the lack of data (only four sampling points). With the exception of the Duffins Creek watershed, the median chloride concentration exceeded the BC MOE water quality objective of 150 mg/L for at least one time period. The first watersheds to exceed the median chloride concentrations of 150 mg/L were the Don River (1988-1992) and Highland Creek (1978-1982) stations. Figure 29 shows that the 2003-2007 time period was the first time that the mouths of the Humber and Rouge Rivers exceeded the 150 mg/L objective. The median chloride concentration at the Duffins Creek site ranged from 14 mg/L from 1963-1967 to 53 mg/L from 2003-2007. It is important to note that winter samples (when chloride concentrations are expected to be the highest due to road salting activities) were not collected during every time period. At the Duffins Creek site, winter sampling began in 1965. Winter samples were collected at the Rouge River and Highland Creek beginning in the mid-1970s and winter sampling did not start at the Humber River and Don River stations until 1990. This suggests that median chloride concentrations may be higher than what is presented in Figures 29 and 30 during periods when winter sampling did not occur.
Figure 29. Chloride concentrations for the mouth of the Humber River, Don River,
Highland Creek, Rouge River and Duffins Creek over time

Approved January 18, 2012B2-35
Appendix B: Watershed Characterization
SS uu rr ff aa cc ee WW aa tt ee rr QQ uu aa ll ii tt yy UU pp dd aa tt eeOctober 2009
31
R² = 0.771
020406080
100120140160180
1990 1995 2000 2005 2010
Med
ian
Chl
orid
e (m
g/L)
Year
Station 83019 - Humber River
R² = 0.350
0
50
100
150
200
250
1990 1995 2000 2005 2010
Med
ian
Chl
orid
e (m
g/L)
Year
Station 85014 - Don River
R² = 0.923
0
50
100
150
200
250
300
350
1975 1980 1985 1990 1995 2000 2005 2010Med
ian
Chl
orid
e (m
g/L)
Year
Station 94002 - Highland Creek
R² = 0.940
020406080
100120140160180200
1980 1985 1990 1995 2000 2005 2010
Med
ian
Chl
orid
e (m
g/L)
Year
Station 97011 - Rouge River
R² = 0.925
0
10
20
30
40
50
60
1960 1970 1980 1990 2000 2010Med
ian
Chl
orid
e (m
g/L)
Year
Station 104001 - Duffins Creek
Note: Both X- and Y-axis values differ amongst stations
Figure 30. Median chloride trends over time at the mouths of the Humber River (83019), Don River (85014), Highland Creek (94002), Rouge River (97011), and Duffins Creek
(104011)
Table 7. Mann-Kendall and regression statistics for chloride trend analysis based on median values at 5-year intervals
Mann-Kendall Regression Watershed Station S p R2
Humber River 83019 1.02 0.31 0.77 Don River 85014 0.34 0.73 0.35 Highland Creek 94002 2.20 0.03* 0.93 Rouge River 97011 1.70 0.09* 0.94 Duffins Creek 104001 3.34 <0.01* 0.93
* = significant (p<0.1)
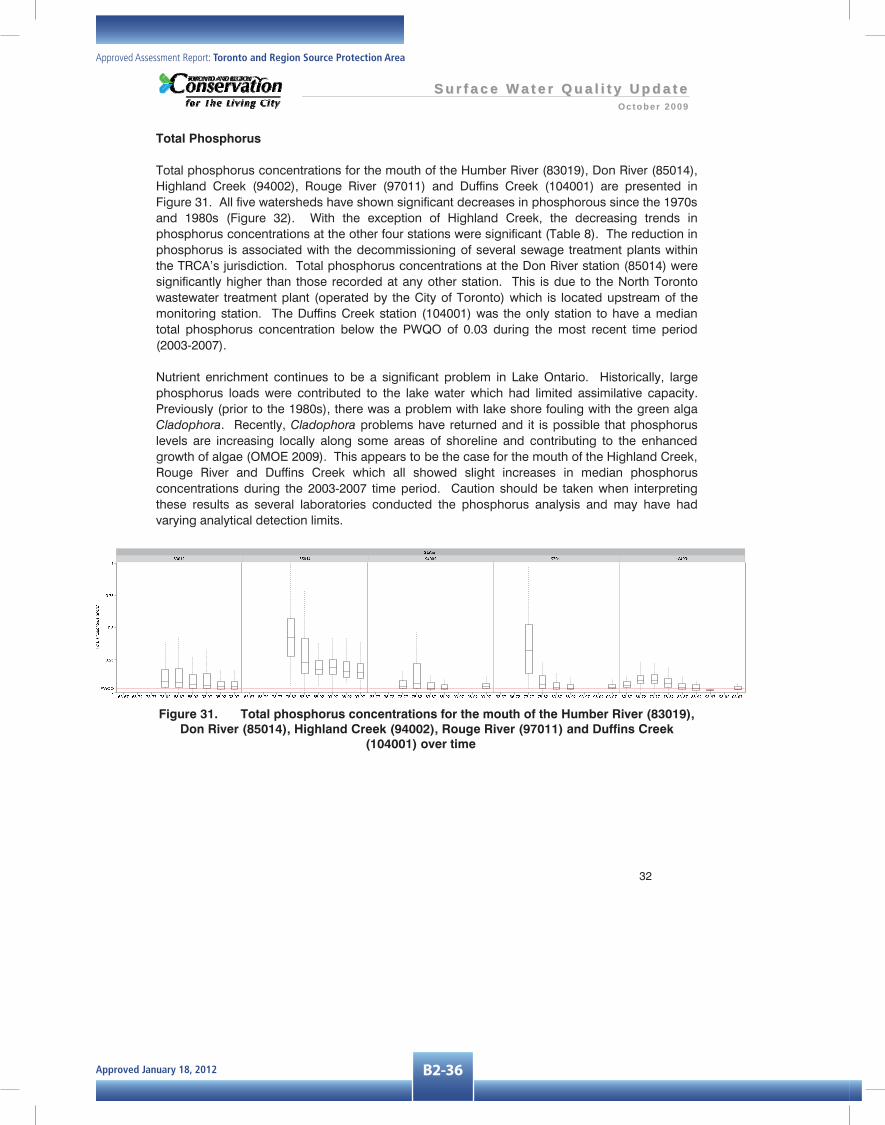
Approved January 18, 2012 B2-36
Approved Assessment Report: Toronto and Region Source Protection Area
SS uu rr ff aa cc ee WW aa tt ee rr QQ uu aa ll ii tt yy UU pp dd aa tt eeOctober 2009
32
Total Phosphorus
Total phosphorus concentrations for the mouth of the Humber River (83019), Don River (85014), Highland Creek (94002), Rouge River (97011) and Duffins Creek (104001) are presented in Figure 31. All five watersheds have shown significant decreases in phosphorous since the 1970s and 1980s (Figure 32). With the exception of Highland Creek, the decreasing trends in phosphorus concentrations at the other four stations were significant (Table 8). The reduction in phosphorus is associated with the decommissioning of several sewage treatment plants within the TRCA’s jurisdiction. Total phosphorus concentrations at the Don River station (85014) were significantly higher than those recorded at any other station. This is due to the North Toronto wastewater treatment plant (operated by the City of Toronto) which is located upstream of the monitoring station. The Duffins Creek station (104001) was the only station to have a median total phosphorus concentration below the PWQO of 0.03 during the most recent time period (2003-2007).
Nutrient enrichment continues to be a significant problem in Lake Ontario. Historically, large phosphorus loads were contributed to the lake water which had limited assimilative capacity. Previously (prior to the 1980s), there was a problem with lake shore fouling with the green alga Cladophora. Recently, Cladophora problems have returned and it is possible that phosphorus levels are increasing locally along some areas of shoreline and contributing to the enhanced growth of algae (OMOE 2009). This appears to be the case for the mouth of the Highland Creek, Rouge River and Duffins Creek which all showed slight increases in median phosphorus concentrations during the 2003-2007 time period. Caution should be taken when interpreting these results as several laboratories conducted the phosphorus analysis and may have had varying analytical detection limits.
Figure 31. Total phosphorus concentrations for the mouth of the Humber River (83019),
Don River (85014), Highland Creek (94002), Rouge River (97011) and Duffins Creek (104001) over time

Approved January 18, 2012B2-37
Appendix B: Watershed Characterization
SS uu rr ff aa cc ee WW aa tt ee rr QQ uu aa ll ii tt yy UU pp dd aa tt eeOctober 2009
33
R² = 0.941
0.000.010.020.030.040.050.060.070.080.09
1980 1985 1990 1995 2000 2005 2010Med
ian
Tota
l Pho
spho
rus
(mg/
L)Year
Station 83019 - Humber River
R² = 0.663
0.000.050.100.150.200.250.300.350.400.45
1980 1985 1990 1995 2000 2005 2010
Med
ian
Tota
l Pho
spho
rus
(mg/
L)
Year
Station 85014 - Don River
R² = 0.101
0.00
0.01
0.02
0.03
0.04
0.05
0.06
0.07
1975 1980 1985 1990 1995 2000 2005 2010Med
ian
Tota
l Pho
spho
rus
(mg/
L)Year
Station 94002 - Highland Creek
R² = 0.393
0.00
0.05
0.10
0.15
0.20
0.25
0.30
0.35
1975 1980 1985 1990 1995 2000 2005 2010Med
ian
Tota
l Pho
spho
rus
(mg/
L)
Year
Station 97011 - Rouge River
R² = 0.584
0.000.010.020.030.040.050.060.070.080.090.10
1960 1970 1980 1990 2000 2010
Med
ian
Tota
l Pho
spho
rus
(mg/
L)
Year
Station 104001 - Duffins Creek
Note: Both X- and Y-axis values differ amongst stations
Figure 32. Median total phosphorus trends over time at the mouths of the Humber River, Don River, Highland Creek, Rouge River, and Duffins Creek
Table 8. Mann-Kendall and regression statistics for total phosphorus trend analysis based on median values at 5-year intervals
Mann-Kendall Regression Watershed Station S p R2
Humber River 83019 -2.25 0.02* 0.94 Don River 85014 -2.25 0.02* 0.66 Highland Creek 94002 -0.73 0.46 0.10 Rouge River 97011 -1.71 0.09* 0.39 Duffins Creek 104001 -2.10 0.04* 0.58
* = significant (p<0.1)
Approved January 18, 2012 B2-38
Approved Assessment Report: Toronto and Region Source Protection Area
SS uu rr ff aa cc ee WW aa tt ee rr QQ uu aa ll ii tt yy UU pp dd aa tt eeOctober 2009
34
3. SummarySurface water quality for the Toronto and Region Conservation Authority’s jurisdiction has been analyzed several times (e.g. TRCA 1998, TRCA 2003) with the general conclusion that water quality issues are correlated to the amount of urbanization within a watershed. The 2003-2007 results are consistent with this broad finding. The Duffins Creek watershed along with the upper Humber River and Rouge River continue to exhibit the best water quality within the TRCA’s jurisdiction; lower levels of urbanization, larger riparian buffers, and groundwater contributions may play a role in the water quality in these areas. TSS • TSS concentrations were elevated in the mid-reaches of the Humber River and Rouge River • There was no relationship between TSS concentrations and urban land cover • TSS concentrations have decreased (↓) over time Chloride • Median chloride concentrations for 44% of the sites monitored exceeded the suggested 150
mg/L objective • The median at two sites (5% of total) exceeded the BC MOE 600 mg/L maximum objective • Numerous individual sampling points often exceeded the maximum 600 mg/L objective • Median chloride concentrations were highest at station 82003 at the mouth of the Mimico
Creek and lowest in the Duffins Creek watershed and the upper reaches of the Humber River • Chloride concentrations have increased (↑) over time Total Phosphorus • Median phosphorus concentrations for 77% of the sites monitored exceeded the interim
PWQO of 0.03 mg/L • High levels of total phosphorus and unionized ammonia were measured at the mouth of the
Don River (station 85014), downstream of the North Toronto wastewater treatment plant • There was an exponential relationships between total phosphorus and urban land cover • Total phosphorus has decreased (↓) over time Nitrogen Compounds • All stations had nitrate values less than the CWQG of 2.93 mg/L • Median nitite concentrations at all stations were below the BC MOE objective of 0.6 mg/L • With the exception of one site, all stations had median unionized ammonia values less than
the PWQO of 0.02 mg/L • Station 85014, located at the mouth of the Don River, had elevated concentrations of nitrite
and unionized ammonia which can be toxic to aquatic organisms • An exponential relationship existed between all three nitrogen compounds (nitrate, nitrite and
unionized ammonia) and urban land cover

Approved January 18, 2012B2-39
Appendix B: Watershed Characterization
SS uu rr ff aa cc ee WW aa tt ee rr QQ uu aa ll ii tt yy UU pp dd aa tt eeOctober 2009
35
E. coli • Median E. coli levels at 89% of the sites monitored were above the PWQO of 100 CFU/100
mL • Individual sampling points often exceeded 20 000 CFU/100 mL at many sites; high E. coli
loadings from tributaries may contribute to waterfront beach closings • The lowest E. coli concentrations were in the Duffins Creek and the upper reaches of the
Humber River and Rouge River where urbanization is lowest • E. coli had exponential relationships with urban land cover Metals • Iron was the metal which most commonly exceeded its PWQO with 55% of the median values
exceeding the PWQO • Nickel was below the PWQO for all sites • Median copper and zinc concentrations exceeded their respective PWQO at three sites:
MM003WM in the Mimico watershed downstream of Pearson International Airport and HU1RWMP and 83012 which are both in the Black Creek subwatershed of the Humber River watershed
• Copper and zinc had positive linear relationships with urban land cover • Iron had exponential relationships with urban land cover Pesticides • Eleven pesticides and one metabolite were detected in the surface waters of the Don and
Humber Rivers from 1998-2002 • Approximately 72% of the samples contained at least one pesticide attribute to lawn care • Diazinon exceeded the PWQO of 0.08 μg/L for 28% of samples and diazinon was detected
more frequently during wet events compared to dry events General The assessment of long-term water quality changes across a large region is a challenging task. Differences in the number of samples collected, the parameters analyzed, the analytical capabilities of laboratories completing the analysis, improvements in laboratory analysis techniques (e.g. lower detection levels) and varying stream flow complicate water quality analysis. Several of these factors confounded water quality analysis within the TRCA’s jurisdiction. For example, the majority of the results for lead and cadmium, two metals commonly associated with urbanization, did not have low enough detection limits to compare against the PWQO. Storm runoff is one of the main contributors to degraded water quality. Separation of wet weather flow (i.e. storm flow) from base flow samples should be completed to quantify and characterize the inputs from non-point source pollution (e.g. storm runoff). Currently only 14 of

Approved January 18, 2012 B2-40
Approved Assessment Report: Toronto and Region Source Protection Area
SS uu rr ff aa cc ee WW aa tt ee rr QQ uu aa ll ii tt yy UU pp dd aa tt eeOctober 2009
36
the 36 monitoring sites have associated with stream flow monitoring. Sampling is completed more frequently at the mouth of the Humber and Don Rivers, two stations which do have associated flow monitoring. These stations could be used as sentinel stations for the TRCA’s jurisdiction. Detailed water quality and quantity analysis could be performed at these two stations to help determine the success of investments and efforts by governments, industry and individuals to protect the water quality in the Toronto region. For example, several initiatives including watershed planning, natural channel design, erosion controls, and stormwater management have all been instituted within the last twenty years. In essence, several multi-disciplinary actions have been taken to address the quality and quantity of urban runoff as it reaches our stream and rivers. By performing detailed water quality and quantity analysis at these two sites, responses to these efforts to protect water quality in the Toronto region may be revealed. In 2008/2009, the City of Toronto in partnership with the TRCA, installed several wet weather flow monitoring stations. These stations consist of automated water samplers which are triggered by flow events. This project will increase the understanding of wet weather flow within the City of Toronto and help to assess the benefits of initiatives being carried out through the Wet Weather Flow Management Master Plan. Overall, the monitoring results presented in this report show that water quality is linked to the amount of urbanization upstream of a monitoring station. Non-point sources of contamination from urbanization continue to be the largest contaminant contributor to water within the TRCA’s jurisdiction. Point sources of contamination such as wastewater treatment plants and Pearson International Airport also contribute to the degradation of water quality in the Toronto area. Certain contaminants (e.g. TSS, total phosphorus) have decreased over the past twenty years while chloride concentrations show an increasing trend. Continued routine efforts such as the treatment of urban runoff via stormwater ponds as well as innovative actions (e.g. biophosphorus removal at wastewater treatment) are required to maintain and improve the water quality in the Toronto region.

Approved January 18, 2012B2-41
Appendix B: Watershed Characterization
SS uu rr ff aa cc ee WW aa tt ee rr QQ uu aa ll ii tt yy UU pp dd aa tt eeOctober 2009
37
4. ReferencesBritish Columbia Ministry of the Environment (BC MOE). 2008. Ambient Water Quality Guidelines for
Iron. http://www.env.gov.bc.ca/wat/wq/BCguidelines/iron/iron_tech.pdf. Accessed April 8, 2008. British Columbia Ministry of the Environment (BC MOE). 2003. Ambient Water Quality Guidelines for
Chloride - Overview Report. http://www.env.gov.bc.ca/wat/wq/BCguidelines/chloride/chloride.html. Accessed March 30, 2008.
Canadian Council of Ministers of the Environment (CCME), 2007. Summary of Canadian water
quality guidelines for the protection of aquatic life. In: Canadian Environmental Quality Guidelines, 2007, Canadian Council of Ministers of the Environment, Winnipeg.
Canadian Council of Ministers of the Environment (CCME), 2004. Canadian water quality
guidelines for the protection of aquatic life: Phosphorus. In: Canadian Environmental Quality Guidelines, 2004, Canadian Council of Ministers of the Environment, Winnipeg.
Canadian Council of Ministers of the Environment (CCME), 2003. Canadian water quality
guidelines for the protection of aquatic life: Nitrate Ion. In: Canadian Environmental Quality Guidelines, Canadian Council of Ministers of the Environment, Winnipeg.
Canadian Council of Ministers of the Environment (CCME), 2002. Canadian water quality
guidelines for the protection of aquatic life: Total particulate matter. In: Canadian Environmental Quality Guidelines, Canadian Council of Ministers of the Environment, Winnipeg.
Canadian Council of Ministers of the Environment (CCME), 2000. Canadian water quality
guidelines for the protection of aquatic life: Ammonia. In: Canadian Environmental Quality Guidelines, Canadian Council of Ministers of the Environment, Winnipeg.
Canadian Council of Ministers of the Environment. 1999a. Canadian sediment quality guidelines
for the protection of aquatic life: Copper. In: Canadian Environmental Quality Guidelines, Canadian Council of Ministers of the Environment, Winnipeg.
Canadian Council of Ministers of the Environment. 1999b. Canadian sediment quality guidelines
for the protection of aquatic life: Zinc. In: Canadian Environmental Quality Guidelines, Canadian Council of Ministers of the Environment, Winnipeg.
Centre for Disease Control (CDC). 2008. U.S. Centre for Disease Control and Prevention.
Atlanta, GA. http://www.cdc.gov/nczved/dfbmd/disease_listing/stec_gi.html. Accessed April 2, 2009. Environment Canada, Health Canada, Statistics Canada. 2008a. Canadian Environmental
Sustainability Indicators 2007: Freshwater Quality Indicator Data Sources and Methods. Ottawa, ON.
Environment Canada, Ontario Ministry of the Environment, City of Toronto. 2008b. Occurrence
of Lawn Care and Agricultural Pesticides in the Don and Humber River Watersheds (1998-2002). Prepared for the 2002 Canada-Ontario Agreement Respecting the Great Lakes Basin Ecosystem. Toronto, ON.

Approved January 18, 2012 B2-42
Approved Assessment Report: Toronto and Region Source Protection Area
SS uu rr ff aa cc ee WW aa tt ee rr QQ uu aa ll ii tt yy UU pp dd aa tt eeOctober 2009
38
Environment Canada (EC). 2004. Canadian Guidance Framework for the management of phosphorus in freshwater systems. Scientific Supporting Document, National Guidelines and Standards Office, Water Policy and Coordination Directorate, Environment Canada, Ottawa, ON.
Environment Canada (EC). 2005. Recommended Water Quality Guidelines for the Protection of
Aquatic Life for Use in the 2005 National Water Quality Indicators under the Canadian Environmental Sustainability Indicators (CESI) Initiative [draft]. National Guidelines and Standards Office, Environment Canada, Gatineau, Quebec. June 23, 2005.
Environment Canada & Health Canada (EC & HC). 2001. Priority Substance List Assessment
Report: Ammonia in the Aquatic Environment. ISBN: 0-662-29192-1. Finkekenbine JK, Atwater JW, Mavinic DS. 2000. Stream health after urbanization. Journal of the
American Water Resources Association 36:1149-1160. Gilbert, RO. 1987. Statistical methods for environmental pollution monitoring. Van Nostrand
Reinhold: New York, NY. Old Time Trains. 2007. http://trainweb.org/oldtimetrains/CPR_Bruce/vaughan.htm. Accessed October 5, 2009. Ontario Ministry of the Environment (OMOE). 2009. Water Quality in Ontario Report 2008.
Queen’s Printer for Ontario. Toronto, ON. Ontario Ministry of the Environment (OMOE). 2009. http://www.ene.gov.on.ca/en/news/2009/030401mb.php.
Accessed September 23, 2009. Ontario Ministry of the Environment (OMOE). 2003. Water Sampling and Data Analysis Manual
for Partners in the Ontario Provincial Water Quality Monitoring Network. Ontario Ministry Environment and Energy (OMOEE). 1994. Policies Guidelines and Provincial
Water Quality Objectives of the Ministry of Environment and Energy. Queen’s Printer for Ontario. Toronto, ON.
Toronto and Region Conservation Authority (TRCA). 2003. A Summary of Water Quality Data in
the Region from 1996 to 2002. Toronto, ON. Toronto and Region Conservation Authority (TRCA). 1998. 1990-1996 Water Quality Data for the
Toronto RAP Watershed. Toronto, ON. United States Environmental Protection Agency (US EPA). 2006. Technical Fact Sheet: Nickel.
http://www.epa.gov/ogwdw/dwh/t-ioc/nickel.html. Accessed April 8, 2009.

Approved January 18, 2012B2-43
Appendix B: Watershed Characterization
SSuu
rr ffaa
ccee
WWaa
tt eerr
QQuu
aall ii
tt yyUU
ppdd
aatt ee
Oct
ob
er 2
009
App
endi
x B
Ap
pen
dix
A –
Cur
rent
Site
Des
crip
tions
Wat
ersh
ed
Sta
tion
Alte
rnat
e N
ame
No
rth
ing
E
astin
g
Sub
wat
ersh
ed
Tow
nsh
ip
Mun
icip
ality
Lo
catio
n D
escr
iptio
n F
low
S
tatio
n P
rop
riet
or
Per
iod
of
Rec
ord
Lo
nges
t C
on
tinuo
us
Rec
ord
(A
pp
rox.
Y
ears
)1
Str
eam
O
rder
2
% U
rban
La
nd
Co
ver3
8000
7 06
0080
0070
2/E
14.9
48
3674
6 60
6933
U
pper
Eto
bico
ke C
reek
M
issi
ssau
ga
Pee
l N
orth
wes
t of D
erry
Rd
and
Dix
ie R
d,
Mis
siss
auga
PW
QM
N
2003
-200
9 6
6 40
8000
6 06
0080
0060
2/E
2.8
4829
016
6162
34
Low
er E
tobi
coke
Cre
ek
Toro
nto
Toro
nto
Sou
thw
est o
f the
QE
W a
nd B
row
n's
Line
02
HC
030
PW
QM
N
2002
-200
9 7
6 (m
outh
) 72
E
tobi
coke
C
reek
8000
4 M
ayfie
ld/0
6008
0004
02/E
28.2
48
4348
8 59
5028
U
pper
Eto
bico
ke C
reek
B
ram
pton
P
eel
Sou
thea
st o
f May
field
Roa
d an
d H
wy
10
R
WM
P
1973
-198
8, 1
991-
1995
, 200
2-20
09
15
6 1
MM
003W
M
MM
003W
M
4837
916
6138
49
Low
er M
imic
o To
ront
o To
ront
o S
outh
wes
t of D
ixon
Rd.
and
Hw
y 27
, in
Roy
al W
oodb
ine
Gol
f Clu
b
City
of
Toro
nto
2006
-200
9 3
3 10
0 M
imic
o C
reek
82
003
0600
8200
302/
M1.
4 48
3171
3 62
1585
Lo
wer
Mim
ico
Toro
nto
Toro
nto
Sou
thw
est o
f Par
k La
wn
Rd.
and
The
Q
ueen
sway
, Eto
bico
ke
P
WQ
MN
19
94-1
995,
200
1-20
09
8 3
(mou
th)
100
8300
2 06
0083
0020
2/H
W16
.9
4843
562
6104
59
Wes
t Hum
ber
Riv
er
Toro
nto
Toro
nto
Nor
thea
st o
f Hw
y 42
7 an
d Fi
nch
Ave
., do
wns
trea
m (
east
) of
Cla
irevi
lle
dam
out
let
02H
C03
4 C
ity o
f To
ront
o
1966
-198
8, 1
991-
1993
, 199
6-19
97,
2001
-200
9 22
6
40
8301
2 06
0083
0120
2/H
B5.
6 48
3684
5 62
0488
B
lack
Cre
ek
Toro
nto
Toro
nto
Nor
thea
st o
f Sca
rlett
Rd
. and
St.
Cla
ir A
ve.
02H
C02
7 C
ity o
f To
ront
o
1974
-198
8, 1
991-
1993
, 199
6-19
97,
2001
-200
9 14
3
100
HU
010W
M
HU
010W
M
4844
744
6150
27
Low
er M
ain
Hum
ber
Toro
nto
Toro
nto
Nor
thw
est o
f Fin
ch A
ve. a
nd Is
lingt
on
Ave
. in
Row
ntre
e M
ills
Par
k
City
of
Toro
nto
2006
-200
9 3
7 31
HU
1RW
MP
H
U1R
WM
P
4848
311
6186
78
Bla
ck C
reek
V
augh
an
Yor
k N
orth
wes
t of S
teel
es A
ve. a
nd J
ane
St.
C
ity o
f To
ront
o 20
06-2
009
3 3
100
8300
9 06
0083
0090
2/H
35.0
48
6024
3 60
2980
M
ain
Hum
ber
Kin
g Y
ork
Nor
thea
st o
f Kin
g R
d. a
nd C
aled
on-
Kin
g To
wnl
ine
02H
C02
3 P
WQ
MN
19
69-1
971,
200
2-20
09
7 6
22
8301
8 06
0083
0180
2/H
42.5
48
6432
9 59
5961
M
ain
Hum
ber
Cal
edon
P
eel
Sou
thw
est o
f Old
Chu
rch
Rd.
and
H
wy
50, d
owns
trea
m A
lbio
n H
ills
CA
02
HC
012
PW
QM
N
1975
-198
8, 1
991-
1997
, 200
1-20
09
13
6 11
8301
9 06
0083
0190
2/H
2.9
4834
265
6216
63
Low
er M
ain
Hum
ber
Toro
nto
Toro
nto
Nor
thw
est o
f Old
Mill
Dr.
and
Old
Mill
R
d. in
Eto
bico
ke
02H
C00
3 P
WQ
MN
19
79-2
009
30
7 (m
outh
) 43
8310
3 06
0083
1030
2/H
W22
.0
4845
870
6063
85
Wes
t Hum
ber
Riv
er
Bra
mpt
on
Pee
l N
orth
wes
t of H
wy
7 an
d M
cVea
n D
r,
upst
ream
(no
rth)
of C
laire
ville
02
HC
031
PW
QM
N
2002
-200
9 7
5 29
8310
4 06
0083
1040
2/H
43.9
48
6411
2 59
3560
M
ain
Hum
ber
Cal
edon
P
eel
Nor
thw
est o
f Old
Chu
rch
Rd.
and
H
wy
50, i
n A
lbio
n H
ills
CA
, at b
lue
gaug
e st
atio
n 02
HC
051
PW
QM
N
2002
-200
9 7
5 14
8300
4 06
0083
0040
2/H
E20
.7
4850
423
6141
48
Eas
t Hum
ber
Riv
er
Vau
ghan
Y
ork
At b
ridge
Pin
e G
rove
Rd
, wes
t of
Pin
e V
alle
y D
r, W
oodb
ridge
02
HC
009
RW
MP
19
65-1
988,
199
1-19
97, 2
001-
2009
23
6
28
Hum
ber
Riv
er
8302
0 06
0083
0200
2/H
23.9
48
5186
1 61
0386
M
ain
Hum
ber
Vau
ghan
Y
ork
Nor
thea
st o
f Rut
herfo
rd R
d. a
nd H
wy
27 a
t firs
t brid
ge
R
WM
P
1996
, 200
1-20
09
8 7
17
8500
3 06
0085
0030
2/D
E17
.9
4851
256
6289
54
Upp
er E
ast D
on
Mar
kham
Y
ork
Nor
thw
est o
f Ste
eles
Ave
. and
B
ayvi
ew A
ve.
C
ity o
f To
ront
o
1966
-198
8, 1
991-
1995
, 199
7, 2
001-
2009
22
3
90
8500
4 06
0085
0040
2/D
W20
.6
4851
207
6220
14
Upp
er W
est D
on
Vau
ghan
Y
ork
Nor
thw
est o
f Hw
y 7
and
Cen
tre
St.
C
ity o
f To
ront
o
1966
-198
8, 1
991-
1995
, 199
7, 2
001-
2009
22
4
85
DM
6.0
D
M 6
.0
4840
251
6343
78
Tayl
or/M
asse
y C
reek
To
ront
o To
ront
o W
est o
f the
DV
P a
nd e
ast o
f Don
M
ills
Rd
.
City
of
Toro
nto
2001
-200
9 8
3 10
0
DN
008W
M
DN
008W
M
4850
889
6302
36
Ger
man
Mill
s C
reek
To
ront
o To
ront
o N
orth
east
of C
umm
er A
ve. a
nd
Bay
view
Ave
.
City
of
Toro
nto
2006
-200
9 3
3 98
Don
Riv
er
8501
4 06
0085
0140
2/D
4.5
4838
576
6320
00
Low
er D
on
Toro
nto
Toro
nto
Pot
tery
Rd
, Tor
onto
02
HC
024
PW
QM
N
1979
-200
9 30
5
(mou
th)
100
Hig
hlan
d C
reek
94
002
0600
9400
202/
Hi2
.5
4849
056
6474
29
Mai
n H
ighl
and
Cre
ek
Toro
nto
Toro
nto
Sou
th o
f Kin
gsto
n R
d. a
nd C
olon
el
Dan
fort
h Tr
ail
02H
C01
3 C
ity o
f To
ront
o 19
72-1
995,
199
7,
2001
-200
9 23
4
(mou
th)
100
9700
3 R
G00
8WM
/060
0970
0302
48
5766
9 64
1985
Lo
wer
Rou
ge C
reek
M
arkh
am
Yor
k S
outh
wes
t of 9
th L
ine
and
14t
h A
ve.
02H
C02
2 C
ity o
f To
ront
o 19
68-1
995,
200
6-20
09
27
5 58
R
ouge
Riv
er
9700
7 R
G00
7WM
/060
0970
0702
/RL9
.0
4857
816
6443
00
Littl
e R
ouge
Cre
ek
Mar
kham
Y
ork
Sou
thw
est o
f 14t
h A
ve. a
nd R
eeso
r R
d.
C
ity o
f To
ront
o 19
72-1
974,
200
6-20
09
3 5
14

Approved January 18, 2012 B2-44
Approved Assessment Report: Toronto and Region Source Protection Area
SSuu
rr ffaa
ccee
WWaa
tt eerr
QQuu
aall ii
tt yyUU
ppdd
aatt ee
Oct
ob
er 2
009
App
endi
x B
Wat
ersh
ed
Sta
tion
Alte
rnat
e N
ame
No
rth
ing
E
astin
g
Sub
wat
ersh
ed
Tow
nsh
ip
Mun
icip
ality
Lo
catio
n D
escr
iptio
n F
low
S
tatio
n P
rop
riet
or
Per
iod
of
Rec
ord
Lo
nges
t C
on
tinuo
us
Rec
ord
(A
pp
rox.
Y
ears
)1
Str
eam
O
rder
2
% U
rban
La
nd
Co
ver3
9701
3 06
0097
0130
2/R
4.2
4852
830
6482
43
Littl
e R
ouge
Cre
ek
Toro
nto
Toro
nto
Eas
t of T
wyn
Riv
ers
Dr.
City
of
Toro
nto
1973
-199
7, 2
001-
2009
24
5
16
9701
1 06
0097
0110
2/R
L4.1
48
5251
1 64
8007
Lo
wer
Rou
ge C
reek
To
ront
o To
ront
o S
outh
east
of T
wyn
Riv
ers
Dr.
and
S
hepp
ard
Ave
. 02
HC
103
PW
QM
N
1973
-199
6, 2
001-
2009
23
5
(mou
th)
61
9701
8 06
0097
0180
2/R
B20
.1
4861
770
6346
80
Bru
ce C
reek
M
arkh
am
Yor
k N
orth
wes
t of M
ajor
Mac
kenz
ie D
r.
and
Ken
nedy
Rd
.
PW
QM
N
2002
-200
9 7
3 5
9777
7 97
777/
R18
.4
4856
823
6342
14
Mid
dle
Rou
ge/B
eave
r M
arkh
am
Yor
k N
orth
wes
t of H
wy
407
and
War
den
Ave
.
RW
MP
20
01-2
009
8 4
76
9799
9 97
999/
RL1
7.4
4863
887
6405
89
Littl
e R
ouge
Cre
ek
Mar
kham
Y
ork
Nor
thw
est o
f Maj
or M
acke
nzie
Rd
. an
d 9t
h Li
ne
R
WM
P
1972
-197
7, 2
001-
2009
2
5 14
1040
01
0601
0400
102/
Ann
adal
e G
olf
Cou
rse/
Du2
.4
4855
880
6575
79
Low
er M
ain
Duf
fins
Aja
x D
urha
m
Sou
thw
est o
f Bay
ly S
t. an
d W
estn
ey
Rd.
PW
QM
N
1964
-199
7, 2
002-
2009
33
6(
mou
th)
24
1040
08
0601
0400
802/
DuE
17.5
48
6929
9 65
0372
E
ast D
uffin
s C
reek
P
icke
ring
Dur
ham
N
orth
wes
t of B
rock
Rd
and
8th
C
once
ssio
n 02
HC
045
PW
QM
N
1972
-197
6, 1
988,
19
95-1
996,
200
2-20
09
7 3
6
1040
25
Bro
ck R
idge
/060
1040
2502
/DuW
5.3
4857
115
6546
56
Wes
t Duf
fins
Cre
ek
Pic
kerin
g D
urha
m
Wes
t of B
rock
Rd
and
Nor
th o
f Fin
ch
Ave
RW
MP
19
73-1
974,
199
5-19
96, 2
002-
2009
7
5 14
1040
27
Pau
lyn
Par
k/06
0104
0270
2/D
uE6.
8 48
5941
9 65
5458
E
ast D
uffin
s C
reek
A
jax
Dur
ham
N
orth
of R
ossl
and
Rd
and
Wes
t of
Chu
rch
St
R
WM
P
1973
-197
4, 1
995-
1996
, 200
2-20
09
7 4
6
1040
29
7th
Con
cess
ion/
0601
0402
902/
DuE
15.4
48
6815
8 65
3641
E
ast D
uffin
s C
reek
P
icke
ring
Dur
ham
N
orth
east
of 7
th C
once
ssio
n an
d S
idel
ine
12
R
WM
P
1973
-197
4, 1
995-
1996
, 200
2-20
09
7 3
5
Duf
fins
Cre
ek
1040
37
8th
Con
cess
ion/
0601
0403
702/
DuW
19.3
48
6646
2 64
4191
W
est D
uffin
s C
reek
P
icke
ring
Dur
ham
S
outh
east
of Y
ork-
Dur
ham
Lin
e an
d 8t
h C
once
ssio
n
RW
MP
19
73-1
974,
199
5, -
2002
-200
9 7
4 23
Car
ruth
ers
Cre
ek
1070
02
Sho
al P
oint
/060
1070
0202
/C2.
8 48
5697
2 66
0850
C
arru
ther
s C
reek
A
jax
Dur
ham
N
orth
wes
t of B
ayly
St.
and
Sho
al
Poi
nt R
d.
R
WM
P
2002
-200
9 7
4 (m
outh
) 98
Cur
rent
as
of D
ecem
ber
2009
. 1 A
t lea
st o
ne p
aram
eter
mea
sure
d pe
r ye
ar
2 Str
ahle
r st
ream
ord
er
3 Urb
an +
urb
aniz
ing
land
cov
er

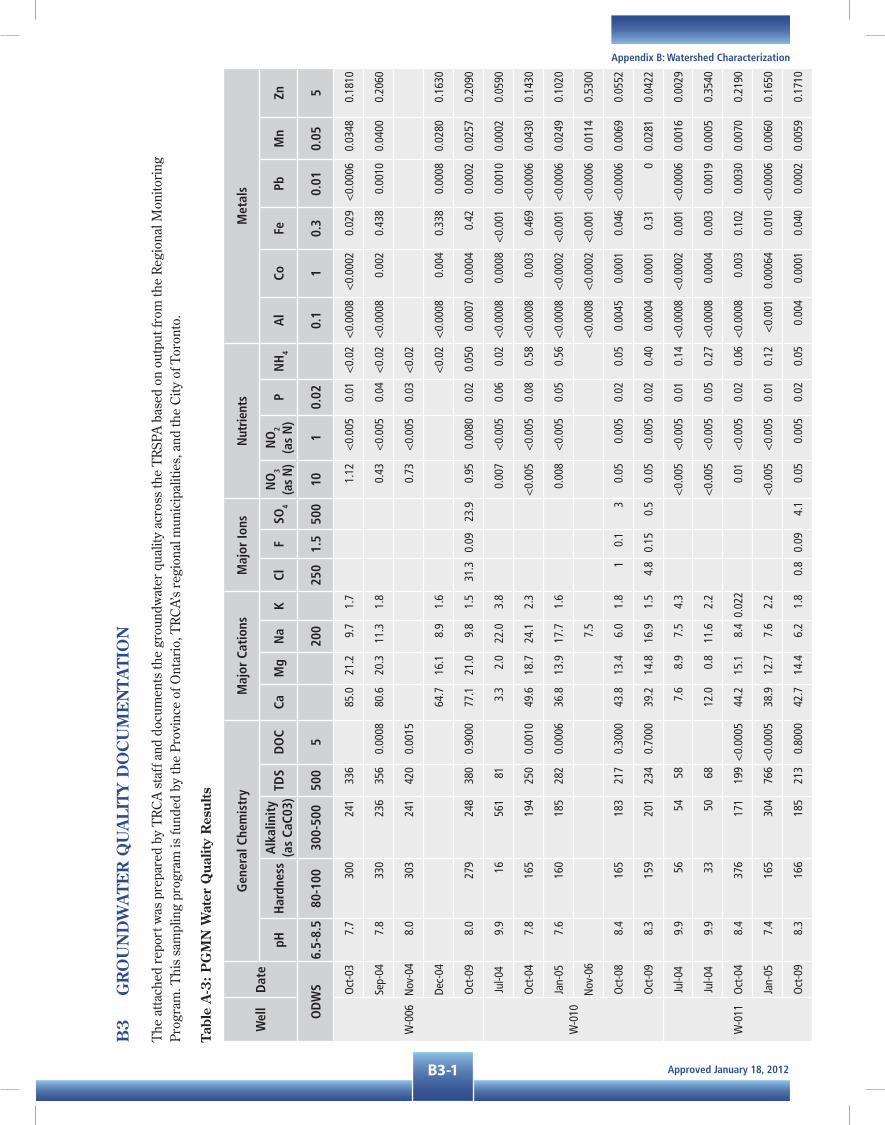
Approved January 18, 2012B3-1
Appendix B: Watershed Characterization
B3
G
RO
UN
DW
ATE
R Q
UA
LITY
DO
CU
ME
NTA
TIO
N
The
atta
ched
rep
ort w
as p
repa
red
by T
RC
A s
taff
and
doc
umen
ts th
e gr
ound
wat
er q
ualit
y ac
ross
the
TR
SPA
bas
ed o
n ou
tput
from
the
Reg
iona
l Mon
itori
ng
Prog
ram
. Thi
s sa
mpl
ing
prog
ram
is fu
nded
by
the
Prov
ince
of O
ntar
io, T
RC
A’s
regi
onal
mun
icip
aliti
es, a
nd th
e C
ity o
f Tor
onto
.
Tabl
e A
-3:
PG
MN
Wat
er Q
ualit
y R
esul
ts
Wel
lD
ate
Gen
eral
Che
mis
try
Maj
or C
atio
nsM
ajor
Ions
Nut
rient
sM
etal
s
pHH
ardn
ess
Alk
alin
ity
(as
CaC0
3)TD
SD
OC
CaM
gN
aK
ClF
SO4
NO
3
(as
N)
NO
2
(as
N)
PN
H4
Al
CoFe
PbM
nZn
OD
WS
6.5-
8.5
80-1
0030
0-50
050
05
200
250
1.5
500
101
0.02
0.1
10.
30.
010.
055
W-0
06
Oct
-03
7.7
300
241
336
85.0
21.2
9.7
1.7
1.12
<0.
005
0.01
<0.
02<
0.00
08<
0.00
020.
029
<0.
0006
0.03
480.
1810
Sep-
047.
833
023
635
60.
0008
80.6
20.3
11.3
1.8
0.43
<0.
005
0.04
<0.
02<
0.00
080.
002
0.43
80.
0010
0.04
000.
2060
Nov
-04
8.0
303
241
420
0.00
150.
73<
0.00
50.
03<
0.02
Dec-
0464
.716
.18.
91.
6<
0.02
<0.
0008
0.00
40.
338
0.00
080.
0280
0.16
30
Oct
-09
8.0
279
248
380
0.90
0077
.121
.09.
81.
531
.30.
0923
.90.
950.
0080
0.02
0.05
00.
0007
0.00
040.
420.
0002
0.02
570.
2090
W-0
10
Jul-0
49.
916
561
813.
32.
022
.03.
80.
007
<0.
005
0.06
0.02
<0.
0008
0.00
08<
0.00
10.
0010
0.00
020.
0590
Oct
-04
7.8
165
194
250
0.00
1049
.618
.724
.12.
3<
0.00
5<
0.00
50.
080.
58<
0.00
080.
003
0.46
9<
0.00
060.
0430
0.14
30
Jan-
057.
616
018
528
20.
0006
36.8
13.9
17.7
1.6
0.00
8<
0.00
50.
050.
56<
0.00
08<
0.00
02<
0.00
1<
0.00
060.
0249
0.10
20
Nov
-06
7.5
<0.
0008
<0.
0002
<0.
001
<0.
0006
0.01
140.
5300
Oct
-08
8.4
165
183
217
0.30
0043
.813
.46.
01.
81
0.1
30.
050.
005
0.02
0.05
0.00
450.
0001
0.04
6<
0.00
060.
0069
0.05
52
Oct
-09
8.3
159
201
234
0.70
0039
.214
.816
.91.
54.
80.
150.
50.
050.
005
0.02
0.40
0.00
040.
0001
0.31
00.
0281
0.04
22
W-0
11
Jul-0
49.
956
5458
7.6
8.9
7.5
4.3
<0.
005
<0.
005
0.01
0.14
<0.
0008
<0.
0002
0.00
1<
0.00
060.
0016
0.00
29
Jul-0
49.
933
5068
12.0
0.8
11.6
2.2
<0.
005
<0.
005
0.05
0.27
<0.
0008
0.00
040.
003
0.00
190.
0005
0.35
40
Oct
-04
8.4
376
171
199
<0.
0005
44.2
15.1
8.4
0.02
20.
01<
0.00
50.
020.
06<
0.00
080.
003
0.10
20.
0030
0.00
700.
2190
Jan-
057.
416
530
476
6<
0.00
0538
.912
.77.
62.
2<
0.00
5<
0.00
50.
010.
12<
0.00
10.
0006
40.
010
<0.
0006
0.00
600.
1650
Oct
-09
8.3
166
185
213
0.80
0042
.714
.46.
21.
80.
80.
094.
10.
050.
005
0.02
0.05
0.00
40.
0001
0.04
00.
0002
0.00
590.
1710
PGMN Water Quality Results

Approved January 18, 2012 B3-2
Approved Assessment Report: Toronto and Region Source Protection Area
Wel
lD
ate
Gen
eral
Che
mis
try
Maj
or C
atio
nsM
ajor
Ions
Nut
rient
sM
etal
s
pHH
ardn
ess
Alk
alin
ity
(as
CaC0
3)TD
SD
OC
CaM
gN
aK
ClF
SO4
NO
3
(as
N)
NO
2
(as
N)
PN
H4
Al
CoFe
PbM
nZn
OD
WS
6.5-
8.5
80-1
0030
0-50
050
05
200
250
1.5
500
101
0.02
0.1
10.
30.
010.
055
W-0
12
Oct
-03
9.4
43.5
51.4
981.
2000
13.6
2.4
12.8
1.8
6.9
0.15
17.6
0.05
0.01
0.51
0.36
0.01
120.
0014
0.00
90.
0025
0.00
030.
2130
Oct
-04
9.4
158
42.5
89<
0.00
0515
.32.
614
.62.
00.
01<
0.00
50.
020.
32<
0.00
080.
0020
0.10
20.
0030
0.00
300.
7000
Jan-
059.
440
.147
.812
10.
0006
13.2
2.6
12.6
1.7
<0.
005
<0.
005
0.03
0.33
<0.
001
<0.
0002
<0.
001
<0.
0006
0.00
040.
0750
Nov
-09
9.3
45.2
49.2
104
1.00
0012
.53.
411
.51.
54.
10.
128
.60.
050.
005
0.02
0.05
0.00
530.
0001
00.
0026
0.00
070.
0701
W-0
17
Jun-
047.
729
331
835
079
.722
.919
.31.
8<
0.00
5<
0.00
50.
202.
3<
0.00
08<
0.00
020.
007
<0.
0006
0.09
670.
0019
Oct
-04
7.5
275
302
464
0.00
2972
.422
.425
.52.
5<
0.00
5<
0.00
50.
192.
0<
0.00
080.
0009
3.05
70.
0010
0.09
700.
0070
Dec-
047.
766
.488
.415
00.
0023
19.1
5.0
24.2
6.9
<0.
005
<0.
005
0.02
1.0
<0.
0008
0.00
4<
0.00
1<
0.00
060.
0560
0.00
10
W-0
21
Jun-
047.
342
230
651
862
.021
.314
.12.
00.
09<
0.00
5<
0.01
0.33
<0.
0008
<0.
0002
0.00
8<
0.00
060.
5240
0.00
17
Oct
-04
7.2
438
207
624
0.00
1510
2.6
33.4
27.8
3.5
0.03
<0.
005
0.03
0.20
<0.
0008
0.00
207.
937
<0.
0006
0.38
100.
0400
Jan-
058.
546
616
623
90.
0005
82.3
27.1
20.7
3.0
0.01
<0.
005
0.01
0.23
<0.
001
0.00
040.
130
<0.
0006
0.38
100.
0030
Oct
-09
7.7
471
331
728
1.40
0012
2.0
40.4
13.4
2.5
82.8
0.08
13.4
0.05
0.00
500.
020.
250.
0002
0.00
1214
.800
00.
3930
0.00
12
W-0
59
Apr-0
323
825
30.
6000
78.8
10.0
3.4
0.7
3.7
0.05
25.7
0.72
0.00
50.
020.
050.
0004
0.00
030.
013
0.00
001
0.00
360.
0017
Jun-
047.
930
921
529
096
.316
.77.
91.
30.
85<
0.00
50.
03<
0.02
<0.
0008
<0.
0002
0.00
7<
0.00
060.
0010
0.00
20
Sep-
047.
925
720
438
30.
0007
83.5
11.8
5.2
0.9
0.39
<0.
005
0.03
<0.
02<
0.00
080.
002
0.18
90.
0010
0.00
400.
0240
Dec-
048.
223
320
832
10.
0010
75.9
10.7
3.6
0.9
0.76
<0.
005
0.02
<0.
02<
0.00
080.
002
0.10
70.
0007
0.00
300.
0090
Oct
-09
8.2
241
227
293
0.50
0080
.49.
84.
50.
65.
30.
0519
.80.
630.
005
0.03
0.05
00.
0003
0.00
020
0.00
000.
0002
0.00
06

Approved January 18, 2012B3-3
Appendix B: Watershed Characterization
Wel
lD
ate
Gen
eral
Che
mis
try
Maj
or C
atio
nsM
ajor
Ions
Nut
rient
sM
etal
s
pHH
ardn
ess
Alk
alin
ity
(as
CaC0
3)TD
SD
OC
CaM
gN
aK
ClF
SO4
NO
3
(as
N)
NO
2
(as
N)
PN
H4
Al
CoFe
PbM
nZn
OD
WS
6.5-
8.5
80-1
0030
0-50
050
05
200
250
1.5
500
101
0.02
0.1
10.
30.
010.
055
W-0
60
Sep-
038.
226
925
334
40.
9000
4.6
70.
0840
.20.
050.
005
0.07
<0.
050
0.00
050.
0002
0.89
0.00
001
0.02
260.
0016
Jun-
047.
426
929
933
061
.125
.911
.11.
5<
0.00
5<
0.00
50.
463.
00.
0008
0.00
020.
006
0.00
060.
1080
0.00
04
Oct
-04
7.6
300
262
383
0.00
196.
30.
01<
0.00
50.
06<
0.02
<0.
0008
0.00
300.
919
0.00
100.
0300
0.00
60
Jan-
057.
629
924
734
6<
0.
0005
74.5
18.5
5.9
1.6
0.01
0.00
50.
01<
0.02
< 0
.001
0.00
09<
0.0
01<
0.00
060.
0260
0.00
07
Sep-
088.
325
226
235
81.
4067
.520
.35.
41.
38.
90.
0749
.50.
050.
005
0.02
0.05
0.00
020.
0003
1.08
<0.
0006
0.02
290.
0004
Nov
-09
8.2
307
265
355
1.10
89.5
20.3
5.5
1.3
8.9
0.08
40.8
0.05
0.00
50.
020.
180.
0003
0.00
020.
940
0.02
210.
0005
W-0
61
Apr-0
38.
326
530
632
12.
5061
.826
.811
.011
.03.
70.
150.
50.
045
0.00
50.
542.
40.
0018
0.00
021.
63<
0.00
060.
1320
0.00
18
Jun-
047.
528
625
534
182
.419
.44.
11.
0<
0.00
5<
0.00
50.
06<
0.02
0.00
08<
0.00
02<
0.00
10.
0007
0.01
320.
0004
Oct
-04
7.6
279
291
356
0.00
3012
.2<
0.00
5<
0.00
50.
592.
6<
0.00
080.
0020
1.33
0.00
20.
1390
0.00
50
Dec-
047.
647
727
811
52<
0.
0005
11.3
<0.
005
<0.
005
0.58
<0.
0008
0.00
040.
028
<0.
0006
0.11
200.
0020
Jan-
057.
627
929
036
30.
0016
55.5
22.7
13.5
2.0
0.01
<0.
005
0.58
2.5
< 0
.001
0.00
050.
003
<0.
0006
0.14
100.
0002
Sep-
088.
227
031
734
83.
5064
.226
.611
.01.
61.
30.
050.
50.
050.
005
1.37
3.6
0.00
050.
0003
1.91
<0.
0006
0.10
700.
0007
Nov
-09
8.2
275
316
345
3.00
66.3
26.7
10.8
1.7
1.5
0.11
0.5
0.05
0.00
60.
963.
20.
0009
0.00
021.
390
0.09
920.
0005
W-0
75
Jun-
037.
931
728
649
51.
0097
.218
.145
.61.
880
.20.
1545
.80.
590.
005
18.7
0.07
0.02
550.
0014
0.03
20.
0002
0.0
016
0.00
46
Dec-
047.
636
728
158
396
.820
.653
.44.
11.
1<
0.00
50.
02<
0.02
<0.
0008
0.00
10<
0.0
01<
0.00
060.
0030
0.00
20
Nov
-09
7.9
380
291
637
1.10
117.
021
.757
.02.
812
20.
0937
.70.
980.
005
0.02
0.05
0.00
070.
0003
00
0.00
030.
0081
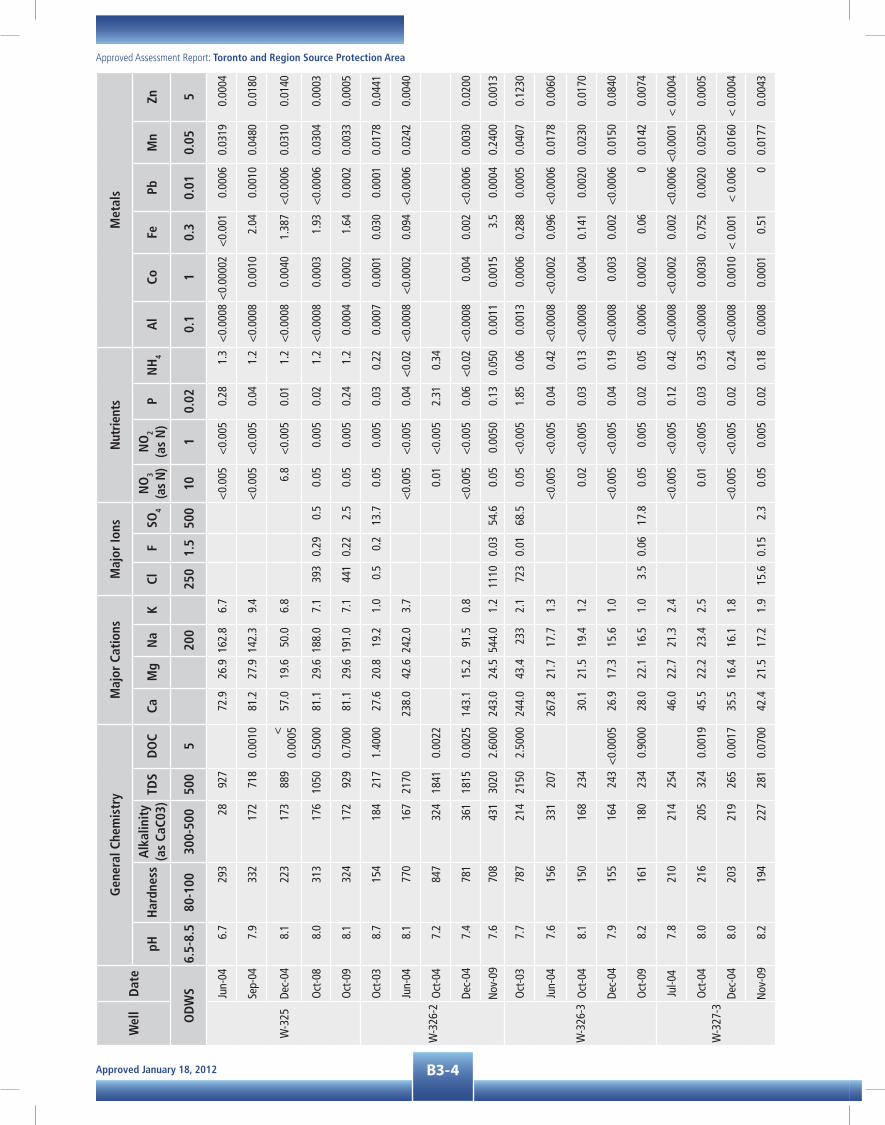
Approved January 18, 2012 B3-4
Approved Assessment Report: Toronto and Region Source Protection Area
Wel
lD
ate
Gen
eral
Che
mis
try
Maj
or C
atio
nsM
ajor
Ions
Nut
rient
sM
etal
s
pHH
ardn
ess
Alk
alin
ity
(as
CaC0
3)TD
SD
OC
CaM
gN
aK
ClF
SO4
NO
3
(as
N)
NO
2
(as
N)
PN
H4
Al
CoFe
PbM
nZn
OD
WS
6.5-
8.5
80-1
0030
0-50
050
05
200
250
1.5
500
101
0.02
0.1
10.
30.
010.
055
W-3
25
Jun-
046.
729
328
927
72.9
26.9
162.
86.
7<
0.00
5<
0.00
50.
281.
3<
0.00
08<
0.00
002
<0.
001
0.00
060.
0319
0.00
04
Sep-
047.
933
217
271
80.
0010
81.2
27.9
142.
39.
4<
0.00
5<
0.00
50.
041.
2<
0.00
080.
0010
2.04
0.00
100.
0480
0.01
80
Dec-
048.
122
317
388
9<
0.
0005
57.0
19.6
50.0
6.8
6.8
<0.
005
0.01
1.2
<0.
0008
0.00
401.
387
<0.
0006
0.03
100.
0140
Oct
-08
8.0
313
176
1050
0.50
0081
.129
.618
8.0
7.1
393
0.29
0.5
0.05
0.00
50.
021.
2<
0.00
080.
0003
1.93
<0.
0006
0.03
040.
0003
Oct
-09
8.1
324
172
929
0.70
0081
.129
.619
1.0
7.1
441
0.22
2.5
0.05
0.00
50.
241.
20.
0004
0.00
021.
640.
0002
0.00
330.
0005
W-3
26-2
Oct
-03
8.7
154
184
217
1.40
0027
.620
.819
.21.
00.
50.
213
.70.
050.
005
0.03
0.22
0.00
070.
0001
0.03
00.
0001
0.01
780.
0441
Jun-
048.
177
016
721
7023
8.0
42.6
242.
03.
7<
0.00
5<
0.00
50.
04<
0.02
<0.
0008
<0.
0002
0.09
4<
0.00
060.
0242
0.00
40
Oct
-04
7.2
847
324
1841
0.00
220.
01<
0.00
52.
310.
34
Dec-
047.
478
136
118
150.
0025
143.
115
.291
.50.
8<
0.00
5<
0.00
50.
06<
0.02
<0.
0008
0.00
40.
002
<0.
0006
0.00
300.
0200
Nov
-09
7.6
708
431
3020
2.60
0024
3.0
24.5
544.
01.
211
100.
0354
.60.
050.
0050
0.13
0.05
00.
0011
0.00
153.
50.
0004
0.24
000.
0013
W-3
26-3
Oct
-03
7.7
787
214
2150
2.50
0024
4.0
43.4
233
2.1
723
0.01
68.5
0.05
<0.
005
1.85
0.06
0.00
130.
0006
0.28
80.
0005
0.04
070.
1230
Jun-
047.
615
633
120
726
7.8
21.7
17.7
1.3
<0.
005
<0.
005
0.04
0.42
<0.
0008
<0.
0002
0.09
6<
0.00
060.
0178
0.00
60
Oct
-04
8.1
150
168
234
30.1
21.5
19.4
1.2
0.02
<0.
005
0.03
0.13
<0.
0008
0.00
40.
141
0.00
200.
0230
0.01
70
Dec-
047.
915
516
424
3<
0.00
0526
.917
.315
.61.
0<
0.00
5<
0.00
50.
040.
19<
0.00
080.
003
0.00
2<
0.00
060.
0150
0.08
40
Oct
-09
8.2
161
180
234
0.90
0028
.022
.116
.51.
03.
50.
0617
.80.
050.
005
0.02
0.05
0.00
060.
0002
0.06
00.
0142
0.00
74
W-3
27-3
Jul-0
47.
821
021
425
446
.022
.721
.32.
4<
0.00
5<
0.00
50.
120.
42<
0.00
08<
0.00
020.
002
<0.
0006
<0.
0001
< 0
.000
4
Oct
-04
8.0
216
205
324
0.00
1945
.522
.223
.42.
50.
01<
0.00
50.
030.
35<
0.00
080.
0030
0.75
20.
0020
0.02
500.
0005
Dec-
048.
020
321
926
50.
0017
35.5
16.4
16.1
1.8
<0.
005
<0.
005
0.02
0.24
<0.
0008
0.00
10<
0.0
01<
0.0
060.
0160
< 0
.000
4
Nov
-09
8.2
194
227
281
0.07
0042
.421
.517
.21.
915
.60.
152.
30.
050.
005
0.02
0.18
0.00
080.
0001
0.51
00.
0177
0.00
43
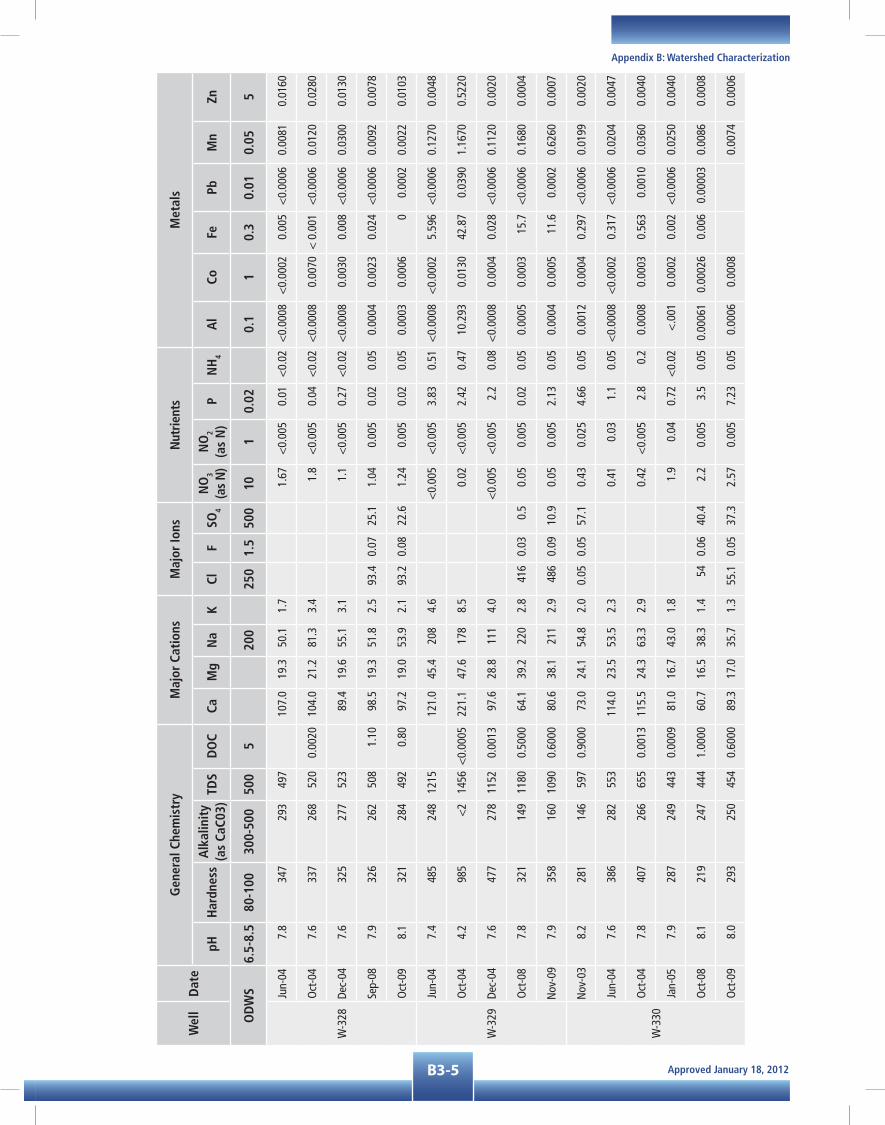
Approved January 18, 2012B3-5
Appendix B: Watershed Characterization
Wel
lD
ate
Gen
eral
Che
mis
try
Maj
or C
atio
nsM
ajor
Ions
Nut
rient
sM
etal
s
pHH
ardn
ess
Alk
alin
ity
(as
CaC0
3)TD
SD
OC
CaM
gN
aK
ClF
SO4
NO
3
(as
N)
NO
2
(as
N)
PN
H4
Al
CoFe
PbM
nZn
OD
WS
6.5-
8.5
80-1
0030
0-50
050
05
200
250
1.5
500
101
0.02
0.1
10.
30.
010.
055
W-3
28
Jun-
047.
834
729
349
710
7.0
19.3
50.1
1.7
1.67
<0.
005
0.01
<0.
02<
0.00
08<
0.00
020.
005
<0.
0006
0.00
810.
0160
Oct
-04
7.6
337
268
520
0.00
2010
4.0
21.2
81.3
3.4
1.8
<0.
005
0.04
<0.
02<
0.00
080.
0070
< 0
.001
<0.
0006
0.01
200.
0280
Dec-
047.
632
527
752
389
.419
.655
.13.
11.
1<
0.00
50.
27<
0.02
<0.
0008
0.00
300.
008
<0.
0006
0.03
000.
0130
Sep-
087.
932
626
250
81.
1098
.519
.351
.82.
593
.40.
0725
.11.
040.
005
0.02
0.05
0.00
040.
0023
0.02
4<
0.00
060.
0092
0.00
78
Oct
-09
8.1
321
284
492
0.80
97.2
19.0
53.9
2.1
93.2
0.08
22.6
1.24
0.00
50.
020.
050.
0003
0.00
060
0.00
020.
0022
0.01
03
W-3
29
Jun-
047.
448
524
812
1512
1.0
45.4
208
4.6
<0.
005
<0.
005
3.83
0.51
<0.
0008
<0.
0002
5.59
6<
0.00
060.
1270
0.00
48
Oct
-04
4.2
985
<2
1456
<0.
0005
221.
147
.617
88.
50.
02<
0.00
52.
420.
4710
.293
0.01
3042
.87
0.03
901.
1670
0.52
20
Dec-
047.
647
727
811
520.
0013
97.6
28.8
111
4.0
<0.
005
<0.
005
2.2
0.08
<0.
0008
0.00
040.
028
<0.
0006
0.11
200.
0020
Oct
-08
7.8
321
149
1180
0.50
0064
.139
.222
02.
841
60.
030.
50.
050.
005
0.02
0.05
0.00
050.
0003
15.7
<0.
0006
0.16
800.
0004
Nov
-09
7.9
358
160
1090
0.60
0080
.638
.121
12.
948
60.
0910
.90.
050.
005
2.13
0.05
0.00
040.
0005
11.6
0.00
020.
6260
0.00
07
W-3
30
Nov
-03
8.2
281
146
597
0.90
0073
.024
.154
.82.
00.
050.
0557
.10.
430.
025
4.66
0.05
0.00
120.
0004
0.29
7<
0.00
060.
0199
0.00
20
Jun-
047.
638
628
255
311
4.0
23.5
53.5
2.3
0.41
0.03
1.1
0.05
<0.
0008
<0.
0002
0.31
7<
0.00
060.
0204
0.00
47
Oct
-04
7.8
407
266
655
0.00
1311
5.5
24.3
63.3
2.9
0.42
<0.
005
2.8
0.2
0.00
080.
0003
0.56
30.
0010
0.03
600.
0040
Jan-
057.
928
724
944
30.
0009
81.0
16.7
43.0
1.8
1.9
0.04
0.72
<0.
02<
.001
0.00
020.
002
<0.
0006
0.02
500.
0040
Oct
-08
8.1
219
247
444
1.00
0060
.716
.538
.31.
454
0.06
40.4
2.2
0.00
53.
50.
050.
0006
10.
0002
60.
006
0.00
003
0.00
860.
0008
Oct
-09
8.0
293
250
454
0.60
0089
.317
.035
.71.
355
.10.
0537
.32.
570.
005
7.23
0.05
0.00
060.
0008
0.00
740.
0006

Approved January 18, 2012 B3-6
Approved Assessment Report: Toronto and Region Source Protection Area
Wel
lD
ate
Gen
eral
Che
mis
try
Maj
or C
atio
nsM
ajor
Ions
Nut
rient
sM
etal
s
pHH
ardn
ess
Alk
alin
ity
(as
CaC0
3)TD
SD
OC
CaM
gN
aK
ClF
SO4
NO
3
(as
N)
NO
2
(as
N)
PN
H4
Al
CoFe
PbM
nZn
OD
WS
6.5-
8.5
80-1
0030
0-50
050
05
200
250
1.5
500
101
0.02
0.1
10.
30.
010.
055
W-3
66
Nov
-03
7.8
246
360
648
1.40
0053
.427
.213
.81.
428
.10.
0910
60.
005
0.00
50.
020.
130.
0016
0.00
060.
050
0.00
006
0.71
700.
0183
Jun-
047.
452
834
268
816
2.0
29.2
18.0
1.7
0.05
9<
0.00
5<
0.01
0.24
<0.
0008
<0.
0002
0.00
2<
0.00
060.
5240
0.01
10
Oct
-04
7.4
803
426
1175
0.00
0918
1.3
40.8
20.7
4.1
0.09
<0.
005
0.04
0.03
<0.
0008
0.00
800.
144
0.00
200.
7610
0.07
50
Dec-
047.
061
838
985
50.
0009
86.1
25.0
11.9
2.5
0.01
<0.
005
0.02
0.07
<0.
001
0.00
700.
006
<0.
0006
0.38
100.
0160
Oct
-08
7.7
386
315
483
0.90
0012
0.0
21.0
18.9
1.3
40.8
0.12
66.7
0.05
0.00
50.
020.
150.
0001
0.00
060.
051
<0.
0006
0.40
200.
0016
Oct
-09
7.8
380
313
512
1.30
0012
0.0
19.5
20.3
1.2
44.2
0.09
59.1
0.05
0.00
50.
020.
320.
0003
0.00
080.
020.
0001
0.45
100.
0022
W-3
67
Jun-
047.
519
723
239
928
.830
.491
.37.
81.
02<
0.00
50.
02<
0.02
<0.
0008
<0.
0002
0.01
4<
0.00
060.
0101
0.01
00
Oct
-04
8.0
122
229
437
0.00
1733
.629
.178
.09.
80.
01<
0.00
50.
03<
0.02
<0.
0008
0.00
900.
034
0.00
060.
0090
0.02
70
Dec-
047.
821
023
348
90.
0013
21.9
19.5
78.0
6.5
0.64
<0.
005
0.03
<0.
02<
0.00
080.
0090
0.03
4<
0.00
06<
0.00
010.
0290
Oct
-08
8.4
450
613
1.40
0.3
90.5
0.46
0.00
50.
020.
050.
0006
0.00
350.
018
0.00
005
0.00
140.
0237
Nov
-09
8.1
448
463
553
1.50
75.9
62.9
34.0
4.3
7.6
0.21
66.4
0.58
0.00
50.
020.
050.
0005
0.00
030.
020
0.00
260.
0038
W-3
82O
ct-0
88.
036
311
100.
0864
.87.
260.
005
0.02
0.05
0.00
050.
0003
10.
006
0.00
001
0.00
010.
0015
Oct
-09
8.0
536
174
1030
0.50
0015
5.0
36.1
67.6
1.8
260
0.06
58.2
7.11
0.00
50.
020.
060
0.00
040.
0003
00.
0002
0.00
010.
0008
Not
es:
OD
WS
- Ont
ario
Dri
nkin
g W
ater
Sta
ndar
ds

Approved January 18, 2012B4-1
Appendix B: Watershed Characterization
B4 MUNICIPAL WATER QUALITY DOCUMENTATION
The four regional municipalities that provide drinking water across the TRSPA provide annual documentation on water quality for their respective intakes. The most recent reports available are provided on the following pages.
Drinking-Water Systems Regulation O. Reg. 170/03
Drinking-Water Systems Regulations (PIBS 4435e01) February 2008
Page 1 of 6
OPTIONAL ANNUAL REPORT TEMPLATE
Drinking-Water System Number: 220002360Drinking-Water System Name: Kleinburg Water Supply System Drinking-Water System Owner: Regional Municipality of York Drinking-Water System Category: Large Municipal Residential Period being reported: January 1, 2009 to December 31, 2009
Complete if your Category is Large Municipal Residential or Small Municipal Residential
Does your Drinking-Water System serve more than 10,000 people? Yes [ ] No [X]
Is your annual report available to the public at no charge on a web site on the Internet? Yes [X] No [ ]
Location where Summary Report required under O. Reg. 170/03 Schedule 22 will be available for inspection.
Complete for all other Categories.
Number of Designated Facilities served:
Did you provide a copy of your annual report to all Designated Facilities you serve?Yes [ ] No [ ]
Number of Interested Authorities you report to:
Did you provide a copy of your annual report to all Interested Authorities you report to for each Designated Facility? Yes [ ] No [ ]
Note: For the following tables below, additional rows or columns may be added or an appendix may be attached to the report
List all Drinking-Water Systems (if any), which receive all of their drinking water from your system: Drinking Water System Name Drinking Water System Number Kleinburg Distribution System 260006607
Did you provide a copy of your annual report to all Drinking-Water System owners that are connected to you and to whom you provide all of its drinking water? Yes [X] No [ ]
Regional Municipality of York Administrative Building Environmental Services Department 17250 Yonge Street Newmarket, Ontario
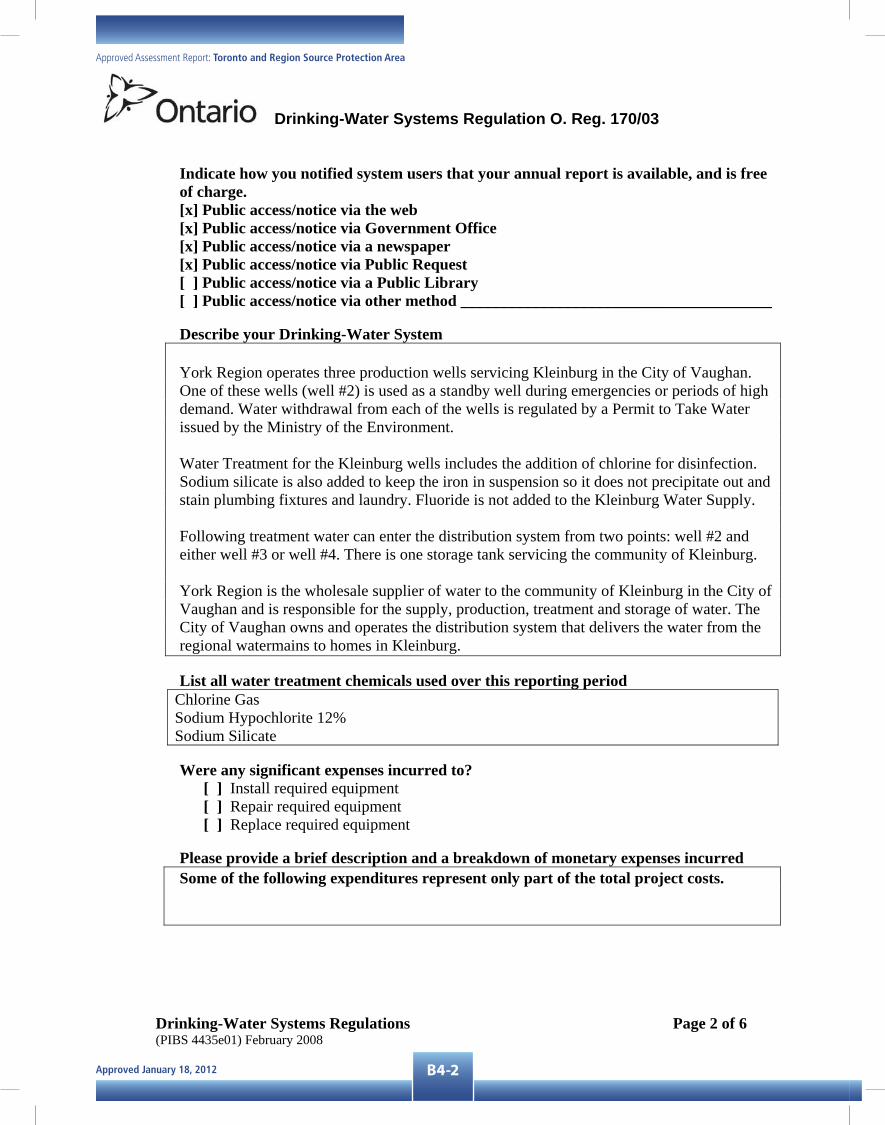
Approved January 18, 2012 B4-2
Approved Assessment Report: Toronto and Region Source Protection Area
Drinking-Water Systems Regulation O. Reg. 170/03
Drinking-Water Systems Regulations (PIBS 4435e01) February 2008
Page 2 of 6
Indicate how you notified system users that your annual report is available, and is free of charge. [x] Public access/notice via the web [x] Public access/notice via Government Office [x] Public access/notice via a newspaper [x] Public access/notice via Public Request [ ] Public access/notice via a Public Library[ ] Public access/notice via other method _______________________________________
Describe your Drinking-Water System
York Region operates three production wells servicing Kleinburg in the City of Vaughan. One of these wells (well #2) is used as a standby well during emergencies or periods of high demand. Water withdrawal from each of the wells is regulated by a Permit to Take Water issued by the Ministry of the Environment.
Water Treatment for the Kleinburg wells includes the addition of chlorine for disinfection. Sodium silicate is also added to keep the iron in suspension so it does not precipitate out and stain plumbing fixtures and laundry. Fluoride is not added to the Kleinburg Water Supply.
Following treatment water can enter the distribution system from two points: well #2 and either well #3 or well #4. There is one storage tank servicing the community of Kleinburg.
York Region is the wholesale supplier of water to the community of Kleinburg in the City of Vaughan and is responsible for the supply, production, treatment and storage of water. The City of Vaughan owns and operates the distribution system that delivers the water from the regional watermains to homes in Kleinburg.
List all water treatment chemicals used over this reporting period Chlorine Gas Sodium Hypochlorite 12% Sodium Silicate
Were any significant expenses incurred to? [ ] Install required equipment [ ] Repair required equipment [ ] Replace required equipment
Please provide a brief description and a breakdown of monetary expenses incurred Some of the following expenditures represent only part of the total project costs.

Approved January 18, 2012B4-3
Appendix B: Watershed Characterization
Drinking-Water Systems Regulation O. Reg. 170/03
Drinking-Water Systems Regulations (PIBS 4435e01) February 2008
Page 3 of 6
Provide details on the notices submitted in accordance with subsection 18(1) of the Safe Drinking-Water Act or section 16-4 of Schedule 16 of O.Reg.170/03 and reported to Spills Action Centre
IncidentDate
Parameter Result Unit of Measure
Corrective Action Corrective Action Date
Microbiological testing done under the Schedule 10, 11 or 12 of Regulation 170/03, during this reporting period.
Number of Samples
Range of E.Coli Or Fecal Results (min #)-(max #)
Range of Total Coliform Results(min #)-(max #)
Number of HPC Samples
Range of HPC Results(min #)-(max #)
Raw 151 0 0 Treated 97 0 0 97 1-29 Distribution
Operational testing done under Schedule 7, 8 or 9 of Regulation 170/03 during the period covered by this Annual Report.
Number of Grab Samples
Range of Results (min #)-(max #)
Turbidity(Treated)
8760 0.023 – 1.814
Turbidity (Raw) 24 0.147 – 19.6 Chlorine 8760 0.439 – 2.407 Fluoride (If the DWS provides fluoridation)
NOTE: Record the unit of measure if it is not milligrams per litre.
Summary of additional testing and sampling carried out in accordance with the requirement of an approval, order or other legal instrument.
Date of legal instrument issued
Parameter Date Sampled Result Unit of Measure
Summary of Inorganic parameters tested during this reporting period or the most recent sample results
NOTE: see attached results for Inorganic parameters.
NOTE: For continuous monitors use 8760 as the number of samples.

Approved January 18, 2012 B4-4
Approved Assessment Report: Toronto and Region Source Protection Area
Drinking-Water Systems Regulation O. Reg. 170/03
Drinking-Water Systems Regulations (PIBS 4435e01) February 2008
Page 4 of 6
Parameter Sample Date Result Value Unit of Measure Exceedance
Antimony Arsenic Barium Boron Cadmium Chromium Lead Mercury Selenium Sodium Uranium Fluoride Nitrite Nitrate
Summary of lead testing under Schedule 15.1 during this reporting period (applicable to the following drinking water systems; large municipal residential systems, smallmunicipal residential systems, and non-municipal year-round residential systems)
Location Type Number of Samples
Range of Lead Results
(min#) – (max #)
Number of Exceedances
Plumbing Distribution
Summary of Organic parameters sampled during this reporting period or the most recent sample results
NOTE: see attached results for Organic parameters (THM values in table below).
Parameter Sample Date
Result Value
Unit of Measure
Exceedance
Alachlor Aldicarb Aldrin + Dieldrin Atrazine + N-dealkylated metobolites Azinphos-methyl Bendiocarb Benzene Benzo(a)pyrene Bromoxynil

Approved January 18, 2012B4-5
Appendix B: Watershed Characterization
Drinking-Water Systems Regulation O. Reg. 170/03
Drinking-Water Systems Regulations (PIBS 4435e01) February 2008
Page 5 of 6
Carbaryl Carbofuran Carbon Tetrachloride Chlordane (Total) Chlorpyrifos Cyanazine Diazinon Dicamba 1,2-Dichlorobenzene 1,4-Dichlorobenzene Dichlorodiphenyltrichloroethane (DDT) + metabolites
1,2-Dichloroethane 1,1-Dichloroethylene (vinylidene chloride)
Dichloromethane 2-4 Dichlorophenol 2,4-Dichlorophenoxy acetic acid (2,4-D) Diclofop-methyl Dimethoate Dinoseb Diquat Diuron Glyphosate Heptachlor + Heptachlor Epoxide Lindane (Total) Malathion Methoxychlor Metolachlor Metribuzin Monochlorobenzene Paraquat Parathion Pentachlorophenol Phorate Picloram Polychlorinated Biphenyls(PCB) Prometryne Simazine THM(NOTE: show latest annual average)Well #2 Well #3,4
0.0150.011
Mg/LMg/L
Temephos
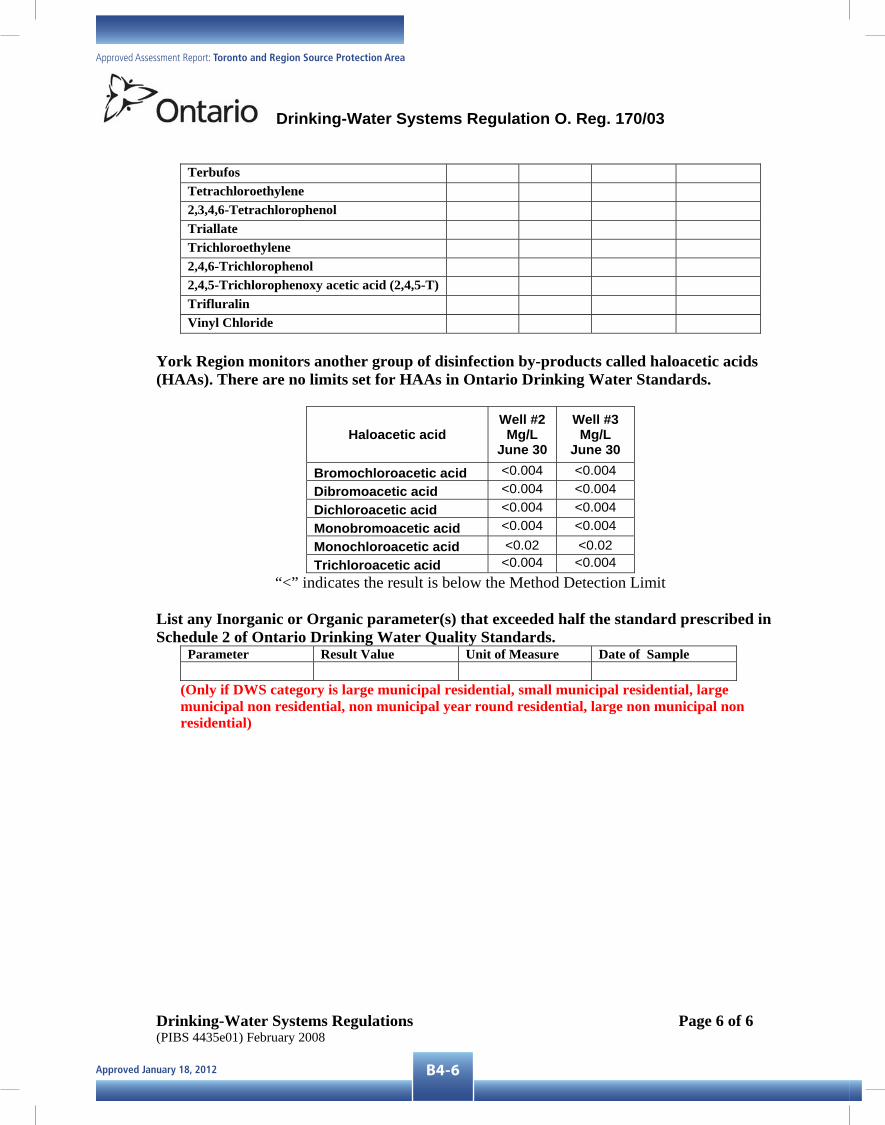
Approved January 18, 2012 B4-6
Approved Assessment Report: Toronto and Region Source Protection Area
Drinking-Water Systems Regulation O. Reg. 170/03
Drinking-Water Systems Regulations (PIBS 4435e01) February 2008
Page 6 of 6
Terbufos Tetrachloroethylene 2,3,4,6-Tetrachlorophenol Triallate Trichloroethylene 2,4,6-Trichlorophenol 2,4,5-Trichlorophenoxy acetic acid (2,4,5-T) Trifluralin Vinyl Chloride
York Region monitors another group of disinfection by-products called haloacetic acids (HAAs). There are no limits set for HAAs in Ontario Drinking Water Standards.
Haloacetic acid Well #2
Mg/LJune 30
Well #3 Mg/L
June 30
Bromochloroacetic acid <0.004 <0.004 Dibromoacetic acid <0.004 <0.004 Dichloroacetic acid <0.004 <0.004 Monobromoacetic acid <0.004 <0.004 Monochloroacetic acid <0.02 <0.02 Trichloroacetic acid <0.004 <0.004
“<” indicates the result is below the Method Detection Limit
List any Inorganic or Organic parameter(s) that exceeded half the standard prescribed in Schedule 2 of Ontario Drinking Water Quality Standards.
Parameter Result Value Unit of Measure Date of Sample
(Only if DWS category is large municipal residential, small municipal residential, large municipal non residential, non municipal year round residential, large non municipal non residential)
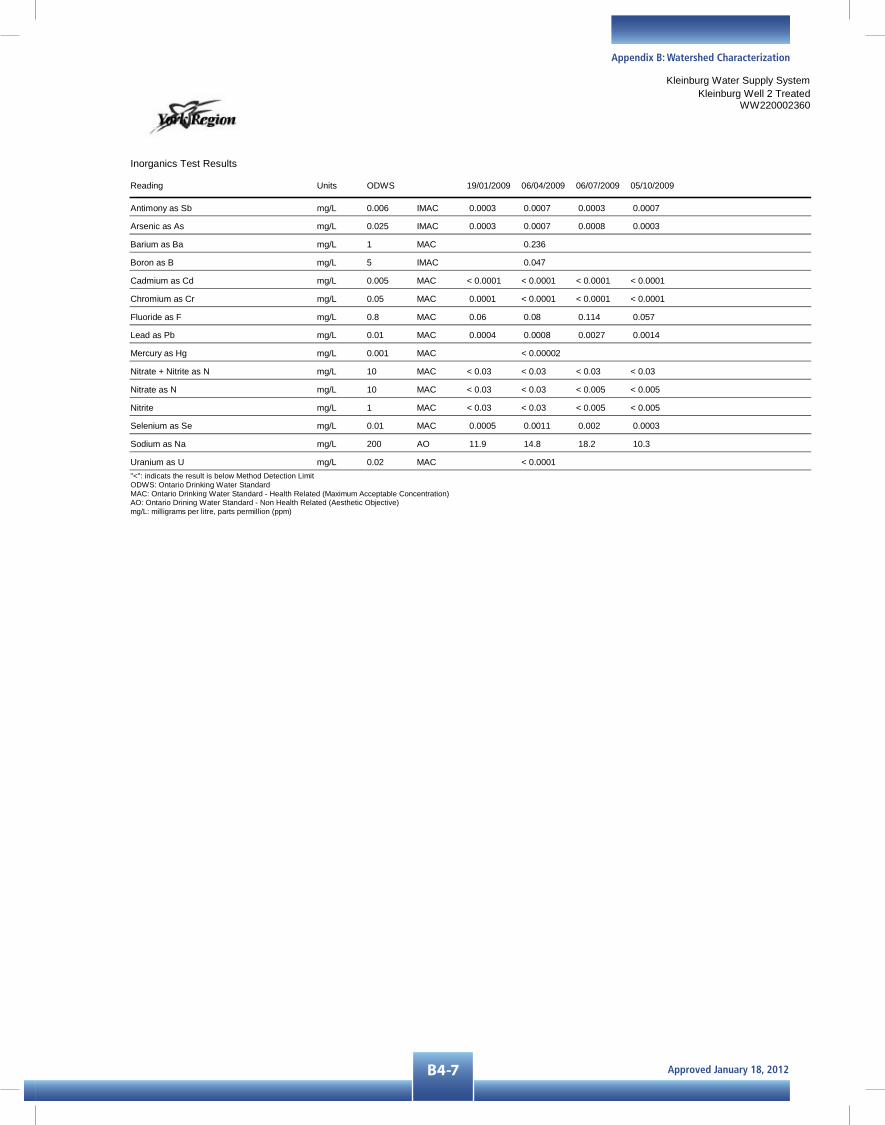
Approved January 18, 2012B4-7
Appendix B: Watershed Characterization
Kleinburg Water Supply System
Inorganics Test Results
Kleinburg Well 2 TreatedWW220002360
Reading Units ODWS 19/01/2009 06/04/2009 06/07/2009 05/10/2009
Antimony as Sb mg/L 0.006 IMAC 0.0003 0.0007 0.0003 0.0007
Arsenic as As mg/L 0.025 IMAC 0.0003 0.0007 0.0008 0.0003
Barium as Ba mg/L 1 MAC 0.236
Boron as B mg/L 5 IMAC 0.047
Cadmium as Cd mg/L 0.005 MAC < 0.0001 < 0.0001 < 0.0001 < 0.0001
Chromium as Cr mg/L 0.05 MAC 0.0001 < 0.0001 < 0.0001 < 0.0001
Fluoride as F mg/L 0.8 MAC 0.06 0.08 0.114 0.057
Lead as Pb mg/L 0.01 MAC 0.0004 0.0008 0.0027 0.0014
Mercury as Hg mg/L 0.001 MAC < 0.00002
Nitrate + Nitrite as N mg/L 10 MAC < 0.03 < 0.03 < 0.03 < 0.03
Nitrate as N mg/L 10 MAC < 0.03 < 0.03 < 0.005 < 0.005
Nitrite mg/L 1 MAC < 0.03 < 0.03 < 0.005 < 0.005
Selenium as Se mg/L 0.01 MAC 0.0005 0.0011 0.002 0.0003
Sodium as Na mg/L 200 AO 11.9 14.8 18.2 10.3
Uranium as U mg/L 0.02 MAC < 0.0001"<": indicats the result is below Method Detection LimitODWS: Ontario Drinking Water StandardMAC: Ontario Drinking Water Standard - Health Related (Maximum Acceptable Concentration)AO: Ontario Drining Water Standard - Non Health Related (Aesthetic Objective)mg/L: milligrams per litre, parts permillion (ppm)

Approved January 18, 2012 B4-8
Approved Assessment Report: Toronto and Region Source Protection Area
Kleinburg Water Supply System
Organics Test Results
Kleinburg Well 2 TreatedWW220002360
Reading Units ODWS 19/01/2009 06/04/2009 13/07/2009 05/10/2009
(DDT) + Metabolites mg/L 0.03 MAC < 0.000008
1,1-dichloroethylene (vinylidene chloride) mg/L 0.014 MAC < 0.0003 < 0.0003 < 0.0003 < 0.0003
1,2-(o-dcb) Dichlorobenzene mg/L 0.2 MAC < 0.0001 < 0.0001 < 0.0001 < 0.0001
1,2-Dichloroethane mg/L 0.005 IMAC < 0.0001 < 0.0001 < 0.0001 < 0.0001
1,4-(p-dcb) Dichlorobenzene mg/L 0.005 MAC < 0.0001 < 0.0001 < 0.0001 < 0.0001
2,3,4,6-Tetrachlorophenol mg/L 0.1 MAC < 0.0005
2,4,5-trichlorophenoxyacetic acid (2,4,5-T) mg/L 0.28 MAC < 0.0005
2,4,6-Trichlorophenol mg/L 0.005 MAC < 0.0005
2,4-Dichlorophenol mg/L 0.9 MAC < 0.0004
2,4-dichlorophenoxyacetic acid (2,4-D) mg/L 0.1 IMAC < 0.0008
Alachlor mg/L 0.005 IMAC < 0.0004
Aldicarb mg/L 0.009 MAC < 0.006
Aldrin + Dieldrin mg/L 0.0007 MAC < 0.000006
Atrazine + N-dealkylated metabolites mg/L 0.005 IMAC < 0.0002
Azinphos-methyl mg/L 0.02 MAC < 0.0003
Bendiocarb mg/L 0.04 MAC < 0.003
Benzene mg/L 0.005 MAC < 0.0001 < 0.0001 < 0.0001 < 0.0001
Benzo(a)pyrene mg/L 0.00001 MAC < 0.00001
Bromoxynil mg/L 0.005 IMAC < 0.0004
Carbaryl mg/L 0.09 MAC < 0.003
Carbofuran mg/L 0.09 MAC < 0.003
Carbon Tetrachloride mg/L 0.005 MAC < 0.0002 < 0.0002 < 0.0002 < 0.0002
Chlordane (Total) mg/L 0.007 MAC < 0.000006
Chlorpyrifos mg/L 0.09 MAC < 0.0002
Cyanazine mg/L 0.01 IMAC < 0.0003
Diazinon mg/L 0.02 MAC < 0.0002
Dicamba mg/L 0.12 MAC < 0.0004
Dichloromethane mg/L 0.05 MAC < 0.0005 < 0.0005 < 0.0005 < 0.0005
Diclofop-methyl mg/L 0.009 MAC < 0.0004
Dimethoate mg/L 0.02 IMAC < 0.0003
Dinoseb mg/L 0.01 MAC < 0.0005
Diquat mg/L 0.07 MAC < 0.0001
Diuron mg/L 0.15 MAC < 0.003
Glyphosate mg/L 0.28 IMAC < 0.025
Heptachlor + Heptachlor Epoxide mg/L 0.003 MAC < 0.000008
Lindane mg/L 0.004 MAC < 0.000005
Malathion mg/L 0.19 MAC < 0.0002
Methoxychlor mg/L 0.9 MAC < 0.000009
Metolachlor mg/L 0.05 IMAC < 0.0002
Metribuzin mg/L 0.08 MAC < 0.0003
Monochlorobenzene mg/L 0.08 MAC < 0.0001 < 0.0001 < 0.0001 < 0.0001
Paraquat mg/L 0.01 IMAC < 0.0001
Parathion mg/L 0.05 MAC < 0.0002
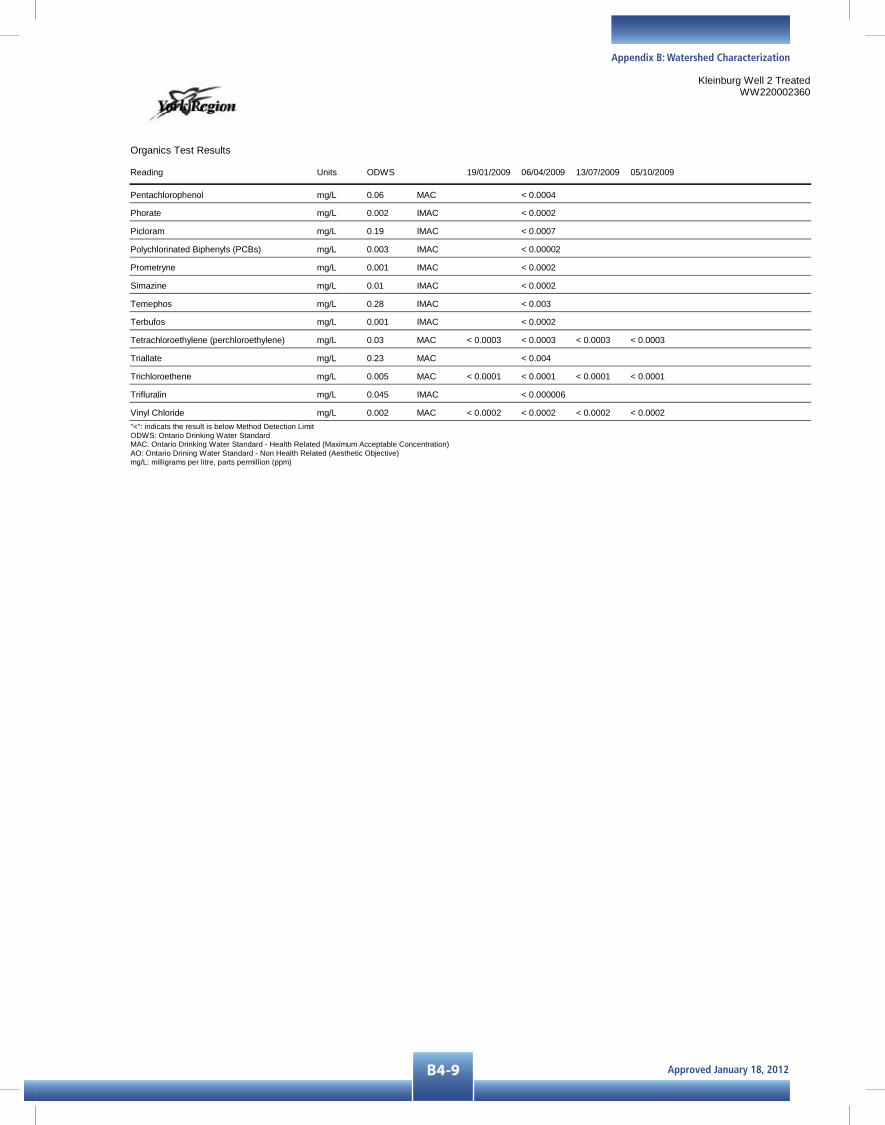
Approved January 18, 2012B4-9
Appendix B: Watershed Characterization
Organics Test Results
Kleinburg Well 2 TreatedWW220002360
Reading Units ODWS 19/01/2009 06/04/2009 13/07/2009 05/10/2009
Pentachlorophenol mg/L 0.06 MAC < 0.0004
Phorate mg/L 0.002 IMAC < 0.0002
Picloram mg/L 0.19 IMAC < 0.0007
Polychlorinated Biphenyls (PCBs) mg/L 0.003 IMAC < 0.00002
Prometryne mg/L 0.001 IMAC < 0.0002
Simazine mg/L 0.01 IMAC < 0.0002
Temephos mg/L 0.28 IMAC < 0.003
Terbufos mg/L 0.001 IMAC < 0.0002
Tetrachloroethylene (perchloroethylene) mg/L 0.03 MAC < 0.0003 < 0.0003 < 0.0003 < 0.0003
Triallate mg/L 0.23 MAC < 0.004
Trichloroethene mg/L 0.005 MAC < 0.0001 < 0.0001 < 0.0001 < 0.0001
Trifluralin mg/L 0.045 IMAC < 0.000006
Vinyl Chloride mg/L 0.002 MAC < 0.0002 < 0.0002 < 0.0002 < 0.0002"<": indicats the result is below Method Detection LimitODWS: Ontario Drinking Water StandardMAC: Ontario Drinking Water Standard - Health Related (Maximum Acceptable Concentration)AO: Ontario Drining Water Standard - Non Health Related (Aesthetic Objective)mg/L: milligrams per litre, parts permillion (ppm)

Approved January 18, 2012 B4-10
Approved Assessment Report: Toronto and Region Source Protection Area
Kleinburg Water Supply System
Inorganics Test Results
Kleinburg Well 3,4 TreatedWW220002360
Reading Units ODWS 19/01/2009 06/04/2009 06/07/2009 05/10/2009
Antimony as Sb mg/L 0.006 IMAC 0.0003 0.0004 0.0003 0.0008
Arsenic as As mg/L 0.025 IMAC 0.001 0.001 0.001 0.0008
Barium as Ba mg/L 1 MAC 0.341
Boron as B mg/L 5 IMAC 0.116
Cadmium as Cd mg/L 0.005 MAC < 0.0001 < 0.0001 < 0.0001 < 0.0001
Chromium as Cr mg/L 0.05 MAC 0.0001 < 0.0001 < 0.0001 < 0.0001
Fluoride as F mg/L 0.8 MAC 0.12 0.12 0.197 0.122
Lead as Pb mg/L 0.01 MAC < 0.0001 < 0.0001 < 0.0001 < 0.0001
Mercury as Hg mg/L 0.001 MAC < 0.00002
Nitrate + Nitrite as N mg/L 10 MAC < 0.03 < 0.03 < 0.03 < 0.03
Nitrate as N mg/L 10 MAC < 0.03 < 0.03 < 0.005 < 0.005
Nitrite mg/L 1 MAC < 0.03 < 0.03 < 0.005 < 0.005
Selenium as Se mg/L 0.01 MAC 0.0015 0.0019 0.0021 0.0015
Sodium as Na mg/L 200 AO 23.5 25.2 25.3 25.2
Uranium as U mg/L 0.02 MAC < 0.0001"<": indicats the result is below Method Detection LimitODWS: Ontario Drinking Water StandardMAC: Ontario Drinking Water Standard - Health Related (Maximum Acceptable Concentration)AO: Ontario Drining Water Standard - Non Health Related (Aesthetic Objective)mg/L: milligrams per litre, parts permillion (ppm)

Approved January 18, 2012B4-11
Appendix B: Watershed Characterization
Kleinburg Water Supply System
Organics Test Results
Kleinburg Well 3,4 TreatedWW220002360
Reading Units ODWS 19/01/2009 06/04/2009 13/07/2009 05/10/2009
(DDT) + Metabolites mg/L 0.03 MAC < 0.000008
1,1-dichloroethylene (vinylidene chloride) mg/L 0.014 MAC < 0.0003 < 0.0003 < 0.0003 < 0.0003
1,2-(o-dcb) Dichlorobenzene mg/L 0.2 MAC < 0.0001 < 0.0001 < 0.0001 < 0.0001
1,2-Dichloroethane mg/L 0.005 IMAC < 0.0001 < 0.0001 < 0.0001 < 0.0001
1,4-(p-dcb) Dichlorobenzene mg/L 0.005 MAC < 0.0001 < 0.0001 < 0.0001 < 0.0001
2,3,4,6-Tetrachlorophenol mg/L 0.1 MAC < 0.0005
2,4,5-trichlorophenoxyacetic acid (2,4,5-T) mg/L 0.28 MAC < 0.0005
2,4,6-Trichlorophenol mg/L 0.005 MAC < 0.0005
2,4-Dichlorophenol mg/L 0.9 MAC < 0.0004
2,4-dichlorophenoxyacetic acid (2,4-D) mg/L 0.1 IMAC < 0.0008
Alachlor mg/L 0.005 IMAC < 0.0004
Aldicarb mg/L 0.009 MAC < 0.006
Aldrin + Dieldrin mg/L 0.0007 MAC < 0.000006
Atrazine + N-dealkylated metabolites mg/L 0.005 IMAC < 0.0002
Azinphos-methyl mg/L 0.02 MAC < 0.0003
Bendiocarb mg/L 0.04 MAC < 0.003
Benzene mg/L 0.005 MAC < 0.0001 < 0.0001 < 0.0001 < 0.0001
Benzo(a)pyrene mg/L 0.00001 MAC < 0.00001
Bromoxynil mg/L 0.005 IMAC < 0.0004
Carbaryl mg/L 0.09 MAC < 0.003
Carbofuran mg/L 0.09 MAC < 0.003
Carbon Tetrachloride mg/L 0.005 MAC < 0.0002 < 0.0002 < 0.0002 < 0.0002
Chlordane (Total) mg/L 0.007 MAC < 0.000006
Chlorpyrifos mg/L 0.09 MAC < 0.0002
Cyanazine mg/L 0.01 IMAC < 0.0003
Diazinon mg/L 0.02 MAC < 0.0002
Dicamba mg/L 0.12 MAC < 0.0004
Dichloromethane mg/L 0.05 MAC < 0.0005 < 0.0005 < 0.0005 < 0.0005
Diclofop-methyl mg/L 0.009 MAC < 0.0004
Dimethoate mg/L 0.02 IMAC < 0.0003
Dinoseb mg/L 0.01 MAC < 0.0005
Diquat mg/L 0.07 MAC < 0.0001
Diuron mg/L 0.15 MAC < 0.003
Glyphosate mg/L 0.28 IMAC < 0.025
Heptachlor + Heptachlor Epoxide mg/L 0.003 MAC < 0.000008
Lindane mg/L 0.004 MAC < 0.000005
Malathion mg/L 0.19 MAC < 0.0002
Methoxychlor mg/L 0.9 MAC < 0.000009
Metolachlor mg/L 0.05 IMAC < 0.0002
Metribuzin mg/L 0.08 MAC < 0.0003
Monochlorobenzene mg/L 0.08 MAC < 0.0001 < 0.0001 < 0.0001 < 0.0001
Paraquat mg/L 0.01 IMAC < 0.0001
Parathion mg/L 0.05 MAC < 0.0002

Approved January 18, 2012 B4-12
Approved Assessment Report: Toronto and Region Source Protection Area
Organics Test Results
Kleinburg Well 3,4 TreatedWW220002360
Reading Units ODWS 19/01/2009 06/04/2009 13/07/2009 05/10/2009
Pentachlorophenol mg/L 0.06 MAC < 0.0004
Phorate mg/L 0.002 IMAC < 0.0002
Picloram mg/L 0.19 IMAC < 0.0007
Polychlorinated Biphenyls (PCBs) mg/L 0.003 IMAC < 0.00002
Prometryne mg/L 0.001 IMAC < 0.0002
Simazine mg/L 0.01 IMAC < 0.0002
Temephos mg/L 0.28 IMAC < 0.003
Terbufos mg/L 0.001 IMAC < 0.0002
Tetrachloroethylene (perchloroethylene) mg/L 0.03 MAC < 0.0003 < 0.0003 < 0.0003 < 0.0003
Triallate mg/L 0.23 MAC < 0.004
Trichloroethene mg/L 0.005 MAC < 0.0001 < 0.0001 < 0.0001 < 0.0001
Trifluralin mg/L 0.045 IMAC < 0.000006
Vinyl Chloride mg/L 0.002 MAC < 0.0002 < 0.0002 < 0.0002 < 0.0002"<": indicats the result is below Method Detection LimitODWS: Ontario Drinking Water StandardMAC: Ontario Drinking Water Standard - Health Related (Maximum Acceptable Concentration)AO: Ontario Drining Water Standard - Non Health Related (Aesthetic Objective)mg/L: milligrams per litre, parts permillion (ppm)

Approved January 18, 2012B4-13
Appendix B: Watershed Characterization
Drinking-Water Systems Regulation O. Reg. 170/03
Drinking-Water Systems Regulations (PIBS 4435e01) February 2008
Page 1 of 6
OPTIONAL ANNUAL REPORT TEMPLATE
Drinking-Water System Number: 220002306Drinking-Water System Name: Nobleton Water Supply System Drinking-Water System Owner: Regional Municipality of York Drinking-Water System Category: Large Municipal Residential Period being reported: January 1, 2009 to December 31, 2009
Complete if your Category is Large Municipal Residential or Small Municipal Residential
Does your Drinking-Water System serve more than 10,000 people? Yes [ ] No [X]
Is your annual report available to the public at no charge on a web site on the Internet? Yes [X] No [ ]
Location where Summary Report required under O. Reg. 170/03 Schedule 22 will be available for inspection.
Complete for all other Categories.
Number of Designated Facilities served:
Did you provide a copy of your annual report to all Designated Facilities you serve?Yes [ ] No [ ]
Number of Interested Authorities you report to:
Did you provide a copy of your annual report to all Interested Authorities you report to for each Designated Facility? Yes [ ] No [ ]
Note: For the following tables below, additional rows or columns may be added or an appendix may be attached to the report
List all Drinking-Water Systems (if any), which receive all of their drinking water from your system: Drinking Water System Name Drinking Water System Number Nobleton Distribution System 260002577
Did you provide a copy of your annual report to all Drinking-Water System owners that are connected to you and to whom you provide all of its drinking water? Yes [X] No [ ]
Regional Municipality of York Administration Building Environmental Services Department 17250 Yonge Street Newmarket, Ontario
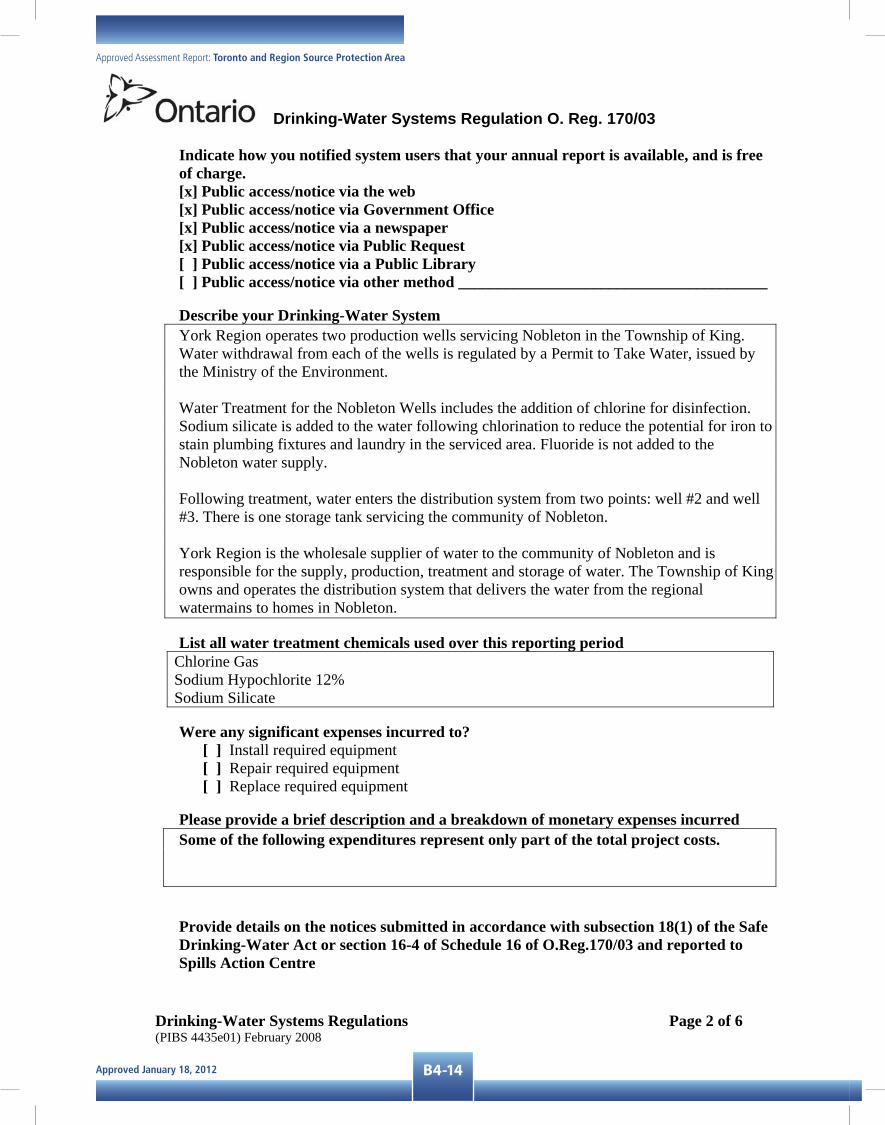
Approved January 18, 2012 B4-14
Approved Assessment Report: Toronto and Region Source Protection Area
Drinking-Water Systems Regulation O. Reg. 170/03
Drinking-Water Systems Regulations (PIBS 4435e01) February 2008
Page 2 of 6
Indicate how you notified system users that your annual report is available, and is free of charge. [x] Public access/notice via the web [x] Public access/notice via Government Office [x] Public access/notice via a newspaper [x] Public access/notice via Public Request [ ] Public access/notice via a Public Library[ ] Public access/notice via other method _______________________________________
Describe your Drinking-Water System York Region operates two production wells servicing Nobleton in the Township of King. Water withdrawal from each of the wells is regulated by a Permit to Take Water, issued by the Ministry of the Environment.
Water Treatment for the Nobleton Wells includes the addition of chlorine for disinfection. Sodium silicate is added to the water following chlorination to reduce the potential for iron to stain plumbing fixtures and laundry in the serviced area. Fluoride is not added to the Nobleton water supply.
Following treatment, water enters the distribution system from two points: well #2 and well #3. There is one storage tank servicing the community of Nobleton.
York Region is the wholesale supplier of water to the community of Nobleton and is responsible for the supply, production, treatment and storage of water. The Township of King owns and operates the distribution system that delivers the water from the regional watermains to homes in Nobleton.
List all water treatment chemicals used over this reporting period Chlorine Gas Sodium Hypochlorite 12% Sodium Silicate
Were any significant expenses incurred to? [ ] Install required equipment [ ] Repair required equipment [ ] Replace required equipment
Please provide a brief description and a breakdown of monetary expenses incurred Some of the following expenditures represent only part of the total project costs.
Provide details on the notices submitted in accordance with subsection 18(1) of the Safe Drinking-Water Act or section 16-4 of Schedule 16 of O.Reg.170/03 and reported to Spills Action Centre

Approved January 18, 2012B4-15
Appendix B: Watershed Characterization
Drinking-Water Systems Regulation O. Reg. 170/03
Drinking-Water Systems Regulations (PIBS 4435e01) February 2008
Page 3 of 6
IncidentDate
Parameter Result Unit of Measure
Corrective Action Corrective Action Date
Microbiological testing done under the Schedule 10, 11 or 12 of Regulation 170/03, during this reporting period.
Number of Samples
Range of E.Coli Or Fecal Results (min #)-(max #)
Range of Total Coliform Results(min #)-(max #)
Number of HPC Samples
Range of HPC Results(min #)-(max #)
Raw 104 0 0 Treated 104 0 0 104 1-2 Distribution
Operational testing done under Schedule 7, 8 or 9 of Regulation 170/03 during the period covered by this Annual Report.
Number of Grab Samples
Range of Results (min #)-(max #)
Turbidity(Treated) 8760 0.021 – 2.976 Turbidity (Raw) 24 0.125 – 10.1 Chlorine 8760 0.371 – 3.002 Fluoride (If the DWS provides fluoridation)
NOTE: Record the unit of measure if it is not milligrams per litre.
Summary of additional testing and sampling carried out in accordance with the requirement of an approval, order or other legal instrument.
Date of legal instrument issued
Parameter Date Sampled Result Unit of Measure
Summary of Inorganic parameters tested during this reporting period or the most recent sample results
Note: See attached results for Inorganic parameters
Parameter Sample Date Result Value Unit of Measure Exceedance
Antimony Arsenic Barium Boron Cadmium
NOTE: For continuous monitors use 8760 as the number of samples.

Approved January 18, 2012 B4-16
Approved Assessment Report: Toronto and Region Source Protection Area
Drinking-Water Systems Regulation O. Reg. 170/03
Drinking-Water Systems Regulations (PIBS 4435e01) February 2008
Page 4 of 6
Chromium Lead Mercury Selenium Sodium Uranium Fluoride Nitrite Nitrate
Summary of lead testing under Schedule 15.1 during this reporting period (applicable to the following drinking water systems; large municipal residential systems, smallmunicipal residential systems, and non-municipal year-round residential systems)
Location Type Number of Samples
Range of Lead Results
(min#) – (max #)
Number of Exceedances
Plumbing Distribution
Summary of Organic parameters sampled during this reporting period or the most recent sample results
Note: See attached results for Organic parameters (THM values in table below)
Parameter Sample Date
Result Value
Unit of Measure
Exceedance
Alachlor Aldicarb Aldrin + Dieldrin Atrazine + N-dealkylated metobolites Azinphos-methyl Bendiocarb Benzene Benzo(a)pyrene Bromoxynil Carbaryl Carbofuran Carbon Tetrachloride Chlordane (Total) Chlorpyrifos Cyanazine Diazinon Dicamba
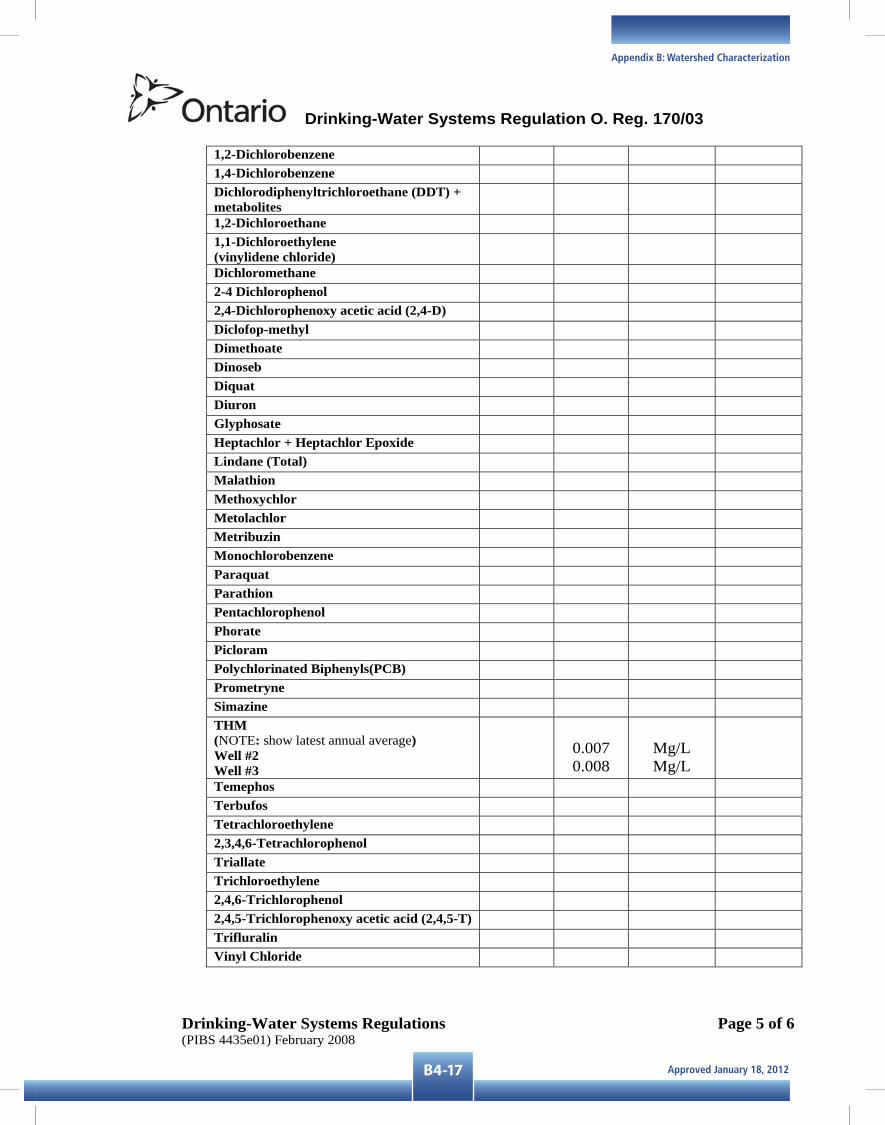
Approved January 18, 2012B4-17
Appendix B: Watershed Characterization
Drinking-Water Systems Regulation O. Reg. 170/03
Drinking-Water Systems Regulations (PIBS 4435e01) February 2008
Page 5 of 6
1,2-Dichlorobenzene 1,4-Dichlorobenzene Dichlorodiphenyltrichloroethane (DDT) + metabolites
1,2-Dichloroethane 1,1-Dichloroethylene (vinylidene chloride)
Dichloromethane 2-4 Dichlorophenol 2,4-Dichlorophenoxy acetic acid (2,4-D) Diclofop-methyl Dimethoate Dinoseb Diquat Diuron Glyphosate Heptachlor + Heptachlor Epoxide Lindane (Total) Malathion Methoxychlor Metolachlor Metribuzin Monochlorobenzene Paraquat Parathion Pentachlorophenol Phorate Picloram Polychlorinated Biphenyls(PCB) Prometryne Simazine THM(NOTE: show latest annual average)Well #2 Well #3
0.0070.008
Mg/LMg/L
Temephos Terbufos Tetrachloroethylene 2,3,4,6-Tetrachlorophenol Triallate Trichloroethylene 2,4,6-Trichlorophenol 2,4,5-Trichlorophenoxy acetic acid (2,4,5-T) Trifluralin Vinyl Chloride

Approved January 18, 2012 B4-18
Approved Assessment Report: Toronto and Region Source Protection Area
Drinking-Water Systems Regulation O. Reg. 170/03
Drinking-Water Systems Regulations (PIBS 4435e01) February 2008
Page 6 of 6
York Region monitors another group of disinfection by-products called haloacetic acids (HAAs). There are no limits set for HAAs in Ontario Drinking Water Standards.
Haloacetic acid Well #2
Mg/L June 30
Well #3 Mg/L
June 30
Bromochloroacetic acid <0.004 <0.004 Dibromoacetic acid <0.004 <0.004 Dichloroacetic acid <0.004 <0.004 Monobromoacetic acid <0.004 <0.004 Monochloroacetic acid <0.02 <0.02 Trichloroacetic acid <0.004 <0.004
“<” indicates the result is below the Method Detection Limit
List any Inorganic or Organic parameter(s) that exceeded half the standard prescribed in Schedule 2 of Ontario Drinking Water Quality Standards.
Parameter Result Value Unit of Measure Date of Sample
(Only if DWS category is large municipal residential, small municipal residential, large municipal non residential, non municipal year round residential, large non municipal non residential)

Approved January 18, 2012B4-19
Appendix B: Watershed Characterization
Nobleton Water Supply System
Inorganics Test Results
Nobleton Well 2 TreatedWW220002306
Reading Units ODWS 19/01/2009 06/04/2009 06/07/2009 05/10/2009
Antimony as Sb mg/L 0.006 IMAC 0.0003 0.0003 0.0004 0.0006
Arsenic as As mg/L 0.025 IMAC 0.0003 0.0002 0.0003 0.0002
Barium as Ba mg/L 1 MAC 0.19
Boron as B mg/L 5 IMAC 0.026
Cadmium as Cd mg/L 0.005 MAC < 0.0001 < 0.0001 < 0.0001 < 0.0001
Chromium as Cr mg/L 0.05 MAC < 0.0001 < 0.0001 < 0.0001 < 0.0001
Fluoride as F mg/L 0.8 MAC 0.1 0.1 0.166 0.095
Lead as Pb mg/L 0.01 MAC < 0.0001 < 0.0001 0.0001 < 0.0001
Mercury as Hg mg/L 0.001 MAC < 0.00002
Nitrate + Nitrite as N mg/L 10 MAC < 0.03 < 0.03 0.05 < 0.03
Nitrate as N mg/L 10 MAC < 0.03 < 0.03 0.047 0.013
Nitrite mg/L 1 MAC < 0.03 < 0.03 < 0.005 < 0.005
Selenium as Se mg/L 0.01 MAC 0.0004 < 0.0001 0.0007 0.0004
Sodium as Na mg/L 200 AO 14.2 13.6 14.7 14.4
Uranium as U mg/L 0.02 MAC < 0.0001"<": indicats the result is below Method Detection LimitODWS: Ontario Drinking Water StandardMAC: Ontario Drinking Water Standard - Health Related (Maximum Acceptable Concentration)AO: Ontario Drining Water Standard - Non Health Related (Aesthetic Objective)mg/L: milligrams per litre, parts permillion (ppm)

Approved January 18, 2012 B4-20
Approved Assessment Report: Toronto and Region Source Protection Area
Nobleton Water Supply System
Organics Test Results
Nobleton Well 2 TreatedWW220002306
Reading Units ODWS 19/01/2009 06/04/2009 06/07/2009 05/10/2009
(DDT) + Metabolites mg/L 0.03 MAC < 0.000008
1,1-dichloroethylene (vinylidene chloride) mg/L 0.014 MAC < 0.0003 < 0.0003 < 0.0003 < 0.0003
1,2-(o-dcb) Dichlorobenzene mg/L 0.2 MAC < 0.0001 < 0.0001 < 0.0001 < 0.0001
1,2-Dichloroethane mg/L 0.005 IMAC < 0.0001 < 0.0001 < 0.0001 < 0.0001
1,4-(p-dcb) Dichlorobenzene mg/L 0.005 MAC < 0.0001 < 0.0001 < 0.0001 < 0.0001
2,3,4,6-Tetrachlorophenol mg/L 0.1 MAC < 0.0005
2,4,5-trichlorophenoxyacetic acid (2,4,5-T) mg/L 0.28 MAC < 0.0005
2,4,6-Trichlorophenol mg/L 0.005 MAC < 0.0005
2,4-Dichlorophenol mg/L 0.9 MAC < 0.0004
2,4-dichlorophenoxyacetic acid (2,4-D) mg/L 0.1 IMAC < 0.0008
Alachlor mg/L 0.005 IMAC < 0.0004
Aldicarb mg/L 0.009 MAC < 0.006
Aldrin + Dieldrin mg/L 0.0007 MAC < 0.000006
Atrazine + N-dealkylated metabolites mg/L 0.005 IMAC < 0.0002
Azinphos-methyl mg/L 0.02 MAC < 0.0003
Bendiocarb mg/L 0.04 MAC < 0.003
Benzene mg/L 0.005 MAC < 0.0001 < 0.0001 < 0.0001 < 0.0001
Benzo(a)pyrene mg/L 0.00001 MAC < 0.00001
Bromoxynil mg/L 0.005 IMAC < 0.0004
Carbaryl mg/L 0.09 MAC < 0.003
Carbofuran mg/L 0.09 MAC < 0.003
Carbon Tetrachloride mg/L 0.005 MAC < 0.0002 < 0.0002 < 0.0002 < 0.0002
Chlordane (Total) mg/L 0.007 MAC < 0.000006
Chlorpyrifos mg/L 0.09 MAC < 0.0002
Cyanazine mg/L 0.01 IMAC < 0.0003
Diazinon mg/L 0.02 MAC < 0.0002
Dicamba mg/L 0.12 MAC < 0.0004
Dichloromethane mg/L 0.05 MAC < 0.0005 < 0.0005 < 0.0005 < 0.0005
Diclofop-methyl mg/L 0.009 MAC < 0.0004
Dimethoate mg/L 0.02 IMAC < 0.0003
Dinoseb mg/L 0.01 MAC < 0.0005
Diquat mg/L 0.07 MAC < 0.0001
Diuron mg/L 0.15 MAC < 0.003
Glyphosate mg/L 0.28 IMAC < 0.025
Heptachlor + Heptachlor Epoxide mg/L 0.003 MAC < 0.000008
Lindane mg/L 0.004 MAC < 0.000005
Malathion mg/L 0.19 MAC < 0.0002
Methoxychlor mg/L 0.9 MAC < 0.000009
Metolachlor mg/L 0.05 IMAC < 0.0002
Metribuzin mg/L 0.08 MAC < 0.0003
Monochlorobenzene mg/L 0.08 MAC < 0.0001 < 0.0001 < 0.0001 < 0.0001
Paraquat mg/L 0.01 IMAC < 0.0001
Parathion mg/L 0.05 MAC < 0.0002

Approved January 18, 2012B4-21
Appendix B: Watershed Characterization
Organics Test Results
Nobleton Well 2 TreatedWW220002306
Reading Units ODWS 19/01/2009 06/04/2009 06/07/2009 05/10/2009
Pentachlorophenol mg/L 0.06 MAC < 0.0004
Phorate mg/L 0.002 IMAC < 0.0002
Picloram mg/L 0.19 IMAC < 0.0007
Polychlorinated Biphenyls (PCBs) mg/L 0.003 IMAC < 0.00002
Prometryne mg/L 0.001 IMAC < 0.0002
Simazine mg/L 0.01 IMAC < 0.0002
Temephos mg/L 0.28 IMAC < 0.003
Terbufos mg/L 0.001 IMAC < 0.0002
Tetrachloroethylene (perchloroethylene) mg/L 0.03 MAC < 0.0003 < 0.0003 < 0.0003 < 0.0003
Triallate mg/L 0.23 MAC < 0.004
Trichloroethene mg/L 0.005 MAC < 0.0001 < 0.0001 < 0.0001 < 0.0001
Trifluralin mg/L 0.045 IMAC < 0.000006
Vinyl Chloride mg/L 0.002 MAC < 0.0002 < 0.0002 < 0.0002 < 0.0002"<": indicats the result is below Method Detection LimitODWS: Ontario Drinking Water StandardMAC: Ontario Drinking Water Standard - Health Related (Maximum Acceptable Concentration)AO: Ontario Drining Water Standard - Non Health Related (Aesthetic Objective)mg/L: milligrams per litre, parts permillion (ppm)

Approved January 18, 2012 B4-22
Approved Assessment Report: Toronto and Region Source Protection Area
Nobleton Water Supply System
Inorganics Test Results
Nobleton Well 3 TreatedWW220002306
Reading Units ODWS 19/01/2009 06/04/2009 06/07/2009 05/10/2009
Antimony as Sb mg/L 0.006 IMAC 0.0003 0.002 0.0004 0.0004
Arsenic as As mg/L 0.025 IMAC 0.0004 0.0004 0.0003 0.0004
Barium as Ba mg/L 1 MAC 0.214
Boron as B mg/L 5 IMAC 0.03
Cadmium as Cd mg/L 0.005 MAC < 0.0001 < 0.0001 < 0.0001 < 0.0001
Chromium as Cr mg/L 0.05 MAC < 0.0001 < 0.0001 < 0.0001 < 0.0001
Fluoride as F mg/L 0.8 MAC 0.09 0.1 0.154 0.093
Lead as Pb mg/L 0.01 MAC 0.0001 < 0.0001 0.0001 0.0001
Mercury as Hg mg/L 0.001 MAC < 0.00002
Nitrate + Nitrite as N mg/L 10 MAC < 0.03 < 0.03 < 0.03 < 0.03
Nitrate as N mg/L 10 MAC < 0.03 < 0.03 < 0.005 < 0.005
Nitrite mg/L 1 MAC < 0.03 < 0.03 < 0.005 < 0.005
Selenium as Se mg/L 0.01 MAC < 0.0001 < 0.0001 0.0005 0.0002
Sodium as Na mg/L 200 AO 17.9 18.2 15 17.9
Uranium as U mg/L 0.02 MAC < 0.0001"<": indicats the result is below Method Detection LimitODWS: Ontario Drinking Water StandardMAC: Ontario Drinking Water Standard - Health Related (Maximum Acceptable Concentration)AO: Ontario Drining Water Standard - Non Health Related (Aesthetic Objective)mg/L: milligrams per litre, parts permillion (ppm)

Approved January 18, 2012B4-23
Appendix B: Watershed Characterization
Nobleton Water Supply System
Organics Test Results
Nobleton Well 3 TreatedWW220002306
Reading Units ODWS 19/01/2009 06/04/2009 06/07/2009 05/10/2009
(DDT) + Metabolites mg/L 0.03 MAC < 0.000008
1,1-dichloroethylene (vinylidene chloride) mg/L 0.014 MAC < 0.0003 < 0.0003 < 0.0003 < 0.0003
1,2-(o-dcb) Dichlorobenzene mg/L 0.2 MAC < 0.0001 < 0.0001 < 0.0001 < 0.0001
1,2-Dichloroethane mg/L 0.005 IMAC < 0.0001 < 0.0001 < 0.0001 < 0.0001
1,4-(p-dcb) Dichlorobenzene mg/L 0.005 MAC < 0.0001 < 0.0001 < 0.0001 < 0.0001
2,3,4,6-Tetrachlorophenol mg/L 0.1 MAC < 0.0005
2,4,5-trichlorophenoxyacetic acid (2,4,5-T) mg/L 0.28 MAC < 0.0005
2,4,6-Trichlorophenol mg/L 0.005 MAC < 0.0005
2,4-Dichlorophenol mg/L 0.9 MAC < 0.0004
2,4-dichlorophenoxyacetic acid (2,4-D) mg/L 0.1 IMAC < 0.0008
Alachlor mg/L 0.005 IMAC < 0.0004
Aldicarb mg/L 0.009 MAC < 0.006
Aldrin + Dieldrin mg/L 0.0007 MAC < 0.000006
Atrazine + N-dealkylated metabolites mg/L 0.005 IMAC < 0.0002
Azinphos-methyl mg/L 0.02 MAC < 0.0003
Bendiocarb mg/L 0.04 MAC < 0.003
Benzene mg/L 0.005 MAC < 0.0001 < 0.0001 < 0.0001 < 0.0001
Benzo(a)pyrene mg/L 0.00001 MAC < 0.00001
Bromoxynil mg/L 0.005 IMAC < 0.0004
Carbaryl mg/L 0.09 MAC < 0.003
Carbofuran mg/L 0.09 MAC < 0.003
Carbon Tetrachloride mg/L 0.005 MAC < 0.0002 < 0.0002 < 0.0002 < 0.0002
Chlordane (Total) mg/L 0.007 MAC < 0.000006
Chlorpyrifos mg/L 0.09 MAC < 0.0002
Cyanazine mg/L 0.01 IMAC < 0.0003
Diazinon mg/L 0.02 MAC < 0.0002
Dicamba mg/L 0.12 MAC < 0.0004
Dichloromethane mg/L 0.05 MAC < 0.0005 < 0.0005 < 0.0005 < 0.0005
Diclofop-methyl mg/L 0.009 MAC < 0.0004
Dimethoate mg/L 0.02 IMAC < 0.0003
Dinoseb mg/L 0.01 MAC < 0.0005
Diquat mg/L 0.07 MAC < 0.0001
Diuron mg/L 0.15 MAC < 0.003
Glyphosate mg/L 0.28 IMAC < 0.025
Heptachlor + Heptachlor Epoxide mg/L 0.003 MAC < 0.000008
Lindane mg/L 0.004 MAC < 0.000005
Malathion mg/L 0.19 MAC < 0.0002
Methoxychlor mg/L 0.9 MAC < 0.000009
Metolachlor mg/L 0.05 IMAC < 0.0002
Metribuzin mg/L 0.08 MAC < 0.0003
Monochlorobenzene mg/L 0.08 MAC < 0.0001 < 0.0001 < 0.0001 < 0.0001
Paraquat mg/L 0.01 IMAC < 0.0001
Parathion mg/L 0.05 MAC < 0.0002

Approved January 18, 2012 B4-24
Approved Assessment Report: Toronto and Region Source Protection Area
Organics Test Results
Nobleton Well 3 TreatedWW220002306
Reading Units ODWS 19/01/2009 06/04/2009 06/07/2009 05/10/2009
Pentachlorophenol mg/L 0.06 MAC < 0.0004
Phorate mg/L 0.002 IMAC < 0.0002
Picloram mg/L 0.19 IMAC < 0.0007
Polychlorinated Biphenyls (PCBs) mg/L 0.003 IMAC < 0.00002
Prometryne mg/L 0.001 IMAC < 0.0002
Simazine mg/L 0.01 IMAC < 0.0002
Temephos mg/L 0.28 IMAC < 0.003
Terbufos mg/L 0.001 IMAC < 0.0002
Tetrachloroethylene (perchloroethylene) mg/L 0.03 MAC < 0.0003 < 0.0003 < 0.0003 < 0.0003
Triallate mg/L 0.23 MAC < 0.004
Trichloroethene mg/L 0.005 MAC < 0.0001 < 0.0001 < 0.0001 < 0.0001
Trifluralin mg/L 0.045 IMAC < 0.000006
Vinyl Chloride mg/L 0.002 MAC < 0.0002 < 0.0002 < 0.0002 < 0.0002"<": indicats the result is below Method Detection LimitODWS: Ontario Drinking Water StandardMAC: Ontario Drinking Water Standard - Health Related (Maximum Acceptable Concentration)AO: Ontario Drining Water Standard - Non Health Related (Aesthetic Objective)mg/L: milligrams per litre, parts permillion (ppm)
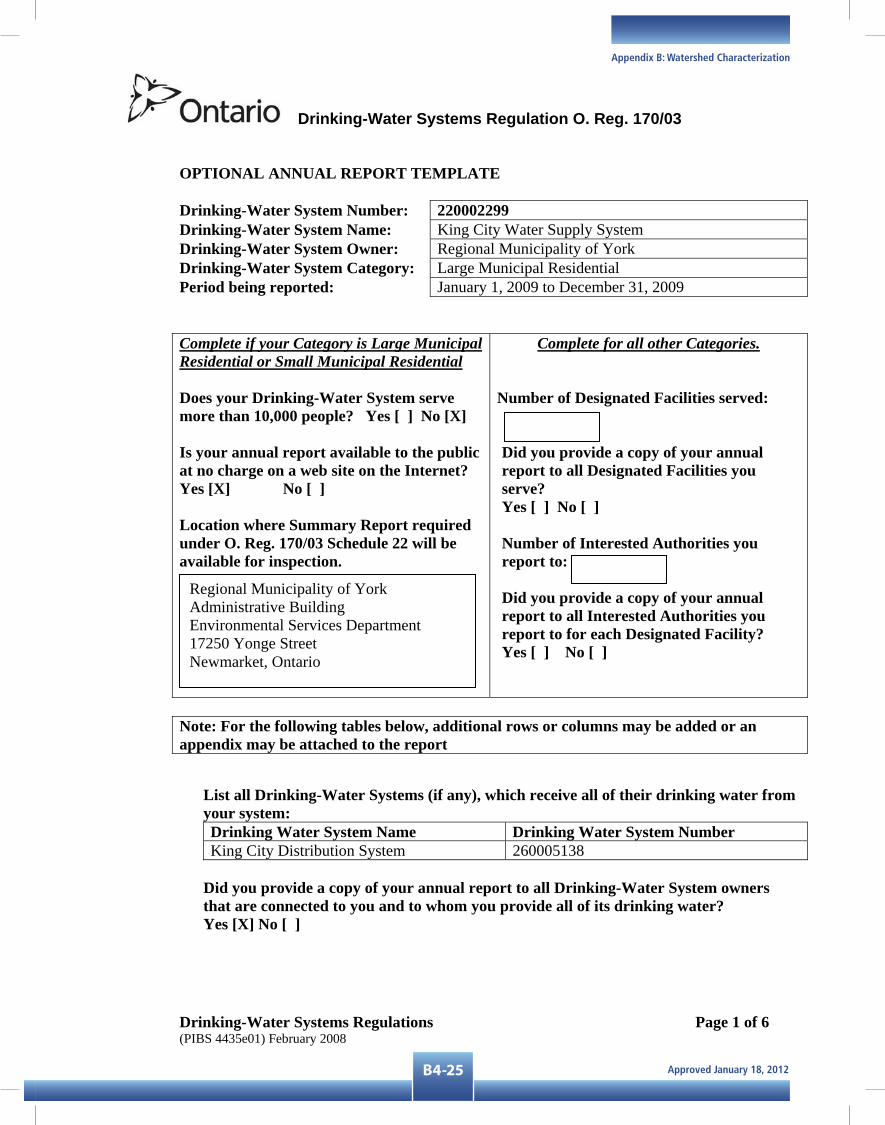
Approved January 18, 2012B4-25
Appendix B: Watershed Characterization
Drinking-Water Systems Regulation O. Reg. 170/03
Drinking-Water Systems Regulations (PIBS 4435e01) February 2008
Page 1 of 6
OPTIONAL ANNUAL REPORT TEMPLATE
Drinking-Water System Number: 220002299Drinking-Water System Name: King City Water Supply System Drinking-Water System Owner: Regional Municipality of York Drinking-Water System Category: Large Municipal Residential Period being reported: January 1, 2009 to December 31, 2009
Complete if your Category is Large Municipal Residential or Small Municipal Residential
Does your Drinking-Water System serve more than 10,000 people? Yes [ ] No [X]
Is your annual report available to the public at no charge on a web site on the Internet? Yes [X] No [ ]
Location where Summary Report required under O. Reg. 170/03 Schedule 22 will be available for inspection.
Complete for all other Categories.
Number of Designated Facilities served:
Did you provide a copy of your annual report to all Designated Facilities you serve?Yes [ ] No [ ]
Number of Interested Authorities you report to:
Did you provide a copy of your annual report to all Interested Authorities you report to for each Designated Facility? Yes [ ] No [ ]
Note: For the following tables below, additional rows or columns may be added or an appendix may be attached to the report
List all Drinking-Water Systems (if any), which receive all of their drinking water from your system: Drinking Water System Name Drinking Water System Number King City Distribution System 260005138
Did you provide a copy of your annual report to all Drinking-Water System owners that are connected to you and to whom you provide all of its drinking water? Yes [X] No [ ]
Regional Municipality of York Administrative Building Environmental Services Department 17250 Yonge Street Newmarket, Ontario

Approved January 18, 2012 B4-26
Approved Assessment Report: Toronto and Region Source Protection Area
Drinking-Water Systems Regulation O. Reg. 170/03
Drinking-Water Systems Regulations (PIBS 4435e01) February 2008
Page 2 of 6
Indicate how you notified system users that your annual report is available, and is free of charge. [x] Public access/notice via the web [x] Public access/notice via Government Office [x] Public access/notice via a newspaper [x] Public access/notice via Public Request [ ] Public access/notice via a Public Library[ ] Public access/notice via other method _______________________________________
Describe your Drinking-Water System York Region operates two production wells servicing King City in the Township of King. Water withdrawal from each of the wells is regulated by a Permit to Take Water issued by the Ministry of the Environment.
Water treatment for King City wells includes the addition of chlorine for disinfection. Sodium silicate is also added to keep the iron in suspension so it does not precipitate out and stain plumbing fixtures and laundry. Fluoride is not added to the King City water supply.
There are two sampling locations for treated water: well #3 and well #4. Following treatment, the water enters the distribution system from a combined location downstream of the contact tank. There is currently one storage tank servicing the community of King City.
York Region is the wholesale supplier of water to the community of King City in the Township of King and is responsible for the supply, production, treatment and storage of water. The Township of King owns and operates the distribution system that delivers the water from the regional watermains to homes in King City.
List all water treatment chemicals used over this reporting period Chlorine Gas Sodium Silicate
Were any significant expenses incurred to? [ ] Install required equipment [ ] Repair required equipment [ ] Replace required equipment
Please provide a brief description and a breakdown of monetary expenses incurred Some of the following expenditures represent only part of the total project cost.
King City ET and Watermain to Town $2,882,000

Approved January 18, 2012B4-27
Appendix B: Watershed Characterization
Drinking-Water Systems Regulation O. Reg. 170/03
Drinking-Water Systems Regulations (PIBS 4435e01) February 2008
Page 3 of 6
Provide details on the notices submitted in accordance with subsection 18(1) of the Safe Drinking-Water Act or section 16-4 of Schedule 16 of O.Reg.170/03 and reported to Spills Action Centre
Incident Date Parameter Result Unit of Measure Corrective Action Corrective Action Date
Microbiological testing done under the Schedule 10, 11 or 12 of Regulation 170/03, during this reporting period.
Number of Samples
Range of E.Coli Or Fecal Results (min #)-(max #)
Range of Total Coliform Results(min #)-(max #)
Number of HPC Samples
Range of HPC Results(min #)-(max #)
Raw 104 0 0-0 Treated 156 0 0 156 1-2 Distribution
Operational testing done under Schedule 7, 8 or 9 of Regulation 170/03 during the period covered by this Annual Report.
Number of Grab Samples
Range of Results (min #)-(max #)
Turbidity(Treated) 8760 0.091 – 2.622 Turbidity (Raw) 24 0.30 – 4.47 Chlorine 8760 0.002 – 2.913 Fluoride (If the DWS provides fluoridation)
NOTE: Record the unit of measure if it is not milligrams per litre.
Summary of additional testing and sampling carried out in accordance with the requirement of an approval, order or other legal instrument.
Date of legal instrument issued
Parameter Date Sampled Result Unit of Measure
Summary of Inorganic parameters tested during this reporting period or the most recent sample results
Note: See attached results for Inorganic parameters.
NOTE: For continuous monitors use 8760 as the number of samples.

Approved January 18, 2012 B4-28
Approved Assessment Report: Toronto and Region Source Protection Area
Drinking-Water Systems Regulation O. Reg. 170/03
Drinking-Water Systems Regulations (PIBS 4435e01) February 2008
Page 4 of 6
Parameter Sample Date Result Value Unit of Measure Exceedance
Antimony Arsenic Barium Boron Cadmium Chromium Lead Mercury Selenium Sodium Uranium Fluoride Nitrite Nitrate
Summary of lead testing under Schedule 15.1 during this reporting period (applicable to the following drinking water systems; large municipal residential systems, smallmunicipal residential systems, and non-municipal year-round residential systems)
Location Type Number of Samples
Range of Lead Results
(min#) – (max #)
Number of Exceedances
Plumbing Distribution
Summary of Organic parameters sampled during this reporting period or the most recent sample results
Note: See attached results for Organic parameters (THM values in table below)
Parameter Sample Date
Result Value
Unit of Measure
Exceedance
Alachlor Aldicarb Aldrin + Dieldrin Atrazine + N-dealkylated metobolites Azinphos-methyl Bendiocarb Benzene Benzo(a)pyrene Bromoxynil Carbaryl

Approved January 18, 2012B4-29
Appendix B: Watershed Characterization
Drinking-Water Systems Regulation O. Reg. 170/03
Drinking-Water Systems Regulations (PIBS 4435e01) February 2008
Page 5 of 6
Carbofuran Carbon Tetrachloride Chlordane (Total) Chlorpyrifos Cyanazine Diazinon Dicamba 1,2-Dichlorobenzene 1,4-Dichlorobenzene Dichlorodiphenyltrichloroethane (DDT) + metabolites
1,2-Dichloroethane 1,1-Dichloroethylene (vinylidene chloride)
Dichloromethane 2-4 Dichlorophenol 2,4-Dichlorophenoxy acetic acid (2,4-D) Diclofop-methyl Dimethoate Dinoseb Diquat Diuron Glyphosate Heptachlor + Heptachlor Epoxide Lindane (Total) Malathion Methoxychlor Metolachlor Metribuzin Monochlorobenzene Paraquat Parathion Pentachlorophenol Phorate Picloram Polychlorinated Biphenyls(PCB) Prometryne Simazine THM(NOTE: show latest annual average)Well #3 Well #4
0.0050.006
Mg/LMg/L
Temephos Terbufos Tetrachloroethylene

Approved January 18, 2012 B4-30
Approved Assessment Report: Toronto and Region Source Protection Area
Drinking-Water Systems Regulation O. Reg. 170/03
Drinking-Water Systems Regulations (PIBS 4435e01) February 2008
Page 6 of 6
2,3,4,6-Tetrachlorophenol Triallate Trichloroethylene 2,4,6-Trichlorophenol 2,4,5-Trichlorophenoxy acetic acid (2,4,5-T) Trifluralin Vinyl Chloride
York Region monitors another group of disinfection by-products called haloacetic acids (HAAs). There are no limits set for HAAs in Ontario Drinking Water Standards.
Haloacetic acid Well #3 Mg/L June 30
Well #4Mg/L
June 30
Bromochloroacetic acid <0.004 <0.004Dibromoacetic acid <0.004 <0.004Dichloroacetic acid <0.004 <0.004Monobromoacetic acid <0.004 <0.004Monochloroacetic acid <0.02 <0.02 Trichloroacetic acid <0.004 <0.004
“<” indicates the result is below the Method Detection Limit
List any Inorganic or Organic parameter(s) that exceeded half the standard prescribed in Schedule 2 of Ontario Drinking Water Quality Standards.
Parameter Result Value Unit of Measure Date of Sample
(Only if DWS category is large municipal residential, small municipal residential, large municipal non residential, non municipal year round residential, large non municipal non residential)

Approved January 18, 2012B4-31
Appendix B: Watershed Characterization
King Water Supply System
Inorganics Test Results
King City Well 3 TreatedWW220002299
Reading Units ODWS 21/01/2009 22/04/2009 08/07/2009 21/10/2009
Antimony as Sb mg/L 0.006 IMAC 0.0003 0.0003 0.0005 0.0001
Arsenic as As mg/L 0.025 IMAC 0.0007 0.0007 0.0008 0.0009
Barium as Ba mg/L 1 MAC 0.199
Boron as B mg/L 5 IMAC 0.021
Cadmium as Cd mg/L 0.005 MAC < 0.0001 < 0.0001 < 0.0001 < 0.0001
Chromium as Cr mg/L 0.05 MAC < 0.0001 < 0.0001 < 0.0001 < 0.0001
Fluoride as F mg/L 0.8 MAC 0.09 0.09 0.124 0.065
Lead as Pb mg/L 0.01 MAC 0.0001 0.0002 0.0003 0.0002
Mercury as Hg mg/L 0.001 MAC < 0.00002
Nitrate + Nitrite as N mg/L 10 MAC < 0.01 < 0.03 < 0.03 < 0.03
Nitrate as N mg/L 10 MAC < 0.01 < 0.03 < 0.005 < 0.005
Nitrite mg/L 1 MAC < 0.01 < 0.03 < 0.005 < 0.005
Selenium as Se mg/L 0.01 MAC < 0.0001 < 0.0001 < 0.0001 0.0004
Sodium as Na mg/L 200 AO 9.04 10.5 10.9 10.8
Uranium as U mg/L 0.02 MAC < 0.0001"<": indicats the result is below Method Detection LimitODWS: Ontario Drinking Water StandardMAC: Ontario Drinking Water Standard - Health Related (Maximum Acceptable Concentration)AO: Ontario Drining Water Standard - Non Health Related (Aesthetic Objective)mg/L: milligrams per litre, parts permillion (ppm)

Approved January 18, 2012 B4-32
Approved Assessment Report: Toronto and Region Source Protection Area
King Water Supply System
Organics Test Results
King City Well 3 TreatedWW220002299
Reading Units ODWS 21/01/2009 22/04/2009 08/07/2009 21/10/2009
(DDT) + Metabolites mg/L 0.03 MAC < 0.000008
1,1-dichloroethylene (vinylidene chloride) mg/L 0.014 MAC < 0.0003 < 0.0003 < 0.0003 < 0.0003
1,2-(o-dcb) Dichlorobenzene mg/L 0.2 MAC < 0.0001 < 0.0001 < 0.0001 < 0.0001
1,2-Dichloroethane mg/L 0.005 IMAC < 0.0001 < 0.0001 < 0.0001 < 0.0001
1,4-(p-dcb) Dichlorobenzene mg/L 0.005 MAC < 0.0001 < 0.0001 < 0.0001 < 0.0001
2,3,4,6-Tetrachlorophenol mg/L 0.1 MAC < 0.0005
2,4,5-trichlorophenoxyacetic acid (2,4,5-T) mg/L 0.28 MAC < 0.0005
2,4,6-Trichlorophenol mg/L 0.005 MAC < 0.0005
2,4-Dichlorophenol mg/L 0.9 MAC < 0.0007
2,4-dichlorophenoxyacetic acid (2,4-D) mg/L 0.1 IMAC < 0.0008
Alachlor mg/L 0.005 IMAC < 0.0004
Aldicarb mg/L 0.009 MAC < 0.0045
Aldrin + Dieldrin mg/L 0.0007 MAC < 0.000006
Atrazine + N-dealkylated metabolites mg/L 0.005 IMAC < 0.0002
Azinphos-methyl mg/L 0.02 MAC < 0.0003
Bendiocarb mg/L 0.04 MAC < 0.003
Benzene mg/L 0.005 MAC < 0.0001 < 0.0001 < 0.0001 < 0.0001
Benzo(a)pyrene mg/L 0.00001 MAC < 0.00001
Bromoxynil mg/L 0.005 IMAC < 0.0004
Carbaryl mg/L 0.09 MAC < 0.003
Carbofuran mg/L 0.09 MAC < 0.003
Carbon Tetrachloride mg/L 0.005 MAC < 0.0002 < 0.0002 < 0.0002 < 0.0002
Chlordane (Total) mg/L 0.007 MAC < 0.000006
Chlorpyrifos mg/L 0.09 MAC < 0.0002
Cyanazine mg/L 0.01 IMAC < 0.0003
Diazinon mg/L 0.02 MAC < 0.0002
Dicamba mg/L 0.12 MAC < 0.0004
Dichloromethane mg/L 0.05 MAC < 0.0005 < 0.0005 < 0.0005 < 0.0005
Diclofop-methyl mg/L 0.009 MAC < 0.0004
Dimethoate mg/L 0.02 IMAC < 0.0003
Dinoseb mg/L 0.01 MAC < 0.0005
Diquat mg/L 0.07 MAC < 0.001
Diuron mg/L 0.15 MAC < 0.003
Glyphosate mg/L 0.28 IMAC < 0.025
Heptachlor + Heptachlor Epoxide mg/L 0.003 MAC < 0.000008
Lindane mg/L 0.004 MAC < 0.000005
Malathion mg/L 0.19 MAC < 0.0002
Methoxychlor mg/L 0.9 MAC < 0.000009
Metolachlor mg/L 0.05 IMAC < 0.0002
Metribuzin mg/L 0.08 MAC < 0.0003
Monochlorobenzene mg/L 0.08 MAC < 0.0001 < 0.0001 < 0.0001 < 0.0001
Paraquat mg/L 0.01 IMAC < 0.001
Parathion mg/L 0.05 MAC < 0.0002

Approved January 18, 2012B4-33
Appendix B: Watershed Characterization
Organics Test Results
King City Well 3 TreatedWW220002299
Reading Units ODWS 21/01/2009 22/04/2009 08/07/2009 21/10/2009
Pentachlorophenol mg/L 0.06 MAC < 0.0004
Phorate mg/L 0.002 IMAC < 0.0002
Picloram mg/L 0.19 IMAC < 0.0007
Polychlorinated Biphenyls (PCBs) mg/L 0.003 IMAC < 0.00002
Prometryne mg/L 0.001 IMAC < 0.0002
Simazine mg/L 0.01 IMAC < 0.0002
Temephos mg/L 0.28 IMAC < 0.003
Terbufos mg/L 0.001 IMAC < 0.0002
Tetrachloroethylene (perchloroethylene) mg/L 0.03 MAC < 0.0003 < 0.0003 < 0.0003 < 0.0003
Triallate mg/L 0.23 MAC < 0.004
Trichloroethene mg/L 0.005 MAC < 0.0001 < 0.0001 < 0.0001 < 0.0001
Trifluralin mg/L 0.045 IMAC < 0.000006
Vinyl Chloride mg/L 0.002 MAC < 0.0002 < 0.0002 < 0.0002 < 0.0002"<": indicats the result is below Method Detection LimitODWS: Ontario Drinking Water StandardMAC: Ontario Drinking Water Standard - Health Related (Maximum Acceptable Concentration)AO: Ontario Drining Water Standard - Non Health Related (Aesthetic Objective)mg/L: milligrams per litre, parts permillion (ppm)
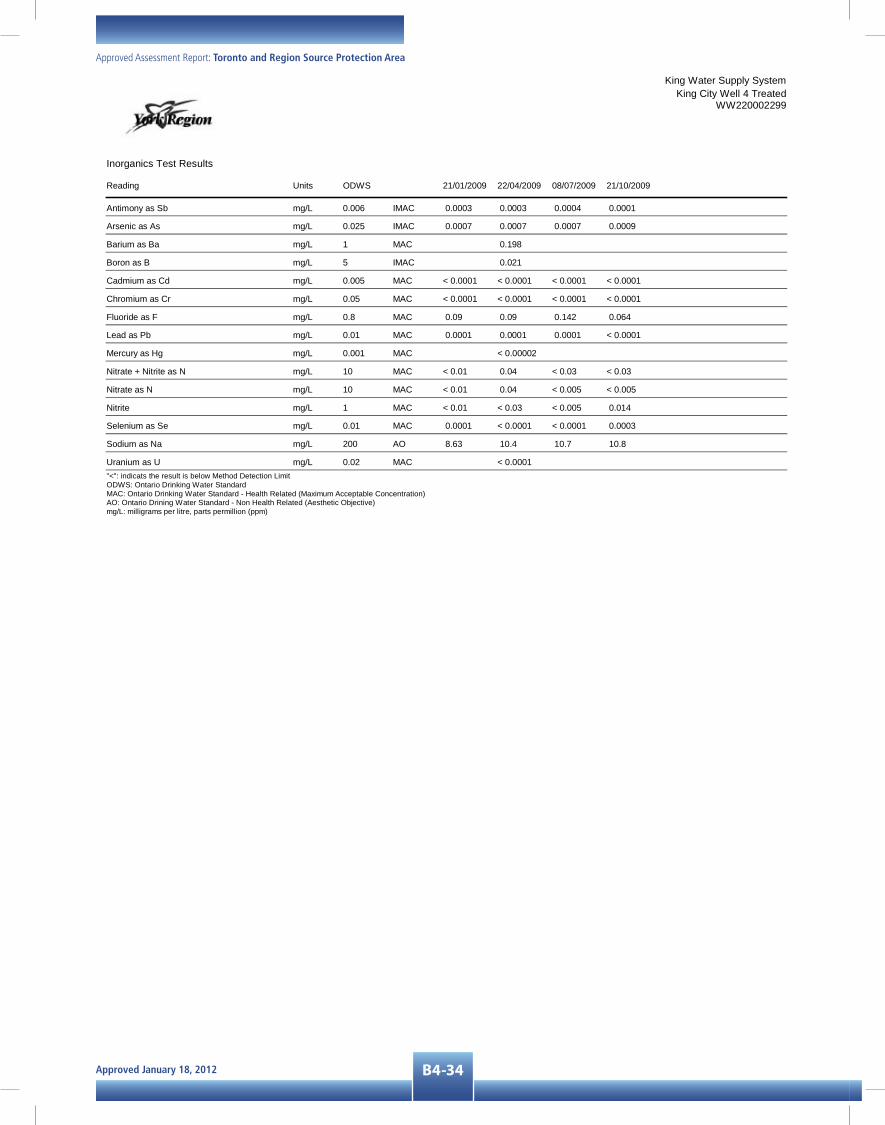
Approved January 18, 2012 B4-34
Approved Assessment Report: Toronto and Region Source Protection Area
King Water Supply System
Inorganics Test Results
King City Well 4 TreatedWW220002299
Reading Units ODWS 21/01/2009 22/04/2009 08/07/2009 21/10/2009
Antimony as Sb mg/L 0.006 IMAC 0.0003 0.0003 0.0004 0.0001
Arsenic as As mg/L 0.025 IMAC 0.0007 0.0007 0.0007 0.0009
Barium as Ba mg/L 1 MAC 0.198
Boron as B mg/L 5 IMAC 0.021
Cadmium as Cd mg/L 0.005 MAC < 0.0001 < 0.0001 < 0.0001 < 0.0001
Chromium as Cr mg/L 0.05 MAC < 0.0001 < 0.0001 < 0.0001 < 0.0001
Fluoride as F mg/L 0.8 MAC 0.09 0.09 0.142 0.064
Lead as Pb mg/L 0.01 MAC 0.0001 0.0001 0.0001 < 0.0001
Mercury as Hg mg/L 0.001 MAC < 0.00002
Nitrate + Nitrite as N mg/L 10 MAC < 0.01 0.04 < 0.03 < 0.03
Nitrate as N mg/L 10 MAC < 0.01 0.04 < 0.005 < 0.005
Nitrite mg/L 1 MAC < 0.01 < 0.03 < 0.005 0.014
Selenium as Se mg/L 0.01 MAC 0.0001 < 0.0001 < 0.0001 0.0003
Sodium as Na mg/L 200 AO 8.63 10.4 10.7 10.8
Uranium as U mg/L 0.02 MAC < 0.0001"<": indicats the result is below Method Detection LimitODWS: Ontario Drinking Water StandardMAC: Ontario Drinking Water Standard - Health Related (Maximum Acceptable Concentration)AO: Ontario Drining Water Standard - Non Health Related (Aesthetic Objective)mg/L: milligrams per litre, parts permillion (ppm)

Approved January 18, 2012B4-35
Appendix B: Watershed Characterization
King Water Supply System
Organics Test Results
King City Well 4 TreatedWW220002299
Reading Units ODWS 21/01/2009 22/04/2009 08/07/2009 14/07/2009 21/10/2009
(DDT) + Metabolites mg/L 0.03 MAC < 0.000008
1,1-dichloroethylene (vinylidene chloride) mg/L 0.014 MAC < 0.0003 < 0.0003 < 0.0003 < 0.0003
1,2-(o-dcb) Dichlorobenzene mg/L 0.2 MAC < 0.0001 < 0.0001 < 0.0001 < 0.0001
1,2-Dichloroethane mg/L 0.005 IMAC < 0.0001 < 0.0001 < 0.0001 < 0.0001
1,4-(p-dcb) Dichlorobenzene mg/L 0.005 MAC < 0.0001 < 0.0001 < 0.0001 < 0.0001
2,3,4,6-Tetrachlorophenol mg/L 0.1 MAC < 0.0005
2,4,5-trichlorophenoxyacetic acid (2,4,5-T) mg/L 0.28 MAC < 0.0005
2,4,6-Trichlorophenol mg/L 0.005 MAC < 0.0005
2,4-Dichlorophenol mg/L 0.9 MAC < 0.0007
2,4-dichlorophenoxyacetic acid (2,4-D) mg/L 0.1 IMAC < 0.0008
Alachlor mg/L 0.005 IMAC < 0.0004
Aldicarb mg/L 0.009 MAC < 0.0045
Aldrin + Dieldrin mg/L 0.0007 MAC < 0.000006
Atrazine + N-dealkylated metabolites mg/L 0.005 IMAC < 0.0002
Azinphos-methyl mg/L 0.02 MAC < 0.0003
Bendiocarb mg/L 0.04 MAC < 0.003
Benzene mg/L 0.005 MAC < 0.0001 < 0.0001 < 0.0001 < 0.0001
Benzo(a)pyrene mg/L 0.00001 MAC < 0.00001
Bromoxynil mg/L 0.005 IMAC < 0.0004
Carbaryl mg/L 0.09 MAC < 0.003
Carbofuran mg/L 0.09 MAC < 0.003
Carbon Tetrachloride mg/L 0.005 MAC < 0.0002 < 0.0002 < 0.0002 < 0.0002
Chlordane (Total) mg/L 0.007 MAC < 0.000006
Chlorpyrifos mg/L 0.09 MAC < 0.0002
Cyanazine mg/L 0.01 IMAC < 0.0003
Diazinon mg/L 0.02 MAC < 0.0002
Dicamba mg/L 0.12 MAC < 0.0004
Dichloromethane mg/L 0.05 MAC < 0.0005 < 0.0005 < 0.0005 < 0.0005
Diclofop-methyl mg/L 0.009 MAC < 0.0004
Dimethoate mg/L 0.02 IMAC < 0.0003
Dinoseb mg/L 0.01 MAC < 0.0005
Diquat mg/L 0.07 MAC < 0.001
Diuron mg/L 0.15 MAC < 0.003
Glyphosate mg/L 0.28 IMAC < 0.025
Heptachlor + Heptachlor Epoxide mg/L 0.003 MAC < 0.000008
Lindane mg/L 0.004 MAC < 0.000005
Malathion mg/L 0.19 MAC < 0.0002
Methoxychlor mg/L 0.9 MAC < 0.000009
Metolachlor mg/L 0.05 IMAC < 0.0002
Metribuzin mg/L 0.08 MAC < 0.0003
Monochlorobenzene mg/L 0.08 MAC < 0.0001 < 0.0001 < 0.0001 < 0.0001
Paraquat mg/L 0.01 IMAC < 0.001
Parathion mg/L 0.05 MAC < 0.0002

Approved January 18, 2012 B4-36
Approved Assessment Report: Toronto and Region Source Protection Area
Organics Test Results
King City Well 4 TreatedWW220002299
Reading Units ODWS 21/01/2009 22/04/2009 08/07/2009 14/07/2009 21/10/2009
Pentachlorophenol mg/L 0.06 MAC < 0.0004
Phorate mg/L 0.002 IMAC < 0.0002
Picloram mg/L 0.19 IMAC < 0.0007
Polychlorinated Biphenyls (PCBs) mg/L 0.003 IMAC < 0.00002
Prometryne mg/L 0.001 IMAC < 0.0002
Simazine mg/L 0.01 IMAC < 0.0002
Temephos mg/L 0.28 IMAC < 0.003
Terbufos mg/L 0.001 IMAC < 0.0002
Tetrachloroethylene (perchloroethylene) mg/L 0.03 MAC < 0.0003 < 0.0003 < 0.0003 < 0.0003
Triallate mg/L 0.23 MAC < 0.004
Trichloroethene mg/L 0.005 MAC < 0.0001 < 0.0001 < 0.0001 < 0.0001
Trifluralin mg/L 0.045 IMAC < 0.000006
Vinyl Chloride mg/L 0.002 MAC < 0.0002 < 0.0002 < 0.0002 < 0.0002"<": indicats the result is below Method Detection LimitODWS: Ontario Drinking Water StandardMAC: Ontario Drinking Water Standard - Health Related (Maximum Acceptable Concentration)AO: Ontario Drining Water Standard - Non Health Related (Aesthetic Objective)mg/L: milligrams per litre, parts permillion (ppm)
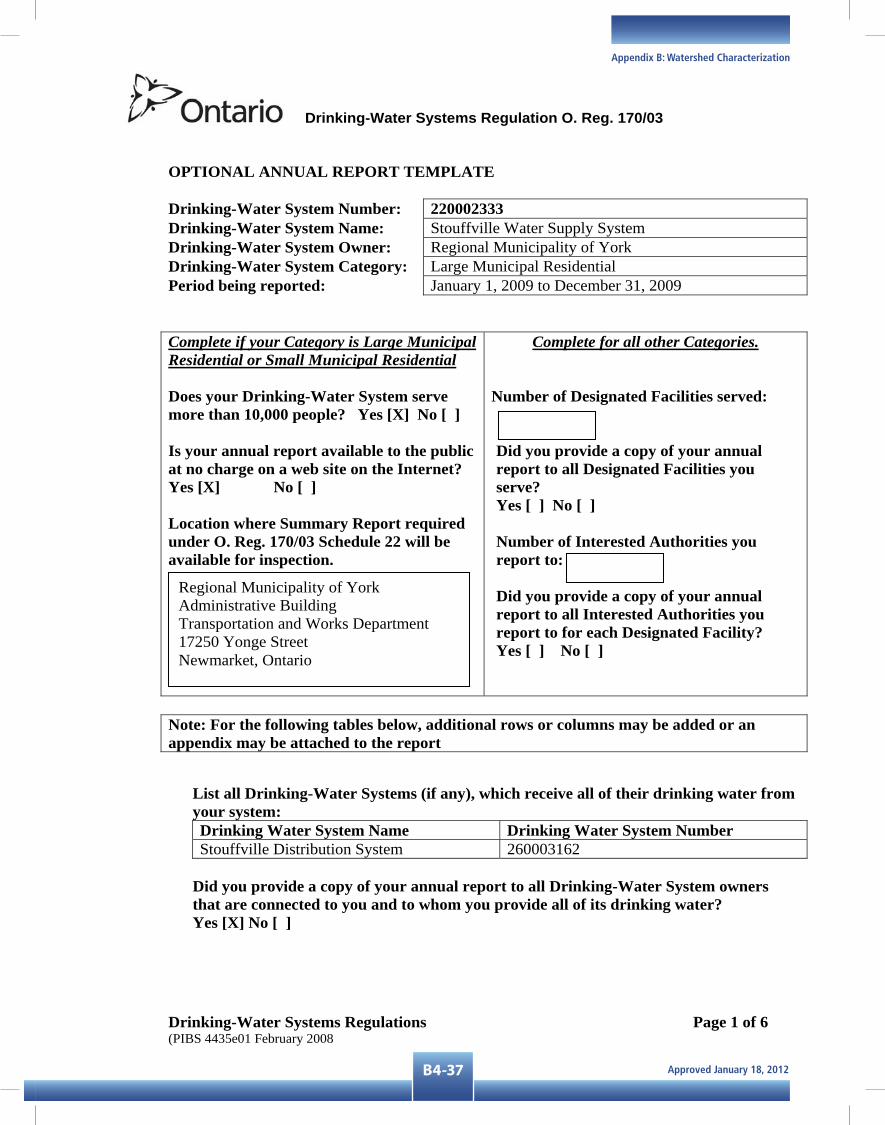
Approved January 18, 2012B4-37
Appendix B: Watershed Characterization
Drinking-Water Systems Regulation O. Reg. 170/03
Drinking-Water Systems Regulations (PIBS 4435e01 February 2008
Page 1 of 6
OPTIONAL ANNUAL REPORT TEMPLATE
Drinking-Water System Number: 220002333Drinking-Water System Name: Stouffville Water Supply System Drinking-Water System Owner: Regional Municipality of York Drinking-Water System Category: Large Municipal Residential Period being reported: January 1, 2009 to December 31, 2009
Complete if your Category is Large Municipal Residential or Small Municipal Residential
Does your Drinking-Water System serve more than 10,000 people? Yes [X] No [ ]
Is your annual report available to the public at no charge on a web site on the Internet? Yes [X] No [ ]
Location where Summary Report required under O. Reg. 170/03 Schedule 22 will be available for inspection.
Complete for all other Categories.
Number of Designated Facilities served:
Did you provide a copy of your annual report to all Designated Facilities you serve?Yes [ ] No [ ]
Number of Interested Authorities you report to:
Did you provide a copy of your annual report to all Interested Authorities you report to for each Designated Facility? Yes [ ] No [ ]
Note: For the following tables below, additional rows or columns may be added or an appendix may be attached to the report
List all Drinking-Water Systems (if any), which receive all of their drinking water from your system: Drinking Water System Name Drinking Water System Number Stouffville Distribution System 260003162
Did you provide a copy of your annual report to all Drinking-Water System owners that are connected to you and to whom you provide all of its drinking water? Yes [X] No [ ]
Regional Municipality of York Administrative Building Transportation and Works Department 17250 Yonge Street Newmarket, Ontario

Approved January 18, 2012 B4-38
Approved Assessment Report: Toronto and Region Source Protection Area
Drinking-Water Systems Regulation O. Reg. 170/03
Drinking-Water Systems Regulations (PIBS 4435e01 February 2008
Page 2 of 6
Indicate how you notified system users that your annual report is available, and is free of charge. [x] Public access/notice via the web [x] Public access/notice via Government Office [x] Public access/notice via a newspaper [x] Public access/notice via Public Request [ ] Public access/notice via a Public Library[ ] Public access/notice via other method _______________________________________
Describe your Drinking-Water System York Region operates five production wells servicing Stouffville in the Town of Whitchurch-Stouffville. Well #1 and well #2 are located on Main Street, well #3 is located on the Tenth Line, and well #5 and well #6 are located on Highway 48 between Bethesda Side Road and Bloomington Road.
Water treatment for the Stouffville wells includes the addition of chlorine for disinfection. Sodium silicate is also added to keep the iron in suspension so it does not precipitate out and stain plumbing fixtures and laundry. Due to very low iron levels found in wells #5 and #6, sodium silicate is not added to these wells. A new UV system was installed at Stouffville Wells #5 and #6 in the spring of 2006.
Following treatment, water enters the distribution system from three points: wells #1 and #2 combined, well #3, and well #5 and well #6 combined.
There are two storage tanks and two reservoirs servicing the community of Stouffville. The Stouffville Zone 1 Elevated Tank is a new tank that was serviced in the fall of 2006 and is located on the Tenth Line and Bethesda Road. York Region also operates three booster stations. One is a small High Lift booster pumping station in Stouffville which supplies water to a number of homes in the Highway #48 / Bloomington area, Hwy 48 Booster Pumping Station was serviced in the fall of 2006 and is located on the Tenth Line near Stouffville Well #3 and Zone 1 Booster Pumping Station was serviced in 2009.
York Region is the wholesale supplier of water to the community of Stouffville in the Town of Whitchurch-Stouffville and is responsible for the supply, production, treatment and storage of water. The Town of Whitchurch-Stouffville owns and operates the distribution system that delivers the water from the regional watermains to homes in Stouffville.
List all water treatment chemicals used over this reporting period Chlorine Gas Sodium Hypochlorite 12% Sodium Silicate
Were any significant expenses incurred to? [ ] Install required equipment [ ] Repair required equipment [ ] Replace required equipment
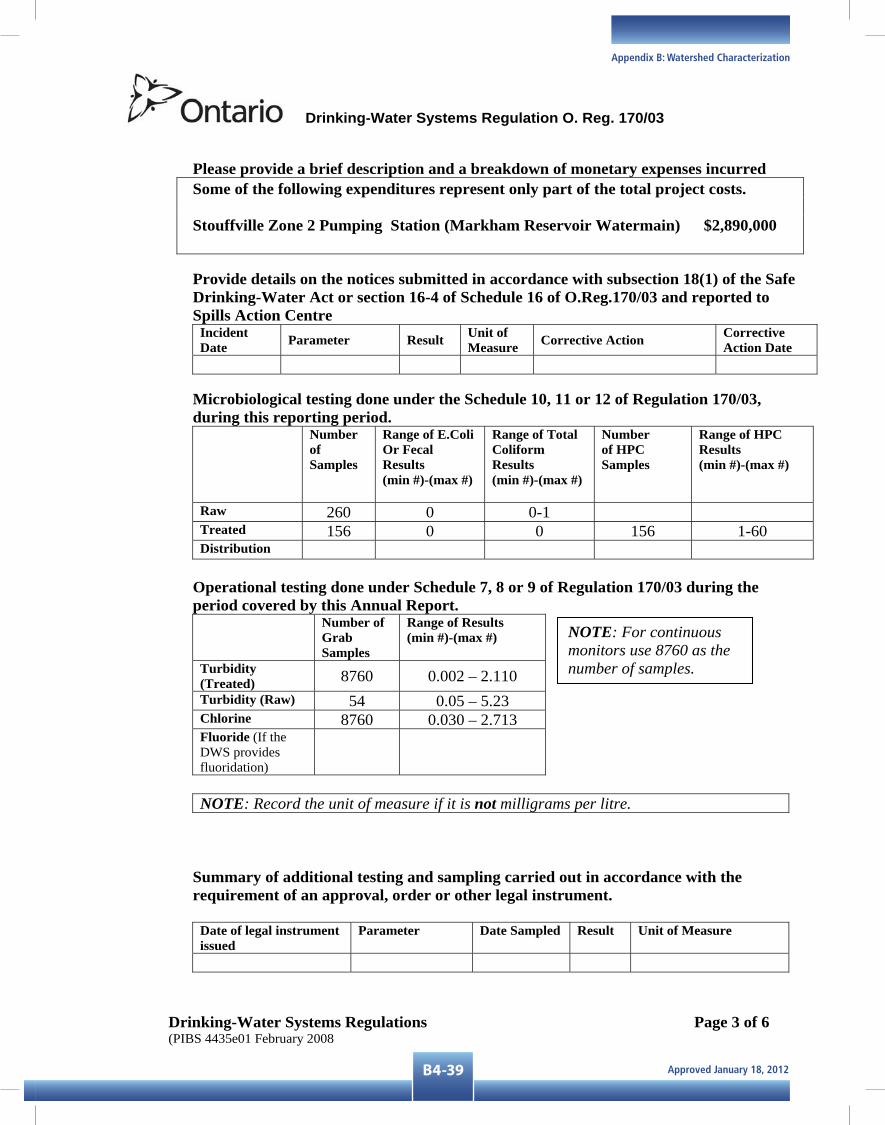
Approved January 18, 2012B4-39
Appendix B: Watershed Characterization
Drinking-Water Systems Regulation O. Reg. 170/03
Drinking-Water Systems Regulations (PIBS 4435e01 February 2008
Page 3 of 6
Please provide a brief description and a breakdown of monetary expenses incurred Some of the following expenditures represent only part of the total project costs.
Stouffville Zone 2 Pumping Station (Markham Reservoir Watermain) $2,890,000
Provide details on the notices submitted in accordance with subsection 18(1) of the Safe Drinking-Water Act or section 16-4 of Schedule 16 of O.Reg.170/03 and reported to Spills Action Centre
IncidentDate Parameter Result Unit of
Measure Corrective Action Corrective Action Date
Microbiological testing done under the Schedule 10, 11 or 12 of Regulation 170/03, during this reporting period.
Number of Samples
Range of E.Coli Or Fecal Results (min #)-(max #)
Range of Total Coliform Results(min #)-(max #)
Number of HPC Samples
Range of HPC Results(min #)-(max #)
Raw 260 0 0-1 Treated 156 0 0 156 1-60 Distribution
Operational testing done under Schedule 7, 8 or 9 of Regulation 170/03 during the period covered by this Annual Report.
Number of Grab Samples
Range of Results (min #)-(max #)
Turbidity(Treated) 8760 0.002 – 2.110 Turbidity (Raw) 54 0.05 – 5.23 Chlorine 8760 0.030 – 2.713 Fluoride (If the DWS provides fluoridation)
NOTE: Record the unit of measure if it is not milligrams per litre.
Summary of additional testing and sampling carried out in accordance with the requirement of an approval, order or other legal instrument.
Date of legal instrument issued
Parameter Date Sampled Result Unit of Measure
NOTE: For continuous monitors use 8760 as the number of samples.

Approved January 18, 2012 B4-40
Approved Assessment Report: Toronto and Region Source Protection Area
Drinking-Water Systems Regulation O. Reg. 170/03
Drinking-Water Systems Regulations (PIBS 4435e01 February 2008
Page 4 of 6
Summary of Inorganic parameters tested during this reporting period or the most recent sample results
NOTE: see attached results for Inorganic parameters.
Parameter Sample Date Result Value Unit of Measure Exceedance
Antimony Arsenic Barium Boron Cadmium Chromium Lead Mercury Selenium Sodium Uranium Fluoride Nitrite Nitrate
Summary of lead testing under Schedule 15.1 during this reporting period (applicable to the following drinking water systems; large municipal residential systems, smallmunicipal residential systems, and non-municipal year-round residential systems)
Location Type Number of Samples
Range of Lead Results
(min#) – (max #)
Number of Exceedances
Plumbing Distribution
Summary of Organic parameters sampled during this reporting period or the most recent sample results
NOTE: see attached results for Organic parameters (THM values in table below).
Parameter Sample Date
Result Value
Unit of Measure
Exceedance
Alachlor Aldicarb Aldrin + Dieldrin Atrazine + N-dealkylated metobolites Azinphos-methyl

Approved January 18, 2012B4-41
Appendix B: Watershed Characterization
Drinking-Water Systems Regulation O. Reg. 170/03
Drinking-Water Systems Regulations (PIBS 4435e01 February 2008
Page 5 of 6
Bendiocarb Benzene Benzo(a)pyrene Bromoxynil Carbaryl Carbofuran Carbon Tetrachloride Chlordane (Total) Chlorpyrifos Cyanazine Diazinon Dicamba 1,2-Dichlorobenzene 1,4-Dichlorobenzene Dichlorodiphenyltrichloroethane (DDT) + metabolites
1,2-Dichloroethane 1,1-Dichloroethylene (vinylidene chloride)
Dichloromethane 2-4 Dichlorophenol 2,4-Dichlorophenoxy acetic acid (2,4-D) Diclofop-methyl Dimethoate Dinoseb Diquat Diuron Glyphosate Heptachlor + Heptachlor Epoxide Lindane (Total) Malathion Methoxychlor Metolachlor Metribuzin Monochlorobenzene Paraquat Parathion Pentachlorophenol Phorate Picloram Polychlorinated Biphenyls(PCB) Prometryne Simazine

Approved January 18, 2012 B4-42
Approved Assessment Report: Toronto and Region Source Protection Area
Drinking-Water Systems Regulation O. Reg. 170/03
Drinking-Water Systems Regulations (PIBS 4435e01 February 2008
Page 6 of 6
THM(NOTE: show latest annual average)Wells #1, #2 Well #3 Wells #5, #6
0.0210.003
0.015
Mg/LMg/LMg/L
Temephos Terbufos Tetrachloroethylene 2,3,4,6-Tetrachlorophenol Triallate Trichloroethylene 2,4,6-Trichlorophenol 2,4,5-Trichlorophenoxy acetic acid (2,4,5-T) Trifluralin Vinyl Chloride
York Region monitors another group of disinfection by-products called haloacetic acids (HAAs). There are no limits set for HAAs in the Ontario Drinking Water Standards.
Haloacetic Acid Wells #5, #6
Mg/LJune 30
Well #1, #2Mg/L
June 30
Well #3Mg/L
June 30 Bromochloroacetic acid <0.004 <0.004 <0.004Dibromoacetic acid <0.004 <0.004 <0.004Dichloroacetic acid <0.004 <0.004 <0.004Monobromoacetic acid <0.004 <0.004 <0.004Monochloroacetic acid <0.02 <0.02 <0.02 Trichloroacetic acid <0.004 <0.004 <0.004
“<” indicates the result is below the Method Detection Limit
List any Inorganic or Organic parameter(s) that exceeded half the standard prescribed in Schedule 2 of Ontario Drinking Water Quality Standards.
Parameter Result Value Unit of Measure Date of Sample
(Only if DWS category is large municipal residential, small municipal residential, large municipal non residential, non municipal year round residential, large non municipal non residential)

Approved January 18, 2012B4-43
Appendix B: Watershed Characterization
Stouffville Water Supply System
Inorganics Test Results
Stouffville Well 1,2 TreatedWW220002333
Reading Units ODWS 12/01/2009 14/04/2009 22/07/2009 28/10/2009
Antimony as Sb mg/L 0.006 IMAC 0.0005 0.0002 0.0003 0.0004
Arsenic as As mg/L 0.025 IMAC 0.0005 0.0003 0.0004 0.0004
Barium as Ba mg/L 1 MAC 0.111
Boron as B mg/L 5 IMAC 0.043
Cadmium as Cd mg/L 0.005 MAC < 0.0001 < 0.0001 < 0.0001 < 0.0001
Chromium as Cr mg/L 0.05 MAC < 0.0001 < 0.0001 < 0.0001 < 0.0001
Fluoride as F mg/L 0.8 MAC 0.16 0.16 0.188 0.162
Lead as Pb mg/L 0.01 MAC 0.0001 < 0.0001 0.0001 0.0004
Mercury as Hg mg/L 0.001 MAC < 0.00002
Nitrate + Nitrite as N mg/L 10 MAC 0.01 0.01 0.03 0.01
Nitrate as N mg/L 10 MAC 0.01 0.01 0.027 0.014
Nitrite mg/L 1 MAC < 0.01 < 0.01 < 0.002 < 0.002
Selenium as Se mg/L 0.01 MAC 0.0006 0.0001 0.0004 0.0005
Sodium as Na mg/L 200 AO 26 23.5 24.8 25.6
Uranium as U mg/L 0.02 MAC < 0.0001"<": indicats the result is below Method Detection LimitODWS: Ontario Drinking Water StandardMAC: Ontario Drinking Water Standard - Health Related (Maximum Acceptable Concentration)AO: Ontario Drining Water Standard - Non Health Related (Aesthetic Objective)mg/L: milligrams per litre, parts permillion (ppm)

Approved January 18, 2012 B4-44
Approved Assessment Report: Toronto and Region Source Protection Area
Stouffville Water Supply System
Organics Test Results
Stouffville Well 1,2 TreatedWW220002333
Reading Units ODWS 12/01/2009 14/04/2009 22/07/2009 28/10/2009
(DDT) + Metabolites mg/L 0.03 MAC < 0.000008
1,1-dichloroethylene (vinylidene chloride) mg/L 0.014 MAC < 0.0003 < 0.0003 < 0.0003 < 0.0003
1,2-(o-dcb) Dichlorobenzene mg/L 0.2 MAC < 0.0001 < 0.0001 < 0.0001 < 0.0001
1,2-Dichloroethane mg/L 0.005 IMAC < 0.0001 < 0.0001 < 0.0001 < 0.0001
1,4-(p-dcb) Dichlorobenzene mg/L 0.005 MAC 0.0001 < 0.0001 < 0.0001 < 0.0001
2,3,4,6-Tetrachlorophenol mg/L 0.1 MAC < 0.0005
2,4,5-trichlorophenoxyacetic acid (2,4,5-T) mg/L 0.28 MAC < 0.0005
2,4,6-Trichlorophenol mg/L 0.005 MAC < 0.0005
2,4-Dichlorophenol mg/L 0.9 MAC < 0.0004
2,4-dichlorophenoxyacetic acid (2,4-D) mg/L 0.1 IMAC < 0.0008
Alachlor mg/L 0.005 IMAC < 0.0004
Aldicarb mg/L 0.009 MAC < 0.006
Aldrin + Dieldrin mg/L 0.0007 MAC < 0.000006
Atrazine + N-dealkylated metabolites mg/L 0.005 IMAC < 0.0002
Azinphos-methyl mg/L 0.02 MAC < 0.0003
Bendiocarb mg/L 0.04 MAC < 0.003
Benzene mg/L 0.005 MAC < 0.0001 < 0.0001 < 0.0001 < 0.0001
Benzo(a)pyrene mg/L 0.00001 MAC < 0.00001
Bromoxynil mg/L 0.005 IMAC < 0.0004
Carbaryl mg/L 0.09 MAC < 0.003
Carbofuran mg/L 0.09 MAC < 0.003
Carbon Tetrachloride mg/L 0.005 MAC < 0.0002 < 0.0002 < 0.0002 < 0.0002
Chlordane (Total) mg/L 0.007 MAC < 0.000006
Chlorpyrifos mg/L 0.09 MAC < 0.0002
Cyanazine mg/L 0.01 IMAC < 0.0003
Diazinon mg/L 0.02 MAC < 0.0002
Dicamba mg/L 0.12 MAC < 0.0004
Dichloromethane mg/L 0.05 MAC < 0.0005 < 0.0005 < 0.0005 < 0.0005
Diclofop-methyl mg/L 0.009 MAC < 0.0004
Dimethoate mg/L 0.02 IMAC < 0.0003
Dinoseb mg/L 0.01 MAC < 0.0005
Diquat mg/L 0.07 MAC < 0.0001
Diuron mg/L 0.15 MAC < 0.003
Glyphosate mg/L 0.28 IMAC < 0.025
Heptachlor + Heptachlor Epoxide mg/L 0.003 MAC < 0.000008
Lindane mg/L 0.004 MAC < 0.000005
Malathion mg/L 0.19 MAC < 0.0002
Methoxychlor mg/L 0.9 MAC < 0.000009
Metolachlor mg/L 0.05 IMAC < 0.0002
Metribuzin mg/L 0.08 MAC < 0.0003
Monochlorobenzene mg/L 0.08 MAC < 0.0001 < 0.0001 < 0.0001 < 0.0001
Paraquat mg/L 0.01 IMAC < 0.0001
Parathion mg/L 0.05 MAC < 0.0002

Approved January 18, 2012B4-45
Appendix B: Watershed Characterization
Organics Test Results
Stouffville Well 1,2 TreatedWW220002333
Reading Units ODWS 12/01/2009 14/04/2009 22/07/2009 28/10/2009
Pentachlorophenol mg/L 0.06 MAC < 0.0004
Phorate mg/L 0.002 IMAC < 0.0002
Picloram mg/L 0.19 IMAC < 0.0007
Polychlorinated Biphenyls (PCBs) mg/L 0.003 IMAC < 0.00002
Prometryne mg/L 0.001 IMAC < 0.0002
Simazine mg/L 0.01 IMAC < 0.0002
Temephos mg/L 0.28 IMAC < 0.003
Terbufos mg/L 0.001 IMAC < 0.0002
Tetrachloroethylene (perchloroethylene) mg/L 0.03 MAC < 0.0003 < 0.0003 < 0.0003 < 0.0003
Triallate mg/L 0.23 MAC < 0.004
Trichloroethene mg/L 0.005 MAC < 0.0001 < 0.0001 < 0.0001 < 0.0001
Trifluralin mg/L 0.045 IMAC < 0.000006
Vinyl Chloride mg/L 0.002 MAC < 0.0002 < 0.0002 < 0.0002 < 0.0002"<": indicats the result is below Method Detection LimitODWS: Ontario Drinking Water StandardMAC: Ontario Drinking Water Standard - Health Related (Maximum Acceptable Concentration)AO: Ontario Drining Water Standard - Non Health Related (Aesthetic Objective)mg/L: milligrams per litre, parts permillion (ppm)

Approved January 18, 2012 B4-46
Approved Assessment Report: Toronto and Region Source Protection Area
Stouffville Water Supply System
Inorganics Test Results
Stouffville Well 3 TreatedWW220002333
Reading Units ODWS 12/01/2009 14/04/2009 22/07/2009 28/10/2009
Antimony as Sb mg/L 0.006 IMAC 0.0005 0.0002 0.0003 0.0005
Arsenic as As mg/L 0.025 IMAC 0.0004 0.0002 0.0004 0.0003
Barium as Ba mg/L 1 MAC 0.1
Boron as B mg/L 5 IMAC < 0.009
Cadmium as Cd mg/L 0.005 MAC < 0.0001 < 0.0001 < 0.0001 < 0.0001
Chromium as Cr mg/L 0.05 MAC < 0.0001 < 0.0001 < 0.0001 < 0.0001
Fluoride as F mg/L 0.8 MAC < 0.08 < 0.08 0.04 0.03
Lead as Pb mg/L 0.01 MAC < 0.0001 < 0.0001 < 0.0001 < 0.0001
Mercury as Hg mg/L 0.001 MAC < 0.00002
Nitrate + Nitrite as N mg/L 10 MAC 0.21 0.22 0.48 0.22
Nitrate as N mg/L 10 MAC 0.21 0.22 0.48 0.22
Nitrite mg/L 1 MAC < 0.05 < 0.05 < 0.01 < 0.01
Selenium as Se mg/L 0.01 MAC 0.0006 0.0001 0.0007 0.0006
Sodium as Na mg/L 200 AO 37.5 37 37.9 38
Uranium as U mg/L 0.02 MAC 0.0029"<": indicats the result is below Method Detection LimitODWS: Ontario Drinking Water StandardMAC: Ontario Drinking Water Standard - Health Related (Maximum Acceptable Concentration)AO: Ontario Drining Water Standard - Non Health Related (Aesthetic Objective)mg/L: milligrams per litre, parts permillion (ppm)

Approved January 18, 2012B4-47
Appendix B: Watershed Characterization
Stouffville Water Supply System
Organics Test Results
Stouffville Well 3 TreatedWW220002333
Reading Units ODWS 12/01/2009 14/04/2009 22/07/2009 28/10/2009
(DDT) + Metabolites mg/L 0.03 MAC < 0.000008
1,1-dichloroethylene (vinylidene chloride) mg/L 0.014 MAC < 0.0003 < 0.0003 < 0.0003 < 0.0003
1,2-(o-dcb) Dichlorobenzene mg/L 0.2 MAC < 0.0001 < 0.0001 < 0.0001 < 0.0001
1,2-Dichloroethane mg/L 0.005 IMAC < 0.0001 < 0.0001 < 0.0001 < 0.0001
1,4-(p-dcb) Dichlorobenzene mg/L 0.005 MAC < 0.0001 < 0.0001 < 0.0001 < 0.0001
2,3,4,6-Tetrachlorophenol mg/L 0.1 MAC < 0.0005
2,4,5-trichlorophenoxyacetic acid (2,4,5-T) mg/L 0.28 MAC < 0.0005
2,4,6-Trichlorophenol mg/L 0.005 MAC < 0.0005
2,4-Dichlorophenol mg/L 0.9 MAC < 0.0004
2,4-dichlorophenoxyacetic acid (2,4-D) mg/L 0.1 IMAC < 0.0008
Alachlor mg/L 0.005 IMAC < 0.0004
Aldicarb mg/L 0.009 MAC < 0.006
Aldrin + Dieldrin mg/L 0.0007 MAC < 0.000006
Atrazine + N-dealkylated metabolites mg/L 0.005 IMAC < 0.0002
Azinphos-methyl mg/L 0.02 MAC < 0.0003
Bendiocarb mg/L 0.04 MAC < 0.003
Benzene mg/L 0.005 MAC < 0.0001 < 0.0001 < 0.0001 < 0.0001
Benzo(a)pyrene mg/L 0.00001 MAC < 0.00001
Bromoxynil mg/L 0.005 IMAC < 0.0004
Carbaryl mg/L 0.09 MAC < 0.003
Carbofuran mg/L 0.09 MAC < 0.003
Carbon Tetrachloride mg/L 0.005 MAC < 0.0002 < 0.0002 < 0.0002 < 0.0002
Chlordane (Total) mg/L 0.007 MAC < 0.000006
Chlorpyrifos mg/L 0.09 MAC < 0.0002
Cyanazine mg/L 0.01 IMAC < 0.0003
Diazinon mg/L 0.02 MAC < 0.0002
Dicamba mg/L 0.12 MAC < 0.0004
Dichloromethane mg/L 0.05 MAC < 0.0005 < 0.0005 < 0.0005 < 0.0005
Diclofop-methyl mg/L 0.009 MAC < 0.0004
Dimethoate mg/L 0.02 IMAC < 0.0003
Dinoseb mg/L 0.01 MAC < 0.0005
Diquat mg/L 0.07 MAC < 0.0001
Diuron mg/L 0.15 MAC < 0.003
Glyphosate mg/L 0.28 IMAC < 0.025
Heptachlor + Heptachlor Epoxide mg/L 0.003 MAC < 0.000008
Lindane mg/L 0.004 MAC < 0.000005
Malathion mg/L 0.19 MAC < 0.0002
Methoxychlor mg/L 0.9 MAC < 0.000009
Metolachlor mg/L 0.05 IMAC < 0.0002
Metribuzin mg/L 0.08 MAC < 0.0003
Monochlorobenzene mg/L 0.08 MAC < 0.0001 < 0.0001 < 0.0001 < 0.0001
Paraquat mg/L 0.01 IMAC < 0.0001
Parathion mg/L 0.05 MAC < 0.0002

Approved January 18, 2012 B4-48
Approved Assessment Report: Toronto and Region Source Protection Area
Organics Test Results
Stouffville Well 3 TreatedWW220002333
Reading Units ODWS 12/01/2009 14/04/2009 22/07/2009 28/10/2009
Pentachlorophenol mg/L 0.06 MAC < 0.0004
Phorate mg/L 0.002 IMAC < 0.0002
Picloram mg/L 0.19 IMAC < 0.0007
Polychlorinated Biphenyls (PCBs) mg/L 0.003 IMAC < 0.00002
Prometryne mg/L 0.001 IMAC < 0.0002
Simazine mg/L 0.01 IMAC < 0.0002
Temephos mg/L 0.28 IMAC < 0.003
Terbufos mg/L 0.001 IMAC < 0.0002
Tetrachloroethylene (perchloroethylene) mg/L 0.03 MAC < 0.0003 < 0.0003 < 0.0003 < 0.0003
Triallate mg/L 0.23 MAC < 0.004
Trichloroethene mg/L 0.005 MAC < 0.0001 < 0.0001 < 0.0001 < 0.0001
Trifluralin mg/L 0.045 IMAC < 0.000006
Vinyl Chloride mg/L 0.002 MAC < 0.0002 < 0.0002 < 0.0002 < 0.0002"<": indicats the result is below Method Detection LimitODWS: Ontario Drinking Water StandardMAC: Ontario Drinking Water Standard - Health Related (Maximum Acceptable Concentration)AO: Ontario Drining Water Standard - Non Health Related (Aesthetic Objective)mg/L: milligrams per litre, parts permillion (ppm)

Approved January 18, 2012B4-49
Appendix B: Watershed Characterization
Stouffville Water Supply System
Inorganics Test Results
Stouffville Well 5,6 TreatedWW220002333
Reading Units ODWS 12/01/2009 14/04/2009 22/07/2009 28/10/2009
Antimony as Sb mg/L 0.006 IMAC 0.0006 0.0003 0.0005 0.0007
Arsenic as As mg/L 0.025 IMAC 0.0002 0.0002 0.0003 0.0002
Barium as Ba mg/L 1 MAC 0.0795
Boron as B mg/L 5 IMAC < 0.009
Cadmium as Cd mg/L 0.005 MAC < 0.0001 < 0.0001 < 0.0001 < 0.0001
Chromium as Cr mg/L 0.05 MAC < 0.0001 < 0.0001 < 0.0001 < 0.0001
Fluoride as F mg/L 0.8 MAC < 0.04 0.04 0.03 0.026
Lead as Pb mg/L 0.01 MAC 0.0002 0.0001 0.0002 0.0001
Mercury as Hg mg/L 0.001 MAC < 0.00002
Nitrate + Nitrite as N mg/L 10 MAC 1.88 1.88 2.48 2.04
Nitrate as N mg/L 10 MAC 1.88 1.88 2.48 2.04
Nitrite mg/L 1 MAC < 0.03 < 0.03 < 0.005 < 0.005
Selenium as Se mg/L 0.01 MAC 0.0004 0.0004 0.0008 0.0005
Sodium as Na mg/L 200 AO 13.8 13.3 13.1 13.4
Uranium as U mg/L 0.02 MAC 0.0023"<": indicats the result is below Method Detection LimitODWS: Ontario Drinking Water StandardMAC: Ontario Drinking Water Standard - Health Related (Maximum Acceptable Concentration)AO: Ontario Drining Water Standard - Non Health Related (Aesthetic Objective)mg/L: milligrams per litre, parts permillion (ppm)

Approved January 18, 2012 B4-50
Approved Assessment Report: Toronto and Region Source Protection Area
Stouffville Water Supply System
Organics Test Results
Stouffville Well 5,6 TreatedWW220002333
Reading Units ODWS 12/01/2009 14/04/2009 22/07/2009 28/10/2009
(DDT) + Metabolites mg/L 0.03 MAC < 0.000008
1,1-dichloroethylene (vinylidene chloride) mg/L 0.014 MAC < 0.0003 < 0.0003 < 0.0003 < 0.0003
1,2-(o-dcb) Dichlorobenzene mg/L 0.2 MAC < 0.0001 < 0.0001 < 0.0001 < 0.0001
1,2-Dichloroethane mg/L 0.005 IMAC < 0.0001 < 0.0001 < 0.0001 < 0.0001
1,4-(p-dcb) Dichlorobenzene mg/L 0.005 MAC < 0.0001 < 0.0001 < 0.0001 < 0.0001
2,3,4,6-Tetrachlorophenol mg/L 0.1 MAC < 0.0005
2,4,5-trichlorophenoxyacetic acid (2,4,5-T) mg/L 0.28 MAC < 0.0005
2,4,6-Trichlorophenol mg/L 0.005 MAC < 0.0005
2,4-Dichlorophenol mg/L 0.9 MAC < 0.0004
2,4-dichlorophenoxyacetic acid (2,4-D) mg/L 0.1 IMAC < 0.0008
Alachlor mg/L 0.005 IMAC < 0.0004
Aldicarb mg/L 0.009 MAC < 0.006
Aldrin + Dieldrin mg/L 0.0007 MAC < 0.000006
Atrazine + N-dealkylated metabolites mg/L 0.005 IMAC < 0.0002
Azinphos-methyl mg/L 0.02 MAC < 0.0003
Bendiocarb mg/L 0.04 MAC < 0.003
Benzene mg/L 0.005 MAC < 0.0001 < 0.0001 < 0.0001 < 0.0001
Benzo(a)pyrene mg/L 0.00001 MAC < 0.00001
Bromoxynil mg/L 0.005 IMAC < 0.0004
Carbaryl mg/L 0.09 MAC < 0.003
Carbofuran mg/L 0.09 MAC < 0.003
Carbon Tetrachloride mg/L 0.005 MAC < 0.0002 < 0.0002 < 0.0002 < 0.0002
Chlordane (Total) mg/L 0.007 MAC < 0.000006
Chlorpyrifos mg/L 0.09 MAC < 0.0002
Cyanazine mg/L 0.01 IMAC < 0.0003
Diazinon mg/L 0.02 MAC < 0.0002
Dicamba mg/L 0.12 MAC < 0.0004
Dichloromethane mg/L 0.05 MAC < 0.0005 < 0.0005 < 0.0005 < 0.0005
Diclofop-methyl mg/L 0.009 MAC < 0.0004
Dimethoate mg/L 0.02 IMAC < 0.0003
Dinoseb mg/L 0.01 MAC < 0.0005
Diquat mg/L 0.07 MAC < 0.0001
Diuron mg/L 0.15 MAC < 0.003
Glyphosate mg/L 0.28 IMAC < 0.025
Heptachlor + Heptachlor Epoxide mg/L 0.003 MAC < 0.000008
Lindane mg/L 0.004 MAC < 0.000005
Malathion mg/L 0.19 MAC < 0.0002
Methoxychlor mg/L 0.9 MAC < 0.000009
Metolachlor mg/L 0.05 IMAC < 0.0002
Metribuzin mg/L 0.08 MAC < 0.0003
Monochlorobenzene mg/L 0.08 MAC < 0.0001 < 0.0001 < 0.0001 < 0.0001
Paraquat mg/L 0.01 IMAC < 0.0001
Parathion mg/L 0.05 MAC < 0.0002

Approved January 18, 2012B4-51
Appendix B: Watershed Characterization
Organics Test Results
Stouffville Well 5,6 TreatedWW220002333
Reading Units ODWS 12/01/2009 14/04/2009 22/07/2009 28/10/2009
Pentachlorophenol mg/L 0.06 MAC < 0.0004
Phorate mg/L 0.002 IMAC < 0.0002
Picloram mg/L 0.19 IMAC < 0.0007
Polychlorinated Biphenyls (PCBs) mg/L 0.003 IMAC < 0.00002
Prometryne mg/L 0.001 IMAC < 0.0002
Simazine mg/L 0.01 IMAC < 0.0002
Temephos mg/L 0.28 IMAC < 0.003
Terbufos mg/L 0.001 IMAC < 0.0002
Tetrachloroethylene (perchloroethylene) mg/L 0.03 MAC < 0.0003 < 0.0003 < 0.0003 < 0.0003
Triallate mg/L 0.23 MAC < 0.004
Trichloroethene mg/L 0.005 MAC < 0.0001 < 0.0001 < 0.0001 < 0.0001
Trifluralin mg/L 0.045 IMAC < 0.000006
Vinyl Chloride mg/L 0.002 MAC < 0.0002 < 0.0002 < 0.0002 < 0.0002"<": indicats the result is below Method Detection LimitODWS: Ontario Drinking Water StandardMAC: Ontario Drinking Water Standard - Health Related (Maximum Acceptable Concentration)AO: Ontario Drining Water Standard - Non Health Related (Aesthetic Objective)mg/L: milligrams per litre, parts permillion (ppm)

Approved January 18, 2012 B4-52
Approved Assessment Report: Toronto and Region Source Protection Area
Inorganics Test Results
Reading Units ODWS 10 Year Deep Sentry TW2009-01-28
10 Year Deep Sentry TW2009-08-04
10 Year Shallow Sentry TW2009-08-05
2 Year Deep Sentry TW2009-08-04
2 Year Shallow Sentry TW2009-07-20
Stouffville Gravel Pit TW2009-07-30
Antimony as Sb mg/L 0.006 IMAC 0.0004 0.0004 0.0005 0.0003 0.0003
Arsenic as As mg/L 0.025 IMAC 0.0002 0.0002 0.0004 0.0001 0.0001
Barium as Ba mg/L 1 MAC 0.08 0.0488 0.396 0.0564 0.0722
Boron as B mg/L 5 IMAC < 0.009 < 0.009 < 0.009 < 0.009 < 0.009
Cadmium as Cd mg/L 0.005 MAC < 0.0001 < 0.0001 < 0.0001 < 0.0001 < 0.0001
Chromium as Cr mg/L 0.05 MAC < 0.0001 < 0.0001 < 0.0001 0.0004 0.0002
Fluoride as F mg/L 0.8 MAC < 0.04 0.035 0.03 0.024 0.028 0.02
Lead as Pb mg/L 0.01 MAC < 0.0001 < 0.0001 < 0.0001 < 0.0001 < 0.0001 0.0002
Mercury as Hg mg/L 0.001 MAC 0.00008 < 0.00002 < 0.00002 < 0.00002 < 0.00002
Nitrate + Nitrite as N mg/L 10 MAC 1.26 1.82 0.97 4.2 6.34 9.87
Nitrate as N mg/L 10 MAC 1.26 1.82 0.968 4.2 6.34 9.87
Nitrite mg/L 1 MAC < 0.03 < 0.005 < 0.005 < 0.005 < 0.005 < 0.01
Selenium as Se mg/L 0.01 MAC 0.0006 0.0004 0.0004 < 0.0001 0.0001
Sodium as Na mg/L 200 AO 8.7 28.3 3.6 350 2.7 28.4
Uranium as U mg/L 0.02 MAC 0.0004 0.0004 0.0002 0.0004 0.0003"<": indicats the result is below Method Detection LimitODWS: Ontario Drinking Water StandardMAC: Ontario Drinking Water Standard - Health Related (Maximum Acceptable Concentration)AO: Ontario Drining Water Standard - Non Health Related (Aesthetic Objective)mg/L: milligrams per litre, parts permillion (ppm)

Approved January 18, 2012B4-53
Appendix B: Watershed Characterization
Organics Test Results
Reading Units ODWS 10 Year Deep Sentry TW2009-08-04
10 Year Shallow Sentry TW2009-08-05
2 Year Deep Sentry TW2009-08-04
2 Year Shallow Sentry TW2009-07-20
Stouffville Gravel Pit TW2009-07-30
(DDT) + Metabolites mg/L 0.03 MAC < 0.000008 < 0.000008 < 0.000008 < 0.000008 < 0.000008
1,1-dichloroethylene (vinylidene chloride) mg/L 0.014 MAC < 0.0003 < 0.0003 < 0.0003 < 0.0003 < 0.0003
1,2-(o-dcb) Dichlorobenzene mg/L 0.2 MAC < 0.0001 < 0.0001 < 0.0001 < 0.0001 < 0.0001
1,2-Dichloroethane mg/L 0.005 IMAC < 0.0001 < 0.0001 < 0.0001 < 0.0001 < 0.0001
1,4-(p-dcb) Dichlorobenzene mg/L 0.005 MAC < 0.0001 < 0.0001 < 0.0001 < 0.0001 < 0.0001
2,3,4,6-Tetrachlorophenol mg/L 0.1 MAC < 0.0005 < 0.0005 < 0.0005 < 0.0005 < 0.0005
2,4,5-trichlorophenoxyacetic acid (2,4,5-T) mg/L 0.28 MAC < 0.0005 < 0.0005 < 0.0005 < 0.0005 < 0.0005
2,4,6-Trichlorophenol mg/L 0.005 MAC < 0.0005 < 0.0005 < 0.0005 < 0.0005 < 0.0005
2,4-Dichlorophenol mg/L 0.9 MAC < 0.0007 < 0.0007 < 0.0007 < 0.0007 < 0.0007
2,4-dichlorophenoxyacetic acid (2,4-D) mg/L 0.1 IMAC < 0.0008 < 0.0008 < 0.0008 < 0.0008 < 0.0008
Alachlor mg/L 0.005 IMAC < 0.0004 < 0.0004 < 0.0004 < 0.0004 < 0.0004
Aldicarb mg/L 0.009 MAC < 0.0045 < 0.0045 < 0.0045 < 0.0045 < 0.0045
Aldrin + Dieldrin mg/L 0.0007 MAC < 0.000006 < 0.000006 < 0.000006 < 0.000006 < 0.000006
Atrazine + N-dealkylated metabolites mg/L 0.005 IMAC < 0.0002 < 0.0002 < 0.0002 < 0.0002 < 0.0002
Azinphos-methyl mg/L 0.02 MAC < 0.0003 < 0.0003 < 0.0003 < 0.0003 < 0.0003
Bendiocarb mg/L 0.04 MAC < 0.003 < 0.003 < 0.003 < 0.003 < 0.003
Benzene mg/L 0.005 MAC < 0.0001 < 0.0001 < 0.0001 < 0.0001 < 0.0001
Benzo(a)pyrene mg/L 0.00001 MAC < 0.00001 < 0.00001 < 0.00001 < 0.00001 < 0.00001
Bromoxynil mg/L 0.005 IMAC < 0.0004 < 0.0004 < 0.0004 < 0.0004 < 0.0004
Carbaryl mg/L 0.09 MAC < 0.003 < 0.003 < 0.003 < 0.003 < 0.003
Carbofuran mg/L 0.09 MAC < 0.003 < 0.003 < 0.003 < 0.003 < 0.003
Carbon Tetrachloride mg/L 0.005 MAC < 0.0002 < 0.0002 < 0.0002 < 0.0002 < 0.0002
Chlordane (Total) mg/L 0.007 MAC < 0.000006 < 0.000006 < 0.000006 < 0.000006 < 0.000006
Chlorpyrifos mg/L 0.09 MAC < 0.0002 < 0.0002 < 0.0002 < 0.0002 < 0.0002
Cyanazine mg/L 0.01 IMAC < 0.0003 < 0.0003 < 0.0003 < 0.0003 < 0.0003
Diazinon mg/L 0.02 MAC < 0.0002 < 0.0002 < 0.0002 < 0.0002 < 0.0002
Dicamba mg/L 0.12 MAC < 0.0004 < 0.0004 < 0.0004 < 0.0004 < 0.0004
Dichloromethane mg/L 0.05 MAC < 0.0005 < 0.0005 < 0.0005 < 0.0005 < 0.0005
Diclofop-methyl mg/L 0.009 MAC < 0.0004 < 0.0004 < 0.0004 < 0.0004 < 0.0004
Dimethoate mg/L 0.02 IMAC < 0.0003 < 0.0003 < 0.0003 < 0.0003 < 0.0003
Dinoseb mg/L 0.01 MAC < 0.0005 < 0.0005 < 0.0005 < 0.0005 < 0.0005
Diquat mg/L 0.07 MAC < 0.001 < 0.001 < 0.001 < 0.001 < 0.001
Diuron mg/L 0.15 MAC < 0.003 < 0.003 < 0.003 < 0.003 < 0.003
Glyphosate mg/L 0.28 IMAC < 0.025 < 0.025 < 0.025 < 0.025 < 0.025
Heptachlor + Heptachlor Epoxide mg/L 0.003 MAC < 0.000008 < 0.000008 < 0.000008 < 0.000008 < 0.000008
Lindane mg/L 0.004 MAC < 0.000005 < 0.000005 < 0.000005 < 0.000005 < 0.000005
Malathion mg/L 0.19 MAC < 0.0002 < 0.0002 < 0.0002 < 0.0002 < 0.0002
Methoxychlor mg/L 0.9 MAC < 0.000009 < 0.000009 < 0.000009 < 0.000009 < 0.000009
Metolachlor mg/L 0.05 IMAC < 0.0002 < 0.0002 < 0.0002 < 0.0002 < 0.0002
Metribuzin mg/L 0.08 MAC < 0.0003 < 0.0003 < 0.0003 < 0.0003 < 0.0003

Approved January 18, 2012 B4-54
Approved Assessment Report: Toronto and Region Source Protection Area
Organics Test Results
Reading Units ODWS 10 Year Deep Sentry TW2009-08-04
10 Year Shallow Sentry TW2009-08-05
2 Year Deep Sentry TW2009-08-04
2 Year Shallow Sentry TW2009-07-20
Stouffville Gravel Pit TW2009-07-30
Monochlorobenzene mg/L 0.08 MAC < 0.0001 < 0.0001 < 0.0001 < 0.0001 < 0.0001
Paraquat mg/L 0.01 IMAC < 0.001 < 0.001 < 0.001 < 0.001 < 0.001
Parathion mg/L 0.05 MAC < 0.0002 < 0.0002 < 0.0002 < 0.0002 < 0.0002
Pentachlorophenol mg/L 0.06 MAC < 0.0004 < 0.0004 < 0.0004 < 0.0004 < 0.0004
Phorate mg/L 0.002 IMAC < 0.0002 < 0.0002 < 0.0002 < 0.0002 < 0.0002
Picloram mg/L 0.19 IMAC < 0.0007 < 0.0007 < 0.0007 < 0.0007 < 0.0007
Polychlorinated Biphenyls (PCBs) mg/L 0.003 IMAC < 0.00002 < 0.00002 < 0.00002 < 0.00002 < 0.00002
Prometryne mg/L 0.001 IMAC < 0.0002 < 0.0002 < 0.0002 < 0.0002 < 0.0002
Simazine mg/L 0.01 IMAC < 0.0002 < 0.0002 < 0.0002 < 0.0002 < 0.0002
Temephos mg/L 0.28 IMAC < 0.003 < 0.003 < 0.003 < 0.003 < 0.003
Terbufos mg/L 0.001 IMAC < 0.0002 < 0.0002 < 0.0002 < 0.0002 < 0.0002
Tetrachloroethylene (perchloroethylene) mg/L 0.03 MAC < 0.0003 < 0.0003 < 0.0003 < 0.0003 < 0.0003
Triallate mg/L 0.23 MAC < 0.004 < 0.004 < 0.004 < 0.004 < 0.004
Trichloroethene mg/L 0.005 MAC < 0.0001 < 0.0001 < 0.0001 < 0.0001 < 0.0001
Trifluralin mg/L 0.045 IMAC < 0.000006 < 0.000006 < 0.000006 < 0.000006 < 0.000006
Vinyl Chloride mg/L 0.002 MAC < 0.0002 < 0.0002 < 0.0002 < 0.0002 < 0.0002"<": indicats the result is below Method Detection LimitODWS: Ontario Drinking Water StandardMAC: Ontario Drinking Water Standard - Health Related (Maximum Acceptable Concentration)AO: Ontario Drining Water Standard - Non Health Related (Aesthetic Objective)mg/L: milligrams per litre, parts permillion (ppm)
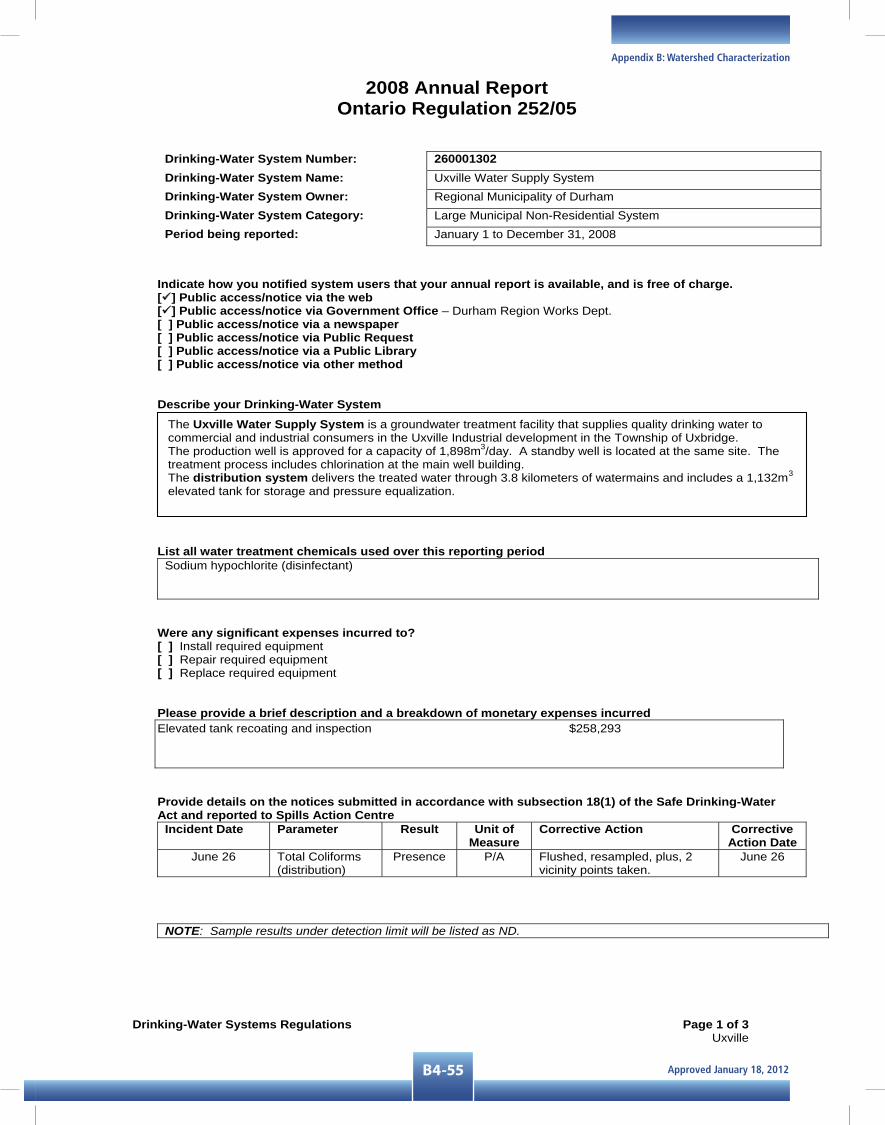
Approved January 18, 2012B4-55
Appendix B: Watershed Characterization
2008 Annual Report Ontario Regulation 252/05
Drinking-Water Systems Regulations Page 1 of 3 Uxville
Drinking-Water System Number: 260001302 Drinking-Water System Name: Uxville Water Supply System Drinking-Water System Owner: Regional Municipality of Durham Drinking-Water System Category: Large Municipal Non-Residential System Period being reported: January 1 to December 31, 2008
Indicate how you notified system users that your annual report is available, and is free of charge. [ ] Public access/notice via the web [ ] Public access/notice via Government Office – Durham Region Works Dept. [ ] Public access/notice via a newspaper [ ] Public access/notice via Public Request [ ] Public access/notice via a Public Library [ ] Public access/notice via other method
Describe your Drinking-Water System
List all water treatment chemicals used over this reporting period Sodium hypochlorite (disinfectant)
Were any significant expenses incurred to? [ ] Install required equipment [ ] Repair required equipment [ ] Replace required equipment
Please provide a brief description and a breakdown of monetary expenses incurred Elevated tank recoating and inspection $258,293
Provide details on the notices submitted in accordance with subsection 18(1) of the Safe Drinking-Water Act and reported to Spills Action Centre
Incident Date Parameter Result Unit of Measure
Corrective Action Corrective Action Date
June 26 Total Coliforms (distribution)
Presence P/A Flushed, resampled, plus, 2 vicinity points taken.
June 26
NOTE: Sample results under detection limit will be listed as ND.
The Uxville Water Supply System is a groundwater treatment facility that supplies quality drinking water to commercial and industrial consumers in the Uxville Industrial development in the Township of Uxbridge. The production well is approved for a capacity of 1,898m3/day. A standby well is located at the same site. The treatment process includes chlorination at the main well building. The distribution system delivers the treated water through 3.8 kilometers of watermains and includes a 1,132m3
elevated tank for storage and pressure equalization.

Approved January 18, 2012 B4-56
Approved Assessment Report: Toronto and Region Source Protection Area
2008 Annual Report Ontario Regulation 252/05
Drinking-Water Systems Regulations Page 2 of 3 Uxville
Microbiological testing done under the Schedule 2 or 3 of Regulation 252/05 during this reporting period.NumberofSamples
Range ofE.ColiMF
Range of Total ColiformMF
NumberofSamples
E.ColiP/A
Total ColiformP/A
Numberof HPC Samples
Range of HPCResults
Raw 94 ND ND-220 - - - - -Treated 2 ND ND 48 A A 50 ND-3Distribution 5 ND ND 104 A A-P(1)* 109 ND-190
MF: Membrane Filter; P/A: Presence/Absence; HPC: Heterotrophic Plate Count Units for MF are CFU/100mL and HPC are CFU/mL *Number in parentheses represents number of exceedance(s).
Operational testing done during the period covered by this Annual Report. Number ofSamples
Range of Results Unit of Measure
Turbidity – raw water 93 0.09-0.51 NTU Free Chlorine – Plant 259 0.79-1.92 mg/LFree Chlorine - Distribution 477 0.54-1.80 mg/L
Summary of additional testing and sampling carried out in accordance with the requirement of an approval, order or other legal instrument.
Date of legal instrument issued
Parameter Date Sampled Result Unit of Measure
-- -- -- -- --
Summary of Inorganic parameters tested during this reporting period or the most recent sample results Parameter Sample Date Result Unit of
Measure Exceedance Number of
Samples Antimony Feb 21 0.0003 mg/L No 1Arsenic Feb 21 0.0002 mg/L No 1Barium Feb 21 0.063 mg/L No 1Boron Feb 21 ND mg/L No 1Cadmium Feb 21 ND mg/L No 1Chromium Feb 21 0.0001 mg/L No 1Lead (distribution) Feb 21 0.0001 mg/L No 1Mercury Feb 21 ND ug/L No 1Selenium Feb 21 0.0002 mg/L No 1Sodium Feb 21 4.42 mg/L No 1Uranium Feb 21 0.001 mg/L No 1Fluoride Feb 21-Nov 26 ND-0.06 mg/L No 4Nitrite Feb 21-Nov 26 ND mg/L No 4Nitrate Feb 21-Nov 26 0.45-0.67 mg/L No 4
Summary of Organic parameters sampled during this reporting period or the most recent sample results Parameter Sample Date Result Unit of
Measure Exceedance Number
ofSamples
Alachlor August 20 ND ug/L No 1Aldicarb August 20 ND ug/L No 1Aldrin + Dieldrin August 20 ND ug/L No 1Atrazine + N-dealkylated metobolites August 20 ND ug/L No 1Azinphos-methyl August 20 ND ug/L No 1Bendiocarb August 20 ND ug/L No 1Benzene August 20 ND ug/L No 1Benzo(a)pyrene August 20 ND ug/L No 1

Approved January 18, 2012B4-57
Appendix B: Watershed Characterization
2008 Annual Report Ontario Regulation 252/05
Drinking-Water Systems Regulations Page 3 of 3 Uxville
Parameter Sample Date Result Unit of Measure
Exceedance Numberof
Samples Bromoxynil August 20 ND ug/L No 1Carbaryl August 20 ND ug/L No 1Carbofuran August 20 ND ug/L No 1Carbon Tetrachloride August 20 ND ug/L No 1Chlordane (Total) August 20 ND ug/L No 1Chlorpyrifos August 20 ND ug/L No 1Cyanazine August 20 ND ug/L No 1Diazinon August 20 ND ug/L No 1Dicamba August 20 ND ug/L No 11,2-Dichlorobenzene August 20 ND ug/L No 11,4-Dichlorobenzene August 20 ND ug/L No 1Dichlorodiphenyltrichloroethane (DDT) + metabolites
August 20 ND ug/L No 1
1,2-Dichlooethane August 20 ND ug/L No 11,1-Dichloroethylene (vinylidene chloride)
August 20 ND ug/L No 1
Dichloromethane August 20 ND ug/L No 12,4-Dichlorophenol August 20 ND ug/L No 12,4-Dichlorophenoxy acetic acid (2,4-D) August 20 ND ug/L No 1Diclofop-methyl August 20 ND ug/L No 1Dimethoate August 20 ND ug/L No 1Dinoseb August 20 ND ug/L No 1Diquat August 20 ND ug/L No 1Diuron August 20 ND ug/L No 1Glyphosate August 20 ND ug/L No 1Heptachlor + Heptachlor Epoxide August 20 ND ug/L No 1Lindane (Total) August 20 ND ug/L No 1Malathion August 20 ND ug/L No 1Methoxychlor August 20 ND ug/L No 1Metolachlor August 20 ND ug/L No 1Metribuzin August 20 ND ug/L No 1Monochlorobenzene August 20 ND ug/L No 1Paraquat August 20 ND ug/L No 1Parathion August 20 ND ug/L No 1Pentachlorophenol August 20 ND ug/L No 1Phorate August 20 ND ug/L No 1Picloram August 20 ND ug/L No 1Polychlorinated Biphenyls(PCB) August 20 ND ug/L No 1Prometryne August 20 ND ug/L No 1Simazine August 20 ND ug/L No 1THM – Distribution (annual average) Feb 21-Nov 26 3.25 ug/L No 4Temephos August 20 ND ug/L No 1Terbufos August 20 ND ug/L No 1Tetrachloroethylene August 20 ND ug/L No 12,3,4,6-Tetrachlorophenol August 20 ND ug/L No 1Triallate August 20 ND ug/L No 1Trichloroethylene August 20 ND ug/L No 12,4,6-Trichlorophenol August 20 ND ug/L No 12,4,5-Trichlorophenoxy acetic acid (2,4,5-T) August 20 ND ug/L No 1Trifluralin August 20 ND ug/L No 1Vinyl Chloride August 20 ND ug/L No 1

Approved January 18, 2012 B4-58
Approved Assessment Report: Toronto and Region Source Protection Area
This page is intentionally left blank.
Approved January 18, 2012B4-59
Appendix B: Watershed Characterization
Drinking Water Systems2008 Annual Report

Approved January 18, 2012 B4-60
Approved Assessment Report: Toronto and Region Source Protection Area
Drinking-Water Systems Regulation O. Reg. 170/03
Drinking-Water Systems Regulations – R.C. Harris WTP Annual Report (PIBS 4435e01) February 2008
Page 1 of 9
Part III Form 2 Section 11. ANNUAL REPORT.
Drinking-Water System Number: R. C. Harris WTP – 220002262Drinking-Water System Name: Toronto (R.C. Harris) Water Treatment Plant Drinking-Water System Owner: City of Toronto Drinking-Water System Category: Large Municipal Residential Period being reported: January 1, 2008 to December 31, 2008
Complete if your Category is Large Municipal Residential or Small Municipal Residential
Does your Drinking-Water System serve more than 10,000 people? Yes [ x ] No [ ]
Is your annual report available to the public at no charge on a web site on the Internet? Yes [ x ] No [ ]
Location where Summary Report required under O. Reg. 170/03 Schedule 22 will be available for inspection.
Complete for all other Categories.NOT APPLICABLE
Number of Designated Facilities served:
Did you provide a copy of your annual report to all Designated Facilities you serve?Yes [ ] No [ ]
Number of Interested Authorities you report to:
Did you provide a copy of your annual report to all Interested Authorities you report to for each Designated Facility? Yes [ ] No [ ]
Note: For the following tables below, additional rows or columns may be added or an appendix may be attached to the report
List all Drinking-Water Systems (if any), which receive all of their drinking water from your system: Drinking Water System Name Drinking Water System Number Region of York – receives some of their water from Toronto
260001929
Did you provide a copy of your annual report to all Drinking-Water System owners that are connected to you and to whom you provide all of its drinking water? Yes [ x ] No [ ]
Indicate how you notified system users that your annual report is available, and is free of charge.
Metro Hall, 18th Floor 55 John Street Toronto, Ontario M5V 3C6
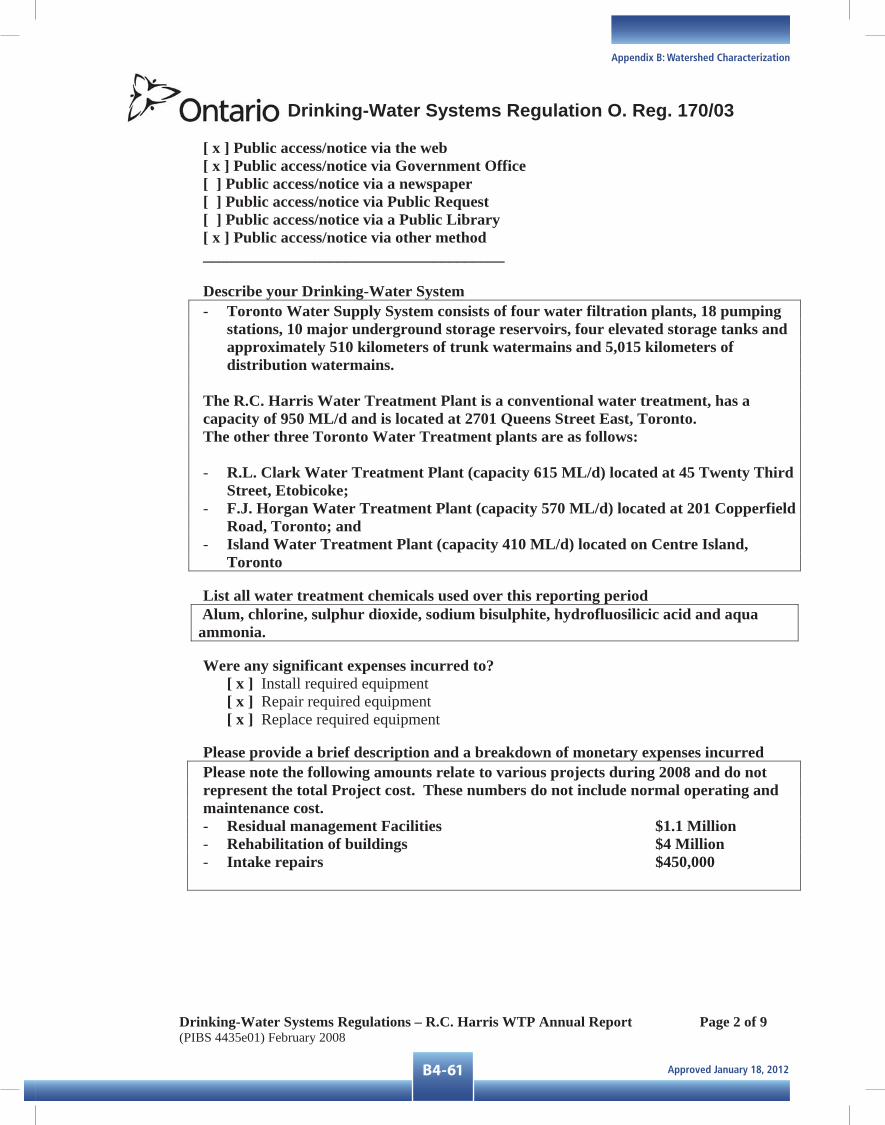
Approved January 18, 2012B4-61
Appendix B: Watershed Characterization
Drinking-Water Systems Regulation O. Reg. 170/03
Drinking-Water Systems Regulations – R.C. Harris WTP Annual Report (PIBS 4435e01) February 2008
Page 2 of 9
[ x ] Public access/notice via the web [ x ] Public access/notice via Government Office [ ] Public access/notice via a newspaper [ ] Public access/notice via Public Request [ ] Public access/notice via a Public Library[ x ] Public access/notice via other method______________________________________
Describe your Drinking-Water System - Toronto Water Supply System consists of four water filtration plants, 18 pumping
stations, 10 major underground storage reservoirs, four elevated storage tanks and approximately 510 kilometers of trunk watermains and 5,015 kilometers of distribution watermains.
The R.C. Harris Water Treatment Plant is a conventional water treatment, has a capacity of 950 ML/d and is located at 2701 Queens Street East, Toronto.The other three Toronto Water Treatment plants are as follows:
- R.L. Clark Water Treatment Plant (capacity 615 ML/d) located at 45 Twenty Third Street, Etobicoke;
- F.J. Horgan Water Treatment Plant (capacity 570 ML/d) located at 201 Copperfield Road, Toronto; and
- Island Water Treatment Plant (capacity 410 ML/d) located on Centre Island, Toronto
List all water treatment chemicals used over this reporting period Alum, chlorine, sulphur dioxide, sodium bisulphite, hydrofluosilicic acid and aqua ammonia.
Were any significant expenses incurred to? [ x ] Install required equipment [ x ] Repair required equipment [ x ] Replace required equipment
Please provide a brief description and a breakdown of monetary expenses incurred Please note the following amounts relate to various projects during 2008 and do not represent the total Project cost. These numbers do not include normal operating and maintenance cost. - Residual management Facilities $1.1 Million - Rehabilitation of buildings $4 Million - Intake repairs $450,000

Approved January 18, 2012 B4-62
Approved Assessment Report: Toronto and Region Source Protection Area
Drinking-Water Systems Regulation O. Reg. 170/03
Drinking-Water Systems Regulations – R.C. Harris WTP Annual Report (PIBS 4435e01) February 2008
Page 3 of 9
Provide details on the notices submitted in accordance with subsection 18(1) of the Safe Drinking-Water Act or section 16-4 of Schedule 16 of O.Reg.170/03 and reported to Spills Action Centre for the R.C. Harris Water Treatment Plant.
Incident Date
Parameter Result Unit of Measure Corrective Action Corrective ActionDate
6-Sep-08 Total Coliform Presence result in 100 mL sample
The test results of subsequent output samples taken at 12:00 and 18:00 on Sept. 6 indicated absence of total coliforms
7-Sep-08
Notices submitted in accordance with subsection 18(1) of the Safe Drinking-Water Act or section 16-4 of Schedule 16 of O.Reg.170/03 and reported to Spills Action Centre for the Distribution System (which is included under the R.C. Harris Drinking Water System Name and Number).
Incident Date
Parameter Result Unit of Measure Corrective Action Corrective ActionDate
9-Jan-08 Loss of Communication
NoSignal
Not Applicable Communication restored, chlorine residual checked
9-Jan-08
22-Jan-08 Loss of Communication
NoSignal
Not Applicable Communication restored, chlorine residual checked
22-Jan-08
16-Feb- 08 Total Coliform Presence result in 100 mL sample
Resampled plus 2 vicinity samples- 17-Feb-08
04-Mar-08 Total Coliform Presence result in 100 mL sample
Resampled plus 2 vicinity samples- 04-Mar-08
06-Mar-08 Incorrect Reading
<0.25 mg/L Analyzer repaired and calibrated 06-Mar-08
10-Mar-08 Loss of Communication
NoSignal
mg/L Communication Restored. Residual checked
10-Mar-08
11-Mar-08 Total Coliform Presence result in 100 mL sample
Resampled plus 2 vicinity samples- 14-Mar-08
23-Mar-08 Incorrect Reading
<0.25 mg/L Analyzer repaired and calibrated 26-Mar-08
22-Apr-08 Incorrect Reading
<0.25 mg/L Analyzer repaired and calibrated 23-Apr-08
23-Apr-08 Loss of Communication
NoSignal
Not Applicable Communication Restored. Residual checked
24-Apr-08
26-Apr-08 Incorrect Reading
<0.25 mg/L Analyzer repaired and calibrated 26-Apr-08
29-Apr-08 Loss of Communication
NoSignal
Not Applicable Communication Restored. Residual checked
29-Apr-08
29-Apr-08 Total Chlorine <0.04 mg/L Flushed, resampled 29-Apr-08 7-May-08 Incorrect
Reading<0.25 mg/L Analyzer repaired and calibrated 9-May-08
8-May-08 Total Coliform Presence result in 100 mL sample
Resampled plus 2 vicinity samples- 9-May-08
9-May-08 Loss of Communication
NoSignal
Not Applicable Communication Restored. Residual checked
9-May-08
22-May-08 Total Coliform Presence result in 100 mL sample
Resampled plus 2 vicinity samples 23-May-08
4-June-08 Total Coliform Presence result in 100 mL sample
Resampled plus 2 vicinity samples 5-June-08
6-June-08 Total Coliform Presence result in 100 mL sample
Resampled plus 2 vicinity samples 7-June-08
10-Jun-08 Loss of Communication
NoSignal
Not Applicable Communication Restored. Residual checked
10-Jun-08

Approved January 18, 2012B4-63
Appendix B: Watershed Characterization
Drinking-Water Systems Regulation O. Reg. 170/03
Drinking-Water Systems Regulations – R.C. Harris WTP Annual Report (PIBS 4435e01) February 2008
Page 4 of 9
Incident Date
Parameter Result Unit of Measure Corrective Action Corrective ActionDate
28-Jun-08 Loss of Communication
NoSignal
Not Applicable Communication Restored. Residual checked
28-Jun-08
1-Jul-08 Incorrect Reading
<0.25 mg/L Analyzer repaired and calibrated 1-Jul-08
8-Jul-08 Loss of Communication
NoSignal
Not Applicable Communication Restored. Residual checked
8-Jul-08
8-Jul-08 Loss of Communication
NoSignal
Not Applicable Communication Restored. Residual checked
8-Jul-08
14-Jul-08 Total Coliform Presence result in 100 mL sample L
Hydrant replacement. Resampled plus 2 vicinity samples
16-Jul-08
19-Jul-08 Total Coliform Presence result in 100 mL sample
Hydrant replacement. Resampled plus 2 vicinity samples
21-Jul-08
20-Jul-08 Loss of Communication
NoSignal
Not Applicable Communication Restored. Residual checked
20-Jul-08
20-Jul-08 Loss of Communication
NoSignal
Not Applicable Communication Restored. Residual checked
20-Jul-08
30-Jul-08 Total Coliform Presence result in 100 mL sample
Water Quality Inquiry. Resampled plus 2 vicinity samples
31-Jul-08
11-Aug-08 Total Coliform Presence result in 100 mL sample
Hydrant replacement. Resampled plus 2 vicinity samples
12-Aug-08
12-Aug-08 E. Coli Presence result in 100 mL sample
Hydrant replacement. Resampled plus 2 vicinity samples
15-Aug-08
14-Aug-08 Total Coliform 1 cfu/100mL Hydrant replacement. Resampled plus 2 vicinity samples
15-Aug-08
15-Aug-08 Loss of Communication
NoSignal
Not Applicable Communication Restored. Residual checked
15-Aug-08
15-Aug-08 Total Coliform Presence result in 100 mL sample
Hydrant replacement. Resampled plus 2 vicinity samples
16-Aug-08
19-Aug-08 Total Coliform Presence result in 100 mL sample
Resampled plus 2 vicinity samples 20-Aug-08
20-Aug-08 Total Coliform Presence result in 100 mL sample
Hydrant replacement. Resampled plus 2 vicinity samples
21-Aug-08
21-Aug-08 Loss of Communication
NoSignal
Not Applicable Communication Restored. Residual checked.
21-Aug-08
1-Sep-08 Total Coliform Presence result in 100 mL sample
Hydrant replacement. Resampled plus 2 vicinity samples
4-Sep-08
5-Sep-08 Total Coliform Presence result in 100 mL sample
Resampled plus 2 vicinity samples 6-Sep-08
5-Sep-08 Loss of Communication
NoSignal
Not Applicable Communication Restored. Residual checked
5-Sep-08
7-Sep-08 Loss of Communication
NoSignal
Not Applicable Communication Restored. Residual checked
7-Sep-08
8-Sep-08 Total Coliform Presence result in 100 mL sample L
Resampled plus 2 vicinity samples 9-Sep-08
11-Sep-08 Loss of Communication
NoSignal
Not Applicable Communication Restored. Residual checked
11-Sep-08
13-Sep-08 Loss of Communication
NoSignal
Not Applicable Communication Restored. Residual checked
13-Sep-08
14-Sep-08 Loss of Communication
NoSignal
Not Applicable Communication Restored. Residual checked
14-Sep-08
14-Sep-08 Loss of Communication
NoSignal
Not Applicable Communication Restored. Residual checked
14-Sep-08
15-Sep-08 Total Coliform Presence result in 100 mL sample
Hydrant replacement. Resampled plus 2 vicinity samples
18-Sep-08
19-Sep-08 Total Coliform Presence result in 100 mL sample
Hydrant replacement. Resampled plus 2 vicinity samples
22-Sep-08
19-Sep-08 Total Coliform Presence result in 100 mL sample
Hydrant replacement. Resampled plus 2 vicinity samples
22-Sep-08
23-Sep-08 Total Coliform Presence result in 100 mL sample
Resampled plus 2 vicinity samples 24-Sep-08

Approved January 18, 2012 B4-64
Approved Assessment Report: Toronto and Region Source Protection Area
Drinking-Water Systems Regulation O. Reg. 170/03
Drinking-Water Systems Regulations – R.C. Harris WTP Annual Report (PIBS 4435e01) February 2008
Page 5 of 9
Incident Date
Parameter Result Unit of Measure Corrective Action Corrective ActionDate
30-Sep-08 Total Coliform Presence result in 100 mL sample
Hydrant replacement. Resampled plus 2 vicinity samples
21-Oct-08
1-Oct-08 Total Coliform Presence result in 100 mL sample
Hydrant replacement. Resampled plus 2 vicinity samples
3-Oct-08
2-Oct-08 Total Coliform Presence result in 100 mL sample
Hydrant replacement. Resampled plus 2 vicinity samples
5-Oct-08
3-Oct-08 Total Coliform 4 cfu/100mL Hydrant replacement. Resampled plus 2 vicinity samples
18-Oct-08
6-Oct-08 Total Coliform 5 cfu/100mL Hydrant replacement. Resampled plus 2 vicinity samples
20-Oct-08
6-Oct-08 Total Coliform 19 cfu/100mL Hydrant replacement. Resampled plus 2 vicinity samples
20-Oct-08
8-Oct-08 Total Coliform 9 cfu/100mL Hydrant replacement. Resampled plus 2 vicinity samples
1 3-Oct-08
11-Oct-08 Total Coliform 1 cfu/100mL Hydrant replacement. Resampled plus 2 vicinity samples
20-Oct-08
14-Oct-08 Total Coliform 1 cfu/100mL Hydrant replacement. Resampled plus 2 vicinity samples
20-Oct-08
16-Oct-08 Loss of Communication
NoSignal
Not Applicable Communication Restored. Residual checked
16-Oct-08
18-Oct-08 Total Coliform 1 cfu/100mL Hydrant replacement. Resampled plus 2 vicinity samples
20-Oct-08
5-Nov-08 Total Coliform Presence result in 100 mL sample
Hydrant replacement. Resampled plus 2 vicinity samples
10-Nov-08
6-Nov-08 Total Coliform Presence result in 100 mL sample
Hydrant replacement. Resampled plus 2 vicinity samples
12-Nov-08
6-Nov-08 Total Coliform Presence result in 100 mL sample
Hydrant replacement. Resampled plus 2 vicinity samples
8-Nov-08
7-Nov-08 Total Coliform Presence result in 100 mL sample
Hydrant replacement. Resampled plus 2 vicinity samples
9-Nov-08
8-Nov-08 Total Coliform 1 cfu/100mL Hydrant replacement. Resampled plus 2 vicinity samples
12-Nov-08
10-Nov-08 Total Coliform 1 cfu/100mL Hydrant replacement. Resampled plus 2 vicinity samples
13-Nov-08
11-Nov-08 Total Coliform 1 cfu/100mL Hydrant replacement. Resampled plus 2 vicinity samples
13-Nov-08
14-Nov-08 Total Coliform Presence result in 100 mL sample
. Resampled plus 2 vicinity samples 15-Nov-08
20-Nov-08 Loss of Communication
NoSignal
Not Applicable Communication Restored. Residual checked
20-Nov-08
10-Dec-08 Loss of Communication
NoSignal
Not Applicable Communication Restored. Residual checked
10-Dec-08
21-Dec-08 Loss of Communication
NoSignal
Not Applicable Communication Restored. Residual checked
21-Dec-08
24-Dec-08 Loss of Communication
NoSignal
Not Applicable Communication Restored. Residual checked
24-Dec-08

Approved January 18, 2012B4-65
Appendix B: Watershed Characterization
Drinking-Water Systems Regulation O. Reg. 170/03
Drinking-Water Systems Regulations – R.C. Harris WTP Annual Report (PIBS 4435e01) February 2008
Page 6 of 9
Microbiological testing done under the Schedule 10, 11 or 12 of Regulation 170/03, during this reporting period.
Number of Samples
Range of E.Coli Or Fecal Results (min #)-(max #)
Range of Total Coliform Results(min #)-(max #)
Number of HPC Samples
Range of HPC Results(min #)-(max #)
Raw 365 0-16 0-120 363 0-826 Treated 1460 1460 A (100 % A) 1459 A, 1 P (99.9 %A) 1460 0-1482 Distribution 4915 4915 A (100 % A) 4905 A, 10 P (99.8 %A) 4885 0 -310
A = Absence P = Presence
Operational testing done under Schedule 7, 8 or 9 of Regulation 170/03 during the period covered by this Annual Report.
Number of Grab Samples
Range of Results (min #)-(max #)
Turbidity 8760 0.00 – 1.28 NTU Chlorine 8760 0.90 – 1.91 mg/L Fluoride (If the DWS provides fluoridation)
8760 0.02 – 2.00 mg/L
Chlorine for Distribution System
4915 0.25 – 1.56
Operational testing for Lead and THMs for End of the Line Distribution System done under Schedule 13 of Regulation 170/03 during the period covered by this Annual Report.
Number of Grab Samples
Range of Results (min #)-(max #)
THMs 6 0.0108 – 0.0164
NOTE: Record the unit of measure if it is not milligrams per litre.
NOTE: For continuous monitors use 8760 as the number of samples.
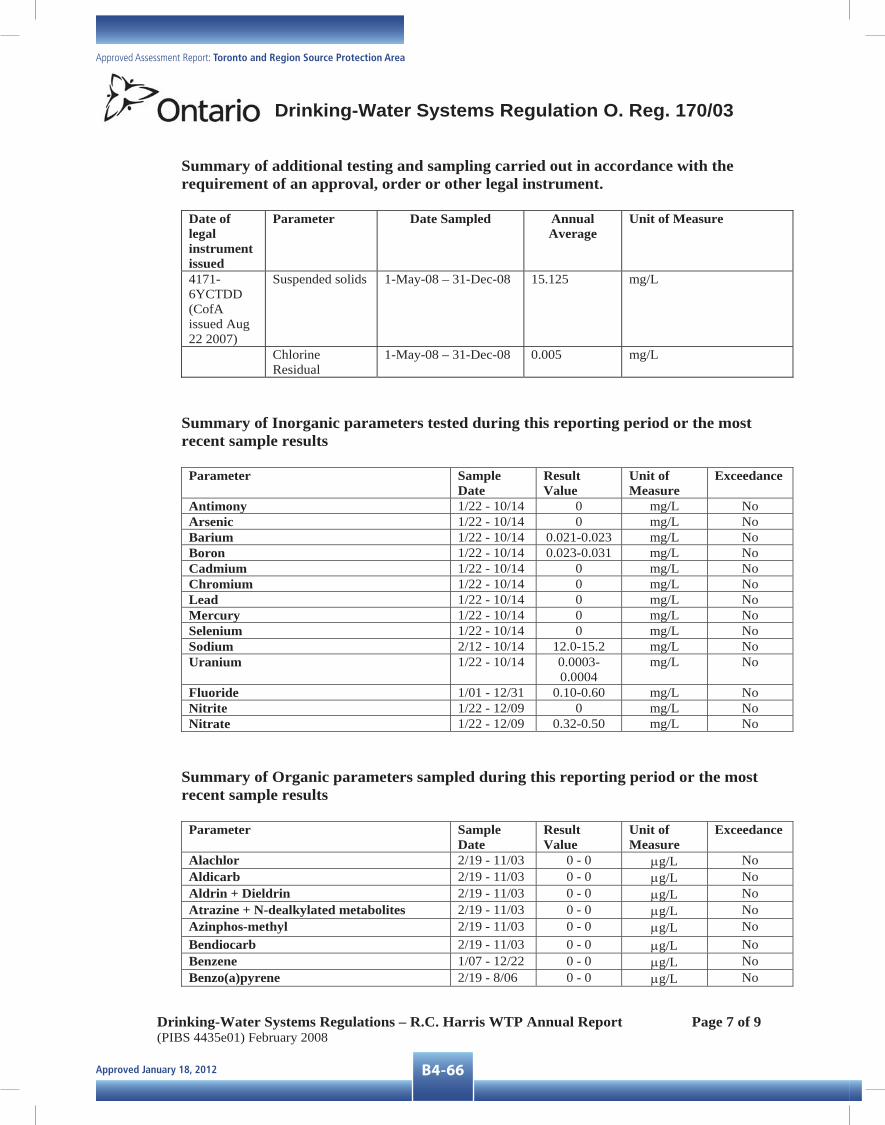
Approved January 18, 2012 B4-66
Approved Assessment Report: Toronto and Region Source Protection Area
Drinking-Water Systems Regulation O. Reg. 170/03
Drinking-Water Systems Regulations – R.C. Harris WTP Annual Report (PIBS 4435e01) February 2008
Page 7 of 9
Summary of additional testing and sampling carried out in accordance with the requirement of an approval, order or other legal instrument.
Date of legal instrument issued
Parameter Date Sampled Annual Average
Unit of Measure
4171-6YCTDD (CofA issued Aug 22 2007)
Suspended solids 1-May-08 – 31-Dec-08 15.125 mg/L
Chlorine Residual
1-May-08 – 31-Dec-08 0.005 mg/L
Summary of Inorganic parameters tested during this reporting period or the most recent sample results
Parameter Sample Date
Result Value
Unit of Measure
Exceedance
Antimony 1/22 - 10/14 0 mg/L No Arsenic 1/22 - 10/14 0 mg/L No Barium 1/22 - 10/14 0.021-0.023 mg/L No Boron 1/22 - 10/14 0.023-0.031 mg/L No Cadmium 1/22 - 10/14 0 mg/L No Chromium 1/22 - 10/14 0 mg/L No Lead 1/22 - 10/14 0 mg/L No Mercury 1/22 - 10/14 0 mg/L No Selenium 1/22 - 10/14 0 mg/L No Sodium 2/12 - 10/14 12.0-15.2 mg/L No Uranium 1/22 - 10/14 0.0003-
0.0004 mg/L No
Fluoride 1/01 - 12/31 0.10-0.60 mg/L No Nitrite 1/22 - 12/09 0 mg/L No Nitrate 1/22 - 12/09 0.32-0.50 mg/L No
Summary of Organic parameters sampled during this reporting period or the most recent sample results
Parameter Sample Date
Result Value
Unit of Measure
Exceedance
Alachlor 2/19 - 11/03 0 - 0 μg/L NoAldicarb 2/19 - 11/03 0 - 0 μg/L NoAldrin + Dieldrin 2/19 - 11/03 0 - 0 μg/L NoAtrazine + N-dealkylated metabolites 2/19 - 11/03 0 - 0 μg/L NoAzinphos-methyl 2/19 - 11/03 0 - 0 μg/L NoBendiocarb 2/19 - 11/03 0 - 0 μg/L NoBenzene 1/07 - 12/22 0 - 0 μg/L NoBenzo(a)pyrene 2/19 - 8/06 0 - 0 μg/L No

Approved January 18, 2012B4-67
Appendix B: Watershed Characterization
Drinking-Water Systems Regulation O. Reg. 170/03
Drinking-Water Systems Regulations – R.C. Harris WTP Annual Report (PIBS 4435e01) February 2008
Page 8 of 9
Parameter Sample Date
Result Value
Unit of Measure
Exceedance
Bromoxynil 2/19 - 11/03 0 - 0 μg/L NoCarbaryl 2/19 - 11/03 0 - 0 μg/L NoCarbofuran 2/19 - 11/03 0 - 0 μg/L NoCarbon Tetrachloride 1/07 - 12/22 0 - 0 μg/L NoChlordane (Total) 2/19 - 11/03 0 - 0 μg/L NoChlorpyrifos 2/19 - 11/03 0 - 0 μg/L NoCyanazine 2/19 - 11/03 0 - 0 μg/L NoDiazinon 2/19 - 11/03 0 - 0 μg/L NoDicamba 2/19 - 11/03 0 - 0 μg/L No1,2-Dichlorobenzene 1/07 - 12/22 0 - 0 μg/L No1,4-Dichlorobenzene 1/07 - 12/22 0 - 0 μg/L NoDichlorodiphenyltrichloroethane (DDT) + metabolites
2/19 - 11/03 0 - 0 μg/L No
1,2-Dichloroethane 1/07 - 12/22 0 - 0 μg/L No1,1-Dichloroethylene (vinylidene chloride)
1/07 - 12/22 0 - 0 μg/L No
Dichloromethane 1/07 - 12/22 0 - 0 μg/L No2-4 Dichlorophenol 2/19 - 2/19 0 - 0 μg/L No2,4-Dichlorophenoxy acetic acid (2,4-D) 2/19 - 11/03 0 - 0 μg/L NoDiclofop-methyl 2/19 - 11/03 0 - 0 μg/L NoDimethoate 2/19 - 11/03 0 - 0 μg/L NoDinoseb 2/19 - 11/03 0 - 0 μg/L NoDiquat 2/19 - 11/03 0 - 0 μg/L NoDiuron 2/19 - 11/03 0 - 0 μg/L NoGlyphosate 2/19 - 2/19 0 - 0 μg/L NoHeptachlor + Heptachlor Epoxide 2/19 - 11/03 0 - 0 μg/L NoLindane (Total) 2/19 - 11/03 0 - 0 μg/L NoMalathion 2/19 - 11/03 0 - 0 μg/L NoMethoxychlor 2/19 - 11/03 0 - 0 μg/L NoMetolachlor 2/19 - 11/03 0 - 0 μg/L NoMetribuzin 2/19 - 11/03 0 - 0 μg/L NoMonochlorobenzene (chlorobenzene) 1/07 - 12/22 0 - 0 μg/L NoParaquat 2/19 - 2/19 0 - 0 μg/L NoParathion 2/19 - 11/03 0 - 0 μg/L NoPentachlorophenol 2/19 - 2/19 0 - 0 μg/L NoPhorate 2/19 - 11/03 0 - 0 μg/L NoPicloram 2/19 - 11/03 0 - 0 μg/L NoPolychlorinated Biphenyls(PCB) 2/19 - 11/03 0 - 0 μg/L NoPrometryne 2/19 - 11/03 0 - 0 μg/L NoSimazine 2/19 - 11/03 0 - 0 μg/L NoTHM(NOTE: show latest annual average)
1/07 - 12/22 10.2 μg/L No
Temephos 2/19 - 11/03 0 - 0 μg/L NoTerbufos 2/19 - 11/03 0 - 0 μg/L NoTetrachloroethylene 1/07 - 12/01 0 - 0 μg/L No2,3,4,6-Tetrachlorophenol 2/19 - 2/19 0 - 0 μg/L NoTriallate 2/19 - 11/03 0 - 0 μg/L NoTrichloroethylene 1/07 - 12/22 0 - 0 μg/L No2,4,6-Trichlorophenol 2/19 - 2/19 0 - 0 μg/L No

Approved January 18, 2012 B4-68
Approved Assessment Report: Toronto and Region Source Protection Area
Drinking-Water Systems Regulation O. Reg. 170/03
Drinking-Water Systems Regulations – R.C. Harris WTP Annual Report (PIBS 4435e01) February 2008
Page 9 of 9
Parameter Sample Date
Result Value
Unit of Measure
Exceedance
2,4,5-Trichlorophenoxy acetic acid (2,4,5-T) 2/19 - 11/03 0 - 0 μg/L NoTrifluralin 2/19 - 11/03 0 - 0 μg/L NoVinyl Chloride 1/07 - 12/22 0 - 0 μg/L No
Availability of the Report
This report along with a copy of the Summary Report (to be available after March 31, 2009) prepared under Schedule 22 of O. Reg. 170/03 will be posted on the City’s website at www.toronto.ca/water.
These reports will also be available for inspection at the Toronto Water offices in Metro Hall, 18th Floor, 55 John Street, Toronto, Ontario M5V 3C6 or by calling (416) 392-8222.
Report Prepared: February 27, 2009

Approved January 18, 2012B4-69
Appendix B: Watershed Characterization
Drinking-Water Systems Regulation O. Reg. 170/03
Drinking-Water Systems Regulations – R.L. Clark WTP Annual Report (PIBS 4435e01) February 2008
Page 1 of 5
Part III Form 2 Section 11. ANNUAL REPORT.
Drinking-Water System Number: R.L. Clark WTP - 220002253 Drinking-Water System Name: Toronto (R.L. Clark) Water Treatment Plant Drinking-Water System Owner: City of Toronto Drinking-Water System Category: Large Municipal Residential Period being reported: January 1, 2008 to December 31, 2008
Complete if your Category is Large Municipal Residential or Small Municipal Residential
Does your Drinking-Water System serve more than 10,000 people? Yes [ x ] No [ ]
Is your annual report available to the public at no charge on a web site on the Internet? Yes [ x ] No [ ]
Location where Summary Report required under O. Reg. 170/03 Schedule 22 will be available for inspection.
Complete for all other Categories.
Number of Designated Facilities served:
Did you provide a copy of your annual report to all Designated Facilities you serve?Yes [ ] No [ ]
Number of Interested Authorities you report to:
Did you provide a copy of your annual report to all Interested Authorities you report to for each Designated Facility? Yes [ ] No [ ]
Note: For the following tables below, additional rows or columns may be added or an appendix may be attached to the report
List all Drinking-Water Systems (if any), which receive all of their drinking water from your system: Drinking Water System Name Drinking Water System Number Region of York – receives some of their water from Toronto
260001929
Did you provide a copy of your annual report to all Drinking-Water System owners that are connected to you and to whom you provide all of its drinking water? Yes [ x ] No [ ]
Indicate how you notified system users that your annual report is available, and is free of charge.
Metro Hall, 18th Floor 55 John Street Toronto, Ontario M5V 3C6

Approved January 18, 2012 B4-70
Approved Assessment Report: Toronto and Region Source Protection Area
Drinking-Water Systems Regulation O. Reg. 170/03
Drinking-Water Systems Regulations – R.L. Clark WTP Annual Report (PIBS 4435e01) February 2008
Page 2 of 5
[ x ] Public access/notice via the web [ x ] Public access/notice via Government Office [ ] Public access/notice via a newspaper [ ] Public access/notice via Public Request [ ] Public access/notice via a Public Library[ x ] Public access/notice via other method _______________________________________
Describe your Drinking-Water System Toronto Water Supply System consists of four water treatment plants, 18 pumping stations, 10 major underground storage reservoirs, four elevated storage tanks and approximately 510 kilometers of trunk watermains and 5,015 kilometers of distribution watermains.
The R.L. Clark Water Treatment Plant is a conventional water treatment plant, has a rated capacity of 615 ML/d and is located at 45 Twenty-Third Street, Etobicoke.
The other three Toronto water treatment plants are as follows:
- R.C. Harris Water Treatment Plant (capacity 950 ML/d) located at 2701 Queen Street East, Toronto;
- F.J. Horgan Water Treatment Plant (capacity 570 ML/d) located at 201 Copperfield Road, Toronto; and
- Island Water Treatment Plant (capacity 410 ML/d) located on Centre Island, Toronto
List all water treatment chemicals used over this reporting period Alum, chlorine, sulphur dioxide, hydrofluosilicic acid, aqua ammonia and powdered activated carbon.
Were any significant expenses incurred to? [ x ] Install required equipment [ x ] Repair required equipment [ x ] Replace required equipment

Approved January 18, 2012B4-71
Appendix B: Watershed Characterization
Drinking-Water Systems Regulation O. Reg. 170/03
Drinking-Water Systems Regulations – R.L. Clark WTP Annual Report (PIBS 4435e01) February 2008
Page 3 of 5
Please provide a brief description and a breakdown of monetary expenses incurred Please note that the following amounts related to various projects outline expenditures during 2008 and do not represent the total project costs at the R.L. Clark Water Treatment Plant. - Residue Management Facilities $ 2.19 Million - Equipment Replacement/Repair/Rehab $ 580,000 - HVAC Rehabilitation $ 520,000 - Electrical Upgrades $ 510,000 - Diesel Storage Tank $ 440,000 - Process Equipment Upgrades $ 440,000 - Administration Building Rehabilitation $ 180,000
Provide details on the notices submitted in accordance with subsection 18(1) of the Safe Drinking-Water Act or section 16-4 of Schedule 16 of O.Reg.170/03 and reported to Spills Action Centre
IncidentDate
Parameter Result Unit of Measure
Corrective Action Corrective Action Date
16-Jan-08 Total Coliforms
Presence Confirmed
P.A./100 mL Reviewed treatment records. Resampled.
18-Jan-08
Microbiological testing done under the Schedule 10, 11 or 12 of Regulation 170/03, during this reporting period.
Number of Samples
Range of E.Coli Or Fecal Results (min #)-(max #)
Range of Total Coliform Results (min #)-(max #)
Number of HPC Samples
Range of HPC Results(min #)-(max #)
Raw 351 0 - 32 0 – 660 350 0 – 855 Treated 1405 1405 A (100 % A) 1404 A, 1 P (99.9 % A) 1405 0 - 103
A = Absence P = Presence
Operational testing done under Schedule 7, 8 or 9 of Regulation 170/03 during the period covered by this Annual Report.
Number of Grab Samples
Range of Results (min #)-(max #)
Turbidity 8760 0.12 – 0.30 NTU Chlorine 8760 1.21 – 0.91 mg/L Fluoride (If the DWS provides fluoridation) (Plant output spot samples)
7214 0.50 – 0.67 mg/L
NOTE: Record the unit of measure if it is not milligrams per litre.
NOTE: For continuous monitors use 8760 as the number of samples.

Approved January 18, 2012 B4-72
Approved Assessment Report: Toronto and Region Source Protection Area
Drinking-Water Systems Regulation O. Reg. 170/03
Drinking-Water Systems Regulations – R.L. Clark WTP Annual Report (PIBS 4435e01) February 2008
Page 4 of 5
Summary of Inorganic parameters tested during this reporting period or the most recent sample results
Parameter Sample Date
Result Value
Unit of Measure
Exceedance
Antimony 3/07 – 11/14 0-0 mg/L Arsenic 3/07 – 11/14 0-0 mg/L Barium 3/07 – 11/14 0.022-0.024 mg/L Boron 3/07 – 11/14 0.023-0.027 mg/L Cadmium 3/07 – 11/14 0-0 mg/L Chromium 3/07 – 11/14 0-0 mg/L Lead 3/07 – 11/14 0-0 mg/L Mercury 3/07 – 11/14 0-0 mg/L Selenium 3/07 – 11/14 0-0 mg/L Sodium 1/05 – 9/19 11.4-19.6 mg/L Uranium 3/07 – 11/14 0.0003-
0.0003 mg/L
Fluoride 1/01 – 12/31 0.14-0.90 mg/L Nitrite 1/17 – 12/12 0-0 mg/L Nitrate 1/17 – 12/12 0.32-0.54 mg/L
Summary of Organic parameters sampled during this reporting period or the most recent sample results
Parameter Sample Date
Result Value
Unit of Measure
Exceedance
Alachlor 3/06-7/24 0-0 µg/L Aldicarb 3/06-7/24 0-0 µg/L Aldrin + Dieldrin 3/06-7/24 0-0 µg/L Atrazine + N-dealkylated metabolites 3/06-7/24 0-0 µg/L Azinphos-methyl 3/06-7/24 0-0 µg/L Bendiocarb 3/06-7/24 0-0 µg/L Benzene 1/09-11/20 0-0 µg/L Benzo(a)pyrene 3/06-11/20 0-0 µg/L Bromoxynil 3/06-7/24 0-0 µg/L Carbaryl 3/06-7/24 0-0 µg/L Carbofuran 3/06-7/24 0-0 µg/L Carbon Tetrachloride 1/09-11/20 0-0 µg/L Chlordane (Total) 3/06-7/24 0-0 µg/L Chlorpyrifos 3/06-7/24 0-0 µg/L Cyanazine 3/06-7/24 0-0 µg/L Diazinon 3/06-7/24 0-0 µg/L Dicamba 3/06-7/24 0-0 µg/L 1,2-Dichlorobenzene 1/09-11/20 0-0 µg/L 1,4-Dichlorobenzene 1/09-11/20 0-0 µg/L Dichlorodiphenyltrichloroethane (DDT) + metabolites
3/06-7/24 0-0 µg/L
1,2-Dichloroethane 1/09-11/20 0-0 µg/L 1,1-Dichloroethylene (vinylidene chloride)
1/09-11/20 0-0 µg/L
Dichloromethane 1/09-11/20 0-0 µg/L 2-4 Dichlorophenol 3/06-7/24 0-0 µg/L 2,4-Dichlorophenoxy acetic acid (2,4-D) 3/06-7/24 0-0 µg/L Diclofop-methyl 3/06-7/24 0-0 µg/L Dimethoate 3/06-7/24 0-0 µg/L Dinoseb 3/06-7/24 0-0 µg/L
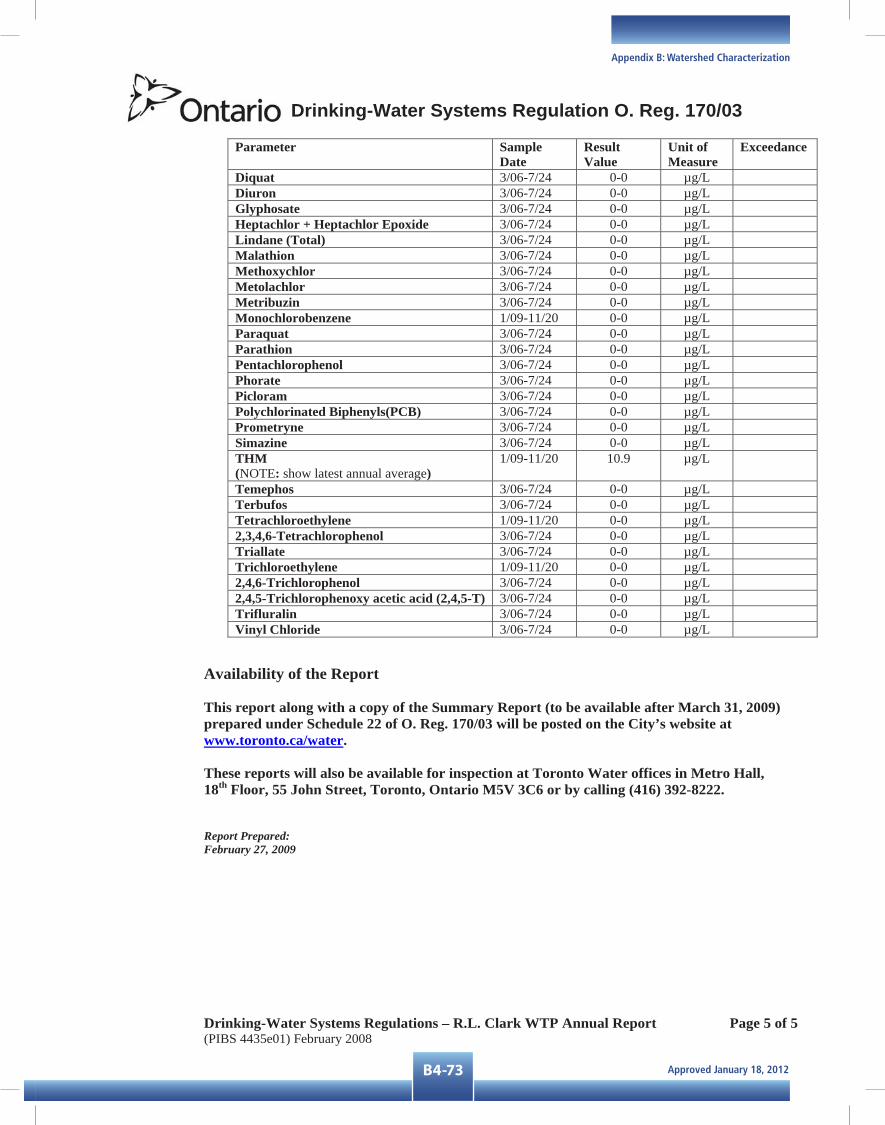
Approved January 18, 2012B4-73
Appendix B: Watershed Characterization
Drinking-Water Systems Regulation O. Reg. 170/03
Drinking-Water Systems Regulations – R.L. Clark WTP Annual Report (PIBS 4435e01) February 2008
Page 5 of 5
Parameter Sample Date
Result Value
Unit of Measure
Exceedance
Diquat 3/06-7/24 0-0 µg/L Diuron 3/06-7/24 0-0 µg/L Glyphosate 3/06-7/24 0-0 µg/L Heptachlor + Heptachlor Epoxide 3/06-7/24 0-0 µg/L Lindane (Total) 3/06-7/24 0-0 µg/L Malathion 3/06-7/24 0-0 µg/L Methoxychlor 3/06-7/24 0-0 µg/L Metolachlor 3/06-7/24 0-0 µg/L Metribuzin 3/06-7/24 0-0 µg/L Monochlorobenzene 1/09-11/20 0-0 µg/L Paraquat 3/06-7/24 0-0 µg/L Parathion 3/06-7/24 0-0 µg/L Pentachlorophenol 3/06-7/24 0-0 µg/L Phorate 3/06-7/24 0-0 µg/L Picloram 3/06-7/24 0-0 µg/L Polychlorinated Biphenyls(PCB) 3/06-7/24 0-0 µg/L Prometryne 3/06-7/24 0-0 µg/L Simazine 3/06-7/24 0-0 µg/L THM(NOTE: show latest annual average)
1/09-11/20 10.9 µg/L
Temephos 3/06-7/24 0-0 µg/L Terbufos 3/06-7/24 0-0 µg/L Tetrachloroethylene 1/09-11/20 0-0 µg/L 2,3,4,6-Tetrachlorophenol 3/06-7/24 0-0 µg/L Triallate 3/06-7/24 0-0 µg/L Trichloroethylene 1/09-11/20 0-0 µg/L 2,4,6-Trichlorophenol 3/06-7/24 0-0 µg/L 2,4,5-Trichlorophenoxy acetic acid (2,4,5-T) 3/06-7/24 0-0 µg/L Trifluralin 3/06-7/24 0-0 µg/L Vinyl Chloride 3/06-7/24 0-0 µg/L
Availability of the Report
This report along with a copy of the Summary Report (to be available after March 31, 2009) prepared under Schedule 22 of O. Reg. 170/03 will be posted on the City’s website at www.toronto.ca/water.
These reports will also be available for inspection at Toronto Water offices in Metro Hall, 18th Floor, 55 John Street, Toronto, Ontario M5V 3C6 or by calling (416) 392-8222.
Report Prepared: February 27, 2009
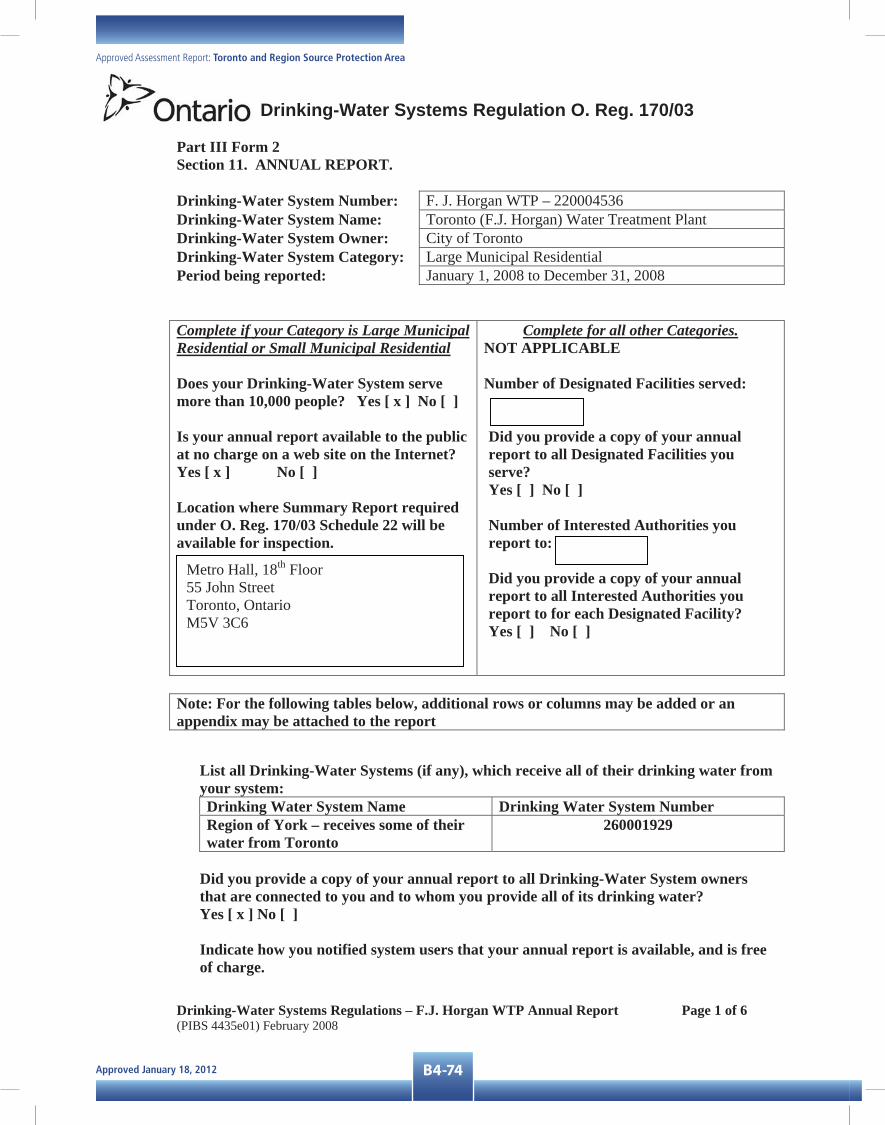
Approved January 18, 2012 B4-74
Approved Assessment Report: Toronto and Region Source Protection Area
Drinking-Water Systems Regulation O. Reg. 170/03
Drinking-Water Systems Regulations – F.J. Horgan WTP Annual Report (PIBS 4435e01) February 2008
Page 1 of 6
Part III Form 2 Section 11. ANNUAL REPORT.
Drinking-Water System Number: F. J. Horgan WTP – 220004536Drinking-Water System Name: Toronto (F.J. Horgan) Water Treatment Plant Drinking-Water System Owner: City of Toronto Drinking-Water System Category: Large Municipal Residential Period being reported: January 1, 2008 to December 31, 2008
Complete if your Category is Large Municipal Residential or Small Municipal Residential
Does your Drinking-Water System serve more than 10,000 people? Yes [ x ] No [ ]
Is your annual report available to the public at no charge on a web site on the Internet? Yes [ x ] No [ ]
Location where Summary Report required under O. Reg. 170/03 Schedule 22 will be available for inspection.
Complete for all other Categories.NOT APPLICABLE
Number of Designated Facilities served:
Did you provide a copy of your annual report to all Designated Facilities you serve?Yes [ ] No [ ]
Number of Interested Authorities you report to:
Did you provide a copy of your annual report to all Interested Authorities you report to for each Designated Facility? Yes [ ] No [ ]
Note: For the following tables below, additional rows or columns may be added or an appendix may be attached to the report
List all Drinking-Water Systems (if any), which receive all of their drinking water from your system: Drinking Water System Name Drinking Water System Number Region of York – receives some of their water from Toronto
260001929
Did you provide a copy of your annual report to all Drinking-Water System owners that are connected to you and to whom you provide all of its drinking water? Yes [ x ] No [ ]
Indicate how you notified system users that your annual report is available, and is free of charge.
Metro Hall, 18th Floor 55 John Street Toronto, Ontario M5V 3C6

Approved January 18, 2012B4-75
Appendix B: Watershed Characterization
Drinking-Water Systems Regulation O. Reg. 170/03
Drinking-Water Systems Regulations – F.J. Horgan WTP Annual Report (PIBS 4435e01) February 2008
Page 2 of 6
[ x ] Public access/notice via the web [ x ] Public access/notice via Government Office [ ] Public access/notice via a newspaper [ ] Public access/notice via Public Request [ ] Public access/notice via a Public Library[ x ] Public access/notice via other method _______________________________________
Describe your Drinking-Water System Toronto Water Supply System consists of four water filtration plants, 18 pumping stations, 10 major underground storage reservoirs, four elevated storage tanks and approximately 510 kilometers of trunk watermains and 5,015 kilometers of distribution watermains.
The F.J. Horgan Water Treatment Plant is a direct water treatment plant, has a rated capacity of 570 ML/d and is located at 201 Copperfield Road, Toronto.
The other three Toronto water treatment plants are as follows:
- R.C. Harris Water Treatment Plant (capacity 950 ML/d) located at 2701 Queens Street East, Toronto;
- R.L. Clark Water Treatment Plant (capacity 615 ML/d) located at 45 Twenty Third Street, Etobicoke; and
- Island Water Treatment Plant (capacity 410 ML/d) located on Centre Island, Toronto
List all water treatment chemicals used over this reporting period
Alum, poly aluminum chloride, MagnaFloc LT7996, chlorine, sulphur dioxide, hydrofluosilicic acid and aqua ammonia. Anionic polymer was used for wastewater treatment.
Were any significant expenses incurred to? [ x ] Install required equipment [ x ] Repair required equipment [ x ] Replace required equipment

Approved January 18, 2012 B4-76
Approved Assessment Report: Toronto and Region Source Protection Area
Drinking-Water Systems Regulation O. Reg. 170/03
Drinking-Water Systems Regulations – F.J. Horgan WTP Annual Report (PIBS 4435e01) February 2008
Page 3 of 6
Please provide a brief description and a breakdown of monetary expenses incurred
Please note that the following amounts related to various projects outline expenditures during 2008 and do not represent the total project costs at the F.J. Horgan Water Treatment Plant. - Plant expansion $ 2.7 Million - Facility HVAC replacement $ 2.4 Million - Facility building improvements $ 271,000 - Facility electrical equipment $ 160,000 - Facility Process Equipment $ 31,000 - Facility instrumentation equipment $ 10,600
Provide details on the notices submitted in accordance with subsection 18(1) of the Safe Drinking-Water Act or section 16-4 of Schedule 16 of O.Reg.170/03 and reported to Spills Action Centre
IncidentDate
Parameter Result Unit of Measure
Corrective Action Corrective Action Date
13-May-08 Fluoride 1.5 mg/L High fluoride levels were noted in the chemical mixing channel but not in the plant output water. Increased residual as a result of returning of chemical feed equipment into service. All process data indicated treatment parameters were within acceptable limits.
22-May-08
13-Nov-08 Fluoride 1.80 mg/L High fluoride levels were noted in the chemical mixing channel. Increased residual in the Output water was due to the return of the feed system into service after completion of tracer study.
24-Nov-08

Approved January 18, 2012B4-77
Appendix B: Watershed Characterization
Drinking-Water Systems Regulation O. Reg. 170/03
Drinking-Water Systems Regulations – F.J. Horgan WTP Annual Report (PIBS 4435e01) February 2008
Page 4 of 6
Microbiological testing done under the Schedule 10, 11 or 12 of Regulation 170/03, during this reporting period.
Number of Samples
Range of E.Coli Or FecalResults (min #)-(max #)
Range of Total Coliform Results (min #)-(max #)
Number of HPC Samples
Range of HPC Results(min #)-(max #)
Raw 367 0 - 3 0 – 34 365 0 – 46 Treated 1456 1456 A (100 % A) 1456 A (100 % A) 1457 0 - 12
A = Absence P = Presence
Operational testing done under Schedule 7, 8 or 9 of Regulation 170/03 during the period covered by this Annual Report.
Number of Grab Samples
Range of Results(min #)-(max #)
Turbidity 8760 0.03 – 0.10 NTU Chlorine 8760 0.47 – 1.67 Fluoride (If the DWS provides fluoridation) (Plant output spot samples)
2183 0.14 – 1.80
NOTE: Record the unit of measure if it is not milligrams per litre.
Summary of additional testing and sampling carried out in accordance with the requirement of an approval, order or other legal instrument.
Date of legal instrument issued
Parameter Date Sampled Result Unit of Measure
Date of order or C of A Parameter Date Sampled Result
(Average) Unit of Measure
F.J. Horgan Water Treatment Plant – All data presented was in accordance with the requirements of C of A #4847 -72BJXC dated August 22, 2007. Note that as of December 19, 2008 the requirements of the Amended C of A # 0945-7JUYF were adhered to. Clarifier Effluent Suspended Solids 1/06 – 12/07 9.58 mg/L
Summary of Inorganic parameters tested during this reporting period or the most recent sample results
Parameter Sample Date
Result Value
Unit of Measure
Exceedance
Antimony 1/22 - 10/24 0 mg/L No Arsenic 1/22 - 10/24 0 mg/L No Barium 1/22 - 10/24 0.021-0.023 mg/L No Boron 1/22 - 10/24 0.017-0.031 mg/L No Cadmium 1/22 - 10/24 0 mg/L No
NOTE: For continuous monitors use 8760 as the number of samples.
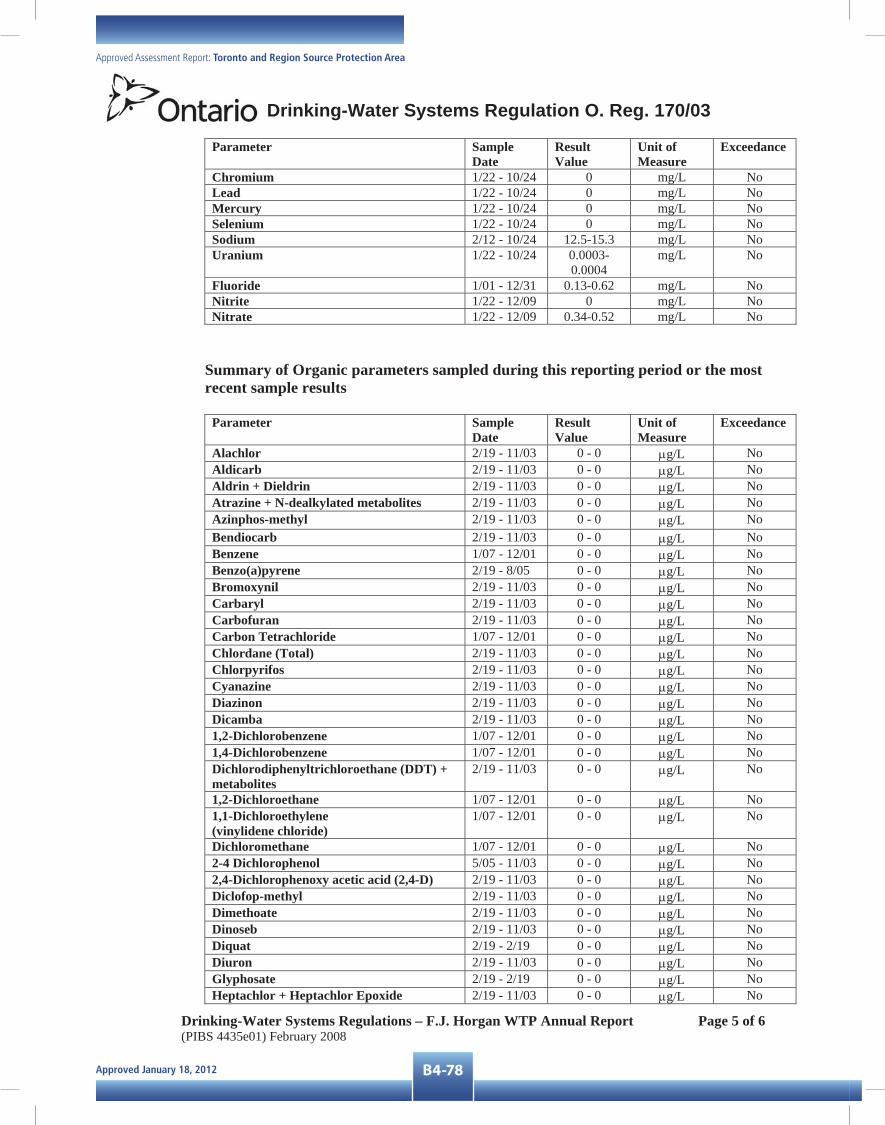
Approved January 18, 2012 B4-78
Approved Assessment Report: Toronto and Region Source Protection Area
Drinking-Water Systems Regulation O. Reg. 170/03
Drinking-Water Systems Regulations – F.J. Horgan WTP Annual Report (PIBS 4435e01) February 2008
Page 5 of 6
Parameter Sample Date
Result Value
Unit of Measure
Exceedance
Chromium 1/22 - 10/24 0 mg/L No Lead 1/22 - 10/24 0 mg/L No Mercury 1/22 - 10/24 0 mg/L No Selenium 1/22 - 10/24 0 mg/L No Sodium 2/12 - 10/24 12.5-15.3 mg/L No Uranium 1/22 - 10/24 0.0003-
0.0004 mg/L No
Fluoride 1/01 - 12/31 0.13-0.62 mg/L No Nitrite 1/22 - 12/09 0 mg/L No Nitrate 1/22 - 12/09 0.34-0.52 mg/L No
Summary of Organic parameters sampled during this reporting period or the most recent sample results
Parameter Sample Date
Result Value
Unit of Measure
Exceedance
Alachlor 2/19 - 11/03 0 - 0 μg/L NoAldicarb 2/19 - 11/03 0 - 0 μg/L NoAldrin + Dieldrin 2/19 - 11/03 0 - 0 μg/L NoAtrazine + N-dealkylated metabolites 2/19 - 11/03 0 - 0 μg/L NoAzinphos-methyl 2/19 - 11/03 0 - 0 μg/L NoBendiocarb 2/19 - 11/03 0 - 0 μg/L NoBenzene 1/07 - 12/01 0 - 0 μg/L NoBenzo(a)pyrene 2/19 - 8/05 0 - 0 μg/L NoBromoxynil 2/19 - 11/03 0 - 0 μg/L NoCarbaryl 2/19 - 11/03 0 - 0 μg/L NoCarbofuran 2/19 - 11/03 0 - 0 μg/L NoCarbon Tetrachloride 1/07 - 12/01 0 - 0 μg/L NoChlordane (Total) 2/19 - 11/03 0 - 0 μg/L NoChlorpyrifos 2/19 - 11/03 0 - 0 μg/L NoCyanazine 2/19 - 11/03 0 - 0 μg/L NoDiazinon 2/19 - 11/03 0 - 0 μg/L NoDicamba 2/19 - 11/03 0 - 0 μg/L No1,2-Dichlorobenzene 1/07 - 12/01 0 - 0 μg/L No1,4-Dichlorobenzene 1/07 - 12/01 0 - 0 μg/L NoDichlorodiphenyltrichloroethane (DDT) + metabolites
2/19 - 11/03 0 - 0 μg/L No
1,2-Dichloroethane 1/07 - 12/01 0 - 0 μg/L No1,1-Dichloroethylene (vinylidene chloride)
1/07 - 12/01 0 - 0 μg/L No
Dichloromethane 1/07 - 12/01 0 - 0 μg/L No2-4 Dichlorophenol 5/05 - 11/03 0 - 0 μg/L No2,4-Dichlorophenoxy acetic acid (2,4-D) 2/19 - 11/03 0 - 0 μg/L NoDiclofop-methyl 2/19 - 11/03 0 - 0 μg/L NoDimethoate 2/19 - 11/03 0 - 0 μg/L NoDinoseb 2/19 - 11/03 0 - 0 μg/L NoDiquat 2/19 - 2/19 0 - 0 μg/L NoDiuron 2/19 - 11/03 0 - 0 μg/L NoGlyphosate 2/19 - 2/19 0 - 0 μg/L NoHeptachlor + Heptachlor Epoxide 2/19 - 11/03 0 - 0 μg/L No
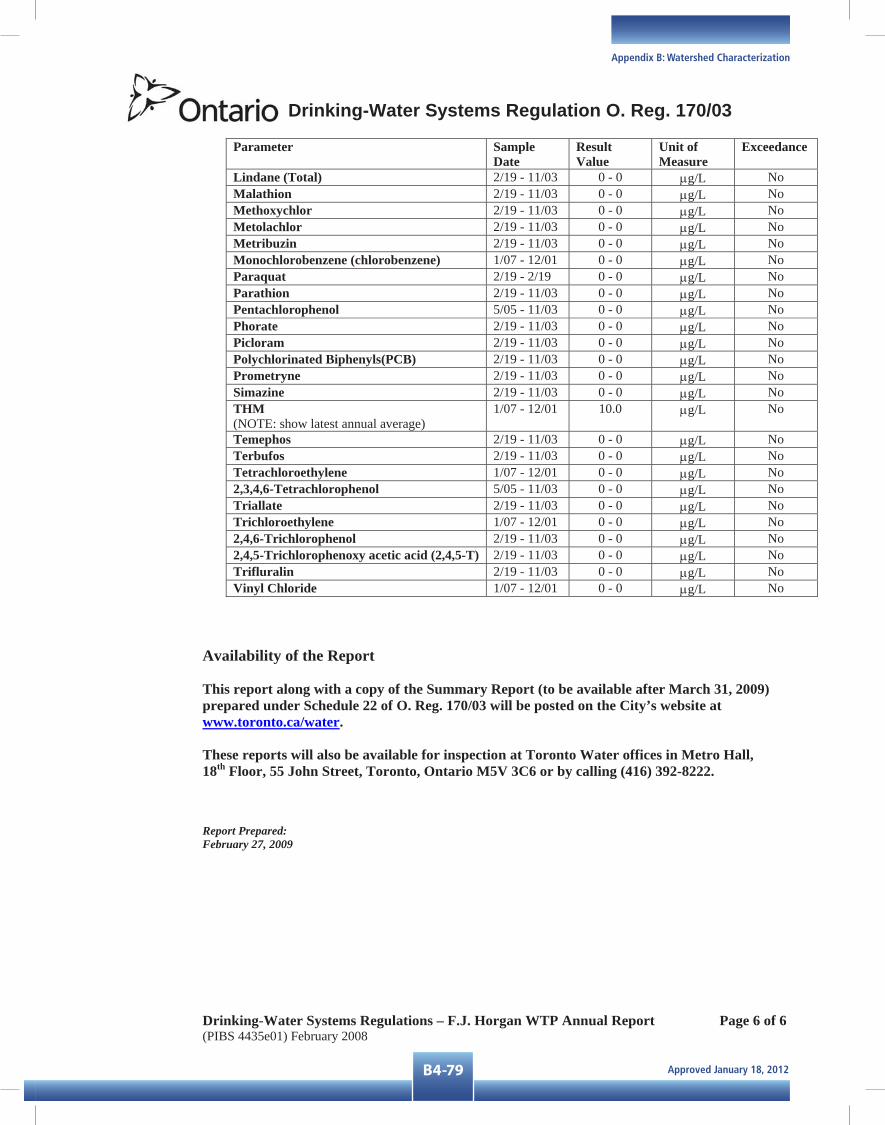
Approved January 18, 2012B4-79
Appendix B: Watershed Characterization
Drinking-Water Systems Regulation O. Reg. 170/03
Drinking-Water Systems Regulations – F.J. Horgan WTP Annual Report (PIBS 4435e01) February 2008
Page 6 of 6
Parameter Sample Date
Result Value
Unit of Measure
Exceedance
Lindane (Total) 2/19 - 11/03 0 - 0 μg/L NoMalathion 2/19 - 11/03 0 - 0 μg/L NoMethoxychlor 2/19 - 11/03 0 - 0 μg/L NoMetolachlor 2/19 - 11/03 0 - 0 μg/L NoMetribuzin 2/19 - 11/03 0 - 0 μg/L NoMonochlorobenzene (chlorobenzene) 1/07 - 12/01 0 - 0 μg/L NoParaquat 2/19 - 2/19 0 - 0 μg/L NoParathion 2/19 - 11/03 0 - 0 μg/L NoPentachlorophenol 5/05 - 11/03 0 - 0 μg/L NoPhorate 2/19 - 11/03 0 - 0 μg/L NoPicloram 2/19 - 11/03 0 - 0 μg/L NoPolychlorinated Biphenyls(PCB) 2/19 - 11/03 0 - 0 μg/L NoPrometryne 2/19 - 11/03 0 - 0 μg/L NoSimazine 2/19 - 11/03 0 - 0 μg/L NoTHM(NOTE: show latest annual average)
1/07 - 12/01 10.0 μg/L No
Temephos 2/19 - 11/03 0 - 0 μg/L NoTerbufos 2/19 - 11/03 0 - 0 μg/L NoTetrachloroethylene 1/07 - 12/01 0 - 0 μg/L No2,3,4,6-Tetrachlorophenol 5/05 - 11/03 0 - 0 μg/L NoTriallate 2/19 - 11/03 0 - 0 μg/L NoTrichloroethylene 1/07 - 12/01 0 - 0 μg/L No2,4,6-Trichlorophenol 2/19 - 11/03 0 - 0 μg/L No2,4,5-Trichlorophenoxy acetic acid (2,4,5-T) 2/19 - 11/03 0 - 0 μg/L NoTrifluralin 2/19 - 11/03 0 - 0 μg/L NoVinyl Chloride 1/07 - 12/01 0 - 0 μg/L No
Availability of the Report
This report along with a copy of the Summary Report (to be available after March 31, 2009) prepared under Schedule 22 of O. Reg. 170/03 will be posted on the City’s website at www.toronto.ca/water.
These reports will also be available for inspection at Toronto Water offices in Metro Hall, 18th Floor, 55 John Street, Toronto, Ontario M5V 3C6 or by calling (416) 392-8222.
Report Prepared: February 27, 2009

Approved January 18, 2012 B4-80
Approved Assessment Report: Toronto and Region Source Protection Area
Drinking-Water Systems Regulation O. Reg. 170/03
Drinking-Water Systems Regulations – Island WTP Annual Report (PIBS 4435e01) February 2008
Page 1 of 6
Part III Form 2 Section 11. ANNUAL REPORT.
Drinking-Water System Number: Island. WTP – 220002244Drinking-Water System Name: Toronto (Island) Water Treatment Plant Drinking-Water System Owner: City of Toronto Drinking-Water System Category: Large Municipal Residential Period being reported: January 1, 2008 to December 31, 2008
Complete if your Category is Large Municipal Residential or Small Municipal Residential
Does your Drinking-Water System serve more than 10,000 people? Yes [ x ] No [ ]
Is your annual report available to the public at no charge on a web site on the Internet? Yes [ x ] No [ ]
Location where Summary Report required under O. Reg. 170/03 Schedule 22 will be available for inspection.
Complete for all other Categories.NOT APPLICABLE
Number of Designated Facilities served:
Did you provide a copy of your annual report to all Designated Facilities you serve?Yes [ ] No [ ]
Number of Interested Authorities you report to:
Did you provide a copy of your annual report to all Interested Authorities you report to for each Designated Facility? Yes [ ] No [ ]
Note: For the following tables below, additional rows or columns may be added or an appendix may be attached to the report
List all Drinking-Water Systems (if any), which receive all of their drinking water from your system: Drinking Water System Name Drinking Water System Number Region of York – receives some of their water from Toronto
260001929
Did you provide a copy of your annual report to all Drinking-Water System owners that are connected to you and to whom you provide all of its drinking water? Yes [ x ] No [ ]
Indicate how you notified system users that your annual report is available, and is free of charge.
Metro Hall, 18th Floor 55 John Street Toronto, Ontario M5V 3C6

Approved January 18, 2012B4-81
Appendix B: Watershed Characterization
Drinking-Water Systems Regulation O. Reg. 170/03
Drinking-Water Systems Regulations – Island WTP Annual Report (PIBS 4435e01) February 2008
Page 2 of 6
[ x ] Public access/notice via the web [ x ] Public access/notice via Government Office [ ] Public access/notice via a newspaper [ ] Public access/notice via Public Request [ ] Public access/notice via a Public Library[ x ] Public access/notice via other method _______________________________________
Describe your Drinking-Water System - Toronto Water Supply System consists of four water filtration plants, 18 pumping
stations, 10 major underground storage reservoirs, four elevated storage tanks and approximately 510 kilometers of trunk watermains and 5,015 kilometers of distribution watermains.
The Island Water Treatment Plant is a direct water treatment plant, has a capacity 410 ML/d and is located on Centre Island, Toronto.
The other three Toronto water treatment plants are as follows:
- R.C. Harris Water Treatment Plant (capacity 950 ML/d) located at 2701 Queens Street East, Toronto;
- R.L. Clark Water Treatment Plant (capacity 615 ML/d) located at 45 Twenty Third Street, Etobicoke; and
- F.J. Horgan Water Treatment Plant (capacity 570 ML/d) located at 201 Copperfield Road, Toronto.
List all water treatment chemicals used over this reporting period
Alum, poly aluminum chloride, chlorine, sulphur dioxide, hydrofluosilicic acid, and aqua ammonia.
Were any significant expenses incurred to? [ x ] Install required equipment [ x ] Repair required equipment [ x ] Replace required equipment
Please provide a brief description and a breakdown of monetary expenses incurred
Please note the following amounts relate to various projects during 2008 and do not represent the total project cost. These numbers do not include normal operating and maintenance cost. - Residue Management $1.6 Million - Filter Rehabilitation $2.9 Million - Winterization of facility $200,000

Approved January 18, 2012 B4-82
Approved Assessment Report: Toronto and Region Source Protection Area
Drinking-Water Systems Regulation O. Reg. 170/03
Drinking-Water Systems Regulations – Island WTP Annual Report (PIBS 4435e01) February 2008
Page 3 of 6
Provide details on the notices submitted in accordance with subsection 18(1) of the Safe Drinking-Water Act or section 16-4 of Schedule 16 of O.Reg.170/03 and reported to Spills Action Centre
IncidentDate
Parameter Result Unit of Measure
Corrective Action Corrective Action Date
28-Jan-08 Island Distribution
Chlorine Residual
<0.25 mg/L The low residual is caused by SO2 injector failure. The secondary injector was placed in service. Distribution Chlorine Total Residual back to 1.08mg/L at 10:00am
28-Jan-08
19-Apr-08 Total Coliforms Presence result in 100 mL sample
The test results of subsequent output samples taken at 06:00am and 12:00pm of Apr 19 indicated total Coliforms absence
19-Apr-08
3-Oct-08 Fluoride Residual
>1.5 mg/L High Fluoride residual due to mechanical failure at the service water line. 2.5L of concentrated FL entered the clear well. Since this concentration entered a large volume of water (5ML) at the clear well, it will be diluted by the time it reaches output channel. FL feed pump was taken out of service immediately.
3-Oct-08
11-Oct-08 Fluoride Residual
>1.5 mg/L High FL residual due to mechanical failure at the service water line. 2.0L of concentrated FL entered the clear well. Since this concentration entered a large volume of water (5ML) at the clear well, it will be diluted by the time it reaches output channel. FL feed pump was taken out of service immediately.
11-Oct-08
21-Dec-08 Island Distribution
Chlorine Residual
0.02 mg/L At 05:33 a rapid shut down of the Island Treatment Plant supply to John St occurred causing an over dechlorination in the channel. Started out flow at 11:40. At 11:45 started to apply trim chlorination in anticipation of low residual. The Island Distribution residual dropped below 0.25mg/L between 12:08 to 12:14 with a minimum residual of 0.02mg/L.
21-Dec-08

Approved January 18, 2012B4-83
Appendix B: Watershed Characterization
Drinking-Water Systems Regulation O. Reg. 170/03
Drinking-Water Systems Regulations – Island WTP Annual Report (PIBS 4435e01) February 2008
Page 4 of 6
Microbiological testing done under the Schedule 10, 11 or 12 of Regulation 170/03, during this reporting period.
Number of Samples
Range of E.Coli Or Fecal Results (min #)-(max #)
Range of Total Coliform Results(min #)-(max #)
Number of HPC Samples
Range of HPC Results(min #)-(max #)
Raw 307 0 - 7 0 - 80 306 0 -57 Treated 1217 1217 A (100 % A) 1216 A, 1 P (99.9 %A) 1216 0 - 7
A = Absence P = Presence
Operational testing done under Schedule 7, 8 or 9 of Regulation 170/03 during the period covered by this Annual Report.
Number of Grab Samples
Range of Results (min #)-(max #)
Turbidity 7280 0.04 – 0.43 Chlorine 7280 0.29 – 2.00 Fluoride (If the DWS provides fluoridation) 6928 0.02 – 2.00
NOTE: Record the unit of measure if it is not milligrams per litre.
Summary of additional testing and sampling carried out in accordance with the requirement of an approval, order or other legal instrument.
None
Summary of Inorganic parameters tested during this reporting period or the most recent sample results
Parameter Sample Date Result Value
Unit of Measure
Exceedance
Antimony 1/22 - 10/14 0-0 mg/L No Arsenic 1/22 - 10/14 0-0 mg/L No Barium 1/22 - 10/14 0.022-
0.023 mg/L No
Boron 1/22 - 10/14 0.022-0.026
mg/L No
Cadmium 1/22 - 10/14 0-0 mg/L No Chromium 1/22 - 10/14 0-0 mg/L No Lead 1/22 - 10/14 0-0 mg/L No Mercury 1/22 - 10/14 0-0 mg/L No Selenium 1/22 - 10/14 0-0 mg/L No Sodium 4/01 - 10/14 13.0-16.0 mg/L No Uranium 1/22 - 10/14 0.0003-
0.0004 mg/L No
Fluoride 1/01 – 12/31 0.13-0.63 mg/L No Nitrite 1/22 – 12/09 0-0 mg/L No Nitrate 1/22 – 12/09 0.40-0.52 mg/L No
NOTE: For continuous monitors use 8760 as the number of samples.

Approved January 18, 2012 B4-84
Approved Assessment Report: Toronto and Region Source Protection Area
Drinking-Water Systems Regulation O. Reg. 170/03
Drinking-Water Systems Regulations – Island WTP Annual Report (PIBS 4435e01) February 2008
Page 5 of 6
Summary of Organic parameters sampled during this reporting period or the most recent sample results
Parameter Sample Date Result Value
Unit of Measure
Exceedance
Alachlor 5/05 - 11/03 0-0 µg/L No Aldicarb 5/05 - 11/03 0-0 µg/L No Aldrin + Dieldrin 5/05 - 11/03 0-0 µg/L No Atrazine + N-dealkylated metabolites 5/05 - 11/03 0-0 µg/L No Azinphos-methyl 5/05 - 11/03 0-0 µg/L No Bendiocarb 5/05 - 11/03 0-0 µg/L No Benzene 1/07 - 12/01 0-0 µg/L No Benzo(a)pyrene 5/05 - 8/06 0-0 µg/L No Bromoxynil 5/05 - 11/03 0-0 µg/L No Carbaryl 5/05 - 11/03 0-0 µg/L No Carbofuran 5/05 - 11/03 0-0 µg/L No Carbon Tetrachloride 1/07 - 12/01 0-0 µg/L No Chlordane (Total) 5/05 - 11/03 0-0 µg/L No Chlorpyrifos 5/05 - 11/03 0-0 µg/L No Cyanazine 5/05 - 11/03 0-0 µg/L No Diazinon 5/05 - 11/03 0-0 µg/L No Dicamba 5/05 - 11/03 0-0 µg/L No 1,2-Dichlorobenzene 1/07 - 12/01 0-0 µg/L No 1,4-Dichlorobenzene 1/07 - 12/01 0-0 µg/L No Dichlorodiphenyltrichloroethane (DDT) + metabolites
5/05 - 11/03 0-0 µg/L No
1,2-Dichloroethane 1/07 - 12/01 0-0 µg/L No 1,1-Dichloroethylene (vinylidene chloride)
1/07 - 12/01 0-0 µg/L No
Dichloromethane 1/07 - 12/01 0 - 12.8 µg/L No 2-4 Dichlorophenol 5/05 - 11/03 0-0 µg/L No 2,4-Dichlorophenoxy acetic acid (2,4-D) 5/05 - 11/03 0-0 µg/L No Diclofop-methyl 5/05 - 11/03 0-0 µg/L No Dimethoate 5/05 - 11/03 0-0 µg/L No Dinoseb 5/05 - 11/03 0-0 µg/L No Diquat 4/07 - 4/07 0-0 µg/L No Diuron 5/05 - 11/03 0-0 µg/L No Glyphosate 4/07 - 4/07 0-0 µg/L No Heptachlor + Heptachlor Epoxide 5/05 - 11/03 0-0 µg/L No Lindane (Total) 5/05 - 11/03 0-0 µg/L No Malathion 5/05 - 11/03 0-0 µg/L No Methoxychlor 5/05 - 11/03 0-0 µg/L No Metolachlor 5/05 - 11/03 0-0 µg/L No Metribuzin 5/05 - 11/03 0-0 µg/L No Monochlorobenzene 1/07 - 12/01 0-0 µg/L No Paraquat 4/07 - 4/07 0-0 µg/L No Parathion 5/05 - 11/03 0-0 µg/L No Pentachlorophenol 5/05 - 11/03 0-0 µg/L No Phorate 5/05 - 11/03 0-0 µg/L No Picloram 5/05 - 11/03 0-0 µg/L No Polychlorinated Biphenyls(PCB) 5/05 - 11/03 0-0 µg/L No Prometryne 5/05 - 11/03 0-0 µg/L No Simazine 5/05 - 11/03 0-0 µg/L No
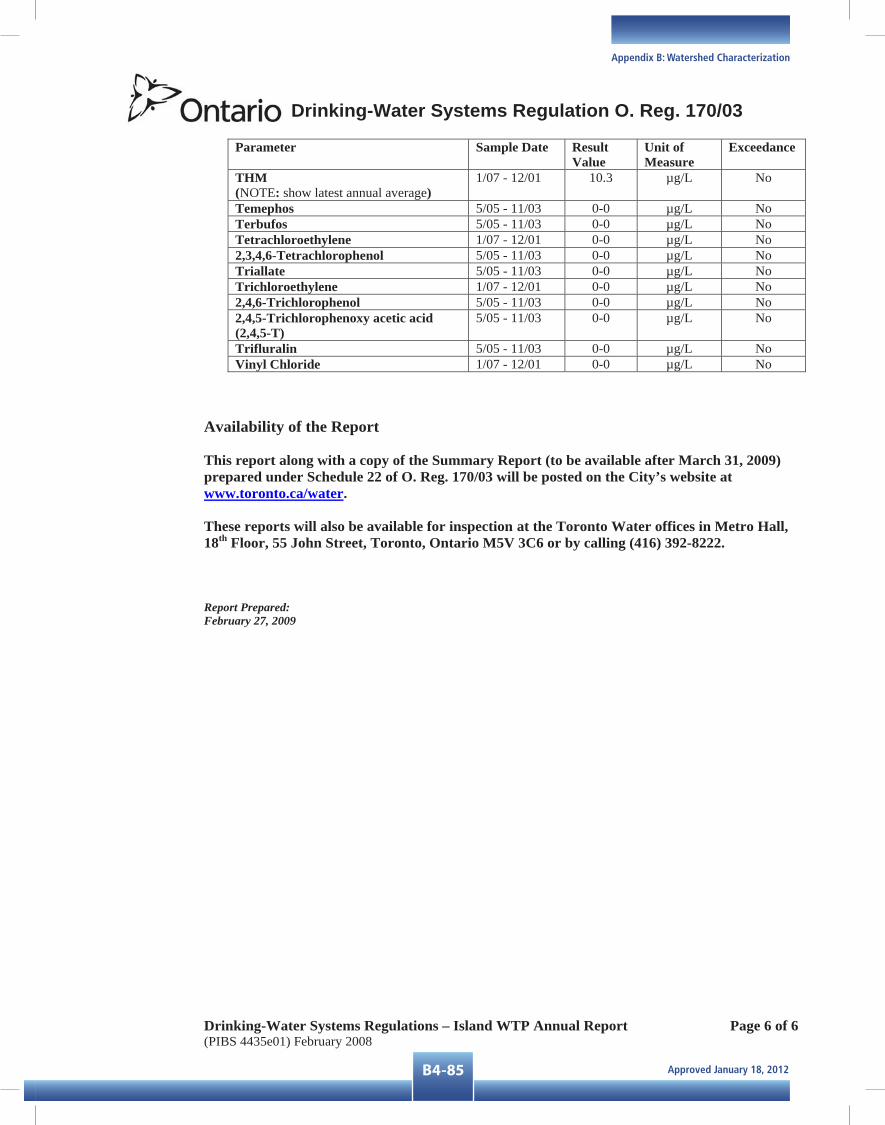
Approved January 18, 2012B4-85
Appendix B: Watershed Characterization
Drinking-Water Systems Regulation O. Reg. 170/03
Drinking-Water Systems Regulations – Island WTP Annual Report (PIBS 4435e01) February 2008
Page 6 of 6
Parameter Sample Date Result Value
Unit of Measure
Exceedance
THM(NOTE: show latest annual average)
1/07 - 12/01 10.3 µg/L No
Temephos 5/05 - 11/03 0-0 µg/L No Terbufos 5/05 - 11/03 0-0 µg/L No Tetrachloroethylene 1/07 - 12/01 0-0 µg/L No 2,3,4,6-Tetrachlorophenol 5/05 - 11/03 0-0 µg/L No Triallate 5/05 - 11/03 0-0 µg/L No Trichloroethylene 1/07 - 12/01 0-0 µg/L No 2,4,6-Trichlorophenol 5/05 - 11/03 0-0 µg/L No 2,4,5-Trichlorophenoxy acetic acid (2,4,5-T)
5/05 - 11/03 0-0 µg/L No
Trifluralin 5/05 - 11/03 0-0 µg/L No Vinyl Chloride 1/07 - 12/01 0-0 µg/L No
Availability of the Report
This report along with a copy of the Summary Report (to be available after March 31, 2009) prepared under Schedule 22 of O. Reg. 170/03 will be posted on the City’s website at www.toronto.ca/water.
These reports will also be available for inspection at the Toronto Water offices in Metro Hall, 18th Floor, 55 John Street, Toronto, Ontario M5V 3C6 or by calling (416) 392-8222.
Report Prepared: February 27, 2009

Approved January 18, 2012 B4-86
Approved Assessment Report: Toronto and Region Source Protection Area
This page is intentionally left blank.

Approved January 18, 2012B4-87
Appendix B: Watershed Characterization
2009 Annual Drinking Water Quality Report
Regional Municipality of Durham Works Department
1
The Regional Municipality of Durham’s 2009 Drinking Water Quality Report is submitted to satisfy the requirement of Section 11 of Ontario Regulation (O. Reg.) 170/03 under the Safe Drinking Water Act. As owner and operator of drinking water systems, the Region must prepare an annual report for each system that includes the following information:
• A brief description of the drinking water system; • A list of water treatment chemicals used; • A summary of the test results covered under the reporting period; • A summary of adverse test results and other issues, including corrective actions
taken;• A description of major expenses incurred to install, repair or replace equipment.
The Regional Municipality of Durham owns and operates thirteen (13) drinking water systems, twelve (12) of which are covered by this report. The drinking water system supplying water to the Uxbridge Industrial Park (Uxville) is no longer covered by this report as it is now regulated by the Ministry of Health and Long Term Care, O. Reg. 318/08.
Water for the Region’s municipal water supply systems comes from three sources: Lake Ontario, Lake Simcoe and groundwater wells. The Region is responsible for operating and maintaining every component of the water supply system; treatment, storage and distribution of potable water to consumers in Ajax, Pickering, Oshawa, Courtice, Whitby, Brooklin, Bowmanville, Newcastle, Newtonville, Orono, Blackstock, Port Perry, Uxbridge, Greenbank, Sunderland, Cannington and Beaverton.
The Region operates and maintains:
• 6 surface water supply plants • 22 water storage facilities • 16 pumping stations • 22 groundwater wells • 2,387km of watermains
The booster pumping stations and water storage facilities are located throughout the distribution systems to pump and store water at sufficient pressure. There must be adequate pressure and water storage throughout the system to meet peak water consumption demands, as well as extraordinary demands, such as fire emergencies.
Drinking Water QualityDrinking water quality is monitored extensively at each stage of the water treatment process. In-plant samples are collected and tested on site throughout the day by licensed operators, while on-line analyzers continuously monitor chlorine residual, turbidity and other quality-related parameters. In addition to on-site quality control, the Region collects and tests samples for bacteriological, inorganic and organic parameters, as required by O. Reg. 170/03. These samples are analyzed at the Regional

Approved January 18, 2012 B4-88
Approved Assessment Report: Toronto and Region Source Protection Area
2009 Annual Drinking Water Quality Report
Regional Municipality of Durham Works Department
2
Environmental Laboratory in Pickering. The laboratory is accredited by the Canadian Association for Laboratory Accreditation and licensed by the Ministry of the Environment (MOE).
Monitoring the bacteriological quality of water is imperative as the presence of disease-causing bacteria, protozoa and viruses in drinking water can be a significant threat to public health. Bacteriological quality is monitored on a daily basis, with samples being collected at three (3) stages of the drinking water system; the raw water entering the drinking water system, the treated water leaving the system and the treated water in the distribution system. Inorganic parameters can be naturally occurring in the environment or be present as a result of industrial or agricultural activities. Organic parameters are present as a result of industrial and municipal waste, urban and agricultural runoff, and the natural decomposition of biological matter.
Bacteriological, inorganic and organic parameters must be less than their standard or objective, as listed in the Ontario Drinking Water Quality Standards, O. Reg. 169/03, under the Safe Drinking Water Act. All inorganic and organic results listed in this report are from treated water samples.
Drinking Water Quality ManagementAll of the Region's drinking water systems are accredited to the Environmental Management Standard ISO 14001:2004, the Quality Management Standard ISO 9001:2008 and the MOE Drinking Water Quality Management Standard (DWQMS). DWQMS has been developed to integrate quality management into the operation of all municipal drinking water systems in Ontario. DWQMS specifies the minimum requirements for a quality management system in an effort to protect the health of individuals who consume Ontario's drinking water.
As a result of recommendations made after the Walkerton Inquiry, Ontario is currently implementing a new approvals program; the Municipal Drinking Water Licensing Program. The program has five components:
• Drinking Water Works Permit; • Accepted Operational Plan, which includes a quality management system that is
based on Ontario’s DWQMS; • Accredited Operating Authority; • Approved Financial Plan; • Permit to Take Water.
For more information on the licensing program visit the MOE Drinking Water Ontario website at: www.ene.gov.on.ca/en/water/
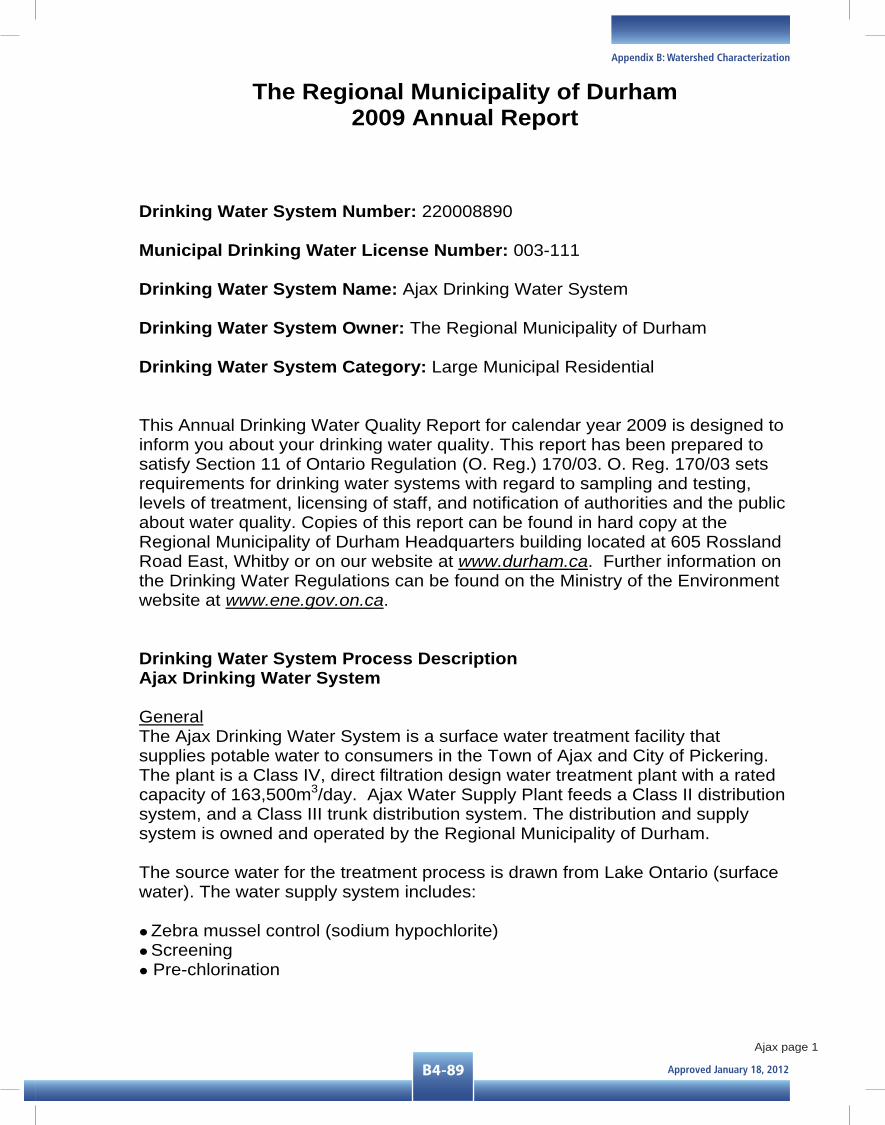
Approved January 18, 2012B4-89
Appendix B: Watershed Characterization
The Regional Municipality of Durham 2009 Annual Report
Drinking Water System Number: 220008890
Municipal Drinking Water License Number: 003-111
Drinking Water System Name: Ajax Drinking Water System
Drinking Water System Owner: The Regional Municipality of Durham
Drinking Water System Category: Large Municipal Residential
This Annual Drinking Water Quality Report for calendar year 2009 is designed to inform you about your drinking water quality. This report has been prepared to satisfy Section 11 of Ontario Regulation (O. Reg.) 170/03. O. Reg. 170/03 sets requirements for drinking water systems with regard to sampling and testing, levels of treatment, licensing of staff, and notification of authorities and the public about water quality. Copies of this report can be found in hard copy at the Regional Municipality of Durham Headquarters building located at 605 Rossland Road East, Whitby or on our website at www.durham.ca. Further information on the Drinking Water Regulations can be found on the Ministry of the Environment website at www.ene.gov.on.ca.
Drinking Water System Process Description Ajax Drinking Water System
GeneralThe Ajax Drinking Water System is a surface water treatment facility that supplies potable water to consumers in the Town of Ajax and City of Pickering. The plant is a Class IV, direct filtration design water treatment plant with a rated capacity of 163,500m3/day. Ajax Water Supply Plant feeds a Class II distribution system, and a Class III trunk distribution system. The distribution and supply system is owned and operated by the Regional Municipality of Durham.
The source water for the treatment process is drawn from Lake Ontario (surface water). The water supply system includes:
Zebra mussel control (sodium hypochlorite) Screening Pre-chlorination
Ajax page 1

Approved January 18, 2012 B4-90
Approved Assessment Report: Toronto and Region Source Protection Area
Low lift pumping pH adjustment (sulphuric acid) Coagulation (aluminum sulphate) Flocculation Filtration Post chlorination/dechlorination (sodium bisulphite)
• Fluoridation (hydrofluosilicic acid) Water storage and high lift pumping Distribution
Raw Water SupplyRaw water is drawn from Lake Ontario through a 2,100mm diameter intake pipe extending 2,506m into the lake. The intake structure is located at a depth of 18m.Five (5) 100mm diameter lines are located outside the intake pipe. Three (3) lines are used for raw water sampling and two lines are dedicated to the delivery of chlorine solution to a zebra mussel chlorine diffuser that is used for disinfection and control of zebra mussels. The chlorine residual and turbidity are continuously monitored by analyzers. Sulphuric acid can be added for pH adjustment to enhance disinfection, coagulation and flocculation.
Coagulation/FlocculationThe water flows through a traveling screen to remove large solids and continues towards the low lift pumps. Aluminum sulphate (alum) is added to the incoming water upstream from the flocculation tanks. Gentle mixing of the alum with the water occurs as the water passes through the six (6) sets of hydraulic spiral up-flow flocculation tanks. Each tank contains three (3) flocculation cells.
FiltrationParticulate matter that is present in the raw water is captured by the flocculation particles and deposited on the top of the filters. The water supply plant has six (6) dual media filters to remove floc particles. Four (4) of the filters use granulated activated carbon (GAC) and two (2) use anthracite. GAC is used to assist taste and odour control. Three vertical centrifugal pumps are available for backwashing the filters. The backwashed water is discharged to two tanks and two sedimentation tanks to allow for settling of the suspended solids. The settled solids are pumped to the sanitary sewer. The dechlorinated clear supernatant is discharged back to Lake Ontario.
Disinfection and FluoridationFiltered water passes through the filter under-drain into the reservoir. The water in the reservoir then enters the clear well and eventually the high lift pump suction well. The high lift pumps deliver pressurized, treated water to the distribution system. Disinfection is controlled by the addition of chlorine and sodium bisulphite at multiple application points throughout the plant. Sodium bisulphite is used to manage chlorine residuals. Consistent disinfection is ensured by continuous online monitoring of the chlorine residual throughout the
Ajax page 2

Approved January 18, 2012B4-91
Appendix B: Watershed Characterization
water supply plant. Fluoride (hydrofluosilicic acid) is added to water for the prevention of tooth decay.
Distribution SystemThe distribution system delivers the treated water through 701km of watermains in six (6) pressure zones. The distribution system has five (5) booster stations, one (1) elevated tank and three (3) reservoirs with a combined water storage capacity of 84,780m3. The Ajax distribution system has the capability to receive water from the Whitby distribution system if required.
Monetary expenses incurred during this reporting period
Under Section 11 of O. Reg. 170/03, a description of any major expenses incurred during this reporting period must be included in the annual report.The details of major expenses for this drinking water system are as follows:
Watermain rehabilitation project – Cathodic protection - $163,273 Watermain rehabilitation project – Cement mortar lining - $49,212 Rebuild transfer pump #2 - $13,950
Ajax page 3

Approved January 18, 2012 B4-92
Approved Assessment Report: Toronto and Region Source Protection Area
Incident Date Result
May 28 Positive
July 5 0
July 10 0.0 mg/L
August 24 0.0 mg/L
September 10 0.02 mg/L
September 19 30 CFU/100mL
September 30 Positive
October 8 1 CFU/100mL
October 31 16 CFU/100mL
Number of Samples Range of E.Coli MF
Raw 205 ND - 11Treated 2 NDDistribution 216 ND
Number of Samples E. Coli P/A
Raw - -Treated 205 ADistribution 1752 A
Number of HPC Samples
Range of HPC Samples
Raw - -Treated 207 ND - 120Distribution 1028 ND - 260*Number in parentheses represents number of exceedence(s).
Number of Samples Range of Results Unit of Measure
Turbidity - Filter Effluent 8760 0.015 - 0.506 NTU
Fluoride - Plant 8760 0.09 - 1.31* mg/L
Free Chlorine - Plant 8760 0.01 - 2.02 mg/L
Free Chlorine - Distribution 8760 0.11 - 2.11 mg/L
Total Coliforms (distribution) Resample and 2 vicinity samples collected. September 30
Turbidity is a measure of particles in water.
Must be sufficient to ensure disinfection has been achieved.
Recommended level of at least 0.20 mg/L in distribution system to maintain microbiological quality, 0.05 mg/L is the minimum.
Chlorine (plant) Flushed, samples collected. September 10
Total Coliforms (distribution) Resample and 2 vicinity samples collected. September 19
Chlorine (plant) Flushed, samples collected. July 10
Chlorine (plant) Flushed, samples collected. August 24
Resample and 2 vicinity samples collected. May 28
Low Pressure (distribution) Pressure restored, system flushed. July 5
Corrective Action Date
October 8
October 31Total Coliforms (distribution)
Corrective Action
Resample and 2 vicinity samples collected.
Resample and 2 vicinity samples collected.
Parameter
Total Coliforms (distribution)
Total Coliforms (distribution)
Parameter Description
ND - 2200ND
ND - 30
A - P(2)*
Operational testing done under Schedule 7, 8 or 9 of O. Reg. 170/03 during the period covered by this Annual Report.
Fluoride is added to water to prevent tooth decay.*Indicates instrument malfunction, reading may not be accurate.
Summary of all adverse water quality incidents reported to Spills Action Centre in accordance with Subsection 18(1) of the Safe Drinking Water Act or Section 16-4 of Schedule 16 of O. Reg. 170/03.
For a description of terms and abbreviations, refer to the glossary at the end of the report.
Microbiological testing done under Schedule 10, 11 or 12 of O. Reg. 170/03, during the period covered by this Annual Report.
Range of Total Coliform MF
Total Coliform P/A
-A
Ajax page 4
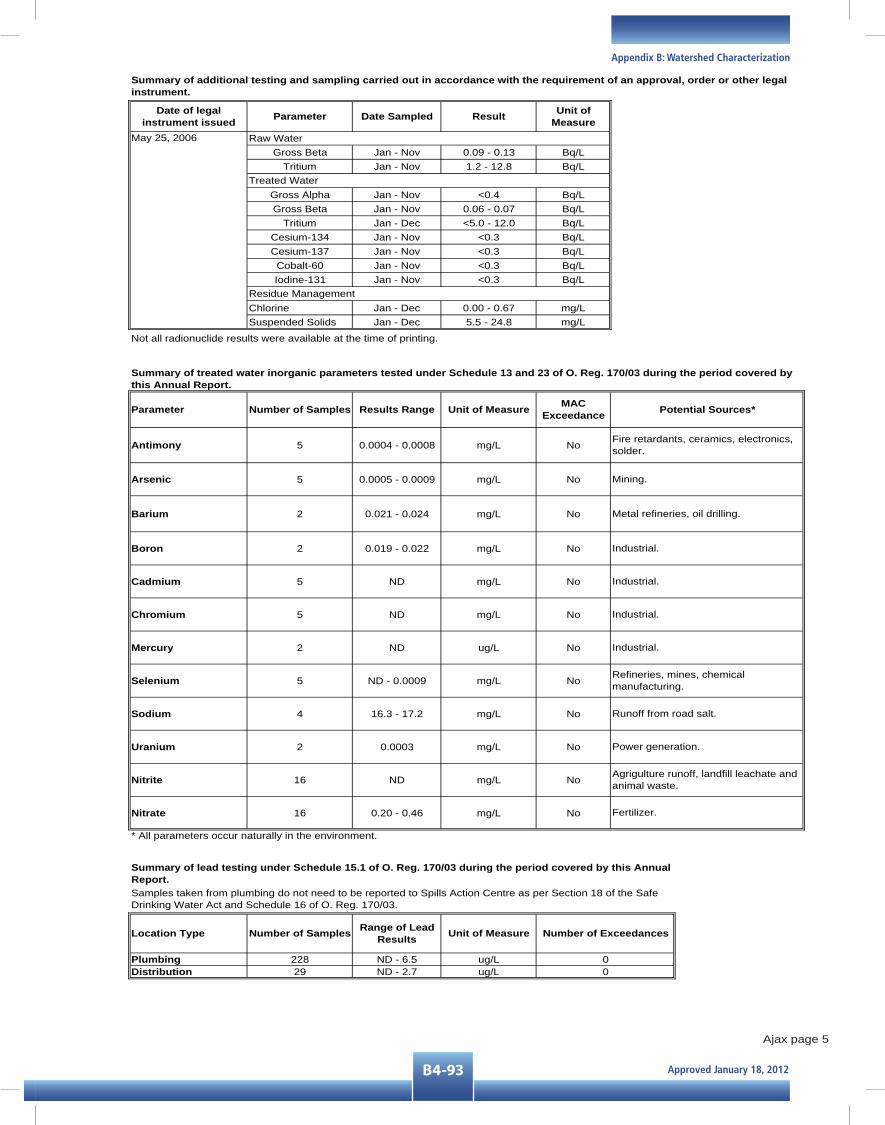
Approved January 18, 2012B4-93
Appendix B: Watershed Characterization
Date of legal instrument issued Parameter Date Sampled Result Unit of
Measure
Gross Beta Jan - Nov 0.09 - 0.13 Bq/LTritium Jan - Nov 1.2 - 12.8 Bq/L
Gross Alpha Jan - Nov <0.4 Bq/LGross Beta Jan - Nov 0.06 - 0.07 Bq/L
Tritium Jan - Dec <5.0 - 12.0 Bq/LCesium-134 Jan - Nov <0.3 Bq/LCesium-137 Jan - Nov <0.3 Bq/LCobalt-60 Jan - Nov <0.3 Bq/LIodine-131 Jan - Nov <0.3 Bq/L
Chlorine Jan - Dec 0.00 - 0.67 mg/LSuspended Solids Jan - Dec 5.5 - 24.8 mg/L
Parameter Number of Samples Results Range Unit of Measure MACExceedance
Antimony 5 0.0004 - 0.0008 mg/L No
Arsenic 5 0.0005 - 0.0009 mg/L No
Barium 2 0.021 - 0.024 mg/L No
Boron 2 0.019 - 0.022 mg/L No
Cadmium 5 ND mg/L No
Chromium 5 ND mg/L No
Mercury 2 ND ug/L No
Selenium 5 ND - 0.0009 mg/L No
Sodium 4 16.3 - 17.2 mg/L No
Uranium 2 0.0003 mg/L No
Nitrite 16 ND mg/L No
Nitrate 16 0.20 - 0.46 mg/L No
* All parameters occur naturally in the environment.
Location Type Number of Samples Range of Lead Results Unit of Measure
Plumbing 228 ND - 6.5 ug/LDistribution 29 ND - 2.7 ug/L
Samples taken from plumbing do not need to be reported to Spills Action Centre as per Section 18 of the Safe Drinking Water Act and Schedule 16 of O. Reg. 170/03.
Fertilizer.
Runoff from road salt.
Summary of treated water inorganic parameters tested under Schedule 13 and 23 of O. Reg. 170/03 during the period covered by this Annual Report.
Number of Exceedances
00
Power generation.
Agrigulture runoff, landfill leachate and animal waste.
Refineries, mines, chemical manufacturing.
Industrial.
Industrial.
Metal refineries, oil drilling.
Potential Sources*
Fire retardants, ceramics, electronics, solder.
Mining.
Industrial.
Summary of lead testing under Schedule 15.1 of O. Reg. 170/03 during the period covered by this Annual Report.
Industrial.
Not all radionuclide results were available at the time of printing.
Summary of additional testing and sampling carried out in accordance with the requirement of an approval, order or other legal instrument.
May 25, 2006 Raw Water
Treated Water
Residue Management
Ajax page 5

Approved January 18, 2012 B4-94
Approved Assessment Report: Toronto and Region Source Protection Area
Parameter Number of Samples Results Range Unit of Measure MACExceedance
Alachlor 2 ND ug/L No
Aldicarb 2 ND ug/L No
Aldrin + Dieldrin 2 ND ug/L No
Atrazine + N-dealkylatedmetobolites
2 ND ug/L No
Azinphos-methy1 2 ND ug/L No
Bendiocarb 2 ND ug/L No
Benzene 2 ND ug/L No
Benzo(a)pyrene 2 ND ug/L No
Bromoxynil 2 ND ug/L No
Carbaryl 2 ND ug/L No
Carbofuran 2 ND ug/L No
Carbon Tetrachloride 2 ND ug/L No
Chlordane (Total) 2 ND ug/L No
Chlorpyrifos 2 ND ug/L No
Cyanazine 2 ND ug/L No
Diazinon 2 ND ug/L No
Dicamba 2 ND ug/L No
1,2-Dichlorobenzene 2 ND ug/L No
Summary of treated water organic parameters tested under Schedule 24 of O. Reg. 170/03 during the period covered by this Annual Report.
Agricultural herbicide.
Chemical and industrial factories.
Residue from banned insecticide.
Agricultural, household insecticide.
Agricultural, residential herbicide.
Agricultural, livestock, operation, residential insecticide.
Agricultural herbicide.
Agricultural, forestry, household insecticide.
Agricultural insecticide.
Chemical and industrial activities.
Insecticide.
Insecticide.
Plastics manufacturing, leaking fuel tanks.
Formed from the incomplete burning of organic matter.
Residue from banned insecticide.
Agricultural herbicide.
Potential Sources
Agricultural herbicide.
Agricultural insecticide.
Ajax page 6

Approved January 18, 2012B4-95
Appendix B: Watershed Characterization
Parameter Number of Samples Results Range Unit of Measure MACExceedance
1,4-Dichlorobenzene 2 ND ug/L No
Dichlorodiphenyltrichloroethane (DDT) + metabolites
2 ND ug/L No
1,2-Dichloroethane 2 ND ug/L No
1,1-Dichloroethylene(vinylidene chloride) 2 ND ug/L No
Dichloromethane 2 ND ug/L No
2,4-dichlorophenol 2 ND ug/L No
2,4-Dichlorophenoxyacetic acid (2,4-D) 2 ND ug/L No
Diclofop-methy1 2 ND ug/L No
Dimethoate 2 ND ug/L No
Dinoseb 2 ND ug/L No
Diquat 2 ND ug/L No
Diuron 2 ND ug/L No
Glyphosate 2 ND ug/L No
Heptachlor + Heptachlor Epoxide 2 ND ug/L No
Lindane (Total) 2 ND ug/L No
Malathion 2 ND ug/L No
Methoxychlor 2 ND ug/L No
Metolachlor 2 ND ug/L No
Metribuzin 2 ND ug/L No
Monochlorobenzene 2 ND ug/L No
Paraquat 2 ND ug/L No
Parathion 2 ND ug/L No
Agricultural herbicide.
Industrial and agricultural chemical factories and dry cleaning facilities.
Agricultural, aquatic herbicide.
Agricultural insecticide.
Agricultural, pharmaceutical insecticide.
Pest control insecticide.
Agricultural, livestock, operation, residential insecticide.
Agricultural herbicide.
Agricultural, aquatic herbicide.
Agricultural, industrial herbicide.
Agricultural, forestry, household herbicide.
Residue from banned insecticide.
Agricultural, residential herbicide.
Agricultural herbicide.
Agricultural, livestock, operation, residential insecticide.
Herbicide residue.
Industrial chemical factories.
Industrial chemical factories.
Pharmaceutical and chemical factories.
Industrial contamination, reaction with chlorine.
Chemical and industrial factories.
Residue from banned insecticide.
Potential Sources
Ajax page 7

Approved January 18, 2012 B4-96
Approved Assessment Report: Toronto and Region Source Protection Area
Parameter Number of Samples Results Range Unit of Measure MACExceedance
Pentachlorophenol 2 ND ug/L No
Phorate 2 ND ug/L No
Picloram 2 ND ug/L No
PolychlorinatedBiphenyls(PCB) 2 ND ug/L No
Popometryne 2 ND ug/L No
Simazine 2 ND ug/L No
THM - Distribution (annual average) 12 28.6 ug/L No
Temephos 2 ND ug/L No
Terbufos 2 ND ug/L No
Tetrachloroethylene 2 ND ug/L No
2,3,4,6 - Tetrachlorophenol 2 ND ug/L No
Triallate 2 ND ug/L No
Trichloroethylene 2 ND ug/L No
2,4,6-Trichlorophenol 2 ND ug/L No
2,4,5-Trichlorophenoxyacetic acid (2,4,5-T)
2 ND ug/L No
Trifluralin 2 ND ug/L No
Vinyl Chloride 2 ND ug/L No
Not Applicable - -
Potential Sources
-
Inorganic or organic parameter(s) that exceed half the standard prescribed in Schedule 2 of the Ontario Drinking Water Quality Standards.
Unit of MeasureParameter Result Date of Sample
Metal degreasing sites and other factories.
Pesticide manufacturing.
Industrial herbicide residue.
Leaching from PVC pipes; discharge from plastics factories.
Agricultural herbicide.
Agricultural insecticide.
Leaching from PVC pipes; discharge from factories; dry cleaners and auto shops (metal degreaser).
Wood preservative.
Agricultural herbicide.
Agricultural herbicide.
Agricultural herbicide.
By-product of chlorination of drinking water.
Insecticide for mosquito, black fly control.
Pesticide, wood preservative rseidue.
Agricultural insecticide.
Industrial herbicide.
Residue from various industrial uses.
Ajax page 8

Approved January 18, 2012TOC-1
Appendix C: Conceptual Water Budget
Table of ConTenTs
WaTer budgeT and sTress assessMenT
C1 ConCepTual WaTer budgeT .................................................................................C1-1
C1.1 Data Resources ....................................................................................................................................... C1-1 C1.2 Methods of Analysis ............................................................................................................................... C1-2 C1.3 Limitations: Data and Methods ............................................................................................................. C1-5 C1.3.1 Database Management ................................................................................................................. C1-5 C1.3.2 Data Limitations ............................................................................................................................ C1-6 C1.4 References ............................................................................................................................................... C1-8
C2 Tier 1 WaTer budgeT and sTress assessMenT ..................................................C2-1
C2.1 Methods of Analysis ............................................................................................................................... C2-1 C2.2 Limitations: Data and Methods ............................................................................................................. C2-4 C2.3 Uncertainty, Data and Knowledge ........................................................................................................ C2-4 C2.4 Surface Water Stress Assessment ........................................................................................................ C2-5 C2.5 Surface Water Supply and Demand .................................................................................................... C2-13 C2.6 Assessment of Required Storage ........................................................................................................ C2-24 C2.7 Groundwater Stress Assessment ........................................................................................................ C2-25 C2.7.1 Calculations .................................................................................................................................. C2-25 C2.7.2 Inputs to Stress Assessment Calculations ................................................................................ C2-25 C2.8 Stress Assessment Summary .............................................................................................................. C2-26
C3 Tier 3 WaTer budgeT and loCal risk assessMenT Workplan - sTouffville .... 113
lisT of figures
Figure C-1: Water Budget Process ....................................................................................................................... C1-4Figure C-2: PRMS/MODFLOW model process integration (Earthfx, 2007) .................................................. C2-2Figure C-3: Flow Duration Curve for Black Creek near Weston Rd. ............................................................. C2-14Figure C-4: Flow Duration Curve for Don River at Todmorden ..................................................................... C2-14Figure C-5: Flow Duration Curve for Don River at York Mills........................................................................ C2-15Figure C-6: Flow Duration Curve for Duffins Cr. above Pickering ................................................................ C2-15Figure C-7: Flow Duration Curve for Duffins Cr. at Ajax ................................................................................ C2-16Figure C-8: Flow Duration Curve for Humber River at Weston Rd. ............................................................... C2-16Figure C-9: Flow Duration Curve for Little Rouge Creek near Locust Hill ................................................... C2-17Figure C-10: Flow Duration Curve Etobicoke Creek below Q.E.W. .............................................................. C2-17Figure C-11: Flow Duration Curve for Highland Creek near West Hill. ........................................................ C2-18Figure C-12: Flow Duration Curve for Humber River at Elder Mills ............................................................. C2-18Figure C-13: Flow Duration Curve for Humber River near Palgrave ............................................................. C2-19Figure C-14: Flow Duration Curve for East Humber near Pine Grove .......................................................... C2-19Figure C-15: Flow Duration Curve for Mimico Cr. at Islington ...................................................................... C2-20Figure C-16: Flow Duration Curve for West Humber at Highway 7. ............................................................. C2-20Figure C-17: Annual Surface Water Supply and Demand for Subwatershed ET04 ...................................... C2-21Figure C-18: Annual Surface Water Supply and Demand for Subwatershed MI03 ...................................... C2-21Figure C-19: Annual Surface Water Supply and Demand for Subwatershed RO07 ...................................... C2-22

Approved January 18, 2012 TOC-2
Approved Assessment Report: Toronto and Region Source Protection Area
Figure C-20: Annual Surface Water Supply and Demand for Subwatershed HU04...................................... C2-22Figure C-21: Annual Surface Water Supply and Demand for Subwatershed CA01 ...................................... C2-23Figure C-22: Annual Surface Water Supply and Demand for Subwatershed RO02 ...................................... C2-23
lisT of Tables
Table C-1: Data Management Needs ................................................................................................................... C1-6Table C-2: Data Limitations ................................................................................................................................... C1-6Table C-3: Surface Water Supply Values (QP50) in m3/s .................................................................................. C2-5Table C-4: Surface Water Reserve Values ((QP90)in m3/s) ............................................................................. C2-7Table C-5: Surface Water Demand Summary by Subwatershed ...................................................................... C2-9Table C-6: Surface Water Stress Assessment Results ...................................................................................... C2-11Table C-7: Required Depth of Storage Calculations – Catchment CA01 ........................................................ C2-24Table C-8: Required Depth of Storage Calculations – Catchment HU04 ........................................................ C2-25Table C-9: Groundwater Stress Assessment Summary (Current) .................................................................. C2-26Table C-10: Groundwater Stress Assessment Summary (Future) ................................................................. C2-28Table C-11: Average Annual Groundwater Demand (Current) ...................................................................... C2-30Table C-12: Average Annual Groundwater Demand (Future) ........................................................................ C2-32Table C-13: Monthly Groundwater Stress Assessment (Current) ................................................................. C2-34Table C-14: Monthly Groundwater Stress Assessment (Future) ................................................................... C2-36Table C-15: Groundwater Usage Data ............................................................................................................... C2-38Table C-16: Current Water Use Estimates by Subwatershed .......................................................................... C2-53Table C-17: Future Water Use Estimates by Subwatershed ............................................................................ C2-55Table C-18: Groundwater Stress Assessment (Current Conditions, January) .............................................. C2-56Table C-19: Groundwater Stress Assessment (Current Conditions, February) ........................................... C2-58Table C-20: Groundwater Stress Assessment (Current Conditions, March) ................................................ C2-60Table C-21: Groundwater Stress Assessment (Current Conditions, April) ................................................... C2-62Table C-22: Groundwater Stress Assessment (Current Conditions, May) .................................................... C2-64Table C-23: Groundwater Stress Assessment (Current Conditions, June) ................................................... C2-66Table C-24: Groundwater Stress Assessment (Current Conditions, July)..................................................... C2-68Table C-25: Groundwater Stress Assessment (Current Conditions, August) ............................................... C2-70Table C-26: Groundwater Stress Assessment (Current Conditions, September) ......................................... C2-72Table C-27: Groundwater Stress Assessment (Current Conditions, October) ............................................. C2-74Table C-28: Groundwater Stress Assessment (Current Conditions, November) ......................................... C2-76Table C-29: Groundwater Stress Assessment (Current Conditions, December) ......................................... C2-78Table C-30: Groundwater Stress Assessment (Future Conditions, January) ................................................ C2-80Table C-31: Groundwater Stress Assessment (Future Conditions, February) ............................................. C2-82Table C-32: Groundwater Stress Assessment (Future Conditions, March) .................................................. C2-84Table C-33: Groundwater Stress Assessment (Future Conditions, April) ..................................................... C2-86Table C-34: Groundwater Stress Assessment (Future Conditions, May) ...................................................... C2-88Table C-35: Groundwater Stress Assessment (Future Conditions, June) ..................................................... C2-90Table C-36: Groundwater Stress Assessment (Future Conditions, July) ....................................................... C2-92Table C-37: Groundwater Stress Assessment (Future Conditions, August) ................................................. C2-94Table C-38: Groundwater Stress Assessment (Future Conditions, September) ........................................... C2-96Table C-39: Groundwater Stress Assessment (Future Conditions, October) ............................................... C2-98Table C-40: Groundwater Stress Assessment (Future Conditions, November) ......................................... C2-100Table C-41: Groundwater Stress Assessment (Future Conditions, December) ......................................... C2-102

Approved January 18, 2012C1-1
Appendix C: Conceptual Water Budget
C1 ConCepTual WaTer budgeT
C1.1 daTa resourCes
Using available data, the TRCA study team accounted for the following elements:
•Climate,
•Geology/Physiography,
•LandCover,
•Groundwater,
•SurfaceWater(includingreservoirsandmajordischarges);and,
•WaterDemand.
The integrated conceptual assessments were undertaken where sufficient continuous data exists:
•StreamGaugeNetworkstreamgaugestations(orHYDATstations),withsufficientperiodsofrecord(generally >5 years of continuous data),
•activeorinactiveEnvironmentCanada(WaterSurveyofCanada),
•Theclimatedatacollectedover36years(1960-1996)fromtheOshawaairportandtheOshawaWaterPollutionControlPlant;and,
•PermittedTakings(2005MOEPTTWdatabase).
Available climate data obtained from the Environment Canada stations is available from the YPDT database shared amongst the Coalition of Authorities on the Moraine (CAMC), the Regional Municipalities of York Peel and Durham, and the City of Toronto. More recent data was queried online from the EC website by month and added to the historical data where possible. CLOSPA-owned climate station data was obtained from an in-house database, though migration of this data to the YPDT database is underway.
Because most of the local Environment Canada operated stations were decommissioned over the past several years, the spatial distribution of current climate monitoring stations has been identified as a gap locally in the support of current and future local water budgeting, amongst other studies. TRCA is currently investigating, in partnership, the commissioning of a centrally located comprehensive climate station to supplement the existing network. It is anticipated that this station will also collect evaporation data.
Soil classifications are based on the National Soil Database data model for Detailed Soil Surveys found on the CanSIS website (http://sis.agr.gc.ca/cansis/nsdb/detailed/intro.html). Where applicable, Ontario Soil data items follow The Canadian System of Soil Classification (2nd Edition) 1987 (http://sis.agr.gc.ca/cansis/publications/manuals/cssc2.html) or The Canadian System of Soil Classification (third edition) 1998 (http://sis.agr.gc.ca/cansis/ references/1998sc_a.html).
To complement the thermal classification exercise, airborne thermography is used to collect the locations of springs and seepage areas. Potential springs and seeps in the Oak Ridges Moraine were mapped from Aerial Thermography collected between midnight and 3 a.m. on March 1, 1994. Data is extracted from thermal infrared images that show a contrast in surface temperatures on a cold winter night. In addition, warm areas on the thermal image may coincide with portions of streams and potential reaches of significant groundwater discharge locations, noted as potential open water. Data are then digitized from NTS map sheets into vector format. This information will be combined with available discharge mapping to help increase understanding of groundwater discharge.
Approved January 18, 2012 C1-2
Approved Assessment Report: Toronto and Region Source Protection Area
Stream gauging provides critical information needed for TRCA’s flood forecasting and warning program. This information is also important to water budgeting analyses that are necessary for source water protection. Total flows, baseflows, mean daily flows, and mean monthly flows are derived from the raw level data and stream section survey information.
C1.2 MeThods of analysis
The purpose of water budget analyses is twofold. They aim to identify watershed communities where the sustainability of water supplies is questionable and to highlight key factors that may limit the sustainability, so that appropriate risk management activities can be completed. This analysis is phased or tiered to focus on areas in need, starting at a regional scale and successively focusing in on smaller areas if necessary. The purpose of the analysis is to
•Estimatethequantityofwaterflowingthroughawatershed,
•Understandthepertinentprocessesandpathwayswaterfollows;and,
•Assessthesustainabilityofwatersupplysourcesfromaquantityperspective.
The first phase is a regional evaluation of all existing water-related data, focusing on various aspects including climate, land use, surface water, groundwater, and water use in each watershed. This phase is known as Conceptual Understanding and forms the basis for subsequent water quantity work.
The Tier 1 Screening Stress Assessment follows the Conceptual Understanding phase (see Figure C-1) and estimates the amount of water that is used currently and will be needed in the future (demand), and compares this to the amount of water available (supply) minus a reserve quantity (demand/(supply – reserve)). The reserve quantity represents the amount of water needed to sustain activities outside of drinking water, such as for maintaining groundwater discharge, supporting the ecosystem, diluting sewage treatment plant effluent, and maintaining navigation. Those areas where municipal drinking water supplies (demand) exceed a certain threshold will be subject to further investigations, namely a Tier 2 Refined Stress Assessment. All areas of the province are to conduct the Conceptual Understanding and Tier 1 analyses.
The subsequent Tier 2 analysis, should it be necessary, focuses in on a smaller area (subwatershed) and will test the assessment results of Tier 1 using newly collected information and more sophisticated technical tools (e.g., numerical groundwater flow models). Should the Tier 2 results suggest that an area may be experiencing stress from a water quantity perspective, then the area will progress to a Tier 3 Risk Assessment for the local area.
The following sections describe the quantitative conceptual understanding undertaken to date by TRCA. The general steps undertaken to generate the estimates are summarized as follows:
•Descriptionofthewatershedconditions,includingasummaryofstreamflow,totalprecipitationfromlocal gauging stations as well as all other hydrological components,
•Estimationofthegroundwaterdischargecomponentthroughhydrographseparations(arangeofvaluesdependent on methodology selected),
•Availableregionalgeologymodelsarecurrentlyusedtodeterminepotentialareasofdischarge.Itisassumed that the amount of groundwater discharge equals groundwater recharge where the change in storage is considered to be negligible within the catchment area. Interflow is included in either of runoff or groundwater discharge,

Approved January 18, 2012C1-3
Appendix C: Conceptual Water Budget
•ComparisonofETcalculationstoestimatesprovidedinexistingsubwatershed,drainageordevelopmentplan proposals for sensitive areas where possible,
•Waterbudgetoutputcomprisedofawatershed-basedquantificationofhydrologicalcomponentsprepared,
•Themeanannualpotentialevapotranspiration(calculatedbytheThornthwaitemethod),
•Calculatewatersurplus(infiltrationandrunoff)accordingtothemethodologyofThornthwaiteandMather (1957). This was calculated using monthly mean temperature and precipitation data for 38 climatestationswithinorneartheRegionofDurham;and,
•PartitionthewatersurplusintorunoffandinfiltrationaccordingtothecoefficientmethodoutlinedinOntario Ministry of the Environment (1995) utilizing soil characteristics, topography and vegetative cover.
There are also a number of water budget investigations being conducted within TRSPA jurisdiction as part of the Regional YPDT Groundwater Management Study. The methods being utilized include:
•HSP-FModels(HydrologicalSimulationProgram–Fortran),
•WABAS(WaterBalanceAnalysisSystem;ClarificaInc.);and,
•MODFLOW,athree-dimensionalnumericalgroundwaterflowmodel(CAMC-Earthfx,2006).
HSP-F is a numerical model that is capable of simulating hydrologic processes, pollutant generation and transport processes both within catchments and along watercourse networks. This tool has been used to assess the potential benefits of implementing stormwater management practices. The model was calibrated to streamflow, surface water quality and sewer discharge data.
Water budget estimates for both existing and future Official Plan land use scenarios have been conducted by ClarificaInc.(2002;2003a;2003b)usingtheWABASmethodology(Grahametal.,1997)fortheUpperHumberRiver watershed, the Petticoat Creek watershed and the Duffins Creek watershed. Inputs to the model include:
•Dailyprecipitation,
•Averageormaximumdailytemperature,
•Panevaporation,
•Dailystreamflowmeasurements;and,
•Physicalbasinparameters,includingimperviousness,interceptionabstractions,vegetationandsoilcharacteristics.
Theoutputsfromthemodelaretimeseriesof;
•Runoff,
•Infiltration,
•Evaporation;and,
•Storageconditionswithineachwaterreservoir(perviousandimperviousinterceptionstorage,surficialsoil storage and snow pack storage).
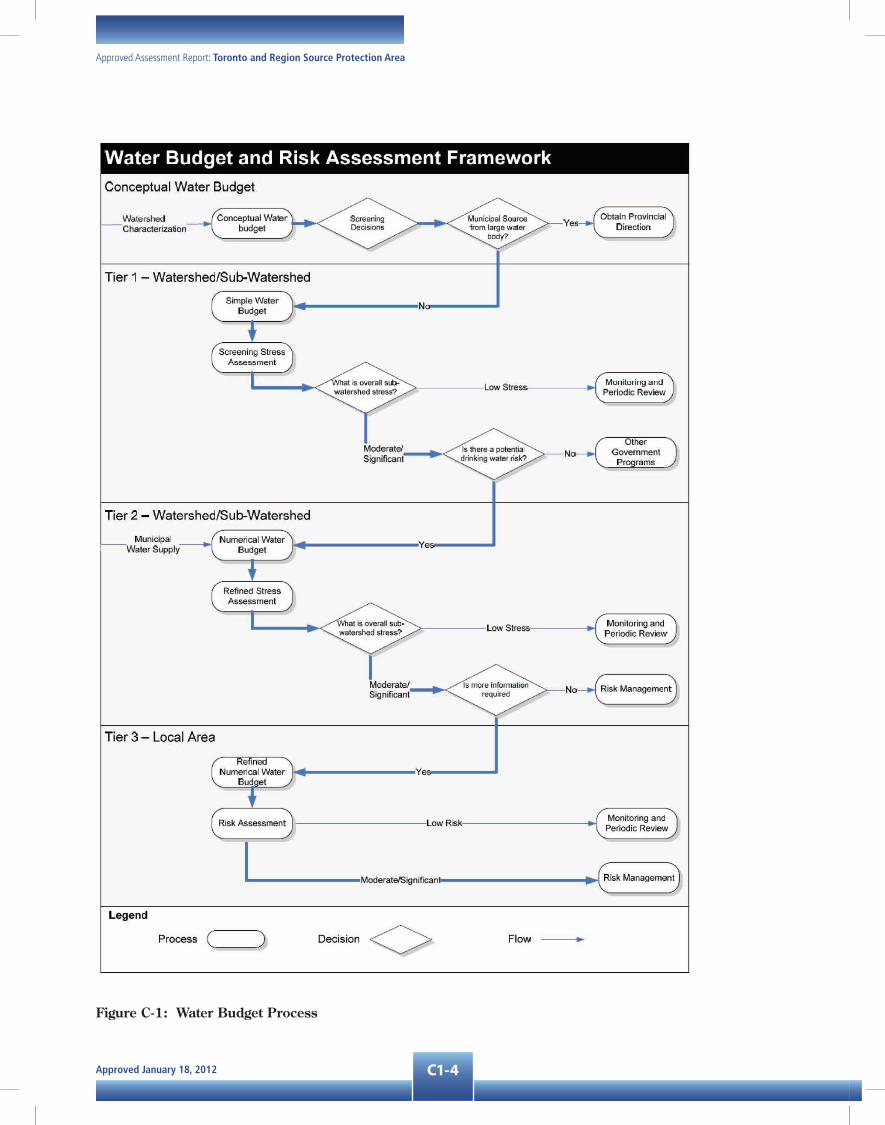
Approved January 18, 2012 C1-4
Approved Assessment Report: Toronto and Region Source Protection Area
figure C-1: Water budget process
Approved January 18, 2012C1-5
Appendix C: Conceptual Water Budget
With respect to the regional numerical groundwater flow model (MODFLOW), which encompasses the study area, initial estimates of applied net recharge on a regional scale were developed and used as input into the Regional Model developed for the YPDT Groundwater Management Study (Earthfx, 2004).
Data on land use, climate and soil properties were analyzed to provide the initial estimates of the spatial distribution of groundwater recharge. The primary influence on the recharge distribution was assumed to be the surficial geology as mapped by the GSC. The initial estimates used in the model were adjusted during model calibration. Additional calibration is required as the Core Model is applied over the study area. Recharge rates in the preliminary regional model assessment were highest over the ORM due to the sandy soils and hummocky topography (360 mm/a) and lowest in areas covered with lake sediments or organic deposits.
Groundwater discharge estimates from streamflow hydrograph separation basically involve removing the runoff or storm/melt events that form peaks on the hydrograph over relatively short durations (hours to days). The groundwater component is considered to be the more consistent contributor to streamflow with annual fluctuations seen as gradual changes in the hydrograph. The three-dimensional numerical groundwater flow model (MODFLOW) being constructed for the ORM is using groundwater discharge estimates from hydrograph separation as one of the flux calibration targets.
From daily average streamflow measurements, the groundwater discharge component is assumed to be approximately equal to a 5 day running average of the 7 day running minimum daily average flow. This method issimilartothatutilizedbytheWABASmethod(Clarifica,2002);howevertheWABASmethodfocusesontherunoff component when calibrating the soil moisture balance model. The WABAS methodology was coupled with the MODFLOW model for a pilot water budget analysis for three watersheds within the Lake Simcoe Region Conservation Authority (Earthfx Inc. and Gerber Geosciences Inc.)
The reader is referred to the Conceptual Water Budget report for the TRSPA jurisdiction prepared by Gartner Lee (2007).
C1.3 liMiTaTions: daTa and MeThods
Efforts were made throughout the conceptual water budget assessment to identify database management gaps, key analytical gaps and knowledge gaps. These gaps are being addressed where possible in facilitating the move forward activities.
C1.3.1 database Management
Data management that is undergoing of refinement arise when database structures are no longer functional for the required analysis, or are not scalable or linkable. In addition, gaps arise when database population or metadata tracking are required. Gaps are addressed recognizing the appropriate scale of the specific study being undertaken have been identified for water budgeting purposes and are primarily related to (Table C-1):
•Streamflowstage-flowrelationships,
•Hydrologicandwaterusedatabasestructuredevelopment;and,
•DataloaderandArcHydrodevelopment.

Approved January 18, 2012 C1-6
Approved Assessment Report: Toronto and Region Source Protection Area
Table C-1: data Management needs
Data Management
WC Deliverable Data Set Name or Source Data Problem Comment
Integrated Hydrologic Database Hydrologic data. requires update YPDT db data loader requires structure update.
York-Peel-Durham-Toronto (YPDT) Hydrogeologic Database
Various data sources. requires update Additional monitoring locations/data to be imported.
PTTW Database MOE PTTW data and field survey data.
requires update Internal database to be developed/ populated.
C1.3.2 data limitations
Data that are undergoing refinement have been identified for water budgeting purposes and are summarized in Table C-2. Identified items are generally consistent with those reported in the characterization report:
•Futuredevelopmentareas,
•Surfacewaterthermalclassifications,
•Seepageandspringsdelineation,
•Serviced/unservicedareasandstormwatermanagementfacilities,
•Precipitationdistribution,andevaporation;and,
•Spatialandtemporaldistributionoflowflows.Whilesomeofthesegapshavebeendealtwithinthisrevision, (e.g., thermal classification), several more will be addressed during the Tier 1 reporting.
Table C-2: data limitations
Identified Data that is undergoing Refinement (not available at the time of reporting)
Water Budget and Stress Assessment
Component Data Set Name or Source Data Problem Comment
Integrated Hydrologic Database Hydrologic data. Requires update YPDT db data loader requires structure update.
York-Peel-Durham-Toronto (YPDT) Hydrogeologic Database
Various data sources. Requires update Additional monitoring locations/data to be imported.

Approved January 18, 2012C1-7
Appendix C: Conceptual Water Budget
Identified Data that is undergoing Refinement (not available at the time of reporting)
Water Budget and Stress Assessment
Component Data Set Name or Source Data Problem Comment
Gauge Database/Installations TRCA data Requires update Internal database to be developed/populated.
Stormwater Management Facili-ties Map
Upper/lower tier municipalities. Field verification.
Partially populated Data requested.
Precipitation Distr. Map
ET Zone Map (draft PRMS map included)
AES (CDCD), TRCA data. Partially populated too sparse Data gaps to be filled. Maps to be completed.
Seepage and Springs Map TRCA field program Partially populated Field surveying and digitizing required. Historical Thermography mapping is included.
Aggregate Resources Update MNR OGDE, MNDM, Municipal, field surveys.
Partially populated Existing data requires orthophotogra-phy review to verify locations.
Integrated Monitoring Network Site Locations and Data Review
TRCA, Region studies. Requires update A review of monitoring needs is required. Paucity of climate data to be addressed.
Water Well Information System (WWIS)
MOE data and field survey data. Requires update Data requested.
Knowledge Gaps
Refinement of aquifer characterization and flow system understanding including the orientation of bedrock valley systems and significant area recharge and discharge mapping;
Ongoing refinement of the existing surface water understanding (refining the tested PRMS model);
Ongoing refinement of the existing groundwater flow understanding (refining the existing Core MODFLOW model);
Understanding of the interaction of the surface water and groundwater flow, including wetlands, within the system;
Development of acceptable water use targets to protect both the resource and the aquatic ecosystem; and,
Development of methodology and tools to provide potential spills response analysis which will involve overland flow, stream travel and ground-water flow including the unsaturated zone transport.
A more comprehensive understanding of the QDEMAND components of the water budget, including assessing the permits and actual water use.

Approved January 18, 2012 C1-8
Approved Assessment Report: Toronto and Region Source Protection Area
Knowledge gaps identified relate to the analysis and tool adjustment required to quantify the water budget estimates and to understand how the flow system operates. These tools enable predictions of impacts from potential future changes such as climate or land use change. Identified knowledge gaps with respect to the conceptual (to date) include:
•Refinementofaquifercharacterizationandflowsystemunderstandingincludingtheorientationofbedrock valley systems and significant area recharge and discharge mapping,
•Refinementoftheexistingsurfacewaterunderstanding(refiningthetestedPRMSmodel),
•Refinementoftheexistinggroundwaterflowunderstanding(refiningtheexistingCoreMODFLOWmodel),
•Understandingoftheinteractionofthesurfacewaterandgroundwaterflow,includingwetlands,withinthe system,
•Developmentofacceptablewaterusetargetstoprotectboththeresourceandtheaquaticecosystem;and,
•Developmentofmethodologyandtoolstoprovidepotentialspillsresponseanalysiswhichwillinvolveoverland flow, stream travel and groundwater flow including the unsaturated zone transport.
C1.4 references
Clarifica Inc., 2002: Water Budget in Urbanizing Watersheds: Duffins Creek Watershed. Prepared for the Toronto and Region Conservation Authority, May 21, 2002.
Clarifica Inc., 2003a: Water Budget in Urbanizing Watersheds: Upper Humber River Sub-watershed. Prepared for the Toronto and Region Conservation Authority, March 2003.
Clarifica Inc., 2003b: Water Budget in Urbanizing Watersheds: Petticoat Watershed. Prepared for the Toronto and Region Conservation Authority, DRAFT March 2003.
Kassenaar, J.D.C. and Wexler, E.J. 2006: Groundwater Modelling of the Oak Ridges Moraine Area. CAMC-YPDT Technical Report #01-06.
Thornthwaite and Mather, 1957: Instructions and Tables for Computing Potential Evapotranspiration and the Water Balance.
Puopolo, J. and Usher, S., 2006. Conceptual Understanding of the Watersheds, Toronto and Region Conservation Authority.

Approved January 18, 2012C2-1
Appendix C: Conceptual Water Budget
C2 Tier 1 WaTer budgeT and sTress assessMenT
C2.1 MeThods of analysis
The Tier 1 Water Budget methodology assessed the existing hydrologic conditions within the watershed using both Conceptual Understanding and numerical modelling information developed through the Source Water Protection program and the CAMC-YPDT Groundwater Study reporting. The conceptual model development involved the collection and analysis of baseline information related to climate, surface water and groundwater.
The purpose of a Tier 1 analysis is to estimate the hydrologic stress of subwatersheds in order to screen out areas that are unstressed from a water quantity perspective. Future efforts and resources (Tier 2 and 3) can then focus on areas that are stressed. At Tier 1, for each subwatershed, the Technical Rules, Nov 2009, require theevaluationoftwoscenarios:(1)currentconditions;and(2)25-yearfuturedemand.Thegoalofthecurrentconditions scenario is to identify subwatersheds that are under stress as a result of existing water takings. The goal of the 25-year future scenario is to identify additional watersheds that may become stressed as a result of additional drinking water requirements.
A planned subset of objectives specific to TRCPA’s Tier 1 numerical modelling is noted below:
•Quantifycomponentsofthehydrologiccycle,
•Applytoolsforuseinanalysis,
•Improveunderstandingofthegroundwatersystem,
•Definelinksbetweenshallowanddeeperflow,
•Assesschangesduetogroundwater/surfacewaterwithdrawal,urbanization,andclimatechange,
•Providespatialmappingofhydrologicalcomponents,
•Supportanunderstandingofflowregimesinun-gaugedwatershedsorwatershedwithapaucityofdata,
•Determinelevelsofstress(i.e.,demandvs.availablewater);and,
•Ultimatelyhelpidentifyriskstothewatershedsinaprocessconsistentwithprovincialguidance.
Following the Conceptual Understanding phase is the Tier 1 Screening Stress Assessment Tier 1 estimates the amount of water that is used currently and will be needed in the future (Demand), and compares this to the amount of water available (Supply) minus a Reserve quantity (Demand/(Supply – Reserve)). The Reserve quantity represents the amount of water that is deemed necessary to sustain other activities outside of drinking water use such as for maintaining groundwater discharge, to support the ecosystem, to dilute sewage treatment plant effluent, to maintain navigation, etc. Those areas where municipal drinking water supplies (Demand) exceed a certain threshold will be subject to further investigations, namely a Tier 2 Refined Stress Assessment.
The schematic shown in FigureC-2 depicts the processes used by the numerical models. A modified Precipitation-Runoff Modelling System (PRMS: surface water model) code developed by the United States Geologic Survey (USGS) was used to estimate quantitatively the various water budget fluxes such as precipitation, interception, evaporation, potential and actual evapotranspiration, snowmelt, runoff, and groundwater interflow and infiltration (Earthfx, 2007).

Approved January 18, 2012 C2-2
Approved Assessment Report: Toronto and Region Source Protection Area
figure C-2: prMs/ModfloW model process integration (earthfx, 2007)
The model integrates watershed characteristics, such as slope, aspect, elevation, soils, land use and cover, precipitation, snowpack, temperature, solar radiation. Square cells, 25 metres on a side, were used to represent the distribution of the characteristics within the watershed, and a daily water balance was calculated for

Approved January 18, 2012C2-3
Appendix C: Conceptual Water Budget
each cell for the simulation period. Daily averages were then averaged over a 19-year simulation period to determine the long-term average annual millimetres per year (mm/yr) for each water budget component. The model was calibrated to total surface water flow data and baseflow estimates from stream gauging, and to the groundwater flow model simulations.
The groundwater model, referred to as the “West Model,” was used to simulate groundwater budget components such as groundwater levels and groundwater discharge to streams (Earthfx, 2007) (). The model integrates data on the physical, geologic, and hydrologic features that govern groundwater flow in the watershed. Calibration was conducted in a trial-and-error process where results of successive model runs were primarily matched to hydraulic heads and flows interpolated from observed static water levels obtained from the MOE Water Well Information System (WWIS). Matching baseflow in the watershed was a second calibration target. A post-processing programme was used to determine lateral groundwater inflows and outflows (underflows) across the watershed boundaries. These underflows were used to adjust the calibration of both the PRMS model and the simulated groundwater discharge from the MODFLOW model.
A surface water model such as PRMS, due to its simplified representation of the groundwater flow processes, may not calibrate properly to observed streamflow if the watershed is gaining or losing significant quantities of groundwater underflow across the watershed boundary. For instance, if the stream gauge data when normalized to the drainage area above the gauge indicates higher rates of normalized flow than recorded at other gauges outside of the watershed, it may indicate that the additional flow is attributable to groundwater inflow from outside the watershed. If this groundwater inflow is not accounted for, the surface water model would need to be adjusted to account for additional groundwater recharge in the watershed. Iteratively calibrating the surface water model (PRMS) to the groundwater flow model (MODFLOW) provides a check on the simulated rates of recharge.
For example, if the PRMS model computes recharge rates that are higher in an area than the groundwater system can transmit, the MODFLOW model will simulate groundwater levels to be much higher than observed. Conversely, if recharge rates are too low, the simulated groundwater levels will also be low. This cross-calibration exercise between the two models also provides a method of determining the net underflow across watershed boundaries. These flows can be subtracted from the observed flows measured at the stream gauge to re-estimate recharge within the watershed. This type of coupling of models is termed “loosely coupled” as they are not directly connected to each other.
The reader is referred to the Tier 1 Water Budget report for the TRSPA jurisdiction prepared by TRCA (2010).The terminology of the water budget parameters used in this chapter consist of Precipitation (P), Net Precipitation (Pnet or precipitation minus interception), Interception (I), Actual Evapotranspiration (AET), Groundwater Infiltration (GWI), Groundwater Lateral (underflow) in (GWLin) and out (GWLout) of the watershed, Discharge to Streams or Groundwater Discharge (GWD) and Runoff (RO). For the purposes of this chapter, GWI is assumed to include groundwater interflow to streams and groundwater recharge to the saturated zone.
Water withdrawals are represented by groundwater use (GW use) or surface water use (SW use). These water budget components represent the key items discussed in this chapter. Long term average annual values of Pnet, I, AET, GWI, GWD and RO are reported at a watershed and subwatershed scale, along with mapping of areas of GWI and GWD.
Water budget estimates are typically normalized to units of millimetres of water distributed over a drainage area per year (mm/yr or mm/a). This is accomplished by converting flow or accumulation rates (e.g., m³/s or L/s) to total volumes per year, and then dividing by the contributing drainage area.

Approved January 18, 2012 C2-4
Approved Assessment Report: Toronto and Region Source Protection Area
The most important source of water use information was the TRCA Water Use Assessment (WUA) database, built upon the MOE PTTW database. The TRCA validated the MOE PTTW database between 2003 and 2005 in the field and has been updating this database over the past two years through Environmental Bill of Rights (EBR) registry postings and MOE application notifications. Field surveys of local water users collected estimates of actual usage rates, which are generally much less than the maximum permitted rates. Additional water use assessment studies completed by the Regions of Peel, York and Durham were amalgamated into thefinaldataset(Marshall,Macklin,Monaghan,2006;GolderAssociates,2003;GartnerLee,2003;Beattyand Associates, 2003). The Regions of Peel, York, and Durham subsequently provided an update of monthly groundwater use for all of their active municipal wells.
Non-serviced domestic water use was calculated by combining the unserviced population estimates by subwatershed with estimated per capita demand of 335 L/d/person from the Environment Canada water use website (www.ec.gc.ca). This value is consistent with the value recommended in Guidance Module 7.
While efforts have been made to accurately present the findings reported in this chapter, factors such as significant digits and rounding, digitizing and data interpretation may influence results. For instance, in data tables no relationship between significant digits and level of accuracy is implied, and values may not always sum to the expected total.
C2.2 liMiTaTions: daTa and MeThods
Empirical methods used to analyze simple functions of physical systems have identified limitations, such as relying on limited available data, or in the application of scale. These methods either simulate at a point or simulate a large area as a single value limiting the ability to scale down to a local area or to distribute water reservoir estimates spatially (Ely, 2006). Process-based numerical models that compute distributed water budgets are used to simulate hydrologic processes at varying scales using generally readily available data (Ely, 2006). Numerical models are generally deterministic meaning they are based on physical theories and equations, and are generally referred to as physically based models. Lumped models simplify physical characteristics by treating catchments as singular response areas using spatially averaged parameters over each area. Distributed models discretize the spatial variation of physical features into a grid or cell-type representation (Barth, 2005). The lumped approach is generally used in conceptual models, whereas distributed physically based models are used for more detailed spatial and temporal analysis and scenario testing.
C2.3 unCerTainTy, daTa and knoWledge
Uncertainty is inherent in the water budget estimation process. The accuracy of estimates relies on the:
•Quantityandqualityoftheinputdata(e.g.,relatedtostreamflow,climate,groundwaterwellrecords),
•Conceptualunderstandingofthewatersheds;and,
•Modellingcalculationmethodology.
Overall, the issues related to uncertainty, data and knowledge gaps are complex and highly qualitative. There isadegreeofuncertaintyassociatedwitheveryaspectofthewaterbudgetanalyses;however,itisimpossibleto provide a quantitative assessment of the level of uncertainty. Rather, one can only say, in very general terms, that the level is low, moderate or high.

Approved January 18, 2012C2-5
Appendix C: Conceptual Water Budget
The Technical Rules suggests that it would be reasonable to expect a low level of uncertainty in areas where data density is high, where hydrogeologic studies have been conducted, and where numerical models have been developed. This study generally satisfies all three of these criteria. It is recognized, however, that all hydrogeologic analyses have an intrinsic level of uncertainty, because one can never have enough data to fully know how conditions vary in the subsurface.
Development of the YPDT-CAMC Core Model entailed a comprehensive process of (1) collecting and filtering thelargeamountofwaterwell,monitoringwell,andothergeologicdata;(2)interpretingthegeologiclogsasbestaspossibleandbuildingaconceptualgeologicmodel;(3)assigninginitialestimatesofaquiferpropertiesandrechargeratesandthenrefiningtheestimatesthroughmodelcalibration;and(4)performingstatisticaland sensitivity analyses to demonstrate the validity of the model calibration. The report by Kassenaar and Wexler (2006) documents the procedures and focuses a great deal of attention on answering the questions related to assessing model uncertainty.
While these independent review comments increase the comfort level with the results of the modelling process, there is still the recognition that geologic data are always incomplete and that the WWIS data used in a large part to develop the models has a high degree of error and uncertainty. Data obtained from municipal monitoring networks and other high-quality sources have less uncertainty and have provided useful information in the vicinity of the municipal wellfields. The number of wells and spatial coverage of high-quality data are limited compared to the WWIS data, however. It is recommended that CLOSPA continue to improve its monitoring network over time and incorporate the available high quality data, especially within the higher stressed watersheds, and thereby reduce the level of uncertainty associated with the numerical models.
Computer models are a simplification of the real world, built from limited and potentially erroneous data, so their results should be considered with care and independently verified. It should be recognized that the passage of time affects the information provided. Environmental conditions can change. Computer simulations are based upon information that existed at the time the data and model was formulated.
C2.4 surfaCe WaTer sTress assessMenT
The surface water supply values for each subwatershed by month are provided in Table C-3 the monthly reserve values are in TableC-4 and the estimated monthly demand values are in Table C-5.
Table C-3: surface Water supply values (Qp50) in m3/s
Watershed Catchment Jan Feb Mar Apr May Jun Jul Aug Sep Oct Nov Dec
Etobicoke
ET01 1.204 1.056 1.665 1.951 1.135 0.431 0.122 0.076 0.118 0.262 0.834 1.026
ET02 0.122 0.102 0.149 0.157 0.112 0.047 0.014 0.012 0.015 0.039 0.091 0.115
ET03 0.323 0.273 0.447 0.459 0.281 0.118 0.039 0.029 0.046 0.097 0.257 0.292
ET04 0.603 0.540 0.913 1.080 0.595 0.204 0.053 0.023 0.041 0.089 0.367 0.493
Mimico
MI01 0.368 0.300 0.479 0.524 0.366 0.163 0.049 0.036 0.048 0.111 0.281 0.357
MI02 0.066 0.053 0.081 0.095 0.066 0.031 0.009 0.007 0.010 0.021 0.055 0.066
MI03 0.094 0.070 0.118 0.168 0.118 0.057 0.019 0.013 0.018 0.039 0.097 0.109

Approved January 18, 2012 C2-6
Approved Assessment Report: Toronto and Region Source Protection Area
Watershed Catchment Jan Feb Mar Apr May Jun Jul Aug Sep Oct Nov Dec
Humber
HU01 6.927 5.393 10.053 12.255 6.473 2.138 0.818 0.455 0.673 2.321 6.134 7.024
HU02 0.364 0.249 0.454 0.408 0.264 0.113 0.048 0.030 0.070 0.207 0.399 0.458
HU03 0.940 0.891 1.452 1.931 1.063 0.332 0.087 0.022 0.025 0.122 0.577 0.822
HU04 0.419 0.437 0.707 0.963 0.523 0.151 0.039 0.008 0.007 0.052 0.249 0.390
HU05 3.375 2.499 4.608 6.276 3.051 0.968 0.362 0.179 0.216 1.153 3.019 3.362
HU06 1.556 1.240 2.172 2.936 1.411 0.460 0.240 0.166 0.213 0.654 1.553 1.806
HU07 0.849 0.625 1.136 1.604 0.776 0.265 0.180 0.130 0.168 0.487 0.986 1.056
HU08 0.307 0.232 0.392 0.509 0.239 0.072 0.030 0.023 0.028 0.138 0.314 0.334
HU09 0.687 0.541 0.883 0.968 0.444 0.124 0.034 0.018 0.024 0.223 0.601 0.658
HU10 2.267 1.589 3.019 4.422 2.049 0.672 0.248 0.137 0.172 0.903 2.150 2.232
HU11 0.550 0.394 0.713 0.958 0.425 0.142 0.056 0.029 0.037 0.197 0.480 0.522
HU12 1.207 0.821 1.674 2.753 1.320 0.439 0.164 0.100 0.131 0.597 1.321 1.270
Don
DO01 2.254 1.803 3.214 3.193 1.870 0.709 0.322 0.265 0.470 1.251 2.596 2.933
DO02 0.191 0.151 0.232 0.221 0.145 0.058 0.023 0.015 0.039 0.116 0.223 0.246
DO03 0.971 0.756 1.404 1.646 0.936 0.369 0.202 0.180 0.244 0.610 1.289 1.379
DO04 0.803 0.612 1.088 1.021 0.603 0.222 0.088 0.058 0.145 0.399 0.847 1.003
DO05 0.326 0.270 0.506 0.541 0.307 0.113 0.046 0.034 0.050 0.127 0.369 0.426
DO06 0.410 0.371 0.637 0.828 0.451 0.174 0.130 0.113 0.125 0.269 0.561 0.584
DO07 0.217 0.173 0.360 0.419 0.241 0.094 0.040 0.033 0.052 0.151 0.336 0.344
Highland
HI01 0.041 0.034 0.064 0.073 0.048 0.018 0.004 0.001 0.003 0.015 0.048 0.055
HI02 0.533 0.336 0.623 0.671 0.442 0.171 0.075 0.054 0.138 0.400 0.771 0.825
HI03 0.291 0.183 0.364 0.342 0.223 0.084 0.035 0.024 0.073 0.218 0.413 0.448
HI04 0.188 0.115 0.230 0.243 0.163 0.068 0.034 0.028 0.059 0.162 0.301 0.309
Rouge
RO01 1.863 1.452 2.675 3.615 2.011 0.702 0.258 0.160 0.286 1.044 2.557 2.779
RO02 0.638 0.505 0.923 1.237 0.664 0.205 0.057 0.024 0.059 0.261 0.755 0.882
RO03 1.210 0.918 1.721 2.337 1.321 0.490 0.197 0.138 0.226 0.750 1.754 1.888
RO04 0.902 0.702 1.354 1.814 1.014 0.374 0.164 0.122 0.170 0.523 1.257 1.339
RO05 0.262 0.202 0.393 0.527 0.291 0.109 0.073 0.062 0.069 0.167 0.364 0.384
RO06 0.156 0.130 0.239 0.338 0.188 0.063 0.017 0.007 0.016 0.068 0.204 0.229
RO07 0.286 0.225 0.434 0.571 0.293 0.095 0.037 0.023 0.040 0.132 0.345 0.379
Petticoat PE01 0.119 0.087 0.151 0.193 0.115 0.038 0.009 0.003 0.013 0.066 0.168 0.193
F. Bay FR01 0.145 0.096 0.167 0.203 0.127 0.047 0.013 0.007 0.024 0.081 0.191 0.206

Approved January 18, 2012C2-7
Appendix C: Conceptual Water Budget
Watershed Catchment Jan Feb Mar Apr May Jun Jul Aug Sep Oct Nov Dec
Duffins
DU01 1.967 1.423 2.606 3.533 1.845 0.633 0.312 0.213 0.331 1.019 2.343 2.582
DU02 1.833 1.316 2.443 3.342 1.726 0.581 0.291 0.203 0.313 0.947 2.133 2.380
DU03 0.755 0.505 0.958 1.406 0.725 0.246 0.129 0.089 0.135 0.393 0.867 0.963
DU04 0.512 0.350 0.649 1.036 0.514 0.180 0.110 0.081 0.120 0.277 0.559 0.610
DU05 0.509 0.360 0.659 0.957 0.475 0.169 0.110 0.082 0.124 0.293 0.568 0.619
DU06 0.299 0.242 0.414 0.533 0.264 0.082 0.027 0.016 0.032 0.099 0.273 0.323
Carruthers CA01 0.234 0.153 0.267 0.313 0.185 0.062 0.017 0.007 0.021 0.110 0.278 0.319
Lake Ontario
LO01 0.135 0.118 0.163 0.155 0.111 0.049 0.015 0.011 0.016 0.039 0.095 0.120
LO04 0.118 0.092 0.138 0.134 0.083 0.028 0.008 0.003 0.019 0.060 0.127 0.144
LO03 0.123 0.159 0.185 0.165 0.102 0.036 0.010 0.004 0.008 0.032 0.084 0.108
LO02 0.355 0.356 0.382 0.319 0.199 0.069 0.024 0.019 0.051 0.131 0.246 0.307
LO05 0.028 0.021 0.037 0.038 0.025 0.009 0.002 0.001 0.004 0.014 0.034 0.037
LO06 0.021 0.013 0.021 0.022 0.015 0.006 0.003 0.002 0.004 0.014 0.027 0.029
Table C-4: surface Water reserve values ((Qp90)in m3/s)
Watershed Catchment Jan Feb Mar Apr May Jun Jul Aug Sep Oct Nov Dec
Etobicoke
ET01 0.518 0.665 1.056 1.084 0.643 0.190 0.059 0.037 0.047 0.126 0.299 0.623
ET02 0.057 0.060 0.091 0.087 0.067 0.023 0.008 0.006 0.008 0.016 0.035 0.067
ET03 0.139 0.172 0.262 0.268 0.160 0.051 0.017 0.015 0.018 0.050 0.114 0.180
ET04 0.252 0.360 0.557 0.617 0.325 0.086 0.024 0.012 0.013 0.038 0.102 0.296
Mimico
MI01 0.159 0.162 0.271 0.267 0.220 0.074 0.027 0.016 0.024 0.049 0.116 0.204
MI02 0.028 0.031 0.049 0.050 0.039 0.013 0.005 0.003 0.005 0.009 0.024 0.039
MI03 0.039 0.034 0.062 0.079 0.069 0.024 0.009 0.006 0.009 0.017 0.043 0.065

Approved January 18, 2012 C2-8
Approved Assessment Report: Toronto and Region Source Protection Area
Watershed Catchment Jan Feb Mar Apr May Jun Jul Aug Sep Oct Nov Dec
Humber
HU01 3.183 3.444 6.220 7.585 3.663 1.065 0.403 0.245 0.224 0.975 2.919 4.337
HU02 0.176 0.141 0.217 0.205 0.156 0.049 0.023 0.016 0.015 0.092 0.204 0.271
HU03 0.399 0.528 0.920 1.031 0.585 0.140 0.037 0.012 0.010 0.049 0.134 0.455
HU04 0.189 0.245 0.442 0.502 0.291 0.067 0.017 0.004 0.003 0.021 0.055 0.196
HU05 1.596 1.678 2.927 4.031 1.802 0.533 0.176 0.099 0.082 0.368 1.590 2.131
HU06 0.738 0.775 1.484 1.761 0.838 0.240 0.101 0.091 0.078 0.250 0.771 1.145
HU07 0.401 0.379 0.797 0.989 0.472 0.146 0.071 0.073 0.066 0.187 0.549 0.685
HU08 0.147 0.144 0.272 0.319 0.137 0.036 0.013 0.013 0.009 0.039 0.172 0.218
HU09 0.345 0.361 0.589 0.606 0.252 0.059 0.017 0.011 0.005 0.053 0.300 0.424
HU10 1.078 1.069 1.788 2.927 1.264 0.404 0.135 0.080 0.070 0.277 1.218 1.482
HU11 0.269 0.267 0.435 0.591 0.257 0.084 0.028 0.016 0.010 0.054 0.261 0.354
HU12 0.549 0.523 0.919 1.897 0.818 0.272 0.090 0.058 0.057 0.197 0.784 0.861
Don
DO01 1.115 0.985 1.739 1.699 1.092 0.320 0.160 0.127 0.122 0.569 1.385 1.778
DO02 0.099 0.081 0.131 0.116 0.086 0.026 0.012 0.008 0.008 0.052 0.115 0.147
DO03 0.457 0.412 0.792 0.916 0.556 0.168 0.087 0.081 0.080 0.280 0.697 0.849
DO04 0.394 0.355 0.582 0.537 0.348 0.098 0.043 0.032 0.028 0.183 0.436 0.603
DO05 0.157 0.166 0.291 0.299 0.176 0.051 0.023 0.018 0.014 0.059 0.151 0.255
DO06 0.204 0.204 0.393 0.499 0.270 0.083 0.046 0.052 0.052 0.116 0.291 0.382
DO07 0.103 0.089 0.189 0.225 0.142 0.042 0.021 0.016 0.016 0.059 0.184 0.209
Highland
HI01 0.020 0.019 0.035 0.038 0.028 0.007 0.002 0.001 0.001 0.005 0.019 0.033
HI02 0.260 0.185 0.314 0.345 0.256 0.077 0.037 0.028 0.023 0.175 0.458 0.496
HI03 0.143 0.100 0.163 0.175 0.128 0.037 0.017 0.013 0.010 0.090 0.245 0.274
HI04 0.092 0.065 0.103 0.126 0.095 0.031 0.017 0.014 0.012 0.071 0.183 0.182
Rouge
RO01 0.918 0.798 1.590 2.019 1.192 0.318 0.127 0.079 0.082 0.354 1.260 1.661
RO02 0.321 0.297 0.563 0.706 0.392 0.094 0.028 0.013 0.011 0.082 0.333 0.530
RO03 0.588 0.491 1.015 1.302 0.789 0.222 0.096 0.065 0.071 0.266 0.915 1.125
RO04 0.430 0.368 0.804 1.040 0.606 0.174 0.078 0.057 0.064 0.191 0.640 0.810
RO05 0.126 0.112 0.236 0.324 0.175 0.053 0.028 0.028 0.028 0.066 0.191 0.247
RO06 0.077 0.068 0.144 0.186 0.112 0.028 0.009 0.004 0.004 0.021 0.087 0.136
RO07 0.139 0.127 0.267 0.345 0.174 0.046 0.017 0.013 0.012 0.046 0.171 0.235
Petticoat PE01 0.061 0.049 0.083 0.099 0.068 0.016 0.004 0.002 0.001 0.020 0.082 0.114
F. Bay FR01 0.066 0.052 0.093 0.095 0.072 0.019 0.007 0.004 0.004 0.031 0.099 0.130

Approved January 18, 2012C2-9
Appendix C: Conceptual Water Budget
Watershed Catchment Jan Feb Mar Apr May Jun Jul Aug Sep Oct Nov Dec
Duffins
DU01 0.955 0.854 1.615 2.090 1.123 0.318 0.132 0.103 0.115 0.384 1.198 1.610
DU02 0.888 0.803 1.511 1.988 1.051 0.298 0.125 0.098 0.111 0.352 1.109 1.487
DU03 0.360 0.311 0.569 0.849 0.442 0.128 0.055 0.044 0.050 0.148 0.454 0.615
DU04 0.242 0.215 0.407 0.659 0.314 0.094 0.046 0.041 0.046 0.116 0.303 0.393
DU05 0.242 0.219 0.441 0.584 0.288 0.087 0.045 0.042 0.047 0.121 0.319 0.397
DU06 0.144 0.154 0.287 0.318 0.156 0.039 0.013 0.009 0.008 0.036 0.121 0.206
Carruthers CA01 0.111 0.087 0.150 0.158 0.107 0.026 0.009 0.004 0.003 0.034 0.140 0.198
Lake Ontario
LO01 0.061 0.068 0.096 0.082 0.067 0.022 0.008 0.005 0.008 0.017 0.038 0.067
LO04 0.061 0.053 0.087 0.070 0.048 0.012 0.004 0.002 0.002 0.023 0.064 0.089
LO03 0.065 0.076 0.121 0.087 0.060 0.016 0.006 0.002 0.003 0.012 0.024 0.055
LO02 0.181 0.191 0.252 0.164 0.119 0.033 0.015 0.010 0.013 0.053 0.118 0.170
LO05 0.013 0.012 0.020 0.019 0.014 0.004 0.001 0.001 0.001 0.006 0.017 0.023
LO06 0.010 0.007 0.012 0.011 0.008 0.003 0.001 0.001 0.001 0.006 0.016 0.018
Table C-5: surface Water demand summary by subwatershed
Watershed Catchment Jan Feb Mar Apr May Jun Jul Aug Sep Oct Nov Dec
Etobicoke
ET01 0.0000 0.0000 0.0000 0.0000 0.0000 0.0115 0.0112 0.0112 0.0115 0.0000 0.0000 0.0000
ET02 - - - - - - - - - - - -
ET03 - - - - - - - - - - - -
ET04 0.0000 0.0000 0.0000 0.0000 0.0000 0.0358 0.0347 0.0347 0.0358 0.0000 0.0000 0.0000
Mimico
MI01 0.0000 0.0000 0.0000 0.0000 0.0000 0.0076 0.0073 0.0073 0.0076 0.0000 0.0000 0.0000
MI02 - - - - - - - - - - - -
MI03 0.0000 0.0000 0.0000 0.0000 0.0000 0.0268 0.0259 0.0259 0.0268 0.0000 0.0000 0.0000

Approved January 18, 2012 C2-10
Approved Assessment Report: Toronto and Region Source Protection Area
Watershed Catchment Jan Feb Mar Apr May Jun Jul Aug Sep Oct Nov Dec
Humber
HU01 0.0001 0.0001 0.0001 0.0001 0.0001 0.0130 0.0433 0.0433 0.0130 0.0001 0.0001 0.0001
HU02 0.0000 0.0000 0.0000 0.0000 0.0000 0.0053 0.0052 0.0052 0.0053 0.0000 0.0000 0.0000
HU03 0.0001 0.0001 0.0001 0.0001 0.0001 0.0029 0.0041 0.0041 0.0029 0.0001 0.0001 0.0001
HU04 0.0000 0.0000 0.0000 0.0000 0.0000 0.0000 0.0052 0.0052 0.0000 0.0000 0.0000 0.0000
HU05 0.0001 0.0001 0.0001 0.0001 0.0001 0.0137 0.0175 0.0175 0.0137 0.0001 0.0001 0.0001
HU06 0.0002 0.0002 0.0002 0.0002 0.0002 0.0100 0.0123 0.0123 0.0100 0.0002 0.0002 0.0002
HU07 0.0001 0.0001 0.0001 0.0001 0.0001 0.0001 0.0024 0.0024 0.0001 0.0001 0.0001 0.0001
HU08 - - - - - - - - - - - -
HU09 0.0001 0.0001 0.0001 0.0001 0.0001 0.0001 0.0001 0.0001 0.0001 0.0001 0.0001 0.0001
HU10 0.0000 0.0000 0.0000 0.0000 0.0000 0.0083 0.0134 0.0134 0.0083 0.0000 0.0000 0.0000
HU11 0.0000 0.0000 0.0000 0.0000 0.0000 0.0000 0.0000 0.0000 0.0000 0.0000 0.0000 0.0000
HU12 0.0001 0.0001 0.0001 0.0001 0.0001 0.0001 0.0001 0.0001 0.0001 0.0001 0.0001 0.0001
Don
DO01 - - - - - - - - - - - -
DO02 - - - - - - - - - - - -
DO03 0.0000 0.0000 0.0000 0.0000 0.0000 0.0102 0.0099 0.0099 0.0102 0.0000 0.0000 0.0000
DO04 0.0000 0.0000 0.0000 0.0000 0.0000 0.0020 0.0020 0.0020 0.0020 0.0000 0.0000 0.0000
DO05 0.0031 0.0035 0.0031 0.0032 0.0031 0.0053 0.0051 0.0051 0.0053 0.0031 0.0032 0.0031
DO06 0.0002 0.0002 0.0002 0.0002 0.0002 0.0051 0.0049 0.0049 0.0051 0.0002 0.0002 0.0002
DO07 0.0006 0.0007 0.0006 0.0006 0.0006 0.0006 0.0006 0.0006 0.0006 0.0006 0.0006 0.0006
Highland
HI01 - - - - - - - - - - - -
HI02 - - - - - - - - - - - -
HI03 0.0000 0.0000 0.0000 0.0000 0.0000 0.0049 0.0047 0.0047 0.0049 0.0000 0.0000 0.0000
HI04 - - - - - - - - - - - -
Rouge
RO01 - - - - - - - - - - - -
RO02 0.0007 0.0008 0.0007 0.0008 0.0007 0.0114 0.0127 0.0127 0.0114 0.0007 0.0008 0.0007
RO03 0.0002 0.0002 0.0002 0.0002 0.0002 0.0158 0.0153 0.0153 0.0158 0.0002 0.0002 0.0002
RO04 0.0001 0.0001 0.0001 0.0001 0.0001 0.0004 0.0010 0.0010 0.0004 0.0001 0.0001 0.0001
RO05 0.0001 0.0001 0.0001 0.0001 0.0001 0.0026 0.0031 0.0031 0.0026 0.0001 0.0001 0.0001
RO06 0.0003 0.0004 0.0003 0.0003 0.0003 0.0003 0.0013 0.0013 0.0003 0.0003 0.0003 0.0003
RO07 0.0009 0.0009 0.0009 0.0009 0.0009 0.0049 0.0059 0.0059 0.0049 0.0009 0.0009 0.0009
Petticoat PE01 - - - - - - - - - - - -
F. Bay FR01 - - - - - - - - - - - -

Approved January 18, 2012C2-11
Appendix C: Conceptual Water Budget
Watershed Catchment Jan Feb Mar Apr May Jun Jul Aug Sep Oct Nov Dec
Duffins
DU01 0.0000 0.0000 0.0000 0.0000 0.0000 0.0037 0.0036 0.0036 0.0037 0.0000 0.0000 0.0000
DU02 0.0000 0.0000 0.0000 0.0000 0.0000 0.0078 0.0076 0.0076 0.0078 0.0000 0.0000 0.0000
DU03 0.0000 0.0000 0.0000 0.0000 0.0000 0.0031 0.0030 0.0030 0.0031 0.0000 0.0000 0.0000
DU04 0.0000 0.0000 0.0000 0.0000 0.0000 0.0035 0.0034 0.0034 0.0035 0.0000 0.0000 0.0000
DU05 0.0001 0.0001 0.0001 0.0001 0.0001 0.0001 0.0001 0.0001 0.0001 0.0001 0.0001 0.0001
DU06 0.0001 0.0001 0.0001 0.0001 0.0001 0.0130 0.0172 0.0172 0.0130 0.0001 0.0001 0.0001
Carruthers CA01 0.0000 0.0000 0.0000 0.0000 0.0000 0.0061 0.0059 0.0059 0.0061 0.0000 0.0000 0.0000
Lake Ontario
LO01 - - - - - - - - - - - -
LO04 - - - - - - - - - - - -
LO03 - - - - - - - - - - - -
LO02 - - - - - - - - - - - -
LO05 - - - - - - - - - - - -
LO06 - - - - - - - - - - - -
Table C-6: surface Water stress assessment results summary
Watershed Catchment Jan Feb Mar Apr May Jun Jul Aug Sep Oct Nov Dec
Etobicoke
ET01 0% 0% 0% 0% 0% 5% 18% 29% 16% 0% 0% 0%
ET02 0% 0% 0% 0% 0% 0% 0% 0% 0% 0% 0% 0%
ET03 0% 0% 0% 0% 0% 0% 0% 0% 0% 0% 0% 0%
ET04 0% 0% 0% 0% 0% 30% 120% 333% 127% 0% 0% 0%
Mimico
MI01 0% 0% 0% 0% 0% 9% 33% 37% 31% 0% 0% 0%
MI02 0% 0% 0% 0% 0% 0% 0% 0% 0% 0% 0% 0%
MI03 0% 0% 0% 0% 0% 81% 257% 360% 294% 0% 0% 0%

Approved January 18, 2012 C2-12
Approved Assessment Report: Toronto and Region Source Protection Area
Watershed Catchment Jan Feb Mar Apr May Jun Jul Aug Sep Oct Nov Dec
Humber
HU01 0% 0% 0% 0% 0% 1% 10% 21% 3% 0% 0% 0%
HU02 0% 0% 0% 0% 0% 8% 21% 37% 10% 0% 0% 0%
HU03 0% 0% 0% 0% 0% 2% 8% 40% 19% 0% 0% 0%
HU04 0% 0% 0% 0% 0% 0% 23% 129% 0% 0% 0% 0%
HU05 0% 0% 0% 0% 0% 3% 9% 22% 10% 0% 0% 0%
HU06 0% 0% 0% 0% 0% 5% 9% 16% 7% 0% 0% 0%
HU07 0% 0% 0% 0% 0% 0% 2% 4% 0% 0% 0% 0%
HU08 0% 0% 0% 0% 0% 0% 0% 0% 0% 0% 0% 0%
HU09 0% 0% 0% 0% 0% 0% 0% 1% 0% 0% 0% 0%
HU10 0% 0% 0% 0% 0% 3% 12% 23% 8% 0% 0% 0%
HU11 0% 0% 0% 0% 0% 0% 0% 0% 0% 0% 0% 0%
HU12 0% 0% 0% 0% 0% 0% 0% 0% 0% 0% 0% 0%
Don
DO01 0% 0% 0% 0% 0% 0% 0% 0% 0% 0% 0% 0%
DO02 0% 0% 0% 0% 0% 0% 0% 0% 0% 0% 0% 0%
DO03 0% 0% 0% 0% 0% 5% 9% 10% 6% 0% 0% 0%
DO04 0% 0% 0% 0% 0% 2% 4% 7% 2% 0% 0% 0%
DO05 2% 3% 1% 1% 2% 8% 22% 32% 15% 5% 1% 2%
DO06 0% 0% 0% 0% 0% 6% 6% 8% 7% 0% 0% 0%
DO07 1% 1% 0% 0% 1% 1% 3% 4% 2% 1% 0% 0%
Highland
HI01 0% 0% 0% 0% 0% 0% 0% 0% 0% 0% 0% 0%
HI02 0% 0% 0% 0% 0% 0% 0% 0% 0% 0% 0% 0%
HI03 0% 0% 0% 0% 0% 10% 25% 44% 8% 0% 0% 0%
HI04 0% 0% 0% 0% 0% 0% 0% 0% 0% 0% 0% 0%
Rouge
RO01 0% 0% 0% 0% 0% 0% 0% 0% 0% 0% 0% 0%
RO02 0% 0% 0% 0% 0% 10% 44% 119% 24% 0% 0% 0%
RO03 0% 0% 0% 0% 0% 6% 15% 21% 10% 0% 0% 0%
RO04 0% 0% 0% 0% 0% 0% 1% 2% 0% 0% 0% 0%
RO05 0% 0% 0% 0% 0% 5% 7% 9% 6% 0% 0% 0%
RO06 0% 1% 0% 0% 0% 1% 15% 38% 3% 1% 0% 0%
RO07 1% 1% 1% 0% 1% 10% 29% 55% 17% 1% 1% 1%
Petticoat PE01 0% 0% 0% 0% 0% 0% 0% 0% 0% 0% 0% 0%
F. Bay FR01 0% 0% 0% 0% 0% 0% 0% 0% 0% 0% 0% 0%
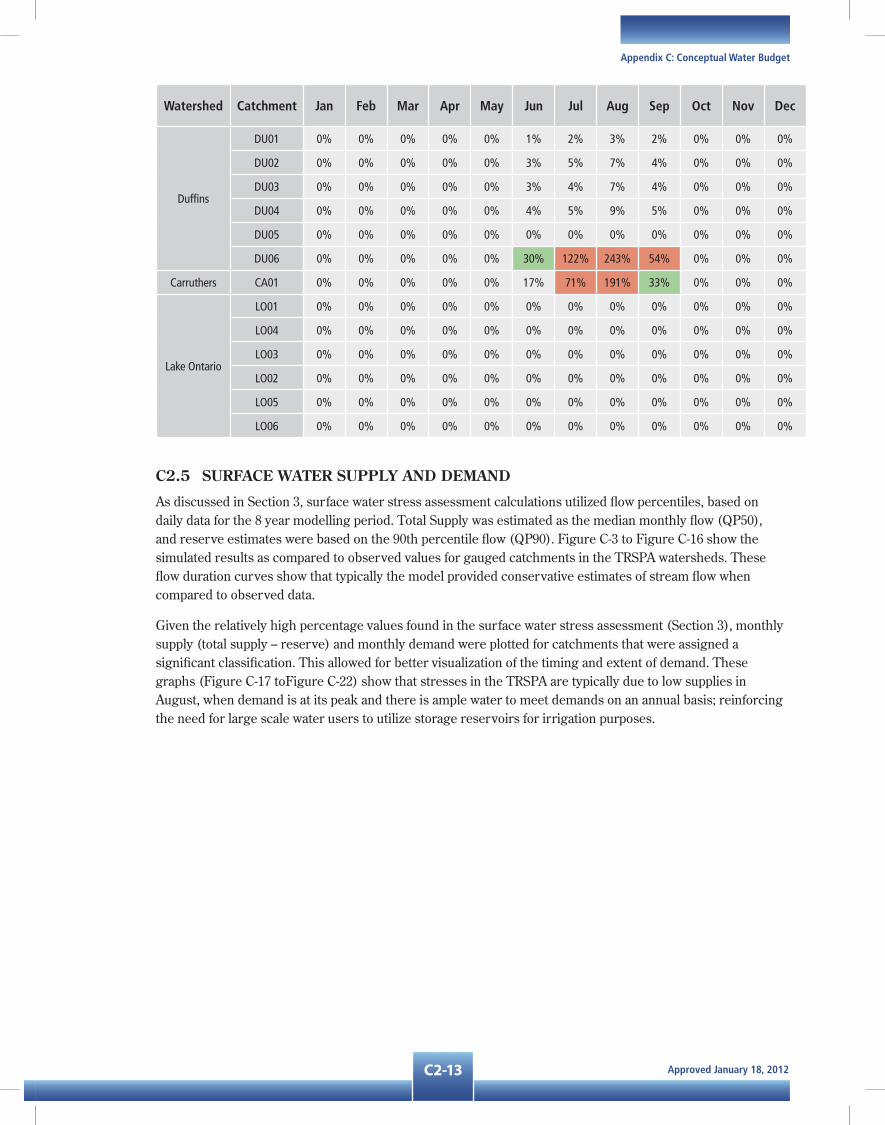
Approved January 18, 2012C2-13
Appendix C: Conceptual Water Budget
Watershed Catchment Jan Feb Mar Apr May Jun Jul Aug Sep Oct Nov Dec
Duffins
DU01 0% 0% 0% 0% 0% 1% 2% 3% 2% 0% 0% 0%
DU02 0% 0% 0% 0% 0% 3% 5% 7% 4% 0% 0% 0%
DU03 0% 0% 0% 0% 0% 3% 4% 7% 4% 0% 0% 0%
DU04 0% 0% 0% 0% 0% 4% 5% 9% 5% 0% 0% 0%
DU05 0% 0% 0% 0% 0% 0% 0% 0% 0% 0% 0% 0%
DU06 0% 0% 0% 0% 0% 30% 122% 243% 54% 0% 0% 0%
Carruthers CA01 0% 0% 0% 0% 0% 17% 71% 191% 33% 0% 0% 0%
Lake Ontario
LO01 0% 0% 0% 0% 0% 0% 0% 0% 0% 0% 0% 0%
LO04 0% 0% 0% 0% 0% 0% 0% 0% 0% 0% 0% 0%
LO03 0% 0% 0% 0% 0% 0% 0% 0% 0% 0% 0% 0%
LO02 0% 0% 0% 0% 0% 0% 0% 0% 0% 0% 0% 0%
LO05 0% 0% 0% 0% 0% 0% 0% 0% 0% 0% 0% 0%
LO06 0% 0% 0% 0% 0% 0% 0% 0% 0% 0% 0% 0%
C2.5 surfaCe WaTer supply and deMand
As discussed in Section 3, surface water stress assessment calculations utilized flow percentiles, based on daily data for the 8 year modelling period. Total Supply was estimated as the median monthly flow (QP50), and reserve estimates were based on the 90th percentile flow (QP90). Figure C-3 to Figure C-16 show the simulated results as compared to observed values for gauged catchments in the TRSPA watersheds. These flow duration curves show that typically the model provided conservative estimates of stream flow when compared to observed data.
Given the relatively high percentage values found in the surface water stress assessment (Section 3), monthly supply (total supply – reserve) and monthly demand were plotted for catchments that were assigned a significant classification. This allowed for better visualization of the timing and extent of demand. These graphs (Figure C-17 toFigure C-22) show that stresses in the TRSPA are typically due to low supplies in August,whendemandisatitspeakandthereisamplewatertomeetdemandsonanannualbasis;reinforcingthe need for large scale water users to utilize storage reservoirs for irrigation purposes.

Approved January 18, 2012 C2-14
Approved Assessment Report: Toronto and Region Source Protection Area
figure C-3: flow duration Curve for black Creek near Weston rd.
figure C-4: flow duration Curve for don river at Todmorden

Approved January 18, 2012C2-15
Appendix C: Conceptual Water Budget
figure C-5: flow duration Curve for don river at york Mills
figure C-6: flow duration Curve for duffins Cr. above pickering

Approved January 18, 2012 C2-16
Approved Assessment Report: Toronto and Region Source Protection Area
figure C-7: flow duration Curve for duffins Cr. at ajax
figure C-8: flow duration Curve for humber river at Weston rd.

Approved January 18, 2012C2-17
Appendix C: Conceptual Water Budget
figure C-9: flow duration Curve for little rouge Creek near locust hill
figure C-10: flow duration Curve etobicoke Creek below Q.e.W.

Approved January 18, 2012 C2-18
Approved Assessment Report: Toronto and Region Source Protection Area
figure C-11: flow duration Curve for highland Creek near West hill.
figure C-12: flow duration Curve for humber river at elder Mills
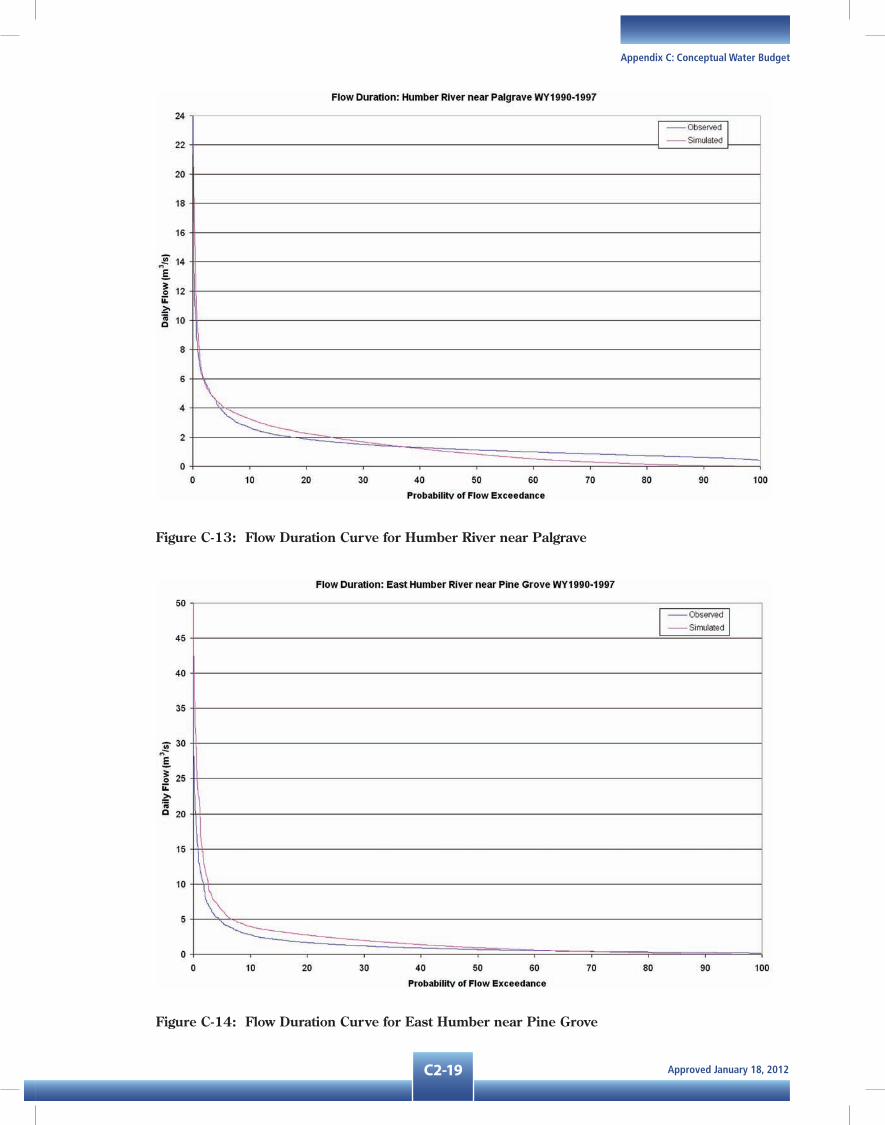
Approved January 18, 2012C2-19
Appendix C: Conceptual Water Budget
figure C-13: flow duration Curve for humber river near palgrave
figure C-14: flow duration Curve for east humber near pine grove

Approved January 18, 2012 C2-20
Approved Assessment Report: Toronto and Region Source Protection Area
figure C-15: flow duration Curve for Mimico Cr. at islington
figure C-16: flow duration Curve for West humber at highway 7.
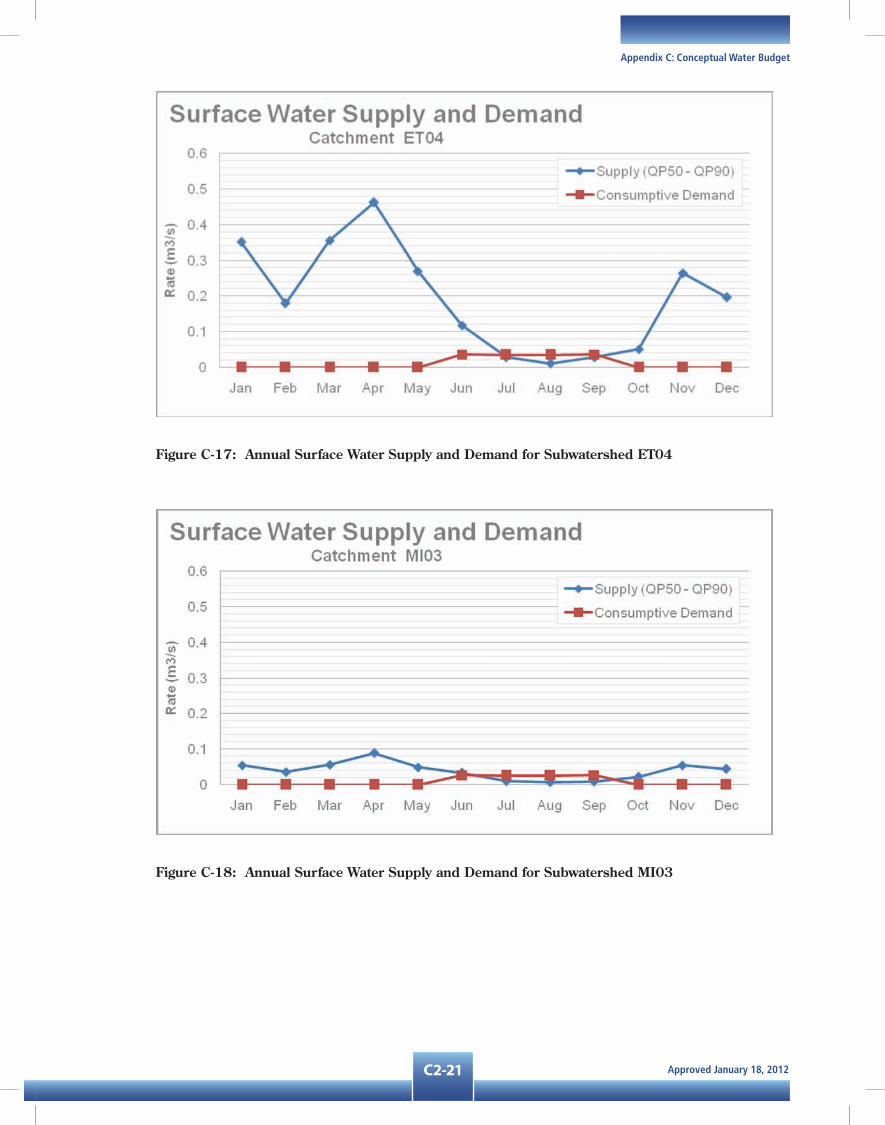
Approved January 18, 2012C2-21
Appendix C: Conceptual Water Budget
figure C-17: annual surface Water supply and demand for subwatershed eT04
figure C-18: annual surface Water supply and demand for subwatershed Mi03

Approved January 18, 2012 C2-22
Approved Assessment Report: Toronto and Region Source Protection Area
figure C-19: annual surface Water supply and demand for subwatershed ro07
figure C-20: annual surface Water supply and demand for subwatershed hu04

Approved January 18, 2012C2-23
Appendix C: Conceptual Water Budget
figure C-21: annual surface Water supply and demand for subwatershed Ca01
figure C-22: annual surface Water supply and demand for subwatershed ro02

Approved January 18, 2012 C2-24
Approved Assessment Report: Toronto and Region Source Protection Area
C2.6 assessment of required storage
Additional analysis was performed on the >100% catchments, to determine the cause of these results, where irrigation storage ponds / reservoirs were examined. This analysis was to investigate if these storage features had sufficient storage to account for the demand of water that is over and above the estimated in-stream supply. While it was not possible, in the scope of a Tier 1 Assessment, to complete this analysis for all surface water users, it was felt that a representative sample should be explored in more detail to validate catchments where demand is greater than available supply.
In this evaluation, the total demand was subtracted from the available supply for each month. Where the supply is less than the demand, a negative number is the result. These are then summed and converted to a total volume (m3), which represents the total water required to meet a specific user’s demand over and above available in-stream supply. This volume is then calculated to a ‘required depth of storage’, based on the surface area of the storage feature. If the required depth of storage was calculated to be more than 2.5m (based on typical golf course pond depths) there may be an error in the demand or supply estimates.
This analysis was performed for catchments CA01 and HU04 as both of these catchments were calculated as having demand >100% of supply, and both catchments had only one (primary) surface water user. Table C-7 and Table C-8 show the results of these calculations. In both instances, the required depth of storage was low, at 16cm and 14cm respectively. These results confirm that any demand greater than available supply can be accounted for by the storage feature(s).
Table C-7: required depth of storage Calculations – Catchment Ca01
CA01
Month Demand Supply Supply - Demand m3 / Month
Jan 0 0.123 0.123 0
Feb 0 0.067 0.067 0
Mar 0 0.117 0.117 0
Apr 0 0.155 0.155 0
May 0 0.078 0.078 0
Jun 0.006 0.035 0.029 0
Jul 0.006 0.008 0.002 0
Aug 0.006 0.003 -0.003 7290
Sep 0.006 0.018 0.012 0
Oct 0 0.077 0.077 0
Nov 0 0.138 0.138 0
Dec 0 0.120 0.120 0
Total Storage Required (m3) 7,290
Required Storage Depth for CA01Pond Area: 45,308m2
Required Storage: 7,290 m3Required Depth of Storage: 0.16m

Approved January 18, 2012C2-25
Appendix C: Conceptual Water Budget
Table C-8: required depth of storage Calculations – Catchment hu04
HU04
Month Demand Supply Supply - Demand m3 / Month
Jan 0 0.230 0.230 0
Feb 0 0.192 0.192 0
Mar 0 0.265 0.265 0
Apr 0 0.461 0.461 0
May 0 0.232 0.232 0
Jun 0 0.085 0.085 0
Jul 0.005 0.022 0.017 0
Aug 0.005 0.004 -0.001 3036
Sep 0 0.005 0.005 0
Oct 0 0.030 0.030 0
Nov 0 0.194 0.194 0
Dec 0 0.194 0.194 0
Total Storage Required (m3): 3,036
Required Storage Depth for HU04Pond Area: 22,415m2
Required Storage: 3,036 m3Required Depth of Storage: 0.14m
C2.7 groundWaTer sTress assessMenT
C2.7.1 Calculations
The groundwater stress assessment calculations are summarized in TableC-9 to Table C-14 and the groundwater usage data are provided in Table C-15. The current and future water use by subwatershed are provided in Table C-16 and Table C-17, respectively. The complete stress assessment results by month for current conditions are provided in Table C-18 to Table C-29. The stress assessment results under future conditions are provided by month in Table C-30 to Table C-44
Further details are provided in the Tier 1 Water Budget report issued for the TRSPA in 2010 (TRCA, 2010).
C2.7.2 inputs to stress assessment Calculations
The inputs from the MODFLOW groundwater model to the groundwater stress assessment calculations include estimates of
•Groundwaterrecharge(QRinstressassessmenttables),

Approved January 18, 2012 C2-26
Approved Assessment Report: Toronto and Region Source Protection Area
•Groundwaterdischarge(QReserveinstressassessmenttables);and,
•Groundwaterinflowstoeachsubwatershed(QINinstressassessmenttables).
Groundwater Inflows
Groundwater inflows for each subwatershed are represented as the QIN values in the stress assessment tables.
C2.8 sTress assessMenT suMMary
This study meets all of the Tier 1 requirements for all of the TRSPA. It includes an enhanced understanding of water use because of TRCA’s water use field survey, and enhanced stress calculations because of the complex surface and groundwater models used in the analysis. MNR has agreed that this assessment meets the main requirements of a Tier 2 Assessment for Whitchurch-Stouffville Area. Although a 2-year drought simulation for the Whitchurch-Stouffville area was not completed, the results of this scenario would only increase the calculated stress levels provided in this study. The final maps are presented in Chapter 3 of the body of this Assessment Report.
Based on this Tier 2 analysis, the Whitchurch-Stouffville area, which includes portions of two subwatersheds (Little Rouge Creek and Stouffville/Ressor Creeks) is recommended for further assessment at the Tier 3 level. This area contains the wellheads for the Whitchurch-Stouffville municipal groundwater supply wells. Although the 2-year drought simulation was not completed for these subwatersheds, the calculated stress levels for these watersheds are above thresholds for the current conditions. Therefore, with the agreement of the MNR, a Tier 3 or local area stress assessment should be completed in this area. The Tier 3 analysis will be led by the Region of York in partnership with TRCA and the Region of Durham. The project will examine cross-watershed groundwater flow and local recharge in more detail, as well as water use and ten-year drought scenarios.
Table C-9: groundwater stress assessment summary (Current)
WatershedSub-
watershed
Stress LevelUncertainty
Municipal Water Supply
Tier 3 Study RequiredAnnual Monthly Final
Etobicoke
ET01 Low Low Low Low No No
ET02 Low Low Low Low No No
ET03 Low Low Low Low No No
ET04 Low Low Low Low No No
Mimico
MI01 Low Low Low Low No No
MI02 Low Low Low Low No No
MI03 Low Low Low Low No No

Approved January 18, 2012C2-27
Appendix C: Conceptual Water Budget
WatershedSub-
watershed
Stress LevelUncertainty
Municipal Water Supply
Tier 3 Study RequiredAnnual Monthly Final
Humber
HU01 Low Low Low Low No No
HU02 Low Low Low Low No No
HU03 Low Low Low Low No No
HU04 Low Low Low Low No No
HU05 Low Low Low Low Yes No
HU06 Low Low Low Low Yes No
HU07 Low Low Low Low Yes No
HU08 Low Low Low Low Yes No
HU09 Low Low Low Low No No
HU10 Low Low Low Low Yes No
HU11 Low Low Low Low Yes No
HU12 Low Low Low Low Yes No
Don
DO01 Low Low Low Low No No
DO02 Low Low Low Low No No
DO03 Low Low Low Low No No
DO04 Low Low Low Low No No
DO05 Low Low Low Low No No
DO06 Moderate Low Moderate Low No No
DO07 Low Low Low Low No No
Highland
HI01 Low Low Low Low No No
HI02 Low Low Low Low No No
HI03 Low Low Low Low No No
HI04 Low Low Low Low No No
Rouge
RO01 Low Low Low Low No No
RO02 Moderate Low Moderate Low Yes Yes
RO03 Low Low Low Low No No
RO04 Low Low Low Low No No
RO05 Low Low Low Low No No
RO06 Low Low Low Low No No
RO07 Low Low Low Low No No
Petticoat PE01 Low Low Low Low No No
Frenchman's Bay
FR01 Low Low Low Low No No

Approved January 18, 2012 C2-28
Approved Assessment Report: Toronto and Region Source Protection Area
WatershedSub-
watershed
Stress LevelUncertainty
Municipal Water Supply
Tier 3 Study RequiredAnnual Monthly Final
Duffins
DU01 Low Low Low Low No No
DU02 Low Low Low Low No No
DU03 Low Low Low Low No No
DU04 Low Low Low Low No No
DU05 Low Low Low Low No No
DU06 Moderate Low Moderate Low Yes Yes
Carruthers CA01 Low Low Low Low No No
Lake Ontario
LO01 Significant Significant Significant Low No No
LO02 Moderate Low Moderate Low No No
LO03 Moderate Low Moderate Low No No
LO04 Low Low Low Low No No
LO05 Low Low Low Low No No
LO06 Low Low Low Low No No
Table C-10: groundwater stress assessment summary (future)
WatershedSub-
watershed
Stress LevelUncertainty
Municipal Water Supply
Tier 3 Refinement
RequiredAnnual Monthly Final
Etobicoke
ET01 Low Low Low Low No No
ET02 Low Low Low Low No No
ET03 Low Low Low Low No No
ET04 Low Low Low Low No No
Mimico
MI01 Low Low Low Low No No
MI02 Low Low Low Low No No
MI03 Low Low Low Low No No

Approved January 18, 2012C2-29
Appendix C: Conceptual Water Budget
WatershedSub-
watershed
Stress LevelUncertainty
Municipal Water Supply
Tier 3 Refinement
RequiredAnnual Monthly Final
Humber
HU01 Low Low Low Low No No
HU02 Low Low Low Low No No
HU03 Low Low Low Low No No
HU04 Low Low Low Low No No
HU05 Low Low Low Low Yes No
HU06 Low Low Low Low Yes No
HU07 Low Low Low Low Yes No
HU08 Low Low Low Low Yes No
HU09 Low Low Low Low No No
HU10 Low Low Low Low Yes No
HU11 Low Low Low Low Yes No
HU12 Low Low Low Low Yes No
Don
DO01 Low Low Low Low No No
DO02 Low Low Low Low No No
DO03 Low Low Low Low No No
DO04 Low Low Low Low No No
DO05 Low Low Low Low No No
DO06 Moderate Low Moderate Low No No
DO07 Low Low Low Low No No
Highland
HI01 Low Low Low Low No No
HI02 Low Low Low Low No No
HI03 Low Low Low Low No No
HI04 Low Low Low Low No No
Rouge
RO01 Low Low Low Low No No
RO02 Moderate Low Moderate Low Yes Yes
RO03 Low Low Low Low No No
RO04 Low Low Low Low No No
RO05 Low Low Low Low No No
RO06 Low Low Low Low No No
RO07 Low Low Low Low No No
Petticoat PE01 Low Low Low Low No No
Frenchman's Bay
FR01 Low Low Low Low No No
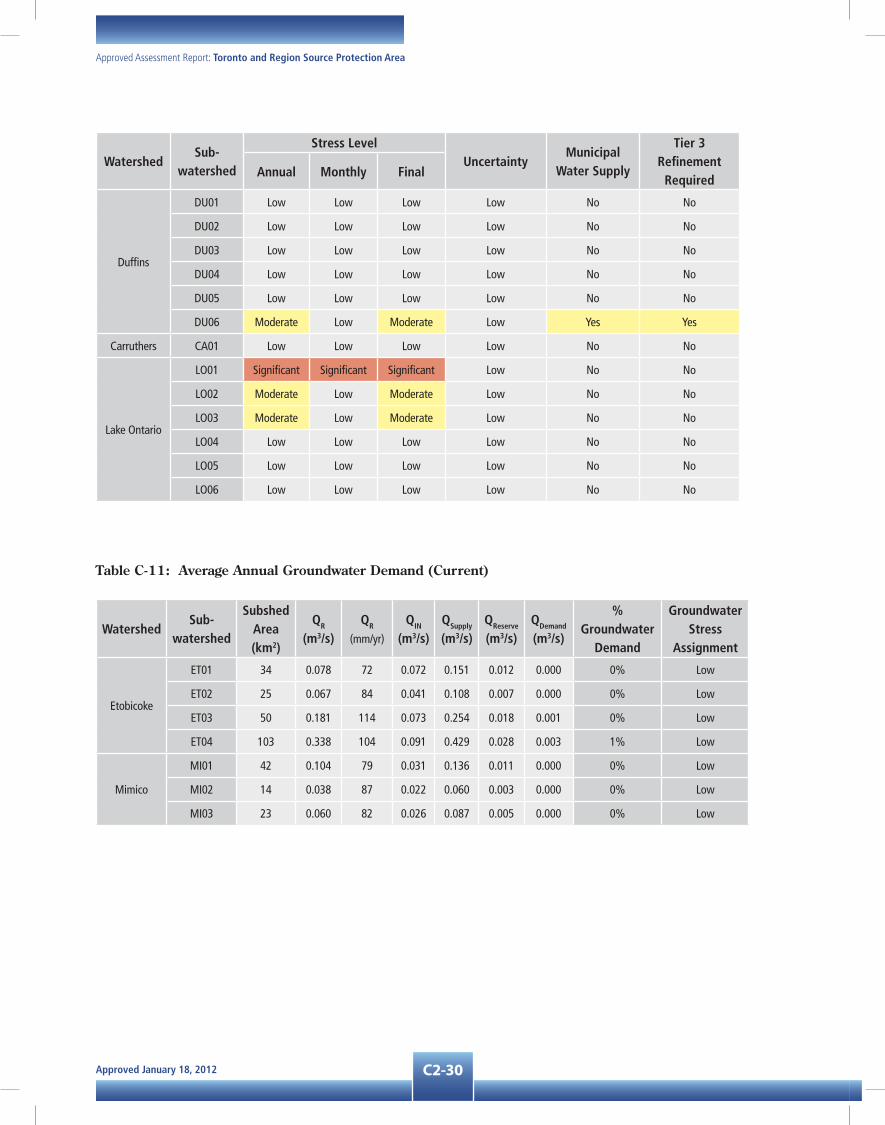
Approved January 18, 2012 C2-30
Approved Assessment Report: Toronto and Region Source Protection Area
WatershedSub-
watershed
Stress LevelUncertainty
Municipal Water Supply
Tier 3 Refinement
RequiredAnnual Monthly Final
Duffins
DU01 Low Low Low Low No No
DU02 Low Low Low Low No No
DU03 Low Low Low Low No No
DU04 Low Low Low Low No No
DU05 Low Low Low Low No No
DU06 Moderate Low Moderate Low Yes Yes
Carruthers CA01 Low Low Low Low No No
Lake Ontario
LO01 Significant Significant Significant Low No No
LO02 Moderate Low Moderate Low No No
LO03 Moderate Low Moderate Low No No
LO04 Low Low Low Low No No
LO05 Low Low Low Low No No
LO06 Low Low Low Low No No
Table C-11: average annual groundwater demand (Current)
WatershedSub-
watershed
Subshed Area (km2)
QR (m3/s)
QR (mm/yr)
QIN (m3/s)
QSupply (m3/s)
QReserve (m3/s)
QDemand
(m3/s)
% Groundwater
Demand
Groundwater Stress
Assignment
Etobicoke
ET01 34 0.078 72 0.072 0.151 0.012 0.000 0% Low
ET02 25 0.067 84 0.041 0.108 0.007 0.000 0% Low
ET03 50 0.181 114 0.073 0.254 0.018 0.001 0% Low
ET04 103 0.338 104 0.091 0.429 0.028 0.003 1% Low
Mimico
MI01 42 0.104 79 0.031 0.136 0.011 0.000 0% Low
MI02 14 0.038 87 0.022 0.060 0.003 0.000 0% Low
MI03 23 0.060 82 0.026 0.087 0.005 0.000 0% Low
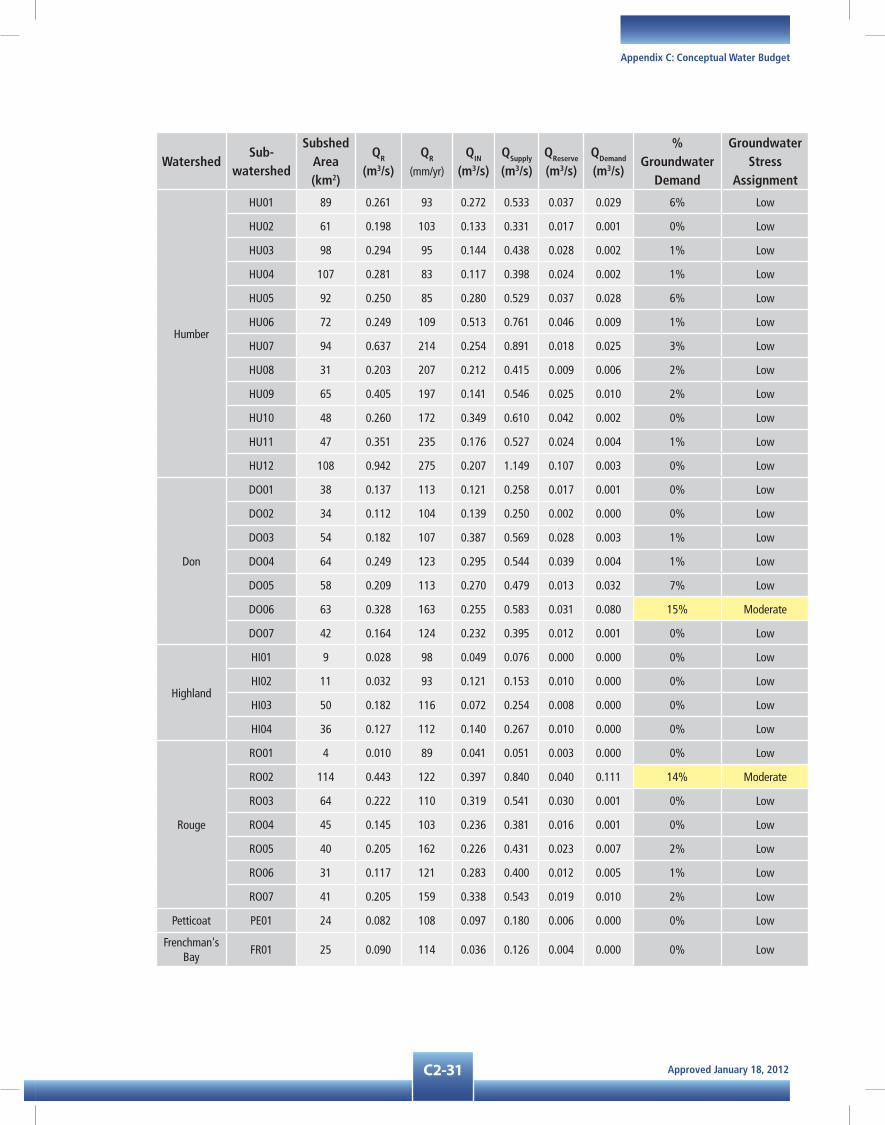
Approved January 18, 2012C2-31
Appendix C: Conceptual Water Budget
WatershedSub-
watershed
Subshed Area (km2)
QR (m3/s)
QR (mm/yr)
QIN (m3/s)
QSupply (m3/s)
QReserve (m3/s)
QDemand
(m3/s)
% Groundwater
Demand
Groundwater Stress
Assignment
Humber
HU01 89 0.261 93 0.272 0.533 0.037 0.029 6% Low
HU02 61 0.198 103 0.133 0.331 0.017 0.001 0% Low
HU03 98 0.294 95 0.144 0.438 0.028 0.002 1% Low
HU04 107 0.281 83 0.117 0.398 0.024 0.002 1% Low
HU05 92 0.250 85 0.280 0.529 0.037 0.028 6% Low
HU06 72 0.249 109 0.513 0.761 0.046 0.009 1% Low
HU07 94 0.637 214 0.254 0.891 0.018 0.025 3% Low
HU08 31 0.203 207 0.212 0.415 0.009 0.006 2% Low
HU09 65 0.405 197 0.141 0.546 0.025 0.010 2% Low
HU10 48 0.260 172 0.349 0.610 0.042 0.002 0% Low
HU11 47 0.351 235 0.176 0.527 0.024 0.004 1% Low
HU12 108 0.942 275 0.207 1.149 0.107 0.003 0% Low
Don
DO01 38 0.137 113 0.121 0.258 0.017 0.001 0% Low
DO02 34 0.112 104 0.139 0.250 0.002 0.000 0% Low
DO03 54 0.182 107 0.387 0.569 0.028 0.003 1% Low
DO04 64 0.249 123 0.295 0.544 0.039 0.004 1% Low
DO05 58 0.209 113 0.270 0.479 0.013 0.032 7% Low
DO06 63 0.328 163 0.255 0.583 0.031 0.080 15% Moderate
DO07 42 0.164 124 0.232 0.395 0.012 0.001 0% Low
Highland
HI01 9 0.028 98 0.049 0.076 0.000 0.000 0% Low
HI02 11 0.032 93 0.121 0.153 0.010 0.000 0% Low
HI03 50 0.182 116 0.072 0.254 0.008 0.000 0% Low
HI04 36 0.127 112 0.140 0.267 0.010 0.000 0% Low
Rouge
RO01 4 0.010 89 0.041 0.051 0.003 0.000 0% Low
RO02 114 0.443 122 0.397 0.840 0.040 0.111 14% Moderate
RO03 64 0.222 110 0.319 0.541 0.030 0.001 0% Low
RO04 45 0.145 103 0.236 0.381 0.016 0.001 0% Low
RO05 40 0.205 162 0.226 0.431 0.023 0.007 2% Low
RO06 31 0.117 121 0.283 0.400 0.012 0.005 1% Low
RO07 41 0.205 159 0.338 0.543 0.019 0.010 2% Low
Petticoat PE01 24 0.082 108 0.097 0.180 0.006 0.000 0% Low
Frenchman's Bay
FR01 25 0.090 114 0.036 0.126 0.004 0.000 0% Low

Approved January 18, 2012 C2-32
Approved Assessment Report: Toronto and Region Source Protection Area
WatershedSub-
watershed
Subshed Area (km2)
QR (m3/s)
QR (mm/yr)
QIN (m3/s)
QSupply (m3/s)
QReserve (m3/s)
QDemand
(m3/s)
% Groundwater
Demand
Groundwater Stress
Assignment
Duffins
DU01 24 0.087 112 0.037 0.123 0.005 0.000 0% Low
DU02 53 0.190 113 0.284 0.474 0.026 0.020 4% Low
DU03 44 0.150 108 0.317 0.467 0.031 0.005 1% Low
DU04 63 0.362 183 0.355 0.717 0.044 0.018 3% Low
DU05 60 0.370 194 0.268 0.638 0.022 0.022 4% Low
DU06 40 0.192 154 0.160 0.353 0.010 0.045 13% Moderate
Carruthers CA01 39 0.131 106 0.109 0.240 0.016 0.004 2% Low
Lake Ontario
LO01 24 0.064 84 0.009 0.073 0.000 0.046 63% Significant
LO02 40 0.159 126 0.030 0.189 0.000 0.022 11% Moderate
LO03 24 0.062 82 0.082 0.143 0.000 0.024 16% Moderate
LO04 16 0.052 101 0.075 0.127 0.000 0.000 0% Low
LO05 5 0.017 108 0.011 0.027 0.000 0.000 0% Low
LO06 3 0.012 117 0.009 0.021 0.000 0.000 0% Low
Table C-12: average annual groundwater demand (future)
WatershedSub-
watershed
Subshed Area (km2)
QR (m3/s)
QR (mm/yr)
QIN (m3/s)
QSupply (m3/s)
QReserve (m3/s)
QDemand
(m3/s)
% Groundwater
Demand
Groundwater Stress
Assignment
Etobicoke
ET01 34 0.078 72 0.072 0.151 0.012 0.000 0.0% Low
ET02 25 0.067 84 0.041 0.108 0.007 0.000 0.0% Low
ET03 50 0.181 114 0.073 0.254 0.018 0.001 0.3% Low
ET04 103 0.338 104 0.091 0.429 0.028 0.003 0.7% Low
Mimico
MI01 42 0.104 79 0.031 0.136 0.011 0.000 0.0% Low
MI02 14 0.038 87 0.022 0.060 0.003 0.000 0.0% Low
MI03 23 0.060 82 0.026 0.087 0.005 0.000 0.0% Low

Approved January 18, 2012C2-33
Appendix C: Conceptual Water Budget
WatershedSub-
watershed
Subshed Area (km2)
QR (m3/s)
QR (mm/yr)
QIN (m3/s)
QSupply (m3/s)
QReserve (m3/s)
QDemand
(m3/s)
% Groundwater
Demand
Groundwater Stress
Assignment
Humber
HU01 89 0.261 93 0.272 0.533 0.037 0.029 5.8% Low
HU02 61 0.198 103 0.133 0.331 0.017 0.001 0.4% Low
HU03 98 0.294 95 0.144 0.438 0.028 0.002 0.6% Low
HU04 107 0.281 83 0.117 0.398 0.024 0.002 0.5% Low
HU05 92 0.250 85 0.280 0.529 0.037 0.011 2.2% Low
HU06 72 0.249 109 0.513 0.761 0.046 0.008 1.1% Low
HU07 94 0.637 214 0.254 0.891 0.018 0.009 1.0% Low
HU08 31 0.203 207 0.212 0.415 0.009 0.010 2.4% Low
HU09 65 0.405 197 0.141 0.546 0.025 0.010 2.0% Low
HU10 48 0.260 172 0.349 0.610 0.042 0.007 1.2% Low
HU11 47 0.351 235 0.176 0.527 0.024 0.008 1.6% Low
HU12 108 0.942 275 0.207 1.149 0.107 0.003 0.3% Low
Don
DO01 38 0.137 113 0.121 0.258 0.017 0.001 0.2% Low
DO02 34 0.112 104 0.139 0.250 0.002 0.000 0.0% Low
DO03 54 0.182 107 0.387 0.569 0.028 0.003 0.6% Low
DO04 64 0.249 123 0.295 0.544 0.039 0.004 0.7% Low
DO05 58 0.209 113 0.270 0.479 0.013 0.032 6.8% Low
DO06 63 0.328 163 0.255 0.583 0.031 0.080 14.5% Moderate
DO07 42 0.164 124 0.232 0.395 0.012 0.001 0.4% Low
Highland
HI01 9 0.028 98 0.049 0.076 0.000 0.000 0.0% Low
HI02 11 0.032 93 0.121 0.153 0.010 0.000 0.0% Low
HI03 50 0.182 116 0.072 0.254 0.008 0.000 0.0% Low
HI04 36 0.127 112 0.140 0.267 0.010 0.000 0.0% Low
Rouge
RO01 4 0.010 89 0.041 0.051 0.003 0.000 0.0% Low
RO02 114 0.443 122 0.397 0.840 0.040 0.114 14.3% Moderate
RO03 64 0.222 110 0.319 0.541 0.030 0.001 0.2% Low
RO04 45 0.145 103 0.236 0.381 0.016 0.001 0.4% Low
RO05 40 0.205 162 0.226 0.431 0.023 0.007 1.8% Low
RO06 31 0.117 121 0.283 0.400 0.012 0.005 1.3% Low
RO07 41 0.205 159 0.338 0.543 0.019 0.010 1.8% Low
Petticoat PE01 24 0.082 108 0.097 0.180 0.006 0.000 0.2% Low
Frenchman's Bay
FR01 25 0.090 114 0.036 0.126 0.004 0.000 0.1% Low

Approved January 18, 2012 C2-34
Approved Assessment Report: Toronto and Region Source Protection Area
WatershedSub-
watershed
Subshed Area (km2)
QR (m3/s)
QR (mm/yr)
QIN (m3/s)
QSupply (m3/s)
QReserve (m3/s)
QDemand
(m3/s)
% Groundwater
Demand
Groundwater Stress
Assignment
Duffins
DU01 24 0.087 112 0.037 0.123 0.005 0.000 0.2% Low
DU02 53 0.190 113 0.284 0.474 0.026 0.020 4.4% Low
DU03 44 0.150 108 0.317 0.467 0.031 0.005 1.1% Low
DU04 63 0.362 183 0.355 0.717 0.044 0.018 2.7% Low
DU05 60 0.370 194 0.268 0.638 0.022 0.022 3.6% Low
DU06 40 0.192 154 0.160 0.353 0.010 0.057 16.6% Moderate
Carruthers CA01 39 0.131 106 0.109 0.240 0.016 0.004 1.7% Low
Lake Ontario
LO01 24 0.064 84 0.009 0.073 0.000 0.046 62.7% Significant
LO02 40 0.159 126 0.030 0.189 0.000 0.022 11.5% Moderate
LO03 24 0.062 82 0.082 0.143 0.000 0.024 16.4% Moderate
LO04 16 0.052 101 0.075 0.127 0.000 0.000 0.0% Low
LO05 5 0.017 108 0.011 0.027 0.000 0.000 0.0% Low
LO06 3 0.012 117 0.009 0.021 0.000 0.000 0.0% Low
Notes: All water supply and demand numbers are presented in m3/s.
QReserve is calculated as 10% of the groundwater discharge
Table C-13: Monthly groundwater stress assessment (Current)
WatershedSub-
watershed
Groundwater % Demand By MonthMax. % Demand
Monthly Max. StressJan Feb Mar Apr May Jun Jul Aug Sep Oct Nov Dec
Etobicoke
ET01 0% 0% 0% 0% 0% 0% 0% 0% 0% 0% 0% 0% 0% Low
ET02 0% 0% 0% 0% 0% 0% 0% 0% 0% 0% 0% 0% 0% Low
ET03 0% 0% 0% 0% 0% 0% 0% 0% 0% 0% 0% 0% 0% Low
ET04 1% 1% 1% 1% 1% 1% 1% 1% 1% 1% 1% 1% 1% Low
Mimico
MI01 0% 0% 0% 0% 0% 0% 0% 0% 0% 0% 0% 0% 0% Low
MI02 0% 0% 0% 0% 0% 0% 0% 0% 0% 0% 0% 0% 0% Low
MI03 0% 0% 0% 0% 0% 0% 0% 0% 0% 0% 0% 0% 0% Low

Approved January 18, 2012C2-35
Appendix C: Conceptual Water Budget
WatershedSub-
watershed
Groundwater % Demand By MonthMax. % Demand
Monthly Max. StressJan Feb Mar Apr May Jun Jul Aug Sep Oct Nov Dec
Humber
HU01 6% 6% 6% 6% 6% 6% 6% 6% 6% 6% 6% 6% 6% Low
HU02 0% 0% 0% 0% 0% 8% 8% 8% 8% 0% 0% 0% 8% Low
HU03 0% 0% 0% 0% 0% 1% 1% 1% 1% 0% 0% 0% 1% Low
HU04 0% 0% 0% 0% 0% 1% 1% 1% 1% 0% 0% 0% 1% Low
HU05 5% 5% 5% 5% 5% 5% 11% 11% 5% 5% 5% 5% 11% Low
HU06 1% 1% 1% 1% 1% 1% 2% 2% 1% 1% 1% 1% 2% Low
HU07 2% 3% 2% 3% 2% 3% 4% 4% 3% 2% 3% 2% 4% Low
HU08 1% 1% 1% 1% 1% 3% 3% 3% 3% 1% 1% 1% 3% Low
HU09 1% 1% 1% 1% 1% 1% 8% 8% 1% 1% 1% 1% 8% Low
HU10 0% 0% 0% 0% 0% 0% 1% 1% 0% 0% 0% 0% 1% Low
HU11 1% 1% 1% 1% 1% 1% 1% 1% 1% 1% 1% 1% 1% Low
HU12 0% 0% 0% 0% 0% 0% 0% 0% 0% 0% 0% 0% 0% Low
Don
DO01 0% 0% 0% 0% 0% 0% 0% 0% 0% 0% 0% 0% 0% Low
DO02 0% 0% 0% 0% 0% 0% 0% 0% 0% 0% 0% 0% 0% Low
DO03 1% 1% 1% 1% 1% 1% 1% 1% 1% 1% 1% 1% 1% Low
DO04 0% 0% 0% 0% 0% 2% 2% 2% 2% 0% 0% 0% 2% Low
DO05 6% 6% 6% 6% 6% 9% 9% 9% 9% 6% 6% 6% 9% Low
DO06 14% 15% 14% 14% 14% 16% 16% 16% 16% 14% 14% 14% 16% Low
DO07 0% 0% 0% 0% 0% 1% 1% 1% 1% 0% 0% 0% 1% Low
Highland
HI01 0% 0% 0% 0% 0% 0% 0% 0% 0% 0% 0% 0% 0% Low
HI02 0% 0% 0% 0% 0% 0% 0% 0% 0% 0% 0% 0% 0% Low
HI03 0% 0% 0% 0% 0% 0% 0% 0% 0% 0% 0% 0% 0% Low
HI04 0% 0% 0% 0% 0% 0% 0% 0% 0% 0% 0% 0% 0% Low
Rouge
RO01 0% 0% 0% 0% 0% 0% 0% 0% 0% 0% 0% 0% 0% Low
RO02 12% 13% 12% 12% 12% 14% 21% 21% 14% 12% 12% 12% 21% Low
RO03 0% 0% 0% 0% 0% 0% 0% 0% 0% 0% 0% 0% 0% Low
RO04 0% 0% 0% 0% 1% 1% 1% 1% 1% 1% 1% 0% 1% Low
RO05 1% 1% 1% 1% 1% 2% 4% 4% 2% 1% 1% 1% 4% Low
RO06 1% 1% 1% 1% 1% 3% 3% 3% 3% 1% 1% 1% 3% Low
RO07 0% 0% 0% 0% 0% 5% 5% 5% 5% 0% 0% 0% 5% Low
Petticoat PE01 0% 0% 0% 0% 0% 0% 0% 0% 0% 0% 0% 0% 0% Low
Frenchman's Bay
FR01 0% 0% 0% 0% 0% 0% 0% 0% 0% 0% 0% 0% 0% Low

Approved January 18, 2012 C2-36
Approved Assessment Report: Toronto and Region Source Protection Area
WatershedSub-
watershed
Groundwater % Demand By MonthMax. % Demand
Monthly Max. StressJan Feb Mar Apr May Jun Jul Aug Sep Oct Nov Dec
Duffins
DU01 0% 0% 0% 0% 0% 0% 0% 0% 0% 0% 0% 0% 0% Low
DU02 4% 5% 4% 4% 4% 4% 4% 4% 4% 4% 4% 4% 5% Low
DU03 0% 0% 0% 0% 0% 2% 4% 4% 2% 0% 0% 0% 4% Low
DU04 10% 11% 0% 0% 0% 0% 0% 0% 0% 0% 0% 10% 11% Low
DU05 1% 1% 1% 1% 1% 10% 10% 10% 10% 1% 1% 1% 10% Low
DU06 11% 13% 11% 12% 13% 15% 15% 15% 15% 13% 14% 11% 15% Low
Carruthers CA01 0% 0% 0% 0% 0% 1% 8% 8% 1% 0% 0% 0% 8% Low
Lake Ontario
LO01 61% 68% 61% 64% 61% 64% 61% 61% 64% 61% 64% 61% 68% Significant
LO02 11% 12% 11% 12% 11% 12% 11% 11% 12% 11% 12% 11% 12% Low
LO03 13% 15% 13% 14% 13% 23% 22% 22% 23% 13% 14% 13% 23% Low
LO04 0% 0% 0% 0% 0% 0% 0% 0% 0% 0% 0% 0% 0% Low
LO05 0% 0% 0% 0% 0% 0% 0% 0% 0% 0% 0% 0% 0% Low
LO06 0% 0% 0% 0% 0% 0% 0% 0% 0% 0% 0% 0% 0% Low
Table C-14: Monthly groundwater stress assessment (future)
WatershedSub-
watershed
Groundwater % Demand By MonthMax. % Demand
Monthly Max. StressJan Feb Mar Apr May Jun Jul Aug Sep Oct Nov Dec
Etobicoke
ET01 0% 0% 0% 0% 0% 0% 0% 0% 0% 0% 0% 0% 0% Low
ET02 0% 0% 0% 0% 0% 0% 0% 0% 0% 0% 0% 0% 0% Low
ET03 0% 0% 0% 0% 0% 0% 0% 0% 0% 0% 0% 0% 0% Low
ET04 1% 1% 1% 1% 1% 1% 1% 1% 1% 1% 1% 1% 1% Low
Mimico
MI01 0% 0% 0% 0% 0% 0% 0% 0% 0% 0% 0% 0% 0% Low
MI02 0% 0% 0% 0% 0% 0% 0% 0% 0% 0% 0% 0% 0% Low
MI03 0% 0% 0% 0% 0% 0% 0% 0% 0% 0% 0% 0% 0% Low
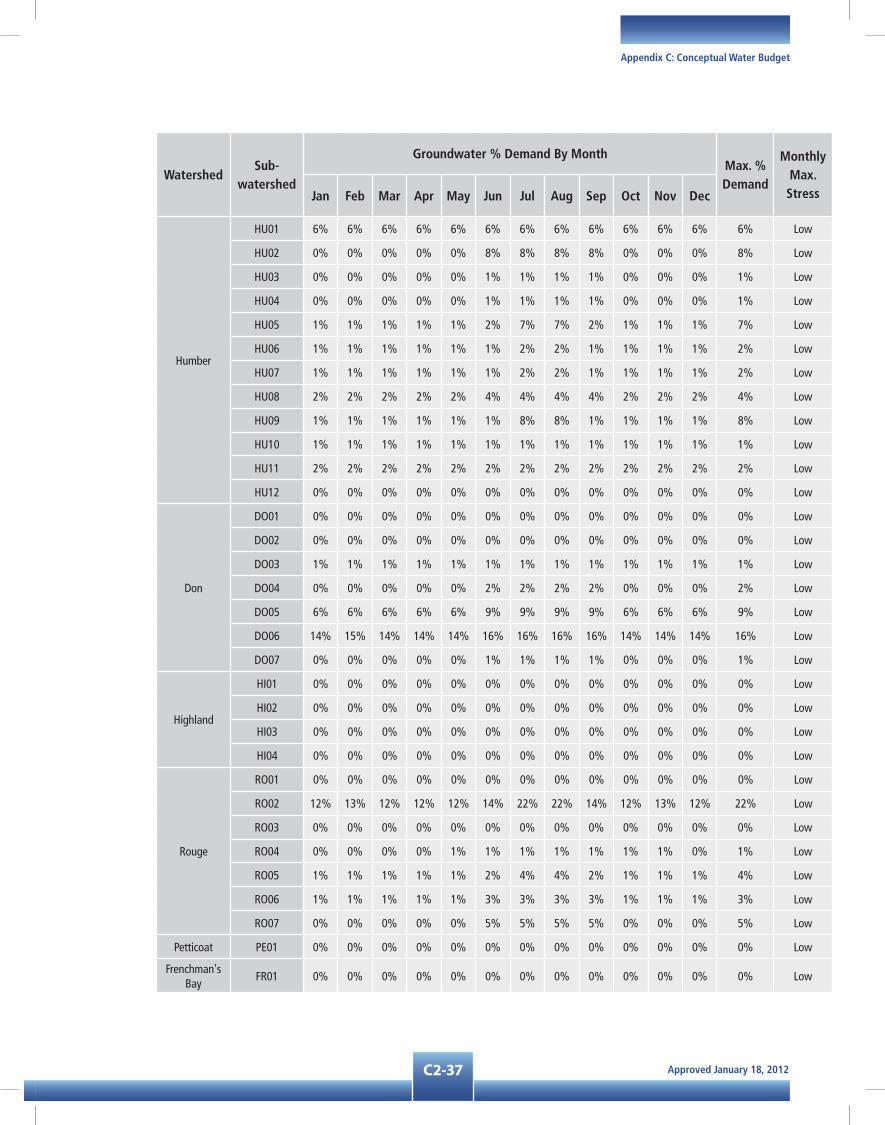
Approved January 18, 2012C2-37
Appendix C: Conceptual Water Budget
WatershedSub-
watershed
Groundwater % Demand By MonthMax. % Demand
Monthly Max. StressJan Feb Mar Apr May Jun Jul Aug Sep Oct Nov Dec
Humber
HU01 6% 6% 6% 6% 6% 6% 6% 6% 6% 6% 6% 6% 6% Low
HU02 0% 0% 0% 0% 0% 8% 8% 8% 8% 0% 0% 0% 8% Low
HU03 0% 0% 0% 0% 0% 1% 1% 1% 1% 0% 0% 0% 1% Low
HU04 0% 0% 0% 0% 0% 1% 1% 1% 1% 0% 0% 0% 1% Low
HU05 1% 1% 1% 1% 1% 2% 7% 7% 2% 1% 1% 1% 7% Low
HU06 1% 1% 1% 1% 1% 1% 2% 2% 1% 1% 1% 1% 2% Low
HU07 1% 1% 1% 1% 1% 1% 2% 2% 1% 1% 1% 1% 2% Low
HU08 2% 2% 2% 2% 2% 4% 4% 4% 4% 2% 2% 2% 4% Low
HU09 1% 1% 1% 1% 1% 1% 8% 8% 1% 1% 1% 1% 8% Low
HU10 1% 1% 1% 1% 1% 1% 1% 1% 1% 1% 1% 1% 1% Low
HU11 2% 2% 2% 2% 2% 2% 2% 2% 2% 2% 2% 2% 2% Low
HU12 0% 0% 0% 0% 0% 0% 0% 0% 0% 0% 0% 0% 0% Low
Don
DO01 0% 0% 0% 0% 0% 0% 0% 0% 0% 0% 0% 0% 0% Low
DO02 0% 0% 0% 0% 0% 0% 0% 0% 0% 0% 0% 0% 0% Low
DO03 1% 1% 1% 1% 1% 1% 1% 1% 1% 1% 1% 1% 1% Low
DO04 0% 0% 0% 0% 0% 2% 2% 2% 2% 0% 0% 0% 2% Low
DO05 6% 6% 6% 6% 6% 9% 9% 9% 9% 6% 6% 6% 9% Low
DO06 14% 15% 14% 14% 14% 16% 16% 16% 16% 14% 14% 14% 16% Low
DO07 0% 0% 0% 0% 0% 1% 1% 1% 1% 0% 0% 0% 1% Low
Highland
HI01 0% 0% 0% 0% 0% 0% 0% 0% 0% 0% 0% 0% 0% Low
HI02 0% 0% 0% 0% 0% 0% 0% 0% 0% 0% 0% 0% 0% Low
HI03 0% 0% 0% 0% 0% 0% 0% 0% 0% 0% 0% 0% 0% Low
HI04 0% 0% 0% 0% 0% 0% 0% 0% 0% 0% 0% 0% 0% Low
Rouge
RO01 0% 0% 0% 0% 0% 0% 0% 0% 0% 0% 0% 0% 0% Low
RO02 12% 13% 12% 12% 12% 14% 22% 22% 14% 12% 13% 12% 22% Low
RO03 0% 0% 0% 0% 0% 0% 0% 0% 0% 0% 0% 0% 0% Low
RO04 0% 0% 0% 0% 1% 1% 1% 1% 1% 1% 1% 0% 1% Low
RO05 1% 1% 1% 1% 1% 2% 4% 4% 2% 1% 1% 1% 4% Low
RO06 1% 1% 1% 1% 1% 3% 3% 3% 3% 1% 1% 1% 3% Low
RO07 0% 0% 0% 0% 0% 5% 5% 5% 5% 0% 0% 0% 5% Low
Petticoat PE01 0% 0% 0% 0% 0% 0% 0% 0% 0% 0% 0% 0% 0% Low
Frenchman's Bay
FR01 0% 0% 0% 0% 0% 0% 0% 0% 0% 0% 0% 0% 0% Low

Approved January 18, 2012 C2-38
Approved Assessment Report: Toronto and Region Source Protection Area
WatershedSub-
watershed
Groundwater % Demand By MonthMax. % Demand
Monthly Max. StressJan Feb Mar Apr May Jun Jul Aug Sep Oct Nov Dec
Duffins
DU01 0% 0% 0% 0% 0% 0% 0% 0% 0% 0% 0% 0% 0% Low
DU02 4% 5% 4% 4% 4% 4% 4% 4% 4% 4% 4% 4% 5% Low
DU03 0% 0% 0% 0% 0% 2% 4% 4% 2% 0% 0% 0% 4% Low
DU04 10% 11% 0% 0% 0% 0% 0% 0% 0% 0% 0% 10% 11% Low
DU05 1% 1% 1% 1% 1% 10% 10% 10% 10% 1% 1% 1% 10% Low
DU06 15% 17% 15% 15% 17% 18% 18% 18% 18% 17% 17% 15% 18% Low
Carruthers CA01 0% 0% 0% 0% 0% 1% 8% 8% 1% 0% 0% 0% 8% Low
Lake Ontario
LO01 61% 68% 61% 64% 61% 64% 61% 61% 64% 61% 64% 61% 68% Significant
LO02 11% 12% 11% 12% 11% 12% 11% 11% 12% 11% 12% 11% 12% Low
LO03 13% 15% 13% 14% 13% 23% 22% 22% 23% 13% 14% 13% 23% Low
LO04 0% 0% 0% 0% 0% 0% 0% 0% 0% 0% 0% 0% 0% Low
LO05 0% 0% 0% 0% 0% 0% 0% 0% 0% 0% 0% 0% 0% Low
LO06 0% 0% 0% 0% 0% 0% 0% 0% 0% 0% 0% 0% 0% Low
Table C-15: groundwater usage data
Sub-watershed
Category Specific UseEstimated
Usage (m3/yr)
Consum. Factor
Current Consumptive Use (m3/yr)
2031 Consumptive Use (m3/yr)
ET02 Commercial Golf Course Irrigation 85 0.7 60 60
ET03 Lumped Domestic Lumped Domestic 5,502 0.2 1,100 1,100
ET03 Remediation Other - Remediation 19,896 1 19,896 19,896
ET04 Agricultural Nursery 4,145 0.9 3,731 3,731
ET04 Agricultural Other - Agricultural 5,724 0.8 4,579 4,579
ET04 Agricultural Unknown 76 0.8 61 76
ET04 Commercial Golf Course Irrigation 4,497 0.7 3,148 3,148
ET04 Livestock Watering Livestock Watering 569 0.3 171 171
ET04 Livestock Watering Livestock Watering 1,040 0.3 312 312
ET04 Livestock Watering Livestock Watering 694 0.3 208 208
ET04 Livestock Watering Livestock Watering 666 0.3 200 200
ET04 Livestock Watering Livestock Watering 996 0.3 299 299
ET04 Livestock Watering Livestock Watering 17,962 0.3 5,389 5,389
ET04 Livestock Watering Livestock Watering 123 0.3 37 37
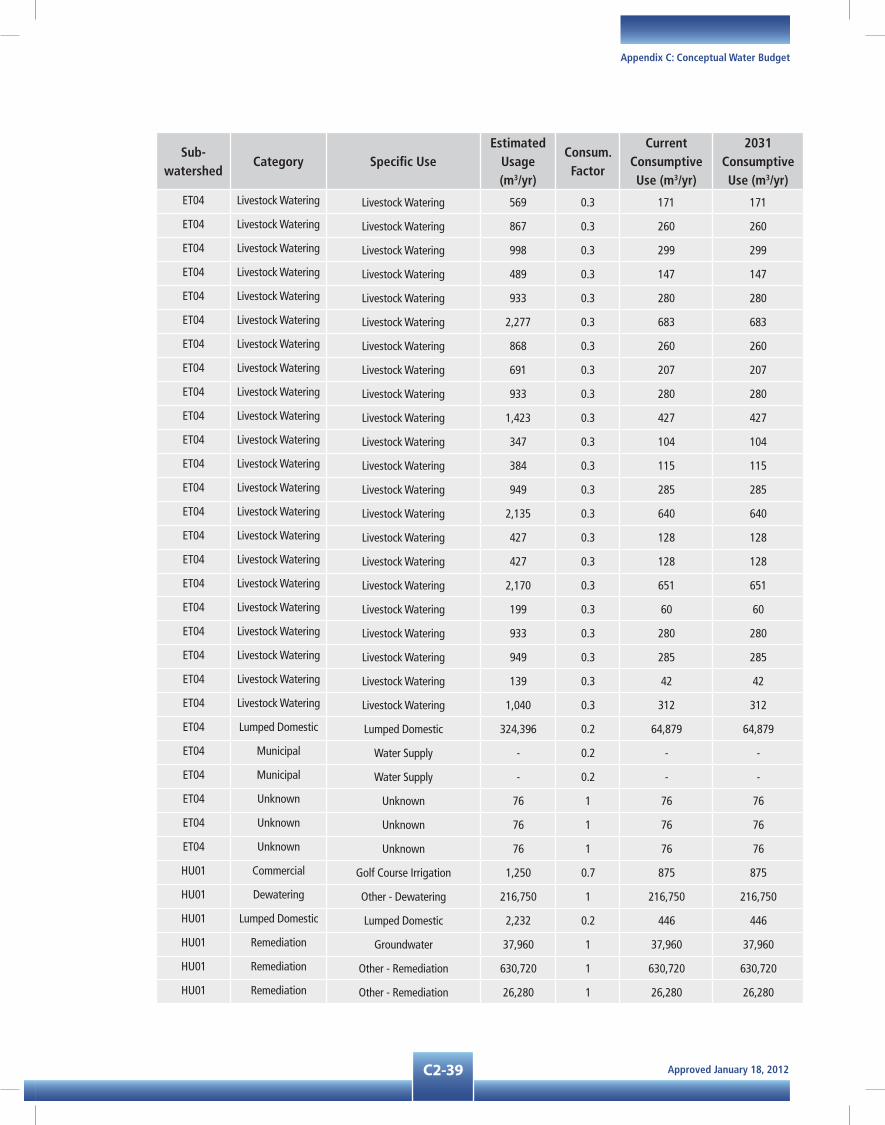
Approved January 18, 2012C2-39
Appendix C: Conceptual Water Budget
Sub-watershed
Category Specific UseEstimated
Usage (m3/yr)
Consum. Factor
Current Consumptive Use (m3/yr)
2031 Consumptive Use (m3/yr)
ET04 Livestock Watering Livestock Watering 569 0.3 171 171
ET04 Livestock Watering Livestock Watering 867 0.3 260 260
ET04 Livestock Watering Livestock Watering 998 0.3 299 299
ET04 Livestock Watering Livestock Watering 489 0.3 147 147
ET04 Livestock Watering Livestock Watering 933 0.3 280 280
ET04 Livestock Watering Livestock Watering 2,277 0.3 683 683
ET04 Livestock Watering Livestock Watering 868 0.3 260 260
ET04 Livestock Watering Livestock Watering 691 0.3 207 207
ET04 Livestock Watering Livestock Watering 933 0.3 280 280
ET04 Livestock Watering Livestock Watering 1,423 0.3 427 427
ET04 Livestock Watering Livestock Watering 347 0.3 104 104
ET04 Livestock Watering Livestock Watering 384 0.3 115 115
ET04 Livestock Watering Livestock Watering 949 0.3 285 285
ET04 Livestock Watering Livestock Watering 2,135 0.3 640 640
ET04 Livestock Watering Livestock Watering 427 0.3 128 128
ET04 Livestock Watering Livestock Watering 427 0.3 128 128
ET04 Livestock Watering Livestock Watering 2,170 0.3 651 651
ET04 Livestock Watering Livestock Watering 199 0.3 60 60
ET04 Livestock Watering Livestock Watering 933 0.3 280 280
ET04 Livestock Watering Livestock Watering 949 0.3 285 285
ET04 Livestock Watering Livestock Watering 139 0.3 42 42
ET04 Livestock Watering Livestock Watering 1,040 0.3 312 312
ET04 Lumped Domestic Lumped Domestic 324,396 0.2 64,879 64,879
ET04 Municipal Water Supply - 0.2 - -
ET04 Municipal Water Supply - 0.2 - -
ET04 Unknown Unknown 76 1 76 76
ET04 Unknown Unknown 76 1 76 76
ET04 Unknown Unknown 76 1 76 76
HU01 Commercial Golf Course Irrigation 1,250 0.7 875 875
HU01 Dewatering Other - Dewatering 216,750 1 216,750 216,750
HU01 Lumped Domestic Lumped Domestic 2,232 0.2 446 446
HU01 Remediation Groundwater 37,960 1 37,960 37,960
HU01 Remediation Other - Remediation 630,720 1 630,720 630,720
HU01 Remediation Other - Remediation 26,280 1 26,280 26,280

Approved January 18, 2012 C2-40
Approved Assessment Report: Toronto and Region Source Protection Area
Sub-watershed
Category Specific UseEstimated
Usage (m3/yr)
Consum. Factor
Current Consumptive Use (m3/yr)
2031 Consumptive Use (m3/yr)
HU02 Commercial Other - Commercial 19,080 1 19,080 19,080
HU02 Recreational Aesthetics 35,640 0.7 24,948 24,948
HU03 Agricultural Nursery 2 0.9 2 2
HU03 Agricultural Other - Agricultural 450 0.8 360 360
HU03 Commercial Golf Course Irrigation 11,810 0.7 8,267 8,267
HU03 Commercial Golf Course Irrigation 30,000 0.7 21,000 21,000
HU03 Commercial Golf Course Irrigation 30,000 0.7 21,000 21,000
HU03 Livestock Watering Livestock Watering 569 0.3 171 171
HU03 Livestock Watering Livestock Watering 1,266 0.3 380 380
HU03 Lumped Domestic Lumped Domestic 121,333 0.2 24,267 24,267
HU04 Agricultural Nursery 4,400 0.9 3,960 3,960
HU04 Agricultural Nursery 3,895 0.9 3,506 3,506
HU04 Agricultural Nursery 3,895 0.9 3,506 3,506
HU04 Commercial Golf Course Irrigation 30,000 0.7 21,000 21,000
HU04 Livestock Watering Livestock Watering 1,370 0.3 411 411
HU04 Livestock Watering Livestock Watering 1,708 0.3 512 512
HU04 Livestock Watering Livestock Watering 498 0.3 149 149
HU04 Livestock Watering Livestock Watering 1,998 0.3 600 600
HU04 Livestock Watering Livestock Watering 2,666 0.3 800 800
HU04 Livestock Watering Livestock Watering 1,066 0.3 320 320
HU04 Livestock Watering Livestock Watering 427 0.3 128 128
HU04 Livestock Watering Livestock Watering 1,423 0.3 427 427
HU04 Livestock Watering Livestock Watering 69 0.3 21 21
HU04 Livestock Watering Livestock Watering 569 0.3 171 171
HU04 Livestock Watering Livestock Watering 712 0.3 213 213
HU04 Livestock Watering Livestock Watering 85 0.3 26 26
HU04 Livestock Watering Livestock Watering 82 0.3 25 25
HU04 Lumped Domestic Lumped Domestic 141,099 0.2 28,220 28,220
HU05 Agricultural Nursery 84 0.9 76 76
HU05 Agricultural Nursery 177 0.9 159 159
HU05 Agricultural Nursery 3,895 0.9 3,506 3,506
HU05 Agricultural Other - Agricultural 168,670 0.8 134,936 134,936
HU05 Agricultural Other - Agricultural 76 0.8 61 61
HU05 Agricultural Other - Agricultural 5,724 0.8 4,579 4,579
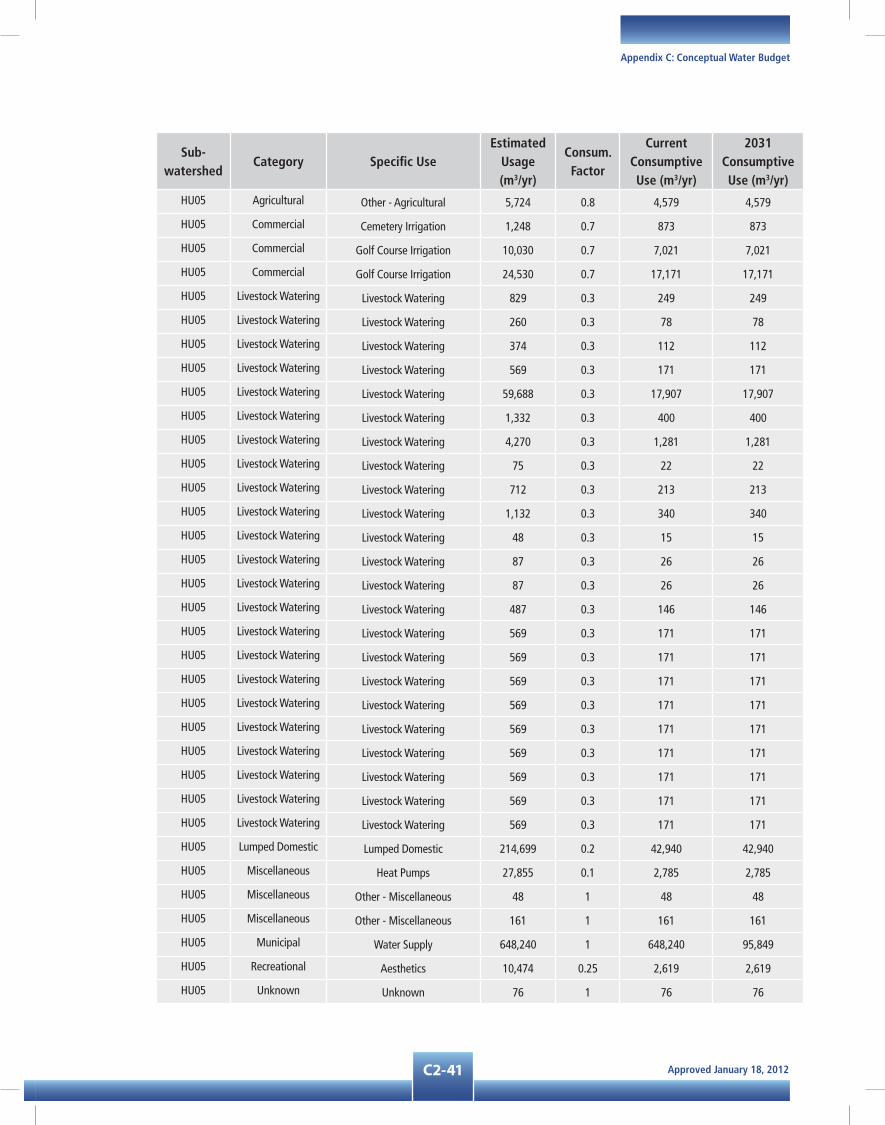
Approved January 18, 2012C2-41
Appendix C: Conceptual Water Budget
Sub-watershed
Category Specific UseEstimated
Usage (m3/yr)
Consum. Factor
Current Consumptive Use (m3/yr)
2031 Consumptive Use (m3/yr)
HU05 Agricultural Other - Agricultural 5,724 0.8 4,579 4,579
HU05 Commercial Cemetery Irrigation 1,248 0.7 873 873
HU05 Commercial Golf Course Irrigation 10,030 0.7 7,021 7,021
HU05 Commercial Golf Course Irrigation 24,530 0.7 17,171 17,171
HU05 Livestock Watering Livestock Watering 829 0.3 249 249
HU05 Livestock Watering Livestock Watering 260 0.3 78 78
HU05 Livestock Watering Livestock Watering 374 0.3 112 112
HU05 Livestock Watering Livestock Watering 569 0.3 171 171
HU05 Livestock Watering Livestock Watering 59,688 0.3 17,907 17,907
HU05 Livestock Watering Livestock Watering 1,332 0.3 400 400
HU05 Livestock Watering Livestock Watering 4,270 0.3 1,281 1,281
HU05 Livestock Watering Livestock Watering 75 0.3 22 22
HU05 Livestock Watering Livestock Watering 712 0.3 213 213
HU05 Livestock Watering Livestock Watering 1,132 0.3 340 340
HU05 Livestock Watering Livestock Watering 48 0.3 15 15
HU05 Livestock Watering Livestock Watering 87 0.3 26 26
HU05 Livestock Watering Livestock Watering 87 0.3 26 26
HU05 Livestock Watering Livestock Watering 487 0.3 146 146
HU05 Livestock Watering Livestock Watering 569 0.3 171 171
HU05 Livestock Watering Livestock Watering 569 0.3 171 171
HU05 Livestock Watering Livestock Watering 569 0.3 171 171
HU05 Livestock Watering Livestock Watering 569 0.3 171 171
HU05 Livestock Watering Livestock Watering 569 0.3 171 171
HU05 Livestock Watering Livestock Watering 569 0.3 171 171
HU05 Livestock Watering Livestock Watering 569 0.3 171 171
HU05 Livestock Watering Livestock Watering 569 0.3 171 171
HU05 Livestock Watering Livestock Watering 569 0.3 171 171
HU05 Lumped Domestic Lumped Domestic 214,699 0.2 42,940 42,940
HU05 Miscellaneous Heat Pumps 27,855 0.1 2,785 2,785
HU05 Miscellaneous Other - Miscellaneous 48 1 48 48
HU05 Miscellaneous Other - Miscellaneous 161 1 161 161
HU05 Municipal Water Supply 648,240 1 648,240 95,849
HU05 Recreational Aesthetics 10,474 0.25 2,619 2,619
HU05 Unknown Unknown 76 1 76 76

Approved January 18, 2012 C2-42
Approved Assessment Report: Toronto and Region Source Protection Area
Sub-watershed
Category Specific UseEstimated
Usage (m3/yr)
Consum. Factor
Current Consumptive Use (m3/yr)
2031 Consumptive Use (m3/yr)
HU05 Unknown Unknown 76 1 76 76
HU05 Unknown Unknown 76 1 76 76
HU06 Agricultural Field and Pasture Crops 58,871 0.8 47,097 47,097
HU06 Agricultural Field and Pasture Crops 28 0.8 22 22
HU06 Agricultural Other - Agricultural 4,145 0.8 3,316 3,316
HU06 Agricultural Other - Agricultural 76 0.8 61 61
HU06 Agricultural Other - Agricultural 76 0.8 61 61
HU06 Agricultural Sod Farm 2,059 0.9 1,853 1,853
HU06 Commercial Other - Commercial 19,080 1 19,080 19,080
HU06 Livestock Watering Livestock Watering 254 0.3 76 76
HU06 Livestock Watering Livestock Watering 414 0.3 124 124
HU06 Livestock Watering Livestock Watering 48 0.3 14 14
HU06 Livestock Watering Livestock Watering 277 0.3 83 83
HU06 Livestock Watering Livestock Watering 684 0.3 205 205
HU06 Livestock Watering Livestock Watering 1,423 0.3 427 427
HU06 Livestock Watering Livestock Watering 312 0.3 94 94
HU06 Livestock Watering Livestock Watering 171 0.3 51 51
HU06 Livestock Watering Livestock Watering 569 0.3 171 171
HU06 Lumped Domestic Lumped Domestic 745,893 0.2 149,179 149,179
HU06 Municipal Water Supply 29,565 1 29,565 -
HU06 Unknown Unknown 76 1 76 76
HU06 Water Supply Communal 116,074 0.2 23,215 23,215
HU07 Agricultural Field/Pasture Crops 8,176 0.8 6,541 6,541
HU07 Agricultural Field/Pasture Crops 2,994 0.8 2,395 2,395
HU07 Agricultural Field/Pasture Crops 26,492 0.8 21,193 21,193
HU07 Agricultural Nursery 442 0.9 398 398
HU07 Agricultural Other - Agricultural 76 0.8 61 61
HU07 Agricultural Other - Agricultural 76 0.8 61 61
HU07 Agricultural Other - Agricultural 76 0.8 61 61
HU07 Commercial Golf Course Irrigation 75,000 0.7 52,500 52,500
HU07 Institutional Schools 4,470 0.25 1,118 1,118
HU07 Livestock Watering Livestock Watering 52 0.3 16 16
HU07 Livestock Watering Livestock Watering 1,332 0.3 400 400
HU07 Livestock Watering Livestock Watering 144 0.3 43 43

Approved January 18, 2012C2-43
Appendix C: Conceptual Water Budget
Sub-watershed
Category Specific UseEstimated
Usage (m3/yr)
Consum. Factor
Current Consumptive Use (m3/yr)
2031 Consumptive Use (m3/yr)
HU07 Livestock Watering Livestock Watering 139 0.3 42 42
HU07 Livestock Watering Livestock Watering 1,387 0.3 416 416
HU07 Livestock Watering Livestock Watering 1,474 0.3 442 442
HU07 Livestock Watering Livestock Watering 139 0.3 42 42
HU07 Livestock Watering Livestock Watering 462 0.3 139 139
HU07 Livestock Watering Livestock Watering 376 0.3 113 113
HU07 Livestock Watering Livestock Watering 414 0.3 124 124
HU07 Livestock Watering Livestock Watering 138 0.3 41 41
HU07 Livestock Watering Livestock Watering 1,382 0.3 414 414
HU07 Livestock Watering Livestock Watering 55 0.3 17 17
HU07 Livestock Watering Livestock Watering 306 0.3 92 92
HU07 Livestock Watering Livestock Watering 387 0.3 116 116
HU07 Livestock Watering Livestock Watering 172 0.3 51 51
HU07 Livestock Watering Livestock Watering 913 0.3 274 274
HU07 Livestock Watering Livestock Watering 1,370 0.3 411 411
HU07 Livestock Watering Livestock Watering 569 0.3 171 171
HU07 Lumped Domestic Lumped Domestic 852,413 0.2 170,483 170,483
HU07 Miscellaneous Heat Pumps 7,955 0.1 795 795
HU07 Municipal Water Supply 152,935 1 152,935 -
HU07 Municipal Water Supply 347,480 1 347,480 -
HU07 Recreational Aesthetics 1,716 0.25 429 429
HU07 Recreational Aesthetics 10,474 0.25 2,619 2,619
HU07 Unknown Unknown 76 1 76 76
HU07 Water Supply Communal 11,774 0.2 2,355 2,355
HU07 Water Supply Other - Water Supply 55,267 0.2 11,053 11,053
HU08 Agricultural Sod Farm 5,678 0.9 5,110 5,110
HU08 Commercial Golf Course Irrigation 108,960 0.7 76,272 76,272
HU08 Livestock Watering Livestock Watering 66,320 0.3 19,896 19,896
HU08 Livestock Watering Livestock Watering 329 0.3 99 99
HU08 Livestock Watering Livestock Watering 22 0.3 7 7
HU08 Livestock Watering Livestock Watering 1,388 0.3 416 416
HU08 Livestock Watering Livestock Watering 1,332 0.3 400 400
HU08 Livestock Watering Livestock Watering 569 0.3 171 171
HU08 Livestock Watering Livestock Watering 569 0.3 171 171

Approved January 18, 2012 C2-44
Approved Assessment Report: Toronto and Region Source Protection Area
Sub-watershed
Category Specific UseEstimated
Usage (m3/yr)
Consum. Factor
Current Consumptive Use (m3/yr)
2031 Consumptive Use (m3/yr)
HU08 Livestock Watering Livestock Watering 76 0.3 23 23
HU08 Livestock Watering Livestock Watering 569 0.3 171 171
HU08 Lumped Domestic Lumped Domestic 85,520 0.2 17,104 17,104
HU08 Municipal Water Supply 197,100 0.2 39,420 97,367
HU08 Municipal Water Supply 176,295 0.2 35,259 87,090
HU08 Recreational Aesthetics 10,474 0.25 2,619 2,619
HU08 Unknown Unknown 76 1 76 76
HU08 Unknown Unknown 76 1 76 76
HU09 Agricultural Nursery 190,785 0.9 171,706 171,706
HU09 Agricultural Nursery 3,895 0.9 3,506 3,506
HU09 Agricultural Other - Agricultural 5,724 0.8 4,579 4,579
HU09 Agricultural Other - Agricultural 5,724 0.8 4,579 4,579
HU09 Commercial Golf Course Irrigation 56,781 0.7 39,747 39,747
HU09 Livestock Watering Livestock Watering 470 0.3 141 141
HU09 Livestock Watering Livestock Watering 427 0.3 128 128
HU09 Livestock Watering Livestock Watering 694 0.3 208 208
HU09 Livestock Watering Livestock Watering 1,210 0.3 363 363
HU09 Livestock Watering Livestock Watering 381 0.3 114 114
HU09 Livestock Watering Livestock Watering 111 0.3 33 33
HU09 Livestock Watering Livestock Watering 1,364 0.3 409 409
HU09 Livestock Watering Livestock Watering 72 0.3 22 22
HU09 Livestock Watering Livestock Watering 5,527 0.3 1,658 1,658
HU09 Livestock Watering Livestock Watering 307 0.3 92 92
HU09 Livestock Watering Livestock Watering 347 0.3 104 104
HU09 Livestock Watering Livestock Watering 228 0.3 68 68
HU09 Livestock Watering Livestock Watering 35,813 0.3 10,744 10,744
HU09 Livestock Watering Livestock Watering 66 0.3 20 20
HU09 Livestock Watering Livestock Watering 533 0.3 160 160
HU09 Livestock Watering Livestock Watering 76 0.3 23 23
HU09 Livestock Watering Livestock Watering 569 0.3 171 171
HU09 Livestock Watering Livestock Watering 569 0.3 171 171
HU09 Livestock Watering Livestock Watering 569 0.3 171 171
HU09 Livestock Watering Livestock Watering 569 0.3 171 171
HU09 Livestock Watering Livestock Watering 569 0.3 171 171

Approved January 18, 2012C2-45
Appendix C: Conceptual Water Budget
Sub-watershed
Category Specific UseEstimated
Usage (m3/yr)
Consum. Factor
Current Consumptive Use (m3/yr)
2031 Consumptive Use (m3/yr)
HU09 Livestock Watering Livestock Watering 569 0.3 171 171
HU09 Livestock Watering Livestock Watering 569 0.3 171 171
HU09 Livestock Watering Livestock Watering 569 0.3 171 171
HU09 Livestock Watering Livestock Watering 569 0.3 171 171
HU09 Livestock Watering Livestock Watering 569 0.3 171 171
HU09 Livestock Watering Livestock Watering 569 0.3 171 171
HU09 Livestock Watering Livestock Watering 569 0.3 171 171
HU09 Livestock Watering Livestock Watering 569 0.3 171 171
HU09 Livestock Watering Livestock Watering 569 0.3 171 171
HU09 Livestock Watering Livestock Watering 569 0.3 171 171
HU09 Livestock Watering Livestock Watering 569 0.3 171 171
HU09 Livestock Watering Livestock Watering 569 0.3 171 171
HU09 Livestock Watering Livestock Watering 569 0.3 171 171
HU09 Livestock Watering Livestock Watering 569 0.3 171 171
HU09 Livestock Watering Livestock Watering 569 0.3 171 171
HU09 Lumped Domestic Lumped Domestic 298,204 0.2 59,641 59,641
HU09 Recreational Aesthetics 20,891 0.25 5,223 5,223
HU09 Recreational Aesthetics 20,891 0.25 5,223 5,223
HU09 Recreational Aesthetics 10,474 0.25 2,619 2,619
HU09 Recreational Aesthetics 10,474 0.25 2,619 2,619
HU09 Unknown Unknown 76 1 76 76
HU09 Unknown Unknown 76 1 76 76
HU09 Unknown Unknown 76 1 76 76
HU09 Unknown Unknown 76 1 76 76
HU09 Unknown Unknown 76 1 76 76
HU09 Water Supply Other - Water Supply 59,860 0.2 11,972 11,972
HU10 Agricultural Nursery 327 0.9 294 294
HU10 Agricultural Nursery 7,437 0.9 6,693 6,693
HU10 Livestock Watering Livestock Watering 140 0.3 42 42
HU10 Livestock Watering Livestock Watering 1,199 0.3 360 360
HU10 Livestock Watering Livestock Watering 794 0.3 238 238
HU10 Livestock Watering Livestock Watering 569 0.3 171 171
HU10 Livestock Watering Livestock Watering 569 0.3 171 171
HU10 Livestock Watering Livestock Watering 569 0.3 171 171

Approved January 18, 2012 C2-46
Approved Assessment Report: Toronto and Region Source Protection Area
Sub-watershed
Category Specific UseEstimated
Usage (m3/yr)
Consum. Factor
Current Consumptive Use (m3/yr)
2031 Consumptive Use (m3/yr)
HU10 Lumped Domestic Lumped Domestic 207,378 0.2 41,476 41,476
HU10 Municipal Other - Dewatering 1,660 1 1,660 1,660
HU10 Municipal Water Supply 73,232 0.2 14,646 22,262
HU10 Municipal Water Supply 740,154 0.2 - 148,031
HU10 Municipal Water Supply 391 0.2 78 119
HU11 Agricultural Nursery 272 0.9 245 245
HU11 Agricultural Nursery 195 0.9 176 176
HU11 Agricultural Other - Agricultural 76 0.8 61 61
HU11 Livestock Watering Livestock Watering 1,825 0.3 548 548
HU11 Lumped Domestic Lumped Domestic 224,130 0.2 44,826 44,826
HU11 Municipal Water Supply 32,408 0.2 6,482 14,981
HU11 Municipal Water Supply 36,538 0.2 7,308 16,891
HU11 Municipal Water Supply 396,632 0.2 79,326 183,350
HU12 Agricultural Other - Agricultural 5,724 0.8 4,579 4,579
HU12 Commercial Aquaculture 16,593 0.1 1,659 1,659
HU12 Livestock Watering Livestock Watering 17,897 0.3 5,369 5,369
HU12 Livestock Watering Livestock Watering 415 0.3 124 124
HU12 Livestock Watering Livestock Watering 76 0.3 23 23
HU12 Lumped Domestic Lumped Domestic 255,677 0.2 51,135 51,135
HU12 Municipal Water Supply 73,232 0.2 14,646 22,262
HU12 Recreational Aesthetics 2,950 0.25 738 738
HU12 Recreational Aesthetics 24 0.25 6 6
HU12 Unknown Unknown 76 1 76 76
HU12 Water Supply Communal 11,938 0.2 2,388 2,388
DO01 Industrial Other - Industrial 67,069 0.25 16,767 16,767
DO03 Remediation Groundwater 105,120 1 105,120 105,120
DO04 Commercial Golf Course Irrigation 142,453 0.7 99,717 99,717
DO04 Industrial Other - Industrial 67,069 0.25 16,767 16,767
DO05 Agricultural Nursery 3,895 0.9 3,506 3,506
DO05 Agricultural Other - Agricultural 5,724 0.8 4,579 4,579
DO05 Agricultural Other - Agricultural 76 0.8 61 61
DO05 Commercial Golf Course Irrigation 246,240 0.7 172,368 172,368
DO05 Lumped Domestic Lumped Domestic 47,477 0.2 9,495 9,495
DO05 Remediation Groundwater 795,845 1 795,845 795,845

Approved January 18, 2012C2-47
Appendix C: Conceptual Water Budget
Sub-watershed
Category Specific UseEstimated
Usage (m3/yr)
Consum. Factor
Current Consumptive Use (m3/yr)
2031 Consumptive Use (m3/yr)
DO05 Remediation Other - Remediation 19,896 1 19,896 19,896
DO05 Unknown Unknown 76 1 76 76
DO05 Unknown Unknown 76 1 76 76
DO06 Agricultural Other - Agricultural 5,724 0.8 4,579 4,579
DO06 Agricultural Other - Agricultural 3,150 0.8 2,520 2,520
DO06 Agricultural Other - Agricultural 5,724 0.8 4,579 4,579
DO06 Agricultural Unknown 76 0.8 61 76
DO06 Commercial Golf Course Irrigation 30,000 0.7 21,000 21,000
DO06 Commercial Golf Course Irrigation 97,083 0.7 67,958 67,958
DO06 Commercial Golf Course Irrigation 2,000 0.7 1,400 1,400
DO06 Dewatering Other - Dewatering 1,149,984 1 1,149,984 1,149,984
DO06 Lumped Domestic Lumped Domestic 1,339 0.2 268 268
DO06 Miscellaneous Other - Miscellaneous 216,710 1 216,710 216,710
DO06 Recreational Aesthetics 10,474 0.25 2,619 2,619
DO06 Recreational Aesthetics 10,474 0.25 2,619 2,619
DO06 Remediation Groundwater 65,723 1 65,723 65,723
DO06 Remediation Groundwater 65,723 1 65,723 65,723
DO06 Remediation Groundwater 65,723 1 65,723 65,723
DO06 Remediation Groundwater 65,723 1 65,723 65,723
DO06 Remediation Groundwater 65,723 1 65,723 65,723

Approved January 18, 2012 C2-48
Approved Assessment Report: Toronto and Region Source Protection Area
Sub-watershed
Category Specific UseEstimated
Usage (m3/yr)
Consum. Factor
Current Consumptive Use (m3/yr)
2031 Consumptive Use (m3/yr)
DO06 Remediation Groundwater 65,723 1 65,723 65,723
DO06 Remediation Groundwater 65,723 1 65,723 65,723
DO06 Remediation Groundwater 65,723 1 65,723 65,723
DO06 Remediation Groundwater 65,723 1 65,723 65,723
DO06 Remediation Groundwater 65,723 1 65,723 65,723
DO06 Remediation Groundwater 65,723 1 65,723 65,723
DO06 Remediation Groundwater 65,723 1 65,723 65,723
DO06 Remediation Groundwater 65,723 1 65,723 65,723
DO06 Remediation Groundwater 65,723 1 65,723 65,723
DO06 Remediation Groundwater 65,723 1 65,723 65,723
DO06 Remediation Groundwater 65,723 1 65,723 65,723
DO06 Unknown Unknown 76 1 76 76
DO07 Agricultural Other - Agricultural 76 0.8 61 61
DO07 Commercial Golf Course Irrigation 425 0.7 298 298
DO07 Commercial Golf Course Irrigation 18,533 0.7 12,973 12,973
DO07 Dewatering Construction - 0.25 - -
DO07 Livestock Watering Livestock Watering 1,515 0.3 455 455
DO07 Lumped Domestic Lumped Domestic 142,663 0.2 28,533 28,533
DO07 Recreational Aesthetics 10,474 0.25 2,619 2,619
HI03 Miscellaneous Other - Miscellaneous 654 1 654 654
RO01 Lumped Domestic Lumped Domestic 2,201 0.2 440 440
RO02 Agricultural Market Gardens / Flowers 1,526 0.9 1,374 1,374
RO02 Agricultural Nursery 44,344 0.9 39,909 39,909
RO02 Agricultural Nursery 10,368 0.9 9,331 9,331
RO02 Agricultural Nursery 4,290 0.9 3,861 3,861
RO02 Agricultural Nursery 12,925 0.9 11,633 11,633
RO02 Agricultural Nursery 17,520 0.9 15,768 15,768
RO02 Agricultural Nursery 38,075 0.9 34,268 34,268
RO02 Agricultural Nursery 3,895 0.9 3,506 3,506
RO02 Agricultural Other - Agricultural 8 0.8 6 6
RO02 Agricultural Other - Agricultural 5,724 0.8 4,579 4,579
RO02 Agricultural Other - Agricultural 613 0.8 490 490
RO02 Agricultural Other - Agricultural 76 0.8 61 61
RO02 Agricultural Tender Fruit 250,291 0.8 200,233 200,233
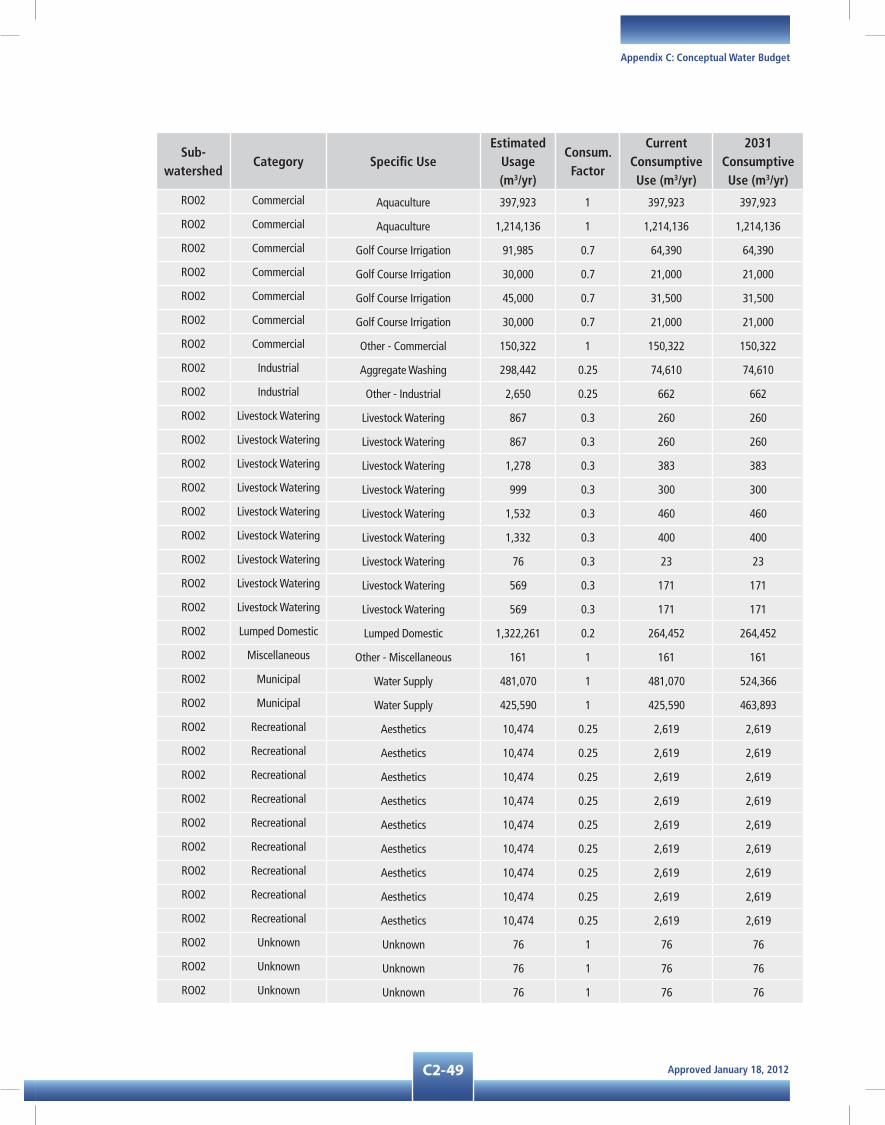
Approved January 18, 2012C2-49
Appendix C: Conceptual Water Budget
Sub-watershed
Category Specific UseEstimated
Usage (m3/yr)
Consum. Factor
Current Consumptive Use (m3/yr)
2031 Consumptive Use (m3/yr)
RO02 Commercial Aquaculture 397,923 1 397,923 397,923
RO02 Commercial Aquaculture 1,214,136 1 1,214,136 1,214,136
RO02 Commercial Golf Course Irrigation 91,985 0.7 64,390 64,390
RO02 Commercial Golf Course Irrigation 30,000 0.7 21,000 21,000
RO02 Commercial Golf Course Irrigation 45,000 0.7 31,500 31,500
RO02 Commercial Golf Course Irrigation 30,000 0.7 21,000 21,000
RO02 Commercial Other - Commercial 150,322 1 150,322 150,322
RO02 Industrial Aggregate Washing 298,442 0.25 74,610 74,610
RO02 Industrial Other - Industrial 2,650 0.25 662 662
RO02 Livestock Watering Livestock Watering 867 0.3 260 260
RO02 Livestock Watering Livestock Watering 867 0.3 260 260
RO02 Livestock Watering Livestock Watering 1,278 0.3 383 383
RO02 Livestock Watering Livestock Watering 999 0.3 300 300
RO02 Livestock Watering Livestock Watering 1,532 0.3 460 460
RO02 Livestock Watering Livestock Watering 1,332 0.3 400 400
RO02 Livestock Watering Livestock Watering 76 0.3 23 23
RO02 Livestock Watering Livestock Watering 569 0.3 171 171
RO02 Livestock Watering Livestock Watering 569 0.3 171 171
RO02 Lumped Domestic Lumped Domestic 1,322,261 0.2 264,452 264,452
RO02 Miscellaneous Other - Miscellaneous 161 1 161 161
RO02 Municipal Water Supply 481,070 1 481,070 524,366
RO02 Municipal Water Supply 425,590 1 425,590 463,893
RO02 Recreational Aesthetics 10,474 0.25 2,619 2,619
RO02 Recreational Aesthetics 10,474 0.25 2,619 2,619
RO02 Recreational Aesthetics 10,474 0.25 2,619 2,619
RO02 Recreational Aesthetics 10,474 0.25 2,619 2,619
RO02 Recreational Aesthetics 10,474 0.25 2,619 2,619
RO02 Recreational Aesthetics 10,474 0.25 2,619 2,619
RO02 Recreational Aesthetics 10,474 0.25 2,619 2,619
RO02 Recreational Aesthetics 10,474 0.25 2,619 2,619
RO02 Recreational Aesthetics 10,474 0.25 2,619 2,619
RO02 Unknown Unknown 76 1 76 76
RO02 Unknown Unknown 76 1 76 76
RO02 Unknown Unknown 76 1 76 76

Approved January 18, 2012 C2-50
Approved Assessment Report: Toronto and Region Source Protection Area
Sub-watershed
Category Specific UseEstimated
Usage (m3/yr)
Consum. Factor
Current Consumptive Use (m3/yr)
2031 Consumptive Use (m3/yr)
RO02 Unknown Unknown 76 1 76 76
RO03 Agricultural Nursery 3,895 0.9 3,506 3,506
RO03 Agricultural Other - Agricultural 76 0.8 61 61
RO03 Agricultural Sod Farm 2,059 0.9 1,853 1,853
RO03 Commercial Golf Course Irrigation 273 0.7 191 191
RO03 Lumped Domestic Lumped Domestic 146,307 0.2 29,261 29,261
RO03 Miscellaneous Wildlife Conservation - 0.1 - -
RO04 Industrial Aggregate Washing 162,750 0.25 40,688 40,688
RO04 Industrial Cooling Water - 0.25 - -
RO04 Livestock Watering Livestock Watering 37 0.3 11 11
RO04 Lumped Domestic Lumped Domestic 445 0.2 89 89
RO05 Agricultural Nursery 40,410 0.9 36,369 36,369
RO05 Agricultural Nursery 398 0.9 358 358
RO05 Agricultural Nursery 3,456 0.9 3,110 3,110
RO05 Agricultural Nursery 3,895 0.9 3,506 3,506
RO05 Commercial Golf Course Irrigation 85,172 0.7 59,620 59,620
RO05 Livestock Watering Livestock Watering 240 0.3 72 72
RO05 Lumped Domestic Lumped Domestic 661,905 0.2 132,381 132,381
RO05 Miscellaneous Other - Miscellaneous 161 1 161 161
RO06 Commercial Golf Course Irrigation 27,255 0.7 19,078 19,078
RO06 Commercial Golf Course Irrigation 52,800 0.7 36,960 36,960
RO06 Commercial Golf Course Irrigation 30,000 0.7 21,000 21,000
RO06 Livestock Watering Livestock Watering 277 0.3 83 83
RO06 Livestock Watering Livestock Watering 569 0.3 171 171
RO06 Lumped Domestic Lumped Domestic 429,792 0.2 85,958 85,958
RO06 Miscellaneous Wildlife Conservation - 0.1 - -
RO07 Agricultural Other - Agricultural 5,724 0.8 4,579 4,579
RO07 Commercial Golf Course Irrigation 58,871 0.7 41,209 41,209
RO07 Commercial Golf Course Irrigation 55,600 0.7 38,920 38,920
RO07 Commercial Golf Course Irrigation 113,562 0.7 79,494 79,494
RO07 Commercial Golf Course Irrigation 98,118 0.7 68,682 68,682
RO07 Livestock Watering Livestock Watering 73,000 0.3 21,900 21,900
RO07 Livestock Watering Livestock Watering 347 0.3 104 104
RO07 Livestock Watering Livestock Watering 996 0.3 299 299

Approved January 18, 2012C2-51
Appendix C: Conceptual Water Budget
Sub-watershed
Category Specific UseEstimated
Usage (m3/yr)
Consum. Factor
Current Consumptive Use (m3/yr)
2031 Consumptive Use (m3/yr)
RO07 Livestock Watering Livestock Watering 399 0.3 120 120
RO07 Livestock Watering Livestock Watering 433 0.3 130 130
RO07 Livestock Watering Livestock Watering 483 0.3 145 145
RO07 Lumped Domestic Lumped Domestic 251,819 0.2 50,364 50,364
PE01 Lumped Domestic Lumped Domestic 56,965 0.2 11,393 11,393
FR01 Lumped Domestic Lumped Domestic 11,713 0.2 2,343 2,343
DU01 Agricultural Sod Farm 2,059 0.9 1,853 1,853
DU01 Livestock Watering Livestock Watering 566 0.3 170 170
DU01 Lumped Domestic Lumped Domestic 25,509 0.2 5,102 5,102
DU02 Livestock Watering Livestock Watering 569 0.3 171 171
DU02 Lumped Domestic Lumped Domestic 57,584 0.2 11,517 11,517
DU02 Remediation Other - Remediation 601,812 1 601,812 601,812
DU03 Agricultural Market Gardens/Flowers 4,406 0.9 3,966 3,966
DU03 Agricultural Market Gardens / Flowers 1,382 0.9 1,244 1,244
DU03 Agricultural Nursery 64,806 0.9 58,326 58,326
DU03 Agricultural Nursery 3,895 0.9 3,506 3,506
DU03 Commercial Cemetery Irrigation 150 0.7 105 105
DU03 Commercial Cemetery Irrigation 2,333 0.7 1,633 1,633
DU03 Commercial Cemetery Irrigation 2,128 0.7 1,489 1,489
DU03 Commercial Golf Course Irrigation 91,500 0.7 64,050 64,050
DU03 Livestock Watering Livestock Watering 347 0.3 104 104
DU03 Livestock Watering Livestock Watering 622 0.3 187 187
DU03 Livestock Watering Livestock Watering 572 0.3 172 172
DU03 Lumped Domestic Lumped Domestic 116,735 0.2 23,347 23,347
DU04 Agricultural Nursery 3,454 0.9 3,109 3,109
DU04 Agricultural Other - Agricultural 5,724 0.8 4,579 4,579
DU04 Agricultural Sod Farm 2,059 0.9 1,853 1,853
DU04 Commercial Snowmaking 1,044,067 0.5 522,034 522,034
DU04 Livestock Watering Livestock Watering 221 0.3 66 66
DU04 Livestock Watering Livestock Watering 365 0.3 110 110
DU04 Livestock Watering Livestock Watering 569 0.3 171 171
DU04 Livestock Watering Livestock Watering 569 0.3 171 171
DU04 Livestock Watering Livestock Watering 569 0.3 171 171
DU04 Livestock Watering Livestock Watering 569 0.3 171 171

Approved January 18, 2012 C2-52
Approved Assessment Report: Toronto and Region Source Protection Area
Sub-watershed
Category Specific UseEstimated
Usage (m3/yr)
Consum. Factor
Current Consumptive Use (m3/yr)
2031 Consumptive Use (m3/yr)
DU04 Livestock Watering Livestock Watering 569 0.3 171 171
DU04 Livestock Watering Livestock Watering 569 0.3 171 171
DU04 Lumped Domestic Lumped Domestic 244,088 0.2 48,818 48,818
DU05 Agricultural Nursery 5,527 0.9 4,974 4,974
DU05 Agricultural Nursery 3,895 0.9 3,506 3,506
DU05 Commercial Golf Course Irrigation 102,330 0.7 71,631 71,631
DU05 Commercial Golf Course Irrigation 707,040 0.7 494,928 494,928
DU05 Commercial Other - Commercial 19,080 1 19,080 19,080
DU05 Industrial Aggregate Washing 42,979 0.25 10,745 10,745
DU05 Livestock Watering Livestock Watering 691 0.3 207 207
DU05 Livestock Watering Livestock Watering 110 0.3 33 33
DU05 Livestock Watering Livestock Watering 569 0.3 171 171
DU05 Lumped Domestic Lumped Domestic 100,011 0.2 20,002 20,002
DU05 Recreational Aesthetics 10,474 0.25 2,619 2,619
DU05 Water Supply Other - Water Supply 366,608 0.2 73,322 73,322
DU06 Agricultural Nursery 3,895 0.9 3,506 3,506
DU06 Agricultural Nursery 3,895 0.9 3,506 3,506
DU06 Agricultural Nursery 3,895 0.9 3,506 3,506
DU06 Agricultural Sod Farm 2,059 0.9 1,853 1,853
DU06 Commercial Golf Course Irrigation 48,989 0.7 34,292 34,292
DU06 Industrial Aggregate Washing 433,109 0.25 108,277 108,277
DU06 Livestock Watering Livestock Watering 3,833 0.3 1,150 1,150
DU06 Lumped Domestic Lumped Domestic 100,544 0.2 20,109 20,109
DU06 Municipal Water Supply 315,360 1 315,360 409,968
DU06 Municipal Water Supply 373,395 1 373,395 485,414
DU06 Municipal Water Supply 553,340 1 553,340 719,342
DU06 Municipal Water Supply 12,097 0.2 2,419 7,258
DU06 Municipal Water Supply 964 0.2 193 579
CA01 Agricultural Market Gardens / Flowers 8,789 0.9 7,910 7,910
CA01 Agricultural Nursery 3,895 0.9 3,506 3,506
CA01 Agricultural Other - Agricultural 99,481 0.8 79,584 79,584
CA01 Commercial Golf Course Irrigation 22,456 0.7 15,719 15,719
CA01 Livestock Watering Livestock Watering 569 0.3 171 171
CA01 Livestock Watering Livestock Watering 569 0.3 171 171

Approved January 18, 2012C2-53
Appendix C: Conceptual Water Budget
Sub-watershed
Category Specific UseEstimated
Usage (m3/yr)
Consum. Factor
Current Consumptive Use (m3/yr)
2031 Consumptive Use (m3/yr)
CA01 Livestock Watering Livestock Watering 569 0.3 171 171
CA01 Lumped Domestic Lumped Domestic 58,545 0.2 11,709 11,709
LO01 Dewatering Other - Dewatering 1,450,656 1 1,450,656 1,450,656
LO02 Dewatering Other - Dewatering 471,744 1 471,744 471,744
LO02 Remediation Other - Remediation 212,342 1 212,342 212,342
LO03 Commercial Golf Course Irrigation 200,310 0.7 140,217 140,217
LO03 Remediation Groundwater 604,440 1 604,440 604,440
Table C-16: Current Water use estimates by subwatershed
SubshedJan m3/s
Feb m3/s
Mar m3/s
Apr m3/s
May m3/s
Jun m3/s
Jul m3/s
Aug m3/s
Sep m3/s
Oct m3/s
Nov m3/s
Dec m3/s
Annual
m3/s
ET01 0.0000 0.0000 0.0000 0.0000 0.0000 0.0000 0.0000 0.0000 0.0000 0.0000 0.0000 0.0000 0.0000
ET02 0.0000 0.0000 0.0000 0.0000 0.0000 0.0000 0.0000 0.0000 0.0000 0.0000 0.0000 0.0000 0.0000
ET03 0.0007 0.0007 0.0007 0.0007 0.0007 0.0007 0.0007 0.0007 0.0007 0.0007 0.0007 0.0007 0.0007
ET04 0.0024 0.0027 0.0024 0.0025 0.0024 0.0028 0.0043 0.0043 0.0028 0.0024 0.0025 0.0024 0.0028
MI01 0.0000 0.0000 0.0000 0.0000 0.0000 0.0000 0.0000 0.0000 0.0000 0.0000 0.0000 0.0000 0.0000
MI02 0.0000 0.0000 0.0000 0.0000 0.0000 0.0000 0.0000 0.0000 0.0000 0.0000 0.0000 0.0000 0.0000
MI03 0.0000 0.0000 0.0000 0.0000 0.0000 0.0000 0.0000 0.0000 0.0000 0.0000 0.0000 0.0000 0.0000
HU01 0.0284 0.0314 0.0284 0.0293 0.0284 0.0294 0.0285 0.0285 0.0294 0.0284 0.0293 0.0284 0.0290
HU02 0.0014 0.0015 0.0014 0.0014 0.0014 0.0014 0.0014 0.0014 0.0014 0.0014 0.0014 0.0014 0.0014
HU03 0.0008 0.0009 0.0008 0.0008 0.0008 0.0056 0.0055 0.0055 0.0056 0.0008 0.0008 0.0008 0.0024
HU04 0.0010 0.0011 0.0010 0.0010 0.0010 0.0031 0.0050 0.0050 0.0031 0.0010 0.0010 0.0010 0.0020
HU05 0.0224 0.0248 0.0224 0.0231 0.0224 0.0256 0.0523 0.0523 0.0256 0.0224 0.0231 0.0224 0.0283
HU06 0.0069 0.0077 0.0069 0.0071 0.0069 0.0073 0.0165 0.0165 0.0073 0.0069 0.0071 0.0069 0.0087
HU07 0.0216 0.0239 0.0216 0.0223 0.0216 0.0273 0.0322 0.0322 0.0273 0.0216 0.0223 0.0216 0.0246
HU08 0.0036 0.0040 0.0036 0.0037 0.0036 0.0116 0.0112 0.0112 0.0116 0.0036 0.0037 0.0036 0.0063
HU09 0.0033 0.0036 0.0033 0.0034 0.0033 0.0072 0.0414 0.0414 0.0072 0.0033 0.0034 0.0033 0.0104
HU10 0.0018 0.0020 0.0018 0.0018 0.0018 0.0018 0.0031 0.0031 0.0018 0.0018 0.0018 0.0018 0.0021
HU11 0.0043 0.0048 0.0043 0.0045 0.0043 0.0045 0.0044 0.0044 0.0045 0.0043 0.0045 0.0043 0.0044
HU12 0.0024 0.0026 0.0024 0.0024 0.0024 0.0024 0.0032 0.0032 0.0024 0.0024 0.0024 0.0024 0.0026
DO01 0.0005 0.0006 0.0005 0.0005 0.0005 0.0005 0.0005 0.0005 0.0005 0.0005 0.0005 0.0005 0.0005
DO02 0.0000 0.0000 0.0000 0.0000 0.0000 0.0000 0.0000 0.0000 0.0000 0.0000 0.0000 0.0000 0.0000
DO03 0.0033 0.0036 0.0033 0.0034 0.0033 0.0034 0.0033 0.0033 0.0034 0.0033 0.0034 0.0033 0.0033
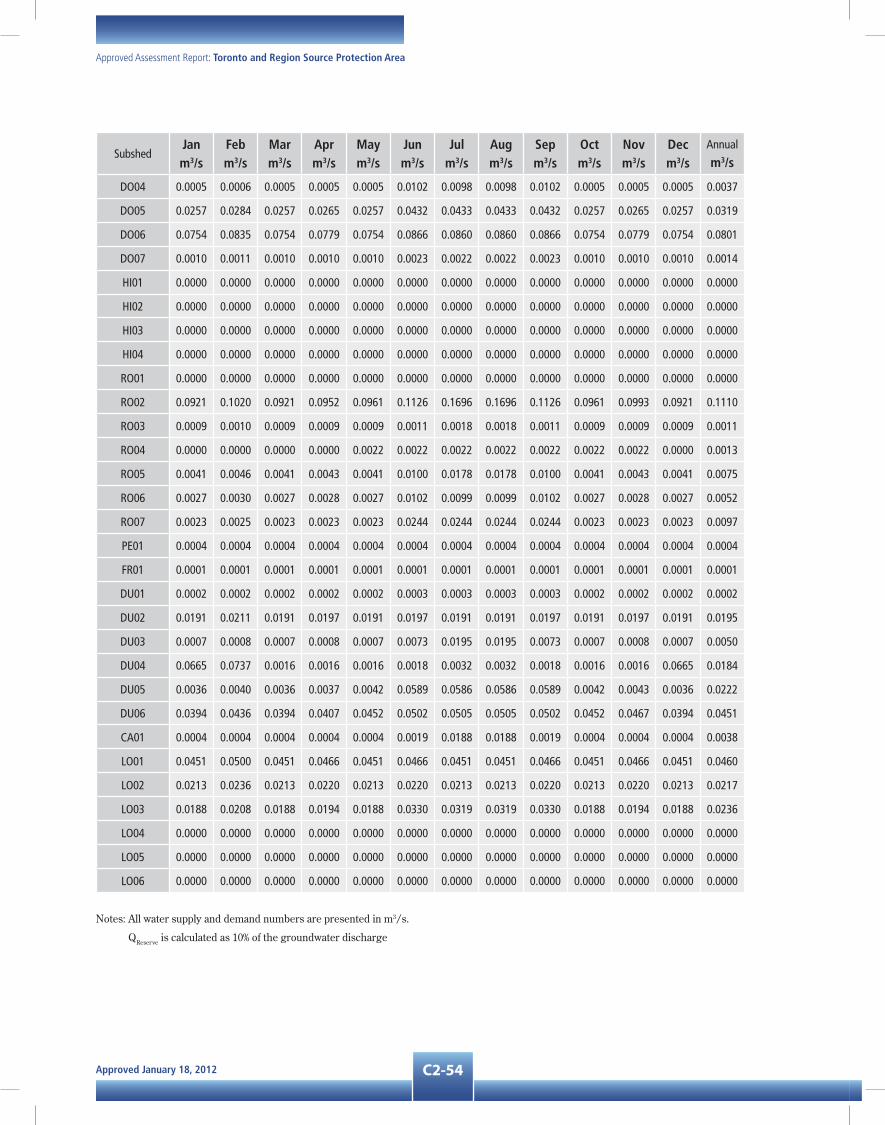
Approved January 18, 2012 C2-54
Approved Assessment Report: Toronto and Region Source Protection Area
SubshedJan m3/s
Feb m3/s
Mar m3/s
Apr m3/s
May m3/s
Jun m3/s
Jul m3/s
Aug m3/s
Sep m3/s
Oct m3/s
Nov m3/s
Dec m3/s
Annual
m3/s
DO04 0.0005 0.0006 0.0005 0.0005 0.0005 0.0102 0.0098 0.0098 0.0102 0.0005 0.0005 0.0005 0.0037
DO05 0.0257 0.0284 0.0257 0.0265 0.0257 0.0432 0.0433 0.0433 0.0432 0.0257 0.0265 0.0257 0.0319
DO06 0.0754 0.0835 0.0754 0.0779 0.0754 0.0866 0.0860 0.0860 0.0866 0.0754 0.0779 0.0754 0.0801
DO07 0.0010 0.0011 0.0010 0.0010 0.0010 0.0023 0.0022 0.0022 0.0023 0.0010 0.0010 0.0010 0.0014
HI01 0.0000 0.0000 0.0000 0.0000 0.0000 0.0000 0.0000 0.0000 0.0000 0.0000 0.0000 0.0000 0.0000
HI02 0.0000 0.0000 0.0000 0.0000 0.0000 0.0000 0.0000 0.0000 0.0000 0.0000 0.0000 0.0000 0.0000
HI03 0.0000 0.0000 0.0000 0.0000 0.0000 0.0000 0.0000 0.0000 0.0000 0.0000 0.0000 0.0000 0.0000
HI04 0.0000 0.0000 0.0000 0.0000 0.0000 0.0000 0.0000 0.0000 0.0000 0.0000 0.0000 0.0000 0.0000
RO01 0.0000 0.0000 0.0000 0.0000 0.0000 0.0000 0.0000 0.0000 0.0000 0.0000 0.0000 0.0000 0.0000
RO02 0.0921 0.1020 0.0921 0.0952 0.0961 0.1126 0.1696 0.1696 0.1126 0.0961 0.0993 0.0921 0.1110
RO03 0.0009 0.0010 0.0009 0.0009 0.0009 0.0011 0.0018 0.0018 0.0011 0.0009 0.0009 0.0009 0.0011
RO04 0.0000 0.0000 0.0000 0.0000 0.0022 0.0022 0.0022 0.0022 0.0022 0.0022 0.0022 0.0000 0.0013
RO05 0.0041 0.0046 0.0041 0.0043 0.0041 0.0100 0.0178 0.0178 0.0100 0.0041 0.0043 0.0041 0.0075
RO06 0.0027 0.0030 0.0027 0.0028 0.0027 0.0102 0.0099 0.0099 0.0102 0.0027 0.0028 0.0027 0.0052
RO07 0.0023 0.0025 0.0023 0.0023 0.0023 0.0244 0.0244 0.0244 0.0244 0.0023 0.0023 0.0023 0.0097
PE01 0.0004 0.0004 0.0004 0.0004 0.0004 0.0004 0.0004 0.0004 0.0004 0.0004 0.0004 0.0004 0.0004
FR01 0.0001 0.0001 0.0001 0.0001 0.0001 0.0001 0.0001 0.0001 0.0001 0.0001 0.0001 0.0001 0.0001
DU01 0.0002 0.0002 0.0002 0.0002 0.0002 0.0003 0.0003 0.0003 0.0003 0.0002 0.0002 0.0002 0.0002
DU02 0.0191 0.0211 0.0191 0.0197 0.0191 0.0197 0.0191 0.0191 0.0197 0.0191 0.0197 0.0191 0.0195
DU03 0.0007 0.0008 0.0007 0.0008 0.0007 0.0073 0.0195 0.0195 0.0073 0.0007 0.0008 0.0007 0.0050
DU04 0.0665 0.0737 0.0016 0.0016 0.0016 0.0018 0.0032 0.0032 0.0018 0.0016 0.0016 0.0665 0.0184
DU05 0.0036 0.0040 0.0036 0.0037 0.0042 0.0589 0.0586 0.0586 0.0589 0.0042 0.0043 0.0036 0.0222
DU06 0.0394 0.0436 0.0394 0.0407 0.0452 0.0502 0.0505 0.0505 0.0502 0.0452 0.0467 0.0394 0.0451
CA01 0.0004 0.0004 0.0004 0.0004 0.0004 0.0019 0.0188 0.0188 0.0019 0.0004 0.0004 0.0004 0.0038
LO01 0.0451 0.0500 0.0451 0.0466 0.0451 0.0466 0.0451 0.0451 0.0466 0.0451 0.0466 0.0451 0.0460
LO02 0.0213 0.0236 0.0213 0.0220 0.0213 0.0220 0.0213 0.0213 0.0220 0.0213 0.0220 0.0213 0.0217
LO03 0.0188 0.0208 0.0188 0.0194 0.0188 0.0330 0.0319 0.0319 0.0330 0.0188 0.0194 0.0188 0.0236
LO04 0.0000 0.0000 0.0000 0.0000 0.0000 0.0000 0.0000 0.0000 0.0000 0.0000 0.0000 0.0000 0.0000
LO05 0.0000 0.0000 0.0000 0.0000 0.0000 0.0000 0.0000 0.0000 0.0000 0.0000 0.0000 0.0000 0.0000
LO06 0.0000 0.0000 0.0000 0.0000 0.0000 0.0000 0.0000 0.0000 0.0000 0.0000 0.0000 0.0000 0.0000
Notes: All water supply and demand numbers are presented in m3/s.
QReserve is calculated as 10% of the groundwater discharge

Approved January 18, 2012C2-55
Appendix C: Conceptual Water Budget
Table C-17: future Water use estimates by subwatershed
SubshedJan m3/s
Feb m3/s
Mar m3/s
Apr m3/s
May m3/s
Jun m3/s
Jul m3/s
Aug m3/s
Sep m3/s
Oct m3/s
Nov m3/s
Dec m3/s
Annual
m3/s
ET01 0.0000 0.0000 0.0000 0.0000 0.0000 0.0000 0.0000 0.0000 0.0000 0.0000 0.0000 0.0000 0.0000
ET02 0.0000 0.0000 0.0000 0.0000 0.0000 0.0000 0.0000 0.0000 0.0000 0.0000 0.0000 0.0000 0.0000
ET03 0.0007 0.0007 0.0007 0.0007 0.0007 0.0007 0.0007 0.0007 0.0007 0.0007 0.0007 0.0007 0.0007
ET04 0.0024 0.0027 0.0024 0.0025 0.0024 0.0028 0.0043 0.0043 0.0028 0.0024 0.0025 0.0024 0.0028
MI01 0.0000 0.0000 0.0000 0.0000 0.0000 0.0000 0.0000 0.0000 0.0000 0.0000 0.0000 0.0000 0.0000
MI02 0.0000 0.0000 0.0000 0.0000 0.0000 0.0000 0.0000 0.0000 0.0000 0.0000 0.0000 0.0000 0.0000
MI03 0.0000 0.0000 0.0000 0.0000 0.0000 0.0000 0.0000 0.0000 0.0000 0.0000 0.0000 0.0000 0.0000
HU01 0.0284 0.0314 0.0284 0.0293 0.0284 0.0294 0.0285 0.0285 0.0294 0.0284 0.0293 0.0284 0.0290
HU02 0.0014 0.0015 0.0014 0.0014 0.0014 0.0014 0.0014 0.0014 0.0014 0.0014 0.0014 0.0014 0.0014
HU03 0.0008 0.0009 0.0008 0.0008 0.0008 0.0056 0.0055 0.0055 0.0056 0.0008 0.0008 0.0008 0.0024
HU04 0.0010 0.0011 0.0010 0.0010 0.0010 0.0031 0.0050 0.0050 0.0031 0.0010 0.0010 0.0010 0.0020
HU05 0.0052 0.0058 0.0052 0.0054 0.0052 0.0078 0.0351 0.0351 0.0078 0.0052 0.0054 0.0052 0.0108
HU06 0.0060 0.0066 0.0060 0.0062 0.0060 0.0064 0.0156 0.0156 0.0064 0.0060 0.0062 0.0060 0.0078
HU07 0.0060 0.0066 0.0060 0.0062 0.0060 0.0113 0.0166 0.0166 0.0113 0.0060 0.0062 0.0060 0.0087
HU08 0.0070 0.0078 0.0070 0.0073 0.0070 0.0151 0.0146 0.0146 0.0151 0.0070 0.0073 0.0070 0.0097
HU09 0.0033 0.0036 0.0033 0.0034 0.0033 0.0072 0.0414 0.0414 0.0072 0.0033 0.0034 0.0033 0.0104
HU10 0.0066 0.0073 0.0066 0.0068 0.0066 0.0068 0.0079 0.0079 0.0068 0.0066 0.0068 0.0066 0.0070
HU11 0.0081 0.0090 0.0081 0.0084 0.0081 0.0084 0.0082 0.0082 0.0084 0.0081 0.0084 0.0081 0.0083
HU12 0.0026 0.0029 0.0026 0.0027 0.0026 0.0027 0.0035 0.0035 0.0027 0.0026 0.0027 0.0026 0.0028
DO01 0.0005 0.0006 0.0005 0.0005 0.0005 0.0005 0.0005 0.0005 0.0005 0.0005 0.0005 0.0005 0.0005
DO02 0.0000 0.0000 0.0000 0.0000 0.0000 0.0000 0.0000 0.0000 0.0000 0.0000 0.0000 0.0000 0.0000
DO03 0.0033 0.0036 0.0033 0.0034 0.0033 0.0034 0.0033 0.0033 0.0034 0.0033 0.0034 0.0033 0.0033
DO04 0.0005 0.0006 0.0005 0.0005 0.0005 0.0102 0.0098 0.0098 0.0102 0.0005 0.0005 0.0005 0.0037
DO05 0.0257 0.0284 0.0257 0.0265 0.0257 0.0432 0.0433 0.0433 0.0432 0.0257 0.0265 0.0257 0.0319
DO06 0.0754 0.0835 0.0754 0.0779 0.0754 0.0866 0.0860 0.0860 0.0866 0.0754 0.0779 0.0754 0.0801
DO07 0.0010 0.0011 0.0010 0.0010 0.0010 0.0023 0.0022 0.0022 0.0023 0.0010 0.0010 0.0010 0.0014
HI01 0.0000 0.0000 0.0000 0.0000 0.0000 0.0000 0.0000 0.0000 0.0000 0.0000 0.0000 0.0000 0.0000
HI02 0.0000 0.0000 0.0000 0.0000 0.0000 0.0000 0.0000 0.0000 0.0000 0.0000 0.0000 0.0000 0.0000
HI03 0.0000 0.0000 0.0000 0.0000 0.0000 0.0000 0.0000 0.0000 0.0000 0.0000 0.0000 0.0000 0.0000
HI04 0.0000 0.0000 0.0000 0.0000 0.0000 0.0000 0.0000 0.0000 0.0000 0.0000 0.0000 0.0000 0.0000
RO01 0.0000 0.0000 0.0000 0.0000 0.0000 0.0000 0.0000 0.0000 0.0000 0.0000 0.0000 0.0000 0.0000
RO02 0.0947 0.1048 0.0947 0.0978 0.0986 0.1152 0.1722 0.1722 0.1152 0.0986 0.1019 0.0947 0.1140
RO03 0.0009 0.0010 0.0009 0.0009 0.0009 0.0011 0.0018 0.0018 0.0011 0.0009 0.0009 0.0009 0.0011

Approved January 18, 2012 C2-56
Approved Assessment Report: Toronto and Region Source Protection Area
SubshedJan m3/s
Feb m3/s
Mar m3/s
Apr m3/s
May m3/s
Jun m3/s
Jul m3/s
Aug m3/s
Sep m3/s
Oct m3/s
Nov m3/s
Dec m3/s
Annual
m3/s
RO04 0.0000 0.0000 0.0000 0.0000 0.0022 0.0022 0.0022 0.0022 0.0022 0.0022 0.0022 0.0000 0.0013
RO05 0.0041 0.0046 0.0041 0.0043 0.0041 0.0100 0.0178 0.0178 0.0100 0.0041 0.0043 0.0041 0.0075
RO06 0.0027 0.0030 0.0027 0.0028 0.0027 0.0102 0.0099 0.0099 0.0102 0.0027 0.0028 0.0027 0.0052
RO07 0.0023 0.0025 0.0023 0.0023 0.0023 0.0244 0.0244 0.0244 0.0244 0.0023 0.0023 0.0023 0.0097
PE01 0.0004 0.0004 0.0004 0.0004 0.0004 0.0004 0.0004 0.0004 0.0004 0.0004 0.0004 0.0004 0.0004
FR01 0.0001 0.0001 0.0001 0.0001 0.0001 0.0001 0.0001 0.0001 0.0001 0.0001 0.0001 0.0001 0.0001
DU01 0.0002 0.0002 0.0002 0.0002 0.0002 0.0003 0.0003 0.0003 0.0003 0.0002 0.0002 0.0002 0.0002
DU02 0.0191 0.0211 0.0191 0.0197 0.0191 0.0197 0.0191 0.0191 0.0197 0.0191 0.0197 0.0191 0.0195
DU03 0.0007 0.0008 0.0007 0.0008 0.0007 0.0073 0.0195 0.0195 0.0073 0.0007 0.0008 0.0007 0.0050
DU04 0.0665 0.0737 0.0016 0.0016 0.0016 0.0018 0.0032 0.0032 0.0018 0.0016 0.0016 0.0665 0.0184
DU05 0.0036 0.0040 0.0036 0.0037 0.0042 0.0589 0.0586 0.0586 0.0589 0.0042 0.0043 0.0036 0.0222
DU06 0.0511 0.0566 0.0511 0.0528 0.0569 0.0623 0.0623 0.0623 0.0623 0.0569 0.0588 0.0511 0.0570
CA01 0.0004 0.0004 0.0004 0.0004 0.0004 0.0019 0.0188 0.0188 0.0019 0.0004 0.0004 0.0004 0.0038
LO01 0.0451 0.0500 0.0451 0.0466 0.0451 0.0466 0.0451 0.0451 0.0466 0.0451 0.0466 0.0451 0.0460
LO02 0.0213 0.0236 0.0213 0.0220 0.0213 0.0220 0.0213 0.0213 0.0220 0.0213 0.0220 0.0213 0.0217
LO03 0.0188 0.0208 0.0188 0.0194 0.0188 0.0330 0.0319 0.0319 0.0330 0.0188 0.0194 0.0188 0.0236
LO04 0.0000 0.0000 0.0000 0.0000 0.0000 0.0000 0.0000 0.0000 0.0000 0.0000 0.0000 0.0000 0.0000
LO05 0.0000 0.0000 0.0000 0.0000 0.0000 0.0000 0.0000 0.0000 0.0000 0.0000 0.0000 0.0000 0.0000
LO06 0.0000 0.0000 0.0000 0.0000 0.0000 0.0000 0.0000 0.0000 0.0000 0.0000 0.0000 0.0000 0.0000
Table C-18: groundwater stress assessment (Current Conditions, January)
WatershedSub-
watershedArea (km2)
QR (m3/s)
QIN (m3/s)
QReserve (m3/s)
QSupply (m3/s)
QDemand
(m3/s)
% Groundwater
Demand
Groundwater Stress
Assignment
Etobicoke
ET01 34,156,179 0.078 0.072 0.012 0.151 0.000 0% Low
ET02 25,131,283 0.067 0.041 0.007 0.108 0.000 0% Low
ET03 50,208,414 0.181 0.073 0.018 0.254 0.001 0% Low
ET04 102,829,189 0.338 0.091 0.028 0.429 0.002 1% Low
Mimico
MI01 41,550,870 0.104 0.031 0.011 0.136 0.000 0% Low
MI02 13,654,309 0.038 0.022 0.003 0.060 0.000 0% Low
MI03 23,283,286 0.060 0.026 0.005 0.087 0.000 0% Low

Approved January 18, 2012C2-57
Appendix C: Conceptual Water Budget
WatershedSub-
watershedArea (km2)
QR (m3/s)
QIN (m3/s)
QReserve (m3/s)
QSupply (m3/s)
QDemand
(m3/s)
% Groundwater
Demand
Groundwater Stress
Assignment
Humber
HU01 88,712,024 0.261 0.272 0.037 0.533 0.028 6% Low
HU02 60,693,407 0.198 0.133 0.017 0.331 0.001 0% Low
HU03 97,672,514 0.294 0.144 0.028 0.438 0.001 0% Low
HU04 106,770,045 0.281 0.117 0.024 0.398 0.001 0% Low
HU05 92,392,586 0.250 0.280 0.037 0.529 0.022 5% Low
HU06 71,585,430 0.249 0.513 0.046 0.761 0.007 1% Low
HU07 93,818,968 0.637 0.254 0.018 0.891 0.022 2% Low
HU08 30,940,908 0.203 0.212 0.009 0.415 0.004 1% Low
HU09 64,762,224 0.405 0.141 0.025 0.546 0.003 1% Low
HU10 47,760,614 0.260 0.349 0.042 0.610 0.002 0% Low
HU11 47,108,648 0.351 0.176 0.024 0.527 0.004 1% Low
HU12 108,051,916 0.942 0.207 0.107 1.149 0.002 0% Low
Don
DO01 38,272,626 0.137 0.121 0.017 0.258 0.001 0% Low
DO02 33,770,602 0.112 0.139 0.002 0.250 0.000 0% Low
DO03 53,719,251 0.182 0.387 0.028 0.569 0.003 1% Low
DO04 63,874,250 0.249 0.295 0.039 0.544 0.001 0% Low
DO05 58,084,448 0.209 0.270 0.013 0.479 0.026 6% Low
DO06 63,354,811 0.328 0.255 0.031 0.583 0.075 14% Low
DO07 41,736,638 0.164 0.232 0.012 0.395 0.001 0% Low
Highland
HI01 8,943,868 0.028 0.049 0.000 0.076 0.000 0% Low
HI02 10,753,908 0.032 0.121 0.010 0.153 0.000 0% Low
HI03 49,512,432 0.182 0.072 0.008 0.254 0.000 0% Low
HI04 35,886,310 0.127 0.140 0.010 0.267 0.000 0% Low
Rouge
RO01 3,625,105 0.010 0.041 0.003 0.051 0.000 0% Low
RO02 114,380,078 0.443 0.397 0.040 0.840 0.092 12% Low
RO03 63,942,168 0.222 0.319 0.030 0.541 0.001 0% Low
RO04 44,531,561 0.145 0.236 0.016 0.381 0.000 0% Low
RO05 39,891,225 0.205 0.226 0.023 0.431 0.004 1% Low
RO06 30,637,450 0.117 0.283 0.012 0.400 0.003 1% Low
RO07 40,631,187 0.205 0.338 0.019 0.543 0.002 0% Low
Petticoat PE01 24,063,409 0.082 0.097 0.006 0.180 0.000 0% Low
Frenchman's Bay
FR01 25,024,806 0.090 0.036 0.004 0.126 0.000 0% Low

Approved January 18, 2012 C2-58
Approved Assessment Report: Toronto and Region Source Protection Area
WatershedSub-
watershedArea (km2)
QR (m3/s)
QIN (m3/s)
QReserve (m3/s)
QSupply (m3/s)
QDemand
(m3/s)
% Groundwater
Demand
Groundwater Stress
Assignment
Duffins
DU01 24,489,851 0.087 0.037 0.005 0.123 0.000 0% Low
DU02 53,061,108 0.190 0.284 0.026 0.474 0.019 4% Low
DU03 43,998,921 0.150 0.317 0.031 0.467 0.001 0% Low
DU04 62,548,890 0.362 0.355 0.044 0.717 0.067 10% Low
DU05 60,125,868 0.370 0.268 0.022 0.638 0.004 1% Low
DU06 39,513,589 0.192 0.160 0.010 0.353 0.039 11% Low
Carruthers CA01 39,204,411 0.131 0.109 0.016 0.240 0.000 0% Low
Lake Ontario
LO01 24,045,851 0.064 0.009 0.000 0.073 0.045 61% Significant
LO02 39,823,376 0.159 0.030 0.000 0.189 0.021 11% Low
LO03 23,973,922 0.062 0.082 0.000 0.143 0.019 13% Low
LO04 16,047,825 0.052 0.075 0.000 0.127 0.000 0% Low
LO05 4,816,221 0.017 0.011 0.000 0.027 0.000 0% Low
LO06 3,317,605 0.012 0.009 0.000 0.021 0.000 0% Low
Notes: All water supply and demand numbers are presented in m3/s.
QReserve is calculated as 10% of the groundwater discharge
Table C-19: groundwater stress assessment (Current Conditions, february)
WatershedSub-
watershedArea (km2)
QR (m3/s)
QIN (m3/s)
QReserve (m3/s)
QSupply (m3/s)
QDemand
(m3/s)
% Groundwater
Demand
Groundwater Stress
Assignment
Etobicoke
ET01 34,156,179 0.078 0.072 0.012 0.151 0.000 0% Low
ET02 25,131,283 0.067 0.041 0.007 0.108 0.000 0% Low
ET03 50,208,414 0.181 0.073 0.018 0.254 0.001 0% Low
ET04 102,829,189 0.338 0.091 0.028 0.429 0.003 1% Low
Mimico
MI01 41,550,870 0.104 0.031 0.011 0.136 0.000 0% Low
MI02 13,654,309 0.038 0.022 0.003 0.060 0.000 0% Low
MI03 23,283,286 0.060 0.026 0.005 0.087 0.000 0% Low

Approved January 18, 2012C2-59
Appendix C: Conceptual Water Budget
WatershedSub-
watershedArea (km2)
QR (m3/s)
QIN (m3/s)
QReserve (m3/s)
QSupply (m3/s)
QDemand
(m3/s)
% Groundwater
Demand
Groundwater Stress
Assignment
Humber
HU01 88,712,024 0.261 0.272 0.037 0.533 0.031 6% Low
HU02 60,693,407 0.198 0.133 0.017 0.331 0.002 0% Low
HU03 97,672,514 0.294 0.144 0.028 0.438 0.001 0% Low
HU04 106,770,045 0.281 0.117 0.024 0.398 0.001 0% Low
HU05 92,392,586 0.250 0.280 0.037 0.529 0.025 5% Low
HU06 71,585,430 0.249 0.513 0.046 0.761 0.008 1% Low
HU07 93,818,968 0.637 0.254 0.018 0.891 0.024 3% Low
HU08 30,940,908 0.203 0.212 0.009 0.415 0.004 1% Low
HU09 64,762,224 0.405 0.141 0.025 0.546 0.004 1% Low
HU10 47,760,614 0.260 0.349 0.042 0.610 0.002 0% Low
HU11 47,108,648 0.351 0.176 0.024 0.527 0.005 1% Low
HU12 108,051,916 0.942 0.207 0.107 1.149 0.003 0% Low
Don
DO01 38,272,626 0.137 0.121 0.017 0.258 0.001 0% Low
DO02 33,770,602 0.112 0.139 0.002 0.250 0.000 0% Low
DO03 53,719,251 0.182 0.387 0.028 0.569 0.004 1% Low
DO04 63,874,250 0.249 0.295 0.039 0.544 0.001 0% Low
DO05 58,084,448 0.209 0.270 0.013 0.479 0.028 6% Low
DO06 63,354,811 0.328 0.255 0.031 0.583 0.083 15% Low
DO07 41,736,638 0.164 0.232 0.012 0.395 0.001 0% Low
Highland
HI01 8,943,868 0.028 0.049 0.000 0.076 0.000 0% Low
HI02 10,753,908 0.032 0.121 0.010 0.153 0.000 0% Low
HI03 49,512,432 0.182 0.072 0.008 0.254 0.000 0% Low
HI04 35,886,310 0.127 0.140 0.010 0.267 0.000 0% Low
Rouge
RO01 3,625,105 0.010 0.041 0.003 0.051 0.000 0% Low
RO02 114,380,078 0.443 0.397 0.040 0.840 0.102 13% Low
RO03 63,942,168 0.222 0.319 0.030 0.541 0.001 0% Low
RO04 44,531,561 0.145 0.236 0.016 0.381 0.000 0% Low
RO05 39,891,225 0.205 0.226 0.023 0.431 0.005 1% Low
RO06 30,637,450 0.117 0.283 0.012 0.400 0.003 1% Low
RO07 40,631,187 0.205 0.338 0.019 0.543 0.003 0% Low
Petticoat PE01 24,063,409 0.082 0.097 0.006 0.180 0.000 0% Low
Frenchman's Bay
FR01 25,024,806 0.090 0.036 0.004 0.126 0.000 0% Low

Approved January 18, 2012 C2-60
Approved Assessment Report: Toronto and Region Source Protection Area
WatershedSub-
watershedArea (km2)
QR (m3/s)
QIN (m3/s)
QReserve (m3/s)
QSupply (m3/s)
QDemand
(m3/s)
% Groundwater
Demand
Groundwater Stress
Assignment
Duffins
DU01 24,489,851 0.087 0.037 0.005 0.123 0.000 0% Low
DU02 53,061,108 0.190 0.284 0.026 0.474 0.021 5% Low
DU03 43,998,921 0.150 0.317 0.031 0.467 0.001 0% Low
DU04 62,548,890 0.362 0.355 0.044 0.717 0.074 11% Low
DU05 60,125,868 0.370 0.268 0.022 0.638 0.004 1% Low
DU06 39,513,589 0.192 0.160 0.010 0.353 0.044 13% Low
Carruthers CA01 39,204,411 0.131 0.109 0.016 0.240 0.000 0% Low
Lake Ontario
LO01 24,045,851 0.064 0.009 0.000 0.073 0.050 68% Significant
LO02 39,823,376 0.159 0.030 0.000 0.189 0.024 12% Low
LO03 23,973,922 0.062 0.082 0.000 0.143 0.021 15% Low
LO04 16,047,825 0.052 0.075 0.000 0.127 0.000 0% Low
LO05 4,816,221 0.017 0.011 0.000 0.027 0.000 0% Low
LO06 3,317,605 0.012 0.009 0.000 0.021 0.000 0% Low
Notes: All water supply and demand numbers are presented in m3/s.
QReserve is calculated as 10% of the groundwater discharge
Table C-20: groundwater stress assessment (Current Conditions, March)
WatershedSub-
watershedArea (km2)
QR (m3/s)
QIN (m3/s)
QReserve (m3/s)
QSupply (m3/s)
QDemand
(m3/s)
% Groundwater
Demand
Groundwater Stress
Assignment
Etobicoke
ET01 34,156,179 0.078 0.072 0.012 0.151 0.000 0% Low
ET02 25,131,283 0.067 0.041 0.007 0.108 0.000 0% Low
ET03 50,208,414 0.181 0.073 0.018 0.254 0.001 0% Low
ET04 102,829,189 0.338 0.091 0.028 0.429 0.002 1% Low
Mimico
MI01 41,550,870 0.104 0.031 0.011 0.136 0.000 0% Low
MI02 13,654,309 0.038 0.022 0.003 0.060 0.000 0% Low
MI03 23,283,286 0.060 0.026 0.005 0.087 0.000 0% Low

Approved January 18, 2012C2-61
Appendix C: Conceptual Water Budget
WatershedSub-
watershedArea (km2)
QR (m3/s)
QIN (m3/s)
QReserve (m3/s)
QSupply (m3/s)
QDemand
(m3/s)
% Groundwater
Demand
Groundwater Stress
Assignment
Humber
HU01 88,712,024 0.261 0.272 0.037 0.533 0.028 6% Low
HU02 60,693,407 0.198 0.133 0.017 0.331 0.001 0% Low
HU03 97,672,514 0.294 0.144 0.028 0.438 0.001 0% Low
HU04 106,770,045 0.281 0.117 0.024 0.398 0.001 0% Low
HU05 92,392,586 0.250 0.280 0.037 0.529 0.022 5% Low
HU06 71,585,430 0.249 0.513 0.046 0.761 0.007 1% Low
HU07 93,818,968 0.637 0.254 0.018 0.891 0.022 2% Low
HU08 30,940,908 0.203 0.212 0.009 0.415 0.004 1% Low
HU09 64,762,224 0.405 0.141 0.025 0.546 0.003 1% Low
HU10 47,760,614 0.260 0.349 0.042 0.610 0.002 0% Low
HU11 47,108,648 0.351 0.176 0.024 0.527 0.004 1% Low
HU12 108,051,916 0.942 0.207 0.107 1.149 0.002 0% Low
Don
DO01 38,272,626 0.137 0.121 0.017 0.258 0.001 0% Low
DO02 33,770,602 0.112 0.139 0.002 0.250 0.000 0% Low
DO03 53,719,251 0.182 0.387 0.028 0.569 0.003 1% Low
DO04 63,874,250 0.249 0.295 0.039 0.544 0.001 0% Low
DO05 58,084,448 0.209 0.270 0.013 0.479 0.026 6% Low
DO06 63,354,811 0.328 0.255 0.031 0.583 0.075 14% Low
DO07 41,736,638 0.164 0.232 0.012 0.395 0.001 0% Low
Highland
HI01 8,943,868 0.028 0.049 0.000 0.076 0.000 0% Low
HI02 10,753,908 0.032 0.121 0.010 0.153 0.000 0% Low
HI03 49,512,432 0.182 0.072 0.008 0.254 0.000 0% Low
HI04 35,886,310 0.127 0.140 0.010 0.267 0.000 0% Low
Rouge
RO01 3,625,105 0.010 0.041 0.003 0.051 0.000 0% Low
RO02 114,380,078 0.443 0.397 0.040 0.840 0.092 12% Low
RO03 63,942,168 0.222 0.319 0.030 0.541 0.001 0% Low
RO04 44,531,561 0.145 0.236 0.016 0.381 0.000 0% Low
RO05 39,891,225 0.205 0.226 0.023 0.431 0.004 1% Low
RO06 30,637,450 0.117 0.283 0.012 0.400 0.003 1% Low
RO07 40,631,187 0.205 0.338 0.019 0.543 0.002 0% Low
Petticoat PE01 24,063,409 0.082 0.097 0.006 0.180 0.000 0% Low
Frenchman's Bay
FR01 25,024,806 0.090 0.036 0.004 0.126 0.000 0% Low

Approved January 18, 2012 C2-62
Approved Assessment Report: Toronto and Region Source Protection Area
WatershedSub-
watershedArea (km2)
QR (m3/s)
QIN (m3/s)
QReserve (m3/s)
QSupply (m3/s)
QDemand
(m3/s)
% Groundwater
Demand
Groundwater Stress
Assignment
Duffins
DU01 24,489,851 0.087 0.037 0.005 0.123 0.000 0% Low
DU02 53,061,108 0.190 0.284 0.026 0.474 0.019 4% Low
DU03 43,998,921 0.150 0.317 0.031 0.467 0.001 0% Low
DU04 62,548,890 0.362 0.355 0.044 0.717 0.002 0% Low
DU05 60,125,868 0.370 0.268 0.022 0.638 0.004 1% Low
DU06 39,513,589 0.192 0.160 0.010 0.353 0.039 11% Low
Carruthers CA01 39,204,411 0.131 0.109 0.016 0.240 0.000 0% Low
Lake Ontario
LO01 24,045,851 0.064 0.009 0.000 0.073 0.045 61% Significant
LO02 39,823,376 0.159 0.030 0.000 0.189 0.021 11% Low
LO03 23,973,922 0.062 0.082 0.000 0.143 0.019 13% Low
LO04 16,047,825 0.052 0.075 0.000 0.127 0.000 0% Low
LO05 4,816,221 0.017 0.011 0.000 0.027 0.000 0% Low
LO06 3,317,605 0.012 0.009 0.000 0.021 0.000 0% Low
Notes: All water supply and demand numbers are presented in m3/s.
QReserve is calculated as 10% of the groundwater discharge
Table C-21: groundwater stress assessment (Current Conditions, april)
WatershedSub-
watershedArea (km2)
QR (m3/s)
QIN (m3/s)
QReserve (m3/s)
QSupply (m3/s)
QDemand
(m3/s)
% Groundwater
Demand
Groundwater Stress
Assignment
Etobicoke
ET01 34,156,179 0.078 0.072 0.012 0.151 0.000 0% Low
ET02 25,131,283 0.067 0.041 0.007 0.108 0.000 0% Low
ET03 50,208,414 0.181 0.073 0.018 0.254 0.001 0% Low
ET04 102,829,189 0.338 0.091 0.028 0.429 0.003 1% Low
Mimico
MI01 41,550,870 0.104 0.031 0.011 0.136 0.000 0% Low
MI02 13,654,309 0.038 0.022 0.003 0.060 0.000 0% Low
MI03 23,283,286 0.060 0.026 0.005 0.087 0.000 0% Low

Approved January 18, 2012C2-63
Appendix C: Conceptual Water Budget
WatershedSub-
watershedArea (km2)
QR (m3/s)
QIN (m3/s)
QReserve (m3/s)
QSupply (m3/s)
QDemand
(m3/s)
% Groundwater
Demand
Groundwater Stress
Assignment
Humber
HU01 88,712,024 0.261 0.272 0.037 0.533 0.029 6% Low
HU02 60,693,407 0.198 0.133 0.017 0.331 0.001 0% Low
HU03 97,672,514 0.294 0.144 0.028 0.438 0.001 0% Low
HU04 106,770,045 0.281 0.117 0.024 0.398 0.001 0% Low
HU05 92,392,586 0.250 0.280 0.037 0.529 0.023 5% Low
HU06 71,585,430 0.249 0.513 0.046 0.761 0.007 1% Low
HU07 93,818,968 0.637 0.254 0.018 0.891 0.022 3% Low
HU08 30,940,908 0.203 0.212 0.009 0.415 0.004 1% Low
HU09 64,762,224 0.405 0.141 0.025 0.546 0.003 1% Low
HU10 47,760,614 0.260 0.349 0.042 0.610 0.002 0% Low
HU11 47,108,648 0.351 0.176 0.024 0.527 0.004 1% Low
HU12 108,051,916 0.942 0.207 0.107 1.149 0.002 0% Low
Don
DO01 38,272,626 0.137 0.121 0.017 0.258 0.001 0% Low
DO02 33,770,602 0.112 0.139 0.002 0.250 0.000 0% Low
DO03 53,719,251 0.182 0.387 0.028 0.569 0.003 1% Low
DO04 63,874,250 0.249 0.295 0.039 0.544 0.001 0% Low
DO05 58,084,448 0.209 0.270 0.013 0.479 0.027 6% Low
DO06 63,354,811 0.328 0.255 0.031 0.583 0.078 14% Low
DO07 41,736,638 0.164 0.232 0.012 0.395 0.001 0% Low
Highland
HI01 8,943,868 0.028 0.049 0.000 0.076 0.000 0% Low
HI02 10,753,908 0.032 0.121 0.010 0.153 0.000 0% Low
HI03 49,512,432 0.182 0.072 0.008 0.254 0.000 0% Low
HI04 35,886,310 0.127 0.140 0.010 0.267 0.000 0% Low
Rouge
RO01 3,625,105 0.010 0.041 0.003 0.051 0.000 0% Low
RO02 114,380,078 0.443 0.397 0.040 0.840 0.095 12% Low
RO03 63,942,168 0.222 0.319 0.030 0.541 0.001 0% Low
RO04 44,531,561 0.145 0.236 0.016 0.381 0.000 0% Low
RO05 39,891,225 0.205 0.226 0.023 0.431 0.004 1% Low
RO06 30,637,450 0.117 0.283 0.012 0.400 0.003 1% Low
RO07 40,631,187 0.205 0.338 0.019 0.543 0.002 0% Low
Petticoat PE01 24,063,409 0.082 0.097 0.006 0.180 0.000 0% Low
Frenchman's Bay
FR01 25,024,806 0.090 0.036 0.004 0.126 0.000 0% Low

Approved January 18, 2012 C2-64
Approved Assessment Report: Toronto and Region Source Protection Area
WatershedSub-
watershedArea (km2)
QR (m3/s)
QIN (m3/s)
QReserve (m3/s)
QSupply (m3/s)
QDemand
(m3/s)
% Groundwater
Demand
Groundwater Stress
Assignment
Duffins
DU01 24,489,851 0.087 0.037 0.005 0.123 0.000 0% Low
DU02 53,061,108 0.190 0.284 0.026 0.474 0.020 4% Low
DU03 43,998,921 0.150 0.317 0.031 0.467 0.001 0% Low
DU04 62,548,890 0.362 0.355 0.044 0.717 0.002 0% Low
DU05 60,125,868 0.370 0.268 0.022 0.638 0.004 1% Low
DU06 39,513,589 0.192 0.160 0.010 0.353 0.041 12% Low
Carruthers CA01 39,204,411 0.131 0.109 0.016 0.240 0.000 0% Low
Lake Ontario
LO01 24,045,851 0.064 0.009 0.000 0.073 0.047 64% Significant
LO02 39,823,376 0.159 0.030 0.000 0.189 0.022 12% Low
LO03 23,973,922 0.062 0.082 0.000 0.143 0.019 14% Low
LO04 16,047,825 0.052 0.075 0.000 0.127 0.000 0% Low
LO05 4,816,221 0.017 0.011 0.000 0.027 0.000 0% Low
LO06 3,317,605 0.012 0.009 0.000 0.021 0.000 0% Low
Notes: All water supply and demand numbers are presented in m3/s.
QReserve is calculated as 10% of the groundwater discharge
Table C-22: groundwater stress assessment (Current Conditions, May)
WatershedSub-
watershedArea (km2)
QR (m3/s)
QIN (m3/s)
QReserve (m3/s)
QSupply (m3/s)
QDemand
(m3/s)
% Groundwater
Demand
Groundwater Stress
Assignment
Etobicoke
ET01 34,156,179 0.078 0.072 0.012 0.151 0.000 0% Low
ET02 25,131,283 0.067 0.041 0.007 0.108 0.000 0% Low
ET03 50,208,414 0.181 0.073 0.018 0.254 0.001 0% Low
ET04 102,829,189 0.338 0.091 0.028 0.429 0.002 1% Low
Mimico
MI01 41,550,870 0.104 0.031 0.011 0.136 0.000 0% Low
MI02 13,654,309 0.038 0.022 0.003 0.060 0.000 0% Low
MI03 23,283,286 0.060 0.026 0.005 0.087 0.000 0% Low

Approved January 18, 2012C2-65
Appendix C: Conceptual Water Budget
WatershedSub-
watershedArea (km2)
QR (m3/s)
QIN (m3/s)
QReserve (m3/s)
QSupply (m3/s)
QDemand
(m3/s)
% Groundwater
Demand
Groundwater Stress
Assignment
Humber
HU01 88,712,024 0.261 0.272 0.037 0.533 0.028 6% Low
HU02 60,693,407 0.198 0.133 0.017 0.331 0.001 0% Low
HU03 97,672,514 0.294 0.144 0.028 0.438 0.001 0% Low
HU04 106,770,045 0.281 0.117 0.024 0.398 0.001 0% Low
HU05 92,392,586 0.250 0.280 0.037 0.529 0.022 5% Low
HU06 71,585,430 0.249 0.513 0.046 0.761 0.007 1% Low
HU07 93,818,968 0.637 0.254 0.018 0.891 0.022 2% Low
HU08 30,940,908 0.203 0.212 0.009 0.415 0.004 1% Low
HU09 64,762,224 0.405 0.141 0.025 0.546 0.003 1% Low
HU10 47,760,614 0.260 0.349 0.042 0.610 0.002 0% Low
HU11 47,108,648 0.351 0.176 0.024 0.527 0.004 1% Low
HU12 108,051,916 0.942 0.207 0.107 1.149 0.002 0% Low
Don
DO01 38,272,626 0.137 0.121 0.017 0.258 0.001 0% Low
DO02 33,770,602 0.112 0.139 0.002 0.250 0.000 0% Low
DO03 53,719,251 0.182 0.387 0.028 0.569 0.003 1% Low
DO04 63,874,250 0.249 0.295 0.039 0.544 0.001 0% Low
DO05 58,084,448 0.209 0.270 0.013 0.479 0.026 6% Low
DO06 63,354,811 0.328 0.255 0.031 0.583 0.075 14% Low
DO07 41,736,638 0.164 0.232 0.012 0.395 0.001 0% Low
Highland
HI01 8,943,868 0.028 0.049 0.000 0.076 0.000 0% Low
HI02 10,753,908 0.032 0.121 0.010 0.153 0.000 0% Low
HI03 49,512,432 0.182 0.072 0.008 0.254 0.000 0% Low
HI04 35,886,310 0.127 0.140 0.010 0.267 0.000 0% Low
Rouge
RO01 3,625,105 0.010 0.041 0.003 0.051 0.000 0% Low
RO02 114,380,078 0.443 0.397 0.040 0.840 0.096 12% Low
RO03 63,942,168 0.222 0.319 0.030 0.541 0.001 0% Low
RO04 44,531,561 0.145 0.236 0.016 0.381 0.002 1% Low
RO05 39,891,225 0.205 0.226 0.023 0.431 0.004 1% Low
RO06 30,637,450 0.117 0.283 0.012 0.400 0.003 1% Low
RO07 40,631,187 0.205 0.338 0.019 0.543 0.002 0% Low
Petticoat PE01 24,063,409 0.082 0.097 0.006 0.180 0.000 0% Low
Frenchman's Bay
FR01 25,024,806 0.090 0.036 0.004 0.126 0.000 0% Low
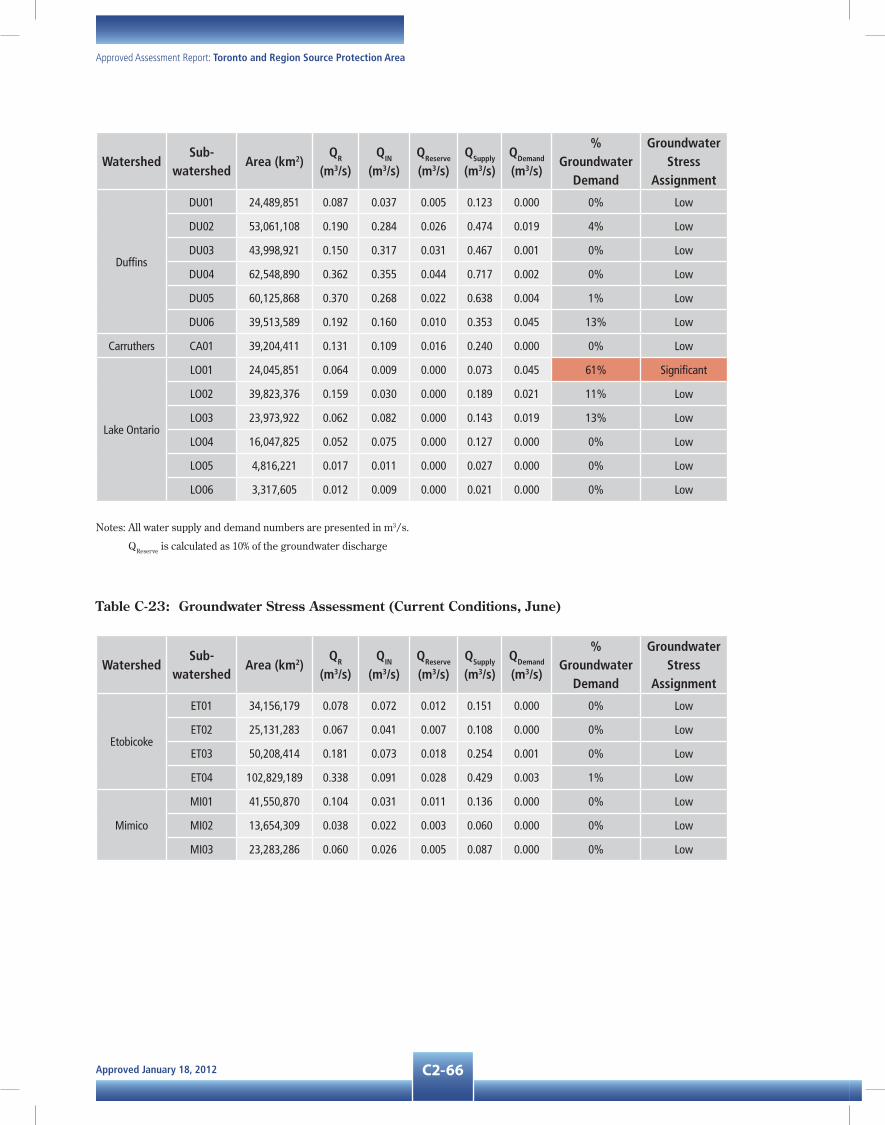
Approved January 18, 2012 C2-66
Approved Assessment Report: Toronto and Region Source Protection Area
WatershedSub-
watershedArea (km2)
QR (m3/s)
QIN (m3/s)
QReserve (m3/s)
QSupply (m3/s)
QDemand
(m3/s)
% Groundwater
Demand
Groundwater Stress
Assignment
Duffins
DU01 24,489,851 0.087 0.037 0.005 0.123 0.000 0% Low
DU02 53,061,108 0.190 0.284 0.026 0.474 0.019 4% Low
DU03 43,998,921 0.150 0.317 0.031 0.467 0.001 0% Low
DU04 62,548,890 0.362 0.355 0.044 0.717 0.002 0% Low
DU05 60,125,868 0.370 0.268 0.022 0.638 0.004 1% Low
DU06 39,513,589 0.192 0.160 0.010 0.353 0.045 13% Low
Carruthers CA01 39,204,411 0.131 0.109 0.016 0.240 0.000 0% Low
Lake Ontario
LO01 24,045,851 0.064 0.009 0.000 0.073 0.045 61% Significant
LO02 39,823,376 0.159 0.030 0.000 0.189 0.021 11% Low
LO03 23,973,922 0.062 0.082 0.000 0.143 0.019 13% Low
LO04 16,047,825 0.052 0.075 0.000 0.127 0.000 0% Low
LO05 4,816,221 0.017 0.011 0.000 0.027 0.000 0% Low
LO06 3,317,605 0.012 0.009 0.000 0.021 0.000 0% Low
Notes: All water supply and demand numbers are presented in m3/s.
QReserve is calculated as 10% of the groundwater discharge
Table C-23: groundwater stress assessment (Current Conditions, June)
WatershedSub-
watershedArea (km2)
QR (m3/s)
QIN (m3/s)
QReserve (m3/s)
QSupply (m3/s)
QDemand
(m3/s)
% Groundwater
Demand
Groundwater Stress
Assignment
Etobicoke
ET01 34,156,179 0.078 0.072 0.012 0.151 0.000 0% Low
ET02 25,131,283 0.067 0.041 0.007 0.108 0.000 0% Low
ET03 50,208,414 0.181 0.073 0.018 0.254 0.001 0% Low
ET04 102,829,189 0.338 0.091 0.028 0.429 0.003 1% Low
Mimico
MI01 41,550,870 0.104 0.031 0.011 0.136 0.000 0% Low
MI02 13,654,309 0.038 0.022 0.003 0.060 0.000 0% Low
MI03 23,283,286 0.060 0.026 0.005 0.087 0.000 0% Low
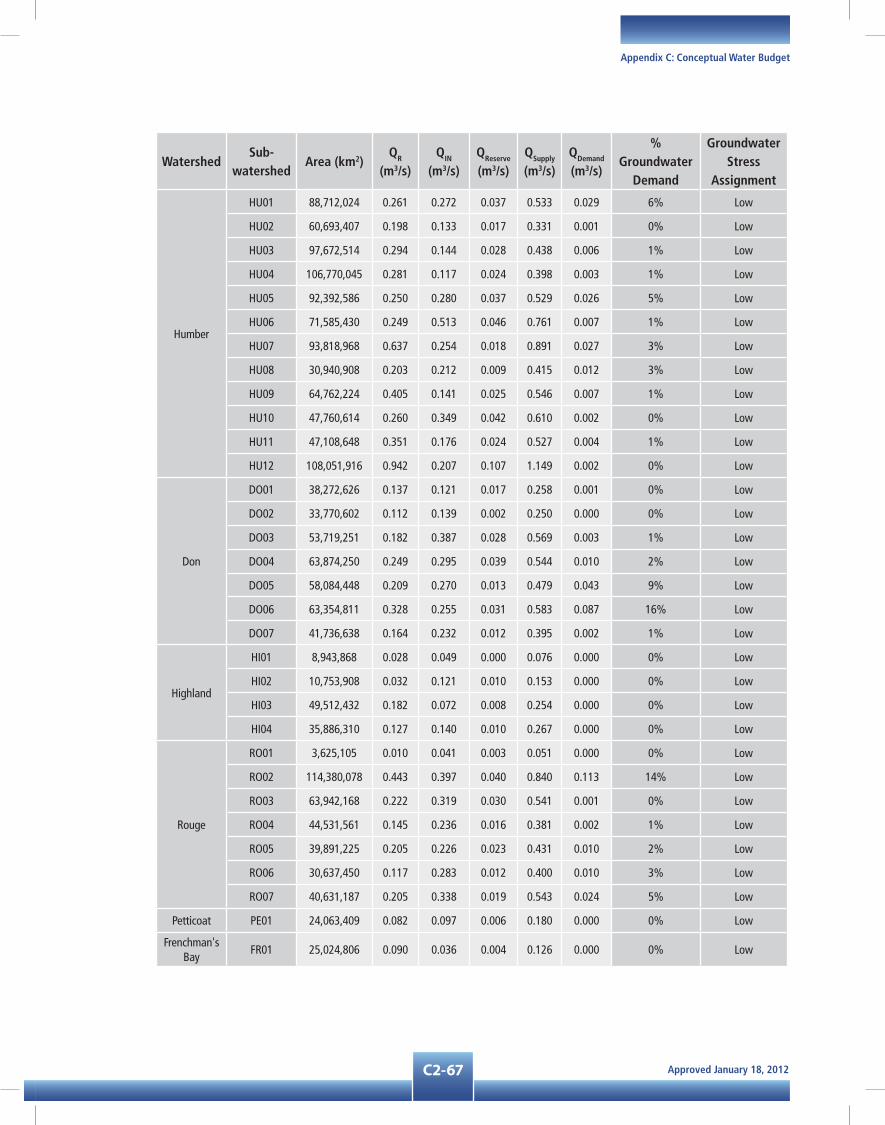
Approved January 18, 2012C2-67
Appendix C: Conceptual Water Budget
WatershedSub-
watershedArea (km2)
QR (m3/s)
QIN (m3/s)
QReserve (m3/s)
QSupply (m3/s)
QDemand
(m3/s)
% Groundwater
Demand
Groundwater Stress
Assignment
Humber
HU01 88,712,024 0.261 0.272 0.037 0.533 0.029 6% Low
HU02 60,693,407 0.198 0.133 0.017 0.331 0.001 0% Low
HU03 97,672,514 0.294 0.144 0.028 0.438 0.006 1% Low
HU04 106,770,045 0.281 0.117 0.024 0.398 0.003 1% Low
HU05 92,392,586 0.250 0.280 0.037 0.529 0.026 5% Low
HU06 71,585,430 0.249 0.513 0.046 0.761 0.007 1% Low
HU07 93,818,968 0.637 0.254 0.018 0.891 0.027 3% Low
HU08 30,940,908 0.203 0.212 0.009 0.415 0.012 3% Low
HU09 64,762,224 0.405 0.141 0.025 0.546 0.007 1% Low
HU10 47,760,614 0.260 0.349 0.042 0.610 0.002 0% Low
HU11 47,108,648 0.351 0.176 0.024 0.527 0.004 1% Low
HU12 108,051,916 0.942 0.207 0.107 1.149 0.002 0% Low
Don
DO01 38,272,626 0.137 0.121 0.017 0.258 0.001 0% Low
DO02 33,770,602 0.112 0.139 0.002 0.250 0.000 0% Low
DO03 53,719,251 0.182 0.387 0.028 0.569 0.003 1% Low
DO04 63,874,250 0.249 0.295 0.039 0.544 0.010 2% Low
DO05 58,084,448 0.209 0.270 0.013 0.479 0.043 9% Low
DO06 63,354,811 0.328 0.255 0.031 0.583 0.087 16% Low
DO07 41,736,638 0.164 0.232 0.012 0.395 0.002 1% Low
Highland
HI01 8,943,868 0.028 0.049 0.000 0.076 0.000 0% Low
HI02 10,753,908 0.032 0.121 0.010 0.153 0.000 0% Low
HI03 49,512,432 0.182 0.072 0.008 0.254 0.000 0% Low
HI04 35,886,310 0.127 0.140 0.010 0.267 0.000 0% Low
Rouge
RO01 3,625,105 0.010 0.041 0.003 0.051 0.000 0% Low
RO02 114,380,078 0.443 0.397 0.040 0.840 0.113 14% Low
RO03 63,942,168 0.222 0.319 0.030 0.541 0.001 0% Low
RO04 44,531,561 0.145 0.236 0.016 0.381 0.002 1% Low
RO05 39,891,225 0.205 0.226 0.023 0.431 0.010 2% Low
RO06 30,637,450 0.117 0.283 0.012 0.400 0.010 3% Low
RO07 40,631,187 0.205 0.338 0.019 0.543 0.024 5% Low
Petticoat PE01 24,063,409 0.082 0.097 0.006 0.180 0.000 0% Low
Frenchman's Bay
FR01 25,024,806 0.090 0.036 0.004 0.126 0.000 0% Low

Approved January 18, 2012 C2-68
Approved Assessment Report: Toronto and Region Source Protection Area
WatershedSub-
watershedArea (km2)
QR (m3/s)
QIN (m3/s)
QReserve (m3/s)
QSupply (m3/s)
QDemand
(m3/s)
% Groundwater
Demand
Groundwater Stress
Assignment
Duffins
DU01 24,489,851 0.087 0.037 0.005 0.123 0.000 0% Low
DU02 53,061,108 0.190 0.284 0.026 0.474 0.020 4% Low
DU03 43,998,921 0.150 0.317 0.031 0.467 0.007 2% Low
DU04 62,548,890 0.362 0.355 0.044 0.717 0.002 0% Low
DU05 60,125,868 0.370 0.268 0.022 0.638 0.059 10% Low
DU06 39,513,589 0.192 0.160 0.010 0.353 0.050 15% Low
Carruthers CA01 39,204,411 0.131 0.109 0.016 0.240 0.002 1% Low
Lake Ontario
LO01 24,045,851 0.064 0.009 0.000 0.073 0.047 64% Significant
LO02 39,823,376 0.159 0.030 0.000 0.189 0.022 12% Low
LO03 23,973,922 0.062 0.082 0.000 0.143 0.033 23% Low
LO04 16,047,825 0.052 0.075 0.000 0.127 0.000 0% Low
LO05 4,816,221 0.017 0.011 0.000 0.027 0.000 0% Low
LO06 3,317,605 0.012 0.009 0.000 0.021 0.000 0% Low
Notes: All water supply and demand numbers are presented in m3/s.
QReserve is calculated as 10% of the groundwater discharge
Table C-24: groundwater stress assessment (Current Conditions, July)
WatershedSub-
watershedArea (km2)
QR (m3/s)
QIN (m3/s)
QReserve (m3/s)
QSupply (m3/s)
QDemand
(m3/s)
% Groundwater
Demand
Groundwater Stress
Assignment
Etobicoke
ET01 34,156,179 0.078 0.072 0.012 0.151 0.000 0% Low
ET02 25,131,283 0.067 0.041 0.007 0.108 0.000 0% Low
ET03 50,208,414 0.181 0.073 0.018 0.254 0.001 0% Low
ET04 102,829,189 0.338 0.091 0.028 0.429 0.004 1% Low
Mimico
MI01 41,550,870 0.104 0.031 0.011 0.136 0.000 0% Low
MI02 13,654,309 0.038 0.022 0.003 0.060 0.000 0% Low
MI03 23,283,286 0.060 0.026 0.005 0.087 0.000 0% Low

Approved January 18, 2012C2-69
Appendix C: Conceptual Water Budget
WatershedSub-
watershedArea (km2)
QR (m3/s)
QIN (m3/s)
QReserve (m3/s)
QSupply (m3/s)
QDemand
(m3/s)
% Groundwater
Demand
Groundwater Stress
Assignment
Humber
HU01 88,712,024 0.261 0.272 0.037 0.533 0.028 6% Low
HU02 60,693,407 0.198 0.133 0.017 0.331 0.001 0% Low
HU03 97,672,514 0.294 0.144 0.028 0.438 0.006 1% Low
HU04 106,770,045 0.281 0.117 0.024 0.398 0.005 1% Low
HU05 92,392,586 0.250 0.280 0.037 0.529 0.052 11% Low
HU06 71,585,430 0.249 0.513 0.046 0.761 0.017 2% Low
HU07 93,818,968 0.637 0.254 0.018 0.891 0.032 4% Low
HU08 30,940,908 0.203 0.212 0.009 0.415 0.011 3% Low
HU09 64,762,224 0.405 0.141 0.025 0.546 0.041 8% Low
HU10 47,760,614 0.260 0.349 0.042 0.610 0.003 1% Low
HU11 47,108,648 0.351 0.176 0.024 0.527 0.004 1% Low
HU12 108,051,916 0.942 0.207 0.107 1.149 0.003 0% Low
Don
DO01 38,272,626 0.137 0.121 0.017 0.258 0.001 0% Low
DO02 33,770,602 0.112 0.139 0.002 0.250 0.000 0% Low
DO03 53,719,251 0.182 0.387 0.028 0.569 0.003 1% Low
DO04 63,874,250 0.249 0.295 0.039 0.544 0.010 2% Low
DO05 58,084,448 0.209 0.270 0.013 0.479 0.043 9% Low
DO06 63,354,811 0.328 0.255 0.031 0.583 0.086 16% Low
DO07 41,736,638 0.164 0.232 0.012 0.395 0.002 1% Low
Highland
HI01 8,943,868 0.028 0.049 0.000 0.076 0.000 0% Low
HI02 10,753,908 0.032 0.121 0.010 0.153 0.000 0% Low
HI03 49,512,432 0.182 0.072 0.008 0.254 0.000 0% Low
HI04 35,886,310 0.127 0.140 0.010 0.267 0.000 0% Low
Rouge
RO01 3,625,105 0.010 0.041 0.003 0.051 0.000 0% Low
RO02 114,380,078 0.443 0.397 0.040 0.840 0.170 21% Low
RO03 63,942,168 0.222 0.319 0.030 0.541 0.002 0% Low
RO04 44,531,561 0.145 0.236 0.016 0.381 0.002 1% Low
RO05 39,891,225 0.205 0.226 0.023 0.431 0.018 4% Low
RO06 30,637,450 0.117 0.283 0.012 0.400 0.010 3% Low
RO07 40,631,187 0.205 0.338 0.019 0.543 0.024 5% Low
Petticoat PE01 24,063,409 0.082 0.097 0.006 0.180 0.000 0% Low
Frenchman's Bay
FR01 25,024,806 0.090 0.036 0.004 0.126 0.000 0% Low

Approved January 18, 2012 C2-70
Approved Assessment Report: Toronto and Region Source Protection Area
WatershedSub-
watershedArea (km2)
QR (m3/s)
QIN (m3/s)
QReserve (m3/s)
QSupply (m3/s)
QDemand
(m3/s)
% Groundwater
Demand
Groundwater Stress
Assignment
Duffins
DU01 24,489,851 0.087 0.037 0.005 0.123 0.000 0% Low
DU02 53,061,108 0.190 0.284 0.026 0.474 0.019 4% Low
DU03 43,998,921 0.150 0.317 0.031 0.467 0.020 4% Low
DU04 62,548,890 0.362 0.355 0.044 0.717 0.003 0% Low
DU05 60,125,868 0.370 0.268 0.022 0.638 0.059 10% Low
DU06 39,513,589 0.192 0.160 0.010 0.353 0.051 15% Low
Carruthers CA01 39,204,411 0.131 0.109 0.016 0.240 0.019 8% Low
Lake Ontario
LO01 24,045,851 0.064 0.009 0.000 0.073 0.045 61% Significant
LO02 39,823,376 0.159 0.030 0.000 0.189 0.021 11% Low
LO03 23,973,922 0.062 0.082 0.000 0.143 0.032 22% Low
LO04 16,047,825 0.052 0.075 0.000 0.127 0.000 0% Low
LO05 4,816,221 0.017 0.011 0.000 0.027 0.000 0% Low
LO06 3,317,605 0.012 0.009 0.000 0.021 0.000 0% Low
Notes: All water supply and demand numbers are presented in m3/s.
QReserve is calculated as 10% of the groundwater discharge
Table C-25: groundwater stress assessment (Current Conditions, august)
WatershedSub-
watershedArea (km2)
QR (m3/s)
QIN (m3/s)
QReserve (m3/s)
QSupply (m3/s)
QDemand
(m3/s)
% Groundwater
Demand
Groundwater Stress
Assignment
Etobicoke
ET01 34,156,179 0.078 0.072 0.012 0.151 0.000 0% Low
ET02 25,131,283 0.067 0.041 0.007 0.108 0.000 0% Low
ET03 50,208,414 0.181 0.073 0.018 0.254 0.001 0% Low
ET04 102,829,189 0.338 0.091 0.028 0.429 0.004 1% Low
Mimico
MI01 41,550,870 0.104 0.031 0.011 0.136 0.000 0% Low
MI02 13,654,309 0.038 0.022 0.003 0.060 0.000 0% Low
MI03 23,283,286 0.060 0.026 0.005 0.087 0.000 0% Low

Approved January 18, 2012C2-71
Appendix C: Conceptual Water Budget
WatershedSub-
watershedArea (km2)
QR (m3/s)
QIN (m3/s)
QReserve (m3/s)
QSupply (m3/s)
QDemand
(m3/s)
% Groundwater
Demand
Groundwater Stress
Assignment
Humber
HU01 88,712,024 0.261 0.272 0.037 0.533 0.028 6% Low
HU02 60,693,407 0.198 0.133 0.017 0.331 0.001 0% Low
HU03 97,672,514 0.294 0.144 0.028 0.438 0.006 1% Low
HU04 106,770,045 0.281 0.117 0.024 0.398 0.005 1% Low
HU05 92,392,586 0.250 0.280 0.037 0.529 0.052 11% Low
HU06 71,585,430 0.249 0.513 0.046 0.761 0.017 2% Low
HU07 93,818,968 0.637 0.254 0.018 0.891 0.032 4% Low
HU08 30,940,908 0.203 0.212 0.009 0.415 0.011 3% Low
HU09 64,762,224 0.405 0.141 0.025 0.546 0.041 8% Low
HU10 47,760,614 0.260 0.349 0.042 0.610 0.003 1% Low
HU11 47,108,648 0.351 0.176 0.024 0.527 0.004 1% Low
HU12 108,051,916 0.942 0.207 0.107 1.149 0.003 0% Low
Don
DO01 38,272,626 0.137 0.121 0.017 0.258 0.001 0% Low
DO02 33,770,602 0.112 0.139 0.002 0.250 0.000 0% Low
DO03 53,719,251 0.182 0.387 0.028 0.569 0.003 1% Low
DO04 63,874,250 0.249 0.295 0.039 0.544 0.010 2% Low
DO05 58,084,448 0.209 0.270 0.013 0.479 0.043 9% Low
DO06 63,354,811 0.328 0.255 0.031 0.583 0.086 16% Low
DO07 41,736,638 0.164 0.232 0.012 0.395 0.002 1% Low
Highland
HI01 8,943,868 0.028 0.049 0.000 0.076 0.000 0% Low
HI02 10,753,908 0.032 0.121 0.010 0.153 0.000 0% Low
HI03 49,512,432 0.182 0.072 0.008 0.254 0.000 0% Low
HI04 35,886,310 0.127 0.140 0.010 0.267 0.000 0% Low
Rouge
RO01 3,625,105 0.010 0.041 0.003 0.051 0.000 0% Low
RO02 114,380,078 0.443 0.397 0.040 0.840 0.170 21% Low
RO03 63,942,168 0.222 0.319 0.030 0.541 0.002 0% Low
RO04 44,531,561 0.145 0.236 0.016 0.381 0.002 1% Low
RO05 39,891,225 0.205 0.226 0.023 0.431 0.018 4% Low
RO06 30,637,450 0.117 0.283 0.012 0.400 0.010 3% Low
RO07 40,631,187 0.205 0.338 0.019 0.543 0.024 5% Low
Petticoat PE01 24,063,409 0.082 0.097 0.006 0.180 0.000 0% Low
Frenchman's Bay
FR01 25,024,806 0.090 0.036 0.004 0.126 0.000 0% Low

Approved January 18, 2012 C2-72
Approved Assessment Report: Toronto and Region Source Protection Area
WatershedSub-
watershedArea (km2)
QR (m3/s)
QIN (m3/s)
QReserve (m3/s)
QSupply (m3/s)
QDemand
(m3/s)
% Groundwater
Demand
Groundwater Stress
Assignment
Duffins
DU01 24,489,851 0.087 0.037 0.005 0.123 0.000 0% Low
DU02 53,061,108 0.190 0.284 0.026 0.474 0.019 4% Low
DU03 43,998,921 0.150 0.317 0.031 0.467 0.020 4% Low
DU04 62,548,890 0.362 0.355 0.044 0.717 0.003 0% Low
DU05 60,125,868 0.370 0.268 0.022 0.638 0.059 10% Low
DU06 39,513,589 0.192 0.160 0.010 0.353 0.051 15% Low
Carruthers CA01 39,204,411 0.131 0.109 0.016 0.240 0.019 8% Low
Lake Ontario
LO01 24,045,851 0.064 0.009 0.000 0.073 0.045 61% Significant
LO02 39,823,376 0.159 0.030 0.000 0.189 0.021 11% Low
LO03 23,973,922 0.062 0.082 0.000 0.143 0.032 22% Low
LO04 16,047,825 0.052 0.075 0.000 0.127 0.000 0% Low
LO05 4,816,221 0.017 0.011 0.000 0.027 0.000 0% Low
LO06 3,317,605 0.012 0.009 0.000 0.021 0.000 0% Low
Notes: All water supply and demand numbers are presented in m3/s.
QReserve is calculated as 10% of the groundwater discharge
Table C-26: groundwater stress assessment (Current Conditions, september)
WatershedSub-
watershedArea (km2)
QR (m3/s)
QIN (m3/s)
Qinflow (m3/s)
QReserve (m3/s)
QSupply (m3/s)
QDemand
(m3/s)
% Groundwater
Demand
Groundwater Stress
Assignment
Etobicoke
ET01 34,156,179 0.078 0.072 0.151 0.012 0.151 0.000 0% Low
ET02 25,131,283 0.067 0.041 0.108 0.007 0.108 0.000 0% Low
ET03 50,208,414 0.181 0.073 0.254 0.018 0.254 0.001 0% Low
ET04 102,829,189 0.338 0.091 0.429 0.028 0.429 0.003 1% Low
Mimico
MI01 41,550,870 0.104 0.031 0.136 0.011 0.136 0.000 0% Low
MI02 13,654,309 0.038 0.022 0.060 0.003 0.060 0.000 0% Low
MI03 23,283,286 0.060 0.026 0.087 0.005 0.087 0.000 0% Low
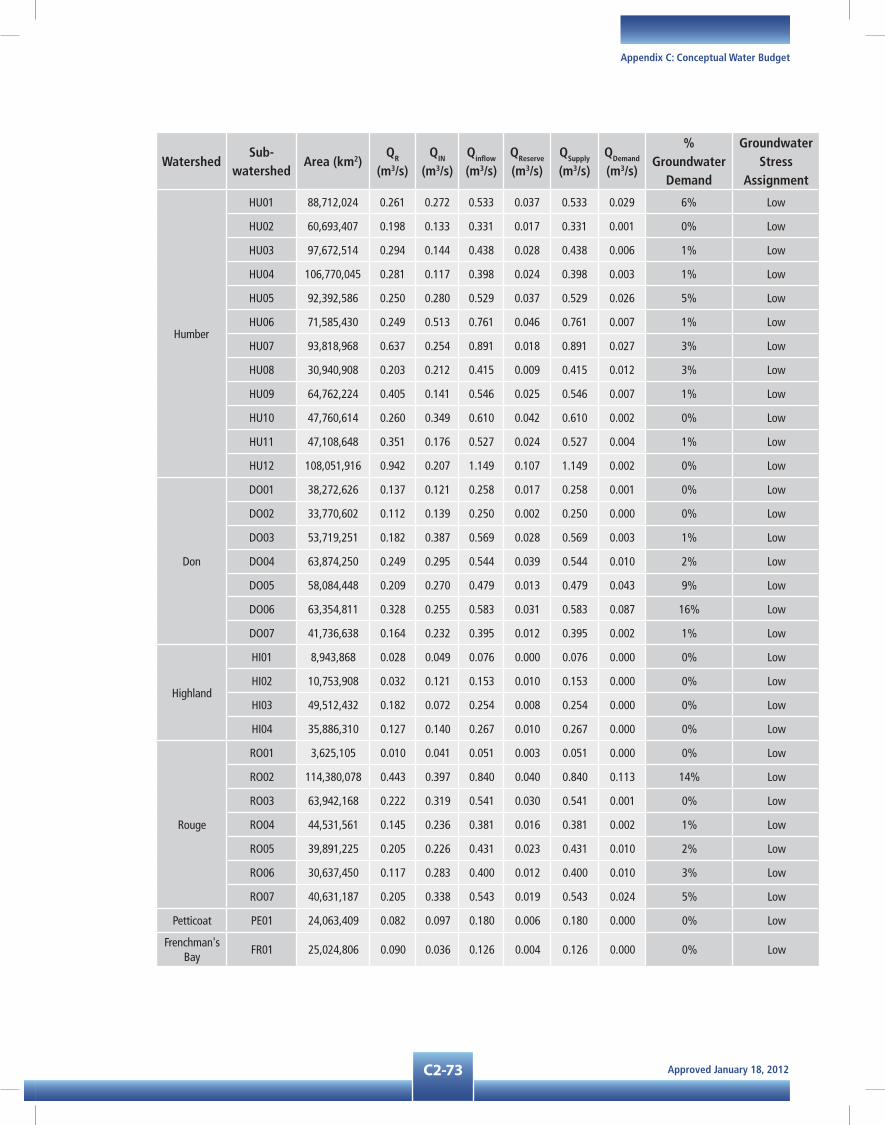
Approved January 18, 2012C2-73
Appendix C: Conceptual Water Budget
WatershedSub-
watershedArea (km2)
QR (m3/s)
QIN (m3/s)
Qinflow (m3/s)
QReserve (m3/s)
QSupply (m3/s)
QDemand
(m3/s)
% Groundwater
Demand
Groundwater Stress
Assignment
Humber
HU01 88,712,024 0.261 0.272 0.533 0.037 0.533 0.029 6% Low
HU02 60,693,407 0.198 0.133 0.331 0.017 0.331 0.001 0% Low
HU03 97,672,514 0.294 0.144 0.438 0.028 0.438 0.006 1% Low
HU04 106,770,045 0.281 0.117 0.398 0.024 0.398 0.003 1% Low
HU05 92,392,586 0.250 0.280 0.529 0.037 0.529 0.026 5% Low
HU06 71,585,430 0.249 0.513 0.761 0.046 0.761 0.007 1% Low
HU07 93,818,968 0.637 0.254 0.891 0.018 0.891 0.027 3% Low
HU08 30,940,908 0.203 0.212 0.415 0.009 0.415 0.012 3% Low
HU09 64,762,224 0.405 0.141 0.546 0.025 0.546 0.007 1% Low
HU10 47,760,614 0.260 0.349 0.610 0.042 0.610 0.002 0% Low
HU11 47,108,648 0.351 0.176 0.527 0.024 0.527 0.004 1% Low
HU12 108,051,916 0.942 0.207 1.149 0.107 1.149 0.002 0% Low
Don
DO01 38,272,626 0.137 0.121 0.258 0.017 0.258 0.001 0% Low
DO02 33,770,602 0.112 0.139 0.250 0.002 0.250 0.000 0% Low
DO03 53,719,251 0.182 0.387 0.569 0.028 0.569 0.003 1% Low
DO04 63,874,250 0.249 0.295 0.544 0.039 0.544 0.010 2% Low
DO05 58,084,448 0.209 0.270 0.479 0.013 0.479 0.043 9% Low
DO06 63,354,811 0.328 0.255 0.583 0.031 0.583 0.087 16% Low
DO07 41,736,638 0.164 0.232 0.395 0.012 0.395 0.002 1% Low
Highland
HI01 8,943,868 0.028 0.049 0.076 0.000 0.076 0.000 0% Low
HI02 10,753,908 0.032 0.121 0.153 0.010 0.153 0.000 0% Low
HI03 49,512,432 0.182 0.072 0.254 0.008 0.254 0.000 0% Low
HI04 35,886,310 0.127 0.140 0.267 0.010 0.267 0.000 0% Low
Rouge
RO01 3,625,105 0.010 0.041 0.051 0.003 0.051 0.000 0% Low
RO02 114,380,078 0.443 0.397 0.840 0.040 0.840 0.113 14% Low
RO03 63,942,168 0.222 0.319 0.541 0.030 0.541 0.001 0% Low
RO04 44,531,561 0.145 0.236 0.381 0.016 0.381 0.002 1% Low
RO05 39,891,225 0.205 0.226 0.431 0.023 0.431 0.010 2% Low
RO06 30,637,450 0.117 0.283 0.400 0.012 0.400 0.010 3% Low
RO07 40,631,187 0.205 0.338 0.543 0.019 0.543 0.024 5% Low
Petticoat PE01 24,063,409 0.082 0.097 0.180 0.006 0.180 0.000 0% Low
Frenchman's Bay
FR01 25,024,806 0.090 0.036 0.126 0.004 0.126 0.000 0% Low

Approved January 18, 2012 C2-74
Approved Assessment Report: Toronto and Region Source Protection Area
WatershedSub-
watershedArea (km2)
QR (m3/s)
QIN (m3/s)
Qinflow (m3/s)
QReserve (m3/s)
QSupply (m3/s)
QDemand
(m3/s)
% Groundwater
Demand
Groundwater Stress
Assignment
Duffins
DU01 24,489,851 0.087 0.037 0.123 0.005 0.123 0.000 0% Low
DU02 53,061,108 0.190 0.284 0.474 0.026 0.474 0.020 4% Low
DU03 43,998,921 0.150 0.317 0.467 0.031 0.467 0.007 2% Low
DU04 62,548,890 0.362 0.355 0.717 0.044 0.717 0.002 0% Low
DU05 60,125,868 0.370 0.268 0.638 0.022 0.638 0.059 10% Low
DU06 39,513,589 0.192 0.160 0.353 0.010 0.353 0.050 15% Low
Carruthers CA01 39,204,411 0.131 0.109 0.240 0.016 0.240 0.002 1% Low
Lake Ontario
LO01 24,045,851 0.064 0.009 0.073 0.000 0.073 0.047 64% Significant
LO02 39,823,376 0.159 0.030 0.189 0.000 0.189 0.022 12% Low
LO03 23,973,922 0.062 0.082 0.143 0.000 0.143 0.033 23% Low
LO04 16,047,825 0.052 0.075 0.127 0.000 0.127 0.000 0% Low
LO05 4,816,221 0.017 0.011 0.027 0.000 0.027 0.000 0% Low
LO06 3,317,605 0.012 0.009 0.021 0.000 0.021 0.000 0% Low
Notes: All water supply and demand numbers are presented in m3/s.
QReserve is calculated as 10% of the groundwater discharge
Table C-27: groundwater stress assessment (Current Conditions, october)
WatershedSub-
watershedArea (km2)
QR (m3/s)
QIN (m3/s)
Qinflow (m3/s)
QReserve (m3/s)
QSupply (m3/s)
QDemand
(m3/s)
% Groundwater
Demand
Groundwater Stress
Assignment
Etobicoke
ET01 34,156,179 0.078 0.072 0.151 0.012 0.151 0.000 0% Low
ET02 25,131,283 0.067 0.041 0.108 0.007 0.108 0.000 0% Low
ET03 50,208,414 0.181 0.073 0.254 0.018 0.254 0.001 0% Low
ET04 102,829,189 0.338 0.091 0.429 0.028 0.429 0.002 1% Low
Mimico
MI01 41,550,870 0.104 0.031 0.136 0.011 0.136 0.000 0% Low
MI02 13,654,309 0.038 0.022 0.060 0.003 0.060 0.000 0% Low
MI03 23,283,286 0.060 0.026 0.087 0.005 0.087 0.000 0% Low

Approved January 18, 2012C2-75
Appendix C: Conceptual Water Budget
WatershedSub-
watershedArea (km2)
QR (m3/s)
QIN (m3/s)
Qinflow (m3/s)
QReserve (m3/s)
QSupply (m3/s)
QDemand
(m3/s)
% Groundwater
Demand
Groundwater Stress
Assignment
Humber
HU01 88,712,024 0.261 0.272 0.533 0.037 0.533 0.028 6% Low
HU02 60,693,407 0.198 0.133 0.331 0.017 0.331 0.001 0% Low
HU03 97,672,514 0.294 0.144 0.438 0.028 0.438 0.001 0% Low
HU04 106,770,045 0.281 0.117 0.398 0.024 0.398 0.001 0% Low
HU05 92,392,586 0.250 0.280 0.529 0.037 0.529 0.022 5% Low
HU06 71,585,430 0.249 0.513 0.761 0.046 0.761 0.007 1% Low
HU07 93,818,968 0.637 0.254 0.891 0.018 0.891 0.022 2% Low
HU08 30,940,908 0.203 0.212 0.415 0.009 0.415 0.004 1% Low
HU09 64,762,224 0.405 0.141 0.546 0.025 0.546 0.003 1% Low
HU10 47,760,614 0.260 0.349 0.610 0.042 0.610 0.002 0% Low
HU11 47,108,648 0.351 0.176 0.527 0.024 0.527 0.004 1% Low
HU12 108,051,916 0.942 0.207 1.149 0.107 1.149 0.002 0% Low
Don
DO01 38,272,626 0.137 0.121 0.258 0.017 0.258 0.001 0% Low
DO02 33,770,602 0.112 0.139 0.250 0.002 0.250 0.000 0% Low
DO03 53,719,251 0.182 0.387 0.569 0.028 0.569 0.003 1% Low
DO04 63,874,250 0.249 0.295 0.544 0.039 0.544 0.001 0% Low
DO05 58,084,448 0.209 0.270 0.479 0.013 0.479 0.026 6% Low
DO06 63,354,811 0.328 0.255 0.583 0.031 0.583 0.075 14% Low
DO07 41,736,638 0.164 0.232 0.395 0.012 0.395 0.001 0% Low
Highland
HI01 8,943,868 0.028 0.049 0.076 0.000 0.076 0.000 0% Low
HI02 10,753,908 0.032 0.121 0.153 0.010 0.153 0.000 0% Low
HI03 49,512,432 0.182 0.072 0.254 0.008 0.254 0.000 0% Low
HI04 35,886,310 0.127 0.140 0.267 0.010 0.267 0.000 0% Low
Rouge
RO01 3,625,105 0.010 0.041 0.051 0.003 0.051 0.000 0% Low
RO02 114,380,078 0.443 0.397 0.840 0.040 0.840 0.096 12% Low
RO03 63,942,168 0.222 0.319 0.541 0.030 0.541 0.001 0% Low
RO04 44,531,561 0.145 0.236 0.381 0.016 0.381 0.002 1% Low
RO05 39,891,225 0.205 0.226 0.431 0.023 0.431 0.004 1% Low
RO06 30,637,450 0.117 0.283 0.400 0.012 0.400 0.003 1% Low
RO07 40,631,187 0.205 0.338 0.543 0.019 0.543 0.002 0% Low
Petticoat PE01 24,063,409 0.082 0.097 0.180 0.006 0.180 0.000 0% Low
Frenchman's Bay
FR01 25,024,806 0.090 0.036 0.126 0.004 0.126 0.000 0% Low

Approved January 18, 2012 C2-76
Approved Assessment Report: Toronto and Region Source Protection Area
WatershedSub-
watershedArea (km2)
QR (m3/s)
QIN (m3/s)
Qinflow (m3/s)
QReserve (m3/s)
QSupply (m3/s)
QDemand
(m3/s)
% Groundwater
Demand
Groundwater Stress
Assignment
Duffins
DU01 24,489,851 0.087 0.037 0.123 0.005 0.123 0.000 0% Low
DU02 53,061,108 0.190 0.284 0.474 0.026 0.474 0.019 4% Low
DU03 43,998,921 0.150 0.317 0.467 0.031 0.467 0.001 0% Low
DU04 62,548,890 0.362 0.355 0.717 0.044 0.717 0.002 0% Low
DU05 60,125,868 0.370 0.268 0.638 0.022 0.638 0.004 1% Low
DU06 39,513,589 0.192 0.160 0.353 0.010 0.353 0.045 13% Low
Carruthers CA01 39,204,411 0.131 0.109 0.240 0.016 0.240 0.000 0% Low
Lake Ontario
LO01 24,045,851 0.064 0.009 0.073 0.000 0.073 0.045 61% Significant
LO02 39,823,376 0.159 0.030 0.189 0.000 0.189 0.021 11% Low
LO03 23,973,922 0.062 0.082 0.143 0.000 0.143 0.019 13% Low
LO04 16,047,825 0.052 0.075 0.127 0.000 0.127 0.000 0% Low
LO05 4,816,221 0.017 0.011 0.027 0.000 0.027 0.000 0% Low
LO06 3,317,605 0.012 0.009 0.021 0.000 0.021 0.000 0% Low
Notes: All water supply and demand numbers are presented in m3/s.
QReserve is calculated as 10% of the groundwater discharge
Table C-28: groundwater stress assessment (Current Conditions, november)
WatershedSub-
watershedArea (km2)
QR (m3/s)
QIN (m3/s)
QReserve (m3/s)
QSupply (m3/s)
QDemand
(m3/s)
% Groundwater
Demand
Groundwater Stress
Assignment
Etobicoke
ET01 34,156,179 0.078 0.072 0.012 0.151 0.000 0% Low
ET02 25,131,283 0.067 0.041 0.007 0.108 0.000 0% Low
ET03 50,208,414 0.181 0.073 0.018 0.254 0.001 0% Low
ET04 102,829,189 0.338 0.091 0.028 0.429 0.003 1% Low
Mimico
MI01 41,550,870 0.104 0.031 0.011 0.136 0.000 0% Low
MI02 13,654,309 0.038 0.022 0.003 0.060 0.000 0% Low
MI03 23,283,286 0.060 0.026 0.005 0.087 0.000 0% Low

Approved January 18, 2012C2-77
Appendix C: Conceptual Water Budget
WatershedSub-
watershedArea (km2)
QR (m3/s)
QIN (m3/s)
QReserve (m3/s)
QSupply (m3/s)
QDemand
(m3/s)
% Groundwater
Demand
Groundwater Stress
Assignment
Humber
HU01 88,712,024 0.261 0.272 0.037 0.533 0.029 6% Low
HU02 60,693,407 0.198 0.133 0.017 0.331 0.001 0% Low
HU03 97,672,514 0.294 0.144 0.028 0.438 0.001 0% Low
HU04 106,770,045 0.281 0.117 0.024 0.398 0.001 0% Low
HU05 92,392,586 0.250 0.280 0.037 0.529 0.023 5% Low
HU06 71,585,430 0.249 0.513 0.046 0.761 0.007 1% Low
HU07 93,818,968 0.637 0.254 0.018 0.891 0.022 3% Low
HU08 30,940,908 0.203 0.212 0.009 0.415 0.004 1% Low
HU09 64,762,224 0.405 0.141 0.025 0.546 0.003 1% Low
HU10 47,760,614 0.260 0.349 0.042 0.610 0.002 0% Low
HU11 47,108,648 0.351 0.176 0.024 0.527 0.004 1% Low
HU12 108,051,916 0.942 0.207 0.107 1.149 0.002 0% Low
Don
DO01 38,272,626 0.137 0.121 0.017 0.258 0.001 0% Low
DO02 33,770,602 0.112 0.139 0.002 0.250 0.000 0% Low
DO03 53,719,251 0.182 0.387 0.028 0.569 0.003 1% Low
DO04 63,874,250 0.249 0.295 0.039 0.544 0.001 0% Low
DO05 58,084,448 0.209 0.270 0.013 0.479 0.027 6% Low
DO06 63,354,811 0.328 0.255 0.031 0.583 0.078 14% Low
DO07 41,736,638 0.164 0.232 0.012 0.395 0.001 0% Low
Highland
HI01 8,943,868 0.028 0.049 0.000 0.076 0.000 0% Low
HI02 10,753,908 0.032 0.121 0.010 0.153 0.000 0% Low
HI03 49,512,432 0.182 0.072 0.008 0.254 0.000 0% Low
HI04 35,886,310 0.127 0.140 0.010 0.267 0.000 0% Low
Rouge
RO01 3,625,105 0.010 0.041 0.003 0.051 0.000 0% Low
RO02 114,380,078 0.443 0.397 0.040 0.840 0.099 12% Low
RO03 63,942,168 0.222 0.319 0.030 0.541 0.001 0% Low
RO04 44,531,561 0.145 0.236 0.016 0.381 0.002 1% Low
RO05 39,891,225 0.205 0.226 0.023 0.431 0.004 1% Low
RO06 30,637,450 0.117 0.283 0.012 0.400 0.003 1% Low
RO07 40,631,187 0.205 0.338 0.019 0.543 0.002 0% Low
Petticoat PE01 24,063,409 0.082 0.097 0.006 0.180 0.000 0% Low
Frenchman's Bay
FR01 25,024,806 0.090 0.036 0.004 0.126 0.000 0% Low

Approved January 18, 2012 C2-78
Approved Assessment Report: Toronto and Region Source Protection Area
WatershedSub-
watershedArea (km2)
QR (m3/s)
QIN (m3/s)
QReserve (m3/s)
QSupply (m3/s)
QDemand
(m3/s)
% Groundwater
Demand
Groundwater Stress
Assignment
Duffins
DU01 24,489,851 0.087 0.037 0.005 0.123 0.000 0% Low
DU02 53,061,108 0.190 0.284 0.026 0.474 0.020 4% Low
DU03 43,998,921 0.150 0.317 0.031 0.467 0.001 0% Low
DU04 62,548,890 0.362 0.355 0.044 0.717 0.002 0% Low
DU05 60,125,868 0.370 0.268 0.022 0.638 0.004 1% Low
DU06 39,513,589 0.192 0.160 0.010 0.353 0.047 14% Low
Carruthers CA01 39,204,411 0.131 0.109 0.016 0.240 0.000 0% Low
Lake Ontario
LO01 24,045,851 0.064 0.009 0.000 0.073 0.047 64% Significant
LO02 39,823,376 0.159 0.030 0.000 0.189 0.022 12% Low
LO03 23,973,922 0.062 0.082 0.000 0.143 0.019 14% Low
LO04 16,047,825 0.052 0.075 0.000 0.127 0.000 0% Low
LO05 4,816,221 0.017 0.011 0.000 0.027 0.000 0% Low
LO06 3,317,605 0.012 0.009 0.000 0.021 0.000 0% Low
Notes: All water supply and demand numbers are presented in m3/s.
QReserve is calculated as 10% of the groundwater discharge
Table C-29: groundwater stress assessment (Current Conditions, december)
WatershedSub-
watershedArea (km2)
QR (m3/s)
QIN (m3/s)
QReserve (m3/s)
QSupply (m3/s)
QDemand
(m3/s)
% Groundwater
Demand
Groundwater Stress
Assignment
Etobicoke
ET01 34,156,179 0.078 0.072 0.012 0.151 0.000 0% Low
ET02 25,131,283 0.067 0.041 0.007 0.108 0.000 0% Low
ET03 50,208,414 0.181 0.073 0.018 0.254 0.001 0% Low
ET04 102,829,189 0.338 0.091 0.028 0.429 0.002 1% Low
Mimico
MI01 41,550,870 0.104 0.031 0.011 0.136 0.000 0% Low
MI02 13,654,309 0.038 0.022 0.003 0.060 0.000 0% Low
MI03 23,283,286 0.060 0.026 0.005 0.087 0.000 0% Low

Approved January 18, 2012C2-79
Appendix C: Conceptual Water Budget
WatershedSub-
watershedArea (km2)
QR (m3/s)
QIN (m3/s)
QReserve (m3/s)
QSupply (m3/s)
QDemand
(m3/s)
% Groundwater
Demand
Groundwater Stress
Assignment
Humber
HU01 88,712,024 0.261 0.272 0.037 0.533 0.028 6% Low
HU02 60,693,407 0.198 0.133 0.017 0.331 0.001 0% Low
HU03 97,672,514 0.294 0.144 0.028 0.438 0.001 0% Low
HU04 106,770,045 0.281 0.117 0.024 0.398 0.001 0% Low
HU05 92,392,586 0.250 0.280 0.037 0.529 0.022 5% Low
HU06 71,585,430 0.249 0.513 0.046 0.761 0.007 1% Low
HU07 93,818,968 0.637 0.254 0.018 0.891 0.022 2% Low
HU08 30,940,908 0.203 0.212 0.009 0.415 0.004 1% Low
HU09 64,762,224 0.405 0.141 0.025 0.546 0.003 1% Low
HU10 47,760,614 0.260 0.349 0.042 0.610 0.002 0% Low
HU11 47,108,648 0.351 0.176 0.024 0.527 0.004 1% Low
HU12 108,051,916 0.942 0.207 0.107 1.149 0.002 0% Low
Don
DO01 38,272,626 0.137 0.121 0.017 0.258 0.001 0% Low
DO02 33,770,602 0.112 0.139 0.002 0.250 0.000 0% Low
DO03 53,719,251 0.182 0.387 0.028 0.569 0.003 1% Low
DO04 63,874,250 0.249 0.295 0.039 0.544 0.001 0% Low
DO05 58,084,448 0.209 0.270 0.013 0.479 0.026 6% Low
DO06 63,354,811 0.328 0.255 0.031 0.583 0.075 14% Low
DO07 41,736,638 0.164 0.232 0.012 0.395 0.001 0% Low
Highland
HI01 8,943,868 0.028 0.049 0.000 0.076 0.000 0% Low
HI02 10,753,908 0.032 0.121 0.010 0.153 0.000 0% Low
HI03 49,512,432 0.182 0.072 0.008 0.254 0.000 0% Low
HI04 35,886,310 0.127 0.140 0.010 0.267 0.000 0% Low
Rouge
RO01 3,625,105 0.010 0.041 0.003 0.051 0.000 0% Low
RO02 114,380,078 0.443 0.397 0.040 0.840 0.092 12% Low
RO03 63,942,168 0.222 0.319 0.030 0.541 0.001 0% Low
RO04 44,531,561 0.145 0.236 0.016 0.381 0.000 0% Low
RO05 39,891,225 0.205 0.226 0.023 0.431 0.004 1% Low
RO06 30,637,450 0.117 0.283 0.012 0.400 0.003 1% Low
RO07 40,631,187 0.205 0.338 0.019 0.543 0.002 0% Low
Petticoat PE01 24,063,409 0.082 0.097 0.006 0.180 0.000 0% Low
Frenchman's Bay
FR01 25,024,806 0.090 0.036 0.004 0.126 0.000 0% Low

Approved January 18, 2012 C2-80
Approved Assessment Report: Toronto and Region Source Protection Area
WatershedSub-
watershedArea (km2)
QR (m3/s)
QIN (m3/s)
QReserve (m3/s)
QSupply (m3/s)
QDemand
(m3/s)
% Groundwater
Demand
Groundwater Stress
Assignment
Duffins
DU01 24,489,851 0.087 0.037 0.005 0.123 0.000 0% Low
DU02 53,061,108 0.190 0.284 0.026 0.474 0.019 4% Low
DU03 43,998,921 0.150 0.317 0.031 0.467 0.001 0% Low
DU04 62,548,890 0.362 0.355 0.044 0.717 0.067 10% Low
DU05 60,125,868 0.370 0.268 0.022 0.638 0.004 1% Low
DU06 39,513,589 0.192 0.160 0.010 0.353 0.039 11% Low
Carruthers CA01 39,204,411 0.131 0.109 0.016 0.240 0.000 0% Low
Lake Ontario
LO01 24,045,851 0.064 0.009 0.000 0.073 0.045 61% Significant
LO02 39,823,376 0.159 0.030 0.000 0.189 0.021 11% Low
LO03 23,973,922 0.062 0.082 0.000 0.143 0.019 13% Low
LO04 16,047,825 0.052 0.075 0.000 0.127 0.000 0% Low
LO05 4,816,221 0.017 0.011 0.000 0.027 0.000 0% Low
LO06 3,317,605 0.012 0.009 0.000 0.021 0.000 0% Low
Notes: All water supply and demand numbers are presented in m3/s.
QReserve is calculated as 10% of the groundwater discharge
Table C-30: groundwater stress assessment (future Conditions, January)
WatershedSub-
watershedArea (km2)
QR (m3/s)
QIN (m3/s)
QReserve (m3/s)
QSupply (m3/s)
QDemand
(m3/s)
% Groundwater
Demand
Groundwater Stress
Assignment
Etobicoke
ET01 34,156,179 0.078 0.072 0.012 0.151 0.000 0% Low
ET02 25,131,283 0.067 0.041 0.007 0.108 0.000 0% Low
ET03 50,208,414 0.181 0.073 0.018 0.254 0.001 0% Low
ET04 102,829,189 0.338 0.091 0.028 0.429 0.002 1% Low
Mimico
MI01 41,550,870 0.104 0.031 0.011 0.136 0.000 0% Low
MI02 13,654,309 0.038 0.022 0.003 0.060 0.000 0% Low
MI03 23,283,286 0.060 0.026 0.005 0.087 0.000 0% Low

Approved January 18, 2012C2-81
Appendix C: Conceptual Water Budget
WatershedSub-
watershedArea (km2)
QR (m3/s)
QIN (m3/s)
QReserve (m3/s)
QSupply (m3/s)
QDemand
(m3/s)
% Groundwater
Demand
Groundwater Stress
Assignment
Humber
HU01 88,712,024 0.261 0.272 0.037 0.533 0.028 6% Low
HU02 60,693,407 0.198 0.133 0.017 0.331 0.001 0% Low
HU03 97,672,514 0.294 0.144 0.028 0.438 0.001 0% Low
HU04 106,770,045 0.281 0.117 0.024 0.398 0.001 0% Low
HU05 92,392,586 0.250 0.280 0.037 0.529 0.005 1% Low
HU06 71,585,430 0.249 0.513 0.046 0.761 0.006 1% Low
HU07 93,818,968 0.637 0.254 0.018 0.891 0.006 1% Low
HU08 30,940,908 0.203 0.212 0.009 0.415 0.007 2% Low
HU09 64,762,224 0.405 0.141 0.025 0.546 0.003 1% Low
HU10 47,760,614 0.260 0.349 0.042 0.610 0.007 1% Low
HU11 47,108,648 0.351 0.176 0.024 0.527 0.008 2% Low
HU12 108,051,916 0.942 0.207 0.107 1.149 0.003 0% Low
Don
DO01 38,272,626 0.137 0.121 0.017 0.258 0.001 0% Low
DO02 33,770,602 0.112 0.139 0.002 0.250 0.000 0% Low
DO03 53,719,251 0.182 0.387 0.028 0.569 0.003 1% Low
DO04 63,874,250 0.249 0.295 0.039 0.544 0.001 0% Low
DO05 58,084,448 0.209 0.270 0.013 0.479 0.026 6% Low
DO06 63,354,811 0.328 0.255 0.031 0.583 0.075 14% Low
DO07 41,736,638 0.164 0.232 0.012 0.395 0.001 0% Low
Highland
HI01 8,943,868 0.028 0.049 0.000 0.076 0.000 0% Low
HI02 10,753,908 0.032 0.121 0.010 0.153 0.000 0% Low
HI03 49,512,432 0.182 0.072 0.008 0.254 0.000 0% Low
HI04 35,886,310 0.127 0.140 0.010 0.267 0.000 0% Low
Rouge
RO01 3,625,105 0.010 0.041 0.003 0.051 0.000 0% Low
RO02 114,380,078 0.443 0.397 0.040 0.840 0.095 12% Low
RO03 63,942,168 0.222 0.319 0.030 0.541 0.001 0% Low
RO04 44,531,561 0.145 0.236 0.016 0.381 0.000 0% Low
RO05 39,891,225 0.205 0.226 0.023 0.431 0.004 1% Low
RO06 30,637,450 0.117 0.283 0.012 0.400 0.003 1% Low
RO07 40,631,187 0.205 0.338 0.019 0.543 0.002 0% Low
Petticoat PE01 24,063,409 0.082 0.097 0.006 0.180 0.000 0% Low
Frenchman's Bay
FR01 25,024,806 0.090 0.036 0.004 0.126 0.000 0% Low

Approved January 18, 2012 C2-82
Approved Assessment Report: Toronto and Region Source Protection Area
WatershedSub-
watershedArea (km2)
QR (m3/s)
QIN (m3/s)
QReserve (m3/s)
QSupply (m3/s)
QDemand
(m3/s)
% Groundwater
Demand
Groundwater Stress
Assignment
Duffins
DU01 24,489,851 0.087 0.037 0.005 0.123 0.000 0% Low
DU02 53,061,108 0.190 0.284 0.026 0.474 0.019 4% Low
DU03 43,998,921 0.150 0.317 0.031 0.467 0.001 0% Low
DU04 62,548,890 0.362 0.355 0.044 0.717 0.067 10% Low
DU05 60,125,868 0.370 0.268 0.022 0.638 0.004 1% Low
DU06 39,513,589 0.192 0.160 0.010 0.353 0.051 15% Low
Carruthers CA01 39,204,411 0.131 0.109 0.016 0.240 0.000 0% Low
Lake Ontario
LO01 24,045,851 0.064 0.009 0.000 0.073 0.045 61% Significant
LO02 39,823,376 0.159 0.030 0.000 0.189 0.021 11% Low
LO03 23,973,922 0.062 0.082 0.000 0.143 0.019 13% Low
LO04 16,047,825 0.052 0.075 0.000 0.127 0.000 0% Low
LO05 4,816,221 0.017 0.011 0.000 0.027 0.000 0% Low
LO06 3,317,605 0.012 0.009 0.000 0.021 0.000 0% Low
Notes: All water supply and demand numbers are presented in m3/s.
QReserve is calculated as 10% of the groundwater discharge
Table C-31: groundwater stress assessment (future Conditions, february)
WatershedSub-
watershedArea (km2)
QR (m3/s)
QIN (m3/s)
QReserve (m3/s)
QSupply (m3/s)
QDemand
(m3/s)
% Groundwater
Demand
Groundwater Stress
Assignment
Etobicoke
ET01 34,156,179 0.078 0.072 0.012 0.151 0.000 0% Low
ET02 25,131,283 0.067 0.041 0.007 0.108 0.000 0% Low
ET03 50,208,414 0.181 0.073 0.018 0.254 0.001 0% Low
ET04 102,829,189 0.338 0.091 0.028 0.429 0.003 1% Low
Mimico
MI01 41,550,870 0.104 0.031 0.011 0.136 0.000 0% Low
MI02 13,654,309 0.038 0.022 0.003 0.060 0.000 0% Low
MI03 23,283,286 0.060 0.026 0.005 0.087 0.000 0% Low

Approved January 18, 2012C2-83
Appendix C: Conceptual Water Budget
WatershedSub-
watershedArea (km2)
QR (m3/s)
QIN (m3/s)
QReserve (m3/s)
QSupply (m3/s)
QDemand
(m3/s)
% Groundwater
Demand
Groundwater Stress
Assignment
Humber
HU01 88,712,024 0.261 0.272 0.037 0.533 0.031 6% Low
HU02 60,693,407 0.198 0.133 0.017 0.331 0.002 0% Low
HU03 97,672,514 0.294 0.144 0.028 0.438 0.001 0% Low
HU04 106,770,045 0.281 0.117 0.024 0.398 0.001 0% Low
HU05 92,392,586 0.250 0.280 0.037 0.529 0.006 1% Low
HU06 71,585,430 0.249 0.513 0.046 0.761 0.007 1% Low
HU07 93,818,968 0.637 0.254 0.018 0.891 0.007 1% Low
HU08 30,940,908 0.203 0.212 0.009 0.415 0.008 2% Low
HU09 64,762,224 0.405 0.141 0.025 0.546 0.004 1% Low
HU10 47,760,614 0.260 0.349 0.042 0.610 0.007 1% Low
HU11 47,108,648 0.351 0.176 0.024 0.527 0.009 2% Low
HU12 108,051,916 0.942 0.207 0.107 1.149 0.003 0% Low
Don
DO01 38,272,626 0.137 0.121 0.017 0.258 0.001 0% Low
DO02 33,770,602 0.112 0.139 0.002 0.250 0.000 0% Low
DO03 53,719,251 0.182 0.387 0.028 0.569 0.004 1% Low
DO04 63,874,250 0.249 0.295 0.039 0.544 0.001 0% Low
DO05 58,084,448 0.209 0.270 0.013 0.479 0.028 6% Low
DO06 63,354,811 0.328 0.255 0.031 0.583 0.083 15% Low
DO07 41,736,638 0.164 0.232 0.012 0.395 0.001 0% Low
Highland
HI01 8,943,868 0.028 0.049 0.000 0.076 0.000 0% Low
HI02 10,753,908 0.032 0.121 0.010 0.153 0.000 0% Low
HI03 49,512,432 0.182 0.072 0.008 0.254 0.000 0% Low
HI04 35,886,310 0.127 0.140 0.010 0.267 0.000 0% Low
Rouge
RO01 3,625,105 0.010 0.041 0.003 0.051 0.000 0% Low
RO02 114,380,078 0.443 0.397 0.040 0.840 0.105 13% Low
RO03 63,942,168 0.222 0.319 0.030 0.541 0.001 0% Low
RO04 44,531,561 0.145 0.236 0.016 0.381 0.000 0% Low
RO05 39,891,225 0.205 0.226 0.023 0.431 0.005 1% Low
RO06 30,637,450 0.117 0.283 0.012 0.400 0.003 1% Low
RO07 40,631,187 0.205 0.338 0.019 0.543 0.003 0% Low
Petticoat PE01 24,063,409 0.082 0.097 0.006 0.180 0.000 0% Low
Frenchman's Bay
FR01 25,024,806 0.090 0.036 0.004 0.126 0.000 0% Low

Approved January 18, 2012 C2-84
Approved Assessment Report: Toronto and Region Source Protection Area
WatershedSub-
watershedArea (km2)
QR (m3/s)
QIN (m3/s)
QReserve (m3/s)
QSupply (m3/s)
QDemand
(m3/s)
% Groundwater
Demand
Groundwater Stress
Assignment
Duffins
DU01 24,489,851 0.087 0.037 0.005 0.123 0.000 0% Low
DU02 53,061,108 0.190 0.284 0.026 0.474 0.021 5% Low
DU03 43,998,921 0.150 0.317 0.031 0.467 0.001 0% Low
DU04 62,548,890 0.362 0.355 0.044 0.717 0.074 11% Low
DU05 60,125,868 0.370 0.268 0.022 0.638 0.004 1% Low
DU06 39,513,589 0.192 0.160 0.010 0.353 0.057 17% Low
Carruthers CA01 39,204,411 0.131 0.109 0.016 0.240 0.000 0% Low
Lake Ontario
LO01 24,045,851 0.064 0.009 0.000 0.073 0.050 68% Significant
LO02 39,823,376 0.159 0.030 0.000 0.189 0.024 12% Low
LO03 23,973,922 0.062 0.082 0.000 0.143 0.021 15% Low
LO04 16,047,825 0.052 0.075 0.000 0.127 0.000 0% Low
LO05 4,816,221 0.017 0.011 0.000 0.027 0.000 0% Low
LO06 3,317,605 0.012 0.009 0.000 0.021 0.000 0% Low
Notes: All water supply and demand numbers are presented in m3/s.
QReserve is calculated as 10% of the groundwater discharge
Table C-32: groundwater stress assessment (future Conditions, March)
WatershedSub-
watershedArea (km2)
QR (m3/s)
QIN (m3/s)
QReserve (m3/s)
QSupply (m3/s)
QDemand
(m3/s)
% Groundwater
Demand
Groundwater Stress
Assignment
Etobicoke
ET01 34,156,179 0.078 0.072 0.012 0.151 0.000 0% Low
ET02 25,131,283 0.067 0.041 0.007 0.108 0.000 0% Low
ET03 50,208,414 0.181 0.073 0.018 0.254 0.001 0% Low
ET04 102,829,189 0.338 0.091 0.028 0.429 0.002 1% Low
Mimico
MI01 41,550,870 0.104 0.031 0.011 0.136 0.000 0% Low
MI02 13,654,309 0.038 0.022 0.003 0.060 0.000 0% Low
MI03 23,283,286 0.060 0.026 0.005 0.087 0.000 0% Low

Approved January 18, 2012C2-85
Appendix C: Conceptual Water Budget
WatershedSub-
watershedArea (km2)
QR (m3/s)
QIN (m3/s)
QReserve (m3/s)
QSupply (m3/s)
QDemand
(m3/s)
% Groundwater
Demand
Groundwater Stress
Assignment
Humber
HU01 88,712,024 0.261 0.272 0.037 0.533 0.028 6% Low
HU02 60,693,407 0.198 0.133 0.017 0.331 0.001 0% Low
HU03 97,672,514 0.294 0.144 0.028 0.438 0.001 0% Low
HU04 106,770,045 0.281 0.117 0.024 0.398 0.001 0% Low
HU05 92,392,586 0.250 0.280 0.037 0.529 0.005 1% Low
HU06 71,585,430 0.249 0.513 0.046 0.761 0.006 1% Low
HU07 93,818,968 0.637 0.254 0.018 0.891 0.006 1% Low
HU08 30,940,908 0.203 0.212 0.009 0.415 0.007 2% Low
HU09 64,762,224 0.405 0.141 0.025 0.546 0.003 1% Low
HU10 47,760,614 0.260 0.349 0.042 0.610 0.007 1% Low
HU11 47,108,648 0.351 0.176 0.024 0.527 0.008 2% Low
HU12 108,051,916 0.942 0.207 0.107 1.149 0.003 0% Low
Don
DO01 38,272,626 0.137 0.121 0.017 0.258 0.001 0% Low
DO02 33,770,602 0.112 0.139 0.002 0.250 0.000 0% Low
DO03 53,719,251 0.182 0.387 0.028 0.569 0.003 1% Low
DO04 63,874,250 0.249 0.295 0.039 0.544 0.001 0% Low
DO05 58,084,448 0.209 0.270 0.013 0.479 0.026 6% Low
DO06 63,354,811 0.328 0.255 0.031 0.583 0.075 14% Low
DO07 41,736,638 0.164 0.232 0.012 0.395 0.001 0% Low
Highland
HI01 8,943,868 0.028 0.049 0.000 0.076 0.000 0% Low
HI02 10,753,908 0.032 0.121 0.010 0.153 0.000 0% Low
HI03 49,512,432 0.182 0.072 0.008 0.254 0.000 0% Low
HI04 35,886,310 0.127 0.140 0.010 0.267 0.000 0% Low
Rouge
RO01 3,625,105 0.010 0.041 0.003 0.051 0.000 0% Low
RO02 114,380,078 0.443 0.397 0.040 0.840 0.095 12% Low
RO03 63,942,168 0.222 0.319 0.030 0.541 0.001 0% Low
RO04 44,531,561 0.145 0.236 0.016 0.381 0.000 0% Low
RO05 39,891,225 0.205 0.226 0.023 0.431 0.004 1% Low
RO06 30,637,450 0.117 0.283 0.012 0.400 0.003 1% Low
RO07 40,631,187 0.205 0.338 0.019 0.543 0.002 0% Low
Petticoat PE01 24,063,409 0.082 0.097 0.006 0.180 0.000 0% Low
Frenchman's Bay
FR01 25,024,806 0.090 0.036 0.004 0.126 0.000 0% Low

Approved January 18, 2012 C2-86
Approved Assessment Report: Toronto and Region Source Protection Area
WatershedSub-
watershedArea (km2)
QR (m3/s)
QIN (m3/s)
QReserve (m3/s)
QSupply (m3/s)
QDemand
(m3/s)
% Groundwater
Demand
Groundwater Stress
Assignment
Duffins
DU01 24,489,851 0.087 0.037 0.005 0.123 0.000 0% Low
DU02 53,061,108 0.190 0.284 0.026 0.474 0.019 4% Low
DU03 43,998,921 0.150 0.317 0.031 0.467 0.001 0% Low
DU04 62,548,890 0.362 0.355 0.044 0.717 0.002 0% Low
DU05 60,125,868 0.370 0.268 0.022 0.638 0.004 1% Low
DU06 39,513,589 0.192 0.160 0.010 0.353 0.051 15% Low
Carruthers CA01 39,204,411 0.131 0.109 0.016 0.240 0.000 0% Low
Lake Ontario
LO01 24,045,851 0.064 0.009 0.000 0.073 0.045 61% Significant
LO02 39,823,376 0.159 0.030 0.000 0.189 0.021 11% Low
LO03 23,973,922 0.062 0.082 0.000 0.143 0.019 13% Low
LO04 16,047,825 0.052 0.075 0.000 0.127 0.000 0% Low
LO05 4,816,221 0.017 0.011 0.000 0.027 0.000 0% Low
LO06 3,317,605 0.012 0.009 0.000 0.021 0.000 0% Low
Notes: All water supply and demand numbers are presented in m3/s.
QReserve is calculated as 10% of the groundwater discharge
Table C-33: groundwater stress assessment (future Conditions, april)
WatershedSub-
watershedArea (km2)
QR (m3/s)
QIN (m3/s)
QReserve (m3/s)
QSupply (m3/s)
QDemand
(m3/s)
% Groundwater
Demand
Groundwater Stress
Assignment
Etobicoke
ET01 34,156,179 0.078 0.072 0.012 0.151 0.000 0% Low
ET02 25,131,283 0.067 0.041 0.007 0.108 0.000 0% Low
ET03 50,208,414 0.181 0.073 0.018 0.254 0.001 0% Low
ET04 102,829,189 0.338 0.091 0.028 0.429 0.003 1% Low
Mimico
MI01 41,550,870 0.104 0.031 0.011 0.136 0.000 0% Low
MI02 13,654,309 0.038 0.022 0.003 0.060 0.000 0% Low
MI03 23,283,286 0.060 0.026 0.005 0.087 0.000 0% Low

Approved January 18, 2012C2-87
Appendix C: Conceptual Water Budget
WatershedSub-
watershedArea (km2)
QR (m3/s)
QIN (m3/s)
QReserve (m3/s)
QSupply (m3/s)
QDemand
(m3/s)
% Groundwater
Demand
Groundwater Stress
Assignment
Humber
HU01 88,712,024 0.261 0.272 0.037 0.533 0.029 6% Low
HU02 60,693,407 0.198 0.133 0.017 0.331 0.001 0% Low
HU03 97,672,514 0.294 0.144 0.028 0.438 0.001 0% Low
HU04 106,770,045 0.281 0.117 0.024 0.398 0.001 0% Low
HU05 92,392,586 0.250 0.280 0.037 0.529 0.005 1% Low
HU06 71,585,430 0.249 0.513 0.046 0.761 0.006 1% Low
HU07 93,818,968 0.637 0.254 0.018 0.891 0.006 1% Low
HU08 30,940,908 0.203 0.212 0.009 0.415 0.007 2% Low
HU09 64,762,224 0.405 0.141 0.025 0.546 0.003 1% Low
HU10 47,760,614 0.260 0.349 0.042 0.610 0.007 1% Low
HU11 47,108,648 0.351 0.176 0.024 0.527 0.008 2% Low
HU12 108,051,916 0.942 0.207 0.107 1.149 0.003 0% Low
Don
DO01 38,272,626 0.137 0.121 0.017 0.258 0.001 0% Low
DO02 33,770,602 0.112 0.139 0.002 0.250 0.000 0% Low
DO03 53,719,251 0.182 0.387 0.028 0.569 0.003 1% Low
DO04 63,874,250 0.249 0.295 0.039 0.544 0.001 0% Low
DO05 58,084,448 0.209 0.270 0.013 0.479 0.027 6% Low
DO06 63,354,811 0.328 0.255 0.031 0.583 0.078 14% Low
DO07 41,736,638 0.164 0.232 0.012 0.395 0.001 0% Low
Highland
HI01 8,943,868 0.028 0.049 0.000 0.076 0.000 0% Low
HI02 10,753,908 0.032 0.121 0.010 0.153 0.000 0% Low
HI03 49,512,432 0.182 0.072 0.008 0.254 0.000 0% Low
HI04 35,886,310 0.127 0.140 0.010 0.267 0.000 0% Low
Rouge
RO01 3,625,105 0.010 0.041 0.003 0.051 0.000 0% Low
RO02 114,380,078 0.443 0.397 0.040 0.840 0.098 12% Low
RO03 63,942,168 0.222 0.319 0.030 0.541 0.001 0% Low
RO04 44,531,561 0.145 0.236 0.016 0.381 0.000 0% Low
RO05 39,891,225 0.205 0.226 0.023 0.431 0.004 1% Low
RO06 30,637,450 0.117 0.283 0.012 0.400 0.003 1% Low
RO07 40,631,187 0.205 0.338 0.019 0.543 0.002 0% Low
Petticoat PE01 24,063,409 0.082 0.097 0.006 0.180 0.000 0% Low
Frenchman's Bay
FR01 25,024,806 0.090 0.036 0.004 0.126 0.000 0% Low

Approved January 18, 2012 C2-88
Approved Assessment Report: Toronto and Region Source Protection Area
WatershedSub-
watershedArea (km2)
QR (m3/s)
QIN (m3/s)
QReserve (m3/s)
QSupply (m3/s)
QDemand
(m3/s)
% Groundwater
Demand
Groundwater Stress
Assignment
Duffins
DU01 24,489,851 0.087 0.037 0.005 0.123 0.000 0% Low
DU02 53,061,108 0.190 0.284 0.026 0.474 0.020 4% Low
DU03 43,998,921 0.150 0.317 0.031 0.467 0.001 0% Low
DU04 62,548,890 0.362 0.355 0.044 0.717 0.002 0% Low
DU05 60,125,868 0.370 0.268 0.022 0.638 0.004 1% Low
DU06 39,513,589 0.192 0.160 0.010 0.353 0.053 15% Low
Carruthers CA01 39,204,411 0.131 0.109 0.016 0.240 0.000 0% Low
Lake Ontario
LO01 24,045,851 0.064 0.009 0.000 0.073 0.047 64% Significant
LO02 39,823,376 0.159 0.030 0.000 0.189 0.022 12% Low
LO03 23,973,922 0.062 0.082 0.000 0.143 0.019 14% Low
LO04 16,047,825 0.052 0.075 0.000 0.127 0.000 0% Low
LO05 4,816,221 0.017 0.011 0.000 0.027 0.000 0% Low
LO06 3,317,605 0.012 0.009 0.000 0.021 0.000 0% Low
Notes: All water supply and demand numbers are presented in m3/s.
QReserve is calculated as 10% of the groundwater discharge
Table C-34: groundwater stress assessment (future Conditions, May)
WatershedSub-
watershedArea (km2)
QR (m3/s)
QIN (m3/s)
QReserve (m3/s)
QSupply (m3/s)
QDemand
(m3/s)
% Groundwater
Demand
Groundwater Stress
Assignment
Etobicoke
ET01 34,156,179 0.078 0.072 0.012 0.151 0.000 0% Low
ET02 25,131,283 0.067 0.041 0.007 0.108 0.000 0% Low
ET03 50,208,414 0.181 0.073 0.018 0.254 0.001 0% Low
ET04 102,829,189 0.338 0.091 0.028 0.429 0.002 1% Low
Mimico
MI01 41,550,870 0.104 0.031 0.011 0.136 0.000 0% Low
MI02 13,654,309 0.038 0.022 0.003 0.060 0.000 0% Low
MI03 23,283,286 0.060 0.026 0.005 0.087 0.000 0% Low

Approved January 18, 2012C2-89
Appendix C: Conceptual Water Budget
WatershedSub-
watershedArea (km2)
QR (m3/s)
QIN (m3/s)
QReserve (m3/s)
QSupply (m3/s)
QDemand
(m3/s)
% Groundwater
Demand
Groundwater Stress
Assignment
Humber
HU01 88,712,024 0.261 0.272 0.037 0.533 0.028 6% Low
HU02 60,693,407 0.198 0.133 0.017 0.331 0.001 0% Low
HU03 97,672,514 0.294 0.144 0.028 0.438 0.001 0% Low
HU04 106,770,045 0.281 0.117 0.024 0.398 0.001 0% Low
HU05 92,392,586 0.250 0.280 0.037 0.529 0.005 1% Low
HU06 71,585,430 0.249 0.513 0.046 0.761 0.006 1% Low
HU07 93,818,968 0.637 0.254 0.018 0.891 0.006 1% Low
HU08 30,940,908 0.203 0.212 0.009 0.415 0.007 2% Low
HU09 64,762,224 0.405 0.141 0.025 0.546 0.003 1% Low
HU10 47,760,614 0.260 0.349 0.042 0.610 0.007 1% Low
HU11 47,108,648 0.351 0.176 0.024 0.527 0.008 2% Low
HU12 108,051,916 0.942 0.207 0.107 1.149 0.003 0% Low
Don
DO01 38,272,626 0.137 0.121 0.017 0.258 0.001 0% Low
DO02 33,770,602 0.112 0.139 0.002 0.250 0.000 0% Low
DO03 53,719,251 0.182 0.387 0.028 0.569 0.003 1% Low
DO04 63,874,250 0.249 0.295 0.039 0.544 0.001 0% Low
DO05 58,084,448 0.209 0.270 0.013 0.479 0.026 6% Low
DO06 63,354,811 0.328 0.255 0.031 0.583 0.075 14% Low
DO07 41,736,638 0.164 0.232 0.012 0.395 0.001 0% Low
Highland
HI01 8,943,868 0.028 0.049 0.000 0.076 0.000 0% Low
HI02 10,753,908 0.032 0.121 0.010 0.153 0.000 0% Low
HI03 49,512,432 0.182 0.072 0.008 0.254 0.000 0% Low
HI04 35,886,310 0.127 0.140 0.010 0.267 0.000 0% Low
Rouge
RO01 3,625,105 0.010 0.041 0.003 0.051 0.000 0% Low
RO02 114,380,078 0.443 0.397 0.040 0.840 0.099 12% Low
RO03 63,942,168 0.222 0.319 0.030 0.541 0.001 0% Low
RO04 44,531,561 0.145 0.236 0.016 0.381 0.002 1% Low
RO05 39,891,225 0.205 0.226 0.023 0.431 0.004 1% Low
RO06 30,637,450 0.117 0.283 0.012 0.400 0.003 1% Low
RO07 40,631,187 0.205 0.338 0.019 0.543 0.002 0% Low
Petticoat PE01 24,063,409 0.082 0.097 0.006 0.180 0.000 0% Low
Frenchman's Bay
FR01 25,024,806 0.090 0.036 0.004 0.126 0.000 0% Low

Approved January 18, 2012 C2-90
Approved Assessment Report: Toronto and Region Source Protection Area
WatershedSub-
watershedArea (km2)
QR (m3/s)
QIN (m3/s)
QReserve (m3/s)
QSupply (m3/s)
QDemand
(m3/s)
% Groundwater
Demand
Groundwater Stress
Assignment
Duffins
DU01 24,489,851 0.087 0.037 0.005 0.123 0.000 0% Low
DU02 53,061,108 0.190 0.284 0.026 0.474 0.019 4% Low
DU03 43,998,921 0.150 0.317 0.031 0.467 0.001 0% Low
DU04 62,548,890 0.362 0.355 0.044 0.717 0.002 0% Low
DU05 60,125,868 0.370 0.268 0.022 0.638 0.004 1% Low
DU06 39,513,589 0.192 0.160 0.010 0.353 0.057 17% Low
Carruthers CA01 39,204,411 0.131 0.109 0.016 0.240 0.000 0% Low
Lake Ontario
LO01 24,045,851 0.064 0.009 0.000 0.073 0.045 61% Significant
LO02 39,823,376 0.159 0.030 0.000 0.189 0.021 11% Low
LO03 23,973,922 0.062 0.082 0.000 0.143 0.019 13% Low
LO04 16,047,825 0.052 0.075 0.000 0.127 0.000 0% Low
LO05 4,816,221 0.017 0.011 0.000 0.027 0.000 0% Low
LO06 3,317,605 0.012 0.009 0.000 0.021 0.000 0% Low
Notes: All water supply and demand numbers are presented in m3/s.
QReserve is calculated as 10% of the groundwater discharge
Table C-35: groundwater stress assessment (future Conditions, June)
WatershedSub-
watershedArea (km2)
QR (m3/s)
QIN (m3/s)
QReserve (m3/s)
QSupply (m3/s)
QDemand
(m3/s)
% Groundwater
Demand
Groundwater Stress
Assignment
Etobicoke
ET01 34,156,179 0.078 0.072 0.012 0.151 0.000 0% Low
ET02 25,131,283 0.067 0.041 0.007 0.108 0.000 0% Low
ET03 50,208,414 0.181 0.073 0.018 0.254 0.001 0% Low
ET04 102,829,189 0.338 0.091 0.028 0.429 0.003 1% Low
Mimico
MI01 41,550,870 0.104 0.031 0.011 0.136 0.000 0% Low
MI02 13,654,309 0.038 0.022 0.003 0.060 0.000 0% Low
MI03 23,283,286 0.060 0.026 0.005 0.087 0.000 0% Low

Approved January 18, 2012C2-91
Appendix C: Conceptual Water Budget
WatershedSub-
watershedArea (km2)
QR (m3/s)
QIN (m3/s)
QReserve (m3/s)
QSupply (m3/s)
QDemand
(m3/s)
% Groundwater
Demand
Groundwater Stress
Assignment
Humber
HU01 88,712,024 0.261 0.272 0.037 0.533 0.029 6% Low
HU02 60,693,407 0.198 0.133 0.017 0.331 0.001 0% Low
HU03 97,672,514 0.294 0.144 0.028 0.438 0.006 1% Low
HU04 106,770,045 0.281 0.117 0.024 0.398 0.003 1% Low
HU05 92,392,586 0.250 0.280 0.037 0.529 0.008 2% Low
HU06 71,585,430 0.249 0.513 0.046 0.761 0.006 1% Low
HU07 93,818,968 0.637 0.254 0.018 0.891 0.011 1% Low
HU08 30,940,908 0.203 0.212 0.009 0.415 0.015 4% Low
HU09 64,762,224 0.405 0.141 0.025 0.546 0.007 1% Low
HU10 47,760,614 0.260 0.349 0.042 0.610 0.007 1% Low
HU11 47,108,648 0.351 0.176 0.024 0.527 0.008 2% Low
HU12 108,051,916 0.942 0.207 0.107 1.149 0.003 0% Low
Don
DO01 38,272,626 0.137 0.121 0.017 0.258 0.001 0% Low
DO02 33,770,602 0.112 0.139 0.002 0.250 0.000 0% Low
DO03 53,719,251 0.182 0.387 0.028 0.569 0.003 1% Low
DO04 63,874,250 0.249 0.295 0.039 0.544 0.010 2% Low
DO05 58,084,448 0.209 0.270 0.013 0.479 0.043 9% Low
DO06 63,354,811 0.328 0.255 0.031 0.583 0.087 16% Low
DO07 41,736,638 0.164 0.232 0.012 0.395 0.002 1% Low
Highland
HI01 8,943,868 0.028 0.049 0.000 0.076 0.000 0% Low
HI02 10,753,908 0.032 0.121 0.010 0.153 0.000 0% Low
HI03 49,512,432 0.182 0.072 0.008 0.254 0.000 0% Low
HI04 35,886,310 0.127 0.140 0.010 0.267 0.000 0% Low
Rouge
RO01 3,625,105 0.010 0.041 0.003 0.051 0.000 0% Low
RO02 114,380,078 0.443 0.397 0.040 0.840 0.115 14% Low
RO03 63,942,168 0.222 0.319 0.030 0.541 0.001 0% Low
RO04 44,531,561 0.145 0.236 0.016 0.381 0.002 1% Low
RO05 39,891,225 0.205 0.226 0.023 0.431 0.010 2% Low
RO06 30,637,450 0.117 0.283 0.012 0.400 0.010 3% Low
RO07 40,631,187 0.205 0.338 0.019 0.543 0.024 5% Low
Petticoat PE01 24,063,409 0.082 0.097 0.006 0.180 0.000 0% Low
Frenchman's Bay
FR01 25,024,806 0.090 0.036 0.004 0.126 0.000 0% Low

Approved January 18, 2012 C2-92
Approved Assessment Report: Toronto and Region Source Protection Area
WatershedSub-
watershedArea (km2)
QR (m3/s)
QIN (m3/s)
QReserve (m3/s)
QSupply (m3/s)
QDemand
(m3/s)
% Groundwater
Demand
Groundwater Stress
Assignment
Duffins
DU01 24,489,851 0.087 0.037 0.005 0.123 0.000 0% Low
DU02 53,061,108 0.190 0.284 0.026 0.474 0.020 4% Low
DU03 43,998,921 0.150 0.317 0.031 0.467 0.007 2% Low
DU04 62,548,890 0.362 0.355 0.044 0.717 0.002 0% Low
DU05 60,125,868 0.370 0.268 0.022 0.638 0.059 10% Low
DU06 39,513,589 0.192 0.160 0.010 0.353 0.062 18% Low
Carruthers CA01 39,204,411 0.131 0.109 0.016 0.240 0.002 1% Low
Lake Ontario
LO01 24,045,851 0.064 0.009 0.000 0.073 0.047 64% Significant
LO02 39,823,376 0.159 0.030 0.000 0.189 0.022 12% Low
LO03 23,973,922 0.062 0.082 0.000 0.143 0.033 23% Low
LO04 16,047,825 0.052 0.075 0.000 0.127 0.000 0% Low
LO05 4,816,221 0.017 0.011 0.000 0.027 0.000 0% Low
LO06 3,317,605 0.012 0.009 0.000 0.021 0.000 0% Low
Notes: All water supply and demand numbers are presented in m3/s.
QReserve is calculated as 10% of the groundwater discharge
Table C-36: groundwater stress assessment (future Conditions, July)
WatershedSub-
watershedArea (km2)
QR (m3/s)
QIN (m3/s)
QReserve (m3/s)
QOut (m3/s)
QSupply (m3/s)
QDemand
(m3/s)
% Groundwater
Demand
Groundwater Stress
Assignment
Etobicoke
ET01 34,156,179 0.078 0.072 0.012 0.012 0.151 0.000 0% Low
ET02 25,131,283 0.067 0.041 0.007 0.007 0.108 0.000 0% Low
ET03 50,208,414 0.181 0.073 0.018 0.018 0.254 0.001 0% Low
ET04 102,829,189 0.338 0.091 0.028 0.028 0.429 0.004 1% Low
Mimico
MI01 41,550,870 0.104 0.031 0.011 0.011 0.136 0.000 0% Low
MI02 13,654,309 0.038 0.022 0.003 0.003 0.060 0.000 0% Low
MI03 23,283,286 0.060 0.026 0.005 0.005 0.087 0.000 0% Low

Approved January 18, 2012C2-93
Appendix C: Conceptual Water Budget
WatershedSub-
watershedArea (km2)
QR (m3/s)
QIN (m3/s)
QReserve (m3/s)
QOut (m3/s)
QSupply (m3/s)
QDemand
(m3/s)
% Groundwater
Demand
Groundwater Stress
Assignment
Humber
HU01 88,712,024 0.261 0.272 0.037 0.037 0.533 0.028 6% Low
HU02 60,693,407 0.198 0.133 0.017 0.017 0.331 0.001 0% Low
HU03 97,672,514 0.294 0.144 0.028 0.028 0.438 0.006 1% Low
HU04 106,770,045 0.281 0.117 0.024 0.024 0.398 0.005 1% Low
HU05 92,392,586 0.250 0.280 0.037 0.037 0.529 0.035 7% Low
HU06 71,585,430 0.249 0.513 0.046 0.046 0.761 0.016 2% Low
HU07 93,818,968 0.637 0.254 0.018 0.018 0.891 0.017 2% Low
HU08 30,940,908 0.203 0.212 0.009 0.009 0.415 0.015 4% Low
HU09 64,762,224 0.405 0.141 0.025 0.025 0.546 0.041 8% Low
HU10 47,760,614 0.260 0.349 0.042 0.042 0.610 0.008 1% Low
HU11 47,108,648 0.351 0.176 0.024 0.024 0.527 0.008 2% Low
HU12 108,051,916 0.942 0.207 0.107 0.107 1.149 0.003 0% Low
Don
DO01 38,272,626 0.137 0.121 0.017 0.017 0.258 0.001 0% Low
DO02 33,770,602 0.112 0.139 0.002 0.002 0.250 0.000 0% Low
DO03 53,719,251 0.182 0.387 0.028 0.028 0.569 0.003 1% Low
DO04 63,874,250 0.249 0.295 0.039 0.039 0.544 0.010 2% Low
DO05 58,084,448 0.209 0.270 0.013 0.013 0.479 0.043 9% Low
DO06 63,354,811 0.328 0.255 0.031 0.031 0.583 0.086 16% Low
DO07 41,736,638 0.164 0.232 0.012 0.012 0.395 0.002 1% Low
Highland
HI01 8,943,868 0.028 0.049 0.000 0.000 0.076 0.000 0% Low
HI02 10,753,908 0.032 0.121 0.010 0.010 0.153 0.000 0% Low
HI03 49,512,432 0.182 0.072 0.008 0.008 0.254 0.000 0% Low
HI04 35,886,310 0.127 0.140 0.010 0.010 0.267 0.000 0% Low
Rouge
RO01 3,625,105 0.010 0.041 0.003 0.003 0.051 0.000 0% Low
RO02 114,380,078 0.443 0.397 0.040 0.040 0.840 0.172 22% Low
RO03 63,942,168 0.222 0.319 0.030 0.030 0.541 0.002 0% Low
RO04 44,531,561 0.145 0.236 0.016 0.016 0.381 0.002 1% Low
RO05 39,891,225 0.205 0.226 0.023 0.023 0.431 0.018 4% Low
RO06 30,637,450 0.117 0.283 0.012 0.012 0.400 0.010 3% Low
RO07 40,631,187 0.205 0.338 0.019 0.019 0.543 0.024 5% Low
Petticoat PE01 24,063,409 0.082 0.097 0.006 0.006 0.180 0.000 0% Low
Frenchman's Bay
FR01 25,024,806 0.090 0.036 0.004 0.004 0.126 0.000 0% Low

Approved January 18, 2012 C2-94
Approved Assessment Report: Toronto and Region Source Protection Area
WatershedSub-
watershedArea (km2)
QR (m3/s)
QIN (m3/s)
QReserve (m3/s)
QOut (m3/s)
QSupply (m3/s)
QDemand
(m3/s)
% Groundwater
Demand
Groundwater Stress
Assignment
Duffins
DU01 24,489,851 0.087 0.037 0.005 0.005 0.123 0.000 0% Low
DU02 53,061,108 0.190 0.284 0.026 0.026 0.474 0.019 4% Low
DU03 43,998,921 0.150 0.317 0.031 0.031 0.467 0.020 4% Low
DU04 62,548,890 0.362 0.355 0.044 0.044 0.717 0.003 0% Low
DU05 60,125,868 0.370 0.268 0.022 0.022 0.638 0.059 10% Low
DU06 39,513,589 0.192 0.160 0.010 0.010 0.353 0.062 18% Low
Carruthers CA01 39,204,411 0.131 0.109 0.016 0.016 0.240 0.019 8% Low
Lake Ontario
LO01 24,045,851 0.064 0.009 0.000 0.000 0.073 0.045 61% Significant
LO02 39,823,376 0.159 0.030 0.000 0.000 0.189 0.021 11% Low
LO03 23,973,922 0.062 0.082 0.000 0.000 0.143 0.032 22% Low
LO04 16,047,825 0.052 0.075 0.000 0.000 0.127 0.000 0% Low
LO05 4,816,221 0.017 0.011 0.000 0.000 0.027 0.000 0% Low
LO06 3,317,605 0.012 0.009 0.000 0.000 0.021 0.000 0% Low
Notes: All water supply and demand numbers are presented in m3/s.
QReserve is calculated as 10% of the groundwater discharge
Table C-37: groundwater stress assessment (future Conditions, august)
WatershedSub-
watershedArea (km2)
QR (m3/s)
QIN (m3/s)
QReserve (m3/s)
QSupply (m3/s)
QDemand
(m3/s)
% Groundwater
Demand
Groundwater Stress
Assignment
Etobicoke
ET01 34,156,179 0.078 0.072 0.012 0.151 0.000 0% Low
ET02 25,131,283 0.067 0.041 0.007 0.108 0.000 0% Low
ET03 50,208,414 0.181 0.073 0.018 0.254 0.001 0% Low
ET04 102,829,189 0.338 0.091 0.028 0.429 0.004 1% Low
Mimico
MI01 41,550,870 0.104 0.031 0.011 0.136 0.000 0% Low
MI02 13,654,309 0.038 0.022 0.003 0.060 0.000 0% Low
MI03 23,283,286 0.060 0.026 0.005 0.087 0.000 0% Low

Approved January 18, 2012C2-95
Appendix C: Conceptual Water Budget
WatershedSub-
watershedArea (km2)
QR (m3/s)
QIN (m3/s)
QReserve (m3/s)
QSupply (m3/s)
QDemand
(m3/s)
% Groundwater
Demand
Groundwater Stress
Assignment
Humber
HU01 88,712,024 0.261 0.272 0.037 0.533 0.028 6% Low
HU02 60,693,407 0.198 0.133 0.017 0.331 0.001 0% Low
HU03 97,672,514 0.294 0.144 0.028 0.438 0.006 1% Low
HU04 106,770,045 0.281 0.117 0.024 0.398 0.005 1% Low
HU05 92,392,586 0.250 0.280 0.037 0.529 0.035 7% Low
HU06 71,585,430 0.249 0.513 0.046 0.761 0.016 2% Low
HU07 93,818,968 0.637 0.254 0.018 0.891 0.017 2% Low
HU08 30,940,908 0.203 0.212 0.009 0.415 0.015 4% Low
HU09 64,762,224 0.405 0.141 0.025 0.546 0.041 8% Low
HU10 47,760,614 0.260 0.349 0.042 0.610 0.008 1% Low
HU11 47,108,648 0.351 0.176 0.024 0.527 0.008 2% Low
HU12 108,051,916 0.942 0.207 0.107 1.149 0.003 0% Low
Don
DO01 38,272,626 0.137 0.121 0.017 0.258 0.001 0% Low
DO02 33,770,602 0.112 0.139 0.002 0.250 0.000 0% Low
DO03 53,719,251 0.182 0.387 0.028 0.569 0.003 1% Low
DO04 63,874,250 0.249 0.295 0.039 0.544 0.010 2% Low
DO05 58,084,448 0.209 0.270 0.013 0.479 0.043 9% Low
DO06 63,354,811 0.328 0.255 0.031 0.583 0.086 16% Low
DO07 41,736,638 0.164 0.232 0.012 0.395 0.002 1% Low
Highland
HI01 8,943,868 0.028 0.049 0.000 0.076 0.000 0% Low
HI02 10,753,908 0.032 0.121 0.010 0.153 0.000 0% Low
HI03 49,512,432 0.182 0.072 0.008 0.254 0.000 0% Low
HI04 35,886,310 0.127 0.140 0.010 0.267 0.000 0% Low
Rouge
RO01 3,625,105 0.010 0.041 0.003 0.051 0.000 0% Low
RO02 114,380,078 0.443 0.397 0.040 0.840 0.172 22% Low
RO03 63,942,168 0.222 0.319 0.030 0.541 0.002 0% Low
RO04 44,531,561 0.145 0.236 0.016 0.381 0.002 1% Low
RO05 39,891,225 0.205 0.226 0.023 0.431 0.018 4% Low
RO06 30,637,450 0.117 0.283 0.012 0.400 0.010 3% Low
RO07 40,631,187 0.205 0.338 0.019 0.543 0.024 5% Low
Petticoat PE01 24,063,409 0.082 0.097 0.006 0.180 0.000 0% Low
Frenchman's Bay
FR01 25,024,806 0.090 0.036 0.004 0.126 0.000 0% Low

Approved January 18, 2012 C2-96
Approved Assessment Report: Toronto and Region Source Protection Area
WatershedSub-
watershedArea (km2)
QR (m3/s)
QIN (m3/s)
QReserve (m3/s)
QSupply (m3/s)
QDemand
(m3/s)
% Groundwater
Demand
Groundwater Stress
Assignment
Duffins
DU01 24,489,851 0.087 0.037 0.005 0.123 0.000 0% Low
DU02 53,061,108 0.190 0.284 0.026 0.474 0.019 4% Low
DU03 43,998,921 0.150 0.317 0.031 0.467 0.020 4% Low
DU04 62,548,890 0.362 0.355 0.044 0.717 0.003 0% Low
DU05 60,125,868 0.370 0.268 0.022 0.638 0.059 10% Low
DU06 39,513,589 0.192 0.160 0.010 0.353 0.062 18% Low
Carruthers CA01 39,204,411 0.131 0.109 0.016 0.240 0.019 8% Low
Lake Ontario
LO01 24,045,851 0.064 0.009 0.000 0.073 0.045 61% Significant
LO02 39,823,376 0.159 0.030 0.000 0.189 0.021 11% Low
LO03 23,973,922 0.062 0.082 0.000 0.143 0.032 22% Low
LO04 16,047,825 0.052 0.075 0.000 0.127 0.000 0% Low
LO05 4,816,221 0.017 0.011 0.000 0.027 0.000 0% Low
LO06 3,317,605 0.012 0.009 0.000 0.021 0.000 0% Low
Notes: All water supply and demand numbers are presented in m3/s.
QReserve is calculated as 10% of the groundwater discharge
Table C-38: groundwater stress assessment (future Conditions, september)
WatershedSub-
watershedArea (km2)
QR (m3/s)
QIN (m3/s)
Qinflow (m3/s)
QReserve (m3/s)
QSupply (m3/s)
QDemand
(m3/s)
% Groundwater
Demand
Groundwater Stress
Assignment
Etobicoke
ET01 34,156,179 0.078 0.072 0.151 0.012 0.151 0.000 0% Low
ET02 25,131,283 0.067 0.041 0.108 0.007 0.108 0.000 0% Low
ET03 50,208,414 0.181 0.073 0.254 0.018 0.254 0.001 0% Low
ET04 102,829,189 0.338 0.091 0.429 0.028 0.429 0.003 1% Low
Mimico
MI01 41,550,870 0.104 0.031 0.136 0.011 0.136 0.000 0% Low
MI02 13,654,309 0.038 0.022 0.060 0.003 0.060 0.000 0% Low
MI03 23,283,286 0.060 0.026 0.087 0.005 0.087 0.000 0% Low

Approved January 18, 2012C2-97
Appendix C: Conceptual Water Budget
WatershedSub-
watershedArea (km2)
QR (m3/s)
QIN (m3/s)
Qinflow (m3/s)
QReserve (m3/s)
QSupply (m3/s)
QDemand
(m3/s)
% Groundwater
Demand
Groundwater Stress
Assignment
Humber
HU01 88,712,024 0.261 0.272 0.533 0.037 0.533 0.029 6% Low
HU02 60,693,407 0.198 0.133 0.331 0.017 0.331 0.001 0% Low
HU03 97,672,514 0.294 0.144 0.438 0.028 0.438 0.006 1% Low
HU04 106,770,045 0.281 0.117 0.398 0.024 0.398 0.003 1% Low
HU05 92,392,586 0.250 0.280 0.529 0.037 0.529 0.008 2% Low
HU06 71,585,430 0.249 0.513 0.761 0.046 0.761 0.006 1% Low
HU07 93,818,968 0.637 0.254 0.891 0.018 0.891 0.011 1% Low
HU08 30,940,908 0.203 0.212 0.415 0.009 0.415 0.015 4% Low
HU09 64,762,224 0.405 0.141 0.546 0.025 0.546 0.007 1% Low
HU10 47,760,614 0.260 0.349 0.610 0.042 0.610 0.007 1% Low
HU11 47,108,648 0.351 0.176 0.527 0.024 0.527 0.008 2% Low
HU12 108,051,916 0.942 0.207 1.149 0.107 1.149 0.003 0% Low
Don
DO01 38,272,626 0.137 0.121 0.258 0.017 0.258 0.001 0% Low
DO02 33,770,602 0.112 0.139 0.250 0.002 0.250 0.000 0% Low
DO03 53,719,251 0.182 0.387 0.569 0.028 0.569 0.003 1% Low
DO04 63,874,250 0.249 0.295 0.544 0.039 0.544 0.010 2% Low
DO05 58,084,448 0.209 0.270 0.479 0.013 0.479 0.043 9% Low
DO06 63,354,811 0.328 0.255 0.583 0.031 0.583 0.087 16% Low
DO07 41,736,638 0.164 0.232 0.395 0.012 0.395 0.002 1% Low
Highland
HI01 8,943,868 0.028 0.049 0.076 0.000 0.076 0.000 0% Low
HI02 10,753,908 0.032 0.121 0.153 0.010 0.153 0.000 0% Low
HI03 49,512,432 0.182 0.072 0.254 0.008 0.254 0.000 0% Low
HI04 35,886,310 0.127 0.140 0.267 0.010 0.267 0.000 0% Low
Rouge
RO01 3,625,105 0.010 0.041 0.051 0.003 0.051 0.000 0% Low
RO02 114,380,078 0.443 0.397 0.840 0.040 0.840 0.115 14% Low
RO03 63,942,168 0.222 0.319 0.541 0.030 0.541 0.001 0% Low
RO04 44,531,561 0.145 0.236 0.381 0.016 0.381 0.002 1% Low
RO05 39,891,225 0.205 0.226 0.431 0.023 0.431 0.010 2% Low
RO06 30,637,450 0.117 0.283 0.400 0.012 0.400 0.010 3% Low
RO07 40,631,187 0.205 0.338 0.543 0.019 0.543 0.024 5% Low
Petticoat PE01 24,063,409 0.082 0.097 0.180 0.006 0.180 0.000 0% Low
Frenchman's Bay
FR01 25,024,806 0.090 0.036 0.126 0.004 0.126 0.000 0% Low

Approved January 18, 2012 C2-98
Approved Assessment Report: Toronto and Region Source Protection Area
WatershedSub-
watershedArea (km2)
QR (m3/s)
QIN (m3/s)
Qinflow (m3/s)
QReserve (m3/s)
QSupply (m3/s)
QDemand
(m3/s)
% Groundwater
Demand
Groundwater Stress
Assignment
Duffins
DU01 24,489,851 0.087 0.037 0.123 0.005 0.123 0.000 0% Low
DU02 53,061,108 0.190 0.284 0.474 0.026 0.474 0.020 4% Low
DU03 43,998,921 0.150 0.317 0.467 0.031 0.467 0.007 2% Low
DU04 62,548,890 0.362 0.355 0.717 0.044 0.717 0.002 0% Low
DU05 60,125,868 0.370 0.268 0.638 0.022 0.638 0.059 10% Low
DU06 39,513,589 0.192 0.160 0.353 0.010 0.353 0.062 18% Low
Carruthers CA01 39,204,411 0.131 0.109 0.240 0.016 0.240 0.002 1% Low
Lake Ontario
LO01 24,045,851 0.064 0.009 0.073 0.000 0.073 0.047 64% Significant
LO02 39,823,376 0.159 0.030 0.189 0.000 0.189 0.022 12% Low
LO03 23,973,922 0.062 0.082 0.143 0.000 0.143 0.033 23% Low
LO04 16,047,825 0.052 0.075 0.127 0.000 0.127 0.000 0% Low
LO05 4,816,221 0.017 0.011 0.027 0.000 0.027 0.000 0% Low
LO06 3,317,605 0.012 0.009 0.021 0.000 0.021 0.000 0% Low
Notes: All water supply and demand numbers are presented in m3/s.
QReserve is calculated as 10% of the groundwater discharge
Table C-39: groundwater stress assessment (future Conditions, october)
WatershedSub-
watershedArea (km2)
QR (m3/s)
QIN (m3/s)
Qinflow (m3/s)
QReserve (m3/s)
QSupply (m3/s)
QDemand
(m3/s)
% Groundwater
Demand
Groundwater Stress
Assignment
Etobicoke
ET01 34,156,179 0.078 0.072 0.151 0.012 0.151 0.000 0% Low
ET02 25,131,283 0.067 0.041 0.108 0.007 0.108 0.000 0% Low
ET03 50,208,414 0.181 0.073 0.254 0.018 0.254 0.001 0% Low
ET04 102,829,189 0.338 0.091 0.429 0.028 0.429 0.002 1% Low
Mimico
MI01 41,550,870 0.104 0.031 0.136 0.011 0.136 0.000 0% Low
MI02 13,654,309 0.038 0.022 0.060 0.003 0.060 0.000 0% Low
MI03 23,283,286 0.060 0.026 0.087 0.005 0.087 0.000 0% Low

Approved January 18, 2012C2-99
Appendix C: Conceptual Water Budget
WatershedSub-
watershedArea (km2)
QR (m3/s)
QIN (m3/s)
Qinflow (m3/s)
QReserve (m3/s)
QSupply (m3/s)
QDemand
(m3/s)
% Groundwater
Demand
Groundwater Stress
Assignment
Humber
HU01 88,712,024 0.261 0.272 0.533 0.037 0.533 0.028 6% Low
HU02 60,693,407 0.198 0.133 0.331 0.017 0.331 0.001 0% Low
HU03 97,672,514 0.294 0.144 0.438 0.028 0.438 0.001 0% Low
HU04 106,770,045 0.281 0.117 0.398 0.024 0.398 0.001 0% Low
HU05 92,392,586 0.250 0.280 0.529 0.037 0.529 0.005 1% Low
HU06 71,585,430 0.249 0.513 0.761 0.046 0.761 0.006 1% Low
HU07 93,818,968 0.637 0.254 0.891 0.018 0.891 0.006 1% Low
HU08 30,940,908 0.203 0.212 0.415 0.009 0.415 0.007 2% Low
HU09 64,762,224 0.405 0.141 0.546 0.025 0.546 0.003 1% Low
HU10 47,760,614 0.260 0.349 0.610 0.042 0.610 0.007 1% Low
HU11 47,108,648 0.351 0.176 0.527 0.024 0.527 0.008 2% Low
HU12 108,051,916 0.942 0.207 1.149 0.107 1.149 0.003 0% Low
Don
DO01 38,272,626 0.137 0.121 0.258 0.017 0.258 0.001 0% Low
DO02 33,770,602 0.112 0.139 0.250 0.002 0.250 0.000 0% Low
DO03 53,719,251 0.182 0.387 0.569 0.028 0.569 0.003 1% Low
DO04 63,874,250 0.249 0.295 0.544 0.039 0.544 0.001 0% Low
DO05 58,084,448 0.209 0.270 0.479 0.013 0.479 0.026 6% Low
DO06 63,354,811 0.328 0.255 0.583 0.031 0.583 0.075 14% Low
DO07 41,736,638 0.164 0.232 0.395 0.012 0.395 0.001 0% Low
Highland
HI01 8,943,868 0.028 0.049 0.076 0.000 0.076 0.000 0% Low
HI02 10,753,908 0.032 0.121 0.153 0.010 0.153 0.000 0% Low
HI03 49,512,432 0.182 0.072 0.254 0.008 0.254 0.000 0% Low
HI04 35,886,310 0.127 0.140 0.267 0.010 0.267 0.000 0% Low
Rouge
RO01 3,625,105 0.010 0.041 0.051 0.003 0.051 0.000 0% Low
RO02 114,380,078 0.443 0.397 0.840 0.040 0.840 0.099 12% Low
RO03 63,942,168 0.222 0.319 0.541 0.030 0.541 0.001 0% Low
RO04 44,531,561 0.145 0.236 0.381 0.016 0.381 0.002 1% Low
RO05 39,891,225 0.205 0.226 0.431 0.023 0.431 0.004 1% Low
RO06 30,637,450 0.117 0.283 0.400 0.012 0.400 0.003 1% Low
RO07 40,631,187 0.205 0.338 0.543 0.019 0.543 0.002 0% Low
Petticoat PE01 24,063,409 0.082 0.097 0.180 0.006 0.180 0.000 0% Low
Frenchman's Bay
FR01 25,024,806 0.090 0.036 0.126 0.004 0.126 0.000 0% Low

Approved January 18, 2012 C2-100
Approved Assessment Report: Toronto and Region Source Protection Area
WatershedSub-
watershedArea (km2)
QR (m3/s)
QIN (m3/s)
Qinflow (m3/s)
QReserve (m3/s)
QSupply (m3/s)
QDemand
(m3/s)
% Groundwater
Demand
Groundwater Stress
Assignment
Duffins
DU01 24,489,851 0.087 0.037 0.123 0.005 0.123 0.000 0% Low
DU02 53,061,108 0.190 0.284 0.474 0.026 0.474 0.019 4% Low
DU03 43,998,921 0.150 0.317 0.467 0.031 0.467 0.001 0% Low
DU04 62,548,890 0.362 0.355 0.717 0.044 0.717 0.002 0% Low
DU05 60,125,868 0.370 0.268 0.638 0.022 0.638 0.004 1% Low
DU06 39,513,589 0.192 0.160 0.353 0.010 0.353 0.057 17% Low
Carruthers CA01 39,204,411 0.131 0.109 0.240 0.016 0.240 0.000 0% Low
Lake Ontario
LO01 24,045,851 0.064 0.009 0.073 0.000 0.073 0.045 61% Significant
LO02 39,823,376 0.159 0.030 0.189 0.000 0.189 0.021 11% Low
LO03 23,973,922 0.062 0.082 0.143 0.000 0.143 0.019 13% Low
LO04 16,047,825 0.052 0.075 0.127 0.000 0.127 0.000 0% Low
LO05 4,816,221 0.017 0.011 0.027 0.000 0.027 0.000 0% Low
LO06 3,317,605 0.012 0.009 0.021 0.000 0.021 0.000 0% Low
Notes: All water supply and demand numbers are presented in m3/s.
QReserve is calculated as 10% of the groundwater discharge
Table C-40: groundwater stress assessment (future Conditions, november)
WatershedSub-
watershedArea (km2)
QR (m3/s)
QIN (m3/s)
QReserve (m3/s)
QSupply (m3/s)
QDemand
(m3/s)
% Groundwater
Demand
Groundwater Stress
Assignment
Etobicoke
ET01 34,156,179 0.078 0.072 0.012 0.151 0.000 0% Low
ET02 25,131,283 0.067 0.041 0.007 0.108 0.000 0% Low
ET03 50,208,414 0.181 0.073 0.018 0.254 0.001 0% Low
ET04 102,829,189 0.338 0.091 0.028 0.429 0.003 1% Low
Mimico
MI01 41,550,870 0.104 0.031 0.011 0.136 0.000 0% Low
MI02 13,654,309 0.038 0.022 0.003 0.060 0.000 0% Low
MI03 23,283,286 0.060 0.026 0.005 0.087 0.000 0% Low

Approved January 18, 2012C2-101
Appendix C: Conceptual Water Budget
WatershedSub-
watershedArea (km2)
QR (m3/s)
QIN (m3/s)
QReserve (m3/s)
QSupply (m3/s)
QDemand
(m3/s)
% Groundwater
Demand
Groundwater Stress
Assignment
Humber
HU01 88,712,024 0.261 0.272 0.037 0.533 0.029 6% Low
HU02 60,693,407 0.198 0.133 0.017 0.331 0.001 0% Low
HU03 97,672,514 0.294 0.144 0.028 0.438 0.001 0% Low
HU04 106,770,045 0.281 0.117 0.024 0.398 0.001 0% Low
HU05 92,392,586 0.250 0.280 0.037 0.529 0.005 1% Low
HU06 71,585,430 0.249 0.513 0.046 0.761 0.006 1% Low
HU07 93,818,968 0.637 0.254 0.018 0.891 0.006 1% Low
HU08 30,940,908 0.203 0.212 0.009 0.415 0.007 2% Low
HU09 64,762,224 0.405 0.141 0.025 0.546 0.003 1% Low
HU10 47,760,614 0.260 0.349 0.042 0.610 0.007 1% Low
HU11 47,108,648 0.351 0.176 0.024 0.527 0.008 2% Low
HU12 108,051,916 0.942 0.207 0.107 1.149 0.003 0% Low
Don
DO01 38,272,626 0.137 0.121 0.017 0.258 0.001 0% Low
DO02 33,770,602 0.112 0.139 0.002 0.250 0.000 0% Low
DO03 53,719,251 0.182 0.387 0.028 0.569 0.003 1% Low
DO04 63,874,250 0.249 0.295 0.039 0.544 0.001 0% Low
DO05 58,084,448 0.209 0.270 0.013 0.479 0.027 6% Low
DO06 63,354,811 0.328 0.255 0.031 0.583 0.078 14% Low
DO07 41,736,638 0.164 0.232 0.012 0.395 0.001 0% Low
Highland
HI01 8,943,868 0.028 0.049 0.000 0.076 0.000 0% Low
HI02 10,753,908 0.032 0.121 0.010 0.153 0.000 0% Low
HI03 49,512,432 0.182 0.072 0.008 0.254 0.000 0% Low
HI04 35,886,310 0.127 0.140 0.010 0.267 0.000 0% Low
Rouge
RO01 3,625,105 0.010 0.041 0.003 0.051 0.000 0% Low
RO02 114,380,078 0.443 0.397 0.040 0.840 0.102 13% Low
RO03 63,942,168 0.222 0.319 0.030 0.541 0.001 0% Low
RO04 44,531,561 0.145 0.236 0.016 0.381 0.002 1% Low
RO05 39,891,225 0.205 0.226 0.023 0.431 0.004 1% Low
RO06 30,637,450 0.117 0.283 0.012 0.400 0.003 1% Low
RO07 40,631,187 0.205 0.338 0.019 0.543 0.002 0% Low
Petticoat PE01 24,063,409 0.082 0.097 0.006 0.180 0.000 0% Low
Frenchman's Bay
FR01 25,024,806 0.090 0.036 0.004 0.126 0.000 0% Low

Approved January 18, 2012 C2-102
Approved Assessment Report: Toronto and Region Source Protection Area
WatershedSub-
watershedArea (km2)
QR (m3/s)
QIN (m3/s)
QReserve (m3/s)
QSupply (m3/s)
QDemand
(m3/s)
% Groundwater
Demand
Groundwater Stress
Assignment
Duffins
DU01 24,489,851 0.087 0.037 0.005 0.123 0.000 0% Low
DU02 53,061,108 0.190 0.284 0.026 0.474 0.020 4% Low
DU03 43,998,921 0.150 0.317 0.031 0.467 0.001 0% Low
DU04 62,548,890 0.362 0.355 0.044 0.717 0.002 0% Low
DU05 60,125,868 0.370 0.268 0.022 0.638 0.004 1% Low
DU06 39,513,589 0.192 0.160 0.010 0.353 0.059 17% Low
Carruthers CA01 39,204,411 0.131 0.109 0.016 0.240 0.000 0% Low
Lake Ontario
LO01 24,045,851 0.064 0.009 0.000 0.073 0.047 64% Significant
LO02 39,823,376 0.159 0.030 0.000 0.189 0.022 12% Low
LO03 23,973,922 0.062 0.082 0.000 0.143 0.019 14% Low
LO04 16,047,825 0.052 0.075 0.000 0.127 0.000 0% Low
LO05 4,816,221 0.017 0.011 0.000 0.027 0.000 0% Low
LO06 3,317,605 0.012 0.009 0.000 0.021 0.000 0% Low
Notes: All water supply and demand numbers are presented in m3/s. QReserve is calculated as 10% of the groundwater discharge
Table C-41: groundwater stress assessment (future Conditions, december)
WatershedSub-
watershedArea (km2)
QR (m3/s)
QIN (m3/s)
QReserve (m3/s)
QSupply (m3/s)
QDemand
(m3/s)
% Groundwater
Demand
Groundwater Stress
Assignment
Etobicoke
ET01 34,156,179 0.078 0.072 0.012 0.151 0.000 0% Low
ET02 25,131,283 0.067 0.041 0.007 0.108 0.000 0% Low
ET03 50,208,414 0.181 0.073 0.018 0.254 0.001 0% Low
ET04 102,829,189 0.338 0.091 0.028 0.429 0.002 1% Low
Mimico
MI01 41,550,870 0.104 0.031 0.011 0.136 0.000 0% Low
MI02 13,654,309 0.038 0.022 0.003 0.060 0.000 0% Low
MI03 23,283,286 0.060 0.026 0.005 0.087 0.000 0% Low

Approved January 18, 2012C2-103
Appendix C: Conceptual Water Budget
WatershedSub-
watershedArea (km2)
QR (m3/s)
QIN (m3/s)
QReserve (m3/s)
QSupply (m3/s)
QDemand
(m3/s)
% Groundwater
Demand
Groundwater Stress
Assignment
Humber
HU01 88,712,024 0.261 0.272 0.037 0.533 0.028 6% Low
HU02 60,693,407 0.198 0.133 0.017 0.331 0.001 0% Low
HU03 97,672,514 0.294 0.144 0.028 0.438 0.001 0% Low
HU04 106,770,045 0.281 0.117 0.024 0.398 0.001 0% Low
HU05 92,392,586 0.250 0.280 0.037 0.529 0.005 1% Low
HU06 71,585,430 0.249 0.513 0.046 0.761 0.006 1% Low
HU07 93,818,968 0.637 0.254 0.018 0.891 0.006 1% Low
HU08 30,940,908 0.203 0.212 0.009 0.415 0.007 2% Low
HU09 64,762,224 0.405 0.141 0.025 0.546 0.003 1% Low
HU10 47,760,614 0.260 0.349 0.042 0.610 0.007 1% Low
HU11 47,108,648 0.351 0.176 0.024 0.527 0.008 2% Low
HU12 108,051,916 0.942 0.207 0.107 1.149 0.003 0% Low
Don
DO01 38,272,626 0.137 0.121 0.017 0.258 0.001 0% Low
DO02 33,770,602 0.112 0.139 0.002 0.250 0.000 0% Low
DO03 53,719,251 0.182 0.387 0.028 0.569 0.003 1% Low
DO04 63,874,250 0.249 0.295 0.039 0.544 0.001 0% Low
DO05 58,084,448 0.209 0.270 0.013 0.479 0.026 6% Low
DO06 63,354,811 0.328 0.255 0.031 0.583 0.075 14% Low
DO07 41,736,638 0.164 0.232 0.012 0.395 0.001 0% Low
Highland
HI01 8,943,868 0.028 0.049 0.000 0.076 0.000 0% Low
HI02 10,753,908 0.032 0.121 0.010 0.153 0.000 0% Low
HI03 49,512,432 0.182 0.072 0.008 0.254 0.000 0% Low
HI04 35,886,310 0.127 0.140 0.010 0.267 0.000 0% Low
Rouge
RO01 3,625,105 0.010 0.041 0.003 0.051 0.000 0% Low
RO02 114,380,078 0.443 0.397 0.040 0.840 0.095 12% Low
RO03 63,942,168 0.222 0.319 0.030 0.541 0.001 0% Low
RO04 44,531,561 0.145 0.236 0.016 0.381 0.000 0% Low
RO05 39,891,225 0.205 0.226 0.023 0.431 0.004 1% Low
RO06 30,637,450 0.117 0.283 0.012 0.400 0.003 1% Low
RO07 40,631,187 0.205 0.338 0.019 0.543 0.002 0% Low
Petticoat PE01 24,063,409 0.082 0.097 0.006 0.180 0.000 0% Low
Frenchman's Bay
FR01 25,024,806 0.090 0.036 0.004 0.126 0.000 0% Low
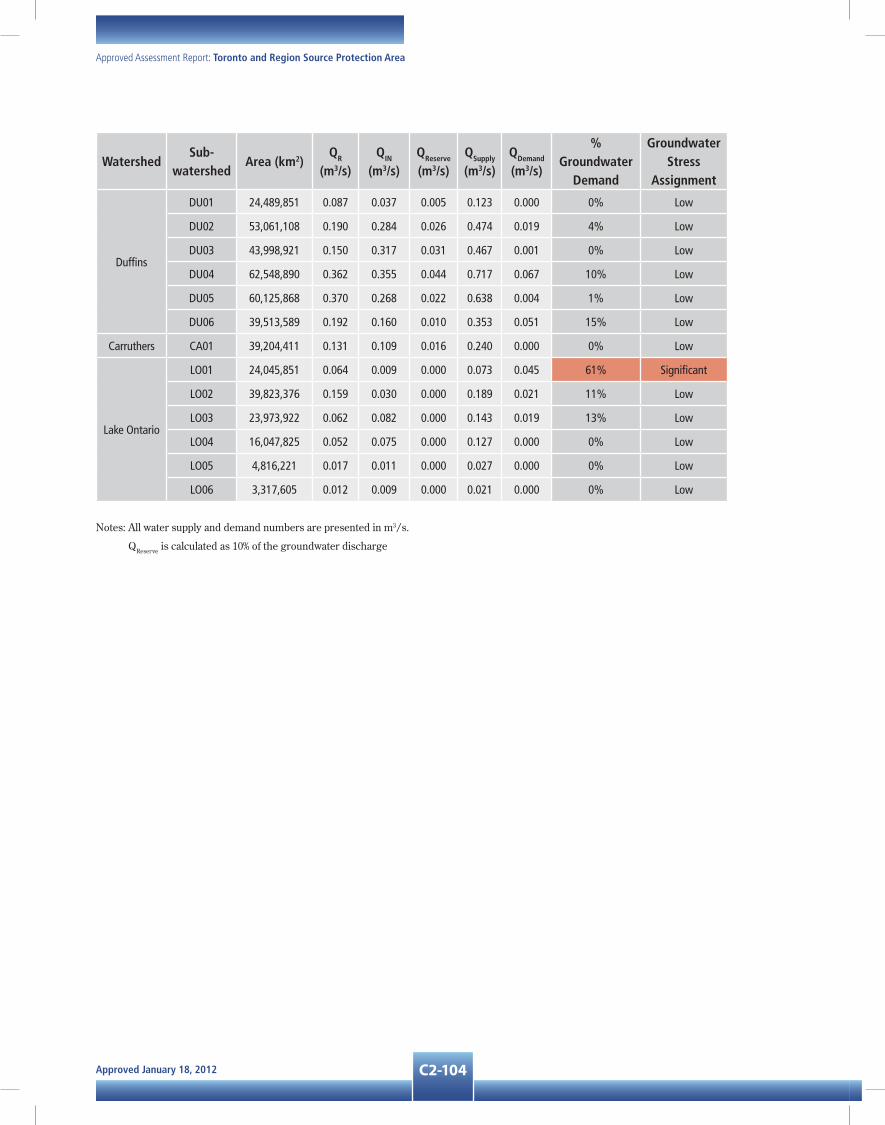
Approved January 18, 2012 C2-104
Approved Assessment Report: Toronto and Region Source Protection Area
WatershedSub-
watershedArea (km2)
QR (m3/s)
QIN (m3/s)
QReserve (m3/s)
QSupply (m3/s)
QDemand
(m3/s)
% Groundwater
Demand
Groundwater Stress
Assignment
Duffins
DU01 24,489,851 0.087 0.037 0.005 0.123 0.000 0% Low
DU02 53,061,108 0.190 0.284 0.026 0.474 0.019 4% Low
DU03 43,998,921 0.150 0.317 0.031 0.467 0.001 0% Low
DU04 62,548,890 0.362 0.355 0.044 0.717 0.067 10% Low
DU05 60,125,868 0.370 0.268 0.022 0.638 0.004 1% Low
DU06 39,513,589 0.192 0.160 0.010 0.353 0.051 15% Low
Carruthers CA01 39,204,411 0.131 0.109 0.016 0.240 0.000 0% Low
Lake Ontario
LO01 24,045,851 0.064 0.009 0.000 0.073 0.045 61% Significant
LO02 39,823,376 0.159 0.030 0.000 0.189 0.021 11% Low
LO03 23,973,922 0.062 0.082 0.000 0.143 0.019 13% Low
LO04 16,047,825 0.052 0.075 0.000 0.127 0.000 0% Low
LO05 4,816,221 0.017 0.011 0.000 0.027 0.000 0% Low
LO06 3,317,605 0.012 0.009 0.000 0.021 0.000 0% Low
Notes: All water supply and demand numbers are presented in m3/s.
QReserve is calculated as 10% of the groundwater discharge

Approved January 18, 2012C3-1
Appendix C: Conceptual Water BudgetC3 Tier 3 WaTer budgeT and loCal risk assessMenT Workplan - sTouffville
