a bayesian framework for reputation in citizen scienceceur-ws.org/vol-1960/paper6.pdf · a bayesian...
TRANSCRIPT

A Bayesian Framework forReputation in Citizen Science
Joan Garriga1,2, Jaume Piera1,3, and Frederic Bartumeus1,2,4
1 Centre de Recerca Ecologica i Aplicacions Forestals (CREAF),Carrer de les Cases Sert 54, 08193, Cerdanyola del Valles, Barcelona
2 Centre d’Estudis Avancats de Blanes (CEAB-CSIC),Carrer Acces Cala Sant Francesc 14, 17300, Girona
3 Institut de Ciencies del Mar (ICM-CSIC),Passeig Marıtim de la Barceloneta 37-49, 08003, Barcelona
4 Institucio Catalana de Recerca i Estudis Avancats (ICREA),Passeig de Lluıs Companys 23, 08010, Barcelona
Abstract. The viability of any Citizen Science (CS) research programis absolutely conditioned to the engagement of the citizen. In a CS frame-work in which participants are expected to perform actions that can belater on validated, the incorporation of a reputation system can be asuccessful strategy to increase the overall data quality and the likelihoodof engagement, and also to evaluate how close citizens fulfill the goals ofthe CS research program. Under the assumption that participant actionsare validated using a simple discrete rating system, current reputationmodels, thoroughly applied in e-platform services, can be easily adaptedto be used in CS frameworks. However, current reputation models im-plicitly assume that rated items and scored agents are the same entity,and this does not necessarily hold in a CS framework, where one maywant to rate actions but score the participants generating it. We presenta simple approach based on a Bayesian network representing the flowdescribed above (user, action, validation), where participants are aggre-gated in a discrete set of user classes and we use the global evidence in thedata base to estimate both the prior and the posterior distribution of theuser classes. Afterwards, we evaluate the expertise of each participant bycomputing the user-class likelihood of the sequence of actions/validationsobserved for that user. As a proof of concept we implement our modelin a real CS case, namely the Mosquito Alert project.
Keywords: citizen science, reputation system, Bayesian network
1 Introduction
Since its origins, back in the mid-90’s, citizen science (CS) has been questionedby the scientific community as an adequate scientific methodology [7]. Pros andcons aside, a basic principle to bring citizens and scientists into a productiverelationship is to match the public understanding of science with the science’s
1
understanding of the public [7]. To this end, modern citizen science is rethinkingmethods for citizen engagement [3, 1]. Key concepts in participants engagementare connection and reward. Connection refers to connecting the scientific goalsof the CS research program with the citizen perception of a social worry orinterest (the basic motivation to start cooperating). Reward refers to providingfeedback that can be neatly perceived as a reward (the basic motivation to keepcooperating). Nevertheless, it is well known by psychologists [1] that the effectof a reward resides in its expectation and vanishes as soon as it is achieved.Thus, in order to increase the likelihood of participation in the long run, itis necessary to generate continuous reward expectations. A successful strategyto achieve sustained participation requires the implementation of a reputationsystem as a core component of any CS research program. In addition, well-grounded reputation systems provide back-end information of participants thatis valuable to augment data quality and to increase the fitness for use [12] of CSresearch programs.
Reputation is a broad concept not only suitable to people but also to manykinds of things or services [2]. Extending the notion given in [11], reputationis the perception that an agent (or item) creates through past actions about itsintentions, norms, knowledge, expertise or value. Reputation can be seen as anasset, not only to promote oneself, but also to help us to make sound judgmentsin the absence of any better information. However, reputation is highly contex-tual and what works well in a specific context may inevitably fail in many others.As a consequence details about reputation systems are profusely treated in theliterature [2, 8, 6, 11, 14]. The simplest reputation systems scale down to a rank-ing/voting system where information is aggregated into a single score used toqualify and sort items (e.g. songs in iTunes, users in Stackoverflow). Systems forcollecting and representing reputation information are usually based on simplerating mechanisms such as thumbs-up/down or a five star rating. The difficultiesarise at the time of aggregating this information.
Many rating aggregation systems recently proposed (e.g. Amazon, iTunes,YouTube) are different forms of Bayesian Rating (BR), a pseudo-average com-puted as a weighted combination of the average rating of a particular item andthe average rating for all items. In a k-way rating system, (i.e with k discreterating levels r ∈ {1, . . . , k}), with a total of m rates and an overall ratingr (all) =
∑mj=1 r (y)j /m, the BR of an item y with n ratings, and an average
rating r (y) =∑nj=1 r (y)j /n is given by,
BR (y) =n r (y) +m r (all)
m+ n= w r (y) + (1− w) r (all) (1)
with w = n/ (n+m). A clear benefit of BR is that an item with only a fewratings (i.e w → 0) will approach the overall mean rating, hence, does notreceive the lowest (unfair and discouraging) rate but the average rate, while themore the item is rated (i.e n � 0) the largest the weight of its own averagerating. In any case m � n, hence the scoring is focused on the quality of theratings rather than on the quantity of ratings.
2

The Beta reputation system [9] (binomial) and the Dirichlet reputation sys-tem [10] (DR), the multinomial generalization of the former, are reputation mod-els based on a sound statistical machinery that explains away the Bayesian ratingconcept and frames it in a real Bayesian perspective. Consider a k-way ratingsystem and let the rating level be indexed by i (i.e. 1 ≤ i ≤ k). Let n (y)i bethe rating counts for item y (the observed evidence), and let ai be a base rateexpressing the biases in our prior belief about each rating level. A Dirichlet (orBeta for k = 2) rating yields a multinomial probability distribution S (y)i overthe k rating levels, where the expectation value for each rating level is computedas,
S (y)i =n (y)i + C aiC + n (y)
(2)
where n (y) =∑ki=1 n (y)i and C is the a priori constant that can be set to
C = k if we consider a uniform prior (i.e. ai = 1/k). In this case Equation 2defaults to the classical Laplace smoothing [9]. The larger the value of C withrespect to k the less the influence of the observed ratings and the more S (y)iwill approach the base rate ai. Assuming the k rating levels evenly distributedin the range [0, 1], a point estimate reputation score is computed as,
DR (y) =
k∑i=1
i
kS (y)i (3)
Multinomial form aside, the similarity with BR (Eq. 1) is clear. But thedifference can not be obviated: while the weighting in Equation 1 emerges froma pure frequentist persepective, in a DR the factor C ai can convey specific apriori information provided by domain experts or any other external source [9].
Agents (and in particular human agents) may change their behaviour overtime. This issue is usually approached either by incorporating a cutoff factorthat limits the series of ratings to the most recent ones, up to a given period ora given number, or by introducing a longevity factor that assigns a time relativeweight to ratings [9]. An additional concern in reputation systems for e-serviceplatforms is its resistance against typical strategies for reputation cheating (e.g.whitewashing, sybil attacks, fraudulent ranking) reviewed in e.g. [4].
CS research programs constitute a different scenario where the aim is notto promote user interaction but to collect useful data for their scientific goals.Hence, reputation issues do not arise from peer-to-peer interaction but from theneed to increase citizen engagement and data quality. However, a systematicreview of 234 CS research programs presented in [5] reveals that despite of thisgeneral concern on data quality, very few has been made in terms of participants’reputation. Data validation is usually performed by a core of domain experts orproject coordinators, eventually assited by authomated methods or with somelevel of intra-community interaction (e.g. eBird, Galaxy Zoo, iSpot) or morebroadly via crowd-sourcing (e.g. www.crowdcrafting.org). In a few cases, localcoordinators take into account the participants’ experience for validating data
3
(e.g Common Bird Monitoring, Weather Observations Website), and just in ahandful of them it is the community of participants itself who directly validatedata (e.g Galaxy Zoo, iSpot, oldWeather). Among the later, Notes from Natureand iSpot [15] are the ones going further in terms of community-based validationand participants’ reputation, implementing simple agreement based algorithmsto rank participants and assign digital badges in recognition of specific achieve-ments. Community-based validation explicitly requires a core reputation systemintegrated with the CS research program. However, there is not a general ap-proach and each research program implements reputation in a functional way tofit its needs, neither framing its system in general conceptual frameworks, normaking it available to the scientific community.
Notably, an implicit assumption in any of the reputation models above is thatthe agent (or item) being rated is the one that is scored and, more explicitely,that the rating system used to collect ratings for an agent is the rating systemused to score that agent (e.g. Equation2). This apparently obvious and irrel-evant assumption might become more subtle in a CS framework. CS researchprograms expect participants to perform a set of actions (basically, reportinginformation in specific formats) and these actions are later on validated. In thiscase, the rated items are the actions, but the scored agents are the participants.Importantly, each kind of action might require its own discrete rating system(not necessarily coincident in the number of levels). Yet the expertise of partic-ipants might be expressed based on a specific set of user classes (with its ownnumber of levels), and scored based on the ratings of all their possibly differentactions. A straightforward way to overcome this problem is to compute separatescores for each type of action and get an overall score using a weighted combina-tion of the former. Alternatively, we propose a novel model for user reputationbased on a Bayesian network describing the characteristic flow of CS researchprograms, (i.e. user, action, validation). The proposed method (i) decouples ac-tion rating from participant scoring, (ii) provides a unified framework to processvalidation information regardless of the rating levels used for each kind of action,(iii) accounts for a good balance of both quality and quantity of evidence, and(iv) is more responsive to participants’ actions, which may augment engagementdynamics.
2 Mosquito Alert: CS for public health
Mosquito Alert (MA) is a CS research program initially devised to monitor theexpansion in Spain of the Asian tiger mosquito (Aedes albopictus), a diseasecarrying mosquito. Since the expansion of the Zika virus threat in 2016, MA in-cluded the monitoring of the yellow fever mosquito (Aedes aegypti). Both speciesare world wide distributed, living in urban environments, and being speciallyinvasive and agressive vectors of tropical infectious diseases such as Dengue,Chikungunya, Yellow Fever, and Zika.
Aside from its scientific goals (e.g. unveiling the population expansion mech-anisms, forecasting vector and disease threats), a particular challenge for MA
4

Fig. 1. Mosquito Alert (left) home screen of the app showing the rank and category;(right) web map showing the validated reports.
arises from its impact on the public health domain. MA is aimed to providereliable early warning information (in recently colonised areas), and real-timemanagement information (in areas where it resides) to public health adminis-trators. Public health administrations at different organizational levels in theterritory, use MA to improve their surveillance and control programs with thegoal of decreasing mosquito populations, specially in urban areas. Because of allthis, MA is designed as a multi-platform system structured as follows:
1. The MA smartphone app (freely available for Android and iOS), by meansof which citizen can send reports of observations of mosquitoes (and theirbreeding sites) potentially belonging to disease vector species (namely theAsian Tiger and the Yellow Fever mosquito).
2. The corresponding server-side functionality (Django, SQL) managing thereception and storage of data, along with an ever evolving set of tools for themanagement and analysis of the data, including machine-learning algorithmsto help automating the validation of information [13].
3. A private platform called Ento Lab. This is a restricted access service throughwhich a set of experts can make a previous filtering of inappropriate reportsand classify the rest as either positive or negative ones. Only classified reportsare afterwards made visible to the rest of the services.
4. Another private platform named Managers Portal which grants on-demand-access to stakeholders (e.g. public health administrations, mosquito controlservices, private mosquito control companies), open GIS tools to visualize allthe available data in the portal (including their own imported managementdata), and the possibility to directly comunicate control actions through theapp.
5. A public platform http://www.mosquitoalert.com, providing data and visu-alization tools to all the public via interactive maps, where participants canfind their individual contributions validated by the experts (Figure 1, right).
5

The direct involvement of public health institutions make citizen truly con-scious of the usefulness of their contributions (much beyond science). Triggeringmosquito control actions in the territory through MA participation constitutesthe necessary reward to keep citizens engaged in the research program.
Table 1. Summary of Mosquit Alert’s data-base (2015-2016).
total NC hd -2 -1 0 +1 +2
adult 4177 19 188 429 128 655 1317 1441% 0.00 0.05 0.10 0.03 0.16 0.32 0.34
total NC hd -1 0 +1
bSite 1172 564 160 90 129 229% 0.48 0.14 0.08 0.11 0.20
The work described in this paper is based on data corresponding to the lasttwo years (2015-2016) of MA, summarized in Table 1, with more than 30000 appdownloads, 2993 active users and 5349 reports submited. Reports are of typeadult (4177) correponding to observations of adult mosquitoes (either Asiantiger or Yellow Fever) or bSite (1172) corresponding to potential mosquitoes’breeding sites. Reports of type adult and bSite are reviewed by experts whomanually label them. Reports of type adult are labelled as: −2, definitely notcorresponding to the species of interest; −1, probably not corresponding to thespecies of interest; 0, can not tell; 1, probably corresponding to the species ofinterest; and 2, definitely corresponding to the species of interest. Reports oftype bSite are labelled as: −1, does not correspond to a breeding site; 0, can nottell; and +1, does correspond to a breeding site. NC stands for not-classifiedreports which either do not provide an image or have not yet been reviewed bythe experts. The hd stands for hidden reports which correspond to reports withimproper images that are hidden by the experts (not shown in the map).
3 Methods
Let’s consider a Bayesian network describing the characteristic flow in a CS re-search program, what we call the User-Action-Validation (UAV) network (Fig-ure 2, left, lightgrey nodes). In our particular case, the nodes of the UAV networkrepresent the following:
– Users are participants of the CS research program aggregated in a variableU = {1, . . . , k} specifying an ordinal set of user-classes with increasing levelsof expertise (e.g. beginner, advanced, expert). Beyond the intuition that Ushould be a discrete ordinal variable, we have no prior idea of the optimalnumber of user classes we should define nor about their prior distribution.
– Actions consist in submitting reports either of type adult or bSite. Thus, wedefine A = {adult, bSite} such that P (A|U) specifies the probability that a
6
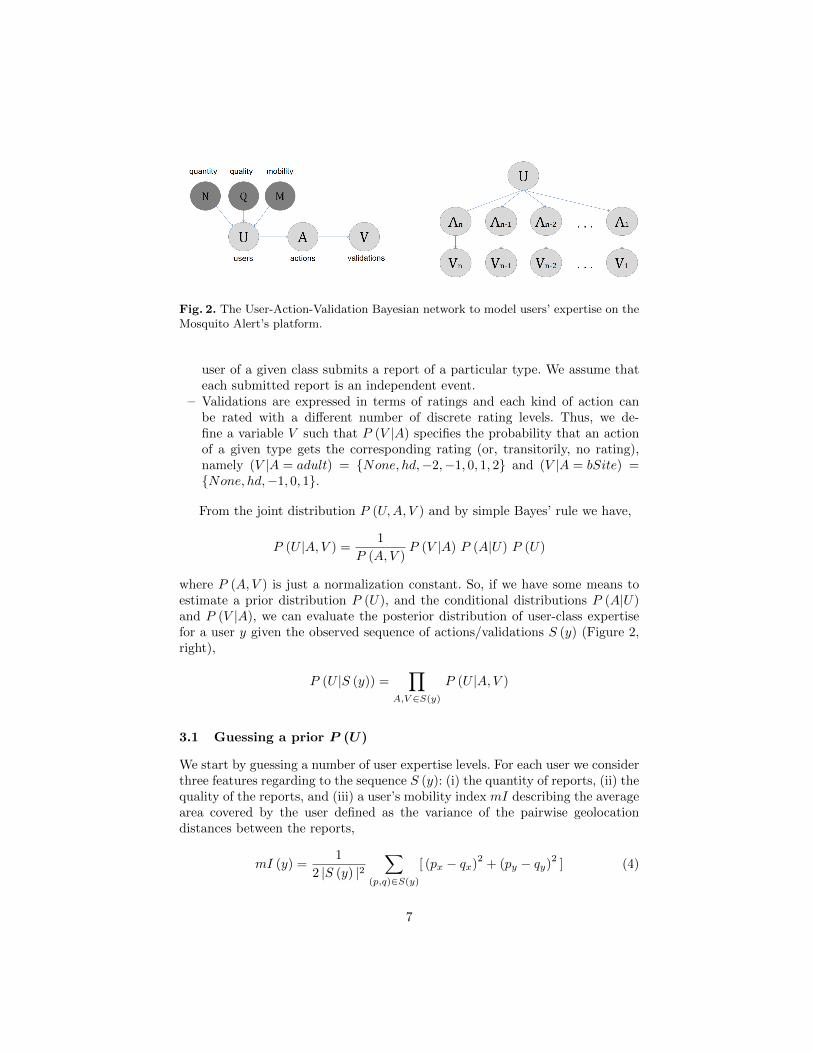
Fig. 2. The User-Action-Validation Bayesian network to model users’ expertise on theMosquito Alert’s platform.
user of a given class submits a report of a particular type. We assume thateach submitted report is an independent event.
– Validations are expressed in terms of ratings and each kind of action canbe rated with a different number of discrete rating levels. Thus, we de-fine a variable V such that P (V |A) specifies the probability that an actionof a given type gets the corresponding rating (or, transitorily, no rating),namely (V |A = adult) = {None, hd,−2,−1, 0, 1, 2} and (V |A = bSite) ={None, hd,−1, 0, 1}.
From the joint distribution P (U,A, V ) and by simple Bayes’ rule we have,
P (U |A, V ) =1
P (A, V )P (V |A) P (A|U) P (U)
where P (A, V ) is just a normalization constant. So, if we have some means toestimate a prior distribution P (U), and the conditional distributions P (A|U)and P (V |A), we can evaluate the posterior distribution of user-class expertisefor a user y given the observed sequence of actions/validations S (y) (Figure 2,right),
P (U |S (y)) =∏
A,V ∈S(y)
P (U |A, V )
3.1 Guessing a prior P (U)
We start by guessing a number of user expertise levels. For each user we considerthree features regarding to the sequence S (y): (i) the quantity of reports, (ii) thequality of the reports, and (iii) a user’s mobility index mI describing the averagearea covered by the user defined as the variance of the pairwise geolocationdistances between the reports,
mI (y) =1
2 |S (y) |2∑
(p,q)∈S(y)
[ (px − qx)2
+ (py − qy)2
] (4)
7

where (px, py) , (qx, qy) are the geolocation coordinates.Based on these features we define the following proxy variables of the user-
class U (Figure 2, left, darkgrey nodes): (i) a quantitative proxy aggregatingusers sending less or more than a given number θ1 of reports (N = {less,more});(ii) a mobility proxy aggregating users with a mobility index lower/higher thana given value θ2 (M = {lower, higher}); (iii) a quality proxy aggregating re-ports in four categories: hidden, low quality (those labeled as (−2,−1)), mediumquality (those labeled as 0), and high quality (those labeled as (1, 2)), (Q ={hidden, low,medium, high}, we do not count here not-classified reports). Notethat (i) and (ii) account for the attitude of the participants, while (iii) accountsfor their skills, and both aspects are deemed important. The joint combinationof the above three proxys results in a primary partition of the users’ expertisespace into 16 categories summarized in Table 2. The threshold values where se-lected by looking at the corresponding histograms and taking the values thatyield the most possible balanced distribution.
Table 2. Join distribution of the proxy variables, P (N,M,Q), resulting in 16 expertisecategories. Threshold values: θ1 = 2, θ2 = 10−9.
N ≤ θ1, M ≤ θ2 N ≤ θ1, M > θ2 N > θ1, M ≤ θ2 N > θ1, M > θ2
hiddden 0.0427 0.0220 0.0004 0.0086low 0.0974 0.0132 0.0027 0.0228medium 0.0853 0.0211 0.0065 0.0519high 0.2685 0.0707 0.0322 0.2541
By looking at this table, we should now infer a set of user classes with increas-ing levels of expertise. We prioritize as following: (i) the quality of the reportsbefore the quantity (low quality reports just result in a waste of experts’ time);(ii) the quantity of reports before the mobility index of the users (we give thelowest priority to the mobility index because the meaning of this variable isdouble folded: for surveillance purposes it is important that participants sendreports covering the broadest geographical area possible, but for control pur-poses it is also important that participants keep sending reports within theirneighbourhoods). Also, we are not looking here for a fine grain discretization ofthe expertise space. Taking into account the unbalances present in Table 2 itlooks reasonable to impose an ordering of the 16 expertise categories into a setof k = 6 user-classes, i.e U = {1, . . . , 6}, as shown in Table 3. Tables 2 and 3together express a joint distribution P (N, Q, M, U) from which the prior P (U)follows straightforwardly by marginalization,
P (U) =∑
N,Q,M
P (N,Q,M,U) (5)
and we get a temptative prior for the user-class variable (Table 4).Having defined the user classes we know the user-class value of each report,
and we can make estimations (maximum a posteriori, MAP) for the action con-
8

Table 3. Definition of user classes
N ≤ θ1, M ≤ θ2 N ≤ θ1, M > θ2 N > θ1, M ≤ θ2 N > θ1, M > θ2
hiddden 1 1 1 2low 2 2 3 3medium 3 4 4 4high 5 6 6 6
Table 4. Expertise-class prior distribution, P (U)
U 1 2 3 4 5 6
0.0648 0.1190 0.1106 0.0792 0.2691 0.3573
ditional distribution P (A|U) (Table 5) and also for the validation conditionaldistributions P (V |A = adult) and P (V |A = bSite) (Table 6).
3.2 Computing the posterior P (U |A, V )
Applying Bayes’ rule we compute the posterior distribution P (U |A, V ),
P (U |A, V ) =1
WP (V |A) P (A|U) P (U) (6)
whereW =∑ki=1 p (ui|A, V ). Equation 6 evaluates the probability that an action
(report) of a given type, with a given validation (rating), belongs to a particularuser-class (Table 7).
Note that, in our Bayesian approach ratings become a fuzzy qualificationof the user-class. Also note that this is indeed a two parameter model (θ1, θ2)allowing a degree of control over the user-class prior and, ultimately, over theuser-class posterior distributions, (i.e. we can push the classification of reportsto a lower/upper user-class by increasing/decreasing either one or both of theparameters (this is shown later in Figure 4).
Table 5. Action conditional distribution, P (A|U)
U 1 2 3 4 5 6
adult .3454 0.7994 0.8456 0.4234 0.9339 0.9144bSite 0.6546 0.2006 0.1544 0.5766 0.0661 0.0856
1.0000 1.0000 1.0000 1.0000 1.0000 1.0000
3.3 Computing users’ scores.
Note that, so far, our UAV-network (Figure 2 , left) just yields the user-classdistribution of a single action, not the users’ scoring that we aim. To compute
9
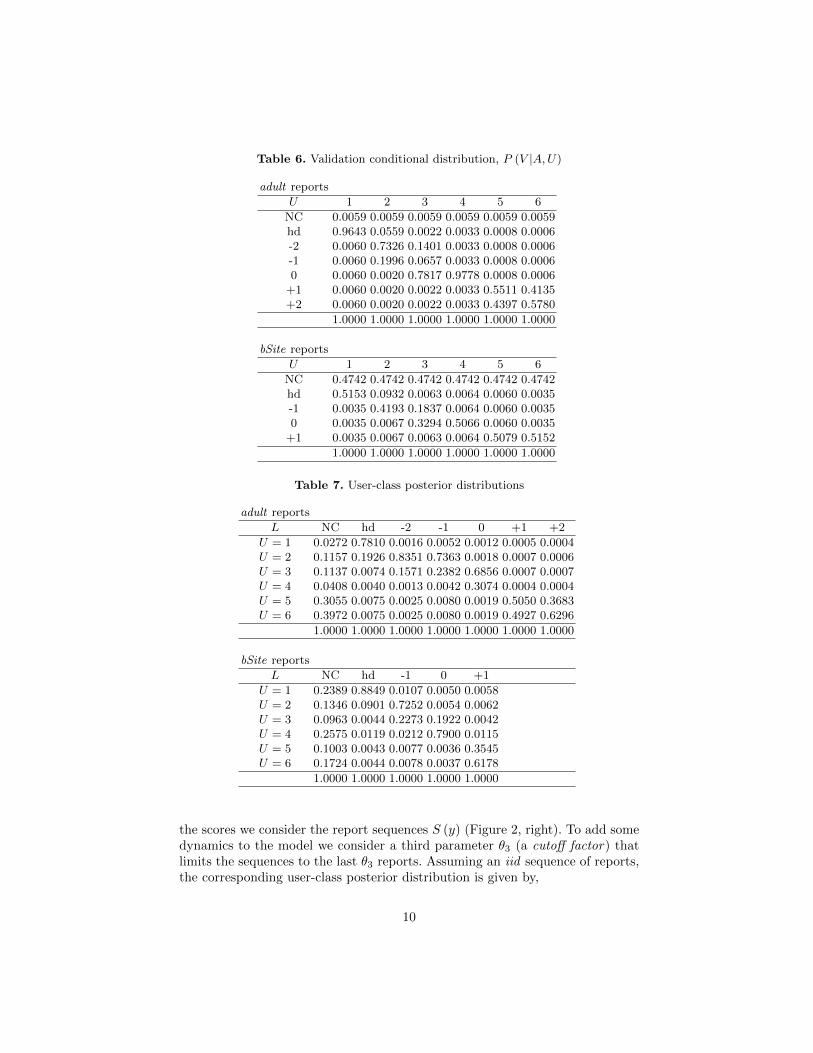
Table 6. Validation conditional distribution, P (V |A,U)
adult reports
U 1 2 3 4 5 6
NC 0.0059 0.0059 0.0059 0.0059 0.0059 0.0059hd 0.9643 0.0559 0.0022 0.0033 0.0008 0.0006-2 0.0060 0.7326 0.1401 0.0033 0.0008 0.0006-1 0.0060 0.1996 0.0657 0.0033 0.0008 0.00060 0.0060 0.0020 0.7817 0.9778 0.0008 0.0006
+1 0.0060 0.0020 0.0022 0.0033 0.5511 0.4135+2 0.0060 0.0020 0.0022 0.0033 0.4397 0.5780
1.0000 1.0000 1.0000 1.0000 1.0000 1.0000
bSite reports
U 1 2 3 4 5 6
NC 0.4742 0.4742 0.4742 0.4742 0.4742 0.4742hd 0.5153 0.0932 0.0063 0.0064 0.0060 0.0035-1 0.0035 0.4193 0.1837 0.0064 0.0060 0.00350 0.0035 0.0067 0.3294 0.5066 0.0060 0.0035
+1 0.0035 0.0067 0.0063 0.0064 0.5079 0.5152
1.0000 1.0000 1.0000 1.0000 1.0000 1.0000
Table 7. User-class posterior distributions
adult reports
L NC hd -2 -1 0 +1 +2
U = 1 0.0272 0.7810 0.0016 0.0052 0.0012 0.0005 0.0004U = 2 0.1157 0.1926 0.8351 0.7363 0.0018 0.0007 0.0006U = 3 0.1137 0.0074 0.1571 0.2382 0.6856 0.0007 0.0007U = 4 0.0408 0.0040 0.0013 0.0042 0.3074 0.0004 0.0004U = 5 0.3055 0.0075 0.0025 0.0080 0.0019 0.5050 0.3683U = 6 0.3972 0.0075 0.0025 0.0080 0.0019 0.4927 0.6296
1.0000 1.0000 1.0000 1.0000 1.0000 1.0000 1.0000
bSite reports
L NC hd -1 0 +1
U = 1 0.2389 0.8849 0.0107 0.0050 0.0058U = 2 0.1346 0.0901 0.7252 0.0054 0.0062U = 3 0.0963 0.0044 0.2273 0.1922 0.0042U = 4 0.2575 0.0119 0.0212 0.7900 0.0115U = 5 0.1003 0.0043 0.0077 0.0036 0.3545U = 6 0.1724 0.0044 0.0078 0.0037 0.6178
1.0000 1.0000 1.0000 1.0000 1.0000
the scores we consider the report sequences S (y) (Figure 2, right). To add somedynamics to the model we consider a third parameter θ3 (a cutoff factor) thatlimits the sequences to the last θ3 reports. Assuming an iid sequence of reports,the corresponding user-class posterior distribution is given by,
10

P (U |S (y)) =P0
Pw
θ3∏j=1
P (U |Aj , Vj) (7)
where P0 = (1/k, . . . , 1/k) sets a starting uniform user-class distribution and
Pw =∑ki=1 P (ui|S) is a normalization factor. Afterwards, an expertise score
can be computed as the user’s expected user-class,
X (y) =1
kE[U ]P (U |S) =
1
k
k∑i=1
ui p (ui|S) (8)
Equation 8 yields a normalized score with a lower bound given by 1k E[U ]P0
which avoids a discouraging zero-score for new comers. Usually, the computa-tion of Equation 7 is subject to numerical precision problems and therefore weimplement a log computation as,
logP (U |S (y)) = logP0 +
θ3∑j=1
log P (U |Aj , Vj)− logPw (9)
For gamification purposes, users are ranked based on their scores. Ties aresolved by mobility index. The rank position, not the score, is notified to theusers via the smartphone app, together with a quantile based category label aseither gold, silver or bronze (Figure 1, left).
In summary, we use the global evidence in the data base to guess the jointdistribution P (U,Q,N,M) and estimate a prior P (U), from which we can de-rive the posteriors P (U |A, V ). Afterwards, we use the evidence observed foreach particular user S (y), to evaluate the posterior distribution P (U |S (y)) andcompute a score for that user. Essentially, our scoring model is a naıve Bayesclassifier where the number of features varies with the number of reports usedto qualify the user. The larger the number of reports, the better the profilingof the user. Because we use the global evidence to estimate the user-class dis-tribution, the scores change dynamically as the contents of the data base growand all individual expertise scores are in part dependent on the overall averageperformance.
4 Results
Based on the user-class posterior distributions (Table 7) and applying Equa-tions 9 and 8 we get the results shown in Figure 3. In the x-axis, users areranked by score (blue line). Scores are plotted together with scaled versions ofthe mobility index (yellow), the number of breedingSite reports (cyan) and thenumber of adultMosquito reports (magenta). The scoring yields several plateauscorresponding to typical number of submitted reports. We highlight (darkgreyrows in Table 8) the position of users who only submitted one report, classifiedas +1 (positions 1494:2053, 560 users), or classified as +2 (positions 2244:2684,
11

Fig. 3. Ranked score plot
Table 8. Ranked score table
adult bSite
rank score hd -2 -1 0 +1 +2 hd -1 0 +1
1 .16668463 42 .16684409 33 .16728058 4
26:112 .19559913 1116:201 .21448389 1221:245 .33933867 2263:553 .36258186 1555:628 .38297512 1629:670 .38557248 1730:756 .52790362 2764:1064 .55214793 11069:1278 .583333331284:1321 .63213868 11356:1390 .82074814 1 11494:2053 .91446382 12139:2205 .92599170 12244:2684 .93735892 12823:2882 .95749959 22892:2899 .95809921 22911:2926 .97219402 32936:2937 .97351476 32944:2952 .98252239 42962:2965 .98930969 5
2978 .99617983 72984 .99888390 92991 .99999356 1 192992 .99999384 18 12993 .99999632 20
12

Fig. 4. Effect of the 3 threshold parameters: (left) effect of the number of reports, θ1,and the mobility index, θ2; (right) effect of the cutoff factor, θ3
441 users), which correspond to the largest plateaus in Figure 3. As expected,the larger the number of positive reports the higher the rank (Table 8 bottomrows), and the larger the number of negative reports the lower the rank (Table 8top rows), with hidden reports being strongly punished.
We also analyze the effect of the threshold parameters (θ1, θ2, θ3) (Figure 4).In the x-axis, participants are ranked by score (blue line). The red line depicts thescore coresponding to a different value of the threshold parameters. In general,the scores do not change much in terms of value though sudden breaks in theincreasing trend of the red line reveal users whose position in the ranking hasbeen affected by the change of the parameter value. The plateaus remain almostinvariant and we only appreciate some changes of position at the borders of theplateaus. Increasing (decreasing) θ1 and θ2 (Figure 4, left) together, move reportsto the left (right) columns of Table 2 and consequently force a change in the priordistribution. As a result, the plateaus are globally pushed lower (higher). Thischange is propagated to the posteriors and originates also the rank changes thatcan be observed at the borders of the plateaus (Figure 4, left). In the case ofθ3 we observe that by not looking so far in the past (Figure 4, right), somelow rank users are upgraded (users who clearly improved their performance overtime) while some high rank users are downgraded (users who worsened theirperformance over time).
The dynamics of the scoring are also shown. In Figure 5 (top) we simulatethe evolution of the score (blue line) and rank (red line) for a particular userin a static situation where nothing is changing, no new users are coming andno reports are submitted by third users. Each submitted report is shown as acoloured dot, where the color indicates the validation value of the report. It isapparent that good/bad reports push the score/rank up/down. Figure 5 (bot-tom) shows the evolution of the score in a realistic situation to show the effect ofthird users’ actions or new comers to MA. Note the double effect of the overalldynamics, inducing soft fluctuations in the score but really significant changesin the rank. The stronger dynamics of the rank makes it much more effective forgamification purposes.
13

Fig. 5. Score dynamics: (top) simulating a static situation in which the rest of partici-pants do not perform any action; (bottom) real situation with new reports submitted bythird participants and new participants joining the Mosquito Alert research program.
Fig. 6. Comparison of scores: (left) UAV-network vs. Bayesian Rating; (right) UAV-network vs. Dirichlet reputation system with different values of C.
14
We also show a comparison of our scores with Bayesian Rating and Dirich-let reputation scores (Figure 6). The scores used in the comparison have beencomputed taking into account only the reports of type adult. In this way weavoid to analyze second order effects due to weight-averaging of adult and bSitereports, given that in BR or DR these must be independently computed andcombined later on. In the x-axis, participants are ranked by our score (blueline). BR scores (Figure 6, left, magenta line) are clearly affected by the weightof the overall average rating (note the scale of the right y-axis). However, BRstill yields the same plateaus and we only observe slight ranking changes at theborders of the plateaus. These changes are due to the differences in the leverageof the rate values (i.e. the values P (U |A, V ) in Tables 7 versus the rating levelsr = {1, . . . , k} used in Equation 1). DR scores (Figure 6, right) are computedfor different values of the C constant. It is clear that C is playing the role of theoverall average factor in BR, but DR gives us some control over it. The most im-portant plateaus are also found, but the differences at the borders of the plateausare more significant. Notably, there is a great difference in the sensibility of ourmodel in comparison to BR and DR. In this context, sensibility represents abetter responsiveness of the scoring in relation to participants actions, which weconsider it to be a good property to improve participants’ engagement in CSresearch programs.
5 Discussion
The model we propose is similar to a naıve-bayes classifier where the number offeature nodes varies with the number of actions performed (i.e. reports submit-ted) by the user. Starting from a uniform user-class distribution, each validatedreport contributes with new evidence to refine the profiling of the user.
The key issue of our approach is to estimate a user-class prior that sufficesfor our scoring purpose. We suggest to select a set of proxy variables of the user-class, with a clear semantics in terms of user expertise, to make a guess aboutthis prior. Nonetheless, any alternative to compute the prior can be consideredand applied as well. Anyway, it is crucial to make a guess of the prior that leadsto a well balanced (as much as possible) prior and to well behaved (as muchas possible) posteriors (i.e. good ratings favouring higher user classes and badratings favouring lower user classes). If the probability mass distribution of theposteriors is not in clear correlation with the user classes the behaviour of thealgorithm can become non-monotonic with respect to increasing evidence abouta certain class. Thus, this step must be carefully considered.
In the same way that it is not good to score new users excesively low, it is alsonot good to score them excessively high. The reason to initialize the score with aunifom instead of the prior user-class distribution is that the later will usually beunbalanced, in our case, clearly unbalanced towards the high expertise classes(Table 4), and consequently users with no validated ativity would be rankedeither excesively high or excessively low. Using the prior to initialize the score,not-active users get a score of 0.74011666 (i.e. P (U |S) = P (U) in Equation 8),
15
while using a uniform distribution their score is 0.58333333 (arround 0.5) andthey are positioned by the middle-low part of the rank (rank positions 1069:1278in Table 8) which is fairly reasonable.
As scores are relative to the performance of the whole community, scoresare quite dynamic. As participants increase their expertise, all good scores areglobally pushed higher. Nevertheless, it is the rank what is ultimately notifiedto the participants, thus along a period of no activity, a participant might bedowngraded with time. Furthermore, in periods of no activity the score can in-deed increase if better positioned participants suddenly start sending reports oflow quality. These unexpected dynamics could easily generate some confusion ordisappointment among the participants. We avoid this situation by giving thebasic hints of our scoring system in the project’s web page 5 where, indeed, wepromote the gamification side of these features in order to use them in our favour.Alternatively, unexpected dynamics as described above could be controlled byimplementing an age weighted rating as proposed in [9]. In our case, this solutionshould be implemented with special care because of the seasonality of mosquitopopulation and, consequently, minimal report activity during winter and spring.This long periods of minimal activity would uniform all scores and many expe-rienced participants might feel disappointed. At the moment, our decision is tokeep participants’ scores from one season to another.
With respect to BR and DR, while essentially capturing the same conceptof rating-based reputation, our model shows a much higher sensibility to theobserved evidence, and a good balance of both, evidence of quality (the ratesthemselves) and quantity of evidence (the number of ratings). The reason lies inthe way that evidence is cumulated, i.e. by multiplication (Equation 8) instead ofby addition as in BR (Equation 1) and in DR (Equation 2). A larger sensibilityresults in a stronger responsiveness to specific participant actions. Augment-ing engagement dynamics with more sensible reputation systems may probablybind better the participants to the long term goals of CS research programs.Furthermore, our model decouples action validation from participant scoring bymeans of an integrative and unified treatment of any action under consideration,independently of the rating system used for each type of action.
By summer 2017, MA is going to collect extra data from participants witha recently added tool designed to reinforce citizen participation in the researchprogram, whilst easing the experts’ validation task. This new tool, natively in-corporated to the app, allows citizens to validate mosquito and breeding siteimages sent by third users and challenge their expertise in identifying mosquitospecies. This new action will provide valuable information in terms of partici-pants’ expertise, based on a binary rating system, i.e. right/wrong. Given thestructure of our scoring model, this information can be readily translated into anew user-class posterior distribution and incorporated to the scoring algorithm.
5 http://www.mosquitoalert.com/en/project/send-data/
16

6 Conclusion
We propose a novel reputation system based on a Bayesian network representingthe characteristic flow typically present in CS research programs where partic-ipants are expected to perform actions that are validated later on (i.e. user,action, validation), what we call the UAV network. In this network, the usersnode represents an aggregation of participants into expertise classes. The keyissue of our approach is to estimate a prior for the user-class distribution thatsuffices for our scoring pourpose. We suggest to select a set of proxy variables ofthe user-class, with a clear semantics in terms of user expertise, to make a guessabout this prior. However, any other means to get a valid estimate of the priorcan readily be used. With respect to Bayesian rating and the Dirichlet reputa-tion models, our approach presents some advantages: (i) is more responsive tothe observed evidence, and thus, it bridges better participants with their actions,(ii) it decouples action rating from user scoring, providing a unified processingof any action under consideration, no matter the number of rating levels definedfor each, and (iii) it yields a better balance of both, evidence of quality (therates themselves) and quantity of evidence (the number of ratings). As a proofof concept this model is implemented as part of the Mosquito Alert CS researchprogram.
7 Acknowledgments
We would like to thank the Mosquito Alert team for continuous effort and sup-port and the Mosquito Alert community for its unvaluable cooperation. Thiswork is part of Mosquito Alert CS program research funded by the SpanishMinistry of Economy and Competitiveness (MINECO, Plan Estatal I+D+ICGL2013-43139-R) and la Caixa Banking Foundation. Mosquito Alert is cur-rently promoted by la Caixa Banking Foundation.
References
1. N. Eyal and R. Hoover. Hooked: How to Build Habit-Forming Products. PortfolioPenguin, 2014.
2. Randy Farmer and Bryce Glass. Building Web Reputation Systems. Yahoo! Press,USA, 1st edition, 2010.
3. BJ Fogg. A behavior model for persuasive design. In Proceedings of the 4th In-ternational Conference on Persuasive Technology, Persuasive ’09, pages 40:1–40:7,New York, NY, USA, 2009. ACM.
4. Eric Friedman, Paul Resnick, and Rahul Sami. Manipulation-resistant reputationsystems. In Noam Nisan, Tim Roughgarden, Eva Tardos, and Vijay Vazirani,editors, Algorithmic Game Theory, pages 677–698. Cambridge University Press,2007.
5. Roy H.E., Preston M.J.O, C.D., Roy D.B., Savage J., Tweddle J.C., and RobinsonL.D. Understanding Citizen Science & Environtmental Monitoring. Final Reporton behalf of UK-EOF. NERC Centre for Ecology & Hidrology and Natural HistoryMuseum, November 2012.
17

6. Ferry Hendrikx, Kris Bubendorfer, and Ryan Chard. Reputation systems. J.Parallel Distrib. Comput., 75(C):184–197, jan 2015.
7. A. Irwin. Citizen Science: A Study of People, Expertise and Sustainable Develop-ment. Routledge, 1995.
8. Audun Jøsang. Trust and reputation systems. In Alessandro Aldini andRoberto Gorrieri, editors, Foundations of Security Analysis and Design IV: FOSAD2006/2007 Tutorial Lectures, pages 209–245, Berlin, Heidelberg, 2007. Springer-Verlag.
9. Audun Josang and Jochen Haller. Dirichlet reputation systems. In Availability,Reliability and Security, 2007. ARES 2007. The Second International Conferenceon, pages 112–119. IEEE, 2007.
10. Audun Jøsang and Roslan Ismail. The beta reputation system. BLED 2002 Pro-ceedings, page 41, 2002.
11. L. Mui, M. Mohtashemi, and A. Halberstadt. A computational model of trust andreputation for e-businesses. In Proceedings of the 35th Annual Hawaii InternationalConference on System Sciences (HICSS’02), volume 7 of HICSS ’02, pages 188–,Washington, DC, USA, 2002. IEEE Computer Society.
12. Colin Robertson. Whitepaper on citizen science for environmental research. 2015.13. Antonio Rodriguez, Frederic Bartumeus, and Ricard Gavalda. Machine learn-
ing assists the classification of reports by citizens on disease-carrying mosquitoes.In Ricard Gavalda, Indre Zliobaite, and Joao Gama, editors, Proceedings of theFirst Workshop on Data Science for Social Good co-located with European Con-ference on Machine Learning and Principles and Practice of Knowledge Dicoveryin Databases, SoGood@ECML-PKDD 2016, Riva del Garda, Italy, September 19,2016, volume 1831 of CEUR Workshop Proceedings. CEUR-WS.org, 2017.
14. Jordi Sabater and Carles Sierra. Review on computational trust and reputationmodels. Artif. Intell. Rev., 24(1):33–60, September 2005.
15. J. Silvertown, M. Harvey, R. Greenwood, M. Dodd, J. Rosewell, T. Rebelo, J. An-sine, and K. McConway. Crowdsourcing the identification of organisms: A case-study of ispot. ZooKeys, 480:125–146, 2015.
18