a brief chronology of the crisis and the impact of policy ... · a brief chronology of the crisis...
TRANSCRIPT
A brief chronology of the crisisand the impact of policy responses
Francesco Paolo Mongelli
Conference ‘Financial integration in Europe’
Center for Research in European, Economic, Financial, and Tax Law
(CIDEFF) – Lisbon School of Law, University of Lisbon
8-9 May 2017
This presentation reflects work-in-progress. It is loosely drawn from a “Chrnology of the euro area crisis” which I am writing with
Gonzalo Camba-Mendez. The presentation today benefitted from discussions and contributions from Björn Fischer, Michael Ehrmann,
Guido Wolsfijk, and Lorenzo Ferrante. The views expressed here are mine and might not reflect those of the ECB or the Eurosystem

Rubric
www.ecb.europa.eu ©
Phases of the crisis (I)
• It started with a liquidity crisis during the “Financial Turmoil” (Aug. 2007 to Sept
2008)
• Followed by a solvency crisis after Lehman’s default (in mid-Sept. 2008).
• This sparked the “Global Financial Crisis” and not long thereafter the “Great
Recession”.
• The recession exacerbated the internal and external imbalances already building up
within several euro area countries.
• Then, in early 2010 the Sovereign Debt Crisis of the euro area was triggered by:
• budgetary shortfalls of some governments,
• excessive private indebtedness in some countries, and
• high banks leverage.
• There were no financial backstops for sovereigns and banks.
• This brought financial fragmentation, a disruption in monetary transmission, and
almost a break-up of the euro area.
2
Rubric
www.ecb.europa.eu ©
Phases of the crisis (II)
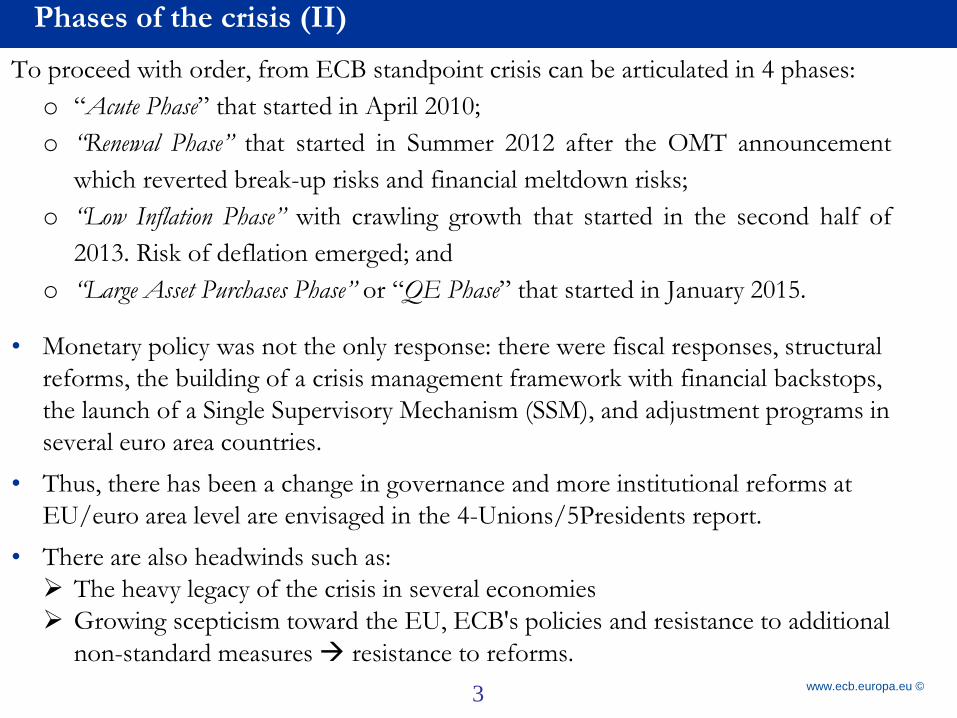
To proceed with order, from ECB standpoint crisis can be articulated in 4 phases:
o “Acute Phase” that started in April 2010;
o “Renewal Phase” that started in Summer 2012 after the OMT announcement
which reverted break-up risks and financial meltdown risks;
o “Low Inflation Phase” with crawling growth that started in the second half of
2013. Risk of deflation emerged; and
o “Large Asset Purchases Phase” or “QE Phase” that started in January 2015.
• Monetary policy was not the only response: there were fiscal responses, structural
reforms, the building of a crisis management framework with financial backstops,
the launch of a Single Supervisory Mechanism (SSM), and adjustment programs in
several euro area countries.
• Thus, there has been a change in governance and more institutional reforms at
EU/euro area level are envisaged in the 4-Unions/5Presidents report.
• There are also headwinds such as:
➢ The heavy legacy of the crisis in several economies
➢ Growing scepticism toward the EU, ECB's policies and resistance to additional
non-standard measures resistance to reforms.
3
Rubric
www.ecb.europa.eu ©
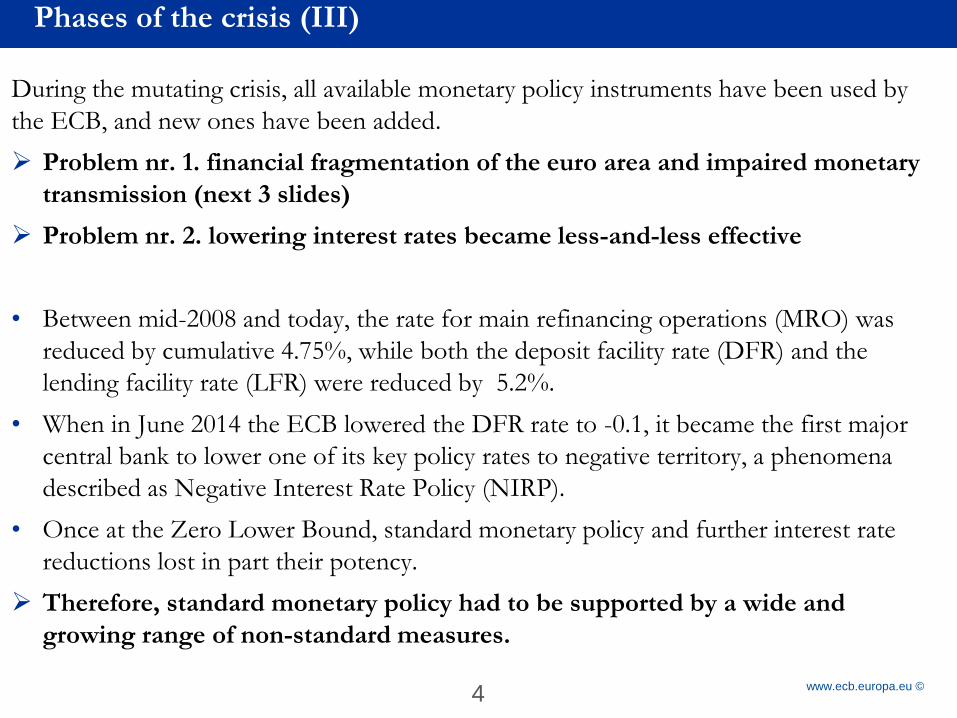
During the mutating crisis, all available monetary policy instruments have been used by
the ECB, and new ones have been added.
➢ Problem nr. 1. financial fragmentation of the euro area and impaired monetary
transmission (next 3 slides)
➢ Problem nr. 2. lowering interest rates became less-and-less effective
• Between mid-2008 and today, the rate for main refinancing operations (MRO) was
reduced by cumulative 4.75%, while both the deposit facility rate (DFR) and the
lending facility rate (LFR) were reduced by 5.2%.
• When in June 2014 the ECB lowered the DFR rate to -0.1, it became the first major
central bank to lower one of its key policy rates to negative territory, a phenomena
described as Negative Interest Rate Policy (NIRP).
• Once at the Zero Lower Bound, standard monetary policy and further interest rate
reductions lost in part their potency.
➢ Therefore, standard monetary policy had to be supported by a wide and
growing range of non-standard measures.
4
Phases of the crisis (III)
Rubric
www.ecb.europa.eu © 5
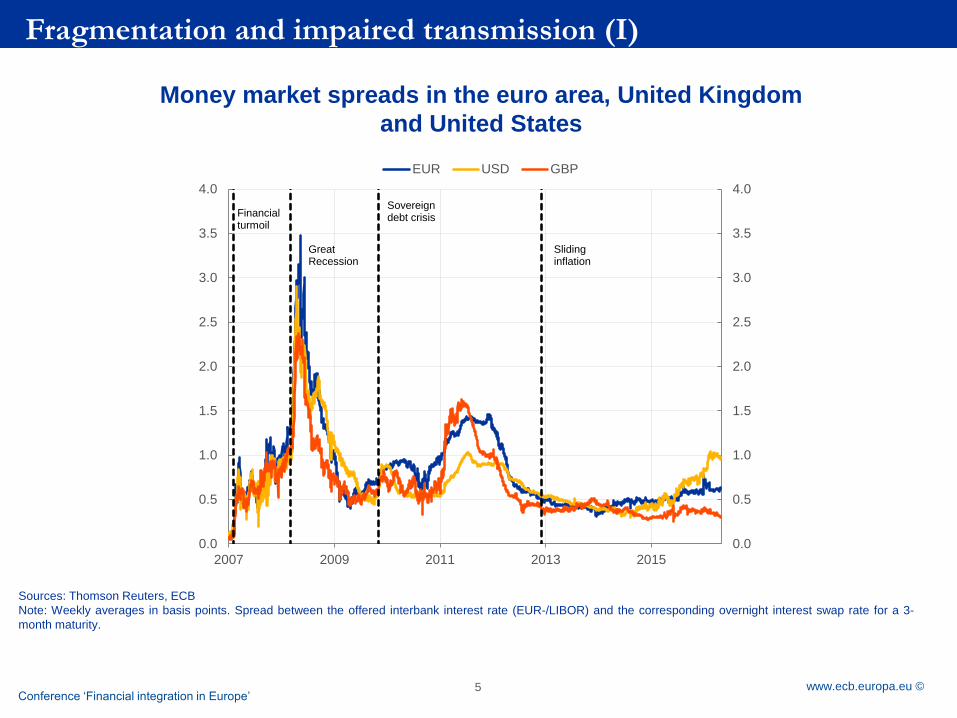
Money market spreads in the euro area, United Kingdom
and United States
Sources: Thomson Reuters, ECB
Note: Weekly averages in basis points. Spread between the offered interbank interest rate (EUR-/LIBOR) and the corresponding overnight interest swap rate for a 3-
month maturity.
Conference ‘Financial integration in Europe’
0.0
0.5
1.0
1.5
2.0
2.5
3.0
3.5
4.0
0.0
0.5
1.0
1.5
2.0
2.5
3.0
3.5
4.0
2007 2009 2011 2013 2015
EUR USD GBP
Great Recession
Sovereign debt crisis
Sliding inflation
Financialturmoil
Fragmentation and impaired transmission (I)

Rubric
www.ecb.europa.eu ©
10-year government bond spreads
Source: Datastream, Latest observation: 20 April 2017
Fragmentation and impaired transmission (II)
6
0
1000
2000
3000
4000
5000
0
500
1000
1500
2000
2500
2007 2008 2009 2010 2011 2012 2013 2014 2015 2016 2017
IE PT ES IT FR FI NL GR(rhs)
Money markettensions: Aug. 2007
Lehman breakdown:Sept. 2008 GR new
government:Jan. 2015
GR programme (IMF/ECB/EC)
and SMP I: May 2010
IE programme (EFSF):
Nov. 2010
SMP II: Aug. 2011
PT programme (EFSF):
May 2011
GR PSI:Mar. 2012
OMTs announcementAug. 2012
Greek referendum:
July 2015
GR programme (IMF/ECB/EC)
and SMP I: May 2010
Rubric
www.ecb.europa.eu ©
Fragmentation and impaired monetary transmission (III)
7
Rubric
www.ecb.europa.eu ©
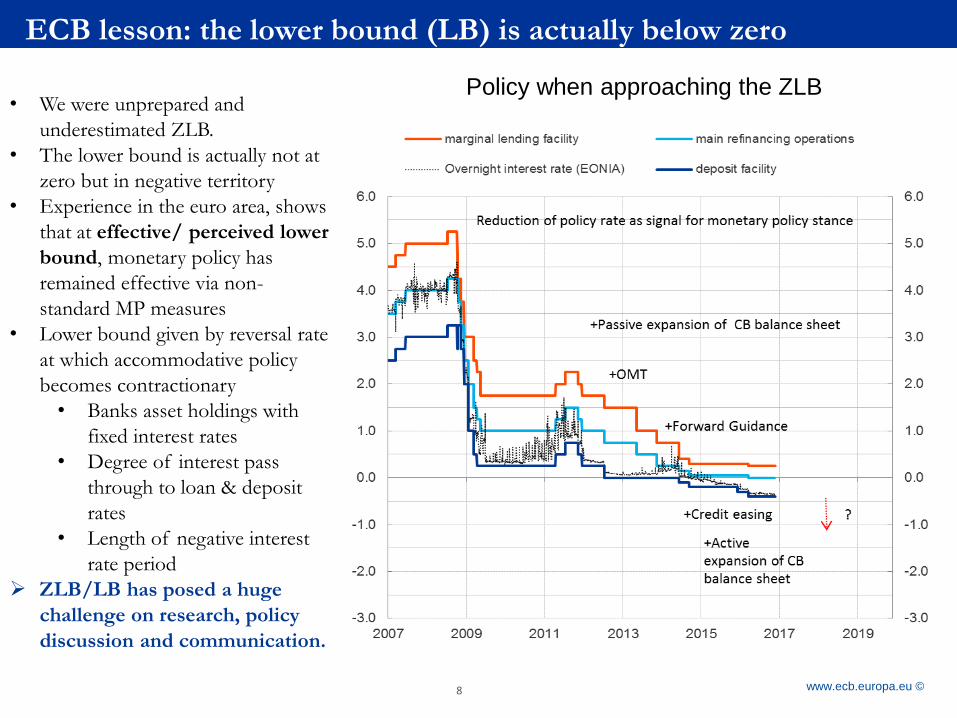
ECB lesson: the lower bound (LB) is actually below zero
8
• We were unprepared and
underestimated ZLB.
• The lower bound is actually not at
zero but in negative territory
• Experience in the euro area, shows
that at effective/ perceived lower
bound, monetary policy has
remained effective via non-
standard MP measures
• Lower bound given by reversal rate
at which accommodative policy
becomes contractionary
• Banks asset holdings with
fixed interest rates
• Degree of interest pass
through to loan & deposit
rates
• Length of negative interest
rate period
➢ ZLB/LB has posed a huge
challenge on research, policy
discussion and communication.
Policy when approaching the ZLB

Rubric
www.ecb.europa.eu © 9
rLt
real long-term rate
iLt
nominal long-term rate
Expectations on
future monetary
policy rates
Term premium
Liquidity premium
Default risk
1/L(iMPt+Eti
MPt+1+…+Eti
MPt+L-1)
= -
Redenomination risk
lpt
rrt
drt
tpt
ECB: OMT
ECB: Forward guidance
ECB (T)LTRO
ECB: APP
≈
+
+
+
+
ECB lesson: explain market premia and non-standard monetary policies
(pe + irp)
inflation expectations+
inflation risk premium)

Rubric
www.ecb.europa.eu © 10
Why? ➢ as policy rates declined, the ability to steer expectations and provide further MP accomodation
declined, and
➢ ECB had to influence expectations directly by communicating likely path of future policy rates.
Key elements of FG:
➢ Element (I): Preserve monetary accommodation
“Our monetary policy stance is geared towards maintaining the degree of monetary accommodation
warranted by the outlook for price stability and promoting stable money market conditions.”
➢ Element (II): Conditional expectation of monetary policy stance going forward
“Looking ahead, our monetary policy stance will remain accommodative for as long as necessary.
The Governing Council expects the key ECB interest rates to remain at present or lower levels for
an extended period of time. This expectation is based on the overall subdued outlook for inflation
extending into the medium term, given the broad-based weakness in the real economy and subdued
monetary dynamics.”
➢ Element (III): display readiness to act
“In the period ahead, we will monitor all incoming information on economic and monetary
developments and assess any impact on the outlook for price stability.”
ECB adopts Forward Guidance (FG) on 4 July 2013

Rubric
www.ecb.europa.eu © 11
ECB lesson: calibrating and explaining Forward Guidance
Forward guidance
Odyssean element:
Central bank communicates parameters of reaction function and policy goals. Odyssean, as reaction function, or strategy, reflects mandate and statutes.
Delphic element:
Information about central bank’s perceptions of macroeconomic
fundamentals, revealing expectations of future events,
given current state of knowledge.
2 interlinked components via which economic actors anticipate future policy:
• Interpretation by economic agents of the MP strategy governing CBs’ actions in response to economic conditions.
• Perceptions about the central bank’s present assessment of current and future economic and financial conditions.
Rubric
www.ecb.europa.eu ©
The non-standard MP measures undertaken by the ECB between August-2007
and December 2016 can be organized in four main clusters.
• The first cluster groups reverse lending operations (Repos) of increasing duration
and a widening aim; these have been unfolding throughout the crisis. These measures
are often referred to as “Credit Easing.” [money market intermediary and “central
counterparty of last resort”.
• The second cluster of non-standard measures embraces various “Ad-hoc non-
standard Operations”.
– There were some forex repos and swaps with other central banks to lighten
funding constraints for European banks with branches abroad.
– There were also ad-hoc money market interventions to provide or drain extra-
liquidity in order to adjust money market conditions.
12
Rubric
www.ecb.europa.eu ©
The third cluster is represented by a large array of “Outright Operations”.
• Their aim is to relieve funding constraints for banks, repair strained financial market
segments and support monetary policy transmission.
• Thus, they have a “market functioning support role”.
• The Covered Bond Purchases Program started in July 2009 with selective purchases
of private sector securities, and was re-proposed twice.
• A second set of outright operations is represented by selective purchases of public
sector securities like the Securities Market Program between 2010 and 2012.
• The Outright Monetary Transactions (OMT), that is a “contingent balance sheet
policy”, was announced in Summer 2012.
• The scope of outright operations changed in mid-2014, with the start of
“Quantitative Easing” policy to provide further monetary stimulus.
13
Rubric
www.ecb.europa.eu ©
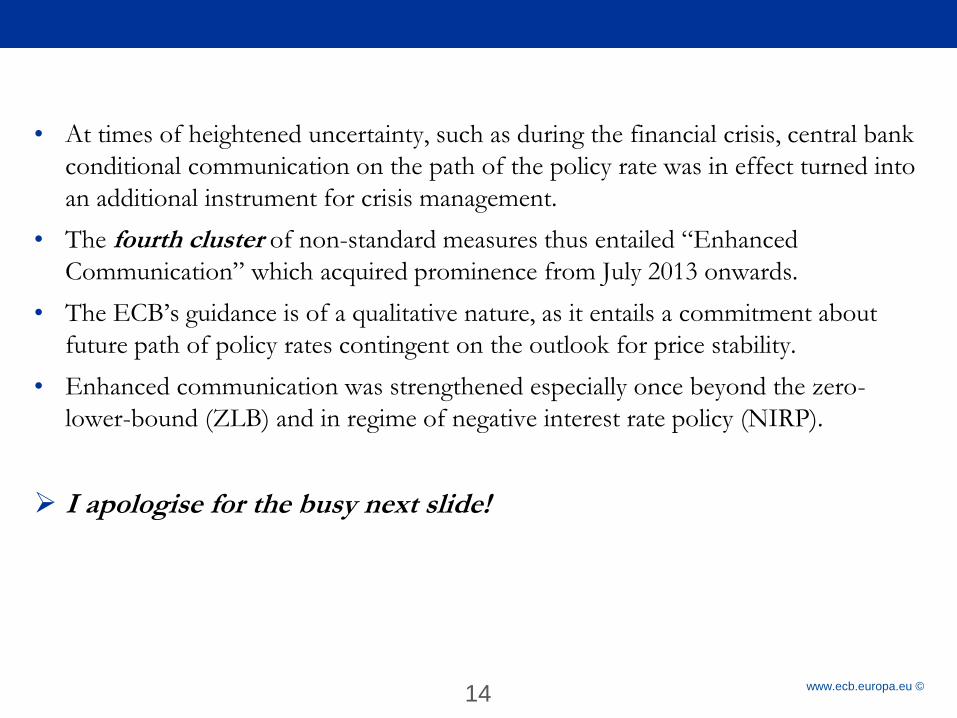
• At times of heightened uncertainty, such as during the financial crisis, central bank
conditional communication on the path of the policy rate was in effect turned into
an additional instrument for crisis management.
• The fourth cluster of non-standard measures thus entailed “Enhanced
Communication” which acquired prominence from July 2013 onwards.
• The ECB’s guidance is of a qualitative nature, as it entails a commitment about
future path of policy rates contingent on the outlook for price stability.
• Enhanced communication was strengthened especially once beyond the zero-
lower-bound (ZLB) and in regime of negative interest rate policy (NIRP).
➢ I apologise for the busy next slide!
14
Rubric
www.ecb.europa.eu © 15
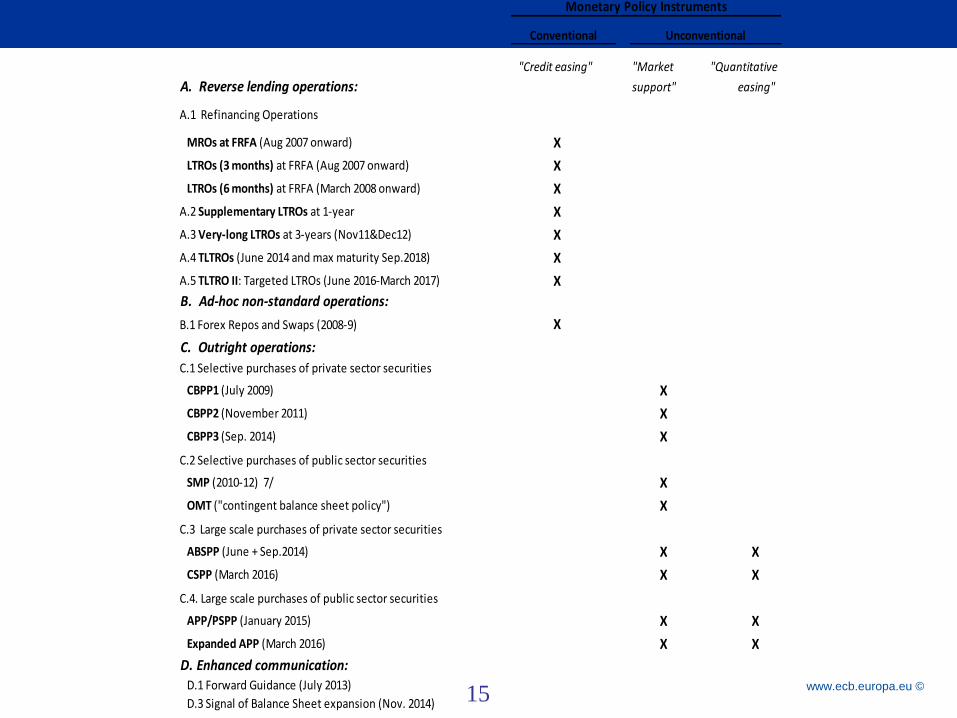
Selected Non-Standard Monetary Policy Measures (2007-2016)Monetary Policy Instruments
"Credit easing" "Market "Quantitative
A. Reverse lending operations: support" easing"
A.1 Refinancing Operations
MROs at FRFA (Aug 2007 onward) X
LTROs (3 months) at FRFA (Aug 2007 onward) X
LTROs (6 months) at FRFA (March 2008 onward) X
A.2 Supplementary LTROs at 1-year X
A.3 Very-long LTROs at 3-years (Nov11&Dec12) X
A.4 TLTROs (June 2014 and max maturity Sep.2018) X
A.5 TLTRO II: Targeted LTROs (June 2016-March 2017) X
B. Ad-hoc non-standard operations:
B.1 Forex Repos and Swaps (2008-9) X
C. Outright operations:
C.1 Selective purchases of private sector securities
CBPP1 (July 2009) X
CBPP2 (November 2011) X
CBPP3 (Sep. 2014) X
C.2 Selective purchases of public sector securities
SMP (2010-12) 7/ X
OMT ("contingent balance sheet policy") X
C.3 Large scale purchases of private sector securities
ABSPP (June + Sep.2014) X X
CSPP (March 2016) X X
C.4. Large scale purchases of public sector securities
APP/PSPP (January 2015) X X
Expanded APP (March 2016) X X
D. Enhanced communication: D.1 Forward Guidance (July 2013)
D.3 Signal of Balance Sheet expansion (Nov. 2014)
Conventional Unconventional
Rubric
www.ecb.europa.eu © 16
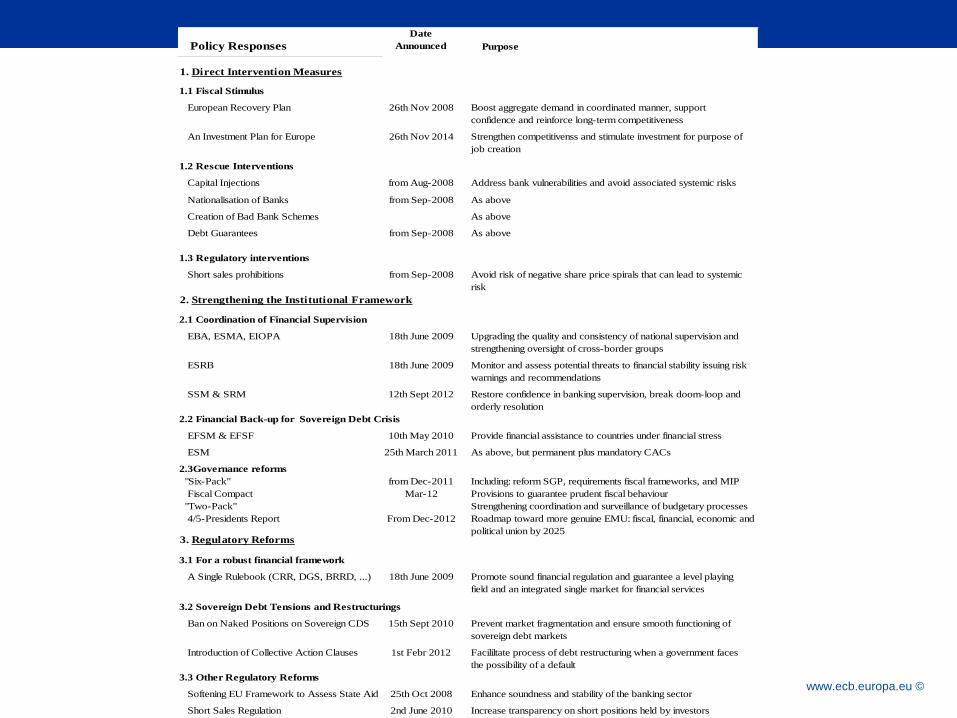
Policy Responses
Date
Announced Purpose
1. Direct Intervention Measures
1.1 Fiscal Stimulus
European Recovery Plan 26th Nov 2008 Boost aggregate demand in coordinated manner, support
confidence and reinforce long-term competitiveness
An Investment Plan for Europe 26th Nov 2014 Strengthen competitivenss and stimulate investment for purpose of
job creation
1.2 Rescue Interventions
Capital Injections from Aug-2008 Address bank vulnerabilities and avoid associated systemic risks
Nationalisation of Banks from Sep-2008 As above
Creation of Bad Bank Schemes As above
Debt Guarantees from Sep-2008 As above
1.3 Regulatory interventions
Short sales prohibitions from Sep-2008 Avoid risk of negative share price spirals that can lead to systemic
risk
2. Strengthening the Institutional Framework
2.1 Coordination of Financial Supervision
EBA, ESMA, EIOPA 18th June 2009 Upgrading the quality and consistency of national supervision and
strengthening oversight of cross-border groups
ESRB 18th June 2009 Monitor and assess potential threats to financial stability issuing risk
warnings and recommendations
SSM & SRM 12th Sept 2012 Restore confidence in banking supervision, break doom-loop and
orderly resolution
2.2 Financial Back-up for Sovereign Debt Crisis
EFSM & EFSF 10th May 2010 Provide financial assistance to countries under financial stress
ESM 25th March 2011 As above, but permanent plus mandatory CACs
2.3Governance reforms
"Six-Pack" from Dec-2011 Including: reform SGP, requirements fiscal frameworks, and MIP
Fiscal Compact Mar-12 Provisions to guarantee prudent fiscal behaviour
"Two-Pack" Strengthening coordination and surveillance of budgetary processes
4/5-Presidents Report From Dec-2012
3. Regulatory Reforms
3.1 For a robust financial framework
A Single Rulebook (CRR, DGS, BRRD, ...) 18th June 2009 Promote sound financial regulation and guarantee a level playing
field and an integrated single market for financial services
3.2 Sovereign Debt Tensions and Restructurings
Ban on Naked Positions on Sovereign CDS 15th Sept 2010 Prevent market fragmentation and ensure smooth functioning of
sovereign debt markets
Introduction of Collective Action Clauses 1st Febr 2012 Facililtate process of debt restructuring when a government faces
the possibility of a default
3.3 Other Regulatory Reforms
Softening EU Framework to Assess State Aid 25th Oct 2008 Enhance soundness and stability of the banking sector
Short Sales Regulation 2nd June 2010 Increase transparency on short positions held by investors
Roadmap toward more genuine EMU: fiscal, financial, economic and
political union by 2025
Rubric
www.ecb.europa.eu ©
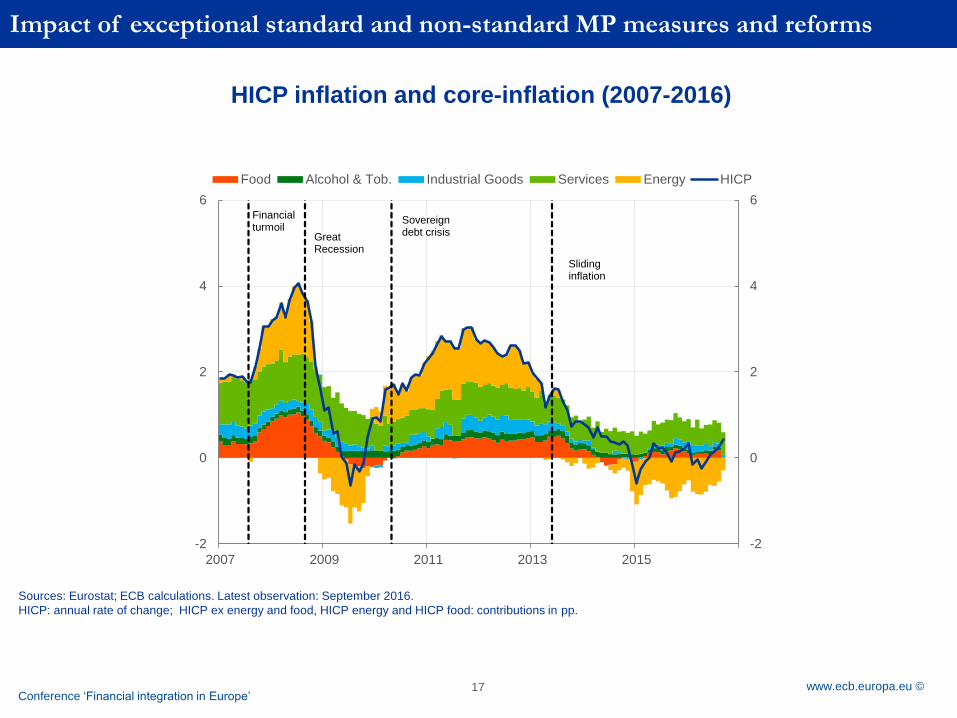
Impact of exceptional standard and non-standard MP measures and reforms
17
HICP inflation and core-inflation (2007-2016)
Sources: Eurostat; ECB calculations. Latest observation: September 2016.
HICP: annual rate of change; HICP ex energy and food, HICP energy and HICP food: contributions in pp.
Conference ‘Financial integration in Europe’
-2
0
2
4
6
-2
0
2
4
6
2007 2009 2011 2013 2015
Food Alcohol & Tob. Industrial Goods Services Energy HICP
Financialturmoil
Great Recession
Sovereign debt crisis
Sliding inflation

Rubric
www.ecb.europa.eu © 18
Euro area real GDP and its components (quarter-on-quarter percentage changes and quarter-on-quarter percentage point
contributions)
Source: Eurostat.
Note: The latest observation is for the fourth quarter of 2016 for GDP and its components.
Conference ‘Financial integration in Europe’
-3.5
-3.0
-2.5
-2.0
-1.5
-1.0
-0.5
0.0
0.5
1.0
1.5
2007 2008 2009 2010 2011 2012 2013 2014 2015 2016
GDP at market prices
private consumption
government consumption
gross fixed capital formation
net exports
changes in inventories
Financialturmoil
Great Recession
Sovereign debt crisis
Sliding inflation

Rubric
www.ecb.europa.eu © 19
Changes in policy rates and bank lending rates to non-financial corporations (basis points)
Standard and non-standard measures achieved receding transmission
impairments
Vulnerable countries Less vulnerable countries
Note: Non-stressed comprise 131 MFIs from DE, AT, FR, BE, NL. Weighted
averages, with weights represented by the corresponding loan outstanding
amounts.
Latest observation: January 2017.
Note: Stressed comprises 80 MFIs from IT, ES, PT, IE, GR. Weighted
averages, with weights represented by the corresponding loan outstanding
amounts.
Latest observation: January 2017.
-3.0
-2.5
-2.0
-1.5
-1.0
-0.5
0.0
0.5
1.0
-3.0
-2.5
-2.0
-1.5
-1.0
-0.5
0.0
0.5
1.0
Sep.11 Sep.12 Sep.13 Sep.14 Sep.15 Sep.16
84th-16th percentile 65th-35th percentile
Median MRO
APP
-3.0
-2.5
-2.0
-1.5
-1.0
-0.5
0.0
0.5
1.0
-3.0
-2.5
-2.0
-1.5
-1.0
-0.5
0.0
0.5
1.0
Sep.11 Sep.12 Sep.13 Sep.14 Sep.15 Sep.16
84th-16th percentile 65th-35th percentile
Median MRO
APPCE
Rubric
www.ecb.europa.eu © 20
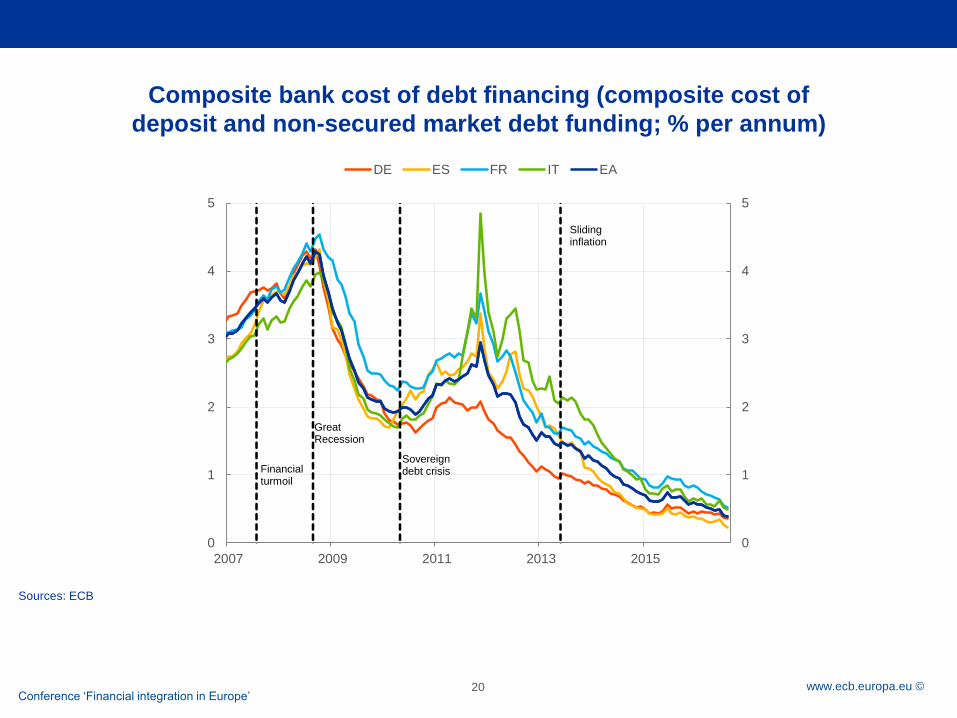
Composite bank cost of debt financing (composite cost of
deposit and non-secured market debt funding; % per annum)
Sources: ECB
Conference ‘Financial integration in Europe’
0
1
2
3
4
5
0
1
2
3
4
5
2007 2009 2011 2013 2015
DE ES FR IT EA
Financialturmoil
Great Recession
Sovereign debt crisis
Sliding inflation
Rubric
www.ecb.europa.eu © 21Conference ‘Financial integration in Europe’
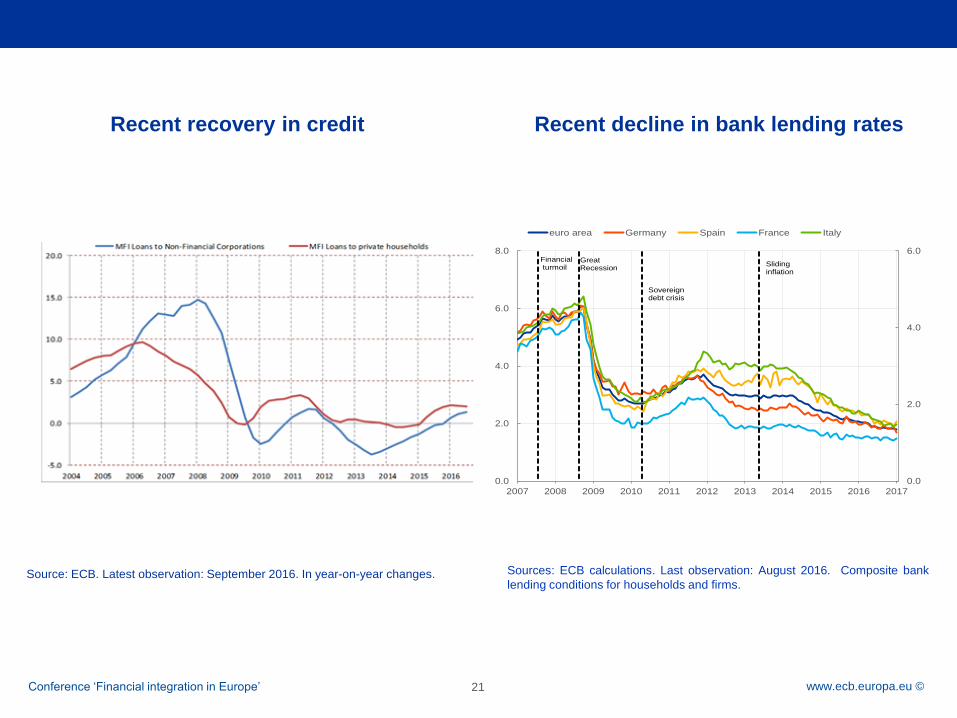
Source: ECB. Latest observation: September 2016. In year-on-year changes.
Recent recovery in credit
Sources: ECB calculations. Last observation: August 2016. Composite bank
lending conditions for households and firms.
Recent decline in bank lending rates
0.0
2.0
4.0
6.0
0.0
2.0
4.0
6.0
8.0
2007 2008 2009 2010 2011 2012 2013 2014 2015 2016 2017
euro area Germany Spain France Italy
Financialturmoil
Great Recession
Sovereign debt crisis
Sliding inflation
Rubric
www.ecb.europa.eu ©
Final remarks
• The balance sheet of the ECB reflects the varying phases of the crisis and
policy responses.
• It has expanded in size: passively in the early years, but actively over the more
recent past following the launch of the asset purchases program.
• This raised concerns about spiralling inflation (that has not materialized) and
risks to financial stability (that need to be monitored), while the economy is
slowly picking up.
• Last, it is increasingly recognised that such a prolonged period of standard and
non-standard monetary policy measures may trigger unintended side effects.
22

Rubric
www.ecb.europa.eu ©
Composite indicators of Systemic Stress (CISS) for the euro area (1999-2016)
23
Rubric
www.ecb.europa.eu ©
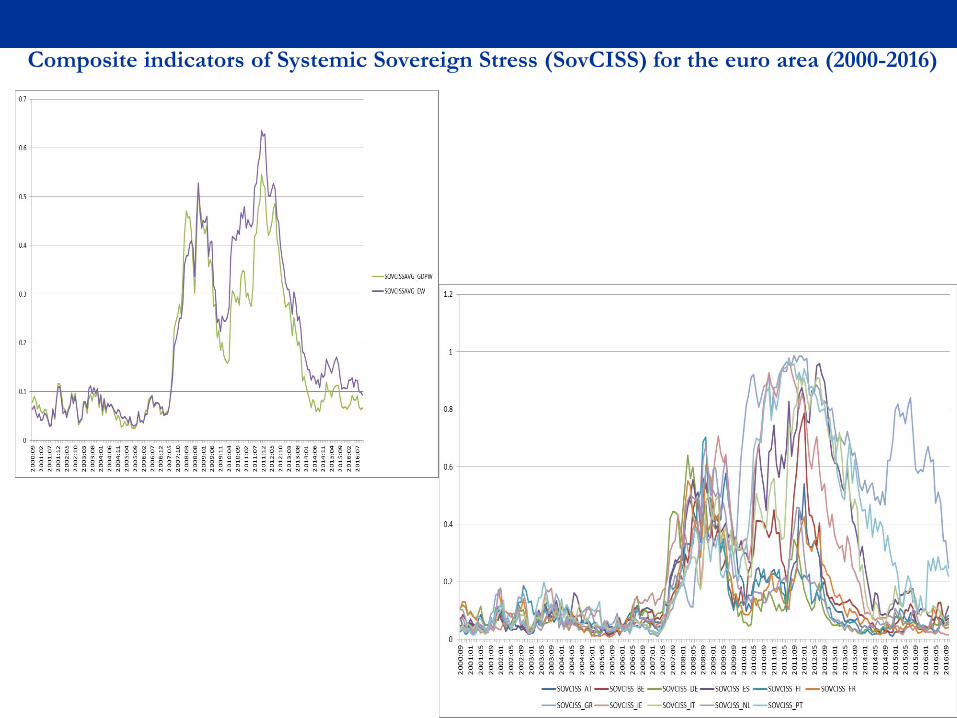
Composite indicators of Systemic Sovereign Stress (SovCISS) for the euro area (2000-2016)
24

Rubric
www.ecb.europa.eu ©
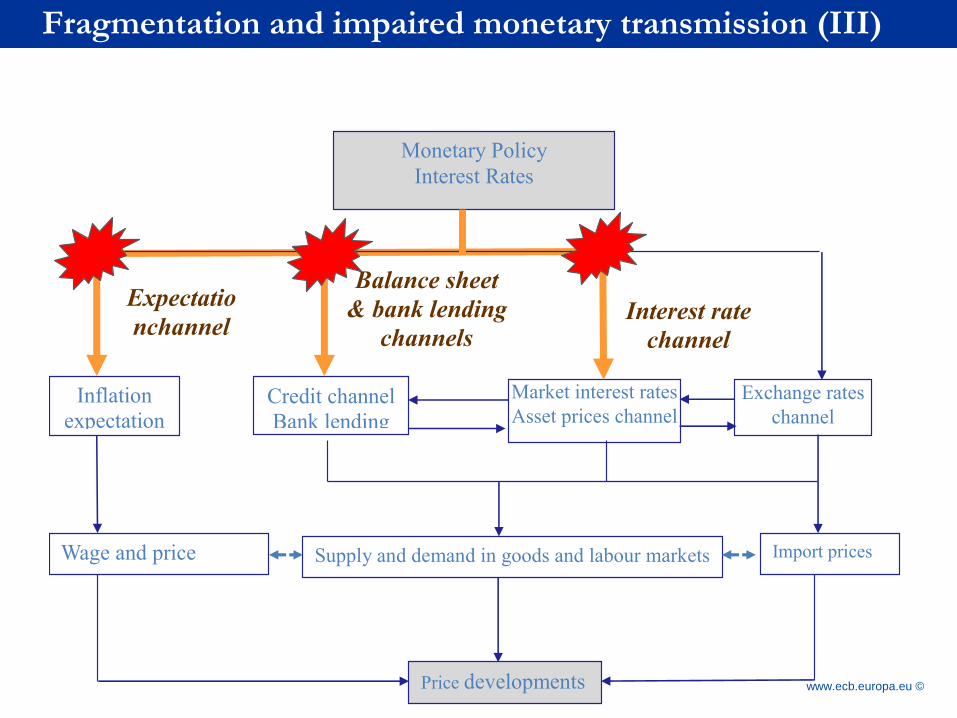
Prior to crisis monetary transmission worked
along following channels:
• “Interest rate channel” through which changes in official policy rates affect
short term money market rates, and thereafter other market rates. Changes in
interest rates also affect asset prices (and Tobin’s q), and thus have a Wealth
Effect and foster portfolio rebalancing (some call it the wealth channel or asset
evaluation channel);
• “Balance sheet and bank lending channel” capturing the impact of
monetary decisions on the net-worth of firms and their collateral value with an
impact on credit and loans supply;
• “Exchange Rates Channel” affecting asset prices as well as import and
export prices; and
• “Expectation channel” which has an impact on inflation expectations and
wage and price setting and ultimately price developments.
25
Rubric
www.ecb.europa.eu © 26
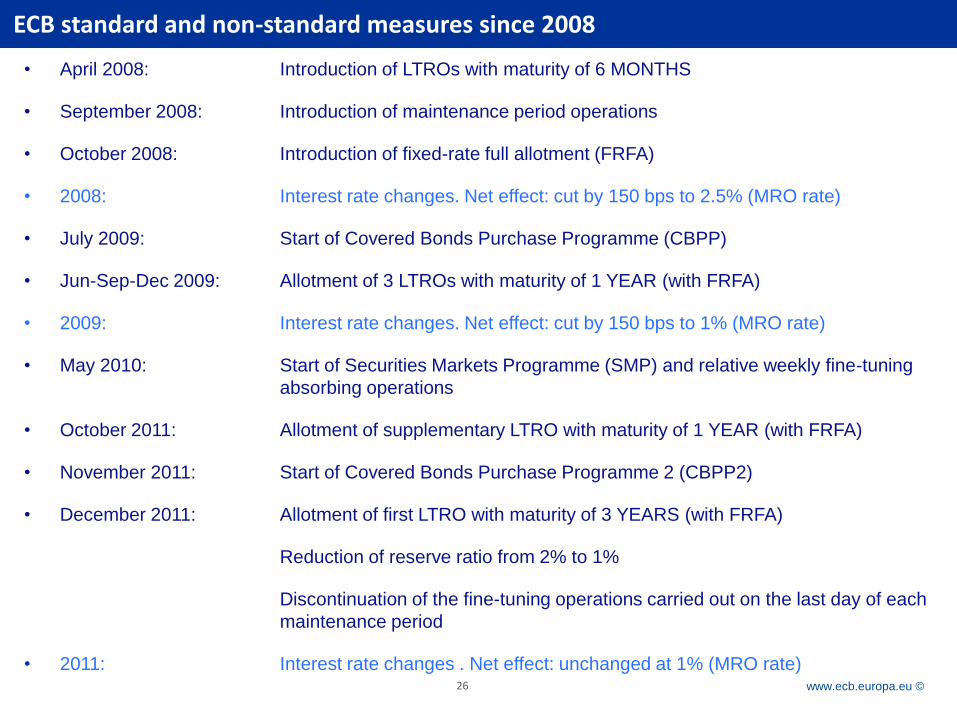
ECB standard and non-standard measures since 2008
• April 2008: Introduction of LTROs with maturity of 6 MONTHS
• September 2008: Introduction of maintenance period operations
• October 2008: Introduction of fixed-rate full allotment (FRFA)
• 2008: Interest rate changes. Net effect: cut by 150 bps to 2.5% (MRO rate)
• July 2009: Start of Covered Bonds Purchase Programme (CBPP)
• Jun-Sep-Dec 2009: Allotment of 3 LTROs with maturity of 1 YEAR (with FRFA)
• 2009: Interest rate changes. Net effect: cut by 150 bps to 1% (MRO rate)
• May 2010: Start of Securities Markets Programme (SMP) and relative weekly fine-tuning
absorbing operations
• October 2011: Allotment of supplementary LTRO with maturity of 1 YEAR (with FRFA)
• November 2011: Start of Covered Bonds Purchase Programme 2 (CBPP2)
• December 2011: Allotment of first LTRO with maturity of 3 YEARS (with FRFA)
Reduction of reserve ratio from 2% to 1%
Discontinuation of the fine-tuning operations carried out on the last day of each
maintenance period
• 2011: Interest rate changes . Net effect: unchanged at 1% (MRO rate)
Rubric
www.ecb.europa.eu © 27The ECB Monetary Policy
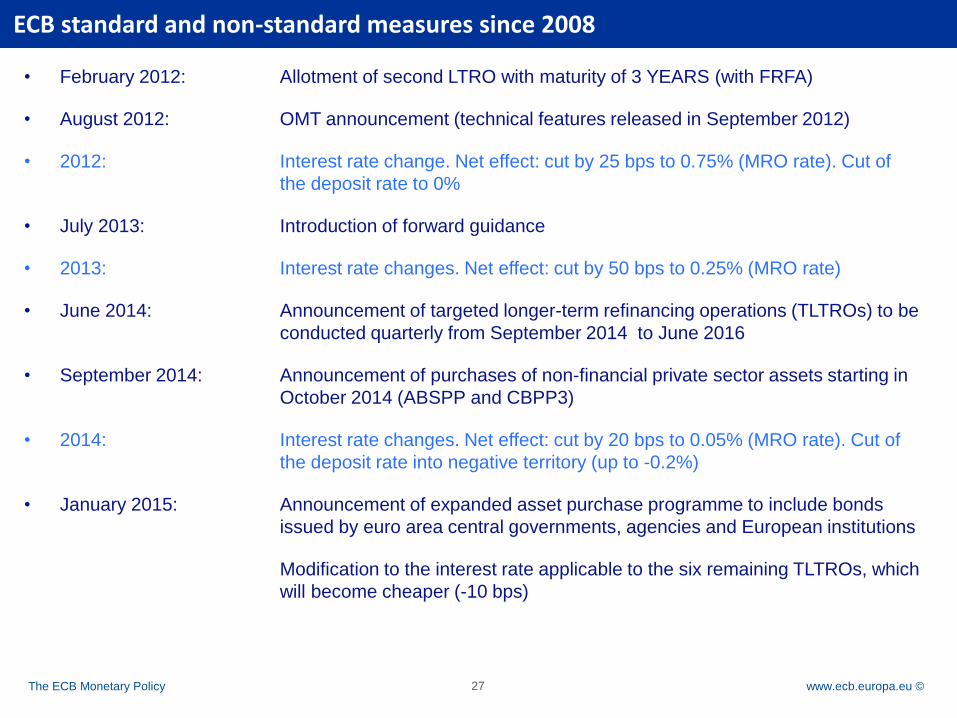
• February 2012: Allotment of second LTRO with maturity of 3 YEARS (with FRFA)
• August 2012: OMT announcement (technical features released in September 2012)
• 2012: Interest rate change. Net effect: cut by 25 bps to 0.75% (MRO rate). Cut of
the deposit rate to 0%
• July 2013: Introduction of forward guidance
• 2013: Interest rate changes. Net effect: cut by 50 bps to 0.25% (MRO rate)
• June 2014: Announcement of targeted longer-term refinancing operations (TLTROs) to be
conducted quarterly from September 2014 to June 2016
• September 2014: Announcement of purchases of non-financial private sector assets starting in
October 2014 (ABSPP and CBPP3)
• 2014: Interest rate changes. Net effect: cut by 20 bps to 0.05% (MRO rate). Cut of
the deposit rate into negative territory (up to -0.2%)
• January 2015: Announcement of expanded asset purchase programme to include bonds
issued by euro area central governments, agencies and European institutions
Modification to the interest rate applicable to the six remaining TLTROs, which
will become cheaper (-10 bps)
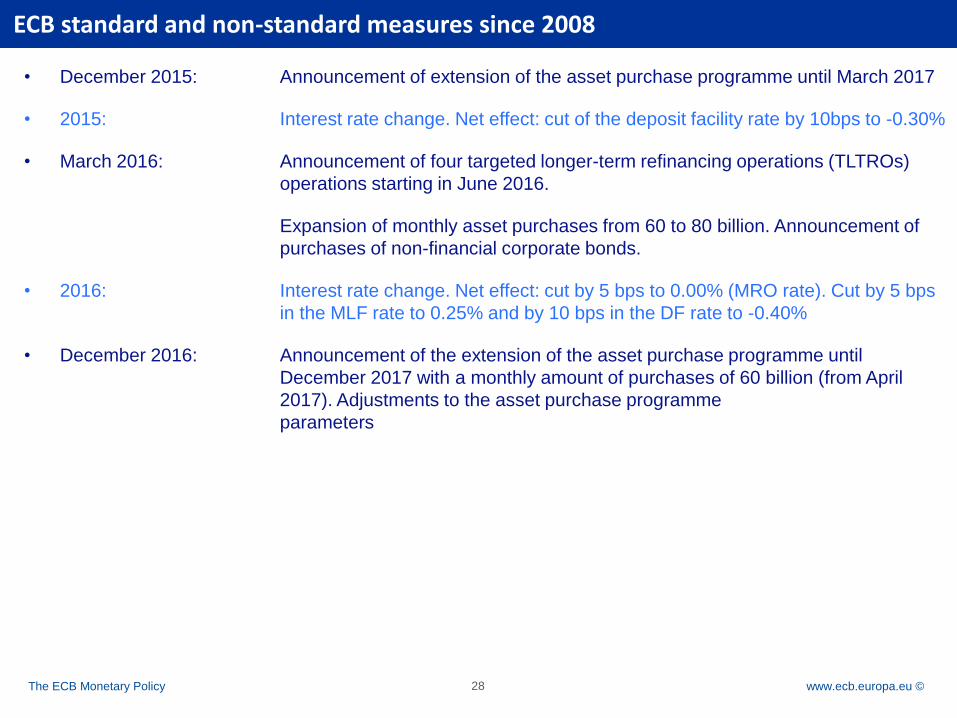
ECB standard and non-standard measures since 2008
Rubric
www.ecb.europa.eu © 28The ECB Monetary Policy
• December 2015: Announcement of extension of the asset purchase programme until March 2017
• 2015: Interest rate change. Net effect: cut of the deposit facility rate by 10bps to -0.30%
• March 2016: Announcement of four targeted longer-term refinancing operations (TLTROs)
operations starting in June 2016.
Expansion of monthly asset purchases from 60 to 80 billion. Announcement of
purchases of non-financial corporate bonds.
• 2016: Interest rate change. Net effect: cut by 5 bps to 0.00% (MRO rate). Cut by 5 bps
in the MLF rate to 0.25% and by 10 bps in the DF rate to -0.40%
• December 2016: Announcement of the extension of the asset purchase programme until
December 2017 with a monthly amount of purchases of 60 billion (from April
2017). Adjustments to the asset purchase programme
parameters
ECB standard and non-standard measures since 2008