a case study on increasing frame flexibility through ... · high-yield drift frame design ......
TRANSCRIPT
A Case Study on Increasing Frame Flexibility Through
Implementing High-Yield-drift Moment Frames
Jason Mathew Hirschi
A project submitted to the faculty of
Brigham Young University
in partial fulfillment of the requirements for the degree of
Master of Science
Dr. Paul William Richards, Chair
Dr. Fernando S. Fonseca
Dr. Richard Jack Balling
Department of Civil Engineering
Brigham Young University
April 2013
Copyright © 2013 Jason Mathew Hirschi
All Rights Reserved


ACKNOWLEDGEMENTS
I want to thank Dr. Richards for his patience with me and his help in getting me to
graduate on time. I also thank Dr. Fonseca for being a mentor and a friend to me, his kindness
and concern will never be forgotten. Most of all I want to thank my committed, dedicated,
beautiful wife. I am what I am, and I do what I do, all because of her. I dedicate this paper to
her and my four beautiful kids.

v
TABLE OF CONTENTS
LIST OF TABLES ...................................................................................................................... vii
LIST OF FIGURES ..................................................................................................................... ix
1 Introduction ........................................................................................................................... 1
2 Case Study ............................................................................................................................. 3
Case Study Building ....................................................................................................... 3 2.1
Traditional Design Method ............................................................................................. 3 2.2
2.2.1 Gravity Design ............................................................................................................ 3
2.2.2 SLRS Design ............................................................................................................... 4
2.2.3 Weight Analysis .......................................................................................................... 6
High-Yield-Drift Frame Design ...................................................................................... 7 2.3
2.3.1 Design Considerations ................................................................................................ 7
2.3.2 Member Size Determination ....................................................................................... 9
3 Static Pushover Analysis .................................................................................................... 13
Static Pushover Analysis Procedure ............................................................................. 13 3.1
Static Pushover Results ................................................................................................. 14 3.2
4 Discussion of Results ........................................................................................................... 15
Discussion of Results .................................................................................................... 15 4.1
Future Research ............................................................................................................ 16 4.2
REFERENCES ............................................................................................................................. 17
Appendix A .................................................................................................................................. 19
Appendix B .................................................................................................................................. 29

vi

vii
LIST OF TABLES
Table 1: Design Loads ...........................................................................................................3
Table 2: Traditional Design Member Summary ....................................................................6
Table 3: Weight Table for Gravity Design of Traditional Case Building .............................7
Table 4: Weight Table for SLRS Design of Traditional Case Building ................................7
Table 5: Moment of Inertia Ratios Used for HYD SLRS Member Selection .......................10
Table 6: HYD SLRS Member Summary ...............................................................................10
Table 7: Moments of Inertia Goals vs. Achieved ..................................................................11
Table 8: HYD Weight Summary & Comparison with Traditional Design ...........................11
Table 9: Pushover Analysis Results .......................................................................................14

viii
ix
LIST OF FIGURES
Figure 1: Plan View of Traditional Design ............................................................................5
Figure 2: Elevation View of Traditional Design SLRS System ............................................5
Figure 3: Moment Frame Layout for HYD SLRS Design .....................................................8
Figure 4: Elevation View of Three Bays of HYD SLRS Design ..........................................9

x

1
1 INTRODUCTION
Steel special moment frames are very desirable in steel building design but come at a
price. The primary advantage to using steel special moment frames is that they have no
structural walls or braces, thereby providing greater architectural freedom. This freedom then
provides for open bays, greater layout flexibility and unobstructed views. The tradeoff for
special moment frames is that their heavier sections and labor intensive connections make them
more costly than other alternatives (Hamburger, Krawinkler 2009).
The members and connections in a steel special moment frame (SMF) are designed to
resist forces that result as a building sways through an earthquake (Hamburger 2009). As the
structure sways, it will sway through both elastic and inelastic deformations. Special attention
and care must be used by the design engineer to resist strong earthquake shaking while having
controlled inelastic behavior.
The current building codes that apply to steel buildings are written with the intent to
protect the life and safety of building occupants. Current building codes provide safety and
avoid earthquake induced collapse in a major seismic event while allowing buildings to sustain
“controlled inelastic, ductile deformations” (American 2006). Such deformations may or may
not render the building structurally unsound after the earthquake. In addition to safety both
architectural and structural damage is mitigated in the code through drift limits.
2
Often the controlling factor in steel SMF design is meeting the requirements known as
drift limits, as found in ASCE 7-10 Section 12.12. A common design approach is to first use the
equivalent lateral force (ELF) procedure to size the SMF members in the SLRS system. Using
the ELF loads, the structure must then meet certain limits on displacement or inter-story drift.
Drift limits tend to govern member sizes in SMF’s rather than strength limits.
This study explores the potential of increasing the flexibility of the SMF system to
eliminate inelastic deformations. Eliminating inelastic deformations will not eliminate
architectural damage; however it will eliminate damage to the structure of the building. The
current philosophy which provided for inelastic behavior will be questioned by replacing SMF’s
with a new moment frame concept, labeled the high-yield-drift (HYD) frame.
The high-yield-drift frame considered herein challenges the current practices and
ideology of creating stiff frames that behave inelastically during a major earthquake. The goal
for the HYD frame concept is to achieve higher elastic drifts before yielding than with current or
traditional design practices. Through increased flexibility all of the displacements in a HYD
frame will be elastic, therefore ensuring a damage-free structure after an earthquake. This case
study attempts to gain this flexibility through distributing the seismic load resisting system
(SLRS) weight in a traditional special moment frame system throughout the whole of the
structure and reducing the number of moment connections per frame. Rather than having only a
few bays or frames act as the SLRS, the HYD structure will use a higher number of frames with
fewer moment connections per frame, thereby providing greater flexibility. The application of
drift limits to HYD frames is beyond the scope of the present study.

3
2 CASE STUDY
Case Study Building 2.1
A simple commercial steel building was considered for this case study, known hereafter
as the “case building.” The case building is five bays by five bays with a bay length of 30ft and
stands four stories with a typical story height of 15ft. The design loads used on the building are
found in Table 1 and are typical of a building of this size with general commercial occupancy.
The exterior of the case building will include a parapet extending up from the roof four feet.
Table 1: Design Loads
Dead
Load
Live
Load
Seismic
Weight
Roof 100 20 90
Floor 100 50 90
Exterior Wall Weight 90psf
Traditional Design Method 2.2
2.2.1 Gravity Design
The first step in the traditional design was the gravity members. The loads found in
Table 1 were used to find tributary areas for sizing the members for gravity loads. The live loads
were considered to be reducible and were reduced in sizing of the individual members. First the
interior columns at the 3-4 story were sized followed by the 1-2 story columns. The gravity
column design was finished with the four exterior corner columns for both the 3-4 and 1-2 story

4
sizes. The girders were then sized, followed by the beams. The design of the beams utilized
composite beams as is typical in buildings of this size and type. All gravity members were kept
the same size on levels 1-2 and 3-4 respectively. The calculations for the gravity design can be
found in Appendix A.
2.2.2 SLRS Design
The design of the SLRS consisted of six special moment frames in each orthogonal
direction. Using special moment frames was important for a reasonable comparison to the
design of the high yield-drift frames. All of the moment frames are found on the exterior grid
lines of the building in the center three bolded bays as shown in Figure 1. Figure 2 shows an
elevation view of the SLRS for any one line of SMF bays. The moment connections are those
connections circled and the four column-foundation connections were assumed to be pinned.
The moment frames were designed using the equivalent lateral force (ELF) procedure as
defined in ASCE 7-10 Section 12.8. The seismic design values used were SDS=1g and SD1=0.6g.
These values were based on the building being located in Salt Lake City, a high seismic area.
The frames then needed to be modeled in order to find the inter-story drift from the ELF
loads. The frames were modeled with the lateral loads in the structural design software
VisualAnalysis. In determining member sizes the same shape was specified for each of the
following members respectively: 1-2 story columns, 3-4 story columns, 1-2 story beams and 3-4
story beams. The members were then sized by comparing the drift limits, as calculated per
Section 12.12 of ASCE 7-10, with the deflections reported from VisualAnalysis. A summary of
the member sizes for the traditional gravity and SLRS design is found in Table 2. Once the drift
limits were satisfied the member size selection was complete.

5
Figure 1: Plan View of Traditional Design
Figure 2: Elevation View of Traditional Design SLRS System

6
Table 2: Traditional Design Member Summary
Location Shape Ix
Gravity Interior 3-4 Column W 12 x 40 307
Gravity Interior 1-2 Column W 12 x 58 478
Gravity Exterior 3-4 Column W 12 x 40 307
Gravity Exterior 1-2 Column W 12 x 53 425
Girders W 21 x 62 1330
Beams W 14 x 22 199
SLRS 3-4 Column W 33 x 118 6710
SLRS 1-2 Column W 33 x 291 17700
SLRS 3-4 Beam W 18 x 106 1910
SLRS 1-2 Beam W 30 x 235 11700
The final step in the SLRS design for this case study was to design the reduced beam
section’s (RBS). An RBS connection was designed for the two different moment connections
found at the 1-2 and 3-4 story heights. The RBS design was done in accordance to chapter five
of part 6 in the American Institute of Steel Construction’s (AISC) Seismic Design Manual. The
design of the RBS connection was important for a better approximation of the lateral force at
yielding. All calculations for the SLRS design can be found in Appendix B.
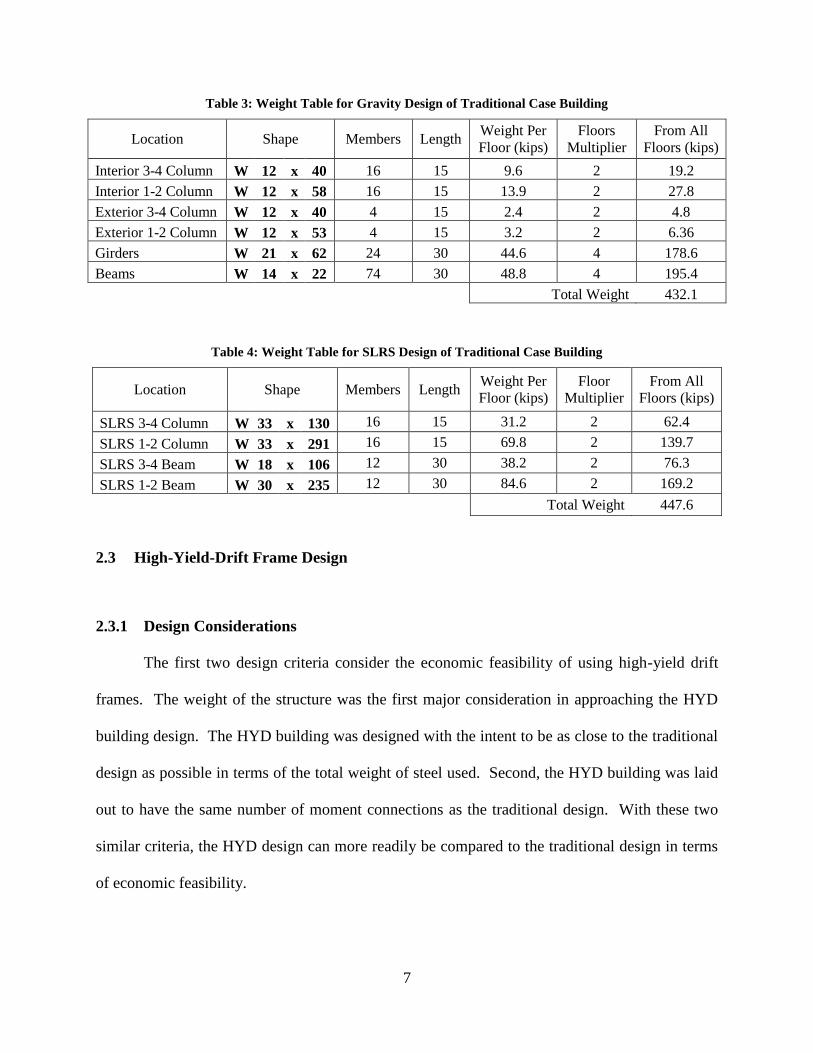
2.2.3 Weight Analysis
Once the design of the traditional building was complete the combined weight of steel
structure was calculated. This weight would later be used as a control for the design of the case
building utilizing high-yield-drift frames. The weight analysis was separated between the
gravity members and the members used in the SLRS system. Table 3 and Table 4 show the
tabulations for the gravity design weight and SLRS design weight respectively. In these tables
the floor multiplier helped account for members which were not on all floors.
7
Table 3: Weight Table for Gravity Design of Traditional Case Building
Location Shape Members Length Weight Per
Floor (kips)
Floors
Multiplier
From All
Floors (kips)
Interior 3-4 Column W 12 x 40 16 15 9.6 2 19.2
Interior 1-2 Column W 12 x 58 16 15 13.9 2 27.8
Exterior 3-4 Column W 12 x 40 4 15 2.4 2 4.8
Exterior 1-2 Column W 12 x 53 4 15 3.2 2 6.36
Girders W 21 x 62 24 30 44.6 4 178.6
Beams W 14 x 22 74 30 48.8 4 195.4
Total Weight 432.1
Table 4: Weight Table for SLRS Design of Traditional Case Building
Location Shape Members Length Weight Per
Floor (kips)
Floor
Multiplier
From All
Floors (kips)
SLRS 3-4 Column W 33 x 130 16 15 31.2 2 62.4
SLRS 1-2 Column W 33 x 291 16 15 69.8 2 139.7
SLRS 3-4 Beam W 18 x 106 12 30 38.2 2 76.3
SLRS 1-2 Beam W 30 x 235 12 30 84.6 2 169.2
Total Weight 447.6
High-Yield-Drift Frame Design 2.3
2.3.1 Design Considerations
The first two design criteria consider the economic feasibility of using high-yield drift
frames. The weight of the structure was the first major consideration in approaching the HYD
building design. The HYD building was designed with the intent to be as close to the traditional
design as possible in terms of the total weight of steel used. Second, the HYD building was laid
out to have the same number of moment connections as the traditional design. With these two
similar criteria, the HYD design can more readily be compared to the traditional design in terms
of economic feasibility.
8
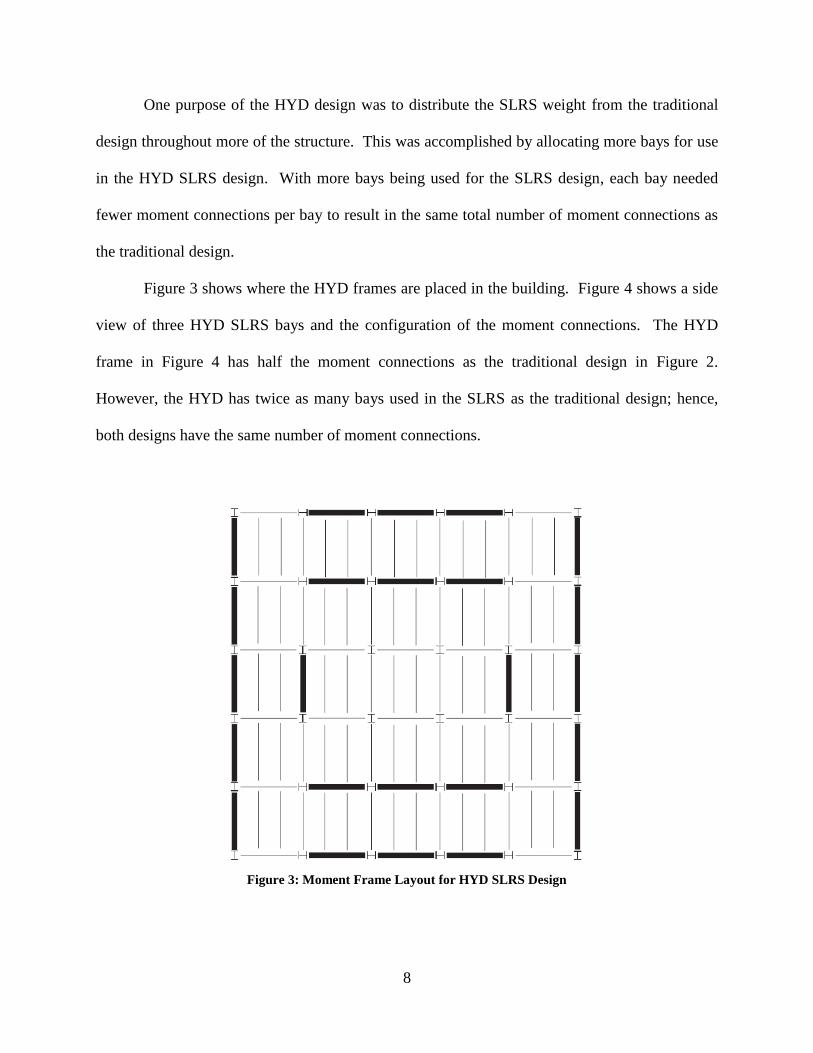
One purpose of the HYD design was to distribute the SLRS weight from the traditional
design throughout more of the structure. This was accomplished by allocating more bays for use
in the HYD SLRS design. With more bays being used for the SLRS design, each bay needed
fewer moment connections per bay to result in the same total number of moment connections as
the traditional design.
Figure 3 shows where the HYD frames are placed in the building. Figure 4 shows a side
view of three HYD SLRS bays and the configuration of the moment connections. The HYD
frame in Figure 4 has half the moment connections as the traditional design in Figure 2.
However, the HYD has twice as many bays used in the SLRS as the traditional design; hence,
both designs have the same number of moment connections.
Figure 3: Moment Frame Layout for HYD SLRS Design

9
Figure 4: Elevation View of Three Bays of HYD SLRS Design
2.3.2 Member Size Determination
The gravity design for the HYD building used all the same members as designed in the
traditional building. Any column or beam not involved in a moment connection was sized from
the sizing of the gravity members in the traditional design. Figure 3 then indicates that only four
columns in the entire structure are sized for gravity. Additionally Figure 4 shows that for each
HYD SLRS bay there are six beams, at the second and fourth stories, that are gravity beams.
The HYD SLRS members were sized based on criteria that were developed using
engineering judgment. The criteria were based on relative moments of inertia (I) as shown in
Table 5. The purpose of the ratios used for the moments of inertia was to distribute the drift and
moments evenly throughout the height of the structure. Due to the finite quantity of steel
member sizes, achieving the ratios exactly as shown was impractical, and the ultimate design
attempted to get the ratios as close as possible to the target ratios. The members chosen for the
HYD SLRS system are shown in Table 6. The end columns identified in Table 5 and Table 6
refer to the two end columns in any line of moment frames in the SLRS system.

10
Table 5: Moment of Inertia Ratios Used for HYD SLRS Member Selection
Members Moment of
Inertia
1 & 2 Story Column I
3 & 4 Story Column 0.7*I
1 & 2 Story Beam I
3 & 4 Story Beam 0.7*I
1 & 2 Story End Column 0.5*I
3 & 4 Story End Column 0.35*I
Table 6: HYD SLRS Member Summary
Members Shape Ix
1 & 2 Story Column W 14 x 283 3840
3 & 4 Story Column W 14 x 211 2660
1 & 2 Story Beam W 18 x 175 3450
3 & 4 Story Beam W 18 x 143 2750
1 & 2 Story End Column W 14 x 159 1900
3 & 4 Story End Column W 14 x 120 1380
Using Excel, the weight analysis was done concurrently with the HYD SLRS design. As
members were chosen for the HYD SLRS design, the spreadsheet would update and report the
building weight as well as the current moment of inertia ratios. Using the spreadsheet, the
moment of inertia ratios as well as the building weight could be determined simultaneously. The
achieved ratios for the HYD design as compared with those in Table 5 are compared in Table 7.
The weights of the two designs are compared in a weight summary in Table 8. The final
HYD design was 6.1kips heavier than the traditional design, which equaled only 0.7% of the
traditional design weight. In the traditional design the distribution of weight between the gravity
and SLRS members is nearly 50/50. However, the HYD design utilized 17% more of the total
structure weight than did the traditional design in the SLRS system.

11
Table 7: Moments of Inertia Goals vs. Achieved
Moments of Inertia (I)
Members Goal Actual
1 & 2 Story Column I I
3 & 4 Story Column 0.7*I 0.69*I
1 & 2 Story Beam I 0.90*I
3 & 4 Story Beam 0.7*I 0.72*I
1 & 2 Story End Column 0.5*I 0.49*I
3 & 4 Story End Column 0.35*I 0.52*I
Table 8: HYD Weight Summary & Comparison with Traditional Design
Traditional HYD Trad/HYD
Gravity Weight 432 280 154%
SLRS Weight 442 600 74%
% of SLRS in Total Weight 51% 68% --
Total Weight 874 880 99.3%

12
13
3 STATIC PUSHOVER ANALYSIS
The stiffness and drifts of the two frames at yielding are vital properties to the
comparison of the two design methods. These properties were obtained through a static
pushover analysis using the software VisualAnalysis.
Static Pushover Analysis Procedure 3.1
The procedure for the pushover analysis was simplified by assuming a rigid diaphragm.
Using this assumption, only three moment frame bays were modeled from each design. The
three moment bays therefore represented half of the SLRS for the traditional building and one-
quarter of the SLRS for the HYD design.
The pushover analysis loads the building until yielding occurs in one or more members.
The lateral loads placed on the frames were distributed in accordance with section 12.8.3 of
ASCE 7-10. Beginning with the base shear, as calculated by the ELF procedure, the lateral
forces were increased until any member of the frame began to yield. The key indicator for
yielding of the frames was the moment in the first story beam. The traditional design was
considered yielded when the moment at the RBS connection in the beam reached its capacity as
determined by Equation 1. The first story HYD beam was considered to be yielded similarly
with Equation 2. These calculations used in the pushover analysis can be found in Appendix B.
14
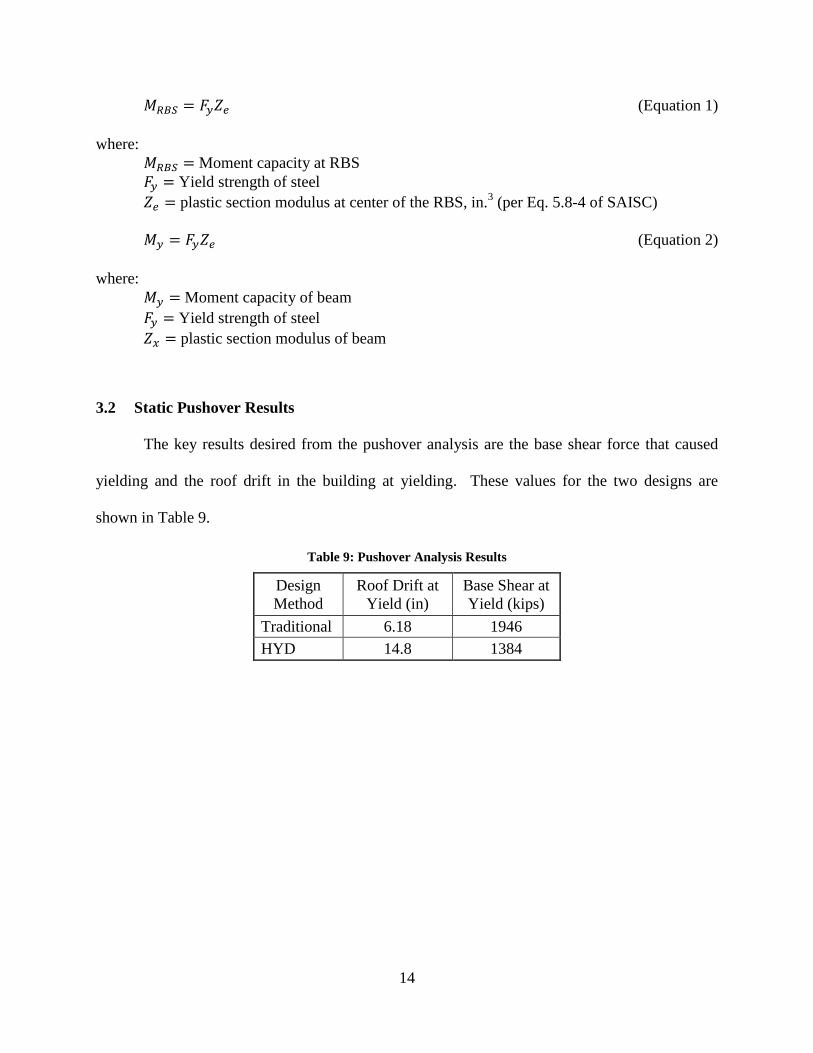
(Equation 1)
where:
Moment capacity at RBS
Yield strength of steel
plastic section modulus at center of the RBS, in.3 (per Eq. 5.8-4 of SAISC)
(Equation 2)
where:
Moment capacity of beam
Yield strength of steel
plastic section modulus of beam
Static Pushover Results 3.2
The key results desired from the pushover analysis are the base shear force that caused
yielding and the roof drift in the building at yielding. These values for the two designs are
shown in Table 9.
Table 9: Pushover Analysis Results
Design
Method
Roof Drift at
Yield (in)
Base Shear at
Yield (kips)
Traditional 6.18 1946
HYD 14.8 1384

15
4 DISCUSSION OF RESULTS
Discussion of Results 4.1
Throughout the height of the structure the HYD frame averaged about 2.5 times the yield
displacement as the traditional design. This result was anticipated, however, with the additional
displacements it was hoped to achieve strengths closer to those of the traditional design.
The traditional design produced SMF’s about 40% stronger than the HYD design. This
seems to be best attributed to the weight distribution among the members used in the two SLRS
systems. Although the HYD building was able to utilize 17% more weight in its SLRS system, it
was also distributing that weight through 40% more lineal feet of member. This weight
distribution resulted in the largest members in the HYD being substantially smaller in both
weight and moment of inertia than those used in the traditional design.
For the traditional and HYD frames, the overall strength can be improved by increasing
the size of the first story beam. This improvement is even more pronounced in the HYD frame.
Through decreasing many of the moment of inertia ratios presented in Table 5, the first story
beam size could be increased. The increase in the first story beam size would better distribute
the lateral forces and therefore provide greater strength for the frame.
16
Future Research 4.2
This case study is meant to supplement further work on the topic of increasing the yield-
drift in steel frames using HYD’s. The weight of both designs is somewhat arbitrary considering
the variability in choosing the members for the traditional frame. The solution to the problem of
inelastic drifts may be found in changing the weights as well as adjusting some HYD design
criteria. Further research may well validate the idea of eliminating inelastic behavior in the
seismic design of steel buildings.
17
REFERENCES
American Institute of Steel Construction. and Structural Steel Educational Council. 2006.
Seismic design manual. Chicago: American Institute of Steel Construction.
Hamburger, Ronald O. 2009. Facts for steel buildings -- earthquakes and seismic design. Vol. 3.
United States of America: American Institute of Steel Construction.
Hamburger, Ronald O., Krawinkler, Helmut, Malley, James O., and Adan, Scott M. (2009).
"Seismic design of steel special moment frames: a guide for practicing engineers," NEHRP
Seismic Design Technical Brief No. 2, produced by the NEHRP Consultants Joint Venture,
a partnership of the Applied Technology Council and the Consortium of Universities for
Research in Earthquake Engineering, for the National Institute of Standards and
Technology, Gaithersburg, MD., NIST GCR 09-917-3
Minimum design loads for buildings and other structures.2010. . Ed. American Society of Civil
Engineers. Reston, Va.: American Society of Civil Engineers: Structural Engineering
Institute, c2010.

18

19
APPENDIX A

20
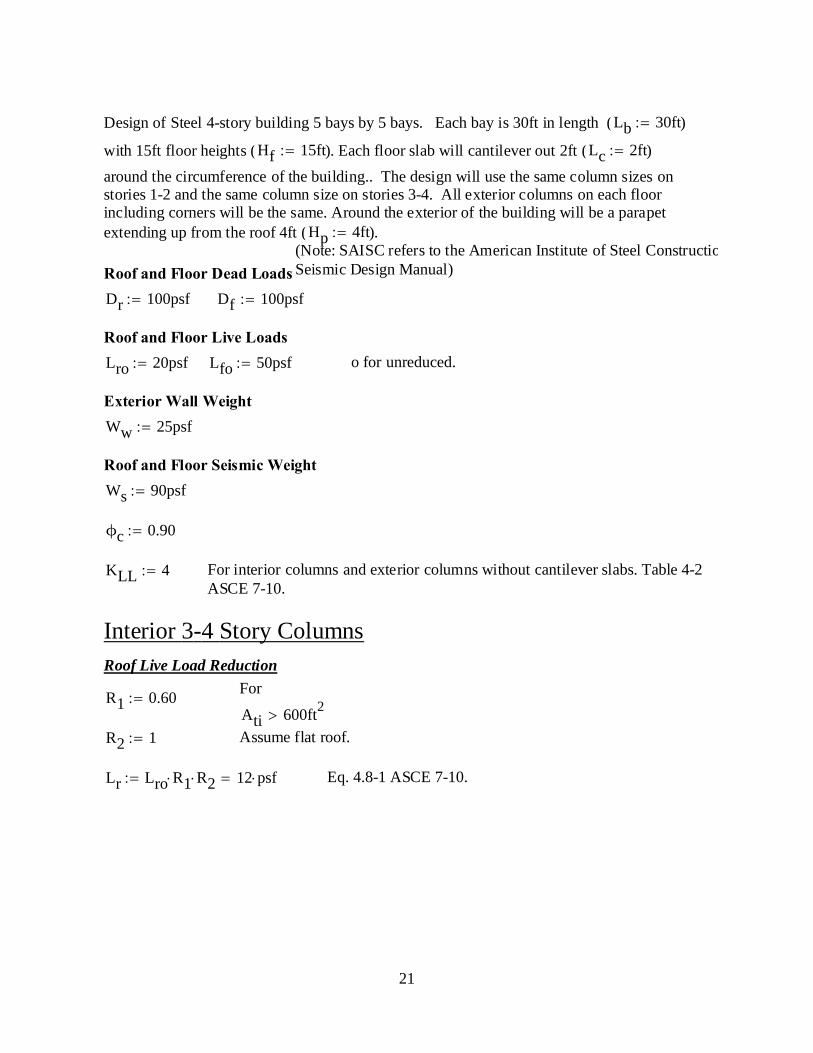
Design of Steel 4-story building 5 bays by 5 bays. Each bay is 30ft in length (Lb 30ft )
with 15ft floor heights (Hf 15ft ). Each floor slab will cantilever out 2ft (Lc 2ft )
around the circumference of the building.. The design will use the same column sizes onstories 1-2 and the same column size on stories 3-4. All exterior columns on each floorincluding corners will be the same. Around the exterior of the building will be a parapetextending up from the roof 4ft (Hp 4ft ).
(Note: SAISC refers to the American Institute of Steel ConstructioSeismic Design Manual)Roof and Floor Dead Loads
Dr 100psf Df 100psf
Roof and Floor Live Loads
Lro 20psf Lfo 50psf o for unreduced.
Exterior Wall Weight
Ww 25psf
Roof and Floor Seismic Weight
Ws 90psf
ϕc 0.90
KLL 4 For interior columns and exterior columns without cantilever slabs. Table 4-2ASCE 7-10.
Interior 3-4 Story ColumnsRoof Live Load Reduction
R1 0.60 For
Ati 600ft2
R2 1 Assume flat roof.
Lr Lro R1 R2 12 psf Eq. 4.8-1 ASCE 7-10.
21

Interior 3-4 Column Live load reduction.
Ati3 Lb Lb 900 ft2 ..................Tributary Area for 3-4 story interior column
Lred max 0.50 Lfo Lfo 0.2515
KLL
Ati3
ft2
25 psf
Eq. 4.7-1 pg. 15 of ASCE 7-10.
Load combination 2 (Sec 2.3.3 ASCE 7-10).
Pui3 1.2 Df Dr Ati3 1.6 Lred Ati3 0.5 Lr Ati3 257.4 kip
Assuming K 1 and using Table 4-1 from AISC Table 4-1 the shapechosen is:W12x40 Where ϕPn 280kip > Pui3 257.4 kip
With weight of interior 3rd story column being Wci3 40lbf
ft
Interior 1-2 Story ColumnsInterior 1-2 Column Live load reduction.
Ati1 3 Lb Lb 2700 ft2 ..................Tributary Area for 1-2 story interior column
Lred max 0.40 Lfo Lfo 0.2515
KLL
Ati1
ft2
20 psf
Eq. 4.7-1 pg. 15 of ASCE 7-10.
Load combination 2 (Sec 2.3.3 ASCE 7-10).
Pui1 1.2 Ati1 Df Dr Ati3 1.6 Lred Ati1 0.5 Lr Ati3 40lbf
ft30 ft 525 kip
Assuming K 1 and using Table 4-1 from AISC Table 4-1 the shapechosen is:W12x58 Where ϕPn 527kip > Pui1 525 kip
With weight of interior 1st story column being Wci1 58lbf
ft
22
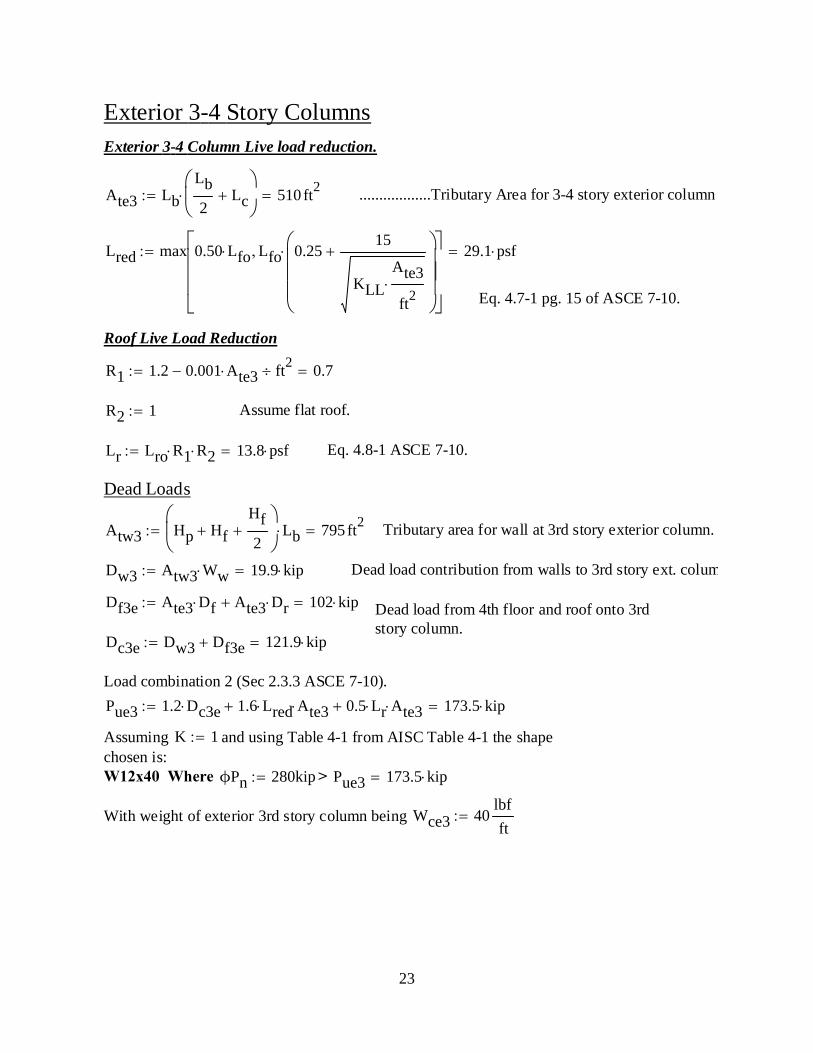
Exterior 3-4 Story ColumnsExterior 3-4 Column Live load reduction.
Ate3 Lb
Lb
2Lc
510 ft2 ..................Tributary Area for 3-4 story exterior column
Lred max 0.50 Lfo Lfo 0.2515
KLL
Ate3
ft2
29.1 psf
Eq. 4.7-1 pg. 15 of ASCE 7-10.
Roof Live Load Reduction
R1 1.2 0.001 Ate3 ft2 0.7
R2 1 Assume flat roof.
Lr Lro R1 R2 13.8 psf Eq. 4.8-1 ASCE 7-10.
Dead Loads
Atw3 Hp HfHf
2
Lb 795 ft2 Tributary area for wall at 3rd story exterior column.
Dw3 Atw3 Ww 19.9 kip Dead load contribution from walls to 3rd story ext. colum
Df3e Ate3 Df Ate3 Dr 102 kip Dead load from 4th floor and roof onto 3rdstory column.
Dc3e Dw3 Df3e 121.9 kip
Load combination 2 (Sec 2.3.3 ASCE 7-10).
Pue3 1.2 Dc3e 1.6 Lred Ate3 0.5 Lr Ate3 173.5 kip
Assuming K 1 and using Table 4-1 from AISC Table 4-1 the shapechosen is:W12x40 Where ϕPn 280kip > Pue3 173.5 kip
With weight of exterior 3rd story column being Wce3 40lbf
ft
23
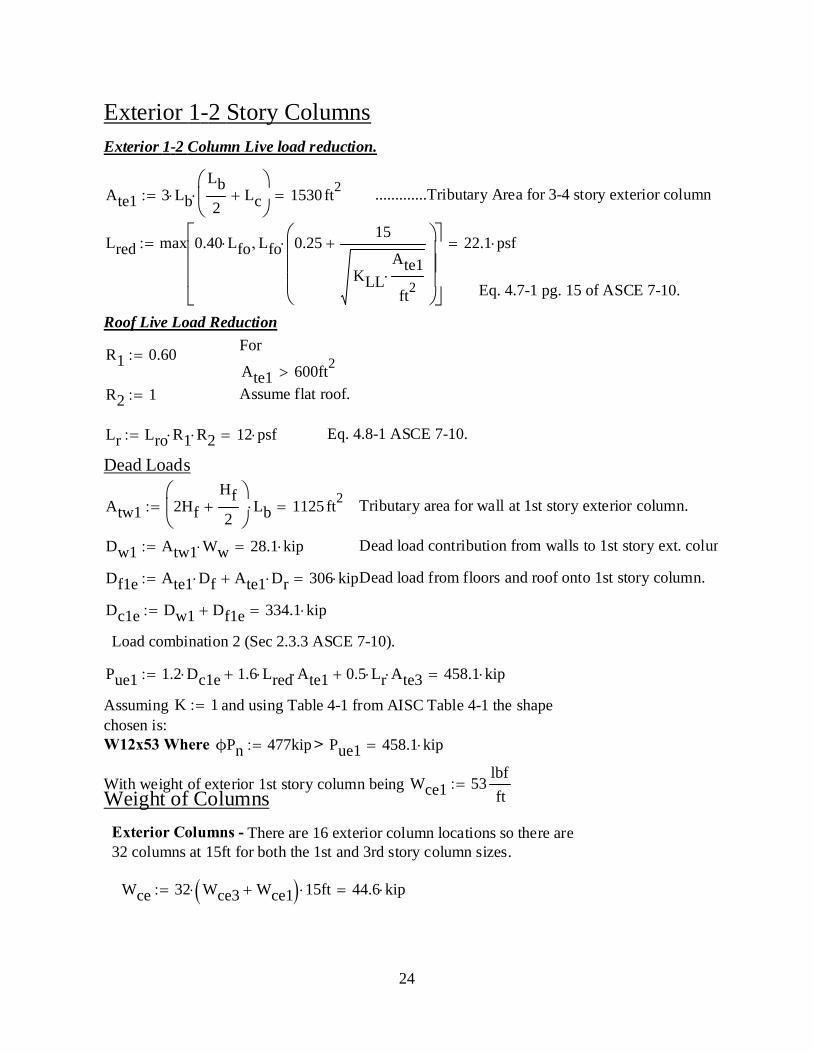
Exterior 1-2 Story ColumnsExterior 1-2 Column Live load reduction.
Ate1 3 LbLb
2Lc
1530 ft2 .............Tributary Area for 3-4 story exterior column
Lred max 0.40 Lfo Lfo 0.2515
KLL
Ate1
ft2
22.1 psf
Eq. 4.7-1 pg. 15 of ASCE 7-10.
Roof Live Load Reduction
R1 0.60 For
Ate1 600ft2
R2 1 Assume flat roof.
Lr Lro R1 R2 12 psf Eq. 4.8-1 ASCE 7-10.
Dead Loads
Atw1 2Hf
Hf
2
Lb 1125 ft2 Tributary area for wall at 1st story exterior column.
Dw1 Atw1 Ww 28.1 kip Dead load contribution from walls to 1st story ext. colum
Df1e Ate1 Df Ate1 Dr 306 kip Dead load from floors and roof onto 1st story column.
Dc1e Dw1 Df1e 334.1 kip
Load combination 2 (Sec 2.3.3 ASCE 7-10).
Pue1 1.2 Dc1e 1.6 Lred Ate1 0.5 Lr Ate3 458.1 kip
Assuming K 1 and using Table 4-1 from AISC Table 4-1 the shapechosen is:W12x53 Where ϕPn 477kip > Pue1 458.1 kip
With weight of exterior 1st story column being Wce1 53lbf
ft
Weight of Columns
Exterior Columns - There are 16 exterior column locations so there are32 columns at 15ft for both the 1st and 3rd story column sizes.
Wce 32 Wce3 Wce1 15 ft 44.6 kip
24

Interior Columns - There are 9 exterior column locations so there are 18columns at 15ft for both the 1st and 3rd story column sizes.
Wci 18 Wci3 Wci1 15 ft 26.5 kip
.WTc Wce Wci 71.1 kip Total weight of all columns.
Girder Design
Determine the point loads.
AT Lb 10 ft 300 ft2
Girder live load reductions.KLL 2 for interior beams
Lred Lfo 0.2515
KLL
AT
ft2
43.1 psf
P 1.2 AT Df 1.6 AT Lred 56.7 kip
With two point loads at P 56.7 kip and using Table 3-23 from theManual:
Mu PLb
3 567 kip ft and
Vu P 56.7 kip
From Table 3-1 Cb 1.14
So I enter table 3-10 with and Lb 10ft and Mu
Cb497.3 kip ft
Assuming lateral torsional buckling will govern I will chooseW21x62
.
25
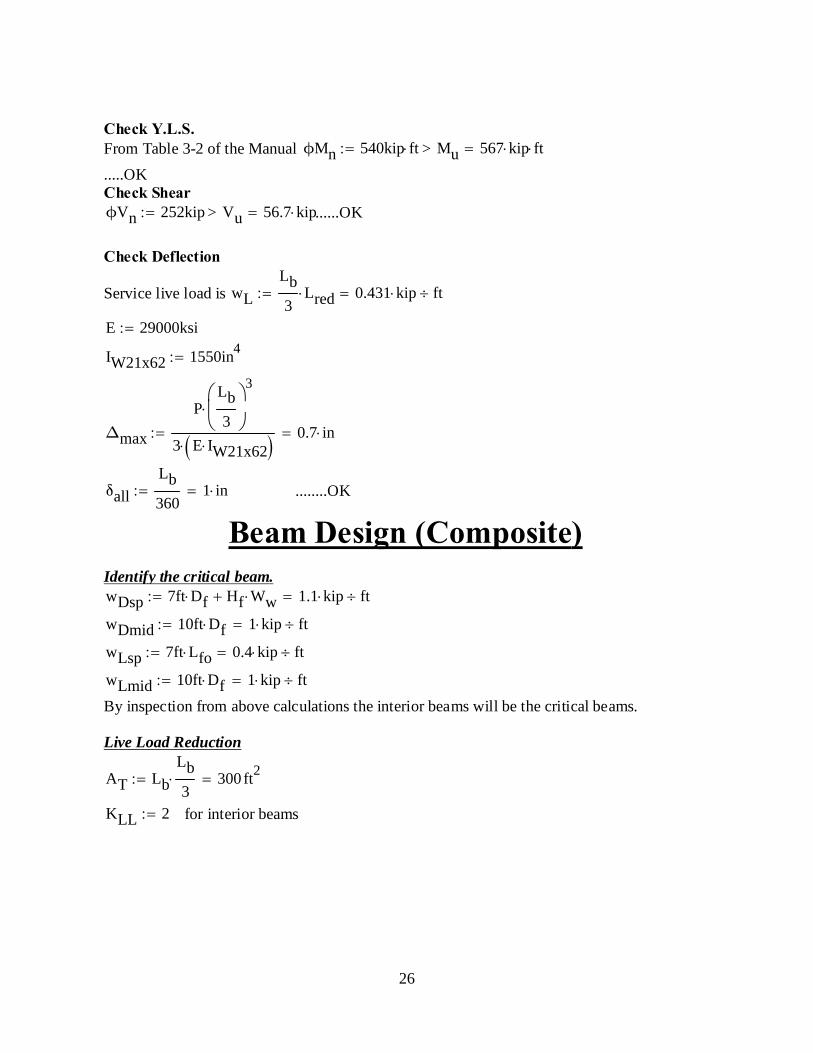
Check Y.L.S.From Table 3-2 of the Manual ϕMn 540kip ft > Mu 567 kip ft
.....OKCheck ShearϕVn 252kip > Vu 56.7 kip ......OK
Check Deflection
Service live load is wL
Lb
3Lred 0.431 kip ft
E 29000ksi
IW21x62 1550in4
Δmax
PLb
3
3
3 E IW21x62 0.7 in
δall
Lb
3601 in ........OK
Use W21x62 for girders.Beam Design (Composite)Identify the critical beam.wDsp 7ft Df Hf Ww 1.1 kip ft
wDmid 10ft Df 1 kip ft
wLsp 7ft Lfo 0.4 kip ft
wLmid 10ft Df 1 kip ft
By inspection from above calculations the interior beams will be the critical beams.
Live Load Reduction
AT Lb
Lb
3 300 ft
2
KLL 2 for interior beams
26

Lred Lfo 0.2515
KLL
AT
ft2
43.1 psf
Demands on Beams
wD Df
Lb
3 1
kip
ft
wL Lred
Lb
3 0.4
kip
ft
wu 1.2 wD 1.6 wL 1.9 kip ft
Mu
wu Lb2
8212.6 kip ft
Vu
wu Lb
228.3 kip
Wet Concrete DemandsAssume depth of concrete: dconc 6.5in
wwc 1.2 80 psf 10 ft 0.96 kip ft
Mwc
wwc Lb2
8108 kip ft
Vwc
wwc Lb
214.4 kip
Guess depth dLb
2415 in
Guess Y2 Y2 dconc1in
2 6 in
From Table 3-19 Composite W Shapes I choose for my trial shape:W14x22 with ΣQ.n = 119 ϕb Mn 216kip ft
27
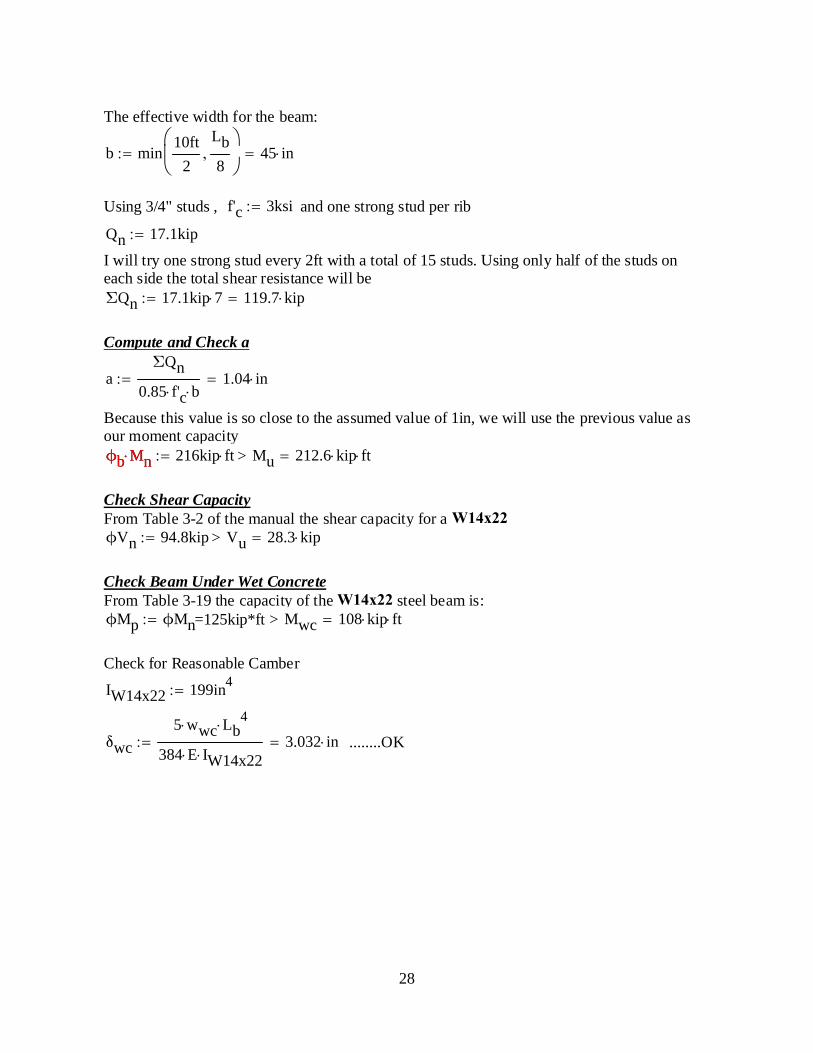
The effective width for the beam:
b min10ft
2
Lb
8
45 in
Using 3/4" studs , f'c 3ksi and one strong stud per rib
Qn 17.1kip
I will try one strong stud every 2ft with a total of 15 studs. Using only half of the studs oneach side the total shear resistance will be ΣQn 17.1kip 7 119.7 kip
Compute and Check a
aΣQn
0.85 f'c b1.04 in
Because this value is so close to the assumed value of 1in, we will use the previous value asour moment capacityϕb Mn 216kip ftϕb Mn > Mu 212.6 kip ft
Check Shear CapacityFrom Table 3-2 of the manual the shear capacity for a W14x22 ϕVn 94.8kip > Vu 28.3 kip
Check Beam Under Wet ConcreteFrom Table 3-19 the capacity of the W14x22 steel beam is:ϕMp ϕMn =125kip*ft > Mwc 108 kip ft
Check for Reasonable Camber
IW14x22 199in4
δwc
5 wwc Lb4
384 E IW14x223.032 in ........OK
28

29
APPENDIX B

30
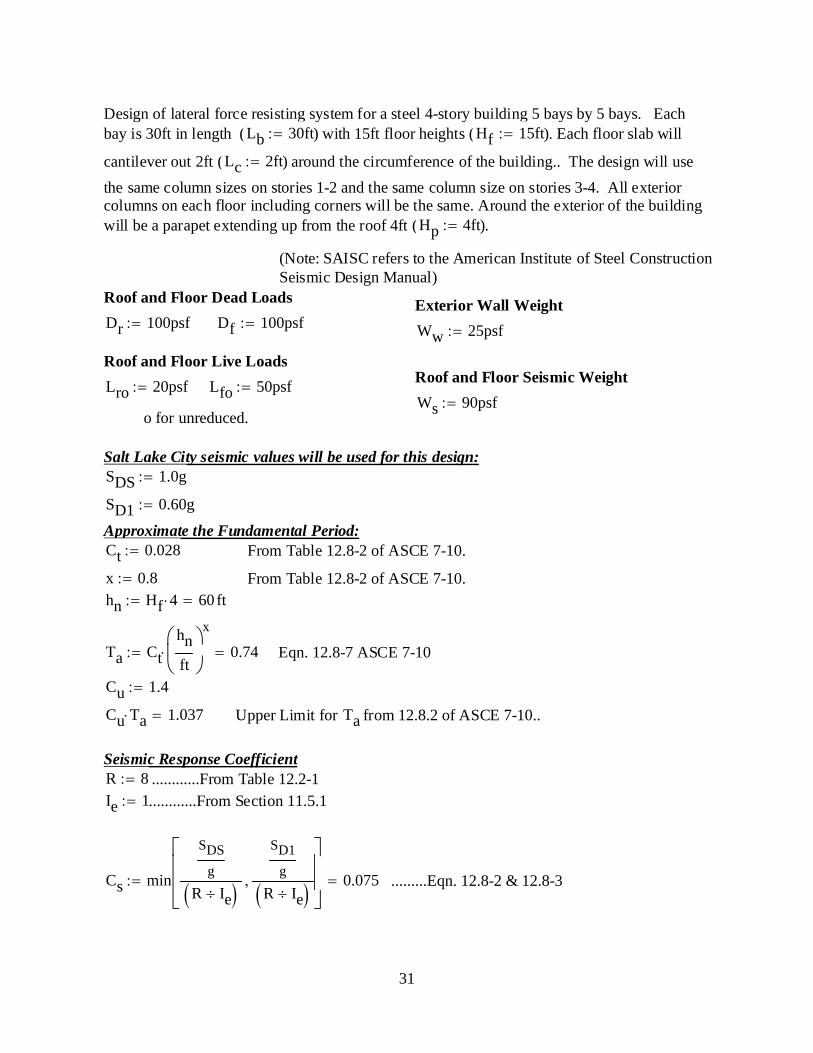
Design of lateral force resisting system for a steel 4-story building 5 bays by 5 bays. Eachbay is 30ft in length (Lb 30ft ) with 15ft floor heights (Hf 15ft ). Each floor slab will
cantilever out 2ft (Lc 2ft ) around the circumference of the building.. The design will use
the same column sizes on stories 1-2 and the same column size on stories 3-4. All exteriorcolumns on each floor including corners will be the same. Around the exterior of the buildingwill be a parapet extending up from the roof 4ft (Hp 4ft ).
(Note: SAISC refers to the American Institute of Steel ConstructionSeismic Design Manual)
Roof and Floor Dead Loads Exterior Wall WeightDr 100psf Df 100psf Ww 25psf
Roof and Floor Live LoadsRoof and Floor Seismic Weight
Lro 20psf Lfo 50psfWs 90psf
o for unreduced.
Salt Lake City seismic values will be used for this design:SDS 1.0g
SD1 0.60g
Approximate the Fundamental Period:Ct 0.028 From Table 12.8-2 of ASCE 7-10.
x 0.8 From Table 12.8-2 of ASCE 7-10.hn Hf 4 60 ft
Ta Ct
hn
ft
x
0.74 Eqn. 12.8-7 ASCE 7-10
Cu 1.4
Cu Ta 1.037 Upper Limit for Ta from 12.8.2 of ASCE 7-10..
Seismic Response CoefficientR 8 ............From Table 12.2-1Ie 1 ............From Section 11.5.1
Cs min
SDS
g
R Ie
SD1
g
R Ie
0.075 .........Eqn. 12.8-2 & 12.8-3
31
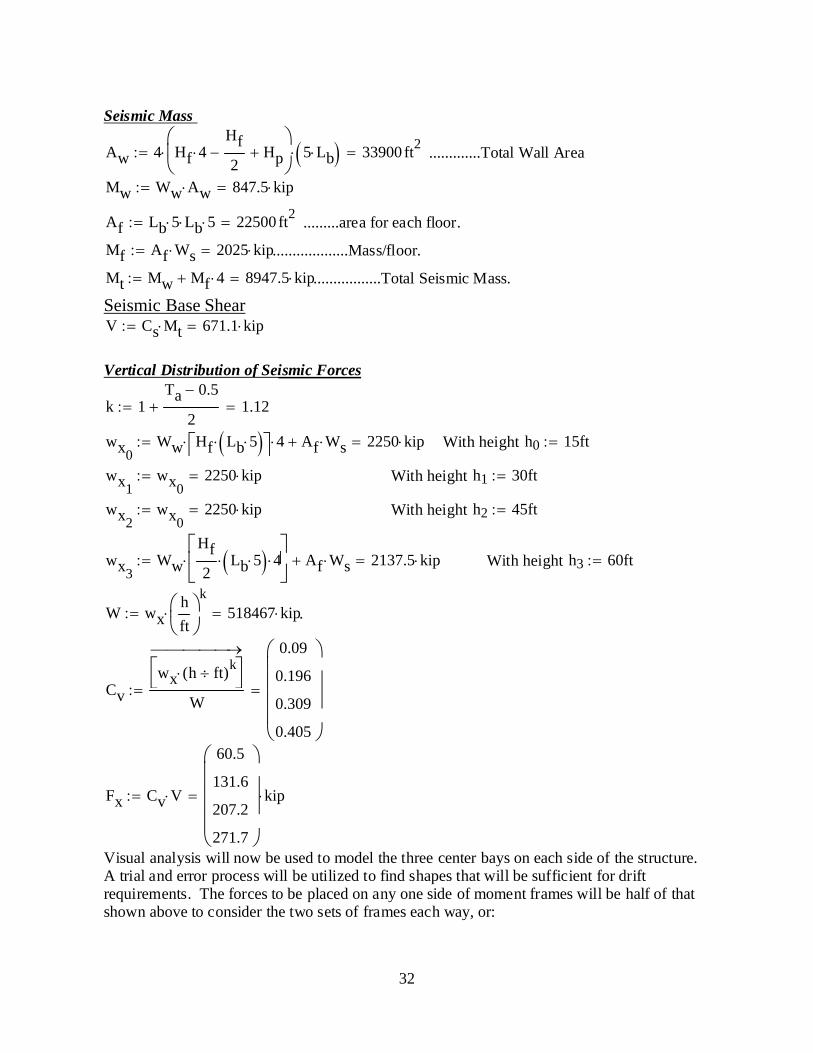
Seismic Mass
Aw 4 Hf 4Hf
2 Hp
5 Lb 33900 ft2 .............Total Wall Area
Mw Ww Aw 847.5 kip
Af Lb 5 Lb 5 22500 ft2 .........area for each floor.
Mf Af Ws 2025 kip ...................Mass/floor.
Mt Mw Mf 4 8947.5 kip .................Total Seismic Mass.
Seismic Base ShearV Cs Mt 671.1 kip
Vertical Distribution of Seismic Forces
k 1Ta 0.5
2 1.12
wx0Ww Hf Lb 5 4 Af Ws 2250 kip With height h0 15ft
wx1wx0
2250 kip With height h1 30ft
wx2wx0
2250 kip With height h2 45ft
wx3Ww
Hf
2Lb 5 4
Af Ws 2137.5 kip With height h3 60ft
W wxh
ft
k
518467 kip .
Cv
wx h ft( )k
W
0.09
0.196
0.309
0.405
Fx Cv V
60.5
131.6
207.2
271.7
kip
Visual analysis will now be used to model the three center bays on each side of the structure.A trial and error process will be utilized to find shapes that will be sufficient for driftrequirements. The forces to be placed on any one side of moment frames will be half of thatshown above to consider the two sets of frames each way, or:
32

Fx
2
30.3
65.8
103.6
135.9
kip .
Drift Limits
Δa h 0.025
4.5
9
13.5
18
in From Table 12.12-1
In order to compare my elastic deflection values directly to the limit, I will divide Δa
by Cd 5.5 from Table 12.2-1
Δa
Cd
0.818
1.636
2.455
3.273
in
The design provided the following elastic drifts under the base shear:
Δelastic
0.772
1.260
1.994
2.746
in
Using the following sections:1-2 Story column W33x2913-4 Story column W33x1181-2 Story beam W30x2353-4 Story beam W18x106
33

RBS DesignFor 1-2 Beams using a W30x235 of A992 SteelL 30ft .............Lengthfy 50ksi
fu 65ksi
bf 15.1in
tbf 11
2
in
db 31.3in
Zx30.235 847in3
Ryb 1.1 (From Table I-6-1 of SAISC)
Using the following values for the RBS shape:a 0.75 bf 11.3 in
b 0.85 db 26.6 in ab
2 2.1 ft Distance to Mpr..
c 0.20 bf 0.3 ft
ZRBS30.235 Zx30.235 22 c tbf db tbf
2
577 in3
Cpr min 1.2fy fu
2 fy
1.15
Mpr30.235 Cpr Ryb ZRBS30.235 fy 3041.3 kip ft
L' L 2 a b( ) db 23.3 ft
Vp
2Mpr30.235
L'261.2 kip
Mf Mpr30.235 Vp ab
2
3577.4 kip ft
Mpe Ryb Zx30.235 fy 3882.1 kip ft
Mpe 3882.1 kip ft > Mf 3577.4 kip ft .................OK
34

Check Panel Zone (SAISC 6.1-32, 6.1-159)For the W33x263ϕv 1.0
tcw 0.87in tcf 1.57in
dc 34.5in bcf 15.8in
Arm 0.95 db 2.5 ft
Pbf
Mf
Arm1443.7 kip
Rv fy dc tcw 13 bcf tcf
2
db dc tcw
1687.4 kip
Rn ϕv Rv 1687.4 kip
Pbf 1443.7 kip < Rn 1687.4 kip ...........OK
Continuity Plate Check (SAISC 6.1-32, 6.1-162, 6.2-8)Ryc 1.1 (From Table I-6-1 of SAISC)
if tcf 0.40 1.8 bf tbffy Ryb
fy Ryc
"OK" "Need Plates"
"Need Plates"
For 3-4 Beams using a W18x106 of A992 SteelL 30ft .............Lengthfy 50ksi
fu 65ksi
bf 11.125in
tf15
16
in
db 18.7in
Zx18.106 230in3
Ry 1.1
35

Using the following values for the RBS shape:a 0.75 bf 8.3 in
b 0.75 db 14 in ab
2 1.3 ft Distance to Mpr.
c 0.15 bf 0.1 ft
ZRBS18.106 Zx18.106 22 c tf db tf
2
174.4 in3
Cpr min 1.2fy fu
2 fy
1.15
Mpr18.106 Cpr Ry ZRBS18.106 fy 919.4 kip ft
L' L 2 a b( ) db 25.9 ft
Vp
2Mpr18.106
L'71 kip
Mf Mpr18.106 Vp ab
2
1010.3 kip ft
Mpe Ry Zx18.106 fy 1054.2 kip ft
Mpe 1054.2 kip ft > Mf 1010.3 kip ft .................OK
Check Panel ZoneFor the W24x176ϕv 1.0
tcw 0.75in tcf 1.34in
dc 25.2in bcf 12.9in
Arm 0.95 db 1.5 ft
Pbf
Mf
Arm682.4 kip
Rv fy dc tcw 13 bcf tcf
2
db dc tcw
1130.8 kip
Rn ϕv Rv 1130.8 kip
Pbf 682.4 kip < Rn 1130.8 kip ...........OK
36
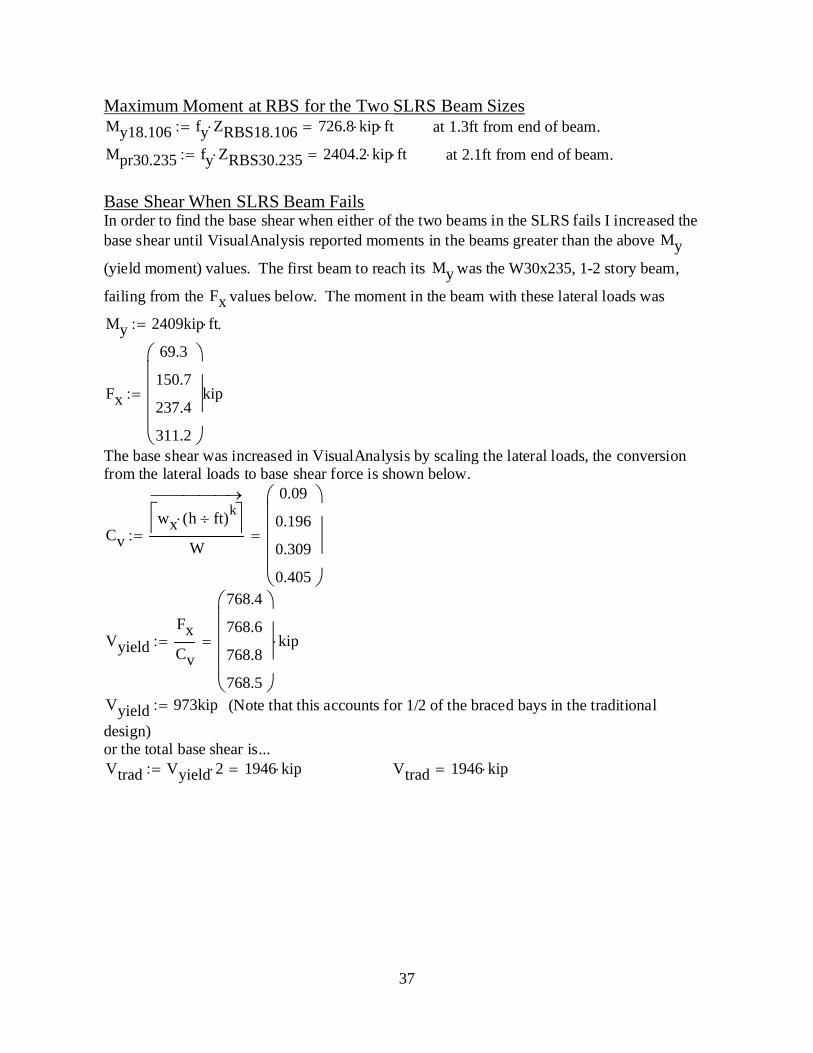
Maximum Moment at RBS for the Two SLRS Beam SizesMy18.106 fy ZRBS18.106 726.8 kip ft at 1.3ft from end of beam.
Mpr30.235 fy ZRBS30.235 2404.2 kip ft at 2.1ft from end of beam.
Base Shear When SLRS Beam FailsIn order to find the base shear when either of the two beams in the SLRS fails I increased thebase shear until VisualAnalysis reported moments in the beams greater than the above My
(yield moment) values. The first beam to reach its My was the W30x235, 1-2 story beam,
failing from the Fx values below. The moment in the beam with these lateral loads was
My 2409kip ft .
Fx
69.3
150.7
237.4
311.2
kip
The base shear was increased in VisualAnalysis by scaling the lateral loads, the conversionfrom the lateral loads to base shear force is shown below.
Cv
wx h ft( )k
W
0.09
0.196
0.309
0.405
Vyield
Fx
Cv
768.4
768.6
768.8
768.5
kip
Vyield 973kip (Note that this accounts for 1/2 of the braced bays in the traditional
design)or the total base shear is...Vtrad Vyield 2 1946 kip Vtrad 1946 kip
37
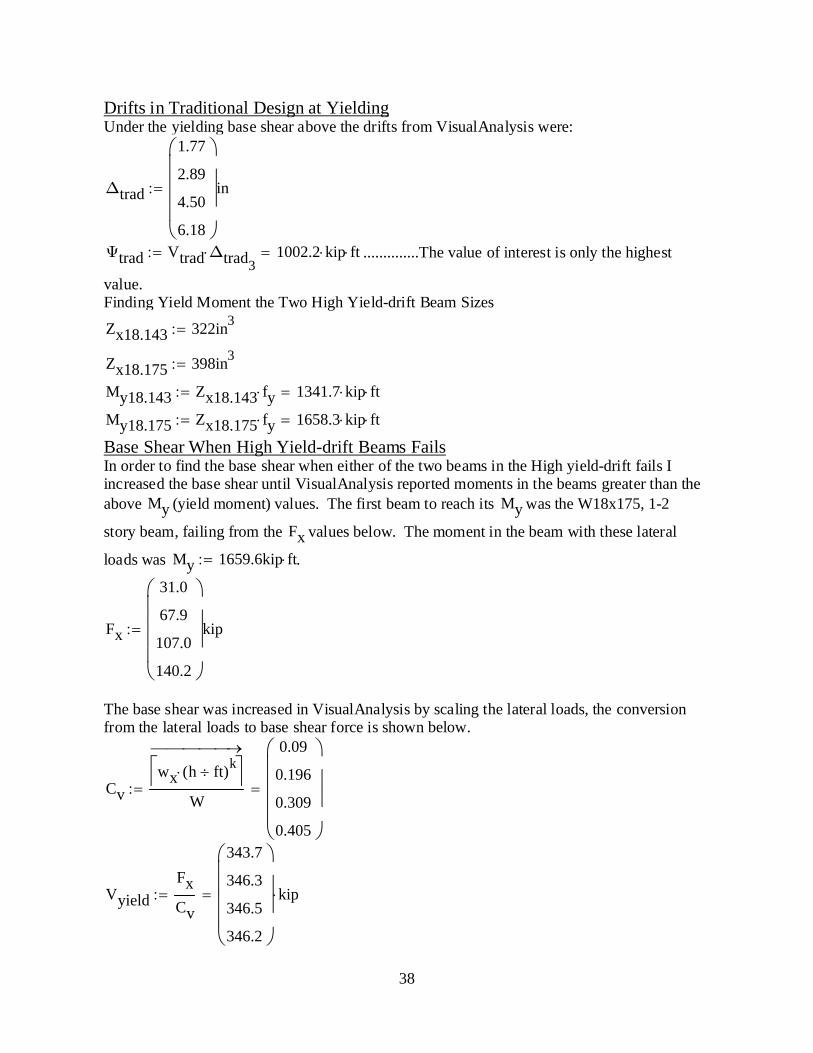
Drifts in Traditional Design at YieldingUnder the yielding base shear above the drifts from VisualAnalysis were:
Δtrad
1.77
2.89
4.50
6.18
in
Ψtrad Vtrad Δtrad3 1002.2 kip ft ..............The value of interest is only the highest
value.Finding Yield Moment the Two High Yield-drift Beam Sizes
Zx18.143 322in3
Zx18.175 398in3
My18.143 Zx18.143 fy 1341.7 kip ft
My18.175 Zx18.175 fy 1658.3 kip ft
Base Shear When High Yield-drift Beams FailsIn order to find the base shear when either of the two beams in the High yield-drift fails Iincreased the base shear until VisualAnalysis reported moments in the beams greater than theabove My (yield moment) values. The first beam to reach its My was the W18x175, 1-2
story beam, failing from the Fx values below. The moment in the beam with these lateral
loads was My 1659.6kip ft .
Fx
31.0
67.9
107.0
140.2
kip
The base shear was increased in VisualAnalysis by scaling the lateral loads, the conversionfrom the lateral loads to base shear force is shown below.
Cv
wx h ft( )k
W
0.09
0.196
0.309
0.405
Vyield
Fx
Cv
343.7
346.3
346.5
346.2
kip
38

Vyield 346kip (Note that for the High yield-drift case building this only represents
1/4 of total braced bays each way.)orVhyd Vyield 4 1384 kip
Vhyd 1384 kip
Drifts in High Yield-drift Design at YieldingUnder the yielding base shear above the drifts from VisualAnalysis were:
Δhyd
4.2
8.2
11.8
14.8
in
Ψhyd Δhyd3Vhyd 1706.9 kip ft ..............The value of interest is only the highest
value.. Averages the HYD/traditionaldisplacement factors calculatedabove.
Δhyd
Δtrad
42.56
39