a chemical ionization high-resolution time-of-flight mass...
TRANSCRIPT

Aerosol Science and Technology, 46:1313–1327, 2012Copyright C© American Association for Aerosol ResearchISSN: 0278-6826 print / 1521-7388 onlineDOI: 10.1080/02786826.2012.712236
A Chemical Ionization High-Resolution Time-of-Flight MassSpectrometer Coupled to a Micro Orifice VolatilizationImpactor (MOVI-HRToF-CIMS) for Analysis of Gas andParticle-Phase Organic Species
Reddy L. N. Yatavelli,1,5 Felipe Lopez-Hilfiker,1 Julia D. Wargo,1
Joel R. Kimmel,2,3,5 Michael J. Cubison,3 Timothy H. Bertram,4 Jose L. Jimenez,5
Marc Gonin,3 Douglas R. Worsnop,2,6 and Joel A. Thornton1
1Department of Atmospheric Sciences, University of Washington, Seattle, Washington, USA2Aerodyne Research Inc., Billerica, Massachusetts, USA3TOFWERK AG, Thun, Switzerland4Department of Chemistry and Biochemistry, University of California, San Diego, California, USA5Cooperative Institute for Research in Environmental Sciences (CIRES) and Department of Chemistryand Biochemistry, University of Colorado, Boulder, Colorado, USA6Department of Physics, University of Helsinki, Helsinki, Finland
We describe a new instrument, chemical ionization (CI) high-resolution time-of-flight mass spectrometer (ToFMS) coupled toa micro-orifice volatilization impactor (MOVI-HRToF-CIMS).The MOVI-HRToF-CIMS instrument is unique in that, withina compact field-deployable package, it provides (1) quantifiablemolecular-level information for both gas and particle-phase or-ganic species on timescales ranging from ≤1 s for gases to 10–60 minfor particle-phase compounds that can be used to efficiently probeoxidation and secondary organic aerosol (SOA) formation mecha-nisms, and (2) relative volatility information of the detected com-pounds simultaneously estimated using the programmed thermaldesorption information obtained from the MOVI. We demonstratethe capabilities of a prototype instrument using known test com-pounds and complex mixtures generated from the oxidation ofbiogenic and anthropogenic hydrocarbons. We present spectra
Received 7 April 2012; accepted 25 June 2012.The MOVI-HRToF-CIMS development was funded by National
Science Foundation CAREER award (NSF ATM-0846183) to JAT,Department of Energy SBIR grant to Aerodyne Research Inc. (DE-SC0004577), NSF ATM-0919189, and a CU Innovative Research Pro-gram Seed Grant to JLJ and a NASA Earth and Space Science Grad-uate Fellowship (07-Earth07F-0069) to RLNY. We acknowledge JillCraven, Christine Loza, and Lindsay Yee of the Caltech chamber groupfor carrying out the cyclododecane experiments shown here and Prof.John Seinfeld, Prof. Paul Ziemann, Dr. Manjula Canagaratna, and Prof.Nga Lee (Sally) Ng for guidance and discussions during the Caltechchamber experiments.
Address correspondence to Joel A. Thornton, Department of At-mospheric Sciences, University of Washington, Box 351640, Seattle,WA 98195, USA. E-mail: [email protected]
obtained using both negative and positive ion CI with acetate(CH3C(O)O−) and protonated water clusters (H3O+· (H2O)n), re-spectively, as reagent ions. The instrument has high mass resolvingpower (R = 5000 above m/Q 250 Th) and mass accuracy (±20 ppm)enabling estimation of compound elemental composition. Instru-ment sensitivity in negative ion mode was tested using formic acid asa representative gas-phase compound, and that for particle-phasecompounds was tested using palmitic, azelaic, and tricarballylicacids. With a heated MOVI inlet, an ion count rate of ∼15 Hzis achieved when sampling 1 pptv (= 1 pmol/mol) of formic acid(or other monocarboxylic acids) under typical operating condi-tions. This sensitivity translates to detection limits less than 1 ng/m3
for carboxylic acids in the particle-phase. We also discuss the re-maining challenges with this instrument to broadly characterizinggaseous and particulate oxygenated organic compounds in situ.
[Supplementary materials are available for this article. Go tothe publisher’s online edition of Aerosol Science and Technologyto view the free supplementary files.]
1. INTRODUCTIONOrganic species (organic aerosols [OA] and organic gases
[OG]) are ubiquitous in Earth’s atmosphere. Through contribu-tions to aerosol particle formation and growth, organic speciesaffect human health, visibility, cloud formation and climate (No-vakov and Penner 1993; Quinn et al. 2005; Mochida et al. 2008;Pope et al. 2009; Sorooshian et al. 2009). Understanding OAformation and loss, and the partitioning of organic species be-tween gas and particle-phases is key to understanding and mit-igating its impacts. Current estimates of primary OA (POA,
1313
Dow
nloa
ded
by [
Uni
vers
ity o
f C
olor
ado
at B
ould
er L
ibra
ries
] at
07:
08 0
2 A
ugus
t 201
2

1314 R. L. N. YATAVELLI ET AL.
emitted directly into the atmosphere in the particle-phase) andsecondary OA (SOA, produced from chemical reactions in theatmosphere) budgets are highly uncertain (Goldstein and Gal-bally 2007; Hallquist et al. 2009; Heald et al. 2010). Recentstudies have improved our understanding of OA and OG (Don-ahue et al. 2006; Robinson et al. 2007; Goldstein et al. 2009;Jimenez et al. 2009; Paulot et al. 2009; Ng et al. 2011), butcritical parameters remain to be adequately quantified for mod-els to accurately simulate regional and global OA distributions(Hallquist et al. 2009). Significant uncertainties related to parti-cle sources, formation and growth mechanisms, loss rates, anddirect and indirect effects (changes in light scattering and ab-sorption, and cloud albedo) persist, in part, due to a lack of anunderstanding of the species which make up OG and OA.
Detailed discussions of various offline and online techniquesfor OA analysis have been published recently (Sullivan andPrather 2005; Nash et al. 2006; Chow et al. 2008; Farmer andJimenez 2010), therefore, only the most relevant research is sum-marized below. The application of time-of-flight mass spectrom-eters (ToFMS) for real-time study of OA and atmospheric OGcomposition has been demonstrated previously (Prather et al.1994; Murphy and Thomson 1995; Blake et al. 2004; Drewnicket al. 2005; Zelenyuk and Imre 2005; DeCarlo et al. 2006;Bertram et al. 2011), but its coupling with chemical ionization(CI) is only recently becoming more widespread.
The main advantages of ToFMS are (1) the ability to ac-quire an entire mass spectrum, for example, from 15–1500 Th(Th = thomson = u/e), at rates exceeding 1000 Hz (Kimmelet al. 2010), leading to a superior duty cycle for broad massrange, without any a priori assumptions on which m/Q to mon-itor, (2) high mass resolving power, R, with field deployableinstruments routinely reaching R > 3000 Th Th−1, and (3) highrelative mass accuracy in the range of 20 µTh Th−1. WhileToFMS instruments for gas-phase composition analysis of at-mospheric samples now exist (Jordan et al. 2009; Bertram et al.2011), the more common application of ToFMS instrumentsto atmospheric composition studies has been analysis of par-ticles. Two main subgroups are single particle laser-ablationinstruments (Prather et al. 1994; Murphy and Thomson 1995;Zelenyuk and Imre 2005) and ensemble particle analysis instru-ments (Drewnick et al. 2005; DeCarlo et al. 2006; Holzingeret al. 2010). Early designs of single particle instruments causedextensive fragmentation of organic compounds due to laser des-orption and ionization, but recent improvements reduce frag-mentation by using single photon ionization and variable energydesorption lasers (Oktem et al. 2004; Vaden et al. 2010). TheAerodyne time-of-flight aerosol mass spectrometer (ToF-AMS)is the most widely used ensemble particle analysis instrumentproviding nonrefractory particle composition (DeCarlo et al.2006). This instrument uses electron impact ionization, whichinduces extensive fragmentation of organic molecules. As a con-sequence, identification and quantification of specific molecularspecies with the Aerodyne AMS is not possible. However, bydetermining the elemental composition of all fragments the av-
erage oxidation state of carbon in the aerosol particles can beinferred (Aiken et al. 2008), and groups of species representingdifferent sources of OA can be identified through factor analysisof the ensemble spectra (Zhang et al. 2011). Recently, proton-transfer-reaction (PTR) ionization, a softer ionization schemethan EI, was coupled to a high-resolution ToFMS for OA anal-ysis (Holzinger et al. 2010). This work reported detection ofun-oxidized and oxidized organic compounds, inorganic com-pounds, and organonitrate and organosulfate compounds at ahigh altitude site.
The MOVI-HRToF-CIMS instrument is unique in that it pro-vides, within a compact field-deployable package, quantifiablemolecular-level information for both gas and particle-phase oxy-genated organic species on a semicontinuous timescale acrossa large range of volatilities. When combined with the fast ac-quisition, high mass resolving power and mass accuracy of ahigh-resolution ToFMS, and the soft and selective ionizationscheme, this technique can be used to efficiently probe oxidationand SOA formation mechanisms by estimating the elementalcomposition of the detected compounds. In addition, using theprogrammed thermal desorption information from the MOVI,relative volatility information of the detected compounds canbe simultaneously estimated. The CI source design used here issimilar to that described previously by Bertram et al. (2011, andreference therein), and the HRToFMS is largely similar to the at-mospheric pressure interface (API-ToF) described by Junninenet al. (2010). Therefore, we focus our description and character-ization on the unique aspects of the MOVI and CI combination.
2. INSTRUMENT DESCRIPTIONThe instrument contains four main components. First, a
MOVI enables analysis of gas-phase compounds while aerosolparticles are simultaneously collected with a cut-point diameter(d50, transition-regime aerodynamic diameter (DeCarlo et al.2004) of 130 nm. A cartridge heater of the MOVI operates atregular intervals to thermally desorb the collected aerosol mass.The analyte molecules from the MOVI enter an ion-molecule re-actor (IMR) where the gas-phase compounds (OG or thermallydesorbed OA) undergo CI. A collisional dissociation chamber(CDC) after the IMR is used to optionally break apart ion-molecule clusters with tunable declustering strengths. Finally,the resulting parent ions are focused and guided through differ-entially pumped regions into a high-resolution ToFMS (HTOF,TOFWERK AG, Switzerland) where they are mass analyzedand detected.
The MOVI-CIMS technique using a quadrupole mass spec-trometer has been described by Yatavelli and Thornton (2010),therefore, only modifications since that publication are reportedhere. The specific high-resolution ToFMS employed here is thesame used in the Aerodyne ToF-AMS (DeCarlo et al. 2006)and the Ionicon proton-transfer-reaction ToFMS (PTR-TOF-MS (Jordan et al. 2009). The atmospheric pressure interface
Dow
nloa
ded
by [
Uni
vers
ity o
f C
olor
ado
at B
ould
er L
ibra
ries
] at
07:
08 0
2 A
ugus
t 201
2

MOVI-HRTOF-CIMS FOR ANALYSIS OF ORGANIC SPECIES 1315
(API) was first described for the detection of atmospheric ionswith the high-resolution ToFMS (Junninen et al. 2010) and morerecently, Bertram et al. (2011) used the same API for couplingof a CI IMR to a compact ToFMS (CTOF, TOFWERK) foranalysis of gas-phase organic acids. For simplicity, we refer tothe instrument described in Bertram et al. (2011) as a CToF-CIMS. The instrument reported in this article represents, to ourknowledge, the first application of high-resolution ToFMS toneutral organic compounds in both gas and particle-phases thatare selectively ionized by positive and negative CI schemes.
2.1. Micro Orifice Volatilization ImpactorFigure 1 shows a schematic of the MOVI design used in the
work described here, slightly revised from the design describedpreviously (Yatavelli and Thornton 2010). The impactor charac-teristics remain largely the same with 100 nozzles, each 150 µmin diameter, and the jet-to-plate distance at 0.6 mm. The designchanges described here were aimed at decreasing the condensa-tion of semivolatile and low-volatility compounds in the MOVIprior to CI. Toward this goal, the total surface area of the man-ifold block was reduced by nearly 50% by eliminating unnec-essary dead space. The MOVI manifold now couples directlyto the IMR region, so that desorbed molecules have a shorterresidence time and a reduced number of wall collisions beforeionization. Up to four cartridge heaters programmatically heatthe manifold block during the heating cycle to enhance transferof low-volatility compounds evolving from the collection post.
FIG. 1. Schematic of the improved micro-orifice volatilization impactor. Num-bers 1–4 correspond to different pressure regions with region 3 at 863 mbar andregion 4 at 90 mbar.
The manifold block is also coated with an inert material (In-ertium, AMCX Corp., State College, PA, USA for Aluminiumor SilicoNert 2000, Restek Corp., Bellefonte, PA, USA for stain-less steel manifold blocks) to further decrease the adsorption ofcondensable species inside the MOVI. Similarly, the stainlesssteel impaction surface also has inert coating (SilicoNert 2000)to minimize adsorption of semivolatile organic compounds. Fi-nally, the critical orifice between the IMR and MOVI is pushedfurther into the IMR compared to the previous design wherethe orifice was closer to the impaction surface. This change hasproven critical in increasing the sensitivity of the instrument pre-sumably due to better mixing between the reagent ion and sam-ple flows (induced by the relatively high flow velocity at the ori-fice exit). Apart from these design changes, the manifold blockis held at 50◦C during aerosol sampling and gas phase analysisto reduce the absorption of gases to the walls during sampling.The impaction surface is kept near ambient temperature by theflow of ambient air through the micro-orifices. Pressure in theMOVI during sampling is slightly below atmospheric pressure,for example, 863 mbar if atmospheric pressure is 1013 mbar.
The particle collection efficiency (CE) of the MOVI can beexpressed as the product of several terms:
CE = Ei × Em × Eb [1]
where Ei is the transmission efficiency of the particle inlet aheadof the MOVI collector (assumed to be typically ∼1), Em is theCE of the MOVI impactor for liquid particles, and Eb is the frac-tion of particles that stick (do not bounce) from the impactorsurface for solid particles (for liquid particles Eb ∼ 1). As dis-cussed in Yatavelli and Thornton (2010), we determined an Eb
of ∼0.65 for amorphous solid particles which we apply as ap-propriate in the analysis of data described herein. The Eb valueof 0.65 used in our analysis of α-pinene ozonolysis SOA is spe-cific to the MOVI and depends on the aerosol particle velocity(which depends on the geometry of the nozzles and the flowrate), roughness of the collection surface, and particle-phasestate (which depends on the composition of the aerosol particlesand relative humidity). The phase-state of SOA is relatively un-certain at present but in a recent study, the bounce behavior ofbiogenic SOA in inertial impactors corroborates our assumptionthat the α-pinene ozonolysis SOA are amorphous solids (Virta-nen et al. 2010). In fact, Virtanen et al. (2010) measured particlebounce of ∼30% on greased aluminum collection surface forSOA produced from ozonolysis of terpenoids at low RH, sim-ilar to the conditions in our α-pinene ozonolysis experiment.Other recent studies (Koop et al. 2011; Vaden et al. 2011; Per-raud et al. 2012) have also supported the hypothesis that SOAproduced from α-pinene oxidation may be amorphous solids orsemisolids, further supporting our Eb value used here.
2.2. Chemical IonizationThe instrument allows analysis with various negative or pos-
itive reagent ions. Here, we present data with the acetate anion
Dow
nloa
ded
by [
Uni
vers
ity o
f C
olor
ado
at B
ould
er L
ibra
ries
] at
07:
08 0
2 A
ugus
t 201
2
1316 R. L. N. YATAVELLI ET AL.
(CH3C(O)O−), which selectively ionizes acids (Veres et al.2008; Roberts et al. 2010, 2011; Bertram et al. 2011), and pro-tonated water clusters H3O+· (H2O)n. Bertram et al. (2011) de-scribed the CH3C(O)O− ion chemistry in detail using the sameIMR and CDC designs used here and at similar though not iden-tical pressures; therefore, no discussion of that ion chemistry ispresented here.
CI-MS analysis using H3O+ is commonly referred to as PTR-MS, and it has been extensively used to detect volatile organiccompounds (VOCs) in the atmosphere (Lindinger et al. 1998;de Gouw and Warneke 2007). Our implementation does not useH3O+ ions but rather H3O+· (H2O)n cluster ions, due to the rel-atively high pressures (90 mbar) and low electric field strengthsin the ionization region. Hearn and Smith (2004) also observedH3O+· (H2O)n ions in their ionization region maintained at 20mbar. As a result of the higher proton affinity of H3O+· (H2O)n
compared to base H3O+, ionization is more selective and doesnot ionize species with dipole moment = 0 (Spanel and Smith1995).
In this study, protonated water cluster ions were generatedby flowing 2000 sccm of humidified N2 through the 210Po ra-dioactive ion source. The ion source and the IMR are maintainedat 50 V relative to ground. Humidified N2 flow was generatedby bubbling 2300 sccm N2 through 18 M� water maintainedat room temperature (no temperature control). A critical orificecontrolled the flow through the 210Po ion source with the excessflow being vented to air. Pressures in various regions of the in-strument were the same as that for acetate experiments. For theexperimental conditions mentioned above, the most abundantion observed was H3O+· H2O with the next dominant peak be-ing H3O+· (H2O)2. Similar reagent ion distributions have beenobserved by other researchers, although they used lower ioniza-tion region pressures (33 and 53 mbar) (de Gouw et al. 2003).The use of a CDC in our instrument alters the detected clustersfrom the actual distribution present in the IMR and likely con-tributes to some enhanced proton transfer during the residencetime within the CDC though we have not examined this issuein detail. Therefore, the actual cluster distribution in the IMRis likely shifted toward higher cluster sizes (H3O+· (H2O)n, n= 3, 4, 5) than as it appears in our mass spectra. During theexperiments described here, the H3O+, H3O+· H2O, and H3O+·(H2O)2 count rates observed were typically, 5 × 10⁴, 1.5 × 10⁶,and 5 × 10⁴ Hz, respectively. It is important to note that thework described here was not aimed at developing an optimizedproton transfer method but more to illustrate the capabilities ofa MOVI-HRToF-CIMS instrument.
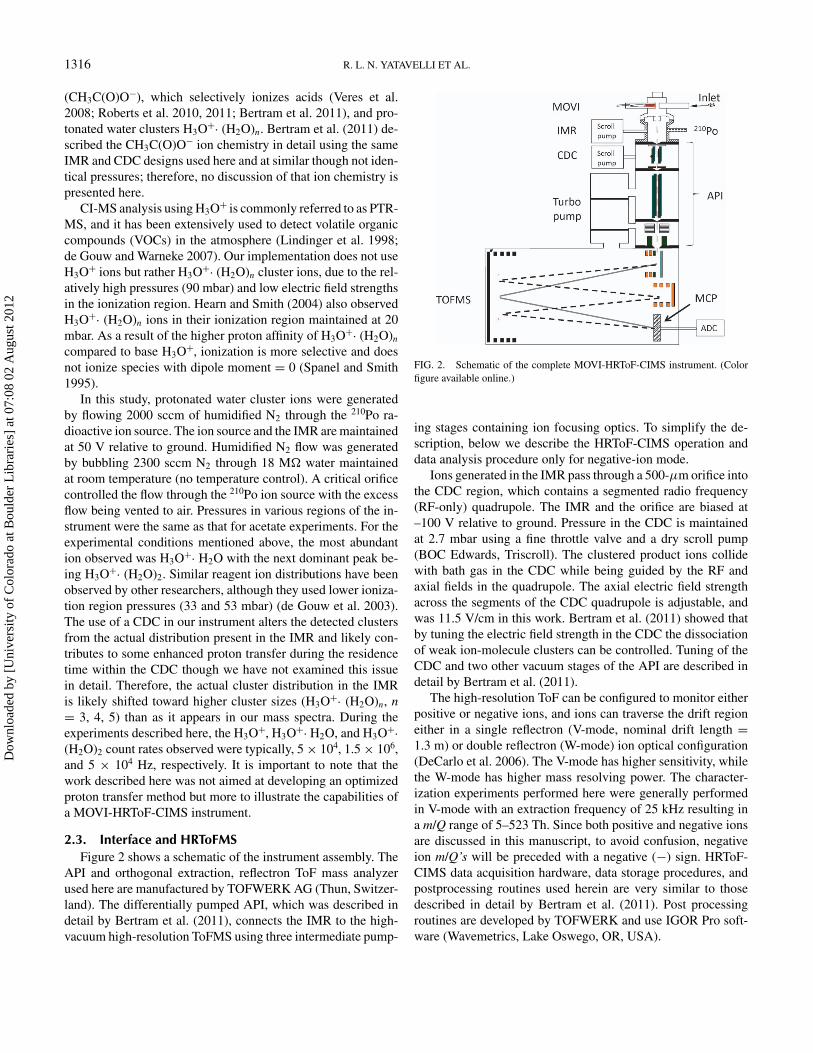
2.3. Interface and HRToFMSFigure 2 shows a schematic of the instrument assembly. The
API and orthogonal extraction, reflectron ToF mass analyzerused here are manufactured by TOFWERK AG (Thun, Switzer-land). The differentially pumped API, which was described indetail by Bertram et al. (2011), connects the IMR to the high-vacuum high-resolution ToFMS using three intermediate pump-
FIG. 2. Schematic of the complete MOVI-HRToF-CIMS instrument. (Colorfigure available online.)
ing stages containing ion focusing optics. To simplify the de-scription, below we describe the HRToF-CIMS operation anddata analysis procedure only for negative-ion mode.
Ions generated in the IMR pass through a 500-µm orifice intothe CDC region, which contains a segmented radio frequency(RF-only) quadrupole. The IMR and the orifice are biased at–100 V relative to ground. Pressure in the CDC is maintainedat 2.7 mbar using a fine throttle valve and a dry scroll pump(BOC Edwards, Triscroll). The clustered product ions collidewith bath gas in the CDC while being guided by the RF andaxial fields in the quadrupole. The axial electric field strengthacross the segments of the CDC quadrupole is adjustable, andwas 11.5 V/cm in this work. Bertram et al. (2011) showed thatby tuning the electric field strength in the CDC the dissociationof weak ion-molecule clusters can be controlled. Tuning of theCDC and two other vacuum stages of the API are described indetail by Bertram et al. (2011).
The high-resolution ToF can be configured to monitor eitherpositive or negative ions, and ions can traverse the drift regioneither in a single reflectron (V-mode, nominal drift length =1.3 m) or double reflectron (W-mode) ion optical configuration(DeCarlo et al. 2006). The V-mode has higher sensitivity, whilethe W-mode has higher mass resolving power. The character-ization experiments performed here were generally performedin V-mode with an extraction frequency of 25 kHz resulting ina m/Q range of 5–523 Th. Since both positive and negative ionsare discussed in this manuscript, to avoid confusion, negativeion m/Q’s will be preceded with a negative (−) sign. HRToF-CIMS data acquisition hardware, data storage procedures, andpostprocessing routines used herein are very similar to thosedescribed in detail by Bertram et al. (2011). Post processingroutines are developed by TOFWERK and use IGOR Pro soft-ware (Wavemetrics, Lake Oswego, OR, USA).
Dow
nloa
ded
by [
Uni
vers
ity o
f C
olor
ado
at B
ould
er L
ibra
ries
] at
07:
08 0
2 A
ugus
t 201
2

MOVI-HRTOF-CIMS FOR ANALYSIS OF ORGANIC SPECIES 1317
3. METHOD EVALUATION
3.1. Mass Accuracy and Mass Resolving PowerThe relatively high mass accuracy and mass resolving power
in a field deployable package are important distinguishing char-acteristics of the HRToF-CIMS. Here, mass accuracy of theinstrument is determined by comparing the measured m/Q ofspecific ions (not used in the calibration) of known elementalcomposition in a calibrated mass spectrum to the true m/Q of theions. The m/Q of a recorded ion spectral peak was measured us-ing a custom peak fitting algorithm in IGOR Pro. The peak centerof the fitted ion peak was taken as the m/Q of the detected ion andcompared to the exact m/Q calculated from the elemental com-position. Figure 3a shows the V-mode mass accuracy for a vari-ety of ions with most of the data within ±20 µTh Th−1 (ppm).
The mass resolving power (R) for an isolated peak in a massspectrum was calculated as the ratio of the m/Q of the peak toits full-width at half-maximum �(m/Q)FWHM.
R = m/Q
�m/QFWHM[2]
Figure 3b shows R of the MOVI-HRToF-CIMS as a functionof m/Q when using the CH3C(O)O− reagent ion. Above 250Th, R plateaus at a maximum value of ∼5000 Th Th−1 in V-
mode and ∼7300 Th Th−1 in W-mode. The W-mode resolvingpower in the MOVI-HRToF-CIMS is higher than for V-mode,as expected. Results described in the rest of the article wereobtained mainly in V-mode to ensure high signal-to-noise ratio(see above). The R achieved here is higher than that typical ofthe HR-ToF-AMS, likely due to more uniform ion energetics,and is also in the range reported for the PTR-ToF instrument(Graus et al. 2010). See Figure S1 in the online supplementalinformation for a comparison of the MOVI-HRToF-CIMS massresolving power to other instruments.
Having a R > 2000 provides the ability to differentiate ionswith the same number of nucleons (i.e., integer m/Q) that are sep-arated by a small fraction of a Th in the m/Q scale. An exampleof this high-resolution ability of the HRToF-CIMS instrumentis shown in Figure 3c. This spectrum was obtained during anal-ysis of gas-phase oxidation products from dark ozonolysis ofα-pinene in a flow through chamber (discussed further in themethod application section). The data clearly shows three dis-tinct ions at −113 Th corresponding to C2F3O−
2 , C5H5O−3 , and
C6H9O−2 which all have the same nucleon number, but slightly
different mass defects. The fluorinated ion is a persistent internalcontaminant due to perfluoro polymers used in seals and tubingupstream of the ion source. Such resolving power is importantfor rigorous testing and development of chemical mechanismsor emissions inventories.
3000
2000
1000
0
Bin
Inte
nsity
(Hz
ns-1
)
113.2113.1113.0112.9112.8-m/Q (Th)
-20
-10
0
10
20
Mas
s A
ccur
acy
( µT
h T
h-1)
400300200100-m/Q (Th)
8000
6000
4000
2000
Mass R
esolving Pow
er R (T
h Th
-1)30025020015010050-m/Q (Th)
5000
4000
3000
2000
1000
0
Integrated Peak A
rea (arb units)
C2F3O2-
112.9838 Th, 6 µTh Th-1
C5H5O3-
113.0222 Th, -15 µTh Th-1
C6H9O2-
113.0587 Th, -14 µTh Th-1
Measured data Total Fit Gaussian fit Integrated peak area
(c)
(a) V-mode
V-mode W-mode
(b)
FIG. 3. (a) Relative mass accuracy as a function of m/Q, (b) mass resolving power as a function of m/Q for V and W modes, and (c) expanded view of −113 Thfrom the α-pinene oxidation experiment. Three ions are marked with their respective mass accuracies in µTh Th−1 (= ppm). (Color figure available online.)
Dow
nloa
ded
by [
Uni
vers
ity o
f C
olor
ado
at B
ould
er L
ibra
ries
] at
07:
08 0
2 A
ugus
t 201
2
1318 R. L. N. YATAVELLI ET AL.
3.2. Sensitivity3.2.1. Sensitivity to Gas-Phase Carboxylic Acids UsingCH3C(O)O−
To assess the sensitivity of the instrument to gas-phase com-pounds, calibrations were performed using formic acid withacetate as the reagent ion. Based on previous work, we expectthe sensitivity to be a nearly linear function of extraction fre-quency, a nonlinear function of IMR and CDC pressure (in partdue to the RF ion guides), and to depend upon electric fieldtuning for resolution and declustering as well as the presence ofsurfaces between the formic acid source and IMR. Therefore,we separate the sensitivity of the instrument that obtained usinga high transmission inlet, from that obtained with the MOVIinlet.
Dilute concentrations of formic acid were produced by flow-ing 10 sccm of N2 over a calibrated permeation tube (Kin-Tek, SRT2, 21.6 ng/min) maintained at 70◦C and contained inan insulated aluminum block. The output of the permeationtube was confirmed to be accurate and stable to within 5%via ion chromatography. Formic acid concentrations were var-ied by increasing or decreasing the carrier flow used to dilutethe formic acid and overflow the instrument inlet which forthese determinations of optimum sensitivity, consisted of a sin-gle fitting bored through with a PFA Teflon tube deliveringgas to the critical orifice separating ambient pressure and theIMR.
Based on HR analysis, it was confirmed that only the HCOO−
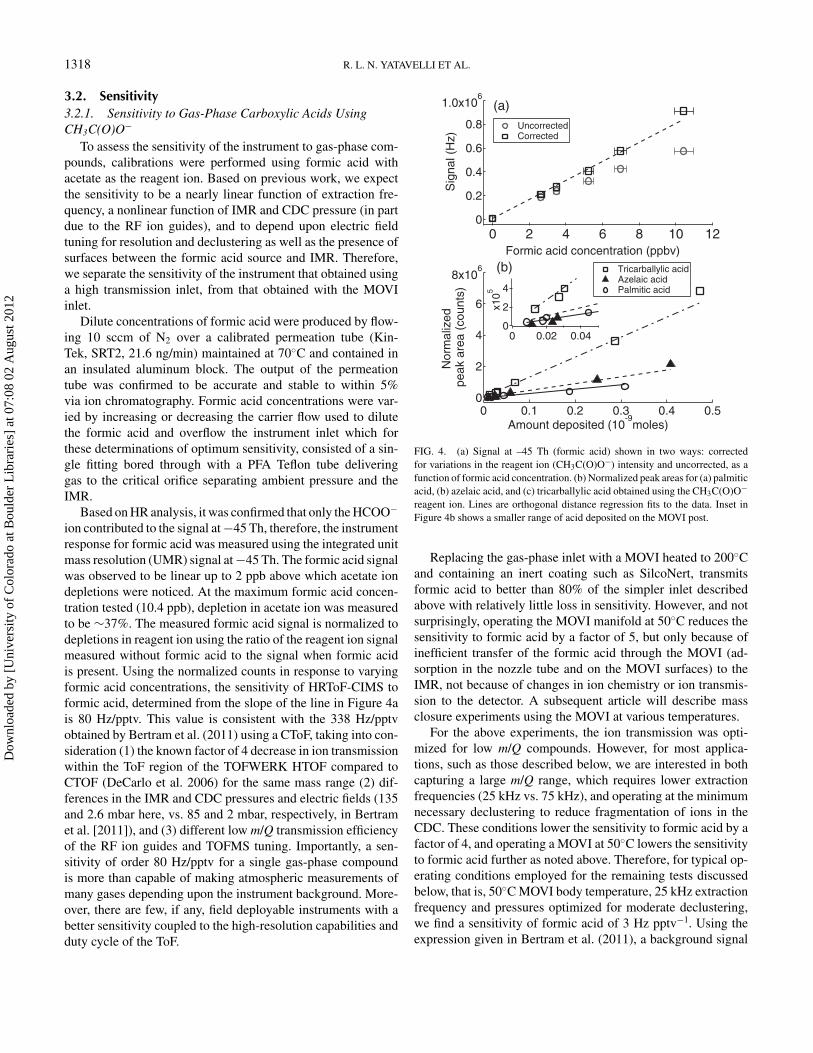
ion contributed to the signal at −45 Th, therefore, the instrumentresponse for formic acid was measured using the integrated unitmass resolution (UMR) signal at −45 Th. The formic acid signalwas observed to be linear up to 2 ppb above which acetate iondepletions were noticed. At the maximum formic acid concen-tration tested (10.4 ppb), depletion in acetate ion was measuredto be ∼37%. The measured formic acid signal is normalized todepletions in reagent ion using the ratio of the reagent ion signalmeasured without formic acid to the signal when formic acidis present. Using the normalized counts in response to varyingformic acid concentrations, the sensitivity of HRToF-CIMS toformic acid, determined from the slope of the line in Figure 4ais 80 Hz/pptv. This value is consistent with the 338 Hz/pptvobtained by Bertram et al. (2011) using a CToF, taking into con-sideration (1) the known factor of 4 decrease in ion transmissionwithin the ToF region of the TOFWERK HTOF compared toCTOF (DeCarlo et al. 2006) for the same mass range (2) dif-ferences in the IMR and CDC pressures and electric fields (135and 2.6 mbar here, vs. 85 and 2 mbar, respectively, in Bertramet al. [2011]), and (3) different low m/Q transmission efficiencyof the RF ion guides and TOFMS tuning. Importantly, a sen-sitivity of order 80 Hz/pptv for a single gas-phase compoundis more than capable of making atmospheric measurements ofmany gases depending upon the instrument background. More-over, there are few, if any, field deployable instruments with abetter sensitivity coupled to the high-resolution capabilities andduty cycle of the ToF.
1.0x10⁶
0.8
0.6
0.4
0.2
0
Sig
nal (
Hz)
121086420Formic acid concentration (ppbv)
8x10⁶
6
4
2
0
Nor
mal
ized
pe
ak a
rea
(cou
nts)
0.50.40.30.20.10Amount deposited (10
-9moles)
4
2
0
x105
0.040.020
Uncorrected Corrected
Tricarballylic acid Azelaic acid Palmitic acid
(a)
(b)
FIG. 4. (a) Signal at –45 Th (formic acid) shown in two ways: correctedfor variations in the reagent ion (CH3C(O)O−) intensity and uncorrected, as afunction of formic acid concentration. (b) Normalized peak areas for (a) palmiticacid, (b) azelaic acid, and (c) tricarballylic acid obtained using the CH3C(O)O−reagent ion. Lines are orthogonal distance regression fits to the data. Inset inFigure 4b shows a smaller range of acid deposited on the MOVI post.
Replacing the gas-phase inlet with a MOVI heated to 200◦Cand containing an inert coating such as SilcoNert, transmitsformic acid to better than 80% of the simpler inlet describedabove with relatively little loss in sensitivity. However, and notsurprisingly, operating the MOVI manifold at 50◦C reduces thesensitivity to formic acid by a factor of 5, but only because ofinefficient transfer of the formic acid through the MOVI (ad-sorption in the nozzle tube and on the MOVI surfaces) to theIMR, not because of changes in ion chemistry or ion transmis-sion to the detector. A subsequent article will describe massclosure experiments using the MOVI at various temperatures.
For the above experiments, the ion transmission was opti-mized for low m/Q compounds. However, for most applica-tions, such as those described below, we are interested in bothcapturing a large m/Q range, which requires lower extractionfrequencies (25 kHz vs. 75 kHz), and operating at the minimumnecessary declustering to reduce fragmentation of ions in theCDC. These conditions lower the sensitivity to formic acid by afactor of 4, and operating a MOVI at 50◦C lowers the sensitivityto formic acid further as noted above. Therefore, for typical op-erating conditions employed for the remaining tests discussedbelow, that is, 50◦C MOVI body temperature, 25 kHz extractionfrequency and pressures optimized for moderate declustering,we find a sensitivity of formic acid of 3 Hz pptv−1. Using theexpression given in Bertram et al. (2011), a background signal
Dow
nloa
ded
by [
Uni
vers
ity o
f C
olor
ado
at B
ould
er L
ibra
ries
] at
07:
08 0
2 A
ugus
t 201
2
MOVI-HRTOF-CIMS FOR ANALYSIS OF ORGANIC SPECIES 1319
of 300 Hz, and a signal-to-noise ratio S/N = 3, we estimate theformic acid detection limit to be 25 pptv in 1 s integrations,which is a factor of 8 lower than that obtained by Bertram et al.(2011) with a high transmission gas-phase inlet and a CToF.
The gas-phase formic acid detection limit reported heremakes this instrument suitable for measurements in both cleanand polluted regions. Formic acid concentrations range between(lowest and highest values reported) 0.02–19 ppbv in pollutedurban air (Chebbi and Carlier 1996; Veres et al. 2011), 1–40ppbv in forested region of Sierra Nevada in Southwestern USA(Harrington et al. 1993), 0.1–3.8 ppbv in rural and semirural re-gions across the world (Chebbi and Carlier 1996), 0.03–1.7 ppbvand 0.65–0.85 ppbv in remote and pollution impacted marineregions, respectively (Bertram et al. 2011), and 0.1–2.9 ppbv inthe Amazon forest (Chebbi and Carlier 1996).
3.2.2. Sensitivity to Particle-Phase Carboxylic Acids UsingCH3C(O)O−
The MOVI-HRToF-CIMS sensitivity for condensed phaseorganic compounds was measured using submicron polydis-perse aerosols generated with a constant output atomizer (TSI3076, St. Paul, MN, USA). A dilute methanol solution con-taining approximately 0.12, 0.11, and 0.11 mM of tricarballylicacid (C6H8O6, tri-acid), azelaic acid (C9H16O4, di-acid), andpalmitic acid (C16H32O2, mono-acid), respectively, was used asthe solution for atomization within 2 days of its preparation.These acids were chosen in order to investigate the ionizationefficiency and instrument response to compounds that differedin number of carboxylic acid functionalities and volatility. Otheracids (glutaric, benzoic, and decanoic) have also been tested, butfall within a similar range of results as the acids presented here.
The mass collected on the impaction surface was changed bysampling for different times between thermal desorptions. Thecollected mass was determined from the particle mass concen-tration, sampling time, and the impactor collection and bounceefficiencies using Equation (1). We assume the dry aerosol par-ticles were more likely amorphous solids rather than liquids.In addition, we assume the components in the aerosol particlesretained the same mole fraction as the atomizer solution. Thecollected particle mass was thermally desorbed into dry N2 andsubsequently detected by CI and ToFMS analysis.
The measured signal for each acid (Si, i = tricarballylic,azelaic, palmitic) was normalized by multiplying the respectiveacid signal by the ratio of the reagent ion signal at the start ofdesorption cycle (Acetatet = 0) to the reagent ion signal duringeach time step (Acetatet = t).
Si,norm = Si,t=t × Acetatet=0
Acetatet=t
[3]
The instrument response to each acid was then determined byintegrating the normalized ion signal (Si,norm) resulting from thethermal desorption at the m/Q corresponding to the deprotonatedacid. The total area under the thermogram desorption peak is
reported as counts, that is, the total number of ions detected overthe thermal desorption time period.
For the acids used here, the corresponding carboxylate an-ions appear in the mass spectrum at the nominal m/Q of −175,−187, and −255 Th for tricarballylic, azelaic and palmitic acid,respectively. For all these acids minimal signal was observed atthe m/Q corresponding to a cluster with acetate ion, and exceptfor tricarballylic acid, the carboxylate anion was the only signif-icant ion observed. For tricarballylic acid, an additional signalwas detected at −157 Th, which was highly correlated with−175 Th and was 2–10 times larger. High-resolution analysisof −157 Th peak had an exact mass of −157.0137 Th, whichcorresponded to the dehydrated TA. At present, it is not knownif the dehydration occurred in the solvent used in the atomizer,during thermal vaporization, or after ionization. Further tests areneeded to more conclusively determine its cause. For the pur-pose of the sensitivity calculation it is assumed that the signalat −157 Th is a dehydration product of tricarballylic acid, andtherefore the signal at this peak is added to the signal measuredat −175 Th to obtain the total tricarballylic acid signal.
Figure 4b shows the tricarballylic, azelaic, and palmitic sig-nals (normalized to acetate signal and integrated ion counts)versus deposited amount in nanomoles (nmol). A linear increasein ion signal is observed with increasing amount deposited forthe range studied consistent with the linearity demonstratedpreviously with the MOVI (Yatavelli and Thornton 2010). Thesensitivity to each acid is the slope of the linear least squaresline shown in Figure 4b and is calculated to be 2.7 ± 0.06 × 106,4.4 ± 0.1 × 10⁶, and 1.3 ± 0.03 × 10⁷ counts/nmol, for palmitic,azelaic, and tricarballylic acid, respectively. For comparison, thesensitivity to gas-phase formic acid with a hot MOVI is equiv-alent to 5 × 10⁶ counts/nmol, essentially the same as that forazelaic acid, suggesting a consistency between the sensitivity togas and particle-phase compounds. Moreover, the sensitivitiescalculated here correspond to ionization efficiencies of 4.5 ×10⁻⁹–2.2 × 10⁻⁸ ions/molecule which can be compared to typi-cal ionization efficiencies of 1 × 10⁻⁷ ions/molecule for V-modeand 1 × 10⁻⁸ ions/molecule for W-mode of the HRToF-AMSusing electron-impact ionization (DeCarlo et al. 2006). Giventhe larger volumes sampled by the MOVI-HRToF-CIMS ver-sus the AMS (10 lpm vs. 0.1 lpm, respectively), the detectionlimits for the MOVI-HRToF-CIMS in terms of ambient concen-trations are expected to be similar or better than those of theHR-ToF-AMS.
The sensitivity to carboxylic acid compounds observed us-ing acetate ion chemistry increases with an increasing numberof carboxylic acid functionalities per compound and is also con-sistent with an increase in the relative acidity (�Gacid) of theanalyte with respect to acetic acid. The gas-phase acidity for var-ious mono and dicarboxylic acids (Bartmess 1989) suggests anincrease in acetate ionization probability with increasing num-ber of acid groups and decreasing carbon number (Figure S2).At some point, ionization will be limited by the ion-moleculecollision frequency and residence time in the IMR; increases in
Dow
nloa
ded
by [
Uni
vers
ity o
f C
olor
ado
at B
ould
er L
ibra
ries
] at
07:
08 0
2 A
ugus
t 201
2
1320 R. L. N. YATAVELLI ET AL.
relative acidity will not increase sensitivity beyond that point.We hypothesize that the range in sensitivity observed for thecarboxylic acids here is due to the range in gas-phase aciditiesrelative to acetate. This conclusion will be the focus of future re-search by testing more acids and/or modeling the ion-moleculereaction thermodynamics and kinetics. Systematic characteriza-tion of the sensitivity to the broad range of compounds detectableby the MOVI-HRToF-CIMS is ultimately necessary to be quan-titative for any specific ion detected. Utilizing measured andtheoretically determined gas-phase acidities (or proton affini-ties when operating in proton addition mode) as a function ofelemental composition is a likely approach for such a universalsensitivity function. While such a universal sensitivity functionis a long-term goal, it is important to note that the relative sen-sitivity between different compounds (and therefore betweendetected ions) is likely fixed for constant operating conditionsand need not be known to determine and characterize statisticalpatterns within a time series of mass spectra, as is done for factoranalysis.
3.3. Precision and Detection Limits for Particle-PhaseCarboxylic Acids
To estimate the precision of the impaction/volatilizationmethod, three replicate calibration experiments were performedfor the three organic acids using syringe deposition as describedpreviously (Yatavelli and Thornton 2010). These tests suggesta relative measurement precision for palmitic, azelaic, and tri-carballylic acid of 8, 16, and 19%, respectively. The overallprecision error is larger than the estimated delivery precision.We speculate that matrix effects, such as variable conversionof acids to esters in the ethanol solution are driving the ob-served variability in this case. Future calibration experimentsare planned with different solvents to test this hypothesis. Inthe absence of independent standards for these acids, it is notpossible to calculate the instrument accuracy.
Following Yatavelli and Thornton (2010), we define the de-tection limit of the MOVI-HRToF-CIMS instrument as beingthe mass deposited on the impaction post that gives rise to asignal that is three times the precision of the signal, includingvariations of the background. The uncertainty in the signal peakareas (σ spa), which is the precision mentioned above, and un-certainty in the blank signal peak areas (σ bspa) together withthe deposited amount in moles (n) and calibration factor (Cf)determine the S/N ratio.
S
N= Cf n
√(σspaCf n)2 + (σbspa)2
[4]
Using S/N = 3 in Equation (4), we calculate a detection limit of10 × 10−3, 2.6 × 10⁻³, and 8.9 × 10⁻³ nmol for palmitic,azelaic, and tricarballylic acid, respectively, when using ac-etate as the reagent ion. These detection limits correspond toatmospheric mass concentration detection limits of 4.4, 0.8,and 2.6 ng/m3 for palmitic, azelaic, and tricarballylic acid, re-
spectively, assuming a particle collection time of 1 h under atypical MOVI flow rate of 10,000 sccm. These detection lim-its are indeed similar to the ∼3 ng/m3 1-h detection-limit ofthe HR-ToF-AMS V-mode for organic material (DeCarlo et al.2006).
These detection limits are suitable for measurements notonly in polluted regions but also in cleaner environments. Forexample, ambient concentrations (lowest and highest valuesreported) of palmitic and azelaic acids are 35.6–89.1 ng/m3
and 2.6–25.5 ng/m3, respectively, in aerosol collected inPhiladelphia, PA, USA (Li et al. 2006), 0.95–2.4 ng/m3
and 0.17–4 ng/m3, respectively, in remote marine aerosol(Kawamura and Sakaguchi 1999; Mochida et al. 2002), and2.1–12.7 ng/m3 and 0.7–2.5 ng/m3, respectively, in the Ama-zon forest (Graham et al. 2003). Tricarballylic acid has alsobeen measured in various source regions with a range of0.35–39.1 ng/m3 in urban aerosol collected in Chennai, India(Fu et al. 2010), 0.002–3.4 ng/m3 in remote marine aerosol (Fuet al. 2011), and 1.5–5.3 ng/m3 in the Amazon forest (Grahamet al. 2003).
4. METHOD APPLICATIONThe capabilities of the technique for broadly characterizing
gaseous and particulate oxygenated organic compounds thoughtto be atmospherically relevant were assessed using OA gener-ated in controlled oxidation experiments. Results presented hereare obtained from two such experiments: (1) dark ozonolysis ofα-pinene in a flow-through chamber, and (2) photo-oxidation ofa cyclic alkane in a large environmental chamber.
4.1. �-Pinene Ozonolysis SOASOA was produced by reacting α-pinene with ozone in an
ambient pressure, room temperature, entrained aerosol flow re-actor. The entrained aerosol flow reactor is similar to that usedpreviously in the Thornton lab and described in detail by Bertramet al. (2009). Details of the experimental setup and conditionsare presented in the supplemental information. We only brieflysummarize the conditions here. Ozone and α-pinene reactedwithout seed particles for 8 min (residence time). At the exitof the flow reactor, a fraction of the eluent was sampled by anSMPS, and the rest was drawn through the MOVI inlet (at 40◦C)to the HRToF-CIMS. Typically, 76 µg/m3 of SOA were detectedat the exit and subsequently diluted by a factor of 5.5 prior tosampling by the MOVI. Total SOA mass collected during thesampling cycle, assuming a density of 1.4 g/cm3 and sphericalparticles was ∼0.94 µg. These calculations used Equation (1)with an Eb equal to that of solid aerosol-particles (0.65) alongwith the size dependent CE of the MOVI (Yatavelli and Thornton2010). Acetate was used as the reagent ion during these exper-iments to detect gas and particle-phase carboxylic acids whichare known to be common products of α-pinene ozonolysis.
Figures 5a and b show average UMR mass spectra obtainedduring (a) sampling and (b) a temperature-programmed thermal
Dow
nloa
ded
by [
Uni
vers
ity o
f C
olor
ado
at B
ould
er L
ibra
ries
] at
07:
08 0
2 A
ugus
t 201
2

MOVI-HRTOF-CIMS FOR ANALYSIS OF ORGANIC SPECIES 1321
40003000
Est
imat
ed m
ass
conc
entr
atio
n (n
g m
-3)
400350300250200150100500
-m/Q (Th)
250
200
150
100
50
0
5000
4000
3000
2000
1000
0
45 (Formic acid) Sampling
(a)
Heating
(b)
45
73
85 127
151
169
183
197215 259
277
73 85 127 155
169
183
197
215259 277
111
FIG. 5. Unit mass resolution (UMR) spectra from ozonolysis of α-pinene in low-NOx conditions for (a) sampling and (b) heating cycles. See text for theestimation of mass concentrations from the detected signals.
desorption cycle of aerosol material collected during the sam-pling. All signals related to the reagent ion have been removedfor clarity. To provide a means of qualitative comparison, wehave assumed that all compounds detected during gas-phasesampling exhibit the same sensitivity as formic acid, while weapply an average of the sensitivities determined for palmiticand azelaic acids to the signals detected during the thermaldesorption cycle. Tricarballylic acid sensitivity was not used inthe calculation above assuming that the formation of tri-acidsduring α-pinene ozonolysis is a minor contributor to the overallSOA mass. The total detected organic acid mass evolvingduring a heating cycle was calculated from the total analyte ioncurrent to be in the range 100–320 ng, where the range arisesfrom using sensitivity equal to that of either azelaic or palmiticacids, respectively. This total acid estimate corresponds toan acid fraction of 11–34% of the total SOA mass. Theorganic acid fraction estimated above is similar to that reportedpreviously by Yu et al. (1999) for α-pinene ozonolysis in alarge environmental chamber (at an SOA concentration of 53µg m−3). They estimated the major ozonolysis products pinic,norpinic, pinonic, norponinic, hydroxypinonic acid, and anunidentified acid (C10H14O3) accounted for 13.6% (9.5–17.8%)of the total aerosol mass yield formed. Using the estimatedmass concentration, shown in Figure 5b, for the same acids, wecalculate that ∼12% of the aerosol mass is accounted by theseacids; again remarkably similar to the study by Yu et al. (1999).
In Figure 5a, the dominant gas-phase analyte ion observedis that of formic acid at −45 Th, the smallest possible gas-phase carboxylic acid presumably formed due to substantialC–C bond breakage during oxidation. Other major well-known
products such as pinonic (−183.1026 Th) and norponinic acid(−169.0876 Th), are also observed during sampling, but aremuch lower in intensity compared to formic acid suggesting thatthere is little gas-phase abundance of carboxylic acids in the highmass range (>200 Th) under our high OA mass concentrations.Alternately, if they preferentially partition to the gas-phase inthe reactor, they may have rapidly partitioned to the reactorwalls and/or the walls and collection surface of the samplinginlet. Likely, both effects play a role in these experiments andpreserving the gas/particle portioning upon sampling representsa significant analytical challenge for any instrument.
Figure 5b shows the mass spectrum during heating (particle-phase). The spectrum is similar to that observed during sam-pling but with much higher intensity upon thermal desorption.Some of the notable spectral features that correspond to productsreported by other studies include norpinonic acid (−169.0876Th), terpenylic acid/norpinic acid (−171.0674 Th), pinonic acid(−183.1026 Th), pinic acid (−185.0831 Th), and hydroxy-pinonic acid (−199.0972 Th).
In addition to the known products, the high mass resolvingpower and high mass accuracy of the HRToF-CIMS, allows us toestimate the elemental composition of a large range of detectedorganic acids. Exact peak centers are calculated using a customhigh-resolution peak fitting algorithm, written at the Universityof Washington, and exact mass values are input into an onlinemolecular composition calculator (http://www.chemcalc.org),whose output is used to estimate the elemental composition.Figure 6 shows the time-averaged high-resolution mass spec-trum obtained during a heating cycle with the possible elementalcompositions of several major ions. The mass scale is divided
Dow
nloa
ded
by [
Uni
vers
ity o
f C
olor
ado
at B
ould
er L
ibra
ries
] at
07:
08 0
2 A
ugus
t 201
2

1322 R. L. N. YATAVELLI ET AL.
357.3357.2357.1357-m/Q (Th)
110100908070 210200190180170160150
420400380360340320-m/Q (Th)
±40 µTh Th-1
±20 µTh Th-1
Peak center (-357.1564 Th)
C21H25O5-
C17H25O8-
C24H21O3-
C13H25O11-
(d)
(a) (b)
(c)
Measured data Gaussian fitC
19H
21O
5-
C18H27O8-
C 16H 31
O 12-
C7H
9O
4- ,C
8H
13O
3- C9H13O3
-
C10H15O3-
C9H13O4-
C 10H 15
O 4-
C 2H 1
O 3-
C 2H 3
O 3-
C 4H 3
O 3-
C2H1O4-
C 5H 5
O 3-
C19H29O8-
FIG. 6. High-resolution mass spectra marked with likely ion elemental compositions from ozonolysis of α-pinene in low-NOx conditions. (a) Mass range−70–117 Th, (b) mass range −150–210 Th, (c) mass range −319–433 Th, and (d) zoomed in view of ion peak −357 Th with possible oxygenated compounds in±40 µTh Th−1 range of the ion peak center. (Color figure available online.)
into three different panels; a, b, and c to more clearly show theseparation in ion peaks. Table T1 in the supplemental informa-tion lists the estimated elemental compositions of all the ionpeaks detected during the heating cycle. Figure 6d shows theion peak at −357.1564 Th and four possible oxygenated com-pounds that are within ±40 µTh Th−1 of the ion peak center.Since the mass accuracy of the instrument is ±20 µTh Th−1,we can reasonably narrow the possibilities to being some com-bination of two elemental compositions at this ion peak. Theestimated elemental composition can also be used to understandthe evolution of oxidation states of the products. This informa-tion provides insights on the fragmentation, functionalization,and oligomerization during oxidation of organic species (Krollet al. 2011).
We wish to highlight the large molecular weight products,presumably formed via oligomeric accretion reactions, whichare clearly detected using the MOVI-HRToF-CIMS (Figure 6c).Presently, to our knowledge, this is the only instrument that canprovide this kind of information at the molecular-level in a fielddeployable package with a specificity to carboxylic acid con-taining compounds. The relatively soft nature of the CI coupledwith the duty cycle of ToFMS allows detection of these largeoligomeric compounds that, to our knowledge, have so far onlybeen detected with extensive offline analyses (Tolocka et al.2004; Reinhardt et al. 2007; Walser et al. 2008; Heaton et al.2009; Hall and Johnston 2011).
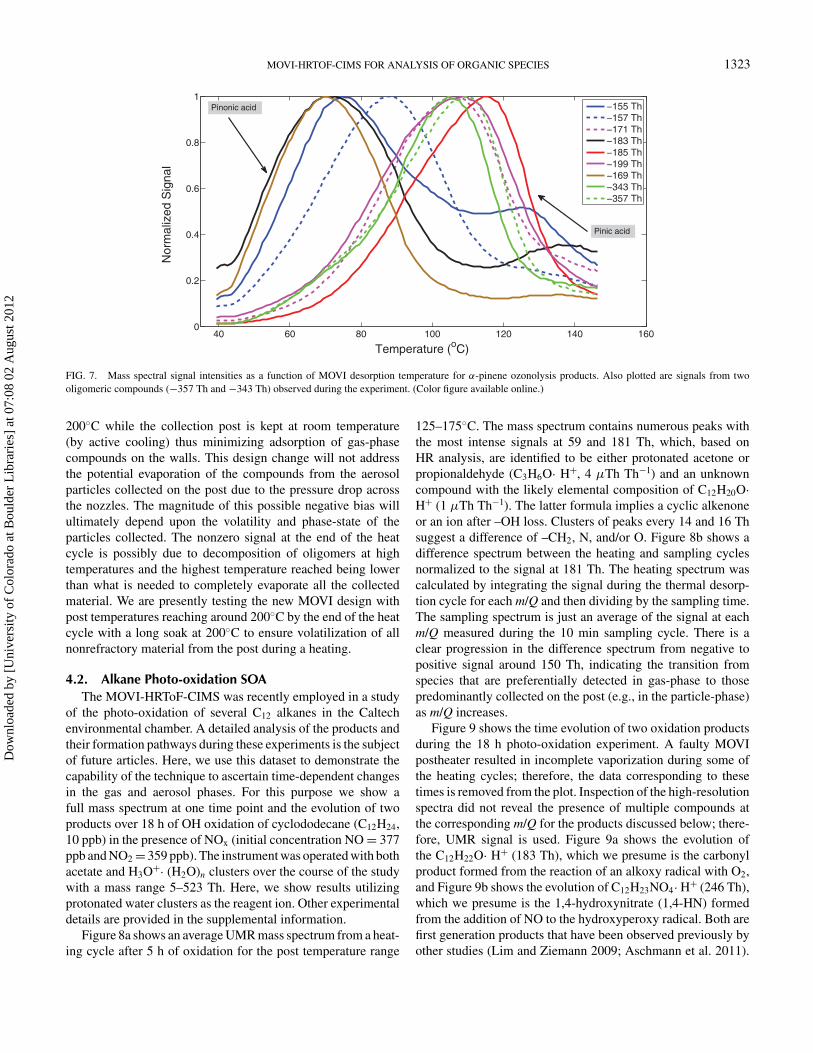
The built-in temperature programmed desorption inherentto MOVI analysis provides the ability to monitor the relativevolatility of a single compound or of the entire spectrum ofcompounds. An example of this capability is shown in Figure 7.The figure shows ion signals, as a function of the desorptiontemperature (mass thermogram) for m/Q consistent with ma-
jor α-pinene ozonolysis products having various functionalities.Based on HR analysis of the averaged mass spectra shown inFigure 6, no interferences were observed for the products shownhere, except −155 and −157 Th. Since development of anal-ysis procedures for automated processing of large amounts ofHR data is still ongoing, UMR data is used here. For example,pinonic acid (C10H16O3) is a monocarboxylic acid, and thus hasa higher equilibrium vapor pressure and desorbs earlier com-pared to pinic acid (C9H14O4) which is a dicarboxylic acid.The equilibrium vapor pressure of pinic acid is two orders ofmagnitude lower than pinonic acid (Compernolle et al. 2010),resulting in its higher desorption temperature. An interestingfeature to note is the double hump structure in the thermogramfor −155, −183, and somewhat for −169 Th. This secondaryhump is probably thermal decomposition of oligomeric com-pounds (shown in Figure 6c) into respective monomers. A recentstudy by Gao et al. (2010) identified the product at −357 Th as adimer of pinic acid and terpenylic acid (C8H12O4). Alternately,since the traces shown in Figure 6 are UMR, it is possible thatthere are other oxidized compounds with lower volatilities atsimilar nominal masses that are desorbing at higher tempera-tures.
The non zero signal for the products during the start ofthe heat cycle is possibly due to a combination of evaporationof the compounds from the sample collected on the post andon the manifold walls (during aerosol sampling). During thestart of the heating cycle, partitioning of the compounds basedon their vapor pressure is in fact visible with pinonic acid,which has a higher vapor pressure compared to pinic acid,and has a correspondingly higher signal than other products.Some of these issues will be addressed with a future MOVIdesign which has the manifold constantly maintained at
Dow
nloa
ded
by [
Uni
vers
ity o
f C
olor
ado
at B
ould
er L
ibra
ries
] at
07:
08 0
2 A
ugus
t 201
2
MOVI-HRTOF-CIMS FOR ANALYSIS OF ORGANIC SPECIES 1323
40 60 80 100 120 140 1600
0.2
0.4
0.6
0.8
1
Temperature (oC)
Nor
mal
ized
Sig
nal
−155 Th−157 Th−171 Th−183 Th−185 Th−199 Th−169 Th−343 Th−357 Th
Pinic acid
Pinonic acid
FIG. 7. Mass spectral signal intensities as a function of MOVI desorption temperature for α-pinene ozonolysis products. Also plotted are signals from twooligomeric compounds (−357 Th and −343 Th) observed during the experiment. (Color figure available online.)
200◦C while the collection post is kept at room temperature(by active cooling) thus minimizing adsorption of gas-phasecompounds on the walls. This design change will not addressthe potential evaporation of the compounds from the aerosolparticles collected on the post due to the pressure drop acrossthe nozzles. The magnitude of this possible negative bias willultimately depend upon the volatility and phase-state of theparticles collected. The nonzero signal at the end of the heatcycle is possibly due to decomposition of oligomers at hightemperatures and the highest temperature reached being lowerthan what is needed to completely evaporate all the collectedmaterial. We are presently testing the new MOVI design withpost temperatures reaching around 200◦C by the end of the heatcycle with a long soak at 200◦C to ensure volatilization of allnonrefractory material from the post during a heating.
4.2. Alkane Photo-oxidation SOAThe MOVI-HRToF-CIMS was recently employed in a study
of the photo-oxidation of several C12 alkanes in the Caltechenvironmental chamber. A detailed analysis of the products andtheir formation pathways during these experiments is the subjectof future articles. Here, we use this dataset to demonstrate thecapability of the technique to ascertain time-dependent changesin the gas and aerosol phases. For this purpose we show afull mass spectrum at one time point and the evolution of twoproducts over 18 h of OH oxidation of cyclododecane (C12H24,10 ppb) in the presence of NOx (initial concentration NO = 377ppb and NO2 = 359 ppb). The instrument was operated with bothacetate and H3O+· (H2O)n clusters over the course of the studywith a mass range 5–523 Th. Here, we show results utilizingprotonated water clusters as the reagent ion. Other experimentaldetails are provided in the supplemental information.
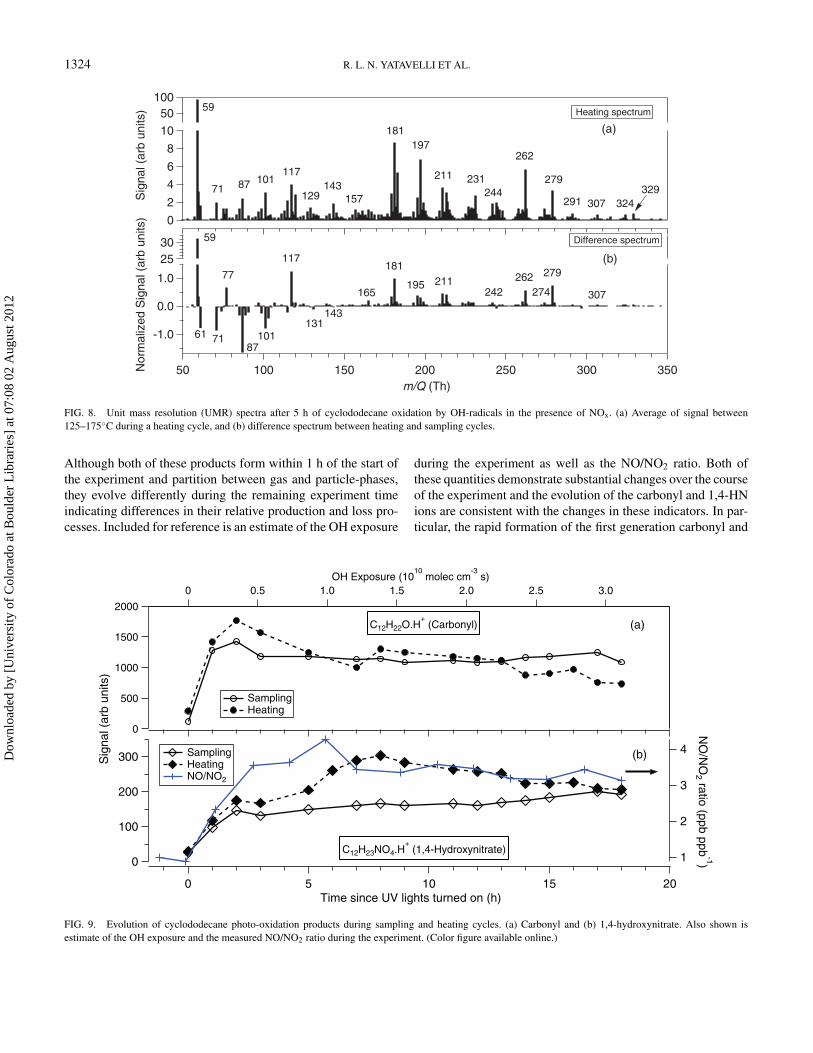
Figure 8a shows an average UMR mass spectrum from a heat-ing cycle after 5 h of oxidation for the post temperature range
125–175◦C. The mass spectrum contains numerous peaks withthe most intense signals at 59 and 181 Th, which, based onHR analysis, are identified to be either protonated acetone orpropionaldehyde (C3H6O· H+, 4 µTh Th−1) and an unknowncompound with the likely elemental composition of C12H20O·H+ (1 µTh Th−1). The latter formula implies a cyclic alkenoneor an ion after –OH loss. Clusters of peaks every 14 and 16 Thsuggest a difference of –CH2, N, and/or O. Figure 8b shows adifference spectrum between the heating and sampling cyclesnormalized to the signal at 181 Th. The heating spectrum wascalculated by integrating the signal during the thermal desorp-tion cycle for each m/Q and then dividing by the sampling time.The sampling spectrum is just an average of the signal at eachm/Q measured during the 10 min sampling cycle. There is aclear progression in the difference spectrum from negative topositive signal around 150 Th, indicating the transition fromspecies that are preferentially detected in gas-phase to thosepredominantly collected on the post (e.g., in the particle-phase)as m/Q increases.
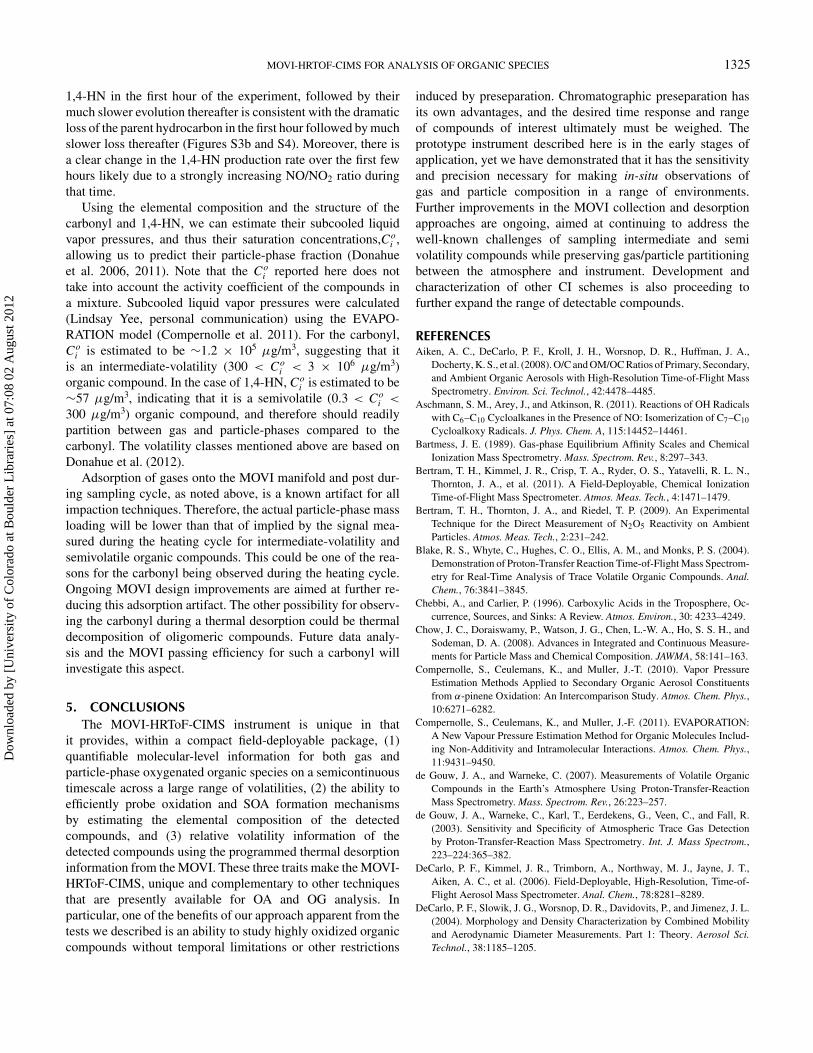
Figure 9 shows the time evolution of two oxidation productsduring the 18 h photo-oxidation experiment. A faulty MOVIpostheater resulted in incomplete vaporization during some ofthe heating cycles; therefore, the data corresponding to thesetimes is removed from the plot. Inspection of the high-resolutionspectra did not reveal the presence of multiple compounds atthe corresponding m/Q for the products discussed below; there-fore, UMR signal is used. Figure 9a shows the evolution ofthe C12H22O· H+ (183 Th), which we presume is the carbonylproduct formed from the reaction of an alkoxy radical with O2,and Figure 9b shows the evolution of C12H23NO4· H+ (246 Th),which we presume is the 1,4-hydroxynitrate (1,4-HN) formedfrom the addition of NO to the hydroxyperoxy radical. Both arefirst generation products that have been observed previously byother studies (Lim and Ziemann 2009; Aschmann et al. 2011).
Dow
nloa
ded
by [
Uni
vers
ity o
f C
olor
ado
at B
ould
er L
ibra
ries
] at
07:
08 0
2 A
ugus
t 201
2
1324 R. L. N. YATAVELLI ET AL.
-1.0
0.0
1.0
Nor
mal
ized
Sig
nal (
arb
units
)
35030025020015010050 m/Q (Th)
3025
10
8
6
4
2
0
Sig
nal (
arb
units
)
10050
59
61 71
77
87101
117
131143
165
181
195 211242
262 279
274
Difference spectrum
307
(b)
(a)
Heating spectrum59
71 87 101117
129143
157
197
211 231244
262
279
291 307 324
181
329
FIG. 8. Unit mass resolution (UMR) spectra after 5 h of cyclododecane oxidation by OH-radicals in the presence of NOx. (a) Average of signal between125–175◦C during a heating cycle, and (b) difference spectrum between heating and sampling cycles.
Although both of these products form within 1 h of the start ofthe experiment and partition between gas and particle-phases,they evolve differently during the remaining experiment timeindicating differences in their relative production and loss pro-cesses. Included for reference is an estimate of the OH exposure
during the experiment as well as the NO/NO2 ratio. Both ofthese quantities demonstrate substantial changes over the courseof the experiment and the evolution of the carbonyl and 1,4-HNions are consistent with the changes in these indicators. In par-ticular, the rapid formation of the first generation carbonyl and
300
200
100
0
Sig
nal (
arb
units
)
20151050 Time since UV lights turned on (h)
4
3
2
1
NO
/NO
2 ratio (ppb ppb-1)
2000
1500
1000
500
0
3.02.52.01.51.00.50 OH Exposure (10
10 molec cm
-3 s)
Sampling Heating NO/NO2
(b)
Sampling Heating
C12H22O.H+ (Carbonyl)
C12H23NO4.H+ (1,4-Hydroxynitrate)
(a)
FIG. 9. Evolution of cyclododecane photo-oxidation products during sampling and heating cycles. (a) Carbonyl and (b) 1,4-hydroxynitrate. Also shown isestimate of the OH exposure and the measured NO/NO2 ratio during the experiment. (Color figure available online.)
Dow
nloa
ded
by [
Uni
vers
ity o
f C
olor
ado
at B
ould
er L
ibra
ries
] at
07:
08 0
2 A
ugus
t 201
2
MOVI-HRTOF-CIMS FOR ANALYSIS OF ORGANIC SPECIES 1325
1,4-HN in the first hour of the experiment, followed by theirmuch slower evolution thereafter is consistent with the dramaticloss of the parent hydrocarbon in the first hour followed by muchslower loss thereafter (Figures S3b and S4). Moreover, there isa clear change in the 1,4-HN production rate over the first fewhours likely due to a strongly increasing NO/NO2 ratio duringthat time.
Using the elemental composition and the structure of thecarbonyl and 1,4-HN, we can estimate their subcooled liquidvapor pressures, and thus their saturation concentrations,Co
i ,allowing us to predict their particle-phase fraction (Donahueet al. 2006, 2011). Note that the Co
i reported here does nottake into account the activity coefficient of the compounds ina mixture. Subcooled liquid vapor pressures were calculated(Lindsay Yee, personal communication) using the EVAPO-RATION model (Compernolle et al. 2011). For the carbonyl,Co
i is estimated to be ∼1.2 × 10⁵ µg/m3, suggesting that itis an intermediate-volatility (300 < Co
i < 3 × 10⁶ µg/m3)organic compound. In the case of 1,4-HN, Co
i is estimated to be∼57 µg/m3, indicating that it is a semivolatile (0.3 < Co
i <
300 µg/m3) organic compound, and therefore should readilypartition between gas and particle-phases compared to thecarbonyl. The volatility classes mentioned above are based onDonahue et al. (2012).
Adsorption of gases onto the MOVI manifold and post dur-ing sampling cycle, as noted above, is a known artifact for allimpaction techniques. Therefore, the actual particle-phase massloading will be lower than that of implied by the signal mea-sured during the heating cycle for intermediate-volatility andsemivolatile organic compounds. This could be one of the rea-sons for the carbonyl being observed during the heating cycle.Ongoing MOVI design improvements are aimed at further re-ducing this adsorption artifact. The other possibility for observ-ing the carbonyl during a thermal desorption could be thermaldecomposition of oligomeric compounds. Future data analy-sis and the MOVI passing efficiency for such a carbonyl willinvestigate this aspect.
5. CONCLUSIONSThe MOVI-HRToF-CIMS instrument is unique in that
it provides, within a compact field-deployable package, (1)quantifiable molecular-level information for both gas andparticle-phase oxygenated organic species on a semicontinuoustimescale across a large range of volatilities, (2) the ability toefficiently probe oxidation and SOA formation mechanismsby estimating the elemental composition of the detectedcompounds, and (3) relative volatility information of thedetected compounds using the programmed thermal desorptioninformation from the MOVI. These three traits make the MOVI-HRToF-CIMS, unique and complementary to other techniquesthat are presently available for OA and OG analysis. Inparticular, one of the benefits of our approach apparent from thetests we described is an ability to study highly oxidized organiccompounds without temporal limitations or other restrictions
induced by preseparation. Chromatographic preseparation hasits own advantages, and the desired time response and rangeof compounds of interest ultimately must be weighed. Theprototype instrument described here is in the early stages ofapplication, yet we have demonstrated that it has the sensitivityand precision necessary for making in-situ observations ofgas and particle composition in a range of environments.Further improvements in the MOVI collection and desorptionapproaches are ongoing, aimed at continuing to address thewell-known challenges of sampling intermediate and semivolatility compounds while preserving gas/particle partitioningbetween the atmosphere and instrument. Development andcharacterization of other CI schemes is also proceeding tofurther expand the range of detectable compounds.
REFERENCESAiken, A. C., DeCarlo, P. F., Kroll, J. H., Worsnop, D. R., Huffman, J. A.,
Docherty, K. S., et al. (2008). O/C and OM/OC Ratios of Primary, Secondary,and Ambient Organic Aerosols with High-Resolution Time-of-Flight MassSpectrometry. Environ. Sci. Technol., 42:4478–4485.
Aschmann, S. M., Arey, J., and Atkinson, R. (2011). Reactions of OH Radicalswith C6–C10 Cycloalkanes in the Presence of NO: Isomerization of C7–C10
Cycloalkoxy Radicals. J. Phys. Chem. A, 115:14452–14461.Bartmess, J. E. (1989). Gas-phase Equilibrium Affinity Scales and Chemical
Ionization Mass Spectrometry. Mass. Spectrom. Rev., 8:297–343.Bertram, T. H., Kimmel, J. R., Crisp, T. A., Ryder, O. S., Yatavelli, R. L. N.,
Thornton, J. A., et al. (2011). A Field-Deployable, Chemical IonizationTime-of-Flight Mass Spectrometer. Atmos. Meas. Tech., 4:1471–1479.
Bertram, T. H., Thornton, J. A., and Riedel, T. P. (2009). An ExperimentalTechnique for the Direct Measurement of N2O5 Reactivity on AmbientParticles. Atmos. Meas. Tech., 2:231–242.
Blake, R. S., Whyte, C., Hughes, C. O., Ellis, A. M., and Monks, P. S. (2004).Demonstration of Proton-Transfer Reaction Time-of-Flight Mass Spectrom-etry for Real-Time Analysis of Trace Volatile Organic Compounds. Anal.Chem., 76:3841–3845.
Chebbi, A., and Carlier, P. (1996). Carboxylic Acids in the Troposphere, Oc-currence, Sources, and Sinks: A Review. Atmos. Environ., 30: 4233–4249.
Chow, J. C., Doraiswamy, P., Watson, J. G., Chen, L.-W. A., Ho, S. S. H., andSodeman, D. A. (2008). Advances in Integrated and Continuous Measure-ments for Particle Mass and Chemical Composition. JAWMA, 58:141–163.
Compernolle, S., Ceulemans, K., and Muller, J.-T. (2010). Vapor PressureEstimation Methods Applied to Secondary Organic Aerosol Constituentsfrom α-pinene Oxidation: An Intercomparison Study. Atmos. Chem. Phys.,10:6271–6282.
Compernolle, S., Ceulemans, K., and Muller, J.-F. (2011). EVAPORATION:A New Vapour Pressure Estimation Method for Organic Molecules Includ-ing Non-Additivity and Intramolecular Interactions. Atmos. Chem. Phys.,11:9431–9450.
de Gouw, J. A., and Warneke, C. (2007). Measurements of Volatile OrganicCompounds in the Earth’s Atmosphere Using Proton-Transfer-ReactionMass Spectrometry. Mass. Spectrom. Rev., 26:223–257.
de Gouw, J. A., Warneke, C., Karl, T., Eerdekens, G., Veen, C., and Fall, R.(2003). Sensitivity and Specificity of Atmospheric Trace Gas Detectionby Proton-Transfer-Reaction Mass Spectrometry. Int. J. Mass Spectrom.,223–224:365–382.
DeCarlo, P. F., Kimmel, J. R., Trimborn, A., Northway, M. J., Jayne, J. T.,Aiken, A. C., et al. (2006). Field-Deployable, High-Resolution, Time-of-Flight Aerosol Mass Spectrometer. Anal. Chem., 78:8281–8289.
DeCarlo, P. F., Slowik, J. G., Worsnop, D. R., Davidovits, P., and Jimenez, J. L.(2004). Morphology and Density Characterization by Combined Mobilityand Aerodynamic Diameter Measurements. Part 1: Theory. Aerosol Sci.Technol., 38:1185–1205.
Dow
nloa
ded
by [
Uni
vers
ity o
f C
olor
ado
at B
ould
er L
ibra
ries
] at
07:
08 0
2 A
ugus
t 201
2
1326 R. L. N. YATAVELLI ET AL.
Donahue, N. M., Epstein, S. A., Pandis, S., and Robinson, A. L. (2011). ATwo-Dimensional Volatility Basis Set: 1. Organic-Aerosol Mixing Thermo-dynamics. Atmos. Chem. Phys., 11:3303–3318.
Donahue, N. M., Kroll, J. H., Pandis, S. N., and Robinson, A. L. (2012). A Two-Dimensional Volatility Basis Set—Part 2: Diagnostics of Organic-AerosolEvolution. Atmos. Chem. Phys., 12:615–634.
Donahue, N. M., Robinson, A. L., Stanier, C. O., and Pandis, S. N. (2006). Cou-pled Partitioning, Dilution, and Chemical Aging of Semivolatile Organics.Environ. Sci. Technol., 40:2635–2643.
Drewnick, F., Hings, S. S., DeCarlo, P. F., Jayne, J. T., Gonin, M., Fuhrer,K., et al. (2005). A New Time-of-Flight Aerosol Mass Spectrometer (TOF-AMS) - Instrument Description and First Field Deployment. Aerosol Sci.Technol., 39:637–658.
Farmer, D. K., and Jimenez, J. L. (2010). Real-Time Atmospheric ChemistryField Instrumentation. Anal. Chem., 82:7879–7884.
Fu, P. Q., Kawamura, K., Pavuluri, C. M., Swaminathan, T., and Chen, J.(2010). Molecular Characterization of Urban Organic Aerosol in TropicalIndia: Contributions of Primary Emissions and Secondary Photooxidation.Atmos. Chem. Phys., 10:2663–2689.
Fu, P., Kawamura, K., and Miura, K. (2011). Molecular Characterization ofMarine Organic Aerosols Collected During a Round-the-World Cruise. J.Geophys. Res., 116:D13302, doi: 10.1029/2011JD015604.
Gao, Y., Hall, W. A., and Johnston, M. V. (2010). Molecular Composition ofMonoterpene Secondary Organic Aerosol at Low Mass Loadings. Environ.Sci. Technol., 44:7897–7902.
Goldstein, A. H., and Galbally, I. E. (2007). Known and Unexplored Or-ganic Constituents in the Earth’s Atmosphere Environ. Sci. Technol.,41:1515–1521.
Goldstein, A. H., Koven, C. D., Heald, C. L., and Fung, I. Y. (2009). BiogenicCarbon and Anthropogenic Pollutants Combine to form a Cooling HazeOver the Southeastern United States. PNAS, 106:8835–8840.
Graham, B., Guyon, P., Taylor, P. E., Artaxo, P., Maenhaut, W., Glovsky, M.M., et al. (2003). Organic Compounds Present in the Natural AmazoniaAerosol: Characterization by Gas Chromatography - Mass Spectrometry. J.Geophys. Res., 108:4766–4779.
Graus, M., Muller, M., and Hansel, A. (2010). High Resolution PTR-TOF:Quantification and Formula Confirmation of VOC in Real Time. J. Am. Soc.Mass Spectrom., 21:1037–1044.
Hall, W. A., and Johnston, M. V. (2011). Oligomeric Content of α-PineneSecondary Organic Aerosol. Aerosol Sci. Technol., 45:37–45.
Hallquist, M., Wenger, J. C., Baltensperger, U., Rudich, Y., Simpson, D.,Claeys, M., et al. (2009). The Formation, Properties and Impacts of Sec-ondary Organic Aerosol: Current and Emerging Issues. Atmos. Chem. Phys.,9:5155–5236.
Harrington, R. F., Gertler, A. W., Grosjean, D., and Amar, P. (1993). FormicAcid and Acetic Acid in the Western Sierra Nevada, California. Atmos.Environ., 27A:1843–1849.
Heald, C. L., Ridley, D. A., Kreidenweis, S. M., and Drury, E. E. (2010). SatelliteObservations Cap the Atmospheric Organic Aerosol Budget. Geophys. Res.Lett., 37:L24808, doi:10.1029/2010GL045095.
Hearn, J. D., and Smith, G. D. (2004). A Chemical Ionization Mass Spectrom-etry Method for the Online Analysis of Organic Aerosols. Anal. Chem.,76:2820–2826.
Heaton, K. J., Sleighter, R. L., Hatcher, P. G., Hall, W. A., and Johnston, M. V.(2009). Composition Domains in Monoterpene Secondary Organic Aerosol.Environ. Sci. Technol., 43:7797–7802.
Holzinger, R., Kasper-Giebl, A., Staudinger, M., Schauer, G., and Rockmann,T. (2010). Analysis of the Chemical Composition of Organic Aerosolat the Mt. Sonnblick Observatory Using a Novel High Mass ResolutionThermal-Desorption Proton-Transfer-Reaction Mass-Spectrometer (hr-TD-PTR-MS). Atmos. Chem. Phys., 10:10111–10128.
Jimenez, J. L., Canagaratna, M. R., Donahue, N. M., Prevot, A. S. H., Zhang, Q.,Kroll, J. H., et al. (2009). Evolution of Organic Aerosols in the Atmosphere.Science, 326:1525–1529.
Jordan, A., Haidacher, S., Hanel, G., Hartungen, E., Mark, L., Seehauser, H.,et al. (2009). A High Resolution and Highsensitivity Proton-Transfer Time-of-Flight Mass Spectrometer (PTR-TOF-MS). Internation Journal of MassSpectrometry, 286:122–128.
Junninen, H., Ehn, M., Petaja, T., Luosujarvi, L., Kotiaho, T., Kostiainen, R.,et al. (2010). A High-Resolution Mass Spectrometer to Measure Atmo-spheric Ion Composition. Atmos. Meas. Tech., 3:1039–1053.
Kawamura, K., and Sakaguchi, F. (1999). Molecular Distributions of Wa-ter Soluble Dicarboxylic Acids in Marine Aerosols Over the PacificOcean Including Tropics. Journal of Geophysical Research-Atmospheres,104:3501–3509.
Kimmel, J. R., Farmer, D. K., Cubison, M. J., Sueper, D., Tanner, C., Nemitz,E., et al. (2010). Real-Time Aerosol Mass Spectrometry with MillisecondResolution. Int. J. Mass Spectrom., 303:15–26.
Koop, T., Bookhold, J., Shiraiwa, M., and Poschl, U. (2011). Glass Transitionand Phase State of Organic Compounds: Dependency on Molecular Prop-erties and Implication for Secondary Organic Aerosols in the Atmosphere.Phys. Chem. Chem. Phys., 13:19238–19255.
Kroll, J. H., Donahue, N. M., Jimenez, J. L., Kessler, S. H., Canagaratna,M. R., Wilson, K. R., et al. (2011). Carbon Oxidation State as a Metric forDescribing the Chemistry of Atmospheric Orgnaic Aerosol. Nature Chem-istry, 3:133–139.
Li, M., McDow, S. R., Tollerud, D. J., and Mazurek, M. A. (2006). SeasonalAbundance of Organic Molecular Markers in Urban Particulate Matter fromPhiladelphia, PA. Atmos. Environ., 40:2260–2273.
Lim, Y. B., and Ziemann, P. J. (2009). Chemistry and Secondary Organic AerosolFormation From OH Radical-Initiated Reactions of Linear, Branched, andCyclic Alkanes in the Presence of NOx. Aerosol Sci. Technol., 43:604–619.
Lindinger, W., Hansel, A., and Jordan, A. (1998). On-Line Monitoring ofVolatile Organic Compounds at pptv Levels by Means of Proton-Transfer-Reaction Mass Spectrometry (PTR-MS); Medical Applications, Food Con-trol, and Environmental Research (1998). Int. J. Mass. Spectrom. Ion Proc.,173:191–241.
Mochida, M., Kitamori, Y., Kawamura, K., Nojiri, Y., and Suzuki, K. (2002).Fatty Acids in the Marine Atmosphere: Factors Governing Their Concen-trations and Evaluations of Organic Films on Sea-Salt Particles. J. Geophys.Res., 107:4325–4334.
Mochida, M., Miyakawa, T., Takegawa, N., Morino, Y., Kawamura, K., andKondo, Y. (2008). Significant Alteration in the Hygroscopic Properties ofUrban Aerosol Particles by the Secondary Formation of Organics. Geophys.Res. Lett., 35:L02804, doi:10.1029/2007GL031310.
Murphy, D. M., and Thomson, D. S. (1995). Laser Ionization Mass Spectroscopyof Single Aerosol Particles. Aerosol Sci. Technol., 22:237–249.
Nash, D. G., Baer, T., and Johnston, M. V. (2006). Aerosol Mass Spectrometry:An Introductory Review. Int. J. Mass Spectrom., 258:2–12.
Ng, N. L., Canagaratna, M. R., Jimenez, J. L., Chhabra, P. S., Seinfeld,J. H., and Worsnop, D. R. (2011). Changes in Organic Aerosol Compo-sition with Aging Inferred from Aerosol Mass Spectra. Atmos. Chem. Phys.,11:6465–6474.
Novakov, T., and Penner, J. E. (1993). Large Contribution of Organic Aerosolsto Cloud-Condensation Nuclei Concentrations. Nature, 365:823–826.
Oktem, B., Tolocka, M. P., and Johnston, M. V. (2004). On-Line Analysis ofOrganic Components in Fine and Ultrafine Particles by PhotoionizationAerosol Mass Spectrometry. Anal. Chem., 76:253–261.
Paulot, F., Crounse, J. D., Kjaergaard, H. G., Kurten, A. St., Clair, J. M.,Seinfeld, J. H., et al. (2009). Unexpected Epoxide Formation in the Gas-Phase Photooxidation of Isoprene. Science, 325:730–733.
Perraud, V., Burns, E. A., Ezell, M. J., Johnson, S. N., Yu, Y., Alexander, M. L.,et al. (2012). Nonequilibrium Atmomspheric Secondary Organic AerosolFormation and Growth. PNAS, 109:2836–2841.
Pope, A. C., Ezzati, M., and Dockery, D. W. (2009). Fine-Particulate Air Pol-lution and Life Expectancy in the United States. N. Engl. J. Med., 360:376–386.
Dow
nloa
ded
by [
Uni
vers
ity o
f C
olor
ado
at B
ould
er L
ibra
ries
] at
07:
08 0
2 A
ugus
t 201
2
MOVI-HRTOF-CIMS FOR ANALYSIS OF ORGANIC SPECIES 1327
Prather, K. A., Nordmeyer, T., and Salt, K. (1994). Real-Time Characterizationof Individual Aerosol Particles Using Time-of-Flight Mass Spectrometry.Anal. Chem., 66:1403–1407.
Quinn, P. K., Bates, T. S., Baynard, T., Clarke, A. D., Onasch, T. B., Wang, W.,et al. (2005). Impact of Particulate Organic Matter on the Relative HumidityDependence of Light Scattering: A Simplified Parameterization. Geophys.Res. Lett., 32:L22809, doi:10.1029/2005GL024322.
Reinhardt, A., Emmenegger, C., Gerrits, B., Panse, C., Dommen, J., Bal-tensperger, U., et al. (2007). Ultrahigh Mass Resolution and Accurate MassMeasurements as a Tool to Characterize Oligomers in Secondary OrganicAerosols. Anal. Chem., 79:4074–4082.
Roberts, J. M., Veres, P., Werneke, C., Neuman, J. A., Washenfelder, R., Brown,S. S., et al. (2010). Measurement of HONO, HNCO, and Other InorganicAcids by Negative-Ion Proton-Transfer Chemical-Ionization Mass Spec-trometry (NI-PT-CIMS): Application to Biomass Burning Emissions. At-mos. Meas. Tech., 3:981–990.
Roberts, J. M., Veres, P. R., Cochran, A. K., Warneke, C., Burling, I. R., Yokel-son, R. J., et al. (2011). Isocyanic Acid in the Atmosphere and its PossibleLink to Smoke-related Health Effects. PNAS, 108:8966–8971.
Robinson, A. L., Donahue, N. M., Shrivastava, M. K., Weitkamp, E. A.,Sage, A. M., Grieshop, A. P., et al. (2007). Rethinking Organic Aerosols:Semivolatile Emissions and Photochemical Aging. Science, 315:1259–1262.
Sorooshian, A., Feingold, G., Lebsock, M. D., Jiang, H., and Stephens, G.(2009). On the Precipitation Susceptibility of Clouds to Aerosol Perturba-tions. Geophys. Res. Lett., 36:L13803, doi:10.1029/2009GL038993.
Spanel, P., and Smith, D. (1995). Reactions of Hydrated Hydronium Ions andHydrated Hydroxide Ions with Some Hydrocarbons and Oxygen-BearingOrganic Molecules. J. Phys. Chem. A, 99:15551–15556.
Sullivan, R. C., and Prather, K. A. (2005). Recent Advances in OurUnderstanding of Atmospheric Chemistry and Climate Made Possibleby On-Line Aerosol Analysis Instrumentation. Anal. Chem., 77:3861–3886.
Tolocka, M. P., Jang, M., Ginter, M. J., Cox, F. J., Kamens, R. M., and Johnston,M. V. (2004). Formation of Oligomers in Secondary Organic Aerosols.Environ. Sci. Technol., 38:1428–1434.
Vaden, T. D., Imre, D., Beranek, J., Shrivastava, M., and Zelenyuk, A. (2011).Evaporation Kinetics and Phase of Laboratory and Ambient SecondaryOrgnaic Aerosol. PNAS, 108:2190–2195.
Vaden, T. D., Song, C., Zaveri, R. A., Imre, D., and Zelenyuk, A. (2010).Morphology of Mixed Primary and Secondary Organic Particles and theAdsorption of Spectator Organic Gases During Aerosol Formation. PNAS,107:6658–6663.
Veres, P. R., Roberts, J. M., Cochran, A. K., Gillman, J. B., Kuster, W.C., Holloway, J. S., et al. (2011). Evidence of Rapid Production of Or-ganic Acids in an Urban Air Mass. Geophys. Res. Lett., 38:L17807,doi:10.1029/2011GL048420.
Veres, P. R., Roberts, J. M., Warneke, C., Welsh-Bon, D., Zahniser, M., Herndon,S., et al. (2008). Development of Negative-Ion Proton-Transfer Chemical-Ionization Mass Spectrometry (NI-PT-CIMS) for the Measurement of Gas-Phase Organic Acids in the Atmosphere. Int. J. Mass Spectrom., 274:48–55.
Virtanen, A., Joutsensaari, J., Koop, T., Kannosto, J., Yli-Pirila, P., Leskinen,J., et al. (2010). An Amorphous Solid State of Biogenic Secondary OrganicAerosol Particles. Nature, 467:824–827.
Walser, M. L., Desyaterik, Y., Laskin, J., Laskin, A., and Nizkorodov, S. A.(2008). High-Resolution Mass Spectrometric Analysis of Secondary Or-ganic Aerosol Produced by Ozonation of Limonene. Phys. Chem. Chem.Phys., 10:1009–1022.
Yatavelli, R. L. N., and Thornton, J. A. (2010). Particulate Organic Matter De-tection Using a Micro-Orifice Volatilization Impactor Coupled to a Chem-ical Ionization Mass Spectrometer (MOVI-CIMS). Aerosol Sci. Technol.,44:61–74.
Yu, J., Crocker III, D. R., Griffin, R. J., Flagan, R. C., and Seinfeld, J. H.(1999). Gas-Phase Ozone Oxidation of Monoterpenes: Gaseous and Partic-ulate Products. J. Atmos. Chem., 34:207–258.
Zelenyuk, A., and Imre, D. (2005). Single Particle Laser Ablation Time-of-Flight Mass Spectrometer: An Introduction to SPLAT. Aerosol Sci. Technol.,39:554–568.
Zhang, Q., Jimenez, J. L., Canagaratna, M. R., Ulbrich, I. M., Ng, N. L.,Worsnop, D. R., et al. (2011). Understanding Atmospheric Organic AerosolsVia Factor Analysis of Aerosol Mass Spectrometry: A Review. Analyticaland Bioanalytical Chemistry, 401:3045–3067.
Dow
nloa
ded
by [
Uni
vers
ity o
f C
olor
ado
at B
ould
er L
ibra
ries
] at
07:
08 0
2 A
ugus
t 201
2
1
Supplemental Information for “A Chemical Ionization High-Resolution Time-of-
Flight Mass Spectrometer Coupled to a Micro Orifice Volatilization Impactor
(MOVI-HRToF-CIMS) for Analysis of Gas and Particle-Phase Organic Species”
Reddy, L. N.Yatavelli,1,* Felipe Lopez-Hilfiker,1 Julia D. Wargo,1 Joel R. Kimmel,2,3 Michael J.
Cubison,3 Timothy H. Bertram,4 Jose L. Jimenez,5 Marc Gonin,3 Douglas R. Worsnop,2,6 Joel A.
Thornton,1
[1] Department of Atmospheric Sciences, University of Washington, Seattle WA 98195, USA
[2] Aerodyne Research Inc, Billerica, MA 01821, USA
[3] TOFWERK AG, 3600 Thun, Switzerland
[4] Department of Chemistry and Biochemistry, University of California, San Diego, CA 92093,
USA
[5] Cooperative Institute for Research in Environmental Sciences (CIRES) and Department of
Chemistry and Biochemistry, University of Colorado, Boulder, CO, 80309, USA
[6] Department of Physics, University of Helsinki, Helsinki 00014, Finland
[*] Now at Cooperative Institute for Research in Environmental Sciences (CIRES) and
Department of Chemistry and Biochemistry, University of Colorado, Boulder, CO, 80309, USA
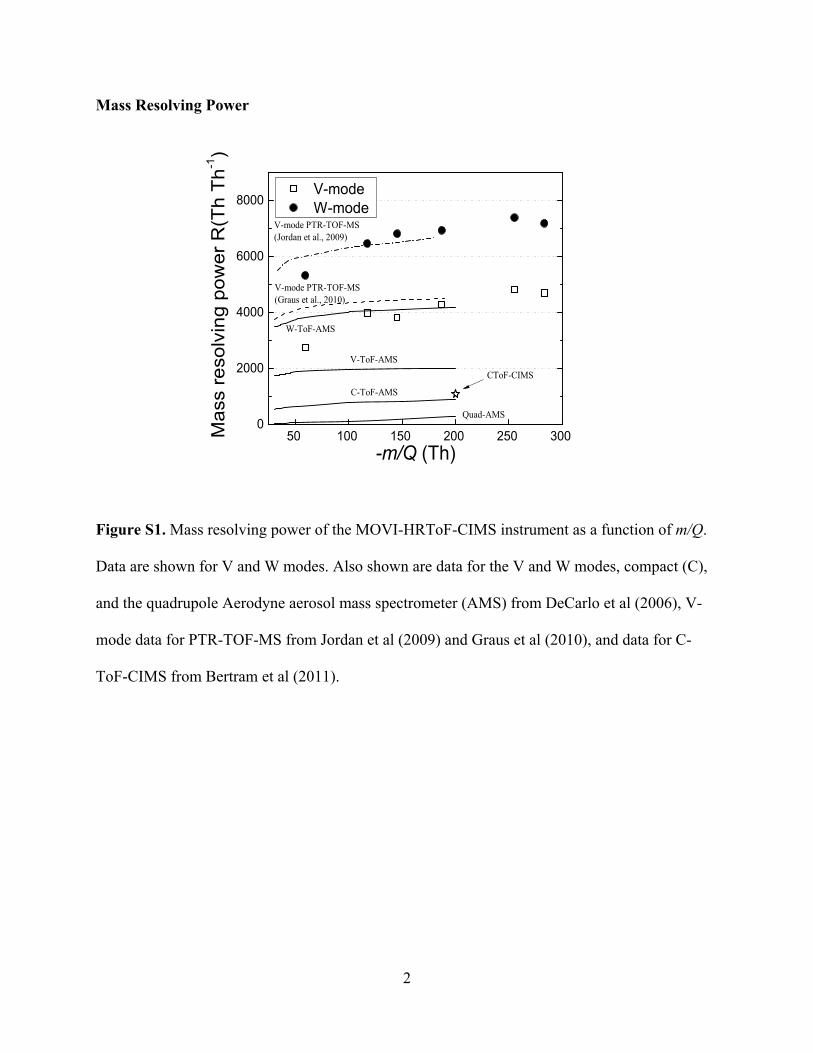
2
Mass Resolving Power
Figure S1. Mass resolving power of the MOVI-HRToF-CIMS instrument as a function of m/Q.
Data are shown for V and W modes. Also shown are data for the V and W modes, compact (C),
and the quadrupole Aerodyne aerosol mass spectrometer (AMS) from DeCarlo et al (2006), V-
mode data for PTR-TOF-MS from Jordan et al (2009) and Graus et al (2010), and data for C-
ToF-CIMS from Bertram et al (2011).
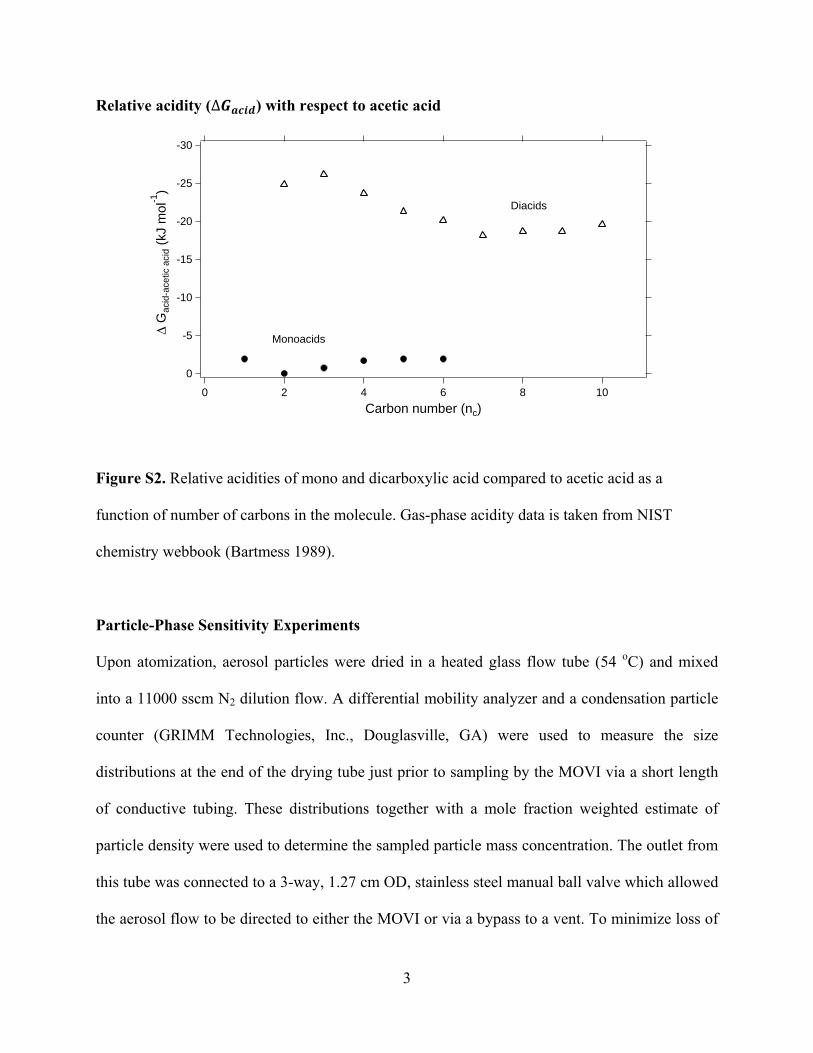
3
Relative acidity (∆ ) with respect to acetic acid
Figure S2. Relative acidities of mono and dicarboxylic acid compared to acetic acid as a
function of number of carbons in the molecule. Gas-phase acidity data is taken from NIST
chemistry webbook (Bartmess 1989).
Particle-Phase Sensitivity Experiments
Upon atomization, aerosol particles were dried in a heated glass flow tube (54 oC) and mixed
into a 11000 sscm N2 dilution flow. A differential mobility analyzer and a condensation particle
counter (GRIMM Technologies, Inc., Douglasville, GA) were used to measure the size
distributions at the end of the drying tube just prior to sampling by the MOVI via a short length
of conductive tubing. These distributions together with a mole fraction weighted estimate of
particle density were used to determine the sampled particle mass concentration. The outlet from
this tube was connected to a 3-way, 1.27 cm OD, stainless steel manual ball valve which allowed
the aerosol flow to be directed to either the MOVI or via a bypass to a vent. To minimize loss of
-30
-25
-20
-15
-10
-5
0
Δ G
acid
-ace
tic a
cid
(kJ
mol
-1)
1086420
Carbon number (nc)
Diacids
Monoacids

4
aerosol particles in the transfer lines, only 1.27 cm OD stainless steel and silicon conductive
tubing were used for particle transfer. To change the particle mass collected, the sample time was
varied from 5 to 180 s. Variation in the mass concentration was calculated to be within 5% from
one scan to the next. The volume weighted mean mobility diameter was dm = 120 nm (~
aerodynamic diameter da = 140 nm) and the geometric mean standard deviation was σg = 2.8 nm.
Assuming an average density of 1.23 g cm-3, the average mass concentration was calculated to be
approximately 31 µg m-3. The density of TA was assumed to be equal to that of citric acid (1.665
g cm-3).
α-pinene Ozonolysis Experiment
The entrained aerosol flow reactor used here is similar to that used previously in this lab and
described in detail by Bertram et al (2009). Briefly, the flow reactor is a 90 cm long, 15 cm ID
stainless steel tube with 5 cm deep aluminum caps on both ends. The caps have ports with
Swagelok fittings to introduce effluent flows tangential to flow direction. The interior walls of
the flow reactor and the caps are coated with halocarbon wax (Series 1500 inert wax, Halocarbon
Products Corp., River Edge, NJ) to minimize particle wall losses and wall interactions. Outside
of the flow reactor is wrapped in 1” polyethylene foam to minimize effects due to fluctuations in
room temperature. For a flow of 2000 sccm, the residence time in the flow reactor is calculated
to be 8 minutes.
Hydrocarbon (α-pinene, 98% Arcos organics) flow is generated by bubbling 5 sccm of
UHP N2 through α-pinene filled glass flask maintained at –40 to -45 oC using a cold finger
(Thermo Scientific Instruments). The temperature was decreased to minimize the vapor pressure
of α-pinene and thus produce small concentration mixture. Ozone was produced using photolysis
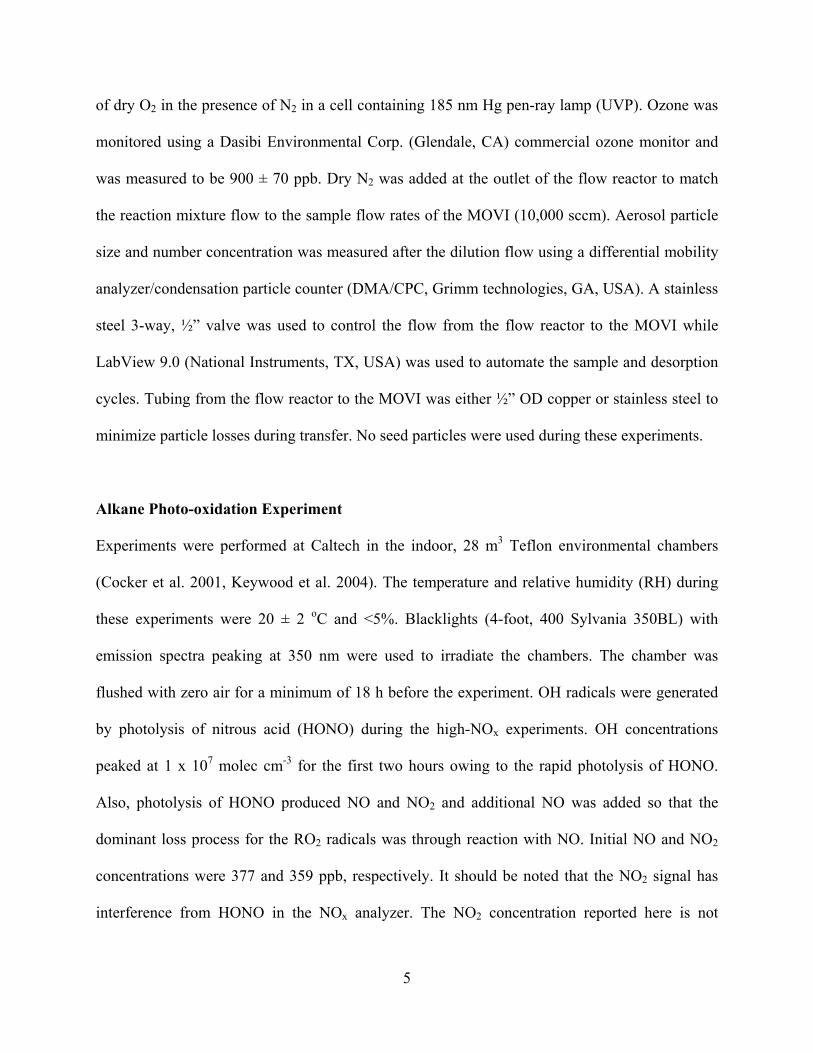
5
of dry O2 in the presence of N2 in a cell containing 185 nm Hg pen-ray lamp (UVP). Ozone was
monitored using a Dasibi Environmental Corp. (Glendale, CA) commercial ozone monitor and
was measured to be 900 ± 70 ppb. Dry N2 was added at the outlet of the flow reactor to match
the reaction mixture flow to the sample flow rates of the MOVI (10,000 sccm). Aerosol particle
size and number concentration was measured after the dilution flow using a differential mobility
analyzer/condensation particle counter (DMA/CPC, Grimm technologies, GA, USA). A stainless
steel 3-way, ½” valve was used to control the flow from the flow reactor to the MOVI while
LabView 9.0 (National Instruments, TX, USA) was used to automate the sample and desorption
cycles. Tubing from the flow reactor to the MOVI was either ½” OD copper or stainless steel to
minimize particle losses during transfer. No seed particles were used during these experiments.
Alkane Photo-oxidation Experiment
Experiments were performed at Caltech in the indoor, 28 m3 Teflon environmental chambers
(Cocker et al. 2001, Keywood et al. 2004). The temperature and relative humidity (RH) during
these experiments were 20 ± 2 oC and <5%. Blacklights (4-foot, 400 Sylvania 350BL) with
emission spectra peaking at 350 nm were used to irradiate the chambers. The chamber was
flushed with zero air for a minimum of 18 h before the experiment. OH radicals were generated
by photolysis of nitrous acid (HONO) during the high-NOx experiments. OH concentrations
peaked at 1 x 10⁷ molec cm-3 for the first two hours owing to the rapid photolysis of HONO.
Also, photolysis of HONO produced NO and NO2 and additional NO was added so that the
dominant loss process for the RO2 radicals was through reaction with NO. Initial NO and NO2
concentrations were 377 and 359 ppb, respectively. It should be noted that the NO2 signal has
interference from HONO in the NOx analyzer. The NO2 concentration reported here is not
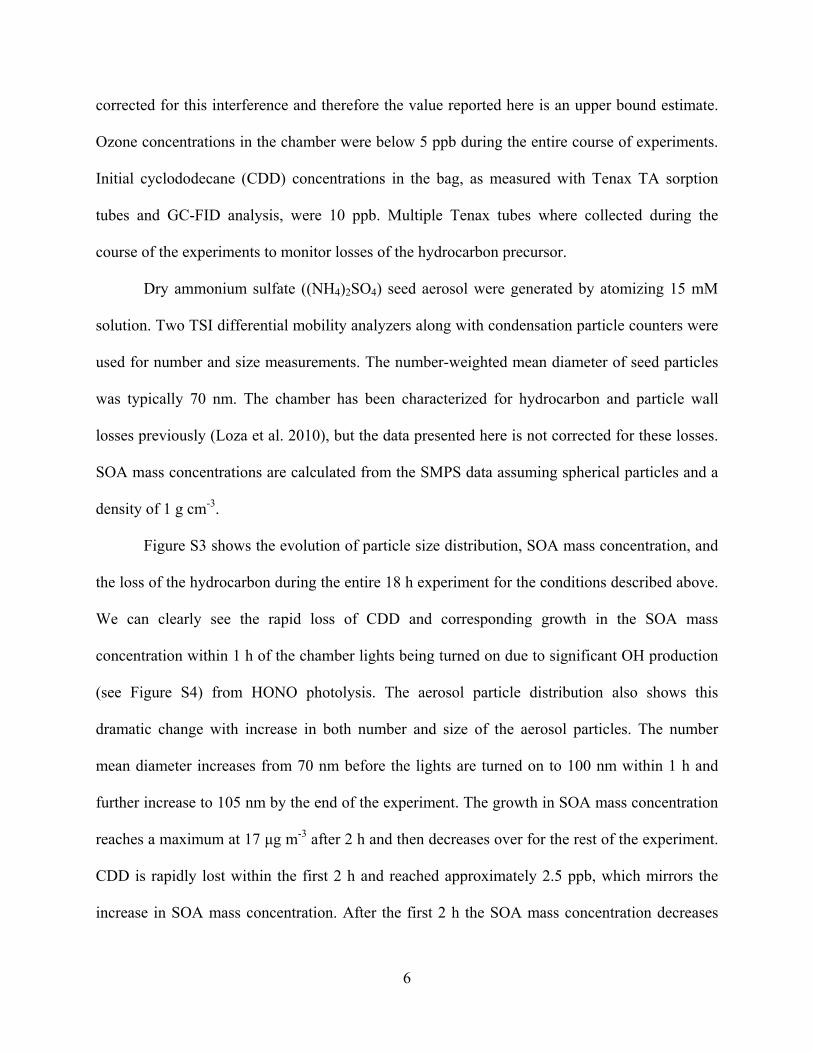
6
corrected for this interference and therefore the value reported here is an upper bound estimate.
Ozone concentrations in the chamber were below 5 ppb during the entire course of experiments.
Initial cyclododecane (CDD) concentrations in the bag, as measured with Tenax TA sorption
tubes and GC-FID analysis, were 10 ppb. Multiple Tenax tubes where collected during the
course of the experiments to monitor losses of the hydrocarbon precursor.
Dry ammonium sulfate ((NH4)2SO4) seed aerosol were generated by atomizing 15 mM
solution. Two TSI differential mobility analyzers along with condensation particle counters were
used for number and size measurements. The number-weighted mean diameter of seed particles
was typically 70 nm. The chamber has been characterized for hydrocarbon and particle wall
losses previously (Loza et al. 2010), but the data presented here is not corrected for these losses.
SOA mass concentrations are calculated from the SMPS data assuming spherical particles and a
density of 1 g cm-3.
Figure S3 shows the evolution of particle size distribution, SOA mass concentration, and
the loss of the hydrocarbon during the entire 18 h experiment for the conditions described above.
We can clearly see the rapid loss of CDD and corresponding growth in the SOA mass
concentration within 1 h of the chamber lights being turned on due to significant OH production
(see Figure S4) from HONO photolysis. The aerosol particle distribution also shows this
dramatic change with increase in both number and size of the aerosol particles. The number
mean diameter increases from 70 nm before the lights are turned on to 100 nm within 1 h and
further increase to 105 nm by the end of the experiment. The growth in SOA mass concentration
reaches a maximum at 17 μg m-3 after 2 h and then decreases over for the rest of the experiment.
CDD is rapidly lost within the first 2 h and reached approximately 2.5 ppb, which mirrors the
increase in SOA mass concentration. After the first 2 h the SOA mass concentration decreases
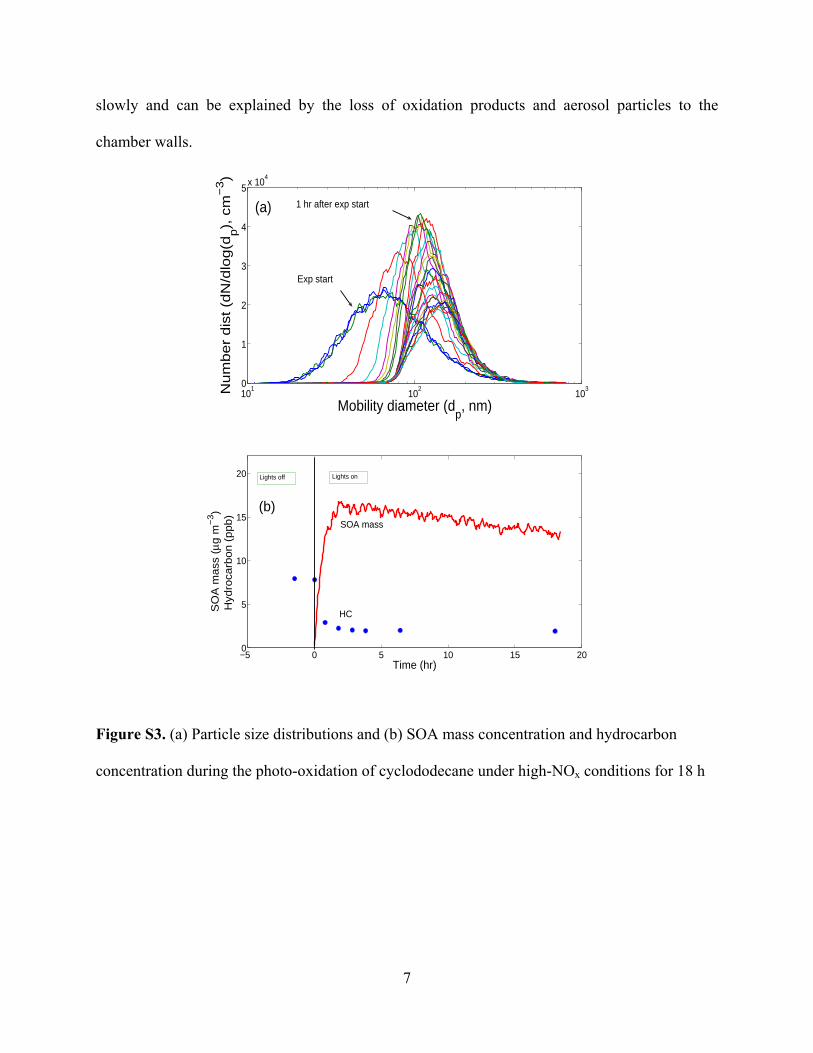
7
slowly and can be explained by the loss of oxidation products and aerosol particles to the
chamber walls.
Figure S3. (a) Particle size distributions and (b) SOA mass concentration and hydrocarbon
concentration during the photo-oxidation of cyclododecane under high-NOx conditions for 18 h
101
102
103
0
1
2
3
4
5x 10
4
Mobility diameter (dp, nm)
Nu
mb
er
dis
t (d
N/d
log
(dp),
cm
−3)
Exp start
1 hr after exp start(a)
−5 0 5 10 15 200
5
10
15
20
Time (hr)
SO
A m
ass
(μg
m−
3)
Hyd
roca
rbo
n (
pp
b)
SOA mass
HC
Lights off Lights on
(b)
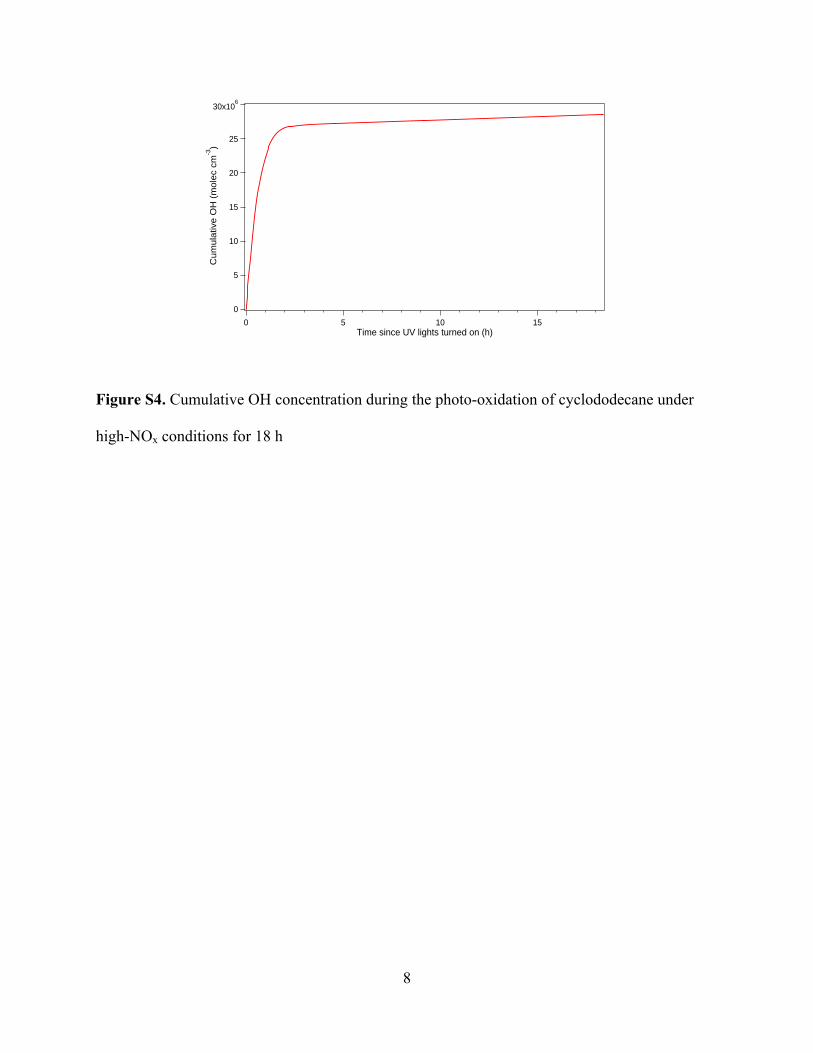
8
Figure S4. Cumulative OH concentration during the photo-oxidation of cyclododecane under
high-NOx conditions for 18 h
30x106
25
20
15
10
5
0
Cum
ula
tive O
H (
mole
c cm
-3)
151050Time since UV lights turned on (h)

9
REFERENCES
Bartmess, J. E. (1989). Gas-phase equilibrium affinity scales and chemical ionization mass
spectrometry. Mass. Spectrom. Rev. 8: 297-343.
Bertram, T. H., Kimmel, J. R., Crisp, T. A., Ryder, O. S., Yatavelli, R. L. N., Thornton, J. A.,
Cubison, M. J., Gonin, M. and Worsnop, D. R. (2011). A field-deployable, chemical ionization
time-of-flight mass spectrometer. Atmos. Meas. Tech. 4: 1471-1479.
Bertram, T. H., Thornton, J. A. and Riedel, T. P. (2009). An Experimental Technique for the
Direct Measurement of N2O5 Reactivity on Ambient Particles. Atmos. Meas. Tech. 2: 231-242.
Cocker, D. R., Flagan, R. C. and Seinfeld, J. H. (2001). State-of-the-art chamber facility for
studying atmospheric aerosol chemistry. Environ. Sci. Technol. 35: 2594-2601.
DeCarlo, P. F., Kimmel, J. R., Trimborn, A., Northway, M. J., Jayne, J. T., Aiken, A. C., Gonin,
M., Fuhrer, K., Horvath, T., Docherty, K. S., Worsnop, D. R. and Jimenez, J. L. (2006). Field-
deployable, high-resolution, time-of-flight aerosol mass spectrometer. Anal. Chem. 78: 8281-
8289.
Graus, M., Muller, M. and Hansel, A. (2010). High resolution PTR-TOF: Quantification and
formula confirmation of VOC in real time. J. Am. Soc. Mass Spectrom. 21: 1037-1044.
Jordan, A., Haidacher, S., Hanel, G., Hartungen, E., Mark, L., Seehauser, H., Schottkowsky, R.,
Sulzer, P. and Mark, T. D. (2009). A high resolution and highsensitivity proton-transfer time-of-
flight mass spectrometer (PTR-TOF-MS). Internation Journal of Mass Spectrometry 286: 122-
128.
Keywood, M. D., Varutbangkul, V., Bahreini, R., Flagan, R. C. and Seinfeld, J. H. (2004).
Secondary organic aerosol formation from the ozonolysis of cycloalkenes and related
compounds. Environ. Sci. Technol. 28: 4157-4164.

10
Loza, C. L., Chan, A. W. H., Galloway, M. M., Keutsch, F. N., Flagan, R. C. and Seinfeld, J. H.
(2010). Characterization of vapor wall loss in laboratory chambers. Environ. Sci. Technol. 44:
5074-5078.
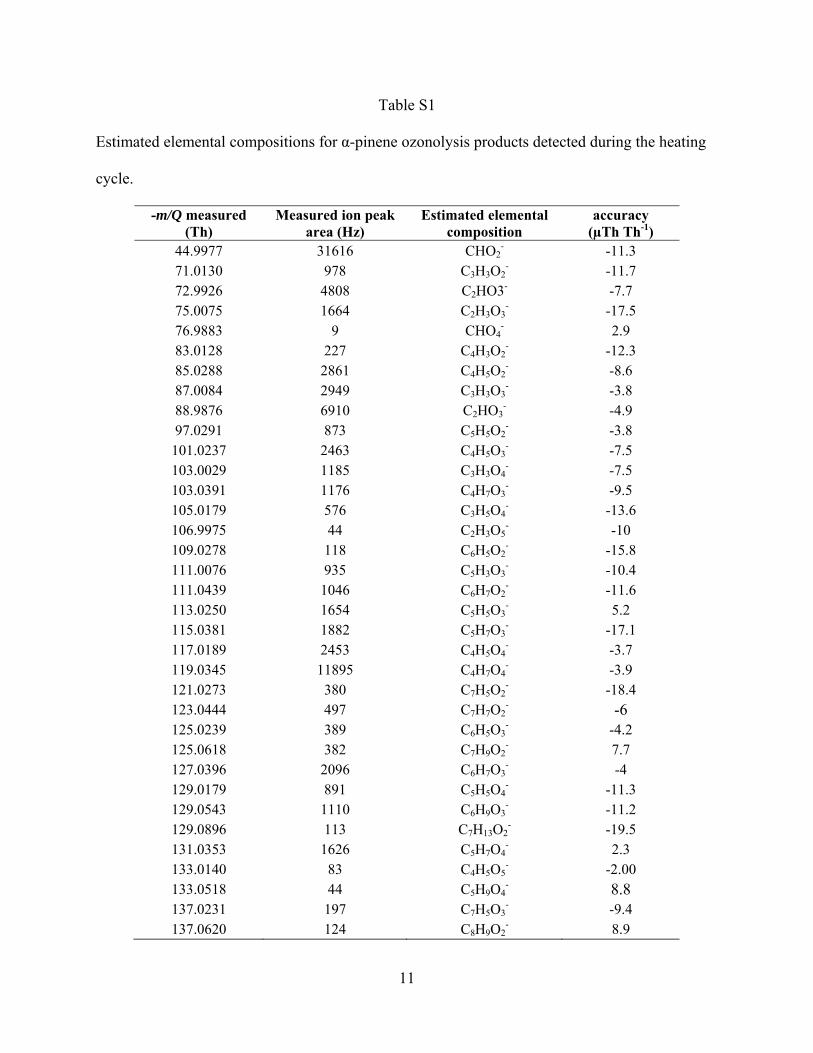
11
Table S1
Estimated elemental compositions for α-pinene ozonolysis products detected during the heating
cycle.
-m/Q measured (Th)
Measured ion peak area (Hz)
Estimated elemental composition
accuracy (µTh Th-1)
44.9977 31616 CHO2- -11.3
71.0130 978 C3H3O2- -11.7
72.9926 4808 C2HO3- -7.7 75.0075 1664 C2H3O3
- -17.5 76.9883 9 CHO4
- 2.9 83.0128 227 C4H3O2
- -12.3 85.0288 2861 C4H5O2
- -8.6 87.0084 2949 C3H3O3
- -3.8 88.9876 6910 C2HO3
- -4.9 97.0291 873 C5H5O2
- -3.8 101.0237 2463 C4H5O3
- -7.5 103.0029 1185 C3H3O4
- -7.5 103.0391 1176 C4H7O3
- -9.5 105.0179 576 C3H5O4
- -13.6 106.9975 44 C2H3O5
- -10 109.0278 118 C6H5O2
- -15.8 111.0076 935 C5H3O3
- -10.4 111.0439 1046 C6H7O2
- -11.6 113.0250 1654 C5H5O3
- 5.2 115.0381 1882 C5H7O3
- -17.1 117.0189 2453 C4H5O4
- -3.7 119.0345 11895 C4H7O4
- -3.9 121.0273 380 C7H5O2
- -18.4 123.0444 497 C7H7O2
- -6 125.0239 389 C6H5O3
- -4.2 125.0618 382 C7H9O2
- 7.7 127.0396 2096 C6H7O3
- -4 129.0179 891 C5H5O4
- -11.3 129.0543 1110 C6H9O3
- -11.2 129.0896 113 C7H13O2
- -19.5 131.0353 1626 C5H7O4
- 2.3 133.0140 83 C4H5O5
- -2.00 133.0518 44 C5H9O4
- 8.8 137.0231 197 C7H5O3
- -9.4 137.0620 124 C8H9O2
- 8.9
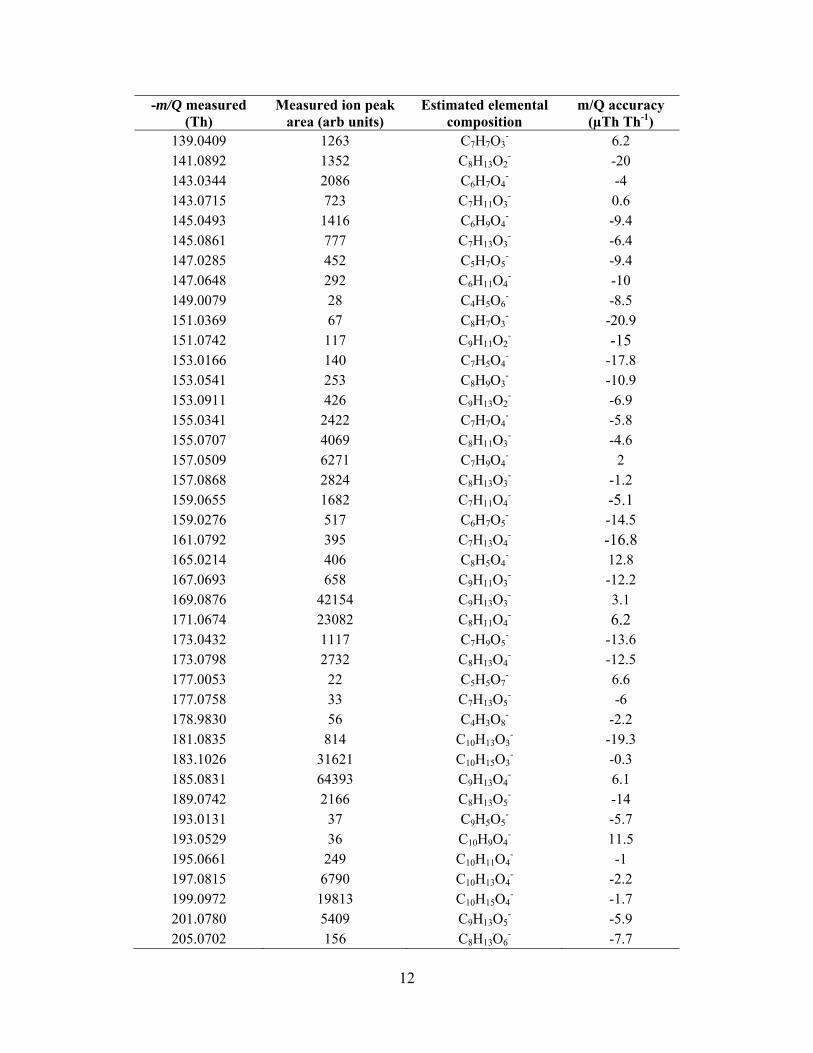
12
-m/Q measured (Th)
Measured ion peak area (arb units)
Estimated elemental composition
m/Q accuracy (µTh Th-1)
139.0409 1263 C7H7O3- 6.2
141.0892 1352 C8H13O2- -20
143.0344 2086 C6H7O4- -4
143.0715 723 C7H11O3- 0.6
145.0493 1416 C6H9O4- -9.4
145.0861 777 C7H13O3- -6.4
147.0285 452 C5H7O5- -9.4
147.0648 292 C6H11O4- -10
149.0079 28 C4H5O6- -8.5
151.0369 67 C8H7O3- -20.9
151.0742 117 C9H11O2- -15
153.0166 140 C7H5O4- -17.8
153.0541 253 C8H9O3- -10.9
153.0911 426 C9H13O2- -6.9
155.0341 2422 C7H7O4- -5.8
155.0707 4069 C8H11O3- -4.6
157.0509 6271 C7H9O4- 2
157.0868 2824 C8H13O3- -1.2
159.0655 1682 C7H11O4- -5.1
159.0276 517 C6H7O5- -14.5
161.0792 395 C7H13O4- -16.8
165.0214 406 C8H5O4- 12.8
167.0693 658 C9H11O3- -12.2
169.0876 42154 C9H13O3- 3.1
171.0674 23082 C8H11O4- 6.2
173.0432 1117 C7H9O5- -13.6
173.0798 2732 C8H13O4- -12.5
177.0053 22 C5H5O7- 6.6
177.0758 33 C7H13O5- -6
178.9830 56 C4H3O8- -2.2
181.0835 814 C10H13O3- -19.3
183.1026 31621 C10H15O3- -0.3
185.0831 64393 C9H13O4- 6.1
189.0742 2166 C8H13O5- -14
193.0131 37 C9H5O5- -5.7
193.0529 36 C10H9O4- 11.5
195.0661 249 C10H11O4- -1
197.0815 6790 C10H13O4- -2.2
199.0972 19813 C10H15O4- -1.7
201.0780 5409 C9H13O5- -5.9
205.0702 156 C8H13O6- -7.7
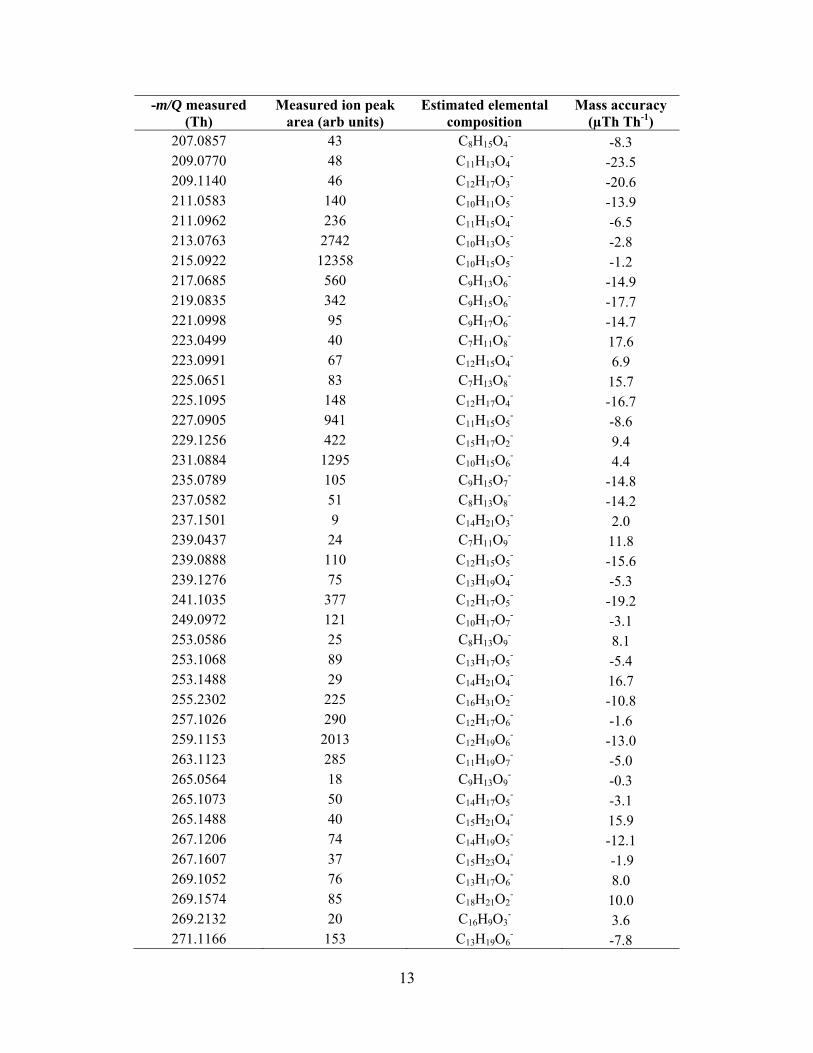
13
-m/Q measured (Th)
Measured ion peak area (arb units)
Estimated elemental composition
Mass accuracy (µTh Th-1)
207.0857 43 C8H15O4- -8.3
209.0770 48 C11H13O4- -23.5
209.1140 46 C12H17O3- -20.6
211.0583 140 C10H11O5- -13.9
211.0962 236 C11H15O4- -6.5
213.0763 2742 C10H13O5- -2.8
215.0922 12358 C10H15O5- -1.2
217.0685 560 C9H13O6- -14.9
219.0835 342 C9H15O6- -17.7
221.0998 95 C9H17O6- -14.7
223.0499 40 C7H11O8- 17.6
223.0991 67 C12H15O4- 6.9
225.0651 83 C7H13O8- 15.7
225.1095 148 C12H17O4- -16.7
227.0905 941 C11H15O5- -8.6
229.1256 422 C15H17O2- 9.4
231.0884 1295 C10H15O6- 4.4
235.0789 105 C9H15O7- -14.8
237.0582 51 C8H13O8- -14.2
237.1501 9 C14H21O3- 2.0
239.0437 24 C7H11O9- 11.8
239.0888 110 C12H15O5- -15.6
239.1276 75 C13H19O4- -5.3
241.1035 377 C12H17O5- -19.2
249.0972 121 C10H17O7- -3.1
253.0586 25 C8H13O9- 8.1
253.1068 89 C13H17O5- -5.4
253.1488 29 C14H21O4- 16.7
255.2302 225 C16H31O2- -10.8
257.1026 290 C12H17O6- -1.6
259.1153 2013 C12H19O6- -13.0
263.1123 285 C11H19O7- -5.0
265.0564 18 C9H13O9- -0.3
265.1073 50 C14H17O5- -3.1
265.1488 40 C15H21O4- 15.9
267.1206 74 C14H19O5- -12.1
267.1607 37 C15H23O4- -1.9
269.1052 76 C13H17O6- 8.0
269.1574 85 C18H21O2- 10.0
269.2132 20 C16H9O3- 3.6
271.1166 153 C13H19O6- -7.8

14
-m/Q measured (Th)
Measured ion peak area (arb units)
Estimated elemental composition
Mass accuracy (µTh Th-1)
273.1030 243 C12H17O7- 18.5
275.1099 719 C12H19O7- -13.7
281.0988 36 C14H17O6- -15.1
283.1187 61 C14H19O6- 0.0
283.1561 51 C15H23O5- 3.4
285.0994 82 C13H17O7- 4.8
287.1163 136 C13H19O7- 9.3
289.1128 173 C16H17O5- 16.1
291.1091 129 C12H19O8- 1.9
293.0837 31 C11H17O9- -14.1
293.1379 58 C16H21O5- -5.3
293.1796 32 C17H25O4- 12.7
295.1077 33 C11H19O9- 14.5
295.1607 68 C16H23O5- 18.8
301.1663 39 C15H25O6- 2.2
303.1048 100 C13H19O8- -12.5
305.0719 17 C15H13O7- 17.0
305.1186 67 C13H21O8- -18.2
305.1700 25 C18H25O4- -19.1
307.1818 90 C14H27O7- 18.2
309.0875 19 C11H19O10- 15.4
309.1504 68 C13H25O8- -16.4
311.1535 153 C16H23O6- 11.1
315.0774 30 C13H15O9- 16.8
315.1233 101 C18H19O5- -1.5
317.1278 121 C14H21O8- 11.3
319.0779 17 C16H15O7- -13.8
319.1846 60 C19H27O4- -21.5
321.1686 101 C18H25O5- -6.6
323.1720 145 C14H27O8- 2.7
325.1633 156 C17H25O6- -7.4
327.1585 199 C20H23O4- -5.1
329.1363 247 C19H21O5- -9.7
331.1362 152 C15H23O8- -11.0
333.1133 55 C14H21O9- -17.4
333.1699 41 C19H25O5- -2.5
335.1796 131 C19H27O5- -20.4
337.1886 137 C15H29O8- 5.2
339.1771 432 C18H27O6- -12.4
341.1624 294 C17H25O7- 5.3
343.1427 548 C16H23O8- 8.4

15
-m/Q measured (Th)
Measured ion peak area (arb units)
Estimated elemental composition
Mass accuracy (µTh Th-1)
347.1397 96 C15H23O9- 14.3
349.1107 21 C14H21O10- -9.6
349.1654 31 C19H25O6- -0.6
349.2065 20 C20H29O5- 12.7
351.1789 112 C19H27O6- -6.8
353.1922 693 C19H29O6- -13.6
355.1783 479 C18H27O7- 5.9
357.1561 753 C17H25O8- 1.8
359.1487 298 C20H23O6- -3.7
361.1463 170 C16H25O9- -11.3
363.1495 45 C19H23O7- 12.5
365.1186 14 C18H21O8- -15.3
365.1903 39 C20H29O6- -18.4
367.1999 398 C16H31O9- 6.8
369.1867 765 C19H29O7- -14.0
371.1700 780 C18H27O8- -3.1
373.1582 496 C21H25O6- -19.9
377.1519 52 C16H25O10- 17.3
379.1239 14 C15H23O11- -1.7
381.2146 271 C17H33O9- 4.2
383.1920 551 C16H31O10- -0.6
385.1810 821 C19H29O8- -15.1
387.1662 715 C18H27O9- 0.4
389.1655 243 C21H25O7- 12.6
391.1579 64 C17H27O10- -7.8
393.0964 4 C15H21O12- -18.9
393.1608 20 C20H25O8- 13.5
393.2193 6 C18H33O9- 15.9
395.1957 48 C17H31O10- 8.6
397.1875 235 C20H29O8- 1.8
399.1905 657 C16H31O11- 8.4
401.1794 513 C19H29O9- -5.7
403.1680 240 C18H27O10- 17.4
407.1692 20 C21H27O8- -4.9
411.1937 80 C17H31O11- 15.9
413.1829 229 C20H29O9- 2.9
415.1865 424 C16H31O12- 10.5
417.1783 211 C19H29O10- 4.1