economicsgpowell6.weebly.com/uploads/5/6/1/5/56150665/econ_department_final...illustrate a circular...
TRANSCRIPT

ECONOMICS UNIT TWO REVIEW
MICROECONOMICS

ECON DEPARTMENT FINAL EXAM
• Your Economics Departmental Final Exam is cumulative and will count as 5% of your
class grade.
• Following is our Review Schedule:
• Tuesday – we’ll review Unit One and Unit Two
• Wednesday – we’ll review Unit Three and Unit Four
• Thursday – we’ll review Unit Five and finish with a wrap-up game!

ECON DEPARTMENT FINAL EXAM
Econ Study CardsTo help you, you’ll create one Study Card per
unit.
• You can write as much as you want on each
index card – front and back
• They will help you study and prepare!
• Each Study Card will count for a classwork
grade – 25 points/Study Card
Your Name on each card Unit 1, 2, 3, 4 or 5

COMPLETE YOUR STUDY CARD AS YOU REVIEW!
• As you review each unit, capture key information on your Study Card.
• At the end of each unit review, there will be questions you have to answer.
• These will receive a grade, so take them seriously!
• Hint – everyone should make a 100% because you can go back and find the answer if you
don’t know it!

HERE’S YOUR TIMING
• First half of class (45 min.)
• 30-35 minutes – review the unit and capture important info on your index card
• 10-15 minutes – answer the review questions
• When you’re done, come show me your index card and I’ll give you the access code for the
next unit to review.
• Second half of class (45 min)
• 30-35 minutes – review the unit and capture important info on your index card
• 10-15 minutes – answer the review questions

UNIT TWO – MICROECONOMICSLEARNING STANDARD #1 OF 3
SSEMI1 Describe how households and businesses are interdependent and
interact through flows of goods, services, resources, and money.
a. Illustrate a circular flow diagram that includes the product market, the
resource (factor) market, households, and firms.
b. Explain the real flow of goods, services, resources, and money between
and among households and firms.

MICROECONOMICS
The economy is a complex area of study – sometimes economists like to look at the small
parts instead of the whole structure
“Zooming in” on the small units that make up the economy is called
microeconomics
The two basic units of microeconomics are:
Producers: those who make goods or provide services for others in the society
They own businesses that provide these outputs
Consumers: those who purchase goods and services
They make up households in the economy

WHY STUDY MICROECONOMICS?
This study can help you understand why consumers choose to buy the things they do and why
producers make the things they do
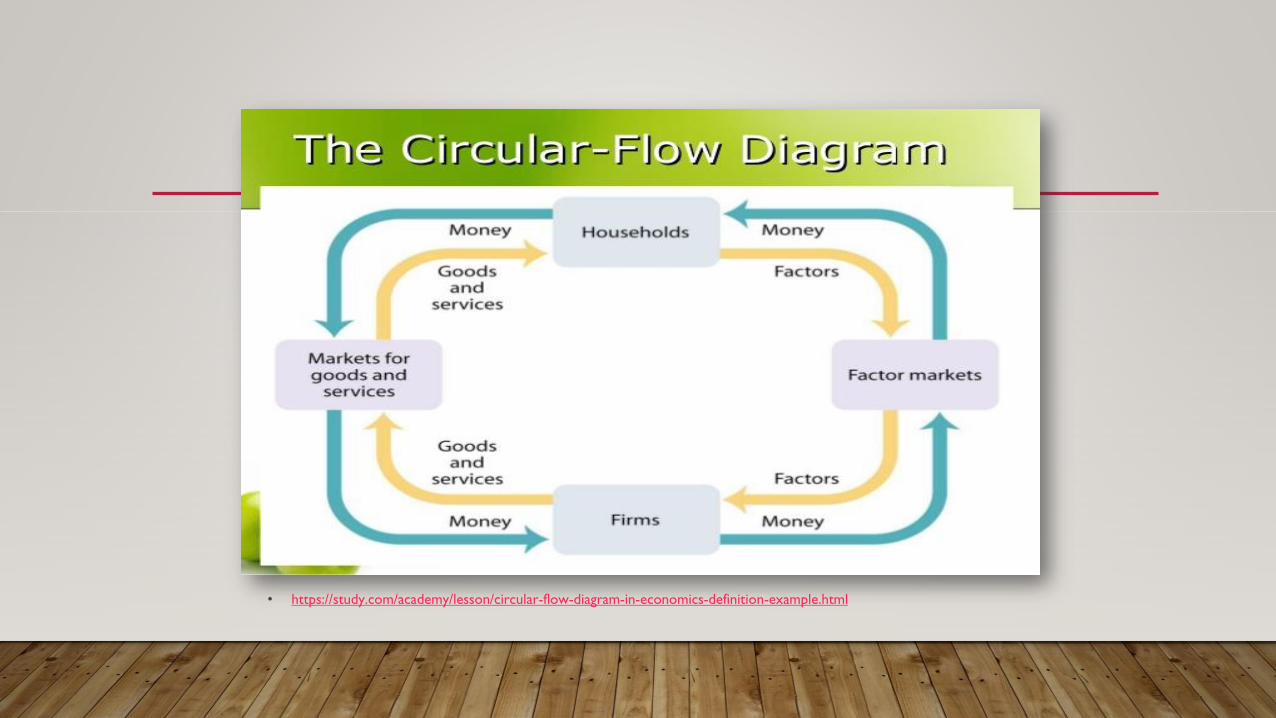
This relationship – between businesses and households – is described in the circular flow of economics
The circular flow shows a lot of things! :
That consumers and producers participate in voluntary exchange
That resources and goods flow throughout the economy from businesses to
households and then back again
That money flows from households to businesses and then back again

The Circular Flow of
Economics
Resource Markets
PRODUCT
MARKETS
Households Businesses
AROUND THE MARKET
Businesses and Households are only half of the circular flow diagram
The rest is made up of markets:
The Product Market is the part of the economy where businesses sell their goods andservices and consumers purchases those goods and services
This exchange is made possible with MONEY!
The Factor or Resource Market is the place where businesses buy the resources theyneed and consumers offer their labor as a resource to businesses
Remember the 4 Factors of Production: Land, Labor, Capital & Entrepreneurs
This exchange is also made possible with CAPITAL INVESTMENT (purchasing L, L & C) andWAGES (workers’ income)!
• https://study.com/academy/lesson/circular-flow-diagram-in-economics-definition-example.html

DIFFERENT WAYS TO VIEW THE SAME INFORMATION
• Since it’s circular, the elements can be viewed from different
perspectives.
It’s the same information!
It’s just that the Businesses/Firms and
Households are on the left and right of the
diagram (instead of the top and bottom).
So don’t be confused!

TWO CIRCLES GOING IN OPPOSITE DIRECTIONS
• 1. Factor/Product Circle
• Just start with the households >>>
• Households sell land, labor & capital in the
Factor Market
• Businesses use the factors of production to
create goods & services
• Businesses sell these goods and services to the
households in the Product Market.

CIRCLE OF MONEY
• Money Flow Circle (going in the opposite direction as the Factor/Product circle)
• Once again, start with the Households >>>
• Households buy the goods and services
• These purchases become revenue for the businesses
• The business then use that revenue to pay for the factors of production
• One of the factors of production is labor/workers – the wages paid to workers becomes income to the
households which gives households the money to buy goods and services.

UNIT TWO – MICROECONOMICSLEARNING STANDARD #2 OF 3
SSEMI2 Explain how the law of demand, the law of supply, and prices work to determine production and
distribution in a market economy.
a. Define the law of supply and the law of demand.
b. Distinguish between supply and quantity supplied, and demand and quantity demanded.
c. Describe the role of buyers and sellers in determining market clearing price (i.e. equilibrium).
d. Illustrate on a graph how supply and demand determine equilibrium price and quantity.
e. Identify the determinants (shifters) of supply (e.g., changes in costs of productive resources, government regulations,
number of sellers, producer expectations, technology, and education) and illustrate the effects on a supply and demand
graph.
f. Identify the determinants (shifters) of demand (e.g., changes in related goods, income, consumer expectations,
preferences/tastes, and number of consumers) and illustrate the effects on a supply and demand graph.
g. Explain and illustrate on a graph how prices set too high (e.g., price floors) create surpluses, and prices set too low (e.g.,
price ceilings) create shortages.

SUPPLY AND DEMAND
In a market economy, producers and consumers interact to determine prices
Does that surprise you? Why?
This interaction responds to the economic laws of Supply and Demand
Supply: is the total quantity of a product that producers are willing to
make and sell at any market price
Demand: is the total quantity of a product that consumers are willing
and able to buy at any market price

THE LAWS THAT GOVERN
Supply and Demand interact in the market – but they
are trying to accomplish different things!
Producers want the highest possible prices that consumers are willing the
pay! (supply)
Consumers want the lowest possible prices that producers are willing to
sell for! (demand)
These two principles are called the Law of Supply and the Law of Demand –
they will hold true for all products/consumers in the marketplace!
Why do you think this is?

COMPROMISE
Eventually, the interaction of supply and demand will reach a compromise -
a price where both consumers and producers are happy
This is called the equilibrium price or the market clearing price
(because, ideally, at this price, all products would be sold)
Predicting where supply and demand will meet helps businesses price
their products in a way that they make a profit

STATISTICS!
So, businesses compile two types of data to help them predict supply and
demand:
Schedules: tables of data that show the quantities of a good willing to
be bought (demand) or produced (supply) at given prices
Curves: graphs of data that show the quantities of a good willing to be
bought (demand) or produced (supply) at given prices
Do you notice anything about how these statistics may be related?

EXAMPLES – SUPPLY SCHEDULE AND CURVE
Price Quantity
$45 50
$40 46
$35 39
$30 30
$25 24
$20 18
$15 8
$10 5
$5 1
$1 0
$0
$5
$10
$15
$20
$25
$30
$35
$40
$45
$50
0 10 20 30 40 50 60
Quantity
Pri
ce
Series1
Schedule
Curve
A supply curve will always rise to the right on a graph

EXAMPLES – DEMAND SCHEDULE AND CURVE
Price Quantity
$45 0
$40 1
$35 5
$30 8
$25 18
$20 24
$15 30
$10 39
$5 46
$1 50
$0
$5
$10
$15
$20
$25
$30
$35
$40
$45
$50
0 10 20 30 40 50 60
Quantity
Pri
ce
Series1
• Schedule
• Curve
The demand curve will always fall to the right
on a graph

FINDING AN EQUILIBRIUM
If we combine the data in our last two slides, we can find the
equilibrium price
Review: what is the equilibrium price?equilibrium
Equilibrium Price
$50
$45
$40
$35
$30
$25
$20
$15
$10
$5
$0
0 10 20 30 40 50 60
The X axis shows us the quantity thatQuantity
Pri
ce Demand
Supply
Where the two lines
meet is called the
The Y axis
shows us
the
equilibrium
price, or the
ideal price
the
producer
should
charge
($23)
consumers are willing to buy and that
producers should expect to sell (21)

SO HOW DO BUSINESSES SET PRICES?
Remember, the equilibrium price is an ideal price
– it doesn’t always start out that way!
Businesses will set a price for their product and then watch the market to see
what happens
At the end of the day, if there are extra products left over, the business
knows that the price was too high
This is called a surplus
At the end of the day, if there are more customers asking for the product,
but there are no more on the shelf, the business knows that the price
was too low
This is called a shortage

ON THE
GRAPHPrice set at
$25 – it’s
above the
equilibrium.
Result:
SURPLUS
Equilibrium
Price and Quantity
Surplus

ON THE GRAPH Quantity Demanded
Quantity Supplied
Equilibrium
Price and Quantity
Price set at $10 – it’s
below the equilibrium.
Result: SHORTAGE
Shortage

REACHING EQUILIBRIUM
Based on their study of surplus and shortage,
businesses will adjust their prices over time
Eventually, when all products are sold and no one
is asking for more, the price is just right!
This is called the market clearing price (or equilibrium)
There is no “shaded area” on the graph this time, because a shaded
area always resembles something that’s wrong with the market – either
too many goods or too many consumers!

A COG IN THE WORKS
The price adjustment process is not the only way that a shortage or surplus is
created in the market
The company or government may place restrictions on certain goods or
services that force those items’ prices to NEVER reach equilibrium!
Remember: governments are involved in market economies to promote
fairness and equity – sometimes that requires adjusting prices!

PRICE FLOORS
Any time a price is set at the MINIMUM possible price, it is called a price
floor
Price floors set the price for an item above the equilibrium, keeping the
price artificially high
Yes, it seems backwards – but just believe it!
Based on what you know, what happens if the price is above
the equilibrium??
A good real-life example is the minimum wage!
The government sets a minimum wage that is higher than the
equilibrium would be
Businesses make less profit per worker - what
do they do?
Surplus
Unemployment

PRICE CEILINGS
Any time a price is set at the MAXIMUM possible price, it is called a price ceiling
Price ceilings set the price for an item below the equilibrium, keeping the price
artificially low
Again, yes; it’s backwards – just deal with it!
Based on what you know, what happens if the price is
below the equilibrium??
A good real-life example is low-income housing!
The government sets a maximum rent that can be charged that is lower than the
equilibrium would be
The company makes less profit, so what do they do?
So, what will consumers do when they see the low
price?
Shortage


OTHER CHANGES IN PRICE
Sometimes the price of a good or service changes because the supply or
demand itself has changed
This means something has happened that affects ALL prices at ANY
quantity (so, graphically, the entire curve changes!)
This means that the previous equilibrium price is now either above or
below what should be the new equilibrium price!
So…at first, there will be a shortage or surplus!
In other words, there will be the same market symptoms (effects),
but there may be a different market diagnosis (cause)

CHANGES IN SUPPLY
Sometimes the way producers produce, or conditions outside of their control,will change the supply of a good or service
The price of the raw materials could go up or down, causing a change in supply
Ex: a natural disaster could destroy a crop and make the cost of that crop higher in the market
The technology of production could change, causing a change in supply
Ex: new machinery could be introduced that saves the business moneywhen they produce something
No matter what the cause, supply changes when the cost of production goesup or down!

CHANGE IN SUPPLY ON A GRAPH
On the graph, S1 represents the
original supply and S2 shows the
new supply curve after a change
in supply
You can also see that the
equilibrium price changes from
$16 to $13
When the supply curve shifts to the right, there is an increase in supply
>>>>> Increase
When the supply curve shifts to the left, there is a decrease in supply
<<<<<Decrease

CHANGES IN DEMAND
Sometimes the demand for goods will change as the condition of people in the
market changes
If people’s incomes change, their demand changes
If a close substitute for a product becomes available, demand for the original
product will change
If two products are complements and demand for one changes, demand for the
other will change also
If the population of an area changes, demand changes
If people’s tastes for certain products or styles change, then the demand for those
products will change
No matter what causes the change, demand will change when consumers change their
buying habits

CHANGE IN DEMAND ON A GRAPH
On the graph, D1 representsthe original demand and D2shows the new demandcurve after a change in demand
You can also see that theequilibrium price changesfrom$16 to $19
When the demand curve shifts to the right, there is an increase in demand>>>>>> increase in demand
When the demand curve shifts to the left, there is a decrease in demand<<<<<< decrease in demand

SOME GOOD RULES TO KNOW!
• If supply increases,
price goes down
• If supply decreases,
price goes up
• If demand increases,
price goes up
• If demand decreases,
price goes down
Can you think of some examples of an increase or decrease in supply or
demand?
Change S/D Change Price
Supply
Supply
Demand
Demand

EFFECTS OF CHANGES IN S/D
When price changes to reflect a change in supply or demand, the actual marketresult can vary based on a number of conditions
One such condition is whether or not a good orservice is elastic or inelastic
Elasticity, or the measure of how responsive the demand or supply of a goodis to a change in its price, is determined by several factors
If a good is found to be elastic, that means that asmall change in price will GREATLY affect its S/D
If a good is found to be inelastic, that means that any change in price will have a SMALL impact on its S/D

ELASTICITY OF DEMAND
Whether or not demand for a product is elastic or inelastic depends on several
factors
First, can the purchase be put off to a later time?
Second, are enough substitutes available for the good?
Third, does the purchase take up a large portion
of income?
The more “yes’s” you get to these questions, the more likely a good is elastic;
the more “no’s” you get, the more likely a good is inelastic
Let’s practice! Think about these goods:
Salt, gasoline, watermelon, television, bicycle, bread

ELASTICITY OF SUPPLY
Having an elastic supply is a little harder: elasticity of supply depends on how
quickly a producer can change their supply to meet changes in price
They want to produce more as price goes up, and less as price goes down
If the producer can respond easily and change production, the supply is
elastic
If the company produces the same amount of a good regardless of its
price, or it would take the company a long time to change production, the
supply is inelastic
Let’s practice! Consider producers of these goods:
Cotton candy, oil, computers, corn, hand-made baskets

UNIT TWO – MICROECONOMICSLEARNING STANDARD #3 OF 3
SSEMI3 Explain the organization and role of business and analyze the four types of market
structures in the U.S. economy.
a. Compare and contrast three forms of business organization—sole proprietorship,
partnership, and corporation with regards to number of owners, liability, lifespan,
decision-making, and taxation.
b. Identify the basic characteristics of monopoly, oligopoly, monopolistic competition, and
pure (perfect) competition with regards to number of sellers, barriers to entry, price
control, and product differentiation.

COMPETITION
• Competition is when businesses and firms try to get you to buy
their good/service over one of their competitors.
• Competition helps consumers because it gives them the power
to choose
• Businesses are forced to keep the quality of their goods and
services up and their prices low to effectively compete

LEVELS OF COMPETITION
• There are four levels of competition:
1. Perfect Competition
2. Monopoly
3. Oligopoly
4. Monopolistic Competition
More companies competing Fewer companies competing

PERFECT COMPETITION
• A market with perfect competition is subject only to the laws of supply and
demand with no government involvement (Laisse faire)
# of
Sellers
Barriers
to Entry
Price Control Product
Differentiation
Requirements
Unlimited None
Anyone can
start a
business
None
Completely up to
supply & demand
Sometimes called
Price Takers
None
All products are
identical
Examples: farm
products
1. Many buyers and sellers
participate in the market
2. Sellers offer identical
products
3. Buyers and sellers are
well informed about
products
4. Sellers are able to enter
and exit the market
freely

MONOPOLISTIC COMPETITION
• Monopolistic Competition offers consumers the most product variety
and price options. Each firm makes products that are slightly different
from the others – either in reality or in people’s minds.
# of
Sellers
Barriers
to Entry
Price Control Product
Differentiation
Requirements
Many,
but not
unlimited
Low
Relatively
easy to
enter
Some
can be
increased by
differentiation>>
High Level
Products are highly
differentiated with
marketing, advertising,
brand names
Examples:
Shampoos, toothpastes,
restaurants, etc.
No formal

MONOPOLISTIC COMPETITION
• Monopolistic Competition offers consumers the most product variety and price
options. Each firm makes products that are slightly different from the others –
either in reality or in people’s minds.# of
Sellers
Barriers
to Entry
Price Control Product
Differentiation
Requirements
Many,
but not
unlimited
Low
Relatively
easy to
enter
Some
can be
increased by
differentiation>>
High Level
Products are highly
differentiated with
marketing, advertising,
brand names
Examples:
Shampoos, toothpastes,
restaurants, etc.
No formal

OLIGOPOLY
# of
Sellers
Barriers
to Entry
Price Control Product
Differentiation
Requirements/
Additional
Comments
Few Higher Limited by
mutual
dependence
Considerable
with collusion or
cartels (illegal in
U.S., but not
overseas)
Standardized or
differentiated
Examples:
Soft drinks,
airlines,
electronics, gas
Competition between
companies can lead to
price wars
In this case, a few small firms dominate the market instead of just one –
but they still have the ability to influence price like a monopoly
But, they are still independent companies – they make decisions based
on what other firms do

MONOPOLY
# of
Seller
s
Barriers to
Entry
Price
Control
Product
Differentiation
Requirements/ Additional
Comments
One Very High
Legal Natural
Monopolies –
okay due to
costs of entry,
infrastructure
Complete
control, Price
Setters
Normally
NOT in
consumer’s
best interests
which is why
it’s illegal
Not necessary
except for limited
public relations
Examples of legal
monopolies:
public utility
companies
Considerable government
involvement to avoid illegal
monopolies and to
monitor/manage legal
monopolies
Legal monopolies are also
allowed for patents,
copyrights & other
intellectual property
protections
• All monopolies have one trait in common – a single seller in the market
• Illegal in the U.S., unless it’s in the public’s best interests – then it is
officially approved as a legal monopoly

A QUICK COMPARISON

