a comparative analysis of the performance of the property
TRANSCRIPT

A Comparative Analysis of the Performance of the Property Funds Listed on the
Johannesburg Stock Exchange
A research paper submitted by
Ziyanda Potelwa
Student number: 0601541N
Proposed Supervisor:
Dr. Thabang Mokoaleli-Mokoteli
Wits Business School
February 2013

1
DECLARATION
I declare that the research project is my own work. It is submitted to complete the
requirements of the Master in Management of Finance and Investment degree at the Wits
business school (WBS). It has not been submitted before to any other institution or university
for a similar qualification. I further declare that I was given authorization by a panel from the
research committee of the WBS to carry out this research.
Signed:
February 2013
2
ABSTRACT
Listed property entities on the Johannesburg Stock Exchange fall under the category of
‘Financials - Real Estate’. There are four types of property entities that a prospective investor
can consider namely: Property Unit Trusts, Property Loan Stock Companies, Real Estate
Holding and Development Companies and Real Estate Investment Trusts. The listed
property sector allows investors to enter the property investment market in a uniquely
affordable and secure way without the added risk, expense and administration that comes
with direct property investment.
This study evaluates the investment performance of the various property fund types through
the implementation of Jensen’s alpha, the Sharpe ratio and Treynor ratio in an effort to
establish whether there is a significant difference in the returns that can be obtained from the
diverse funds given the associated risks. An analysis of the total returns and standard
deviation of the property industry shows that the real estate market is affected by changes
that take place in the macro economy. It is also investigated whether there is a differential
risk associated with investing in these funds.
We find that there is no significant difference between the performances of the various funds
and there is no differential level of risk associated with investing in the property funds. An
analysis of the fluctuation of total returns and standard deviation of the property funds over
the eleven year period shows that the property sector is affected by changes in economic
conditions however the changes are not enough to cause colossal volatility. For instance,
the global recession of 2008 had an impact on the property industry returns but the sector
has since made a steady recovery.

3
ACKNOWLEDGEMENTS
I am grateful to my family, classmates and friends for their help, encouragement and
support.
I thank my supervisor, Dr Mokoaleli-Mokoteli, for guidance, patience and support.
I also thank Nedbank Group for allowing me to use their data software to source the relevant
information for this paper.

4
DECLARATION .................................................................................................................................... 1
ABSTRACT ........................................................................................................................................... 2
ACKNOWLEDGEMENTS ................................................................................................................... 3
List of Appendices ................................................................................................................................ 6
List of Figures ....................................................................................................................................... 7
CHAPTER ONE: INTRODUCTION ................................................................................................... 8
1.1Introduction .................................................................................................................................. 8
1.2 Context of the study................................................................................................................... 8
1.3 Research Problem ................................................................................................................... 11
1.4 Research Objectives ............................................................................................................... 11
1.5 Research Questions ................................................................................................................ 11
1.6 Significance of the Study ........................................................................................................ 11
1.7 Structure of the Thesis ............................................................................................................ 12
Chapter Summary .......................................................................................................................... 13
CHAPTER TWO: LITERATURE REVIEW ..................................................................................... 14
2.1 Introduction ............................................................................................................................... 14
2.2 Listed property investments ................................................................................................... 14
2.3 Property investment risk and return ...................................................................................... 16
2.4 Property Funds on the Johannesburg Stock exchange .................................................... 19
2.4.1 Property Loan Stock ........................................................................................................ 19
2.4.2 Property Unit Trusts ......................................................................................................... 19
2.5 Measuring and Evaluating Performance .............................................................................. 22
2.6 Persistence in Performance ................................................................................................... 23
2.7 Active and Passive Allocation ................................................................................................ 24
2.8 The Global Recession ............................................................................................................. 25
Chapter Summary .......................................................................................................................... 26
CHAPTER THREE: RESEARCH METHODOLOGY .................................................................... 27
3.1 Introduction ............................................................................................................................... 27
3.2 Data and data sources ............................................................................................................ 27
3.3 Research design ...................................................................................................................... 28
3.3.1 Assessing performance using Jensen’s alpha............................................................. 28
3.3.2 Assessing performance using Sharpe ratio ................................................................. 29
3.3.3 Performance using Treynor measure ............................................................................ 29
3.3.4 Performance using risk adjusted return on capital ...................................................... 30
5
3.4 Chapter Summary ................................................................................................................... 30
CHAPTER FOUR: DESCRIPTIVE DATA AND EMPIRICAL RESULTS ................................... 31
4.1 Introduction ............................................................................................................................... 31
4.2 Descriptive Statistics ............................................................................................................... 31
4.2.1 Descriptives of fund returns ............................................................................................ 31
4.2.2 Descriptives of yearly fund returns ................................................................................ 31
4.3 Performance of property funds using Jensen’s alpha ........................................................ 35
4.4 Performance of property funds using Sharpe ratio ............................................................ 37
4.5 Performance of property funds using Treynor ratio ............................................................ 37
4.6 Risk Adjusted Return on Capital ........................................................................................... 38
Chapter Summary .......................................................................................................................... 39
CHAPTER FIVE: DISCUSSION AND CONCLUSION ................................................................. 40
5.1 Introduction ............................................................................................................................... 40
5.2 Discussion of findings ............................................................................................................. 40
5.3 Conclusion ................................................................................................................................ 41
Further Research ........................................................................................................................... 42
References .......................................................................................................................................... 44

6
List of Appendices
APPENDIX 1: Monthly asset class return series
APPENDIX 2: Market Beta Calculation (2000 -2011)

7
List of Figures
Figure 1: The Property cycle clock
Figure 2: Total returns of the property sector
Figure 3: Graph1 – Total return indexes (1999 – 2010)
Figure 4: Graph 2 – The Market Capitalisation of the property loan stocks and property unit
trusts
Figure 5: Table 1 – Characteristics of fund returns
Figure 6: Table 2 – Yearly Descriptives of fund returns
Figure 7: Figure 1 – Mean for property loan stocks
Figure 8: Figure 2 – Mean for property unit trusts
Figure 9: Figure 3 – Mean for real estate holding and development companies
Figure 10: Table 3 – Performance of property funds over a sample period – Jensen’s Alpha
Figure 11: Table 4 – Excess return per unit of risk - Sharpe ratio
Figure 12: Table 5 – Excess return per unit of systematic – Treynor ratio
Figure 13: Table 6 - The Sharpe ratio and the Treynor ratio
Figure 14: Table 7 – Risk adjusted return on capital for the property funds listed on the JSE
8
CHAPTER ONE: INTRODUCTION
1.1 Introduction
This chapter introduces the thesis. It covers the context of the study and provides a brief
overview of what will be investigated in this paper. Section 1.2 presents the context of the
study. Section 1.3 discusses the research problem. Section 1.4 presents the research
objectives. Section 1.5 presents the research questions. Section 1.6 discusses the
significance of the study. Section 1.7 presents the structure of the thesis and chapter
summary concludes the chapter.
1.2 Context of the study
Grant and Kingsnorth (1966) identify mutual funds as a useful savings medium for small
investors. The accumulated money is invested in various capital market instruments such as
stocks and bonds. The resulting income and capital gain is then distributed to the unit
holders in proportion to the units they hold. A fund manager is responsible for the decisions
pertaining to how the available funds should be invested. The two main advantages of
investing in mutual fund is the diversification in the portfolio, which helps reduce but does not
eliminate the risk associated with the investment and an investor can invest in a mutual fund
without having a large capital outlay. Mutual funds are a way for most investors to achieve
diversification on their portfolio of assets without engaging in expensive research and
incurring excessive trading costs. Although some excess returns may be generated, with the
exception of a handful of funds, it is impossible to rely upon a single benchmark as a reliable
indicator of even past performance (Prince and Bacon, 2010). Grinblatt et al (1995)
characterise some of the investment strategies of mutual funds analyse how the strategies
relate to realised performance. The evidence form the study indicates that mutual funds
have a tendency to buy stocks based on their past returns and that they tend to buy and sell
the same stocks at the same time. Grinblatt et al (1995) find that there is a high correlation
between the tendency of individual funds to buy past winners and herding with fund
performance over the period of study. They find that the relation between the tendency to
buy past winners and performance is especially strong. Their research shows how mutual
funds can profit from their security analysis procedures.
Investing in real estate can be done by a wide variety of entities, from individuals, private
trusts, insurance companies, pension funds, charities, property companies, property bond
funds and property unit trusts (Hager and Lord, 1985). Directly investing in land requires
substantial amounts of money, meaning that if the investor does not have the amount of
money required for them to purchase the property, they will have to seek external funding in
9
the form of debt. Real estate ownership is identified as an investment with the ability to
hedge against inflation as real estate has the ability to earn returns that exceed the rate of
inflation over long periods of time. Real estate investment is considered a superior
investment in comparison to other types of investments (Hager and Lord, 1985).
Amongst the many investment options available on the Johannesburg Stock Exchange
(JSE) are property entities. Property entities are an indirect method of investing in real
estate. They allow investors to have the benefit of investing in property without having to be
involved with the ‘hands on’ management of the building and the administration that comes
with being an owner of the physical property. One of the main benefits of having property
entities listed on the JSE is the price transparency (Buchner, 2008).
There are the four types of property entities that are listed on the JSE namely, property unit
trusts, property loan stock companies, real estate investment trusts and real estate holding
and development companies (Buchner, 2008). The listed property sector allows investors to
enter the property investment market in a uniquely affordable and secure way without the
added risk, expense and administration that comes with direct property investment. It is
imperative that a clear distinction be made between direct and indirect property investment.
Direct investment refers to the physical acquisition of the property and indirect investment
refers to investing in the listed property sector. Typically, a large degree of direct property
investors comprise of institutional investors such as banks, pension funds and life insurance
companies (Buchner, 2008). Listed property funds are categorised as income funds as they
distribute almost all of their income as opposed to other companies that have been known to
retain an astounding 80% of their income. Property loan stocks, property unit trusts, real
estate holding and development companies and real estate investment trusts are aimed at
investors who are interested in long term income returns. These funds are an indirect way of
investing in property but they are different in their composition of units that investors can own
in the company (Hardy and van Schoor, 2010).
Property loan stock companies (PLS’s) invest solely in property. As with all other companies
property loan stocks and real estate holding and development companies are subject to the
Companies Act, JSE regulations and are governed by their own memorandum and articles
of association (Johannesburg Stock Exchange, 2012). Property loan stock companies link
their shares to debentures in the company meaning that they are part share and part share
debenture structures that are not regulated by the Financial Services Board (Buchner, 2008).
Property unit trusts (PUT’s) are structured so as to generate income for the unit holders by
way of the rental income that has accrued from the physical properties. This income is made
available to the unit holders in the short term as well as the appreciation in the value of the
10
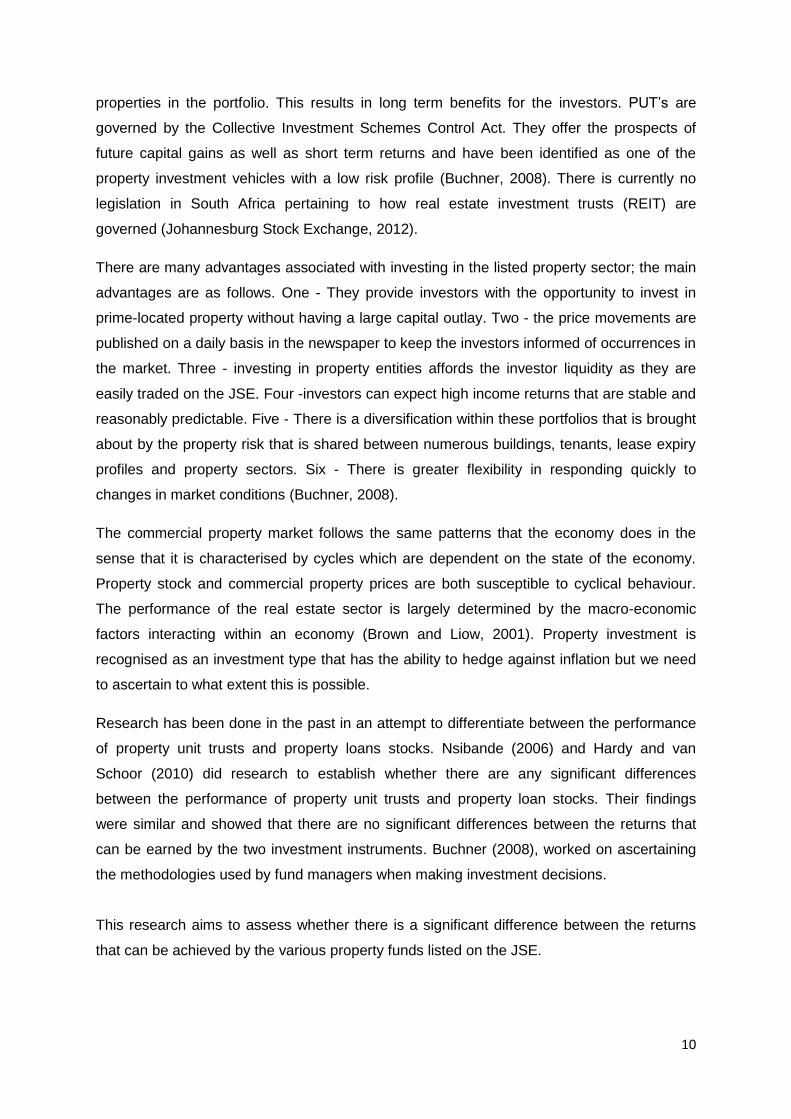
properties in the portfolio. This results in long term benefits for the investors. PUT’s are
governed by the Collective Investment Schemes Control Act. They offer the prospects of
future capital gains as well as short term returns and have been identified as one of the
property investment vehicles with a low risk profile (Buchner, 2008). There is currently no
legislation in South Africa pertaining to how real estate investment trusts (REIT) are
governed (Johannesburg Stock Exchange, 2012).
There are many advantages associated with investing in the listed property sector; the main
advantages are as follows. One - They provide investors with the opportunity to invest in
prime-located property without having a large capital outlay. Two - the price movements are
published on a daily basis in the newspaper to keep the investors informed of occurrences in
the market. Three - investing in property entities affords the investor liquidity as they are
easily traded on the JSE. Four -investors can expect high income returns that are stable and
reasonably predictable. Five - There is a diversification within these portfolios that is brought
about by the property risk that is shared between numerous buildings, tenants, lease expiry
profiles and property sectors. Six - There is greater flexibility in responding quickly to
changes in market conditions (Buchner, 2008).
The commercial property market follows the same patterns that the economy does in the
sense that it is characterised by cycles which are dependent on the state of the economy.
Property stock and commercial property prices are both susceptible to cyclical behaviour.
The performance of the real estate sector is largely determined by the macro-economic
factors interacting within an economy (Brown and Liow, 2001). Property investment is
recognised as an investment type that has the ability to hedge against inflation but we need
to ascertain to what extent this is possible.
Research has been done in the past in an attempt to differentiate between the performance
of property unit trusts and property loans stocks. Nsibande (2006) and Hardy and van
Schoor (2010) did research to establish whether there are any significant differences
between the performance of property unit trusts and property loan stocks. Their findings
were similar and showed that there are no significant differences between the returns that
can be earned by the two investment instruments. Buchner (2008), worked on ascertaining
the methodologies used by fund managers when making investment decisions.
This research aims to assess whether there is a significant difference between the returns
that can be achieved by the various property funds listed on the JSE.
11
1.3 Research Problem
Property unit trusts, property loan stocks, real estate investment trusts and real estate
holding and development companies are property entities that form the listed property sector
in South Africa. These property funds are similar in nature and it is easy for the investor to
conclude that they will yield the same returns without realising that they are slightly different
in the way that they operate. The problem is currently there is very limited information about
these funds’ returns and the associated risk especially in the South African environment.
There are only two studies that have been done in the past, both of which are unpublished
papers. The one study focused on methodologies used by property fund managers to
evaluate investment decisions and the other concentrated on comparing the returns of
property unit trusts and property loan stocks. Studies done in the past have not compared
the returns from and associated risk of the four JSE listed property funds. The real estate
cycle generally lags the economic cycle, thus the extent to which the property funds are
affected by changes in the economy is unknown. This study aims to bridge the gaps in
current knowledge by assessing how these property funds respond to the bull versus the
bear market. This will allow investors (private and institutional) to make informed decisions
when embarking on such investments since the study will differentiate between the returns
achieved from each type of property fund.
1.4 Research Objectives
To assess whether there is a significant difference between the returns obtained from
investing in different listed property funds.
To establish the extent to which different property entities are affected by different
market conditions, i.e bull and bear markets.
To establish the differential level of risk associated with each type of fund.
1.5 Research Questions
Are the returns that are realised from different property funds significantly different?
To what extent does the economic volatility affect the returns of different property
funds?
Are there differential risk levels between the various property funds?
1.6 Significance of the Study
Investing in real estate is identified as a lucrative investment to embark on. The listed
property sector has been established with the aim of allowing investors the opportunity to
12
invest in property without having to be directly involved in the management and
administration of the property (Hager and Lord, 1985). The purpose of holding property
indirectly by investing in a diversified portfolio of properties is to provide investors with a
relatively safe and liquid investment that provides predictable cash flows which achieves
capital gains in the long term through capital growth (Hardy and van Schoor, 2010).
Prospective investors will benefit from being informed about the intricacies pertaining to how
property funds operate form an investment perspective, especially information regarding the
ability to achieve excess returns and the risks associated with investing in property funds.
Institutional investors and financial organisations may also benefit from ascertaining whether
investing in these instruments is a lucrative investment decision, given the risks involved. It
is imperative that prospective investors understand the returns that can be obtained and the
differential level of risk associated with investing in these funds. The effect of economic
shocks on these investment vehicles will benefit investors as they will be well-informed as to
which property fund has the ability to act as a hedge against the economic turmoil
experienced during a recession. This research will assess the above mentioned aspects of
investing in the listed property sector based on the returns that have been achieved in the
past with the intention of ascertaining the risks involved and the effect of the macro-economy
has on the property industry.
The literature merely expresses how the performance of the mutual funds is measured and
how diversification can be an advantage or disadvantage. This research aims to differentiate
between the performances of the property funds listed on the JSE. The property funds are
similar in nature but have different rules pertaining to the way they are governed. This
research aims to provide investors with information that will allow them to make informed
decisions when embarking on investment in property entities. Investing in property entities is
believed to be a preferred method of investing in real estate however prospective investors
need to identify which of the property funds can yield the best returns. Institutional investors
will also be in a position to opt for the investment option that provides more favourable
returns in comparison to the others.
1.7 Structure of the Thesis
The thesis is divided into five main chapters: Chapter 2 presents a logical and critical
argument on the subject based on literature and previous studies that have been conducted
on the subject. Chapter 3 presents research methodology. Chapter 4 presents results and
13
the interpretation of the results. Chapter 5 presents discussion, conclusions and further
work.
Chapter Summary
In summary, this chapter lays the foundation of the thesis. The regulatory framework
pertaining to the operation of the property funds listed on the JSE is described. The listed
property sector in South Africa is one of the less risky investments an investor should have
as part of their investment portfolio. Investing in real estate has become an inexpensive, less
cumbersome task due to the introduction of these property funds. One of the main
advantages associated with investing in mutual funds is the diversification it brings to an
investor’s portfolio. The high degree of diversification that comes with investing in these
property entities is attributed to the various types of property that make up the portfolio.
These property funds are similar in nature but they are different in the way that they operate.
The objective of this research is to differentiate between the returns of the various property
funds and to what extent changing economic conditions have an impact their performance
so that investors can make informed decisions about the investment they settle on to pursuit
their ideal investor portfolio. A comparative analysis of past returns realised by the property
funds listed on the JSE will enable investors to ascertain which one is best suited to their
investor profile. Investors will be able to make informed investment decisions once they have
a better understanding of the returns that they can achieve as well as the associated risks.
14
CHAPTER TWO: LITERATURE REVIEW
2.1 Introduction
This chapter summarises the different strands of literature that are related to property
entities, namely property unit trusts, property loan stocks, real estate holding and
development companies and real estate investment trusts. The literature discussed below
comprises the types of listed property investments, the risks and performance, measuring
performance, persistence in mutual fund performance, active and passive allocation and the
effects of the global recession on investment vehicles.
Section 2.2 distinguishes between direct and indirect property investment with emphasis on
the benefits that come with investing in the listed property sector as opposed to direct
property investing. Section 2.3 discusses the performance of the different types of
investment and explains how diversification offered by property funds can reduce the
systematic risk and also discusses the factors that affect the financial returns of the physical
property. Section 2.4 highlights the main differences between the various property funds.
Section 2.5 discusses various methods that are used for measuring mutual fund
performance. Section 2.6 delves into the persistence of mutual fund performance. Section
2.7 covers the active and passive asset allocation strategies that are adopted by fund
managers in their management of mutual funds. Section 2.8 discusses some of the
implications of the global recession for the real estate market.
2.2 Listed property investments
Listed property investments entail investing in a portfolio of commercial property assets
comprising of, commercial, retail and warehousing which is managed by a specialist property
fund manager (Berkeley, 2012). The listed property sector reveals information about the
changes in real estate values in a timely manner as opposed to the periodic reports that are
compiled either monthly or quarterly (Joseph and Keim, 1993). By investing in listed
property, investors receive a share of the rental income collected from the property in the
short term and they will benefit from any capital gain that is realised in the long term
(Berkeley, 2012). Price fluctuations observed in property investments are often attributable
to the changes in real estate fundamentals (Joseph and Keim, 1993). Joseph and Keim
(1993) conclude that the stock market provides reliable measures of return for the real estate
15
market which is considered to be one of the most important asset categories and yet minimal
research has been done on this subject.
Direct investment in property can be undertaken by different types of investors. Immovable
property will ultimately be affected to a greater or lesser extent by the performance of the
property market as a whole (Hager and Lord, 1985). There are many different uses of
property that can be considered such as office space, warehousing, shopping centres,
housing and agriculture. The primary focus of this paper is on the commercial property
sector. Hager and Lord (1985) identify three categories of property investment namely:
prime, secondary and tertiary. Prime properties are those that are modern or recently
refurbished with high quality finishes. Prime property is generally well situated in a
commercially strong geographical location with a good quality tenant which would normally
be a blue chip or single tenanted building. Secondary properties are those that are
considered to have one or two of the basic characteristics of prime property. Tertiary –
comprises of buildings that are generally older, poorly constructed or in a poor geographical
location with a tenant that is considered to be more risky in the sense that they are not well
known. Old multi-tenanted premises with multiple occupants are considered to be tertiary
properties.
Additional benefits of investing in listed property include the following. One, diversification–It
is observed by Amit and Livnat (1988) that some firms reduce their risk and settle for low
returns while others will assume higher risks with the aim of gaining high returns. Investing
in property entities allows the investor to invest in a diversified portfolio of immovable
property which is managed by a fund manager. The purpose of holding property indirectly by
investing in a diversified portfolio of properties is to provide investors with a relatively safe
and liquid investment which provides predictable cash flows and achieves capital gains
through growth (Hardy and van Schoor, 2010). Amit and Livnat (1988) prove that
diversification allows a firm to increase its financial risk which has a reducing effect on the
systematic risk. Two, conduit principle - this refers to property unit trusts and real estate
investment trusts being exempt from income tax distributed to the investors. Property loan
stocks are structured such that a majority of their capital structure is comprised of
debentures. The interest earned on debentures is distributed before tax, which permits
property loan stock companies to distribute a large portion of their income to investors.
Three, regular income stream – property entities are considered income funds as they
distribute a large portion of their income to investors. Four, exposure to immovable property
– investing in property entities allow individuals to become investors in immovable property
without having a large capital outlay. There is a set minimum amount that an investor should
16
have in order to become part owner in property entities but it does not compare to what the
investor would need to raise if they were to invest in a property directly. Five, Liquidity –
property entity investments allow the investor a large degree of liquidity as property entities
are traded on capital markets. Six, well regulated – Property entities are well regulated by
the legislation which is particular to the country in which the company is incorporated.
Seven, transparency – the price of the property entity is regulated by the market and is
transparent as the price of the entity is public information as it may be found in newspapers
on a daily basis (Buchner, 2008).
Property entities are similar in nature but they have certain characteristics that differentiate
them from one another. In South Africa, property loan stock and property holding and
development companies are subject to the Companies Act, Johannesburg Stock Exchange
listing requirements and their own articles of association. Property Unit trusts are registered
and governed by the Collective Investments Schemes Act (Hardy and van Schoor, 2010).
There is currently no legislation relating to how real estate investment trusts are governed.
There are tax advantages that accrue to the unit holders who have units in property unit
trusts, property loan stocks and real estate investment trusts. However, the same is not true
for real estate holding and development companies. The major benefit of investing in
property entities is the diversification that is brought about by the various properties that the
portfolio holds (Buchner, 2008).
2.3 Property investment risk and return
There are numerous factors that impact on the returns that are achieved by the investors
from their investments. The shape of the return from a direct property investment is similar to
that of index- linked gilt in the sense that the immediate yield is low but tends to rise over
time. This is due to the fact that most of the return is effectively reinvested in the asset and
then realised at a later date. The initial yield and the capital growth achieved are the two
aspects that can be considered as the constituents of total return (Hager and Lord, 1985).
Direct property investment comes with added responsibility in comparison to indirect
property investing. The following points should be noted. One, Expenses - there are running
expenses such as the electricity and water that are be related to the daily operation of the
building. The management costs are compensated for by the payment of rental in advance.
Two, taxation - according to the South Africa Revenue Services, an investment property is
subject to capital gains tax. Three, physical property - the physical condition of the building
needs to be maintained and probably ungraded on a regular basis so as to keep up with the
tenant requirements and avoid obsolescence as this will affect the income of the building.
17
Buildings have to change over time so as to comply with new regulations such as the green
building initiative that has become an increasingly prevalent phenomenon in recent years.
Four, Capital outlay - direct property investment requires the prospective investor to have
substantial amounts of money at hand; otherwise, they have to acquire the funds form
financial institutions in the form of debt. Five, Yield - the initial yield, which is observed by
comparing the valuation or cost against the reflecting income is a crucial aspect which plays
a pivotal role in the decision whether or not to invest in a particular property. Six, Rent
reviews - the frequency of rent reviews determine the periods for increase in income which
provides the raw data for the determination of the capital growth. Seven, Lease expiry profile
- the lease expiry profile of the properties has to be checked regularly so as to determine the
security of the income of the various properties. (Source: Hager and Lord, 1985).
The above factors have an influence on the total returns that can be achieved by the
immovable property. In addition to all the risk that the actual building may be subjected to,
there is an additional market risk which is the risk associated with the various sectors of the
property market. The commercial property market follows the same patterns that the
economy does in the sense that it is characterised by cycles which are dependent on the
state of the economy. Property stock and commercial property prices are both susceptible to
cyclical behaviour (Brown and Liow, 2001). An understanding of this cyclical behaviour is
useful in the development of tactical asset allocation models that include commercial real
estate and property stock in an effort to optimise investors’ returns at a certain level of risk.
Real estate cycles can be categorised as either minor (small) or major (long) cycles. Minor
cycles typically have a duration of four to five years which reflects the influence of business
cycles working through fluctuations in the demand for properties. Major cycles typically have
a duration of nine years and are generally caused by the supply-side production lags that
affect all types of construction (Brown and Liow, 2001). The cyclical behaviour can be
attributed to the alternating economic demand shocks. However it should be noted that real
estate investment is not a uniform sector and that market behaviour and investment
performance can be fundamentally different across the various property types (Wheaton,
1999).
Buchner (2008) states that periods of growth tend to lead to oversupply of property in the
market as was the case in South Africa following the property boom of year 2000 – 2006,
this is followed by stabilisation, absorption and then growth, leading to a shortage of supply.
Past research shows that commercial property investment is closely linked to the state of the
economy. Factors such as gross domestic product, employment, interest rates and inflation
play a role in influencing the state of the property sector. The property cycle generally lags
18
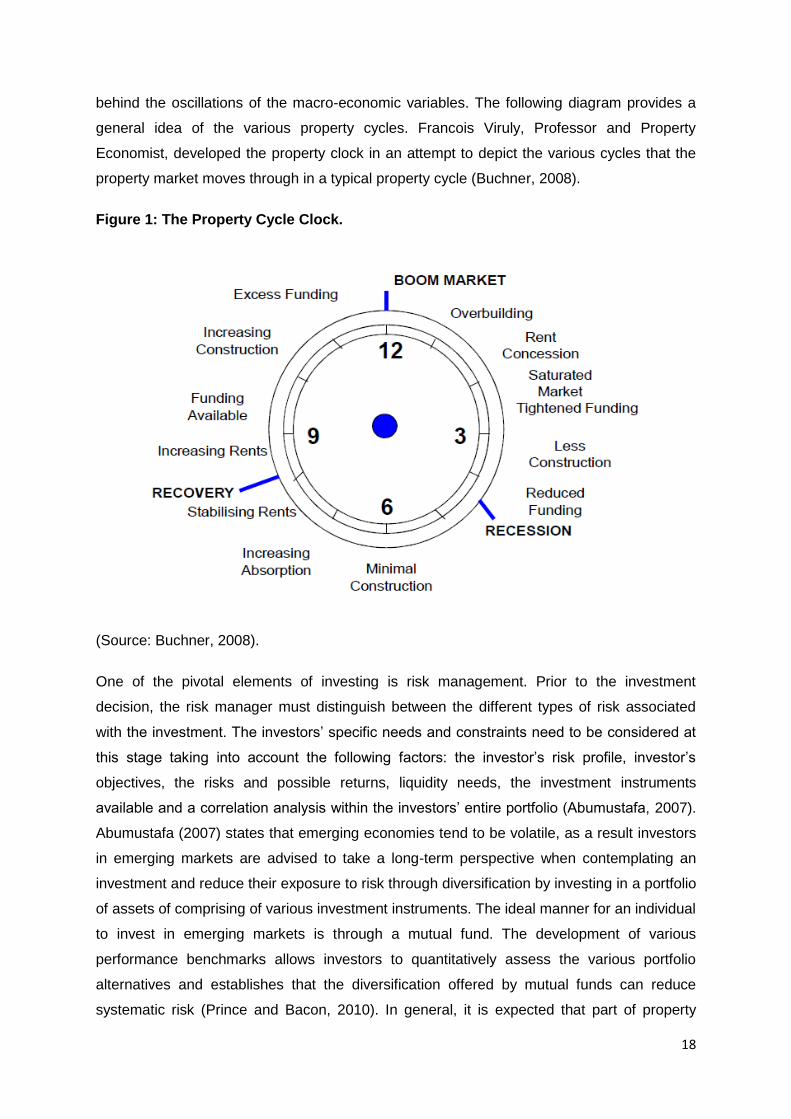
behind the oscillations of the macro-economic variables. The following diagram provides a
general idea of the various property cycles. Francois Viruly, Professor and Property
Economist, developed the property clock in an attempt to depict the various cycles that the
property market moves through in a typical property cycle (Buchner, 2008).
Figure 1: The Property Cycle Clock.
(Source: Buchner, 2008).
One of the pivotal elements of investing is risk management. Prior to the investment
decision, the risk manager must distinguish between the different types of risk associated
with the investment. The investors’ specific needs and constraints need to be considered at
this stage taking into account the following factors: the investor’s risk profile, investor’s
objectives, the risks and possible returns, liquidity needs, the investment instruments
available and a correlation analysis within the investors’ entire portfolio (Abumustafa, 2007).
Abumustafa (2007) states that emerging economies tend to be volatile, as a result investors
in emerging markets are advised to take a long-term perspective when contemplating an
investment and reduce their exposure to risk through diversification by investing in a portfolio
of assets of comprising of various investment instruments. The ideal manner for an individual
to invest in emerging markets is through a mutual fund. The development of various
performance benchmarks allows investors to quantitatively assess the various portfolio
alternatives and establishes that the diversification offered by mutual funds can reduce
systematic risk (Prince and Bacon, 2010). In general, it is expected that part of property
19
market risk that is associated with the health of the economy should yield a positive
correlation between property returns and the stock returns the broader market (Joseph and
Keim, 1993). Joseph and Keim (1993) conclude from their findings that the stock market
provides a reliable measure of returns and conditions of the listed real estate sector.
2.4 Property Funds on the Johannesburg Stock exchange
2.4.1 Property Loan Stock
Property loan stock companies hold direct investments in commercial, retail or industrial
property which are managed on behalf of the shareholders. In the case of property loan
stock companies, what the investor purchases is referred to as “linked units”, as they
comprise of part share and part debenture to share in the income stream of that property
portfolio. Property loan stock companies do not pay tax at corporate level, their structure is
such that the shareholders or debenture holders loan the property company money and
which will be repaid with interest which is only taxable at the investor’s level. Property Loan
stocks are at liberty to make the decision not to distribute the realised income; such income
is still subject to tax deductions. The managers of property loan stock companies are at
liberty to gear up their portfolios and some companies have been known to borrow well over
50% against their holdings which has the potential to create an element of risk in a in high
interest rate environment (Hardy and van Schoor, 2010).
2.4.2 Property Unit Trusts
The investors of property unit trusts buy a share in the buildings that are owned by the
management company. Listed property unit trusts differ from the other unit trusts in the
sense that they are close-ended meaning that there are a limited number of units available in
the property unit trust company (Hardy and van Schoor, 2010). The units that are available
in the fund may be expanded through the implementation of a rights issue. For instance, the
fund manager may decide to acquire new property but may not be agreeable to using the
available funds. The low profile nature of property unit trusts is mainly attributable to the fact
that they are largely bought and not sold by financial advisors. As a result, it is estimated that
almost 85% of the unit holders in property unit trusts are institutions such as pension funds,
provident funds and asset management companies (Equinox, 2011). Property unit trusts are
restricted in terms of gearing as they may only borrow up to 50% for the purposes of
refurbishing their existing buildings (Hrady and van Schoor, 2010). There is currently no
legislation in South Africa pertaining to how real estate investment trusts (REIT) are
governed (Johannesburg Stock Exchange, 2012).
20
The implementation of the collective investment schemes act affords property unit trusts
some additional benefits. One, the properties are held in the trust, which permit the selling of
the buildings in the trust without having to incur capital gains tax expenses. Two, previously,
property unit trusts were not permitted to purchase their own units. The Collective
investment schemes act now allows for this practice, which benefits the unit holders when
units are trading at a substantial discount. Three, the underlying properties may now be
bonded, which gives rise to an increased and favourable borrowing facility (Equinox, 2011).
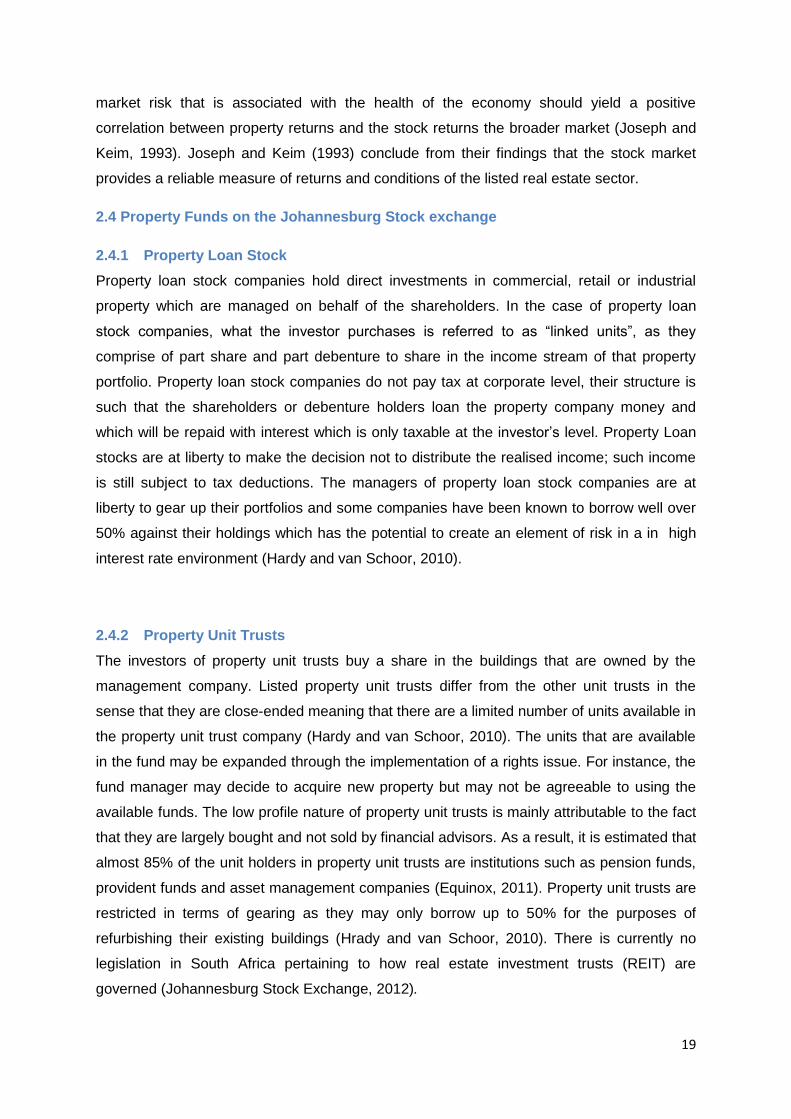
The figure 2 below presents the performance of the property sector over the sample period
of eleven years (2000 – 2011). This graph shows how the total returns of the property sector
as have fluctuated over the eleven year period. The graph below further shows how the
property market performed during the years where it experienced a property boom which
period was characterised by excess funding, increased construction and overbuilding.
Noteworthy is sharp fall in property returns from 2007 to 2008 and 2009. The property sector
made a slight recovery from 2009 till 2010 but this was short lived as the property sector
returns took yet another plunge from 2010 to 2011. The graph below is a representation of a
property boom as well as the impact of the global recession on the performance of the
property sector.
Figure 2 – Total returns of the property sector
(Source: IPD Property Sector Performance)
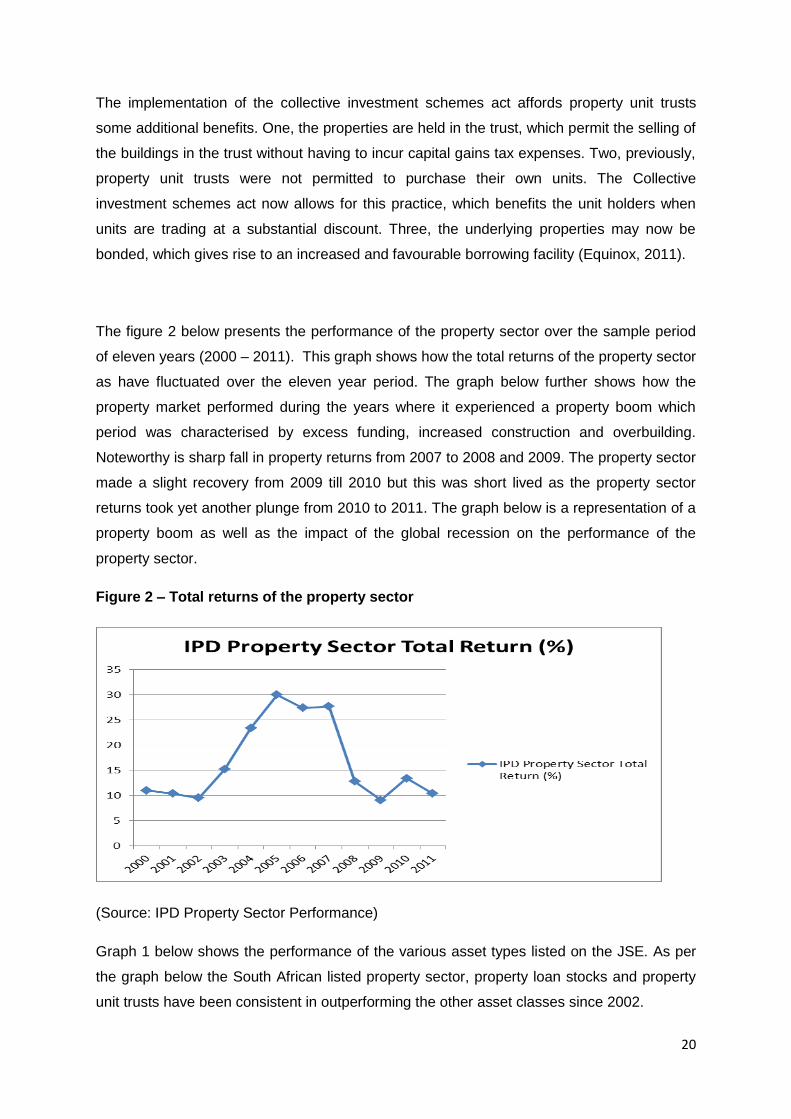
Graph 1 below shows the performance of the various asset types listed on the JSE. As per
the graph below the South African listed property sector, property loan stocks and property
unit trusts have been consistent in outperforming the other asset classes since 2002.
21
Graph1 – Total return indexes (1999 – 2010)
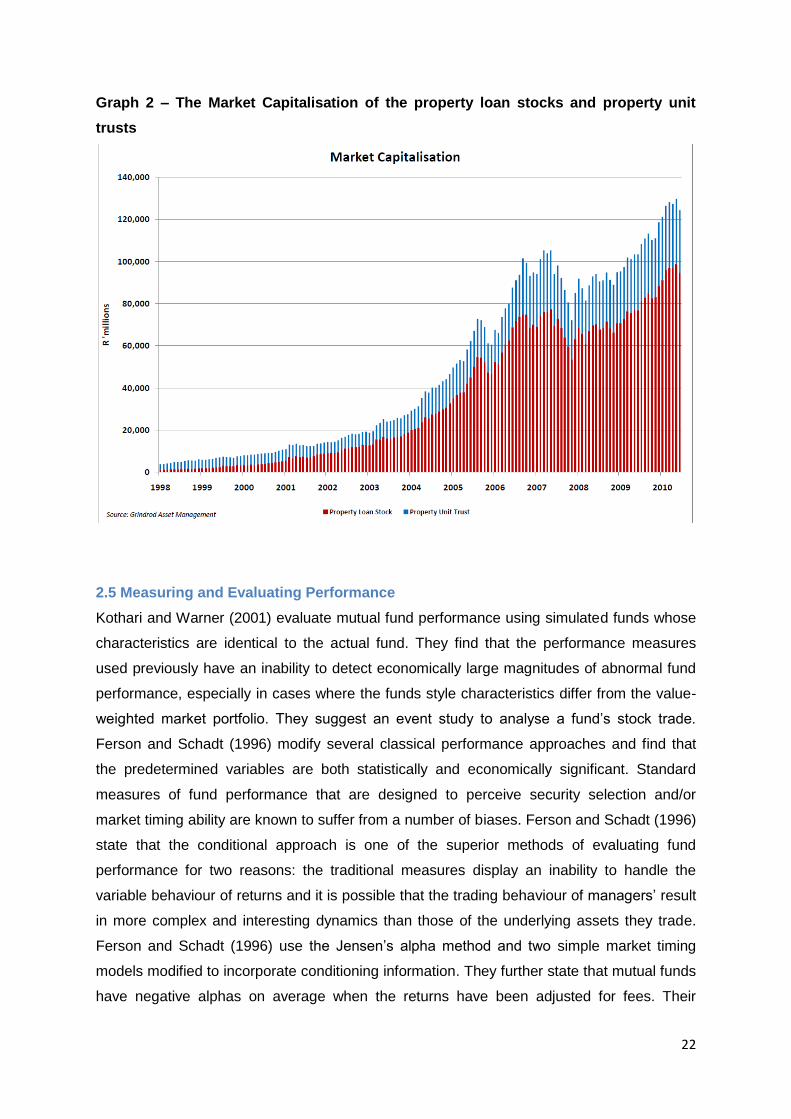
Graph 2 below depicts how the property loan stocks and property unit trusts have grown
since 1998. Further, it shows how the property market capitalisation rate experienced a
period of growth up to and including 2007 and took a fall in 2008 highlighting the negative
effects of the global recession.
22
Graph 2 – The Market Capitalisation of the property loan stocks and property unit
trusts
2.5 Measuring and Evaluating Performance
Kothari and Warner (2001) evaluate mutual fund performance using simulated funds whose
characteristics are identical to the actual fund. They find that the performance measures
used previously have an inability to detect economically large magnitudes of abnormal fund
performance, especially in cases where the funds style characteristics differ from the value-
weighted market portfolio. They suggest an event study to analyse a fund’s stock trade.
Ferson and Schadt (1996) modify several classical performance approaches and find that
the predetermined variables are both statistically and economically significant. Standard
measures of fund performance that are designed to perceive security selection and/or
market timing ability are known to suffer from a number of biases. Ferson and Schadt (1996)
state that the conditional approach is one of the superior methods of evaluating fund
performance for two reasons: the traditional measures display an inability to handle the
variable behaviour of returns and it is possible that the trading behaviour of managers’ result
in more complex and interesting dynamics than those of the underlying assets they trade.
Ferson and Schadt (1996) use the Jensen’s alpha method and two simple market timing
models modified to incorporate conditioning information. They further state that mutual funds
have negative alphas on average when the returns have been adjusted for fees. Their
23
regression results for Jensen’s alpha show that using a multifactor benchmark, mutual fund
unconditional alphas tend to be negative. Daniel et. al (1997), examine whether mutual
funds can select stocks that allow them to earn back a fraction of the fees and expenses that
they generate. Characteristic timing and characteristic selectivity are the benchmarks are
used to ascertain whether portfolio managers are able to time their portfolio weightings
based on these characteristics and whether managers can select stocks that outperform the
average stock, having the same characteristics. Their results show that mutual funds,
especially aggressive growth funds, exhibit some selectivity ability but the funds exhibited no
characteristic timing ability. Massa and Patgiri (2009) state that most fund managers are
rewarded for generating positive alphas however they find it difficult to do so as most fund
managers produce poor or negative alphas by assuming liquidity risk through the holding of
illiquid assets to maturity. They find that high-incentive contracts induce fund managers to
take on additional risk and reduce the funds' probability of survival. As a result, mutual funds
with high-incentive contracts deliver higher risk-adjusted return and the superior
performance remains persistent.
2.6 Persistence in Performance
Grinblatt and Titman (1992), find evidence that there are differences in the performance of
funds that persist over time and persistence is consistent with the ability of fund managers to
earn abnormal returns. There is a growing industry devoted to the measurement of mutual
fund performance. This industry is based on the idea that funds that do well or poorly in the
past will continue to do so in the future. Minimal research has been conducted with the aim
of testing for persistence in fund performance. Grinblatt and Titman (1992) attribute this lack
of research to the biases prevalent in the traditional benchmarks used in the evaluation of
fund performance. Some of the methods used in the process of performance evaluation
such as the Capital Asset Pricing Model and APT-based benchmarks favour small
capitalisation and high dividend yield stocks. In order to ascertain whether past performance
can provide useful information to an investor, tests that are focused on the actual returns
achieved in the past must be executed.
Grinblatt and Titman (1992) conclude that there is positive persistence in mutual fund
performance. However they state that persistence cannot be attributed solely to the
inefficiencies in the benchmark that are related to the firm size, dividend yield, past returns,
skewness, interest rate sensitivity or CAPM beta. It should also be taken into consideration
that there are persistent differences between the fees and transaction cost that are incurred
by multiple funds.
24
Grinblatt and Titman (1992) find empirical evidence that supports the notion that the past
performance of a mutual fund provides useful information for investors who are considering
an investment in mutual funds. They find that past performance is positively related to future
performance. Grinblatt and Titman (1992) acknowledge that one of the shortcomings in this
paper is how to optimally select information about the past performance of a mutual fund.
Grinblatt and Titman (1993) find evidence that differences in performance between funds
persist overtime and this persistence is consistent with the ability of fund managers to earn
abnormal returns. Bollen and Busse (2004) conclude that superior performance is a short-
lived phenomenon that is observable only when funds are evaluated several times a year.
2.7 Active and Passive Allocation
Hensel, Ezra and Ilkew (1991) state that for an average investor, the asset allocation policy
decision of an investor is more important than decisions relating to market timing and
security selection. On the other hand, some investors believe that security selection has a
more significant impact on the achieved return than asset allocation. The resultant impact of
any financial decision can be measured by comparing the outcome with the outcome of
some alternative decision that could have been made. This is the fundamental rationale
frequently used to attribute pension fund investment performance to each of a number of
possible decisions. Some mutual funds compare the return on an actively managed portfolio
with the return that would have been achieved had funds been invested in the market
portfolio instead. The naïve alternative represents all the available alternatives
proportionately and is compared to the security selection and market timing abilities of an
investor. The dissimilarity of the results represents the value added by the investment
judgements which represent departures from the market portfolio. Hensel, Ezra and Ilkew
(1991) identify this method as the most efficient means of evaluating the performance;
however the implementation is more complicated as it is difficult to define the alternative
portfolio that would be held by an investor who is lacking in investment judgement. The
results obtained indicate that the amount of variability of each sponsor’s return is explained
by each decision level and highlights the importance of naïve allocation. Different investment
decisions have a direct effect on the return that is ultimately achieved. The most significant
analysis is concerned with the potential impact of different types of decisions on returns
themselves rather than their variability. Hensel, Ezra and Ilkew (1991) conclude that an
investor’s decision to part from risk-minimizing investment policy is likely to have a greater
impact on total returns and return variability than any other single decision concerning the
investment. Decisions regarding active management by fund managers are as important as
the asset allocation strategy. Chang and Lewellen (1984) stated that few fund managers
appear to display market-timing skills and hence the conclusion is that they are unable to
25
outperform a passive investment strategy. Chang and Lewellen (1984) produce empirical
evidence suggesting that neither expert market timing nor security selection abilities are
evident in the observed mutual fund returns leading to the conclusion that historically, mutual
funds have been unable collectively to outperform a passive investment strategy.
2.8 The Global Recession
The global recession of 2008 was initiated by the instability of the sub-prime US housing
market bubble which quickly turned into the severe recession, one that has not been
witnessed in over six decades (Verick and Islam, 2010). Verick and Islam (2010) believe that
the warning signs in the market were evident prior to the collapse of the US housing market.
Substantial current deficits in the United States and the United Kingdom were being financed
by excess savings from emerging economies and oil exporters, at the time loose monetary
policy was prevalent, weak financial regulation and misperception of risk were great
contributors to the crisis. There seems to have been a large degree of oblivion to the
liabilities linked to the rapidly deteriorating US housing market, which lead to consequences
with respect to liquidity and ultimately, the collapse of the global financial system (Verick and
Islam, 2010). Governments in both advanced and developing economies had to implement
some crisis control measures in an effort to prevent previously experienced dire
consequences of a recession. The financial markets became riddled with a decrease in the
availability of credit; interest rate reductions and systems were put in place to implement a
fiscal stimulation in the economy (Verick and Islam, 2010). During the late 1980’s and early
1990’s, the real estate sector encountered a large decline in real estate values due to
declines in occupancy rates in commercial properties as a result of the overbuilding that took
place in the early 1980’s and credit trouble that limited the amount of financing that was
made available to borrowers (Brown, 2000). Brown (2000) conducts an analysis of the
mortgage and equity real estate investment trusts during the real estate downturn and the
following results are obtained. One - the book value of mortgage loans held by the mortgage
real estate investment trusts decline significantly during the period of real estate value
decline while the book value of the estate equity positions held by equity real estate
investment trust increased. During this period mortgage real estate investment trusts are net
sellers of highly leveraged assets and equity real estate investment trusts are net
purchasers. Two - despite the market indicators that the real estate market is depressed,
mortgage real estate investment trusts seldom reorganise their nonperforming or defaulted
loans. Three - during a period of decline in real estate values, the total mortgage real estate
investment trust are more negative than the total equity real estate investment trusts. This
26
large share price decline in the mortgage real estate investment trusts reveals that they are
more susceptible to financial distress costs.
The decline in real estate values forces the lenders to sell their real estate assets and the
less leveraged firms are usually the acquiring parties in these transactions. The different
ownership structures and financial leverage of the mortgage real estate investment trusts
and equity real estate investment trusts are the main reason why the different investment
vehicles are affected in dissimilar ways by the decline in real estate values (Brown, 2000).
Brown (2000) provides evidence that there is asset illiquidity during an industry-wide
downturn and that owner-managed entities are more vulnerable as there is no incentive for
lenders to reorganise loans that have been defaulted upon due to the depressed state of the
market.
Chapter Summary
In this chapter, the various components and mechanisms of the listed property sector are
explored. An overview of the intricacies regarding how the funds operate is given and
various advantages that accrue to an investor who wishes to invest in the listed property
sector are identified. The types of special purpose vehicles available in the market for
indirect property investment, namely property unit trusts and property loan stock companies
are differentiated. Property unit trusts, property loan stock companies, real estate holding
and development companies and real estate investment trusts are similar in nature but they
have certain features that differentiate them from one another in terms of their capital
structure and the way that they are governed. An outline of the various methods used to
measure performance is given. The key advantages of not having to manage the property
directly and the various factors of the physical property that can have significant impact on
the return achieved by the physical property are highlighted. The positive relationship
between the state of the macro economy and the real estate sector is discussed in light of
the global recession of 2008. The global recession of 2008 is discussed with the aim of
establishing its’ impact on the values of the real estate market and subsequently the returns
and performance of the listed real estate sector during that period. The next chapter
presents the methodology used in this research.
27
CHAPTER THREE: RESEARCH METHODOLOGY
3.1 Introduction
This chapter introduces and explains the research methodology that is used to investigate
the objectives set out in chapter one. The first step is the selection of the sample of the
property funds listed on the. The returns of the sample property funds are then calculated
from an investor’s perspective and are analysed in order to determine which one of the four
property funds has the ability to consistently outperform the other. Section 3.2 describes
data sources. Section 3.3 discusses the research design which is comprised of the following
steps. Step one entails establishing the total returns of all the property funds that will be
used in the study and the second part discusses the use of the three methods to establish
the performance of property funds. The three methods are Jensen’s alpha, Sharpe ratio and
Treynor ratio.
3.2 Data and data sources
The research analyses the property funds listed on the JSE namely property loan stocks,
property unit trusts and real estate holding and development funds. All these funds tend to
be similar in their functionality as investment vehicles but are different in the way that they
are governed. Section 2.4 above provides detailed characteristics of each of the funds. The
three funds were selected because they have complete data over the sample period which
creates survivorship bias in the sample. The survivorship bias creates a problem in
performance measurement because focusing only on the surviving funds tends to overstate
the performance measure and gives rise to spurious correlation between these variables’
performance (Elton et. al, 1996).
The returns data for each of the property funds are obtained from Nedbank Capital database
and S&P Capital IQ. Nedbank Capital operates in the financial services sector offering
various financial products and services to a wide range of different types of clients. S&P
Capital IQ is an innovative provider of the most accurate and timely financial information. On
the other hand Equinox offers a data base that provides prospective investors with the past
returns of mutual funds, more like Morning Star in the US. The information obtained from the
three sources is correlated to ensure the accuracy of the data. The returns that are used in
this study are dividend adjusted and are net of management fees to provide an accurate
measure of the actual returns achieved.
28
The research period is 01 January 2000 – 31 December 2011. The research period is
selected so that it includes bull and bear markets. The two market conditions will enable us
to determine which of the property funds can withstand harsh economic conditions like those
experienced during the global recession of 2008. All the property funds that were in
existence during the selected time period are included in the sample.
In addition to the returns data of the various property funds a real estate index and one
month treasury bills are used in the construction of a benchmark. The one month treasury
bills rate is obtained from Nedbank Capital Global Markets division.
Property index benchmark is used to assess performance of property funds and the
benchmark used is called Spliced index and it is obtained from Catalyst Fund Managers
(CFM). The Spliced index was created using the J255 (PUT) index and J265 (PLS) index
and market weighting. The South African listed property index only came into being in 2002
and comprises of the top 20 stocks by market cap. The J255 and J256 indices include all
PUT’s and PLS’s (Catalyst, 2012).
3.3 Research design
There are several statistical measures used to assess fund performance. The standard
deviation of returns, Sharpe, Treynor and Jensen’s measure are the most commonly used
for the evaluation of risk of mutual funds (Jagric et. al, 2007). The methods used in this
study to assess the performance of the property funds’ portfolios are Jensen’s alpha, Sharpe
ratio, Tryenor ratio and the risk adjusted return on capital.
3.3.1 Assessing performance using Jensen’s alpha
Jensen’s alpha is used to determine which of the property funds is consistent in
outperforming the market on a risk adjusted basis (Hardy and van Schoor, 2010). Jensen’s
alpha is a risk adjusted performance measure that adjusts expected or average returns beta
risk (Nielsen and Vassalou, 2004). Kothari and Warner defined the single Beta CAPM
Jensen alpha measure as the intercept from the regression of portfolio excess returns on the
market portfolio excess returns. The equation is defined as follows:
RPt – Rft = αP + βP (RM - Rft) + єPt (Equation1)
Where RPt is the mutual fund portfolio return in month t, Rft is the risk free return in month t,
єPt is the error term and αP and βP are the regression’s intercept and slope (beta risk)
coefficients (Kothari and Warner, 2001). Beta describes the volatility of the portfolio with
respect to the market while alpha is an indication of whether the portfolio has beaten the
market on a risk adjusted basis. This calculated using the following equation:
29
β = Covariance (rs, rb)/ Variance (rsb)
Jensen’s alpha regression method has been implemented using the two benchmarks, the
one month Treasury bill rate and the PUT &PLS spliced index. The regression-based
measures are the estimated intercepts from a regression of 120 monthly excess returns
against the one month Treasury bill rate and the spliced index (Kothari and Warner, 2001).
The regression has been executed at a 95% confidence level. The results of the Jensen’s
alpha regression will be compared to a market beta obtained for the property market for the
year 2000 – 2011 periods which has been calculated using the spliced index return and the
ALSI index of the JSE. The resultant beta for the market has been calculated as per the
table in Appendix 2. The regression analysis produces a value for alpha and beta. The beta
value is compared to a market beta that has been determined through a comparison of the
performance of the listed property sector to the ALSI index of the JSE.
The alpha value indicates whether the portfolio manager is superior or inferior in stock
selection. A significant positive alpha indicates that the fund manager performs better than
the benchmark and a negative alpha indicates that the fund manager does not beat the
market.
3.3.2 Assessing performance using Sharpe ratio
The Sharpe ratio is used to determine the ration between the excess average return and
risk. Risk is measured as the standard deviation of the return. The implementation of the
Sharpe ratio is an underlying fundamental consideration when an investor is faced with an
exclusive choice among a number of funds. The prospective investor can unambiguously
rank the possible investment options on the basis of their Sharpe ratios. A fund with a higher
Sharpe ratio is the preferred result as it will enable all investors to achieve a higher expected
utility (Nielsen and Vassalou 2004). The Sharpe ratio is calculated by dividing the annualized
excess return by the standard deviation of the return (Jagric et al. 2007). The Sharpe ratio
equation is as follows:
Sh = R1- Rf/ σ
3.3.3 Performance using Treynor measure
The Treynor measure is similar to the Sharpe ratio but has different denominator because it
measures the excess return per unit of systematic risk. This ratio takes the systematic risk
into consideration which is the relevant measure of risk when evaluating fully diversified
portfolios. A well-diversified portfolio will have a systematic risk that is equal to the total risk
(Jagric et al. 2007). The Treynor ratio is calculated as follows:
TR = R1 –Rf/ β
30
The calculation of the risk adjusted return on capital is used to assess whether there is a
differential level of risk associated with investing in the various property fund types (Crouhy
et al., 1999). The results obtained from the calculation of the risk adjusted return on capital
are compared to assess the variability of the risk associated with investing in each of the
fund types.
3.3.4 Performance using risk adjusted return on capital
Risk adjusted return on capital (RARAC) is one of two commonly used risk adjusted
performance measures. The RARAC adjusts the denominator to the account for the various
anticipated risks. The Bankers trust developed the RAROC methodology in the late 1970’s.
This method was designed with the aim of adjusting trader profit for the risks associated with
the prospective investment (Crouhy et al. 1999). According to Zaik et al (1996), this model
was developed with the intention of measuring the risk of the Banks credit portfolio and the
amount of equity capital necessary to limit the probability of loss. The methodology of
measuring has evolved and moved away from its original market driven definition of risk to a
firm specific measure risk. RARAC can be used to measure the performance of different
types of businesses. If the business units’ RAROC is higher than the cost of the banks
equity, the minimum rate of return required by shareholders then the unit is deemed to be
adding value to the shareholders. The method used to assess the RAROC of the property
funds is the same as that developed by the Bankers trust in the 1970’s (Crouhy et al. 1999).
3.4 Chapter Summary
In this chapter the data, the data source and the research design implemented in the study
are described. The data for the different types of property investment vehicles are analysed
namely property unit trusts, property loan stocks, property development and holding
companies and real estate investment trusts with the intention of ascertaining which one of
these funds will be used as the sample data. The different methods that are used to assess
fund performance are described. The next chapter presents the results.

31
CHAPTER FOUR: DESCRIPTIVE DATA AND EMPIRICAL RESULTS
4.1 Introduction
This chapter presents the descriptive data and empirical results. Section 4.2.1 provides
descriptive statistics of the three fund returns over the eleven year period starting in January
2000 to December 2011. Section 4.3 presents performance of property funds using Jensen’s
alpha. Section 4.4 discusses performance of property funds using Sharpe ratio. Section 4.5
presents the performance of property funds using Treynor measure and Section 4.6
presents the performance of property funds using adjusted return on capital.
4.2 Descriptive Statistics
4.2.1 Descriptives of fund returns
Table 1 below presents the descriptive statistics of fund returns. The property loan stocks,
property unit trusts and real estate holding and development companies have a mean of
0.01339, 0.00974 and 0.00721 respectively. The property loan stocks have a median of
0.01060 while the property unit trusts and real estate holding and development companies
have a median of 0.0990 and zero respectively. There doesn’t seem to be a differential level
of risk between the returns of the property loan stocks and the property unit trusts as their
standard deviations are relatively close. On the other hand, the Real estate holding and
development companies have a slightly higher standard deviation showing that there is
possibly a higher level of risk associated with investing in this type of fund.
Table 1 – Characteristics of fund returns
4.2.2 Descriptives of yearly fund returns
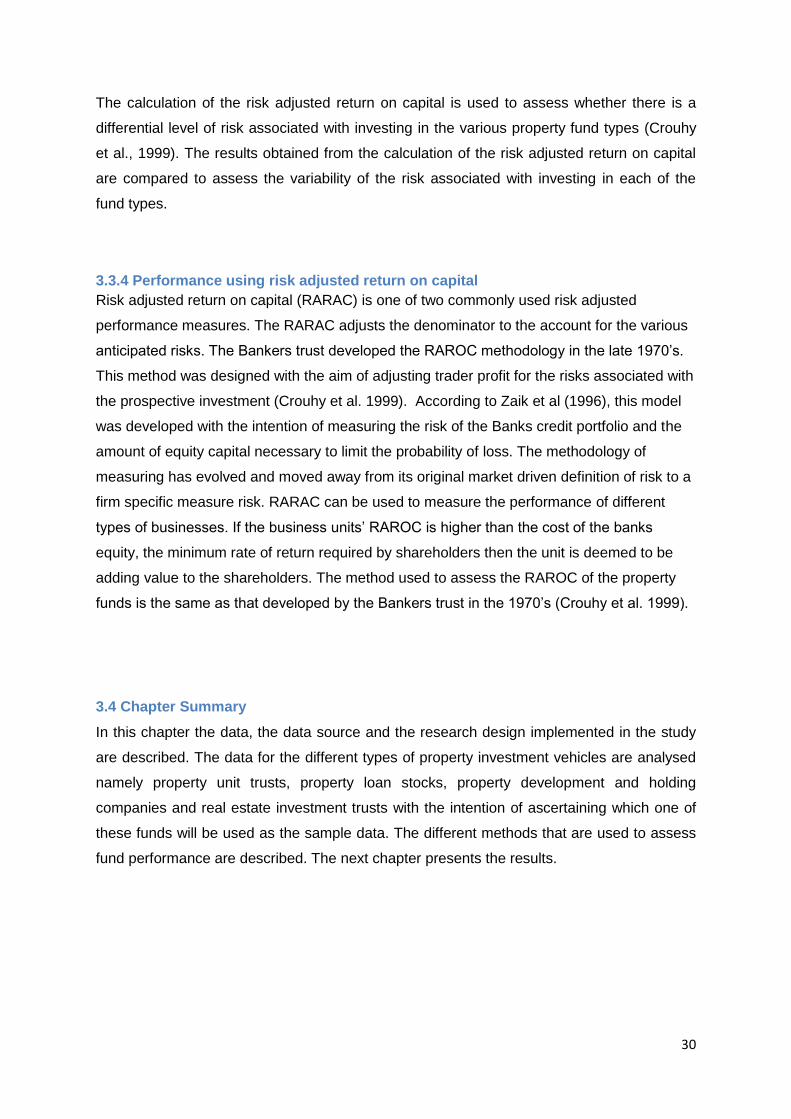
Table 2 below shows characteristics of the property funds returns on a yearly basis over the
period (2000 – 2011). An analysis of the mean return for the property loan stocks shows that
it has fluctuated between -0.3223 and 0.01664 over time. The property unit trust average
returns have followed a similar pattern with an average return ranging between -0.00847 and
Fund Types
Number
of Cases Mean Median Standard Deviation
Property Loan Stocks 14 0.01339 0.01060 0.07162
Property Unit Trusts 5 0.00974 0.00990 0.06012
Real Estate Holding and
Development companies 7 0.00721 0.00000 0.15647

32
0.01966 while real estate holding and development companies have fluctuated between
-0.2599 and 0.03890 over time. An analysis of the median for the property loan stocks
shows that it has fluctuated between -0.03132 and 0.02788 over time. The property unit trust
average returns have followed a similar pattern ranging between -0.2306 and 0.1611 while
real estate holding and development companies have fluctuated between -0.1980 and
0.02004 over time. An analysis of the standard deviation for the property loan stocks shows
that it has oscillated between 0.24718 and 0.03968 over time. The property unit trust
standard deviation has followed a similar pattern with a fluctuation between 0.03731 and
0.09669 while real estate holding and development companies have oscillated between
0.05525 and 0.26789 over time. The results of the standard deviation show that real estate
holding and development funds are associated with a slightly higher risk in comparison to
property loan stocks and property unit trusts.
33
Table 2 – Yearly Descriptives of fund returns
Year Mean Median Standard Deviation
2000 0.01753 0.00498 0.07220
2001 -0.02687 0.01339 0.24718
2002 -0.03223 0.00000 0.23666
2003 -0.00422 0.01871 0.24458
2004 -0.00941 0.01940 0.24207
2005 -0.00382 0.02788 0.21077
2006 -0.00368 0.02925 0.20003
2007 -0.00578 0.01919 0.18936
2008 -0.00344 -0.03132 0.22944
2009 0.00577 0.00225 0.05860
2010 0.01664 0.01569 0.03968
2011 -0.00598 0.00094 0.09578
2000 0.00779 0.01461 0.05297
2001 -0.00280 -0.00585 0.05312
2002 0.00574 0.01130 0.06259
2003 0.01966 0.00990 0.05726
2004 0.02252 0.01611 0.05304
2005 0.02262 0.02474 0.04564
2006 0.01019 0.01423 0.08342
2007 0.01534 0.02093 0.06687
2008 -0.00847 -0.02306 0.09669
2009 0.00698 0.00000 0.03680
2010 0.01242 0.00365 0.03731
2011 0.00307 0.00553 0.03792
2000 -0.00370 -0.00347 0.06864
2001 0.02603 0.00656 0.08216
2002 -0.00215 0.00000 0.05525
2003 0.01454 0.00000 0.18940
2004 -0.01152 0.00000 0.26789
2005 -0.00893 0.00000 0.22390
2006 0.03890 0.02004 0.15305
2007 0.01675 0.00000 0.11793
2008 -0.02599 -0.01980 0.09455
2009 0.01449 0.00357 0.12926
2010 0.00389 0.00000 0.09550
2011 0.01965 0.00000 0.12589
Panel 1: Property Loan Fund
Panel 2: Property Unit Trusts
Panel 1: Real estate holding and development funds
34
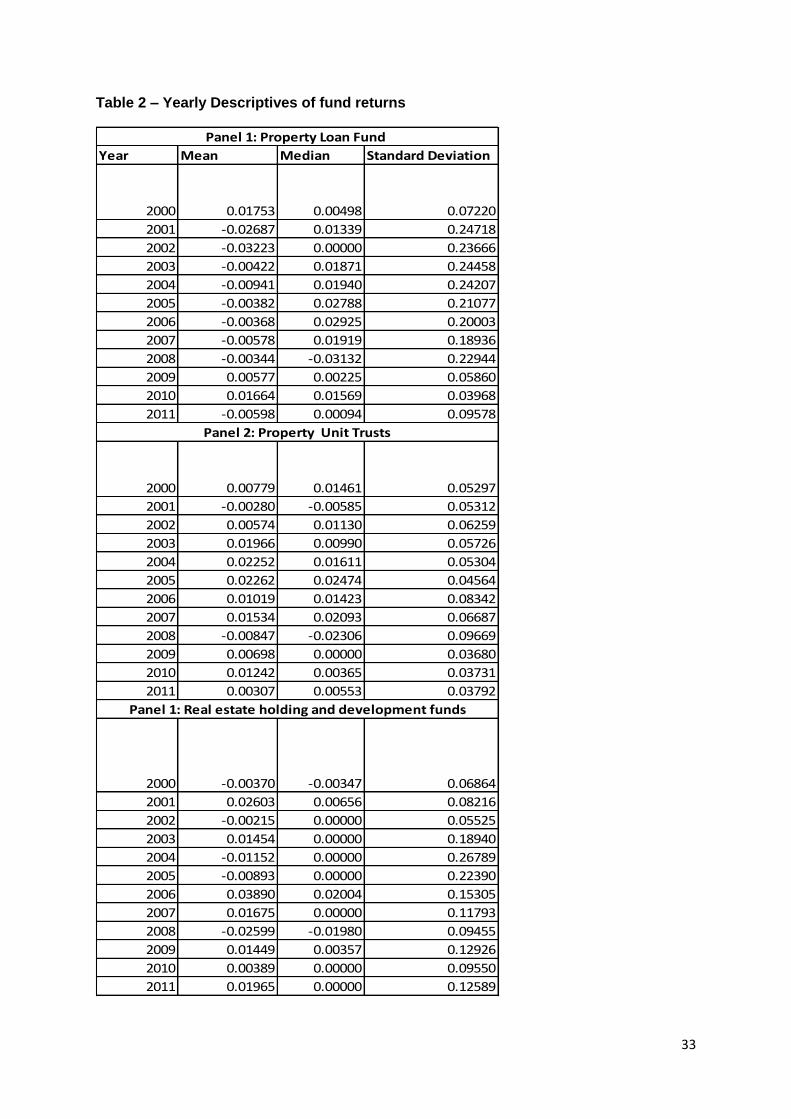
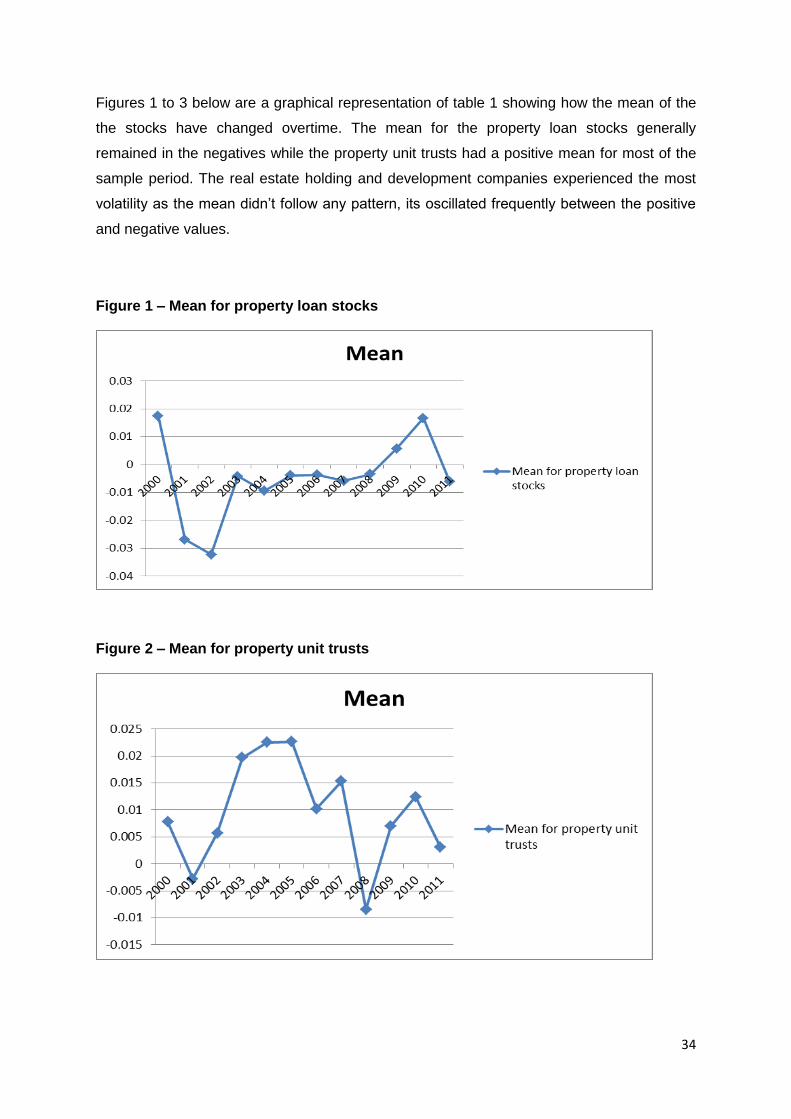
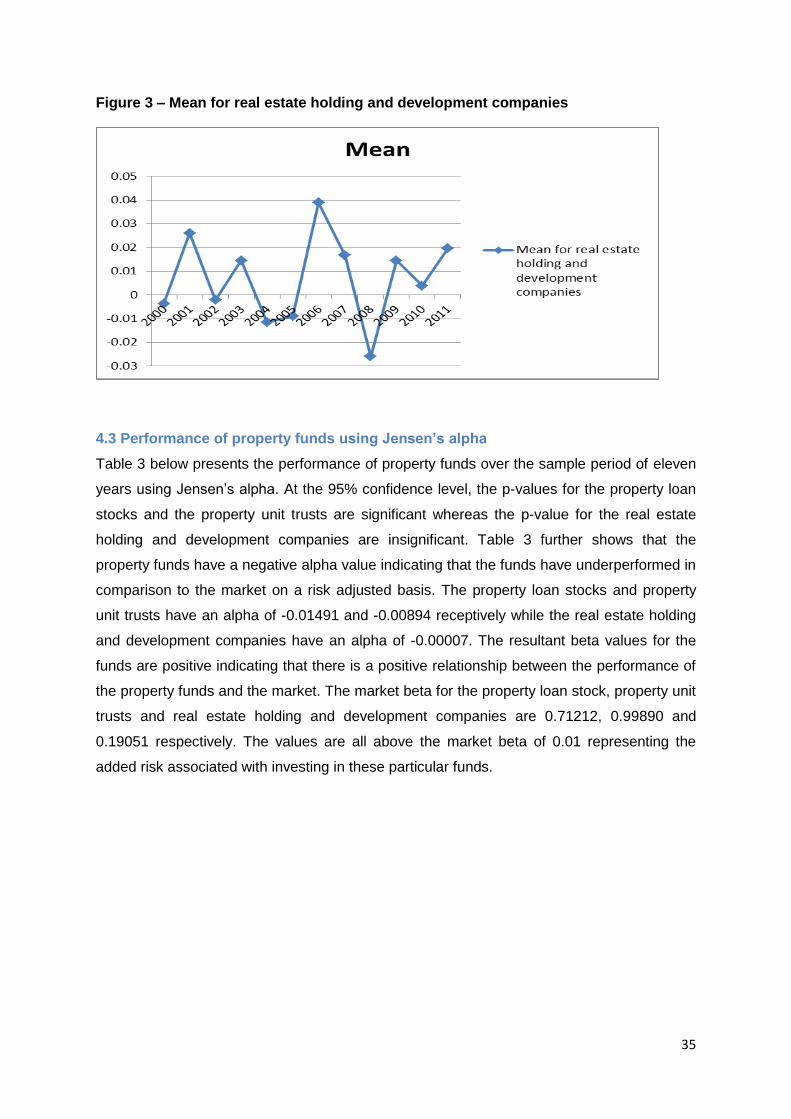
Figures 1 to 3 below are a graphical representation of table 1 showing how the mean of the
the stocks have changed overtime. The mean for the property loan stocks generally
remained in the negatives while the property unit trusts had a positive mean for most of the
sample period. The real estate holding and development companies experienced the most
volatility as the mean didn’t follow any pattern, its oscillated frequently between the positive
and negative values.
Figure 1 – Mean for property loan stocks
Figure 2 – Mean for property unit trusts
35
Figure 3 – Mean for real estate holding and development companies
4.3 Performance of property funds using Jensen’s alpha
Table 3 below presents the performance of property funds over the sample period of eleven
years using Jensen’s alpha. At the 95% confidence level, the p-values for the property loan
stocks and the property unit trusts are significant whereas the p-value for the real estate
holding and development companies are insignificant. Table 3 further shows that the
property funds have a negative alpha value indicating that the funds have underperformed in
comparison to the market on a risk adjusted basis. The property loan stocks and property
unit trusts have an alpha of -0.01491 and -0.00894 receptively while the real estate holding
and development companies have an alpha of -0.00007. The resultant beta values for the
funds are positive indicating that there is a positive relationship between the performance of
the property funds and the market. The market beta for the property loan stock, property unit
trusts and real estate holding and development companies are 0.71212, 0.99890 and
0.19051 respectively. The values are all above the market beta of 0.01 representing the
added risk associated with investing in these particular funds.

36
Table 3 – Performance of property funds over a sample period – Jensen’s Alpha
Hypothesis Testing of the Difference between Two Populations Means
The null hypothesis says that there is no significant difference in the returns that is
offered by both the Splice index and the Benchmark. The alternative hypothesis says there
is a significant difference in the returns from the Splice index and Benchmark. The
hypothesis testing will utilize a Student t distribution to reach a conclusion.
Splice index: = 0.014 = 1235 = 0.002128748
Benchmark: = 0.018 = 1235 = 0.002128699
α = .05
Calculation of Pooled Variance:
( -1)
+ ( -1)
(1235-1)X 0.002128748 + (1235-1) X 0.002128699
1235 +1235 – 2
= 0.002129
Measure
Property Loan
Stock Property Unit Trusts
Real estate holding and
develeopment companies
Alpha coefficient -0.01491 -0.00894 -0.00007
Beta coefficient 0.71212 0.99890 0.19051
Alpha t-stats -3.25292 -5.66266 -0.01151
Beta t-stats 7.49427 30.37390 1.46407
Alpha p-value 0.00117 0.00000 0.99082
Beta p-value 0.00000 0.00000 0.14363
Market beta 0.01400 0.01400 0.01400
Adjusted R2 0.04323 0.57831 0.00166

37
In the t test statistic a substitution can be made using the null hypothesis it can be
replaced in the equation by a zero.
t= - 0.2154
Considering the critical value of the t distribution α = 0.05 and 2468 degrees of freedom is
1.645. Since t calculated (-0.2154) is less than t critical (1.645) therefore we accept the null
hypothesis and conclude there is no difference in the returns generated by the spliced index
and the benchmark.
4.4 Performance of property funds using Sharpe ratio
Table 4 below presents the results of the Sharpe ratio measure. The Sharpe ratio calculates
the return per unit of risk for each of the property fund types. An analysis of the ratio’s
obtained for the funds shows that the property unit trusts and real estate holding and
development companies have positive Sharpe ratios which are 0.09251 and 0.01737
respectively while the property loan stocks have a negative Sharpe ratio of -0.07426. These
results suggest that the property unit trusts and the real estate holding and development
companies provide slightly better returns given the level of risk associated with investing in
the funds while the property loan stocks have performed worse than a risk free asset on a
risk adjusted basis.
Table 4 – Excess return per unit of risk - Sharpe ratio
4.5 Performance of property funds using Treynor ratio
Table 5 below presents the results of the Treynor ratio. A positive result is an indication that
the investment added value in relation to the risk associated with the investment while a
negative result is an indication that the investment performed worse than a risk free
instrument. The property unit trusts and real estate holding and development companies
have a positive Treynor ratio while the property loan stocks have a negative result. The
results of the Treynor ratio suggest that the property unit trusts and real estate holding and
Fund Type Sharpe Ratio
Property Loan Stocks -0.07426
Property Unit Trusts 0.09251
Real Estate Holding and Development companies 0.01737
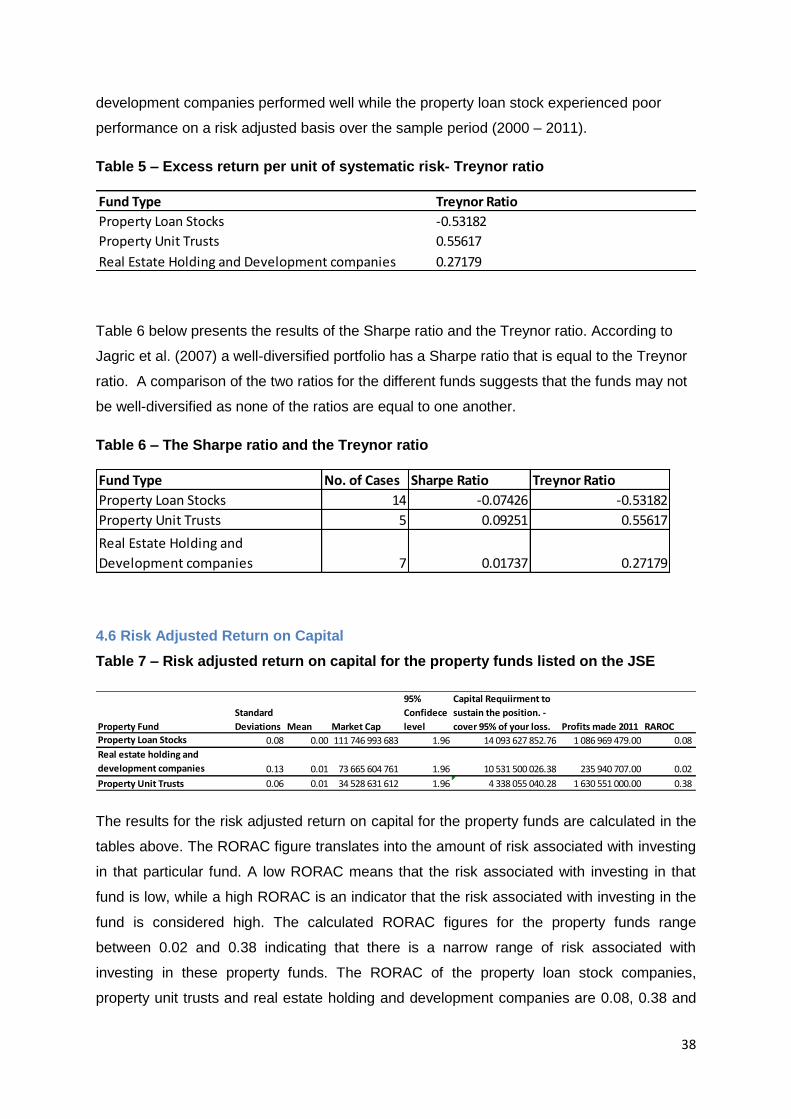
38
development companies performed well while the property loan stock experienced poor
performance on a risk adjusted basis over the sample period (2000 – 2011).
Table 5 – Excess return per unit of systematic risk- Treynor ratio
Table 6 below presents the results of the Sharpe ratio and the Treynor ratio. According to
Jagric et al. (2007) a well-diversified portfolio has a Sharpe ratio that is equal to the Treynor
ratio. A comparison of the two ratios for the different funds suggests that the funds may not
be well-diversified as none of the ratios are equal to one another.
Table 6 – The Sharpe ratio and the Treynor ratio
4.6 Risk Adjusted Return on Capital
Table 7 – Risk adjusted return on capital for the property funds listed on the JSE
The results for the risk adjusted return on capital for the property funds are calculated in the
tables above. The RORAC figure translates into the amount of risk associated with investing
in that particular fund. A low RORAC means that the risk associated with investing in that
fund is low, while a high RORAC is an indicator that the risk associated with investing in the
fund is considered high. The calculated RORAC figures for the property funds range
between 0.02 and 0.38 indicating that there is a narrow range of risk associated with
investing in these property funds. The RORAC of the property loan stock companies,
property unit trusts and real estate holding and development companies are 0.08, 0.38 and
Fund Type Treynor Ratio
Property Loan Stocks -0.53182
Property Unit Trusts 0.55617
Real Estate Holding and Development companies 0.27179
Fund Type No. of Cases Sharpe Ratio Treynor Ratio
Property Loan Stocks 14 -0.07426 -0.53182
Property Unit Trusts 5 0.09251 0.55617
Real Estate Holding and
Development companies 7 0.01737 0.27179
Property Fund
Standard
Deviations Mean Market Cap
95%
Confidece
level
Capital Requiirment to
sustain the position. -
cover 95% of your loss. Profits made 2011 RAROC
Property Loan Stocks 0.08 0.00 111 746 993 683 1.96 14 093 627 852.76 1 086 969 479.00 0.08
Real estate holding and
development companies 0.13 0.01 73 665 604 761 1.96 10 531 500 026.38 235 940 707.00 0.02
Property Unit Trusts 0.06 0.01 34 528 631 612 1.96 4 338 055 040.28 1 630 551 000.00 0.38

39
0.02 respectively. The 0.38 for the property unit trusts can be viewed as slightly high in
comparison to the other two types of funds but it is still within a reasonable range. All the
property funds have their different characteristics and investment strategies that drive their
ultimate performance in the property market so there is no way of determining which of the
factors used in the calculation is responsible for the high or low RORAC achieved. An
analysis of all the funds’ RAROC’s shows that the risk associated with investing in property
funds is relatively low suggesting that investors with a risk averse approach to investing
would be best suited to these types of investment. In summary, based on the above
calculations there doesn’t seem to be a differential level of risk associated with investing in
the various property funds listed on the JSE.
Chapter Summary
This chapter presents the results of the performance measures implemented. The results of
the descriptive statistics, Jensen’s alpha, Sharpe and Treynor ratio and the risk adjusted
return on capital are discussed and explained.
40
CHAPTER FIVE: DISCUSSION AND CONCLUSION
5.1 Introduction
This chapter discusses the results presented in chapter 4 and make a conclusion of the
study. Section 5.2 presents the discussion of the findings and section 5.3 presents the
conclusion.
5.2 Discussion of findings
Based on the results of the Jensen’s regression analysis there doesn’t seem to be a
noteworthy difference between the returns that can be achieved by the various property
funds listed on the JSE. These results are the same as those found by Nsibande (2006) and
Hardy and van Schoor (2010). Both Nsibande (2006) and Hardy and van Schoor (2010)
compared the performance of property loan stocks and property unit trusts and found that
there was no significant difference between the returns achieved from both investment
vehicles. All of the Alpha values obtained for the fund types indicate that the funds
underperformed in comparison to the market on a risk adjusted basis. The results obtained
for the alphas of the property funds are in line with those of Ferson and Schadt (1996) who
find the mutual fund unconditional alphas tend to be negative. These results are further
supported by Massa and Pitgiri (2009) who state that most fund managers find it difficult to
generate positive alphas as a result of taking on liquidity risk and holding illiquid assets to
maturity, such as those held by the property funds. A comparison between the beta of the
property funds and the market beta shows that there is a higher risk associated with
investing in these funds as opposed to the market. This finding is similar to that of Massa
and Patgiri (2009) who find that there is a higher level of risk associated with investing in
mutual funds that is mainly attributable to the incentive driven behaviour of the fund
manager. On the other hand these findings do not support the statement by Joseph and
Keim (1993) stating previous research shows that equity real estate investment trusts are
significantly positively correlated with the broader stock market returns. These results are
possibly different due to the composition of assets held by the two different types of
investment vehicles and the fact that although real estate investment trusts and the property
funds listed on the JSE are similar in nature but are different in the way they are governed.
An examination of the results for the Sharpe and Treynor ratio suggest that although the
property unit trusts and real estate holding and development companies seem to provide
slightly better returns given the associated risks, there is no difference between the results
obtained for the different funds. An analysis of the RORAC of the property funds listed on the
JSE supports the idea that there is no differential level of risk associated with investing in the
41
various types of property funds. The RORAC results for the funds all within a relatively low
range indicating that there is a low risk associated with investing in these funds. These
results further support the notion that the risk associated with investing in these property
funds is basically the same as there doesn’t seem to be a difference in the results obtained
for the RORAC. These findings are in line with those of Hardy and van Schoor (2010) and
Nsibande (2006).
In analysing the results of the standard deviation of the property funds there is a positive
relationship between the total returns and the standard deviations. Prior to the global
recession of 2008, the funds experienced high returns and high standard deviations.
Subsequent to the global recession it can be seen that the plunge in total returns was
coupled with a fall in the standard deviation. According to the IPD, an analysis of the various
property sectors shows that from a returns perspective the office, industrial and retail sectors
experienced significant decreases in total returns achieved subsequent to the global
recession in 2008 demonstrating that the performance of the property sector took strain
during the global recession of 2008 (Investment Property Databank, 2013).This shows that
the property market is affected by changes that occur in the macro – economy. These
results are in line with those of Brown (2000) who states that harsh economic conditions
have a negative effect on the performance of the property sector resulting in a decline in
book value, a depressed real estate market, decline in real estate values and increased
vacancy rates.
5.3 Conclusion
It appears that although there are slight differences between the results obtained from the
analysis of the regression of the funds returns against the benchmark there is no noteworthy
variance in the performances of the various funds listed on the JSE. This study has shown
that there are prominent fluctuations that have taken place within the property sector as a
result of changes that take place in the macro-economy. This study presents evidence that
the property sector is consistent in following the economic cycle through the fluctuations that
transpired and the movement of the property returns over the sample period (2000 – 2011).
These fluctuations and resultant performance of the funds need to be taken into
consideration when embarking on an investment of this nature. The level of risk associated
with investing in the property funds is similar as there is no noteworthy difference between
the results of the RORAC figures.
This research is an initial step towards evaluating the performance of the listed property
sector. It is hoped that the findings of the study will contribute to the body of knowledge of
42
investing in the listed property sector and assist investors, individuals as well as institutional,
in making more informed decisions that enable them to achieve their investment objectives.
Further Research
Further to the conclusions of this research paper, there are opportunities for auxiliary
research. A paper comparing direct property investment versus the stock market with the
aim of ascertaining which investment opportunity is more beneficial for the investor in the
long term could assist prospective investors in making more informed decisions. In pursuit of
diversification of one’s portfolio of assets, there are other types of investment that an
investor can consider such as mutual funds, bonds, cash and securities. Investors would
benefit from the investigation of these assets in order to determine which asset class has
outperformed the market on a risk adjusted basis and which one has the ability to hedge
against bearish market conditions.
Legislation governing the operation of property funds stipulates that there is a limit to the
amount of debt that property funds can incur. The structure and governance of the property
funds is such that the level of debt is not permitted to exceed certain limits. These limitations
are stipulated in the legislation governing the funds respectively (Hardy and van Schoor,
2010). Fund managers have to make these decisions on a regular basis in order to align the
investment decisions with the financial position of the firm. Research can be done to
establish the optimal level of gearing for property funds.
The South African property market has a new proposed property investment structure that
will convert all the property funds listed on JSE to a listed property investment vehicle that is
used in overseas countries, the real estate investment trust structure (reits). Property
professionals have expressed their concerns with respect to the structure of the property
funds in South Africa regarding foreign investment and how the current structure may be a
deterrent due to the misunderstanding of the funds as investment instrument instruments
(National Treasury, 2007). This new proposed structure is being implemented with the
intention of attracting foreign investment into the South Africa property market.
National Treasury have written a discussion paper wherein they highlight the main
advantages of adopting the real estate investment trust structure as an investment vehicle.
The following are identified as the core benefits of this internationally recognised structure.
One – Tax efficiency, the income earned from reits is added to the investors’ taxable income
and taxed at a marginal rate. Two – Diversification, reits provide an opportunity for investors
to enter various property sectors and invest in a wide variety of geographical regions. Three
43
– Liquidity, listed property entities can be easily traded as opposed to directly investing in
property that proves a highly illiquid investment. Four – Accessibility, Investors can easily
gain exposure to the property market with a minimum capital outlay. Five – Income oriented,
it is a reit requirement to pay out most of their income to investors making it an ideal
investment vehicle for pension funds and pensioners. Six – Good Governance, reits are
subject to listing rules as well as governance. (Source: National Treasury, 2007). The above
list of advantages is largely the same as the benefits associated with investing in the
property entities currently listed on the JSE. The main objective of the proposed structure is
to streamline the corporate layering within the property industry as well as to promote
investment in South Africa real estate and attract foreign investment (National Treasury,
2007). An investigation into the real estate investment trust structure would be beneficial for
investors so as to educate them on how their current and prospective property investment in
the listed sector operates and how this will affect their possible return on investment in
comparison to the current structure of the various funds.
44
References
Abumustafa, N. I. (2007). Risk Diversification in Emerging Economies. Risk Management,
Vol. 9, No. 1 (Feb., 2007), pp. 36-43.
Amit, R and Livnat, J (1988). Diversification and the Risk-Return Trade-off. The Academy of
Mangement Journal, Vol. 31, No. 1 (Mar., 1988), pp. 154 – 166.
Barkeley, F. (2012). Listed property Investments Report. Nedbank . Last accessed,
5May2012.
http://www.nedbank.co.za/website/uploads/files/Article_Listed_Property_Investments.pdf
Bollen, N.P.B and Busse, J.A (2004). Short –Term Persistence in Mutual Fund Performance.
The Review of Financial Studies. Vol. 18 No.2. August 2004.
Brown, D.T, (2000). Liquidity and Liquidation: Evidence from Real Estate Investment Trusts.
The Journal of Finance, Vol. 55 No. 1 (Feb., 2000), pp 469 – 485.
Brown, G and Liow. H, K. (2001). Cyclical relationship between commercial real estate and
property stock prices. Journal of Property Research, 2001, 18(4) 309 – 320.
Buchner, Glen. (2008). Methodologies used by property fund managers to evaluate
investment decisions. Unpublished thesis submitted to the Gordon Institute of Business
Science, University of Pretoria. Pretoria.
Catalyst fund managers – April 2012 report – building property returns. Last Acessed, 5 May
2012 http://www.catalyst.co.za/domestic/reports/reports2012/monthlyreportApr2012.pdf
Chang, E. C and Lewellen (1984). Market Timing and Mutual Fund Investment Performance.
The Journal of Business. Vol. 57, No. 1, Part 1 (Jan 1984), pp. 57- 72.
Crouhy, M, Turnbull, S.M and Wakeman, L.M. (1999). Measuring risk-adjusted
performance. Market risk Management, Canadian Imperial Bank of commerce. Volume 2,
No. 1, 1999.
Elton, E.J, Gruber, J.M and Blake, R. C (1996). Survivorship Bias and Mutual Fund
Performance. The Review of Financial studies Winter 1996. Vol 9, No 4, pp. 1097 -1120.
45
Equinox (2011) Available from: http://www.equinox.co.za/article_405.html date accessed, 29
August 2012
Equinox (2011) Available from: http://www.equinox.co.za/, date accessed, 28 August, 2012).
Fischer. S and Easterly. W (1990). The Economics of the Government Budget Constraint.
The World Bank Research Observer, vol. 5, no. 2 (July 1990), pp. 127 – 42.
Ferson, W.E., and Schadt, R.W., 1996, Measuring Fund Strategy and Performance in
Changing Economic Conditions, Journal of Finance 51, 425-462.
Fourie, M.P.W (2009). Attracting Investment into South Africa Property Investment Vehicles:
Evaluating Tax. Submitted in partial fulfilment of the requirements of the degree Bachelor
Magister Commerce Taxation. In the Faculty of Economic and Management Sciences at the
University of Pretoria.
Grant, A.T and Kingsnorth, G.A (1966). Unit Trusts and Equity Linked endowment
assurances. Cambridge University Press, Vol. 30. No. 225 (1966-68), pp. 17 -80.
Grinblatt, M, Titman, S and Wermers, R (1995). Momentun Investment Strategies, Portfolio
Performances, and Herding: A Study of Mutual Fund Behaviour. The American Economic
review, Vol. 85, No. 5 (Dec., 1995), pp. 1088 - 1105
Grinblatt, M and Titman, S. (1993). Performance measurement without benchmarks: An
Examination of Mutual Fund Returns. The Journal of Business. Vol. 66, No. 1 (Jan., 1993),
pp. 47-68.
Grinblatt, M and Titman, S (1992). The Persistence of Mutual Fund Performance. The
Journal of Finance. Vol XLVII, No. 5 December 1992.
Hardy, H and van Schoor, M. (2010). An analysis of Property Unit Trusts and Property Loan
Stock Companies listed on the Johannesburg Stock Exchange in order to determine which
of these two special purpose vehicles is optimal in terms of governance, tax efficiency, and
achieving returns for their investors. Submitted in partial fulfilment of the requirements for the
award of the Degree of Bachelor of Commerce Financial Analysis and Portfolio
Management. University Of Cape Town.
46
Hager, P.D and Lord, D.J (1985). The property market, property valuations and property
performance measurement. Journal of the Institute of Actuaries (1886 - 1994), Vol. 112, No.
1 (June 1985), pp. 19 – 60.
Hensel, C.R, Ezra, D.D and Ilkiw (1991). The importance of the Asset Allocation Decision.
Financial Analysts Journal, Vol. 47, No. 4 (July – Aug., 1991), pp. 65 – 72.
Hess, A.C and Kamara, A. (2005). Conditional Time-varying Interest rate risk Premium:
Evidence form the treasury bill futures market. Journal of money, credit and banking, Vol 37,
No. 4 (August 2005).
Investment Property Databank (2013). Available from www.ipd.co.za last accessed 23
January 2013.
Jensen, (1969). Risk, The pricing of Capital Assets, and the Evaluation of Investment
portfolios. Journal of Business. Vol.42 No. 2 (Apr., 1969), pp 167 – 247.
Joseph, G and Keim, D (1993). Risk and Return in Real Estate: Evidence form a Real
Estate Stock. Financial Analysis Journal, Vol 49, No. 5 (Sep – Oct., 1993), pp 39 – 46.
Jagric, T, Podobnik, B, Strasec, S and Jagric, V (2007). Risk-Adjusted performance of
mutual funds: Some tests. South-Eastern Europe Journal of Economics 2 (2007) 233-244.
Johannesburg Stock Exchange. (2012) Johannesburg Stock Exchange Equity Markets.
Availablefrom:http://www.jse.co.za/Libraries/Products_-_Equity_Markets
Presentations/REITs.sflb.ashx last accessed 25 September 2012.
Kahn and Rudd (1995). Does Historical Performance Predict Future Performance? Financial
analysts journal, vol. 51, No. 6 (Nov – Dec., 1995), pp. 43-52.
Kaminsky, G. L, Lyons, R.K and Schmukler, L. S. (2001). Mutual Fund Investment in
Emerging Markets: An Overview. The World Bank Economic Review, Vol. 15, No. 2 (2001),
pp. 315 – 340.
Kothari, S.P and Warner, J.B. (2001). Evaluating Mutual Fund Performance. The Journal of
Finance. Vol. LVI, No. 5.
Kahn and Rudd (1995). Does Historical Performance Predict Future Performance? Financial
analysts journal, vol. 51, No. 6 (Nov – Dec., 1995), pp. 43-52.
Mayya, M. R. (1977), Do Equities Act as a Hedge against Inflation? Economic and Political
Weekly, 12, No. 22.
47
Massa, M and Patgiri, R(2009).Incentives and Mutual Fund Performance: Higher
Performance or Just Higher Risk Taking? The Review of Financial Studies, Vol. 22, No. 5
(May, 2009), pp. 1777-1815.
Nielsen, L. T and Vassalou, M. (2004). Sharpe Ratio’s amd Alpha’s in continuous time. The
Journal of Financial Quatitative Analysis. Vol.39 No.1 (Mar 2004) pp 103 – 114.
Nsibande, C Muzi, 2006, Performance of Property Unit Trusts and Property Loan Stocks:
Property Investment Trusts - comparison of performance. Unpublished paper in fulfilment of
the masters in business administration course. Submitted to the University of the
Witwatersrand. Johannesburg.
Prince, T and Bacon, F. (2010) Analysing Mutual Fund performance against established
performance benchmarks: A test of Market efficiency. Research in Business and Economics
Journal.
The discussion paper on Reforming the Listed Property Investment Sector in South Africa.
National Treasury’s discussion paper on reforming the listed property investment sector in
South Africa, Discussion paper, 3 December 2007.
The association of property unit trusts – Last accessed 5 May 2012 at http://www.put.co.za/
Verick, S. And Islam, I. (2010). The great recession of 2008 – 2009: Causes, Consequences
and policy responses. IZA Discussion Paper No. 4934.
Wheaton, W.C (1999). Real Estate “Cycles”: Some Fundamentals. Real Estate Economics.
Volume 27 (2) 209 -230.
Zaik, E., Walter, J., Kelling, G., and James, C. (1996). RAROC at Bank of America: From
theory to practice. Journal of Applied Corporate Finance, 9(2), 83±92.Volume 2/Number 1,
Fall 1999.

48
APPENDIX 1: MONTHLY ASSET CLASS RETURN SERIES
APPENDIX 2: MARKET BETA CALCULATION (2000 -2011)