a comparative study of ordinary cross-validation, r-fold...
TRANSCRIPT

Biometrika (1989), 76, 3, pp. 503-14Printed in Great Britain
A comparative study of ordinary cross-validation, r-foldcross-validation and the repeated learning-testing methods
BY PRABIR BURMANDivision of Statistics, University of California, Davis, California 95616, U.S.A.
SUMMARY
Concepts of u-fold cross-validation and repeated learning-testing methods have beenintroduced here. In many problems, these methods are computationally much lessexpensive than ordinary cross-validation and can be used in its place. A comparativestudy of these three methods has been carried out in detail.
Some key words: Ordinary cross-validation; Repeated learning-testing method; u-fold cross-validation.
1. INTRODUCTION
Model selection has attracted the attention of many researchers. One of the mostwell-known methods is ordinary cross-validation. Much work has been done on this, forexample Stone (1974, 1977), Bowman (1984) and Hardle & Marron (1985). However,the difficulty with ordinary cross-validation is that it can be computationally very expen-sive in a number of practical problems, for example L1 regression, tree structured methodsfor classification and regression (Breiman et al., 1984), estimation of the optimal transfor-mations of variables for correlation and regression (Breiman & Friedman, 1985). Wehave therefore recently introduced two techniques (Burman, 1989) in a study of theoptimal transformations of variables. We call them corrected u-fold cross-validation andrepeated learning-testing methods. These methods can be used in the place of ordinarycross-validation whenever the latter is computationally very expensive. In this presentpaper we study these methods in detail.
The organization of the paper is as follows. In § 2 we introduce the concepts of u-foldcross-validation and the repeated learning-testing methods. In § 3 we discuss the stabilityof our estimates. In § 4 we present a few simulation results on various aspects of ourproposed estimates. We then summarize our findings in § 5. Section 6 presents a fewtechnical results to support our simulation study, and finally we give proofs in § 7.
2. y-FOLD CROSS-VALIDATION AND REPEATED LEARNING-TESTING METHODS
2 • 1. General descriptionIn this section we describe u-fold cross-validation and repeated learning-testing
methods, demonstrate the need for bias correction and introduce the proper correctionterms. The concepts of y-fold cross-validation and repeated learning-testing methods arenot new. They are discussed by Breiman et al. (1984, Ch. 3, 8). Based on their simulationstudies they concluded that these methods do not always work. To rectify that we haveintroduced certain correction terms. Burman (1989) showed that with these correctionterms u-fold cross-validation and repeated learning-testing methods work very well for

504 PRABIR BURMAN
model selection purposes. Here we study various aspects of these methods in detail. Isy-fold cross-validation a better method than repeated learning-testing? For what valuesof v does u-fold cross-validation work best?
Let Z , , . . . , Zn be independent and identically distributed observations with distribu-tion function F and let Fn be the empirical estimate of F. Our goal is to estimate aquantity of the form
sn=\ T(z,Fn)dF(z). (2-1)
We may also wish to estimate E(sn), which could be estimated by ordinary cross-validation. We introduce three other methods for estimating sn. We first give a fewexamples of T and sn.
Example 1. Let Zi = {Yi,Xi) (i = 1 , . . . , n) be independent and identically distributedrandom variables and let /x(x) = E(YX\XX = x) be the regression function. If we approxi-mate the regression function by a polynomial of degree k, estimate the parameters byleast-squares and denote the estimated regression function by /2k(x), then z = (y, x),
y-jik(x)}2dF(x,y).
Here sn is the predictive error. In model selection problems we estimate sn for variousvalues of k and choose that value of k for which the estimated value of sn is the smallest.
Example 2. Let Z = (Y, Xx,..., Xd) be a vector of univariate random variables. Breiman& Friedman (1985) considered transformations h( Y), </>,(X,),..., <pd(Xd) of the variablesY, Xi,..., Xd such that
Transformations h*, <j>*,..., <f>* are called optimal if they minimize
e\h, <}>x,...,<l>d) = E{h{Y)- <t>x{Xx) - . . . - <f>d{Xd)}2.
Assume that we have a data set of size n and estimate the optimal transformations usingsplines with k0, kx,..., kd knots respectively. If h, $x,..., <f>d are the sample estimatesof the optimal transformations, then the predictive error is
In this example, sn is the quantity above and we are interested in estimating it for variousv a l u e s k0, kx,...,kd.
Example 3: L regression. Consider the regression problem in Example 1. Let 60,..., 6d
be the estimates obtained by minimizing
1 1 y, - 0O- etx, - e2x2 -... - ekx%
i=l
Let (X, Y) be independent of (X,, Y,) (i = 1 , . . . , n). Then the prediction error is
E(\Y-eo-eix-...-ekxk\\Yi,xi, , = i , . . . , « ) .
Here sn is the quantity given above. The L1 method is typically used to get a robustestimate of the regression function. It is known that a good deal of computing is neededto calculate the estimates 60,...,dd.

Comparative study of cross-validation 505
In the last two examples ordinary cross-validation could be computationally veryexpensive and there thus arises the need for alternative methods. Let us now formallyintroduce the concepts of u-fold cross-validation, the repeated learning testing and therepeated u-fold cross-validation methods.
2-2. v-fold cross-validationWe first divide the data randomly in v groups so that their sizes are as nearly equal
as possible. Let the size of the ath group be ma and assume that [n/v]^ ma ^ [n /u ] + lfor all a. Let Fna be the empirical estimate of F based on all the na = n-ma observationsoutside group a and let Fna be the estimate of F based on the ma observations in groupa. Then a u-fold cross-validated estimate of sn is given by
- - i p. \«=i a J
cvnv= Zpa] T(z, Fna) dFna(z),
where pa = ma/n. Note that pa — v~l for all a.Let s = j T(z, F) dF(z). If we assume that T(., Fn) can be expanded about T(., F)
and note that na — (v — !)«"'n for all a, then
where c0 is a constant depending on T and F. Consequently,
E(cvnv-sn) — (u- l )" 1 ^"" 1 - (2-2)
For ordinary cross-validation, that is u = n, the right-hand side of the last expression isO{n~2), but when v is small, say u = 3 or 4, this term is not necessarily very small.Simulation results presented in § 4 clearly bring this out. Also the term c0 is of the orderof k, the number of parameters being estimated. Indeed, for the regression case in Example1, if we fit a polynomial of degree k, then c0 is a constant times fc +1. So cvnu may turnout to be a poor estimate of sn if the number of parameters is not small. This observationis consistent with Stone's response to Geisser's comment (Stone, 1974).
Thus a correction term for cvnp is needed. We show later that the following workswell. Let
cv*nv = Zpa J T(z, Fna) dFna(z) + ̂ T(z, Fn) dFn(z)-j:pa J T(z, Fna) dFn(z). (2-3)
As shown in § 6,
(-(u-ir 'c.n"2 (2-4)
for some constant c, depending on T and F. Expressions (2-2) and (2-4) show that thecorrected u-fold cross-validated estimate cv*u works much better than cvnu asymptoticallyas n increases; the correction term is negligible when v — n.
506 PRABIR BURMAN
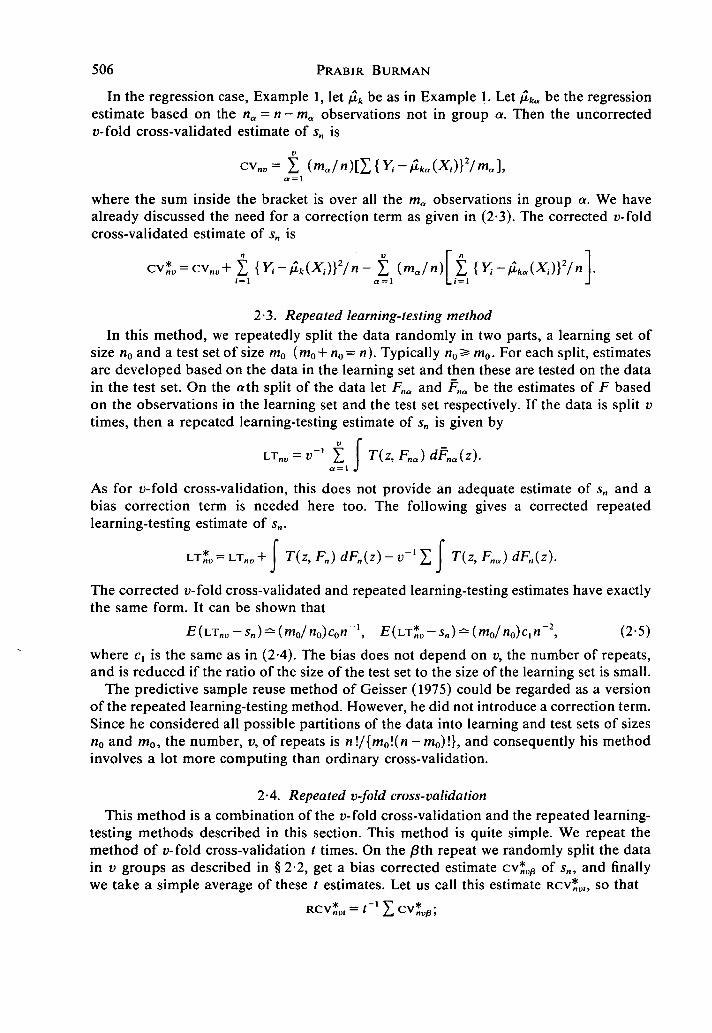
In the regression case, Example 1, let jxk be as in Example 1. Let (Lka be the regressionestimate based on the na = n — ma observations not in group a. Then the uncorrectedu-fold cross-validated estimate of sn is
cvno = X (ma/
where the sum inside the bracket is over all the ma observations in group a. We havealready discussed the need for a correction term as given in (2-3). The corrected u-foldcross-validated estimate of sn is
/i- t {mjn)\i {Y.-jla = l Li=l
2-3. Repeated learning-testing methodIn this method, we repeatedly split the data randomly in two parts, a learning set of
size n0 and a test set of size m0 (mo+ no = n). Typically no3= m0. For each split, estimatesare developed based on the data in the learning set and then these are tested on the datain the test set. On the ath split of the data let Fna and Fna be the estimates of F basedon the observations in the learning set and the test set respectively. If the data is split utimes, then a repeated learning-testing estimate of sn is given by
I T(z,Fna)dFna{z).
As for u-fold cross-validation, this does not provide an adequate estimate of sn and abias correction term is needed here too. The following gives a corrected repeatedlearning-testing estimate of sn.
T(z, Fna) dFn(z).
The corrected u-fold cross-validated and repeated learning-testing estimates have exactlythe same form. It can be shown that
E(uTnv-sn)^(m0/no)con~l, E(hT*v-sn)^(mo/no)cin~2, (2-5)
where c, is the same as in (2-4). The bias does not depend on v, the number of repeats,and is reduced if the ratio of the size of the test set to the size of the learning set is small.
The predictive sample reuse method of Geisser (1975) could be regarded as a versionof the repeated learning-testing method. However, he did not introduce a correction term.Since he considered all possible partitions of the data into learning and test sets of sizesn0 and m0, the number, v, of repeats is nl/{mol(n -m0)!}, and consequently his methodinvolves a lot more computing than ordinary cross-validation.
2-4. Repeated v-fold cross-validationThis method is a combination of the u-fold cross-validation and the repeated learning-
testing methods described in this section. This method is quite simple. We repeat themethod of u-fold cross-validation t times. On the /3th repeat we randomly split the datain v groups as described in § 2-2, get a bias corrected estimate cv*^ of sn, and finallywe take a simple average of these t estimates. Let us call this estimate Rcv*w, so that

Comparative study of cross-validation 507
Rcvnu, has about the same bias as cv*;
However, a variance calculation shows that it may be better to use a uf-fold correctedcross-validated estimate rather than RCV*,,,; see § 3.
3. STABILITY OF THE ESTIMATES
We now compare the stability of the ordinary cross-validated estimate of sn with thosedefined in § 2.
Retaining only the terms of order n~2 and higher, we get, see § 6,
\ar (cwnn- sn)- yon'1 + yln~2 + 2y2n~2,
var(cv* y -s n ) -y 0n~' + t>(u-ir1y1n-2 + 2y2n-2. (3-1)
Here yo>0, Ti>0 and y2 are constants depending on T and F. Thus
var (cv*u - sn) > var (cvnn - sn).
However, the difference is {v-\)~xyxn~2 and this decreases as v increases. So we canexpect the difference to be small for v > 2 and this is supported by simulation. Theexpression for var (cvnv-sn) is not pretty, but it can be shown that
var (cvno -sn) = var (cv*u-sn) + O((v- l)'ln~2);
see § 6. In the regression case it can be shown that it is larger than var (cv*o-jn) andvar (cvnn — sn). We believe this to be true always, but do not have a proof. However, asexpected, the difference between var (cv*,, - sn) and var (cvn i )-sn) is negligible as vbecomes large.
Now consider the repeated learning-testing estimate. Even though LT*,, has a smallbias as an estimate of sn, its variance is not as small as we want it to be. Retaining termsof order n"1 we get
var (LT*0 -sn)^{l + no/(mov)}yon~\
var(L.T*v-sn)-var(cvnn-sn)^no/(mov)yon-1.
Recall from § 2 that
£(LT*o-Sn) = (fM0/«0)c,«"2.
As the ratio mo/no decreases the bias becomes smaller but the variance increases. Theonly way we can reduce variance in the learning-testing case is by increasing v, thenumber of repeats. From a computational point of view, it seems that u-fold cross-validation is better than the repeated learning-testing method. As in the case of u-foldcross-validation, the expression for var (LTnv-sn) is not a nice one; see § 6.
Finally, consider the repeated u-fold cross-validated estimate as given in § 2-4. It turnsout that
var(RCvL-5 n ) -y o n- 1 + / ( f - l ) - 1 (u- l ) - 1 y 1 «~ 2 + 2y2n-2, (3-2)
where y0, yi and y2 are as in (3-1). An easy calculation shows that the expression in(3-2) is larger than the variance of the corrected uf-fold cross-validated estimate, thoughthe difference ^"'(u — I)~1-y1n~2 is rather small. In repeated u-fold cross-validation, theestimate T(. , .) has to be calculated vt times, as it has to be in the case of uf-foldcross-validation, so that we may be better off using irt-fold cross-validation than repeatingu-fold cross-validation t times.

508 PRABIR BURMAN
4. SOME SIMULATION RESULTS
In this section we present some simulation results for a regression model. The correctregression is a quadratic model but we fit a linear model to it. Let
Ywhere
), 1), e~N(0,2), p(x) = x\x\--X and e being independent. Based on a data set of size n we estimate the linear regressiond + bx by least-squares. We want to estimate
stt = E{(Y-a-bX)2\(Xt, Y,), i = 1 , . . . , «} .
We consider two sample sizes, n = 12 and n = 24. For u-fold cross-validation we randomlysplit the data in v groups and calculate the linear regression da + bax by least-squaresbased on all the observations not in group a. The uncorrected u-fold cross-validatedestimate of sn is
cvnv= £ (ma/n){I(y,-fla-to)7ma},
where the sum inside the second bracket is over all the ma observations in group a. Thecorrected u-fold cross-validated estimate of sn is
cv*u = cvnu+£ (Y,-d-bXt)2/n- £ (mjn){i (y;-ao-to)7«]-
1 = 1 a = l l i = l J
For the repeated learning-testing method, n0 and m0 are the sizes of the learning and thetest sets and v is the number of times the data has been split. The uncorrected repeatedlearning-testing estimate is
LT^IT1 £ (KYi-4 -to)7m0},
where the second sum inside the second bracket is over all the m0 observations in thetest set on the ath split of the data.
The corrected repeated learning-testing estimate is
LT*, = LTnu + £ (Y, - a - WC)2/n - v~l £ f £ (Y,,- aa - to)2/«]•i=l a = l l l = l J
The simulations in Tables 1, 2 and 3 are based on 40 000 repeats. In Table 1 we havecalculated E(cvtv-sn), E(cvno-sn), and the standard deviations of cv* u -s n andcvnu — sn for various values of v. The case v = n is evaluated only for the uncorrected case;cvnn is the ordinary cross-validated estimate of sn.
Table 1 shows that the bias of cv*u is always smaller than that of cvnu and c\*v hasa smaller variance than cvnu even though the difference is quite small when n = 24 andv>3. The simulations support the observations in §§2 and 3 that the performance ofcv*u is worst when v = 2. Though it seems that the bias for cv*p initially decreases andthen increases, there is no reason to support that simply because the standard error isabout 001 when n = 12 and is about 0004 when n = 24.
Table 2 gives results for the repeated learning-testing method for various values ofPo= "»0/n, t n e proportion of observations in the test set. For each p0, we consider twovalues of v, v = [l/p0] and v = [2/p0], where [.] is the integer part of a number. Thereason for these two choices is as follows. If p0 = j and v = [ l/po] = 3 then we are calculating

Comparative study of cross-validation 509
Table 1. Biases and variances of uncorrected and corrected v-fold cross-validated estimates
12 2-566 £ (cv , , t - j n ) 0-78 0-31 0-20 014 012 006£ ( c v j o - s n ) 016 005 004 001 003st. dev. (cv,,u-s,,) 2-66 1-79 1-62 1-54 1-49 1-41st. dev. (cv*D-sn) 1-79 1-54 1-48 1-44 1-42
24 2-321 E(cv,,v-sn) 0-25 Oil 007 005 004 002E(cv*v-sn) 002 0002 0-0001 00004 0-002st. dev. ( c v m - s n ) 1-05 0-88 0-84 0-82 0-80 0-78st. dev. (C\*v-sn) 0-86 0-81 0-80 0-79 0-78
t The case for v = n corresponds to ordinary cross-validation.
Table 2. Biases and variances of uncorrected and corrected repeated learning-testingestimates; v, number of repeats
n E(sn)
12 2-566
24 2-321
the regression line three times for three learning sets. Three-fold cross-validation corre-sponds to the case po = \ and v = 3 in the sense that test set sizes are about one-third ofthe data and the regression line has been calculated three times. When p0 = j and v = 6we have 6 learning sets and consequently we have to estimate the regression line 6 times.
As we have discussed earlier, the variances of the repeated learning-testing estimates,corrected and uncorrected, decrease as v, the number of repeats, increases. However, asshown in (2-5), the biases do not depend on the number of repeats. The simulation resultssupport these facts and also show that the bias of LTnu is always larger than that of LT*U .As for u-fold cross-validation, it appears that vr*v has a smaller variance than LTnu, butthe difference seems to be quite small when n=24 and u>3. Comparison of Tables 1and 2 shows that cv*r and LT*U have about the same biases, but var (cv*u)<var (LT*,,).
For a fixed data set the value of the corrected and the uncorrected u-fold cross-validatedestimates vary from partition to partition. Table 3 is based on a simulation studyof this variability. For the quantities £{var (cvnv\3£n)}, £{var(cv*p|2Tn)} given inTable 3, the variance is first taken over random partitions for a given data set2£n = {Zi = {Yi,Xi): i = 1,...,«} and then the expectation is taken over 2tn. Tables 1 and3 clearly show that £{var (cvnu|3Tn)} and £{var (cv*,,!^,,)} are quite small compared tothe variances of cvnv-sn and cv*u-sn .
Table 3. Variability of the estimates over the partitions
n = l2 n=24v = 2 v = 3 v = 4 v = 5 v = 6 v = 2 v = 3 v = 4 v = 5 v = 6
£{var(cvJ3rn)} 0046 0037 0029 0025 0032 0014 0011 0008 0008 0006£{var(cv*c|arn)} 0023 0023 0021 0019 0025 0008 0008 0006 0007 0005
E(LTnv-Sn)E(i.T*v-sn)st. dev. (LT,w-sn)st. dev. (LT*v-sn)
E(LT,,V-Sn)E(LT*V-S,,)
st. dev. (LTnv-sn)st. dev. (LT* -sn)
Pov = 2
0-740142-591-78
0-260-021090-93
— 2
v = 4
0-750142191-59
0-240010-980-85
Pov = 3
0-310051-931-68
0120011010-95
— 3
v = 6
0-320061-741-53
0-120010-920-87
Pov = 4
0190031-871-71
0080011020-98
= 5u = 8
0-200041-651-53
0080010-920-88
Pov = 5
0110021-851-76
005001106103
= 5y = 10
0120031-651-58
0 0 4-0003
0-940-91
Pot> = 6
0130041-821-73
004-0001
1-020-99
i > = 1 2
0120-021-611-54
004-0001
0-900-88

510 PRABIR BURMAN
5. CONCLUSIONS
In summary whenever ordinary cross-validation is computationally very expensive, wecan use i>-fold cross-validation or the repeated learning-testing methods. If v is not largethe uncorrected u-fold cross-validated estimate or the uncorrected repeated learning-testing estimate may have large biases. Thus we recommend that the correction termsgiven in § 2 should be routinely used.
The corrected r-fold cross-validated estimate is preferable to the corrected repeatedlearning-testing estimate because the former has a smaller variance.
The bias and the variance of the y-fold cross-validated estimate decrease as v increases.From a practical point of view, 2-fold corrected cross-validation should be avoided ifpossible.
For the corrected repeated learning-testing estimate, the bias depends on the ratiomo/"o> the ratio of the size of the test set to the learning set, and not on the number ofrepeats v. The smaller the ratio mo/no, the smaller the bias. However, the smaller theratio no/(mov), the smaller the variance.
6. SOME TECHNICAL RESULTS
This section gives a few technical results on the biases and the variances. More detailsappear in an unpublished technical report. We assume that for any z, 7(z,.) is von Misesdifferentiate with derivatives 7, and 72 (Serfling, 1980, Ch. 6). This condition can berelaxed a little. For all the results in this section, we keep only the dominant terms. Allproofs we present here can be made rigorous with careful analysis (Beran, 1984; Serfling,1984). Let Dn = Fn- F, Dna = Fna - F, Dna = Fna - F,
nE | {T(z, Fn)-T(z, F)}
- E J {7,(z,, z, Fn)- 7,(2,, z, F)} dDn(Zl) dDn(z) = c,«-2+ O{n~*).
Note that the constants c0 and c, depend on 7 and F.
THEOREM 6-1. We have that(a) E(cvnv-sn)^(v-l)-lc0/n,
(b) F.(LTm,-Sn)-(/7Jo//!o)Co/n,(c) £(cv*u-sn)-(i>-ir1c,/«2,(d) E(VT*V-sn)^(m0/no)cjn2,(e) F . (RCvL-s n ) - (u- l ) - 1 c , /n 2 .
To find c0 and c, in the regression case of Example 1, let us assume that the regressionfunction \L is linear,
where e and X are independent normal random variables, F.(e) = 0 and var(e) = o-2.Then c0 = 2cr2 and c, = 4cr2. Now
E(cvnv-sn)-2(T\V - l r ' i T 1 , £(cvnn -sn)*±2a2n~2,
If the regression function fi is not linear, but we fit a linear regression, then theexpressions for c0 and c, are not so simple because they include terms involving the bias

Comparative study of cross-validation 511
function fe(x) = /*(*)-/*,(*), where nl(x) = a + bx is the least-squares linear modelclosest to fx.
Next, for any a, let
T(z)dDn(z)J = y0.
Tx{zx,z) dDna{zx) dDna{z)
+ J Tl(zl,z)dDna(zl)dDna(z)} =
[Jx [ J Uz2, zx,z) dDna(z2) dDna{zx) dDnQ
Then y0, y, and y2 are constants depending on T and F and y, > 0. Since ma — n/v forall a, two quantities described above are meaningful.
THEOREM 6-2. We have(a) var(cv*1)-5n)-y0/n + y(i '-l)"171 /(b) var (LT*,,-sn)-{1 + no/(mov)}yo/n,(c)(d)
As a consequence of Theorem 6-2 we get the following result.
COROLLARY 6-3. It follows that(a) var (cv*r - sn) ^ var (cvnn -s n ) + (u - \)~xyjn2,(b)(c)
Theorem 6-2 and Corollary 6-3 show that LT^ is a poorer estimate of sn than cv*u.Also var (cv* r-s n)> var (cvnn-5n), but the difference becomes small as v increases.
The expressions for the variances of cvno — sn and LTnu — sn are quite complicated. Herewe give only the expression for var (urnv-sn). Let
J j j T(z)THEOREM 6-4. We
(a)(b)
Corollary 6-3 shows that cv*a, the corrected u-fold cross-validated estimate, has alarger variance than cvnn, the ordinary cross-validated estimate of sn. Even though wehave been unable to show in our general setting that cv*u has a smaller variance than

512 PRABIR BURMAN
cvn u , we believe this to be so. In the regression case when the regression function /i islinear, y0
= 2o-4, yx = 16<74 and y2 = y3 = y4 = 0. Then the following can be shown:
var (cvnn - *„) - 2o-4{«"1 + 8/T2},
As we have discussed earlier, if the regression function fi is not linear and we are fittinga linear model, then the expressions for y0,..., y4 involve the model bias.
ACKNOWLEDGEMENT
It is a pleasure to thank Professors Leo Breiman and Charles Stone for many helpfuldiscussions. Thanks are also due to two referees whose suggestions have led to theimprovement in the presentation of this paper.
APPENDIX
Outline of proofs of theoremsFor Theorem 6 1 , note for (a) that cvnv — sn can be written as
J T(z) dDn(z) + Zpa J {T(z, Fna)-T(z, F)} dDna(z)
+ llPaj{nz,Fna)-T(z,Fn)}dF(z) = Il + I2 + I3, (A-l)
say. Now E(I1) = E(I2) = 0, whereas
,(Zl) dDna(zl)-fx(z1) dD^z,)}J, zl) dDna(z2) dDna{zx)-t2{z2, z,) dDn{z2) dDn(zt)}.
The first term in the last expression is zero since ^/>aDna = Dn. Since pa — v~l and na^(v — l)w~!nfor all a, the expectation of the second term approximately is
The proof of (b) is the same as in (a).For (c) note that
cw*nv~sn = J T(z) dDn{z) + YdPa J {T(z, Fna)-T(z, F)} dDna(z)
+ 1 A. J {T(z, Fn)-T(z, Fna)} dDn(z)
= / 4 +/ 5 + /6, (A-2)
say. Now E(I4) = E(I5) = 0. The result holds since it can be shown that
The proofs of (d) and (e) follow as in (c).

Comparative study of cross-validation 513
For (a) of Theorem 6-2, as in (A-2), cv*v -sn = I4+Is + I6. Since £(cv*u - sn) = O(n~2) as givenin Theorem 61 and since we are keeping terms of order n~2 and higher,
Now,
The result is proved via
E(H) = yo/n,
£(/2)-O(n-3),
For (b), the proof follows from part (a) of Theorem 6-4 by putting v = n.For (c) note that vr*v-sn can be written as
i T 1 T(z) dDna(z) + v'11 J {T(z, Fna)- T(z, F)} dDna{z)
+ v~ll) iT(z> Fn)-T(z, Fna)}
say. The result holds since it can be shown that
The proof of (d) is the same as in parts (a) and (c).For Theorem 6-4 the proof of (a) follows using (A-l) and calculations similar to the ones in
Theorem 6-2.For (b) note that
LTnv-sn = »-' Z J T(z) dDna(z) + v~l I J {T(z, Fna)- T(z, F)} dDna{z)
+ v~l I J {T(z, Fna)-T{z, Fn)} dF{z)
= /,0+/|l + /l2,
say. Since we are interested only in the terms of order n"1,
The proof follows from
E(I2w) = {1 + "o/("iov)}yon~l, E(IwIl2)- -{nv)~ly4,
REFERENCES
BERAN, R. J. (1984). Jackknife approximation to bootstrap estimates. Ann. Statist. 12, 101-18.BOWMAN, A. W. (1984). An alternative method of cross-validation for the smoothing of density estimates.
Biometrika 71, 353-60.BREIMAN, L. & FRIEDMAN, J. (1985). Estimating optimal transformations for regression and correlation.
/. Am. Statist. Assoc. 80, 580-619.BREIMAN, L., FRIEDMAN, J., OLSHEN, R. & STONE, C. (1984). Classification and Regression Trees. Belmont,
California: Wadsworth.

514 PRABIR BURMAN
BURMAN, P. (1989). Estimation of optimal transformations using D-fold cross validation and repeatedlearning-testing methods. Sankhya A 51. To appear.
GEISSER, S. (1975). The predictive sample reuse method with applications. J. Am. Statist. Assoc. 70, 320-28.HARDLE, W. & MARRON, J. S. (1985). Optimal bandwidth selection in nonparametric regression function
estimation. Ann. Statist. 13, 1465-81.SERFLING, R. J. (1980). Approximation Theorems of Mathematical Statistics. New York: Wiley.SERFLING, R. J. (1984). Generalized L-, M-, and K-statistics. Ann. Statist 12, 76-86.STONE, M. (1974). Cross-validatory choice and assessment of statistical predictions (with discussion). J. R.
Statist. SocB 36, 111-47.STONE, M. (1977). Cross validation: a review. Math. Oper. Statist., ser. Statist. 9, 127-39.
[Received April 1988. Revised January 1989]