a comparison of animated maps with static small-multiple maps for
TRANSCRIPT

A Comparison of Animated Maps with StaticSmall-Multiple Maps for Visually Identifying
Space-Time Clusters
Amy L. Griffin,* Alan M. MacEachren,w Frank Hardisty,z Erik Steiner,§ and Bonan Li**
*School of Physical, Environmental and Mathematical Sciences, University of New South Wales-ADFAwGeoVISTA Center, Department of Geography, The Pennsylvania State University
zDepartment of Geography, University of South Carolina§InfoGraphics Laboratory, Department of Geography, University of Oregon
**Department of Information Technology, Richland County Government
Although animated maps are widely promoted as ideal vehicles for learning and scientific discovery, there hasbeen little empirical work that demonstrates their relative effectiveness in relation to static small-multiple al-ternatives. In this article, we attempt to clarify the issues related to the potential of animation from an explicitlygeographic perspective, but one that is also grounded in broader cognitive science and human-computer inter-action considerations. We compared the effectiveness of animated with static small-multiple maps, specifically inrelation to map readers’ ability to identify clusters that move over space and through time. In this study, wefocused on several factors that might impact (or help explain) map readers’ ability to correctly identify clusters.These factors included animation pace, cluster coherence, and gender. We found that map readers answer morequickly and identify more patterns correctly when using animated maps than when using static small-multiplemaps. We also found that pace and cluster coherence interact so that different paces are more effective foridentifying certain types of clusters (none vs. subtle vs. strong), and that there are some gender differences in theanimated condition. This study is one of a small number of controlled experiments directed to the relativeadvantages of animated and static small-multiple maps. It provides the basis for further research that is needed tobetter understand the cognitive load involved in reading animated maps, to better describe and understandgender differences, and to investigate the efficacy of animated maps for other types of map reading tasks. KeyWords: map animation, small-multiple maps, visual cluster detection.
Although the first animated maps were created asearly as 1940 (Peterson 1995), they did notbecome a significant part of the spectrum of
maps to which most people are exposed until the adventof the Internet as a medium for distributing maps in the1990s (Harrower 2004). Animations in general andanimated maps in particular are now commonly used asaids for teaching and learning about a wide variety ofearth and social science processes in multimedia envi-ronments (e.g., Acevedo and Masuoka 1997; Blok et al.1999; Lowe 1999; Harrower, MacEachren, and Griffin2000; Slocum et al. 2000; Harrower 2002).
Animated maps have been proposed as ideal vehiclesfor learning and scientific discovery because they canexplicitly represent dynamic systems and processes.Conventional wisdom holds that because animationsexplicitly depict temporal changes, they should moreeasily enable individuals to understand dynamic pro-cesses. Tversky, Morrison, and Betrancourt (2002) sug-gest that according to the Congruence Principle (i.e., thenatural cognitive correspondence between an effective
graphic and mental representations of that graphic), itwould not be surprising if the mental representationsthat people form of dynamic processes shared structuralcharacteristics with animations (i.e., that people men-tally represent dynamic processes as animations). How-ever, there is evidence to suggest that people mentallyrepresent dynamic processes or systems through a seriesof static small-multiple snapshots based on critical mo-ments (i.e., moments of important change) rather thanas a dynamic representation (Hegarty, Kriz, and Cate2003; Lee, Klippel, and Tappe 2003).
Despite wide promotion of the benefits of animation,there is little empirical evidence demonstrating thatanimated representations are indeed superior to staticsmall-multiple representations of processes. Studies ofstatic small-multiple and animated cartographic repre-sentations have produced mixed results. Kossoulakouand Kraak (1992) compared static small-multiple andanimated forms of several different types of cartographicsymbolization. They found that participants were able toanswer questions more quickly when they used the
Annals of the Association of American Geographers, 96(4), 2006, pp. 740–753 r 2006 by Association of American GeographersInitial submission, June 2005; revised submission, December 2005; final acceptance, January 2006
Published by Blackwell Publishing, 350 Main Street, Malden, MA 02148, and 9600 Garsington Road, Oxford OX4 2DQ, U.K.

animated representation, but found no differences in thenumber of correct answers by representation type. Incontrast, Cutler (1998) found that children answeredsignificantly fewer questions correctly and took longer toanswer in an experiment that compared animated isar-ithmic maps with static small-multiple maps. In a recentqualitative evaluation of software that provided mapreaders with both animated maps and static small-mul-tiple maps, Slocum et al. (2004) found that participantsfelt that animations and static small-multiples were bestused for completing different tasks: animations foridentifying general trends and static small-multiples forcomparing specific time points.
In a recent review of noninteractive animations1 thatdid not include any cartographic representations, Tver-sky, Morrison, and Betrancourt (2002) found experi-mental design flaws in more than twenty studies thatpurport to show a benefit of animated representationsover static small-multiple representations, and con-cluded that there was no evidence to suggest that ani-mated representations help people learn more effectively.They found two main types of design flaws in compara-tive experiments: (1) the animated and static small-multiple graphics contained incomparable levels of in-formation (i.e., that because the animated graphicscontained microsteps, they showed more informationthan the static small-multiple graphics); and (2) manystudies used different procedures while testing the ani-mated and static small-multiple graphics (e.g., the ani-mated graphics were interactive, the static small-multiple graphics were not). The presence of these ex-perimental flaws led Tversky, Morrison, and Betrancourtto conclude that the differences the studies found mayhave been due to the procedures used rather than to thegraphics themselves.
One explanation for the better performance of staticsmall-multiple representations compared with animatedrepresentations may lie in the perceptual and cognitiveprocesses involved in processing the information con-tained in visual representations. A number of authorshave noted that the extra cognitive effort required tointerpret animated representations (compared with sta-tic small-multiple representations) may impede readers’ability to efficiently extract information from them(Tversky, Morrison, and Betrancourt 2002; Hegarty,Kriz, and Cate 2003; Hegarty 2004; Price 2004). Twocommonly cited potential factors relate to the (some-times) ephemeral nature of features in animations thatmay lead to an overload of working memory and to howthe viewer directs his or her attention. In many casesboth of these problems could be attenuated by incorp-orating interactivity into the animated representations.
However, we believe it is important to achieve someunderstanding of factors that may affect the perceptualand cognitive processes that are involved in extractinginformation from noninteractive animated representa-tions, as this knowledge could help guide and improvethe design of both interactive and noninteractive ani-mations.
Tversky, Morrison, and Betrancourt’s (2002) reviewfocused on animated representations that were designedto help students understand nongeographic dynamicprocesses and systems, and did not include animatedrepresentations designed for other purposes (the exam-ples they reviewed included diagrams that explain theworking of the circulatory system, how a bicycle pumpworks, and Newton’s laws of motion).
Another purpose for which animated representationsmight be used is for knowledge construction and dis-covery while viewers are exploring data. In this case, theviewer’s primary goal might be to notice a pattern in hisor her data, rather than (at least initially) trying tounderstand the process that is creating that pattern. Ourgoal in this experiment was to investigate the relativeeffectiveness of animated and static small-multiple rep-resentations of space-time information in aiding viewerswith knowledge construction and discovery tasks.
One case in which we believed that animated mapswould be a more effective tool than static small-multiplemaps was in detecting clusters that move through spaceand over time.2 Visual cluster detection is essentially aprocess of identifying one or more areas that are in-ternally homogenous but different from their surround-ings. Indeed, Gestalt psychologists identified similarity asone of the factors that aids the perceptual groupingprocess (MacEachren 1995).
The study presented here is a test of a specific hy-pothesis, that an animated representation will be moreeffective than a static small-multiple representation forvisually detecting moving clusters. The rationale for thishypothesis is the assumption that animation takes ad-vantage of an additional Gestalt principle: common fate.This principle holds that objects that are moving to-gether (i.e., in the same direction at the same rate) areseen as a group. In particular, we thought that the ap-parent motion inherent in an animated presentation (ofthe individual scenes making up the static small-multiplerepresentation alternative) would help in identifyingclusters that may be of interest but that are perhaps moredifficult to identify from multiple, juxtaposed frames.
In addition to comparing viewers’ abilities to identifymoving clusters from a noninteractive animated mapwith the ability to identify the same moving clusters froma set of static small-multiple maps, in this study we also
Comparison of Animated and Static Small-Multiple Maps for Visually Identifying Space-Time Clusters 741

investigated how two factors (animation pace and clus-ter coherence) might influence users’ ability to identifymoving clusters.
In the section that follows, we outline the method-ology for our study. Then we provide detailed results ofthe experiment. The final section offers a discussion ofthe results, our conclusions, and suggestions for futureresearch.
Methodology
The study attempts to address some of the concernsraised by Tversky, Morrison, and Betrancourt (2002)about previous experiments by developing a carefullycontrolled experiment in which the animated and staticsmall-multiple map representations to be compared dif-fer only in respect to whether they are animated or not;thus other typical differences that exist between ‘‘real-world’’ animated and static small-multiple maps of timeseries data are removed. We also controlled for otherfactors that might have an impact on the relative ef-fectiveness of animated and static small-multiple maprepresentations, but that are not part of the differencebetween these forms of representation (the kind of map,the structure of the geographic region represented, thenature of the data signified, etc.). To do so, we opted formaplike displays with constructed data sets in which wecould control several aspects of the spatial and temporalcharacteristics of the data. Subsections below providedetails on (a) the construction of the visual (maplike)stimuli, (b) the creation of the test instruments, (c) theexperimental design, (d) the test participants, and (e)the experimental procedures.
Development of Moving Cluster Visual Stimuli
We developed a random pattern generation methodto create a set of test stimuli that could be used to ex-plore the relative effectiveness of animated and staticsmall-multiple representations for allowing subjects todetect moving and growing patterns. The developmentof these pattern generation methods was itself a chal-lenge. There is little or no previous work in the area;there are no generally accepted methods (such as stat-istical tests) for identifying such space-time patterns, andthus no standard way to measure space-time clusteringwithin the patterns we generated. A method that ad-dresses part of the problem is the scan statistic developedby Kulldorff (Kulldorff and Nagarwalla 1995), a methodderived from early work by Openshaw on the Geo-graphical Analysis Machine (GAM; see Openshaw,Charlton, and Craft 1988). However, the scan statistic
detects only space-time cylinders (if time is treated as athird dimension). Moving clusters can be thought of asspace-time prisms; growing clusters as space-time cones.Neither is detected by the scan statistic.
Given the lack of a generation method for creatingmoving clusters or a statistic for assessing space-timeclusters, we developed a cluster generation method thatproduces, on average, statistically significant spatialclusters at each step, where the location of these clusterschanges systematically over time (we used a linearchange in location over time in all cases). These sim-plifying assumptions make it possible to create a series oftest stimuli for which we are confident that the space-time pattern is a kind of moving cluster. The movingclusters that this method generates are only a subset ofthe possible kinds of moving clusters that may exist inreal-world data. Our clusters are all relatively compact,are all made up of cells that are identical in size andshape, and are each big enough to be individuallyidentifiable at the display size and resolution we used(1,280� 960 on 17-inch monitors).
The maplike displays we generated are analogous tochoropleth maps of data by census tract or county,without the variability of real places. A display consists ofa 36 � 21 array of hexagons. Each hexagon could takeon one of five different data categories represented bycolor values (see Figure 1). We used a heterogeneousPoisson process to generate a spatially clustered patternat each time step. In other words, we created a randombackground pattern, and then within that an area ofhigher (but still randomly generated) intensity. We thenforced the center of the pattern to move across the studyarea in a linear manner.
The intensity of the cluster was varied by increasingthe color value of a number of the cells within the clusterarea by one setting, allowing for cells to be repeatedlyintensified. We defined moving clusters as circular areaswith radii of four hexagonal shapes. We varied the pro-portion of intensified cells to produce subtle or strongmoving clusters (see Figures 2 and 3). Because one of our
Figure 1. Frames from a trial with no moving cluster.
Griffin et al.742
goals in creating these patterns was to produce a range ofpossible time-space patterns for which parameters of therepresentation might have an impact, we did pilotstudies that helped to calibrate the match betweenstatistical measures and perception. In other words, ourpilot studies identified patterns that were easily, but notalways, discerned (our strong clusters) as well as patternsthat were typically discernable, but difficult to discern(our subtle clusters).
The Java code we developed for generating the testpatterns is a small but measurable addition to the set ofmethods available for manipulating hexagonal datastructures, following Dan Carr’s work (Carr, Olsen, andWhite 1992). The code is available in both source andexecutable forms from http://people.cas.sc.edu/hardistf/hexmap. The features of the code include a number ofroutines for manipulating hexagonal arrays and output inboth XML and SaTScan forms. We have released thecode under an Open Source license (LGPL) that permitsboth modification and redistribution. The web site in-cludes executable versions for Microsoft Windows,Macintosh OS X, Sun Solaris, and GNU Linux. Byproviding this code and the executables, we make itpractical for others to critique or extend the researchpresented here by exploring in detail the cluster gener-ation method and by modifying that method to generate
alternative kinds of moving clusters for subsequenttesting.
Test Instruments
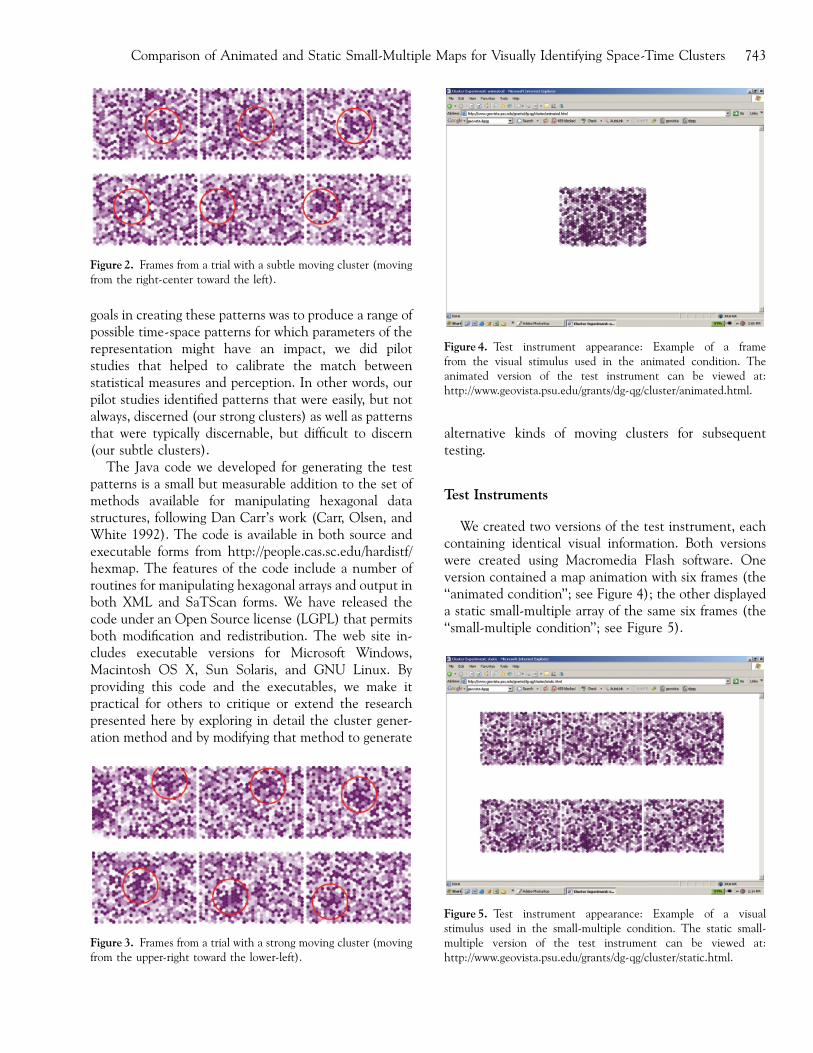
We created two versions of the test instrument, eachcontaining identical visual information. Both versionswere created using Macromedia Flash software. Oneversion contained a map animation with six frames (the‘‘animated condition’’; see Figure 4); the other displayeda static small-multiple array of the same six frames (the‘‘small-multiple condition’’; see Figure 5).
Figure 2. Frames from a trial with a subtle moving cluster (movingfrom the right-center toward the left).
Figure 3. Frames from a trial with a strong moving cluster (movingfrom the upper-right toward the lower-left).
Figure 4. Test instrument appearance: Example of a framefrom the visual stimulus used in the animated condition. Theanimated version of the test instrument can be viewed at:http://www.geovista.psu.edu/grants/dg-qg/cluster/animated.html.
Figure 5. Test instrument appearance: Example of a visualstimulus used in the small-multiple condition. The static small-multiple version of the test instrument can be viewed at:http://www.geovista.psu.edu/grants/dg-qg/cluster/static.html.
Comparison of Animated and Static Small-Multiple Maps for Visually Identifying Space-Time Clusters 743

In the animated condition, participants saw each six-frame animation three times. Each run of the animationwas separated from the next by a gray screen that flashedto indicate that the animation was starting again. Tocontrol for the possibility that there might be a positiverelationship between a map reader’s ability to identifymoving clusters and the size of the visual stimuli (themap size), we used visual stimuli of the same size in boththe animated and small-multiple conditions.
As described above, we constructed the visual pat-terns from regular arrays of hexagons. We chose to use anabstract shape for the visual stimuli (as opposed to realgeographic areas) in order to remove familiarity withparticular geographic places as a factor in the experimentand to eliminate the possibility that the shape and size ofgeographic units could have an impact on inferencesabout the pattern (or lack of pattern) that participantswere seeing. In the future this work could be extended toreal places (e.g., counties or local government areas)using the same experimental framework to determinewhat effect (if any) place-based knowledge or varyingthe size and shape of geographic units has on the pat-terns people see or do not see.
Experimental Design
To compare animated maps with the static small-multiple maps, we used a within-subjects experimentaldesign in which each participant saw both the animatedand the small-multiple condition.
In this experiment, our goal was to compare animatedwith static small-multiple representations across a rangeof data and display conditions. To make the experimentpractical, we had to control for many factors in order totest a few. Pilot studies and observations about use of themany different map animations we have implemented inthe past led us to focus on two factors that we expectedto have an impact on the relative advantages of eachtype of representation. These factors are (a) the coher-ence of space-time patterns (pilot studies suggested thata difference between the two map forms is most pro-nounced for relatively difficult judgments—in situationsin which the presence of a moving cluster is not obvi-ous); and (b) the pace of the animation (work withseveral map-based animations convinced us that thereis probably an ‘‘optimal’’ pace for at least some mapanimations that can result in visual ‘‘popout’’ effectsthat lead to nonobvious space-time patterns becomingobvious). As a result, we designed the experiment totest for these two factors while controlling for others.The experiment tested each participant on threedistinct coherence levels (no pattern, subtle pattern, and
strong pattern) and at four distinct paces (5, 7, 9, and11 sec).
This led to an experiment with twelve conditions,each of which was included two times within the testinstrument (i.e., there were twenty-four trials, two foreach pattern coherence/pace combination). Due to ourdesire to test for both pattern coherence and animationpace while keeping the number of study participants to areasonable level, we used a balanced Latin square designwithin the test instrument for each condition to controlfor order effects related to pace and coherence. In abalanced Latin square design, each condition precedesand follows each other treatment equally often (e.g., thecombination of pace 5 5 sec, coherence 5 no patternprecedes the combination of pace 5 5 sec, coher-ence 5 subtle pattern as often as it follows it), and eachcondition appears in each ordinal position the samenumber of times. In other words, within the totalpopulation of experiment participants, a particular visualstimulus combination (e.g., pace 5 5 sec, coher-ence 5 no pattern) will appear once in each trial pos-ition.
Participants
Twenty-four students (twelve males and twelve fe-males), who were mostly between the ages of eighteenand twenty-four years of age (twenty-two of the twenty-four participants), and who were from varied academicbackgrounds, participated in the experiment. They werepaid a small sum of money in return for their participa-tion. As we did not want to bias our sample by includinga high proportion of participants who had extensiveexperience with animated maps, we specifically avoidedrecruiting students who had taken the department’sintroductory cartography or dynamic cartographycourses.
Experimental Procedures
We carried out the experiment in a departmentcomputer lab. We counterbalanced the animated andsmall-multiple conditions so that half of the participantssaw the animated condition first, and the other partici-pants saw the small-multiple condition first. We alsocontrolled for gender in this counterbalancing, but didnot counterbalance participants by age because almostall participants were in the same age class.
Participants in both conditions initially saw a welcomepage that explained the purpose of the experiment anddescribed the task that they would be required to per-form: identifying whether or not a moving cluster was
Griffin et al.744

present in the display. In the small-multiple condition,this welcome screen also included a diagram that showedthe order in which the screens should be viewed (i.e., thetop row left to right, followed by the bottom row left toright). Next, participants in both conditions saw an ex-ample of a trial that contained a moving cluster. Afterseeing the visual stimulus, the participants were asked torecord whether they saw a cluster or not by clicking ei-ther a button labeled ‘‘moving cluster’’ or another la-beled ‘‘no cluster.’’ In addition to the participants’answers, the computer also recorded the amount of timeit took for participants to respond by clicking on one ofthe two buttons. After they indicated whether or notthey had seen a moving cluster, the participants weretold whether they had correctly identified the pattern,and were shown an example of a trial that did notcontain a moving cluster.
After seeing the examples, participants completedtwenty-six trials. The first two trials used the same strong(i.e., high coherence) cluster patterns for each partici-pant and were not analyzed, leaving twenty-four trials ofactual data for each participant. These practice trialshelped participants to orient themselves to the task.Across the twenty-four core trials, we presented partic-ipants with stimuli having different levels of patterncoherence for different lengths of time (i.e., paces), usingthe Latin Squares procedure detailed above to balancethe order of presentation. In the animated condition, thefour different animation paces meant that for individualtrials, participants had different total lengths of time toview and interpret the particular display sequence of sixmaps contained in that trial. To remove this as a factor incomparing the animated and small-multiple conditions,we adjusted the display times for the static small-mul-tiple stimuli in the same way (i.e., we created a ‘‘pace’’for the static small-multiple maps). For each individualtrial, pace in the animated condition was matched toviewing time for the small-multiple condition.
At the end of the session, participants filled out ademographic questionnaire where they indicated theirage, gender, field of study, and certainty in their answerson a Likert scale that ranged from 0 to 100. There wasalso an opportunity for participants to make commentsabout the experiment. After completing the procedurefor the initial condition to which they were assigned(animated or small-multiple), participants worked withthe test instrument for the other condition.
Results
The test instruments collected two pieces of data foreach trial that each participant completed: the answer
he or she recorded and the time he or she took to an-swer. We analyzed the data separately for each condition,then compared the animated with the small-multipleconditions. In analyzing the animated and small-multipleconditions separately, we used the chi-square statistic tolook at the number of correct answers under differentexperimental conditions (i.e., pace and cluster coher-ence) as well as different participant demographicgroupings, and either ANOVA (analysis of variance) ora two-sample t-test to examine the times under differentexperimental conditions. To compare the conditions, weused the McNemar test to examine the number of cor-rect answers in each condition, and the Wilcoxon sign-rank test to look at time differences. We first report onthe comparison of the animated and small-multipleconditions and then report the results for each conditionseparately. To understand how variables related to eachother, we also stratified trials by variables and looked atthe effects of other variables on each of the strata.
Comparison of the Animated and Small-MultipleConditions
Participants identified patterns correctly more oftenusing the animation than they did using the small-mul-tiples (70.5 vs. 64.8 percent; w2 5 4.80, po0.03). Theyalso took significantly less time to answer using theanimation (1.1 vs. 1.4 sec; z 5�7.90, po0.01).
When we looked at the number of patterns thatparticipants identified correctly at different paces in thetwo conditions, we found that there was no differencebetween the animation and the small-multiple repre-sentation at either the slowest or fastest pace (see Figure6). However, patterns were identified correctly signifi-cantly more often in the animation at moderate paces (7sec: 72.2 vs. 61.1 percent, w2 5 3.80, po0.05; 9 sec: 79.2vs. 68.8 percent, w2 5 4.40, po0.04). Participants alsoidentified patterns significantly more quickly using theanimation, with the difference in the time it took toanswer increasing substantially at slower paces (seeFigure 7). Interestingly, in both conditions, participantstook longer (although not significantly longer) to answerat the slowest pace, perhaps suggesting that when thepace is too slow the visual system cannot maintain theGestalt grouping of common fate.
Although there were no differences in the number ofpatterns identified correctly between the animated andsmall-multiple conditions at different levels of patterncoherence, there were significant differences in theamount of time it took to identify patterns (no cluster:z 5�3.70, po0.01; subtle cluster: z 5�5.00, po0.01;strong cluster: z 5�5.00, po0.01). Animation provided
Comparison of Animated and Static Small-Multiple Maps for Visually Identifying Space-Time Clusters 745

the strongest advantage in cases where the trials con-tained subtle clusters (see Figure 8).
There were significant differences between the ani-mated and small-multiple conditions in the number ofcorrect responses provided by males when responses werestratified by gender. Males identified patterns correctlymore often in the animated condition than in the small-multiple condition (74.3 vs. 66.3 percent; w2 5 4.80,po0.03). There was no significant difference for females(66.7 vs. 63.2 percent; w2 5 0.72, po0.40). Both malesand females were significantly faster in identifying pat-terns with the animation than with the small-multiples(males: z 5�6.70, po0.01; females: z 5�4.50,po0.01). The difference between the two conditions waslarger for males than for females (0.3 sec vs. 0.2 sec).
Animated Condition
Overall, participants correctly identified patterns (orlack of pattern) in 70.5 percent of trials (n 5 576) in the
animated condition. It took participants significantly lesstime when they identified a pattern correctly than whenthey did not identify a pattern correctly (1.1 vs. 1.3 sec;z 5�3.93, po0.01).
Pace and the Animated Condition. As the pace of theanimation decreased (from 5 sec to 11 sec), participantsidentified a higher number of patterns correctly(w2 5 24.1, po0.02), except at the slowest pace, wherethere were fewer correct answers than in all but thefastest pace:
� 5 sec (fast) 63.2 percent correct� 7 sec 72.2 percent correct� 9 sec 79.2 percent correct� 11 sec (slow) 67.4 percent correct.
These results imply that too little viewing time perframe makes it hard to process the scene; as pace slowsdown, performance improves up to the point at whichthe visual system cannot maintain the Gestalt groupingprinciple of common fate. There were no significantdifferences in the time it took participants to answer atdifferent animation paces.
When we stratified the trials by cluster coherence, wefound that there was an interaction of pace with clustercoherence. For trials with no cluster or a strong cluster,the second fastest pace (7 sec) was the pace at whichparticipants identified the most patterns correctly.However, trials with subtle clusters were best identifiedat a slower pace (9 sec; see Figure 9). These differencesbetween cluster coherence types were significant at 7 sec(w2 5 18.2, po0.01) and 11 sec (w2 5 13.4, po0.01).The subtle clusters require a slower pace—thus moretime per view to process—up to the point when the
Pace (sec)
Per
cent
cor
rect
55
60
65
70
75
80
85Animated Small multiple
5 7 9 11
Figure 6. Percentage of patterns correctly identified in the ani-mated and small-multiple conditions, stratified by pace.
Pace (sec)5 7 9 11
Tim
e (s
)
0.8
1.0
1.2
1.4
1.6
1.8
2.0
2.2
2.4
2.6
Animated Small multiple
Figure 7. Time taken to answer in both the animated and small-multiple conditions, stratified by pace.
Cluster coherence
None Subtle Obvious
Tim
e (s
)
1.0
1.1
1.2
1.3
1.4
1.5
Animated Small multiple
Figure 8. Time taken to identify patterns in both the animated andsmall-multiple conditions, stratified by coherence.
Griffin et al.746

increased time between frames makes it hard to maintainshort-term memory of what was present in the previousframe (i.e., the appearance of common fate). Addition-ally, there appears to be a range of effective paces acrosswhich animations can be successfully used to identifypatterns, but this range is perhaps narrower for subtlepatterns than for strong patterns. These results suggestthat providing interactive control of animations is likelyto be critical to the effective use of pace as a dynamicvariable, as it will be difficult or impossible to predeter-mine what pace will work for which dataset.
Cluster Coherence and the Animated Condition. Notsurprisingly, we found that there were significant differ-ences (w2 5 24.1, po0.01) in the number of patternsthat participants correctly identified in trials with differ-ent levels of cluster coherence. Participants were betterat identifying strong moving clusters and patterns withno moving cluster than patterns with subtle movingclusters:
� No pattern 77.6 percent correct� Subtle pattern 57.3 percent correct� Strong pattern 76.6 percent correct.
It took participants significantly longer to answer intrials where there was no cluster than in trials wherethere was a strong cluster (1.3 vs. 1.1 sec; F 5 4.20,po0.02, Bonferroni corrected). This result is one thatwe would expect; that is, the no-cluster trials require anexhaustive visual search, while trials that contain clus-ters are self-terminating visual searches. There were nosignificant differences in the time it took to answer inother group comparisons.
Gender Effects and the Animated Condition. Maleswere significantly more likely to identify patterns cor-rectly than were females (w2 5 4.04, po0.04):
� Males 74.3 percent correct� Females 66.7 percent correct.
This result is unusual, for although modest genderdifferences have been commonly reported for some map-reading tasks associated with navigation (e.g., Montelloet al. 1999; Malinowski and Gillespie 2001; Lloyd andBunch 2005), they have not been commonly reportedfor thematic map reading (e.g., Gilmartin and Patton1984; Evans 1997). There was no significant differencein the amount of time it took males or females to identifypatterns.
We also stratified the trials by cluster coherence andanimation pace to investigate whether there were otherexperimental factors that are important for describingthis difference between males and females. Pattern co-herence seems to be one factor that differentially affectsthe performance of males and females. There is a sub-stantial, but not statistically significant difference be-tween males’ and females’ abilities to correctly identifypatterns in trials where there is either a subtle pattern ora strong pattern (subtle pattern: w2 5 2.13, po0.15;strong pattern: w2 5 3.51, po0.06; see Figure 10). Thispattern of males identifying more patterns correctly ismuch less marked in the trials that did not containmoving clusters (w2 5 0.03, po0.86).
The differential rate at which males and femalescorrectly identified patterns also exists at faster anima-tion paces. As pace decreases, males have increasingnumbers of correct pattern identifications until theslowest pace, which is the most inaccurate for them (seeFigure 11). For males, these performance differences
Pace (sec)
5 7 9 11
Per
cent
cor
rect
40
50
60
70
80
90
No cluster Subtle cluster Strong cluster
Figure 9. Percentage of patterns correctly identified in the ani-mated condition at different paces, stratified by cluster coherence.
Cluster coherence
None Subtle Strong
Per
cent
cor
rect
50
55
60
65
70
75
80
85
Male Female
Figure 10. Percentage of patterns identified correctly in the ani-mated condition at different levels of pattern coherence, stratifiedby gender.
Comparison of Animated and Static Small-Multiple Maps for Visually Identifying Space-Time Clusters 747

(between paces) are significant (w2 5 9.10, po0.03).Females have a similar overall pattern, except that theyhave fewer correct responses than males at all but theslowest pace, and the magnitude of the pace effect isweaker and not statistically significant (w2 5 3.40,po0.34). Males were significantly better than females atidentifying patterns for pace three (w2 5 4.20, po0.04);there was no statistically significant difference betweenmales and females at any other pace.
Small-Multiple Condition
Overall, participants correctly identified patterns fromthe small-multiple representation trials 64.8 percent ofthe time (n 5 576). As in the animated condition, par-ticipants took less time to correctly identify a patternthan to incorrectly identify patterns (1.3 vs. 1.4 sec;z 5�2.80, po0.01).
Pace and the Small-Multiple Condition. In the small-multiple condition, the term ‘‘pace’’ refers to the lengthof time that the participants saw the representation. Thepaces used in this condition were identical in length tothose used in the animated condition. Although therewas no significant difference in the number of correctresponses between the paces in the small-multiple con-dition (as we observed in the animated condition;w2 5 2.00, po0.57), there does seem to be a thresholdbetween the two fastest paces and the two slowest paces(i.e., between 7 and 9 sec):
� 5 sec (fast) 62.7 percent correct� 7 sec 61.6 percent correct� 9 sec 68.8 percent correct� 11 sec (slow) 66.0 percent correct.
An explanation for this pattern is simply that a displaymust be visible long enough for the participant to scanall of the small-multiples. This hypothesis could betested by comparing the ability of participants to cor-rectly identify patterns from displays with increasingnumbers of small-multiples. We would expect that as thenumber of multiples increases, so too would the amountof time needed to correctly identify a particular numberof patterns.
There was a strong interaction between cluster co-herence and the pace at which the small-multiple rep-resentations were displayed. There was a statisticallysignificant difference between the levels of pattern co-herence for all paces (5 sec: w2 5 12.4, po0.01; 7 sec:w2 5 10.4, po0.01; 9 sec: w2 5 11.4, po0.01; 11 sec:w2 5 8.40, po0.02). For trials that contained either nocluster or a subtle cluster, participants identified themost patterns correctly at the second slowest pace (9sec). In contrast, for trials that contained a strongcluster, the fastest pace (5 sec) was most conducive toparticipants correctly identifying patterns (see Figure12). One potential explanation for these resultsis that the faster pace that produced better identificationof strong clusters forced participants to rely (uncon-sciously) on preattentive visual processing instead offocused attention for determining if a pattern was pres-ent or not. In contrast, preattentive vision may not havebeen sufficient to recognize subtle clusters or lack ofclusters.
Cluster Coherence and the Small-Multiple Condi-tion. As in the animated condition, there was asignificant difference in the number of correct responsesfor different coherence levels (w2 5 35.4, po0.01).
Pace (sec)
Per
cent
cor
rect
55
60
65
70
75
80
85
90
Male Female
5 7 9 11
Figure 11. Percentage of patterns identified correctly in the ani-mated condition at different paces, stratified by gender.
Pace (sec)
Per
cent
cor
rect
30
40
50
60
70
80
90
No cluster Subtle cluster Strong cluster
5 7 9 11
Figure 12. Percentage of patterns correctly identified in thesmall-multiple condition at different paces, stratified by clustercoherence.
Griffin et al.748

Participants were better at identifying patterns whenthey contained either no cluster or a strong cluster:
� No cluster 76.0 percent correct� Subtle cluster 48.4 percent correct� Strong cluster 69.8 percent correct.
Gender Effects and the Small-Multiple Condition. Inthe small-multiple condition, there was no statisticallysignificant difference in the number of correct answersbetween males and females (w2 5 0.61, po0.43). How-ever, females were slightly faster at identifying patternsthan males (1.3 vs. 1.4 sec; z 5�2.80, po0.01). Therewere also no significant interactions of gender with paceor cluster coherence.
Discussion and Conclusions
Overall, our results show that the animated repre-sentation enabled users to more often correctly identifywhether a particular type of pattern was present than didthe static small-multiple representation. Participantswere also able to come to a conclusion about what theysaw more quickly while viewing an animated represen-tation.
Our results do not provide any evidence to supportthe often-made contention that animations require extracognitive effort for information extraction when com-pared with static small-multiple representations. It maybe that the cognitive load associated with visuallyidentifying moving clusters is relatively light, and thosefactors that influence the map reader’s perceptual cap-abilities are more important for successfully completingthis task.
Performing a cognitive demands analysis, a techniquedescribed by T. Green (1989), for the task we studied(i.e., visual identification of moving clusters) providessome support for our contention that animations shouldbe (and are) more effective for this task than are staticsmall-multiples. The visual identification of movingclusters is a special case of the more general problem ofvisually identifying clusters. In order to identify a cluster,map readers must first notice a graphical difference be-tween different locations on a map. A prerequisite fornoticing a difference in a visual representation thenwould be whether or not the difference is visible. Oncemap readers have noticed a difference, they then have toidentify whether or not the difference is a cluster or someother type of graphical difference. In an experiment thatasked map readers to outline clusters from graduatedcircle maps, Slocum (1983) found that two characteris-
tics of the maps (proximity and figure-ground relation-ships) influence whether map readers define particulargroupings of map symbols as clusters. Finally, mapreaders may also interpret the identified cluster (e.g.,decide whether or not it is likely to be a significant or aspurious cluster).
In the case of visually identifying moving clusters fromstatic small-multiples, we would expect the map readerto iterate through the same three cognitive tasks wedescribed above for each multiple contained in the col-lection of small-multiples (see Figure 13). In animations,by contrast, we suggest that this process of examiningeach multiple (or in this case, each frame) can be by-passed if the map reader focuses on the characteristics ofthe motion contained in the animation. In animatedexemplars containing a moving cluster, there should becoherent motion rather than the random patterns ofmotion contained in exemplars that do not containmoving clusters. In other words, because animationsenable map readers to focus on an additional graphicalcharacteristic of the patterns (motion in addition toproximity and figure-ground relationships), map readersshould be able to identify clusters both more easily andmore quickly in the animated condition than they can inthe small-multiple condition.
We did not collect any direct evidence of whereparticipants were directing their attention (such as eye-movement measurements), and thus cannot conclu-sively comment on any differences that may have existedin where participants directed their attention in thedifferent conditions (i.e., whether map readers viewedeach of the small-multiple frames sequentially). How-ever, it is plausible to speculate that map readers,through their prior experience of looking at animations(of any type), have (consciously or unconsciously) de-veloped appropriate and effective strategies for directingtheir attention while viewing an animation (i.e., thatthey focus on the characteristics of the motion).
Our results do provide some evidence in support ofthis hypothesis in that the optimal pace for correctlyidentifying different types of patterns in the two condi-tions differed. In trials that contained a strong cluster inthe small-multiple condition, participants correctlyidentified the highest number of patterns correctly at thefastest pace. It seems likely that for the small-multiplecondition, participants directed their attention to eachframe more or less sequentially while looking for acluster. We would expect participants who were usingthis strategy to identify a higher number of patternscorrectly at slower paces, as in the slower paces theywould actually have enough time to fixate on andvisually analyze each of the multiples. Indeed, we did
Comparison of Animated and Static Small-Multiple Maps for Visually Identifying Space-Time Clusters 749

find evidence that this was the case for patterns con-taining subtle clusters or no clusters. In the animatedcondition, participants had more success in identifyingstrong clusters at moderately fast paces. The fastest paceapparently does not allow sufficient time to process eachview, but, once processed, a relatively quick transition tothe next view seems to help achieve pattern coherencethroughout the sequence.
Our results suggest that relative motion may play animportant but complex role in the identification ofspace-time clusters in animation. Several authors haveargued that motion is indeed an attention-focusingcharacteristic of visual displays (Nakayama 1985; Mac-Eachren 1995). Facilitating the perception of motion inanimations is therefore a fundamental issue. The per-ception of motion in animations is an example of whatpsychologists refer to as the apparent motion problem, inwhich we perceive motion (that is not directly depicted)
from jumps in position between static small-multipleimages. The perception of apparent motion depends onthe duration of the stimulus (i.e., the length of time aframe is displayed), the interstimulus interval (i.e., theframe rate), and the distance that an object moves.Generally, if an object moves over a larger distance, itwill need a shorter interstimulus interval for the viewerto perceive smooth apparent motion than will an objectmoving over a shorter distance. If the interstimulusinterval is too long, the result is what Wertheimer (1912)described as phi movement, in which the object willappear to move from one location to another withouttraveling through intermediate locations. In the ani-mated condition, participants correctly identified mov-ing clusters at the lowest rate in trials presented at thefastest pace. This may be due to an inability to processeach view at the fastest pace. Participants also hadsubstantial difficulty identifying subtle moving clusters at
Notice Motion
Identify
Motion Type
Interpret Cluster
Coherent
vs.
Random
Cluster
vs.
No cluster
Notice GraphicalDifference
Identify GraphicalDifference
Interpret Cluster
Notice GraphicalDifference
Identify GraphicalDifference
Interpret Cluster
Notice GraphicalDifference
Identify GraphicalDifference
Interpret Cluster
Notice GraphicalDifference
Identify GraphicalDifference
Interpret Cluster
Notice GraphicalDifference
Identify GraphicalDifference
Interpret Cluster
Notice GraphicalDifference
Identify GraphicalDifference
Interpret Cluster
Frame 1 Frame 2 Frame 3
Frame 4 Frame 5 Frame 6
Value Differences
Value Concentrations Same
Cluster?
Moving cluster
vs.
No moving cluster
Figure 13. Cognitive demand analysis for the visual identification of moving clusters using static small-multiple (left) and animated maps(right). Animated maps are able to compress the cognitive processes needed to identify moving clusters by focusing on an alternative graphicalcharacteristic of the display (motion instead of color value).
Griffin et al.750

the slowest pace. At this pace the combination of less-obvious figure-ground relationships in the subtle clus-ters, combined with a less-coherent movement of thecluster (i.e., the movement may have appeared stutteredlike the phi movement, rather than smooth), may havelessened the appearance of the cells in a cluster having acommon fate, thereby increasing the cognitive effortrequired to identify a cluster. One direction for futureresearch may be to first investigate and describe therelationship between frame rate and the distance movedacross the screen that results in a smooth versus astuttered pattern and then test whether participants arebetter at identifying clusters from patterns containingeach type of movement.
Tversky, Morrison, and Betrancourt’s (2002) reviewexamined studies that compared the performance ofanimated and static small-multiple representations forcomprehension tasks, which should require substantiallymore cognitive effort than our task. In comprehensiontasks, we would expect map readers to perform addi-tional cognitive actions, such as tracking change in thephenomenon over time, parsing the overall map intosmaller components for more detailed examination, andthen linking these components back together to developan integrated understanding of the phenomenon thatthe map reader was seeking to understand. Developingthis type of understanding also requires tapping into themap reader’s conceptual mental structures (i.e., his orher schemata) in order to construct new knowledge. Bycontrast, the task of visually identifying moving clustersis a task that does not demand that map readers developan understanding of why they are seeing clusters, butinstead requires them to identify whether or not clustersexist (which is certainly a prerequisite step to under-standing why they might exist). We suggest that ani-mation was successful for this task because it decreasedrather than increased the cognitive load for map readers.
Fabrikant (2005) has recently hypothesized that thereason some map animations studied in the context ofcomprehension tasks have been unsuccessful is that theperceptually salient features of the maps have not beenthematically relevant to developing an understanding ofthe problem, thereby increasing the cognitive load onmap readers who have to ‘‘sort through’’ the perceptualstimuli to find those that are most relevant to the task athand. Indeed, in a 1999 study of interactive weathermap animations, Lowe documented that map readersoften extracted perceptually salient information whileignoring that which was thematically relevant. In otherwords, perhaps map animations have been unsuccessfulin some contexts because they have not taken into ac-count the cognitive demands of the task for which they
were intended to be used when they were designed. Onepossible avenue for further research might be to useFabrikant’s (2005) proposed method of comparingmodeled perceptual salience of our map stimuli with eyemovement tracking to measure whether map readers areextracting information that is both perceptually salientand thematically relevant (in this case the motion of acluster).
We did not control for visual acuity when selectingparticipants for this experiment. Although it is possiblethat one or more participants had uncorrected vision, wedo not believe that it would have had a substantial im-pact on participants’ ability to discern clusters as clusterswere approximately an inch in diameter and were viewedfrom a relatively short distance. Moreover, because weused a within-subjects design, a participant who haddifficulty discerning clusters because of uncorrected vi-sion should have had the same problems in both theanimated and small-multiple conditions. We suspect thathaving uncorrected vision would have the same impacton cluster detection as viewing maps with a smaller cellsize (and hence cluster radius) would have, but we didnot have any test stimuli with smaller cell sizes. How-ever, a future experiment could examine the effect ofcluster size on participants’ ability to detect movingclusters.
Finally, we did not expect to find a difference in theability of males and females to correctly identify patterns,as our task was neither related to navigation nor did itrequire the explicit use of a rotational spatial ability. Weonly found a gender difference in the animated condi-tion; the difference in pattern identification in the small-multiple condition was not statistically significant. Theliterature provides two potential explanations for thedifference that we found: one social or environmental,and one biological.
One relatively recent socioenvironmental change hasbeen the development and widespread use of videogametechnology among both adolescents and adults. Recentresearch has demonstrated that individuals who regu-larly play action video games have improved generalvisual abilities, particularly those related to selectivevisual attention (C. S. Green and Bavelier 2003). Thisresearch also demonstrated that both male and femalenon-videogame players who played action videogamesfor one hour a day for ten days showed improved visualattention skills. Media studies research has demon-strated that boys play videogames at almost twice therate of girls (Woodard and Gridina 2000). Taken to-gether, these results suggest that because many of today’sgeneration of boys practice tasks that develop their vis-ual attention skills to a higher degree than girls, they are
Comparison of Animated and Static Small-Multiple Maps for Visually Identifying Space-Time Clusters 751

better equipped to identify moving clusters from ani-mations; this hypothesis is one potential explanation forthe gender difference we observed. However, because wedid not specifically ask participants about their video-game playing practices, we cannot assume that males inour study played videogames regularly or that the fe-males did not. One way in which it would be possible togather additional evidence in support of this theorywould be to run the experiment again, specifically re-cruiting males and females who do and do not playvideogames.
Another potential explanation for the gender differ-ence lies in the biology of our visual system. Sax (2005)has proposed that male eyes may be better hard-wired forsensing motion, while female eyes do better at sensingcolor and texture because of a difference in the relativenumber of M-cells (those that sense motion and direc-tion) and P-cells (those that sense color and texture)among males and females. Although this structural dif-ference in the relative amounts of different sensory re-ceptor types has only been conclusively demonstrated inrats (Salyer et al. 2001), similar studies in humans mayshow the same pattern.
Regardless of what the results of future physiologicalstudies demonstrate, C. S. Green and Bavelier’s (2003)study demonstrates that it is possible for both males andfemales to develop general visual skills with practice.Future cartographic research could investigate whethergender differences are seen in other types of dynamicmaps (e.g., interactive animated maps) and for othertypes of dynamic map-reading tasks, particularly thoseinvolving more cognitive processing, such as character-izing change in attributes over time. Additionally, itwould be useful to determine the robustness of thegender effect we observed in this relatively small study byconducting other studies that examine gender differ-ences for tasks that are heavily influenced by perceptualfactors. Results of such studies could then be appliedboth to developing training materials to help mapreaders learn how to best work with dynamic maps andto designing symbolization solutions that may make iteasier for less-experienced map readers to work withdynamic maps of any kind.
Acknowledgments
Funding for this work was provided by National Sci-ence Foundation Digital Government Grants 9983451,9983459, and 983461. The authors would like to thankDr. Mark Harrower for his comments on the initial ex-perimental design; Brian Pacheco, Geoff Hatchard, andDerek Swingley for their assistance with data collection;
the Penn State University students who participated inthe research; and the four anonymous referees whoprovided helpful and constructive critiques of earlierdrafts of this article.
Notes
1. Interactivity itself has been shown to increase students’ability to learn, so comparing interactive animations withnoninteractive static small-multiple visual representationswould confound interactivity and animation. For this reason,Tversky, Morrison, and Betrancourt (2002) decided to ex-clude studies of interactive animations from their review.
2. Clusters can be considered to be either (1) concentrations ofevents surrounded by nonevents or (2) areal concentrationswithin which the mapped phenomenon exists at either loweror higher intensities than surrounding areas.
References
Acevedo, W., and P. Masuoka. 1997. Time-series animationtechniques for visualizing urban growth. Computers & Ge-osciences 23 (4): 423–36.
Blok, C., B. Kobben, T. Cheng, and A. A. Kuterema. 1999.Visualization of relationships between spatial patterns intime by cartographic animation. Cartography and Geograph-ic Information Systems 26 (2): 139–51.
Carr, D. B., A. R. Olsen, and D. White. 1992. Hexagon mosaicmaps for display of univariate and bivariate geographicaldata. Cartography and Geographic Information Systems 19(4): 228–36, 271.
Cutler, M. E. 1998. The effects of prior knowledge on children’sability to read static and animated maps. MS thesis, Uni-versity of South Carolina, Columbia.
Evans, B. J. 1997. Dynamic display of spatial data-reliability:Does it benefit the map user? Computers & Geosciences 23(4): 409–22.
Fabrikant, S. I. 2005. Towards an understanding of geovisuali-zation with dynamic displays: Issues and prospects. In: Pro-ceedings of the 2005 Spring Symposium of the AmericanAssociation for Artificial Intelligence, Reasoning with mentaland external diagrams: Computational modeling and spatialassistance, Stanford, CA, 21–23 March 2005, ed. T. Barkow-sky, C. Freksa, M. Hegarty, and R. Lowe, 6–11. Menlo Park,CA: AAAI Press.
Gilmartin, P. P., and J. C. Patton. 1984. Comparing the sexes onspatial abilities: Map-use skills. Annals of the Association ofAmerican Geographers 74: 605–19.
Green, C. S., and D. Bavelier. 2003. Action video game modifiesvisual selective attention. Nature 423:534–7.
Green, T. 1989. Cognitive dimensions of notation. In People andComputers V, ed. A. Sutcliffe and L. Macauley, 443–60.Cambridge, U.K.: Cambridge University Press.
Harrower, M. 2002. Visualizing change: Using cartographic ani-mation to explore remotely-sensed data. Cartographic Per-spectives 39:30–42.
FFF. 2004. A look at the history and future of animatedmaps. Cartographica 39 (3): 33–42.
Harrower, M., A. M. MacEachren, and A. L. Griffin. 2000. De-veloping a geographic visualization tool to support earth
Griffin et al.752

science learning. Cartography and Geographic InformationScience 27 (4): 279–93.
Hegarty, M. 2004. Dynamic visualizations and learning: Gettingto the difficult questions. Learning and Instruction 14:343–51.
Hegarty, M., S. Kriz, and C. Cate. 2003. The roles of mentalanimations and external animations in understandingmechanical systems. Cognition and Instruction 21 (4):325–60.
Kossoulakou, A., and M.-J. Kraak. 1992. Spatio-temporal mapsand cartographic communication. Cartographic Journal 29(2): 101–8.
Kulldorff, M., and N. Nagarwalla. 1995. Spatial disease clus-ters—Detection and inference. Statistics in Medicine 14 (8):799–810.
Lee, P. U., A. Klippel, and H. Tappe. 2003. The effect of motionin graphical user interfaces. Lecture Notes in Computer Sci-ence 2733:12–21.
Lloyd, R. E., and R. L. Bunch. 2005. Individual differences inmap reading spatial abilities using perceptual and memoryprocesses. Cartography and Geographic Information Science32 (1): 33–46.
Lowe, R. 1999. Extracting information from an animation dur-ing complex visual learning. European Journal of Psychologyof Education 14:225–44.
MacEachren, A. M. 1995. How maps work: Representation, visu-alization and design. New York: Guilford.
Macromedia Flash 5, Macromedia, San Francisco, CA, USA.Malinowski, J. C., and W. T. Gillespie. 2001. Individual differ-
ences in performance on a large-scale, real-world wayfind-ing task. Journal of Environmental Psychology 21:73–82.
Montello, D. R., K. L. Lovelace, R. G. Golledge, and C. M. Self.1999. Sex-related differences and similarities in geographicand environmental spatial abilities. Annals of the Associationof American Geographers 89: 515–34.
Nakayama, K. 1985. Biological image motion processing: A re-view. Vision Research 25:625–60.
Openshaw, S., M. Charlton, and A. Craft. 1988. Searching forleukemia clusters using a geographical analysis machine.Papers of the Regional Science Association 64:95–106.
Peterson, M. P. 1995. Interactive and animated cartography. Eng-lewood Cliffs, NJ: Prentice Hall.
Price, S. 2004. Processing animation: Integrating informationfrom animated diagrams. Lecture Notes in Artificial Intelli-gence 2980:360–4.
Salyer, D. L., T. D. Lund, D. E. Fleming, E. D. Lephart, and T. L.Hormath. 2001. Sexual dimorphism and aromatasein the rat retina. Developmental Brain Research 126 (1):131–6.
Sax, L. 2005. Why gender matters. New York: Random House.Slocum, T. A. 1983. Predicting clusters on graduated circle
maps. American Cartographer 10:59–72.Slocum, T. A., R. S. Sluter, F. C. Kessler, and S. C. Yoder. 2004.
A qualitative evaluation of MapTime, a program for ex-ploring spatiotemporal point data. Cartographica 39 (3):43–68.
Slocum, T. A., S. C. Yoder, F. C. Kessler, and R. S. Sluter. 2000.MapTime: Software for exploring spatiotemporal data as-sociated with point locations. Cartographica 37 (1): 15–29.
Tversky, B., J. B. Morrison, and M. Betrancourt. 2002. Anima-tion: Can it facilitate? International Journal of Human Com-puter Studies 57:247–62.
Wertheimer, M. 1912. Experimentelle Studien uber das Sehenvon Bewegung [Experimental studies on motion percep-tion]. Zeitschrift fur Psychologie 61:161–265.
Woodard, E. H., and N. Gridina. 2000. Media in the home 2000:The fifth annual survey of parents and children. http://www.annenbergpublicpolicycenter.org/05_media_develop-ing_child/mediasurvey/survey7.pdf (last accessed 23 Janu-ary 2006).
Correspondence: School of Physical, Environmental and Mathematical Sciences, University of New South Wales-ADFA, Canberra ACT, 2600,Australia, e-mail: [email protected] (Griffin); GeoVISTA Center, Department of Geography, The Pennsylvania State University, 302Walker Building, University Park, PA 16802, e-mail: [email protected] (MacEachren); Department of Geography, University of SouthCarolina, Callcott Social Sciences Building, 709 Bull Street, Room 127, Columbia, SC 29208, e-mail: [email protected] (Hardisty); Info-Graphics Laboratory, University of Oregon, Department of Geography, 1251 University of Oregon, Eugene, Oregon 97403-1251, e-mail:[email protected] (Steiner); Department of Information Technology, Richland County Government, 2020 Hampton Street, Room 3061,P.O. Box 192, Columbia, SC 29202, e-mail: [email protected] (Li).
Comparison of Animated and Static Small-Multiple Maps for Visually Identifying Space-Time Clusters 753