a comparison of berl saddles and nor-pac rings for a …
TRANSCRIPT


A COMPARISON OF BERL SADDLES AND NOR-PAC RINGS FOR
ABSORPTION IN THE AIR-AMMONIA-WATER SYSTEM
by
TRINA L. CARAWAY, B.S. in Ch.E.
A THESIS
IN
CHEMICAL ENGINEERING
Submitted to the Graduate Faculty of Texas Tech University in
Partial Fulfillment of the Requirements for
the Degree of
MASTER OF SCIENCE
IN
CHEMICAL ENGINEERING
Approved
Accepted
May, 1990

Pit
T3
uo. ^ coP. %
ACKNOWLEDGEMENTS
I would like to thank the many individuals who have made this thesis
possible. First, I must express my appreciation to Drs. R. M. Bethea, R. R.
Rhinehart, and R. S. Narayan for their professional insight and guidance in all
technical areas of this project. Second, I must also thank Polymer Piping and
Materials, Inc. for the donation of the Nor-Pac® rings to the Department of
Chemical Engineering and to Dr. Shieh for his interest in this project. Third, I
would like to express my gratitude to the former students of the Unit Opera
tions Laboratory for their diligence in helping me collect the data.
There are not words enough to thank all the friends and family who
have stood behind me for the past two years. My professors, Dr. R. M. Bethea
in particular, have been a solid source of encouragement. Also, Mary Ann
Manley has been an Invaluable friend and advisor. Finally, I must express my
appreciation and love to my family and friends, especially Mr. and Mrs. Don E.
Caraway, who have given me unending encouragement and support.
II

TABLE OF CONTENTS
ACKNOWLEDGEMENTS ii
LIST OF TABLES v
LIST OF FIGURES vi
NOMENCLATURE vill
CHAPTER
L INTRODUCTION 1
IL OBJECTIVES 5
III. THEORY 7
IV. OPERATING AND DESIGN REVIEW 14
Results of Previous Investigations 22
V. EXPERIMENTAL APPARATUS, PROCEDURE, AND SAFETY 27
Experimental Apparatus 27
Experimental Procedure 31
Experimental Safety 33
VI. RESULTS 36
Capacity Comparison 36
Mass-Transfer-Efficiency Comparison 42
Discussion 45
VII. CONCLUSIONS AND RECOMMENDATIONS 47
LIST OF REFERENCES 49
III

IV
APPENDICES
A. ROTAMETER CALIBRATION CURVES 51
B. GAS ABSORBER OPERATING PROCEDURE 54
C. CALIBRATING AND OPERATING PROCEDURE: 57
ORION lONALYZER AND SPECIFIC ION ELECTRODE
D. COMPOSITION OF LUBBOCK CITY WATER 63
E. PRESSURE DROP DATA 67
F. FINAL RESULTS 76
G. DATA FOR NOR-PAC® RINGS 79

LIST OF TABLES
1. Composition of Lubbock city water 64
2. Pressure-drop data for Berl saddles 68
3. Pressure-drop data for Nor-Pac® rings 72
4. Values for pressure-drop comparison of Berl saddles 77
5. Values for pressure-drop comparison of Nor-Pac® rings 77
6. Values for mass-transfer-efficiency comparison of Berl saddles 78
7. Values for mass-transfer-efficiency comparison of Nor-Pac® rings 78

LIST OF FIGURES
1. Interface properties in terms of bulk properties 8
2. Countercurrent flow in packed towers 11
3. Pressure-drop characteristics of packed columns 15
4. Typical pressure drop-gas flowrate curves 16
5. Tower-sizing algorithm 20
6. Generalized flooding and pressure-drop correlations for packings 21
7. Pressure-drop data for ceramic Berl saddles 23
8. Modified specific pressure drop as a function of the vapor capacity factor 24
9. Comparison of mass-transfer capabilities of Berl saddles and
Rashig rings 26
10. Experimental gas absorber 28
11. Column packings 29
12. Selected pressure-drop curves for Berl saddles 37 13. Selected pressure-drop curves for Nor-Pac® hngs 37
14. Capacity as a function of liquid flowrate 38
15. Capacity comparison of Berl saddles and Nor-Pac® rings 40
16. Flooding and pressure-drop curves for Berl saddles 41
17. Flooding and pressure-drop curves for Nor-Pac® rings 41
18. Comparison of HTU as a function of gas flowrate 43
vi

vii
19. Comparison of HTU as a function of water flowrate 43
20. Comparison of KQG as a function of gas flowrate 44
21. Comparison of KQG as a function of water flowrate 44
22. Air rotameter calibration curve 52
23. Ammonia rotameter calibration curve 53
24. Typical electrode response: liquid samples 59
25. Typical electrode response: air samples 62
26. Physical properties of Nor-Pac® rings 80

NOMENCLATURE
a interfacial area per unit volume of active sq ft / cu ft packing
C A concentration of component A Ibmol / cu ft
Cv vapor capacity factor ft / sec
dp nominal packing size in.
D column diameter ft
D A B diffuslvity of component A in component B sq ft-min
Fp packing factor 1/ft
gc gravity constant Ibf-sec2 / Ibm-ft
G total gas flowrate Ibm / hr-sq ft
G* carrier gas flowrate Ibm / hr-sq ft
G" superficial gas velocity Ibm / hr
HTU overall height of a transfer unit ft
KOG overall, gas-side, mass-transfer coefficient Ibmol / sq ft-min-atm
kg gas-side, mass-transfer coefficient Ibmol / sq ft-min-atm
L total liquid flowrate Ibm / hr-sq ft
L' flowrate of liquid solvent Ibm / hr-sq ft
LT height of the packed section of a tower ft
M molarity g /1
VIM

IX
N normality
N A molar flux of component A
NTU number of transfer units
AP pressure drop
S cross-sectional area of column
Sc Schmidt number
V linear gas velocity
V volume
XA mole fraction of component A in liquid phase
XA mole ratio of component A in liquid phase to liquid solvent
yA mole fraction of component A in gas phase
Y A mole ratio of component A in gas phase to gas solvent
z film thickness
g / i
Ibmol / sq ft-min
in. of water
sqft
ft/sec
ml
in.
Subscripts
AB property of component A in component B
B property at bottom of the packed column
F property at flooding point
g property is based on gas-side mass-transfer resistance
G property is based on gas-side mass-transfer resistance or is a property of the gas stream
i property at gas-liquid interface
L property at loading point or a property of the liquid stream
p property of column packing
T property of the tower or a property at the top of the packed column
V property associated with a vapor
1 property of an original solution
2 property of a diluted solution
Superscript
* property based on equilibrium values
Greek Symbols
<) square root of the ratio of the density of the solute gas to the carrier gas
\i viscosity cp
p density Ibm/cuft
\\f ratio of the density of water to the density of the liquid used for absorption

CHAPTER I
INTRODUCTION
Mass-transfer operations involve the transfer of one or more compo
nents from one phase to another on a molecular scale.'' Such separation op
erations make up a large portion of the unit operations in the chemical pro
cess industry. The major function of these operations includes the preliminary
separation and purification of raw materials, the purification of final products,
and the recovery of process materials, such as solvents, for reuse. Also, due
to the demand for pure products, the major cost of a particular process is often
the expense associated with the separation and purification units.
There are several different types of mass-transfer operations, two of
which are gas absorption and distillation. Gas absorption is a so lute-recovery
or solute-removal operation in which one or more components of a gas mix
ture are removed by a liquid solvent wash.'' This procedure is used when the
solute and gas solvent have very different properties, such as diffusivity, in the
liquid solvent phase. Some industrial applications of gas absorption include
the removal of methane from other hydrocarbons using a nonvolatile hydro
carbon oil, the removal of hydrogen sulfide or carbon dioxide from hydro-
cariDon streams using an amine, or the removal of ammonia from waste
streams using water as the liquid solvent. Gas absorption is performed in a
packed tower, a vertical column filled with packing to encourage repetitive
gas-liquid contact.
1

Distillation, on the other hand, is a technique used to separate compo
nents that are often chemically similar in nature. For example, a situation in
which distillation would be used is in the separation of pentane and hexane.
In general, distillation is carried out in trayed towers, vertical columns in which
the liquid and gas are contacted on trays or plates. However, thermally sen
sitive materials may require vacuum distillation, which is handled more readily
in packed towers.2
As with any other type of equipment, there are advantages and disad
vantages associated with the use of packed towers. Packed towers tend to
have a smaller pressure drop than trayed towers, and therefore, contribute a
smaller energy requirement to the entire process. This pressure drop is
caused by the loss of fluid energy due to friction predominantly through the
mass-transfer devices (packing or trays) and, more importantly, loss of accel
eration. Some other advantages associated with the packed tower include
their ability to handle corrosive, thermally sensitive, or foaming systems, as
well as high liquid and gas flowrates. A few of the drawbacks to the use of
packed towers are the lack of side streams, the increased difficulty in cleaning
compared to trayed towers, and the use of fragile packings that may tend to be
crushed and may not withstand high temperature fluctuations.
Despite all of the situations suggesting the use of a packed tower along
with their advantages and disadvantages, packed towers will not be built un
less their construction and use are profitable to industry. An economical
packed tower is operated so that it has as low an energy requirement as pos
sible, or, in other words, a low pressure drop. The capital cost of the equip
ment needs to be low or, rather, the tower should be as small and light as
possible to perform the required separation. Column packings have a
considerable effect on the energy requirement, the height, and the necessary
foundations a packed tower may require.
A dominant trend in the chemical process industry today is the retro
fitting of some existing trayed or packed columns with packings that have
been recently developed.2 Nor-Pac® plastic packing is one of the many new
packings that have been developed to meet this demand. The manufacturers
of this ring-like packing state that it exhibits the properties most needed in in
dustrial packed columns: low pressure drop, extremely high capacity, and
high mass-transfer efficiency.^
In order to select a suitable packing for the retrofit of an existing column
or the design of a new column, one must know the performance character
istics of the packing and how they compare to those of more well-known pack
ings. These performance characteristics include operating problems such as
flooding, a condition caused by high pressure drop or an excessive liquid
flowrate resulting in liquid buildup within the tower and a subsequent drop in
mass-transfer. Thus, the capacity of a packed tower is defined in terms of the
liquid solvent flowrate at which flooding occurs. One must note that flooding
will occur at different liquid solvent flowrates as the gas flowrate changes.
Another performance characteristic that should be noted is the loading
point associated with a particular set of liquid and gas flowrates. This point is
defined as the lowest liquid solvent flowrate that will provide sufficient gas-
liquid contact for mass transfer at a particular gas flowrate. The liquid solvent
flowrates between the loading and flooding points constitute the operating
range of the tower at a particular gas flowrate.
Other packing performance characteristics include the height of a trans
fer unit (HTU), which is the overall height of a gas transfer unit, and the overall,

gas-side, mass-transfer coefficient, K Q G . a measure of the rate of mass trans
fer within a process.'' All symbols are defined in the Nomenclature, pp. viii-x.
Both are functions of the gas and liquid flowrates and compositions. Mass-
transfer effectiveness can be expressed in terms of the number of transfer
units (NTU), a measure of the packing required for a particular separation, or
their height (HTU). The HTU will be defined as a function of process stream
compositions and the packed height of the column. The overall, gas-side,
mass-transfer coefficient is defined as the ratio of the mass flux to the concen
tration gradient of solute in the gas phase. The mass-transfer coefficient can
be related to HTU and other process variables.
This work evaluates the performance characteristics of 5/8-in. (nominal)
polypropylene Nor-Pac® rings and a subsequent comparison to similar char
acteristics of a more common packing, 1/2-in. (nominal) ceramic Beri saddles.
The laboratory-scale. Corning gas absoriDer used for this project is equipped
to study the absorption of ammonia from air using water as the liquid solvent.
The results are reported in terms of flooding characteristics, HTU, and KQG-
CHAPTER II
OBJECTIVES
This research has two objectives. The first objective is to determine
three conventional packed tower performance characteristics for each of two
packings: 1/2-in. (nominal) ceramic Berl saddles and 5/8-in. (nominal) poly
propylene Nor-Pac® rings. The characteristics are the gas-handling capac
ity; the height of a transfer unit; and the overall, gas-side, mass-transfer coef
ficient associated with each packing. The second objective is to compare
these performance characteristics in order to determine which packing has
the higher gas-handling capacity, the lower height of a transfer unit, and the
higher overall, gas-side, mass-transfer coefficient.
The first objective was met by obtaining experimental data from a sin
gle laboratory-scale gas absorber packed first with the Berl saddles, then
with the Nor-Pac® rings when they became available. The data includes
the pressure drop at various air and water flowrates, which was used to de
termine a set of flooding and loading points. The operating range and the
gas-handling capacity associated with each packing were based on the
flooding- and loading-point data. The packed tower was then used as an
absorber to remove ammonia from air using water as the liquid solvent. The
steady-state inlet and outlet compositions were used to calculate the num
ber of transfer units (NTU), which represent the amount of contacting re
quired to accomplish a phase enrichment, divided by the driving force in that

6
phase.^ The HTU values were obtained from the NTU and the height of the
packed section. Subsequently, the HTU and other proces parameters were
used to calculate KoG-
The second objective was met by comparing the flooding points and
operating ranges of each packing, as well as the HTUs and KQGS. These last
two parameters were reported as functions of both the gas and the liquid
flowrates.

CHAPTER III
THEORY
The height of a packed section of any column, L j , is evaluated from
the NTU, the HTU, and the mass-transfer coefficient associated with the par
ticular system in question. These three parameters are all functions of the gas
and liquid flowrates used in the column, the type of packing used in the col
umn, and the separation to be performed by the column. The functionality of
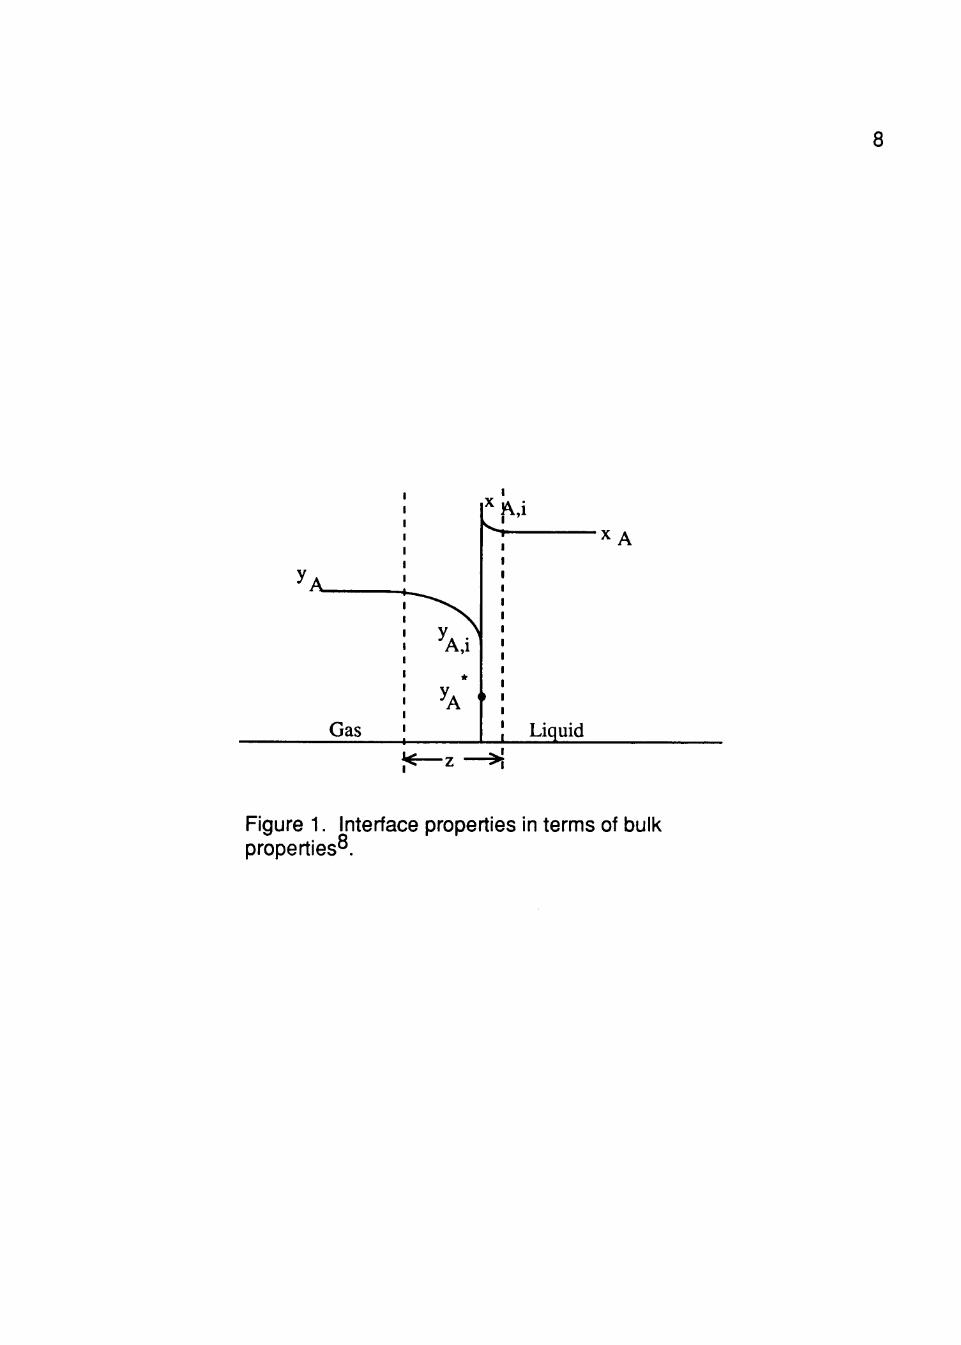
NTU is based on the definition of the mass flux of a component A (Figure 1):
N A = - C A * DAB * (dyA / dz) + yA * (NA + NB). (1)
While the second term in Equation 1 accounts for transport by bulk flow, the
first accounts for the diffusive transport which is superimposed on the bulk
flow.4
Some simplifying assumptions can be made at this time. First, the air-
ammonia-water system exhibits unimolecular diffusion, UMD, the diffusion of
one component A, ammonia, through a non-diffusing component B, air. This
assumption is valid since air does not diffuse into the water and at the temper
atures at which experiments were performed, 70-75OF, there is no appre
ciable evaporation of water into the gas stream. Since N B = 0, Equation 1
becomes
8
^A
Gas
A,i
*
A '
< z
]^ X A
» 1
] Liquid - ^
Figure 1. Interface properties in terms of bulk properties .

9 NA = -CA * DAB * (dyA / dz) + yA * NA (2)
or, after separation of variables,
NA dz = (-CA * DAB / (1 -yA)) dyA. (3)
Second, in dilute solutions, yA is small, (1-yA) is approximately 1, and, after
integration and rearrangement. Equation 3 becomes
NA = -CA * DAB * (yA - yA,i) / z. (4)
Since the film thickness, z, and component diffusivities are difficult to predict, a
new parameter, kg, the gas-side, mass-transfer coefficient, is introduced to
simplify Equation 4:
NA = kg * (yA - yA,i), (5)
where
kg = -CA * DAB / z. (6)
Due to the difficulty in evaluating compositions at the film interface, Equation 5
is further modified to
NA = KOG * (yA - yA*) (7)
or, in mole ratios,
NA = Ko G * (Y -Y*). (8)

10
The subscript has been dropped from the mole ratio terms since only one
component composition, that of ammonia, is of interest. The overall, gas-side,
mass-transfer coefficient, K Q G . may be determined from terminal, rather than
interfacial, compositions. The mole ratio of solute to gas solvent in equilibrium
with a solution of X moles of solute per mole of liquid solvent is Y*.
Next, a material balance for component A, which is being absorbed
over a differential height of column, dLj in Figure 2, gives
-d(G*Y) = N A * a * S dLj. (9)
The gas solvent flowrate, G', is constant due to the assumption of UMD and is
a good representation of G, the total gas flowrate, since the diffusing solute is
present in dilute quantities. A new parameter, a, the interfacial area per unit
volume of active packing has been introduced in order to quantify the area in
the packing available for mass transfer. The cross-sectional area of the col
umn is S. Substitution of Equation 8 into Equation 9 and simplification gives
G' dY = -KoG * (Y - Y*) * a * S dLy (10)
or, after rearrangement,
dLT = (-G* / KoGaS) * dY / (Y -Y*). (11)
Integration of Equation 11 yields
LT = (G* / KoGaS) * [(YB - Yj) / (Y - Y * )LM] (12)
where

11
IT
dLy
JL
Figure 2. Countercurrent flow in packed towers^.

12
(Y - Y* )LM = (Y-Y*)T - (Y-Y*)B / In [(Y-Y*)T / (Y-Y*)B]. (13)
Equation 12 is the basic equation used for the design of gas absorbers and
may be rewritten as
LT = H T U * N T U , (14)
where
NTU = (YB-YT) / (Y - Y \ M (15)
and
HTU =G'/KOGaS. (16)
The compositions of the gas phase, as opposed to the liquid phase, were
used in developing the design equation because the main resistance to mass
transfer in the air-ammonia-water system is on the gas side of the gas-liquid
interface due to the great solubility of ammonia in water.
The NTUs are a function of the required separation and the departure
from thermodynamic equilibrium as shown by the numerator and denominator
of Equation 15, respectively. The NTUs required for a particular separation
are a measure of the difficulty of that separation. A more difficult separation
will require more NTUs, and thus, a longer packed section.
The HTU is the vertical height of packing required to affect a phase en
richment. The lower the value of HTU, the more efficient the device will be."
The use of packings yielding lower HTUs produces shorter new columns, thus
reducing the cost of the column shell and foundations. Also, as seen in

13
Equation 14, HTU and NTU are inversely proportional for a fixed column
height. Therefore, existing columns retrofitted with a lower-HTU packing for
the same operation will have more mass-transfer area than before the retrofit.
The latter situation will only be a payoff if an increase in mass-transfer area
will significantly improve the separation capabilities of the column, i. e., in
crease the NTUs.
The overall, gas-side, mass-transfer coefficient, K Q G . is intimately as
sociated with the mass-transfer capabilities of any packed column. K Q G is
inversely proportional to HTU, as shown by the first term on the right in Equa
tion 16. Thus, the higher the K Q G . the more efficient the device will be. K Q G
is defined by Equation 8 as the molar flux of a solute component divided by a
concentration gradient of that component. However, K Q G niay be calculated
using HTU, as in Equation 16. If the column height is unknown, the HTU or
KOG values must be obtained from literature tabulations, experimental data,
or correlations.'''^
CHAPTER IV
OPERATING AND DESIGN REVIEW
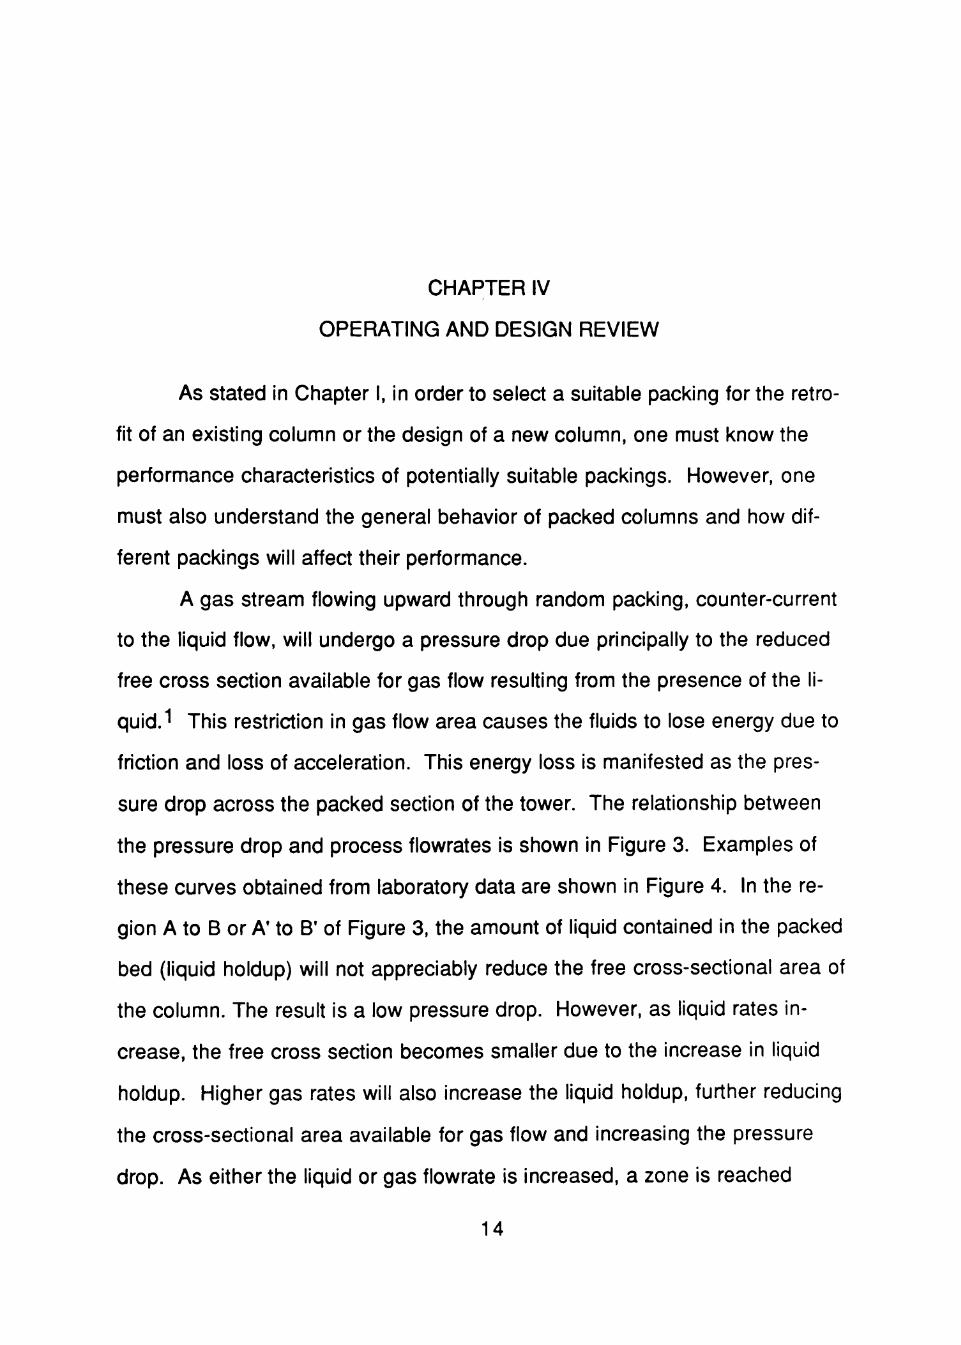
As stated in Chapter I, in order to select a suitable packing for the retro
fit of an existing column or the design of a new column, one must know the
performance characteristics of potentially suitable packings. However, one
must also understand the general behavior of packed columns and how dif
ferent packings will affect their performance.
A gas stream flowing upward through random packing, counter-current
to the liquid flow, will undergo a pressure drop due principally to the reduced
free cross section available for gas flow resulting from the presence of the li
quid.'' This restriction in gas flow area causes the fluids to lose energy due to
friction and loss of acceleration. This energy loss is manifested as the pres
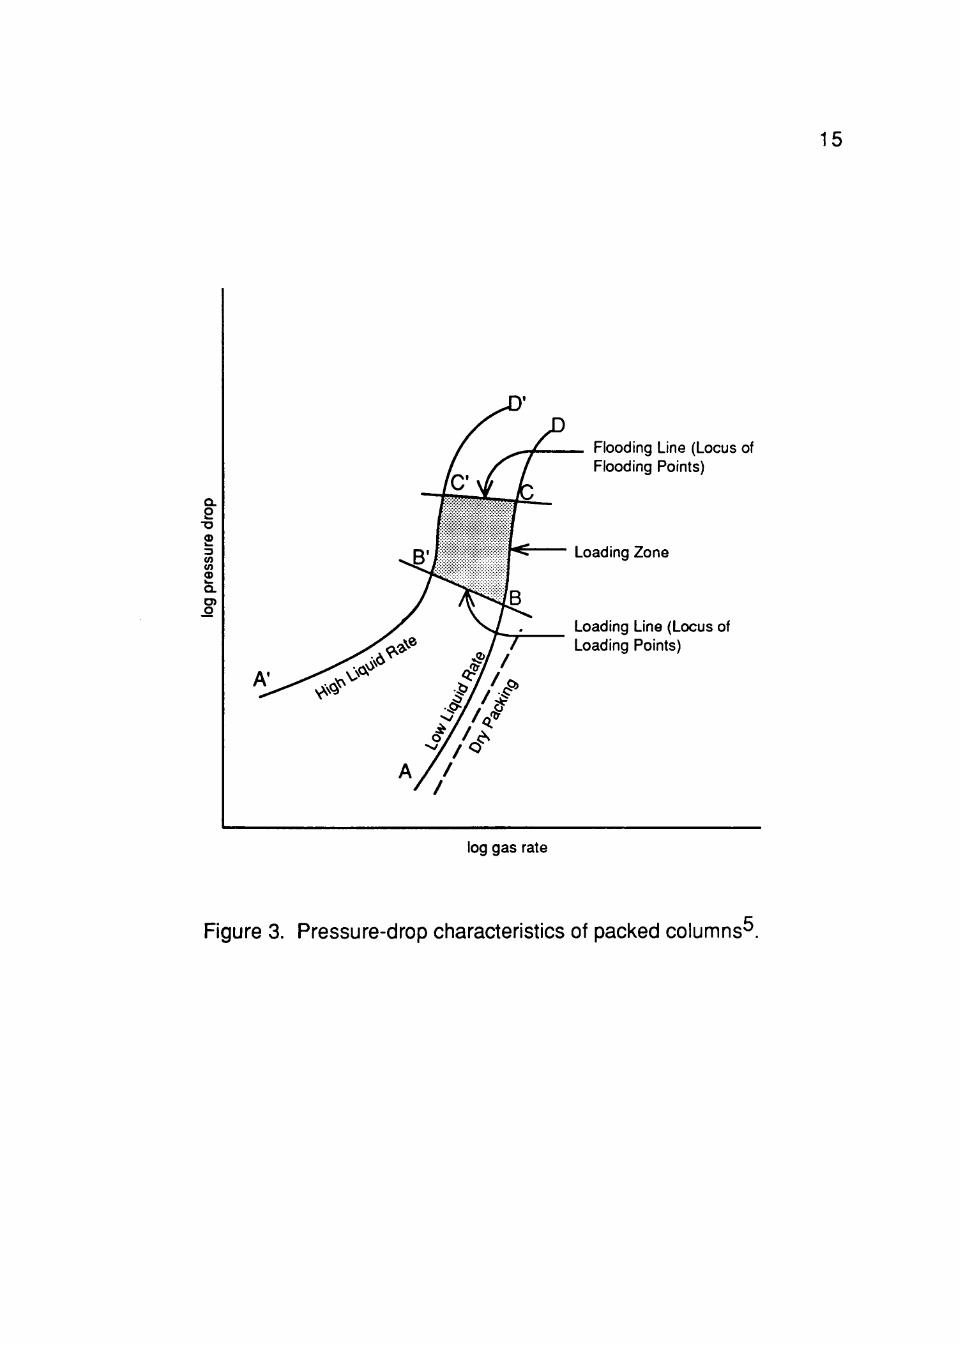
sure drop across the packed section of the tower. The relationship between
the pressure drop and process flowrates is shown in Figure 3. Examples of
these curves obtained from laboratory data are shown in Figure 4. In the re
gion A to B or A* to B' of Figure 3, the amount of liquid contained in the packed
bed (liquid holdup) will not appreciably reduce the free cross-sectional area of
the column. The result is a low pressure drop. However, as liquid rates in
crease, the free cross section becomes smaller due to the increase in liquid
holdup. Higher gas rates will also increase the liquid holdup, further reducing
the cross-sectional area available for gas flow and increasing the pressure
drop. As either the liquid or gas flowrate is increased, a zone is reached
14
Q. 2
• o
Oi in
O
B
>^<^ ^ V •A-.o^ .9^* ^®
15
Flooding Line (Locus of Flooding Points)
1 f 1 ^
/ / ^
Loading Zone
Loading Line (Locus of Loading Points)
log gas rate
Figure 3. Pressure-drop characteristics of packed columns^.

16
t o r t 3
\S
L4
L3
LC
IJ
t o 0 t 9
0 « O
0 4 9
a s o
0.7S
0.70
o.«s
0 ti
0 AC
• m
0/M
IJ IT
/
/ /
/ /
/L«tl.T20 / f , ' a i o » « /
,/ /
/ /
1 , 1 1 1 U3 u LZ L5 L4
1
J
\ \
/ f'
f
j L«to.4ac / f H O o n
/
j_U, LS
, t l L<
/l«C LT
> T
/
/
J L«
/ /
L*
/ / ^
LO
"1 n
I
1
/
i
.•11.130 ^!00V«
\ -S
Figure 4. Typical pressure drop-gas flowrate curves.

17
where the pressure drop begins to increase rapidly. This zone, between B
and C or B' and C, is known as the loading zone, and B or B', the loading
point for a particular liquid rate. The loading point is physically defined as a
particular gas and liquid flowrate combination that will provide sufficient liquid
holdup for high mass transfer without too high a pressure drop. The loading
point is also defined analytically as the first breakpoint in the log-log plot of
pressure drop versus gas flowrate.^
As the liquid and/or gas flowrates are increased to C or C, one of a
number of changes occurs:
1) a layer of liquid, through which the gas bubbles, may appear at the top of the packed section,
2) liquid may fill the column, starting at the bottom or at any intermediate restriction, such as a support, so that there is a change from gas-continuous liquid-dispersed to liquid-continuous gas-dispersed (phase role reversal), or
3) slugs of foam may rise rapidly upward through the packing.''
When one or more of these conditions exists, the column is said to be flooded.
The pressure drop increases very rapidly with a slight increase in gas or liquid
flowrate. For a particular liquid rate, the gas rate at which flooding occurs is
known as the vapor flooding velocity or the allowable vapor rate. Thus, the
vapor flooding velocity is the vapor- or gas-handling capacity of a packed col
umn.5 It is impractical to operate a packed column in a flooded condition due
to the accompanying large pressure drop, reduction of effective area for mass
transfer, and possible damage to column internals and packings. The change
in conditions in the regions B to C and B' to C of Figure 3 is gradual, and ini
tial loading and flooding points are frequently determined by the change in
18
slope of the pressure-drop curves rather than by visual inspection of the
operating column.^
The capacity factor, Cv, and the capacity factor at floodlng,CvF. are
used as aids in describing column capacity. These parameters are based on
UG (pG/pL)''^^, a value used in correlating data on the physical properties of
industrial process fluids, including but not limited to air and water.47 jhis
value is also used to correlate flooding velocities in packed columns.^'8 Ex
amples of the use of the capacity factor can be found in such articles as the
one by Kunesh.9
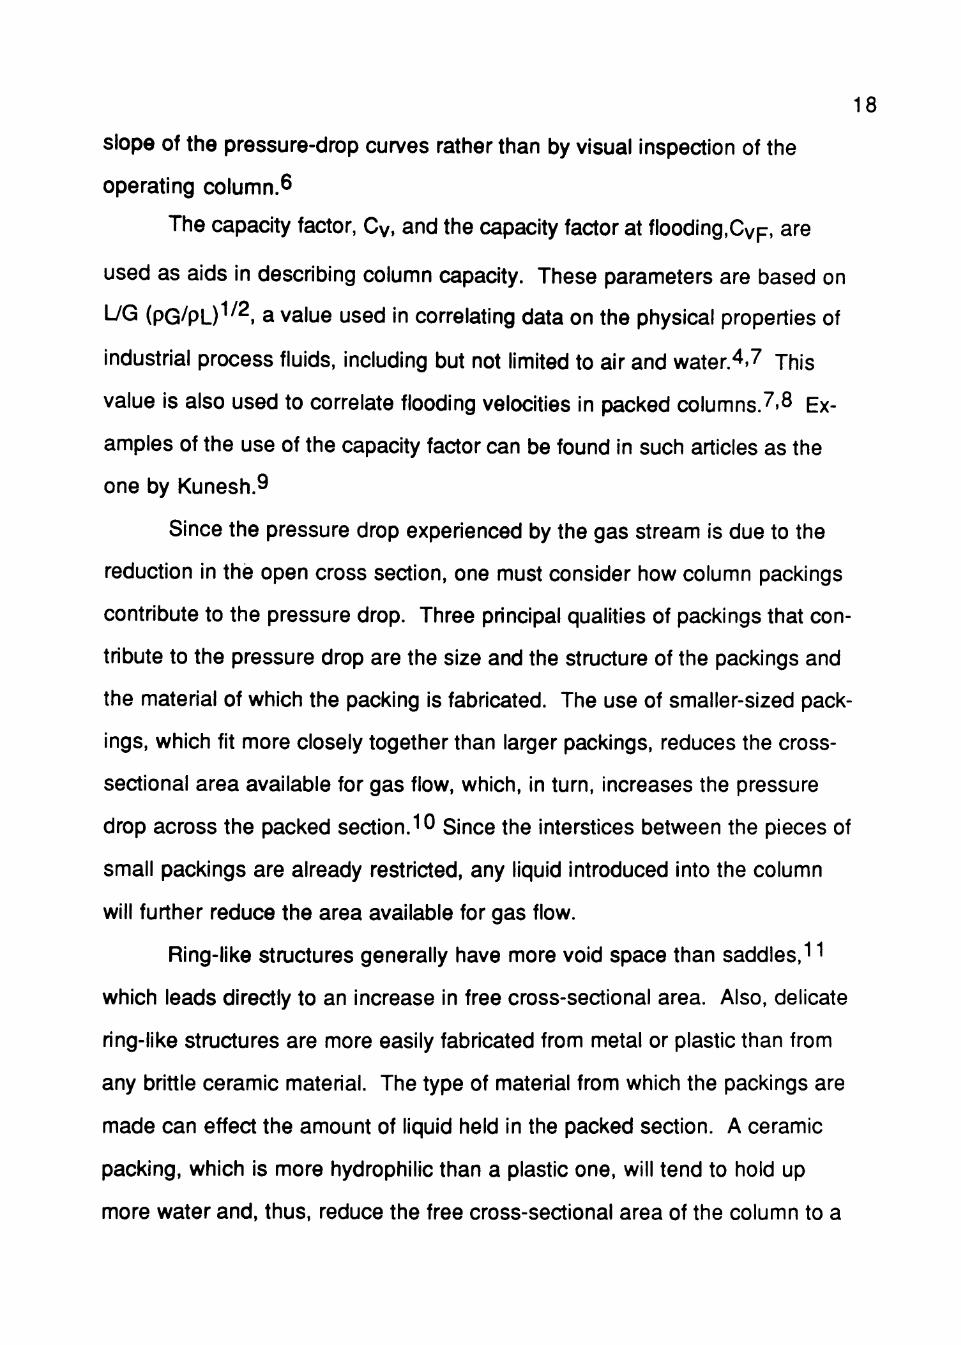
Since the pressure drop experienced by the gas stream is due to the
reduction in the open cross section, one must consider how column packings
contribute to the pressure drop. Three principal qualities of packings that con
tribute to the pressure drop are the size and the structure of the packings and
the material of which the packing is fabricated. The use of smaller-sized pack
ings, which fit more closely together than larger packings, reduces the cross-
sectional area available for gas flow, which, in turn, increases the pressure
drop across the packed section."'0 Since the interstices between the pieces of
small packings are already restricted, any liquid Introduced into the column
will further reduce the area available for gas flow.
Ring-like structures generally have more void space than saddles,''''
which leads directly to an increase in free cross-sectional area. Also, delicate
ring-like structures are more easily fabricated from metal or plastic than from
any brittle ceramic material. The type of material from which the packings are
made can effect the amount of liquid held in the packed section. A ceramic
packing, which is more hydrophilic than a plastic one, will tend to hold up
more water and, thus, reduce the free cross-sectional area of the column to a

19
greater extent. Also, ceramic packings do not have dry spots at low liquid
flowrates, creating a larger interfacial area for mass transfer.
Column packings and the gas and liquid flowrates used in the column
are critical to the determination of column diameter. While a high vapor rate
may be desirable, the column packing and diameter must be selected in order
to operate the column between the loading and flooding points to avoid chan
neling and phase role reversal, respectively. This selection is accomplished
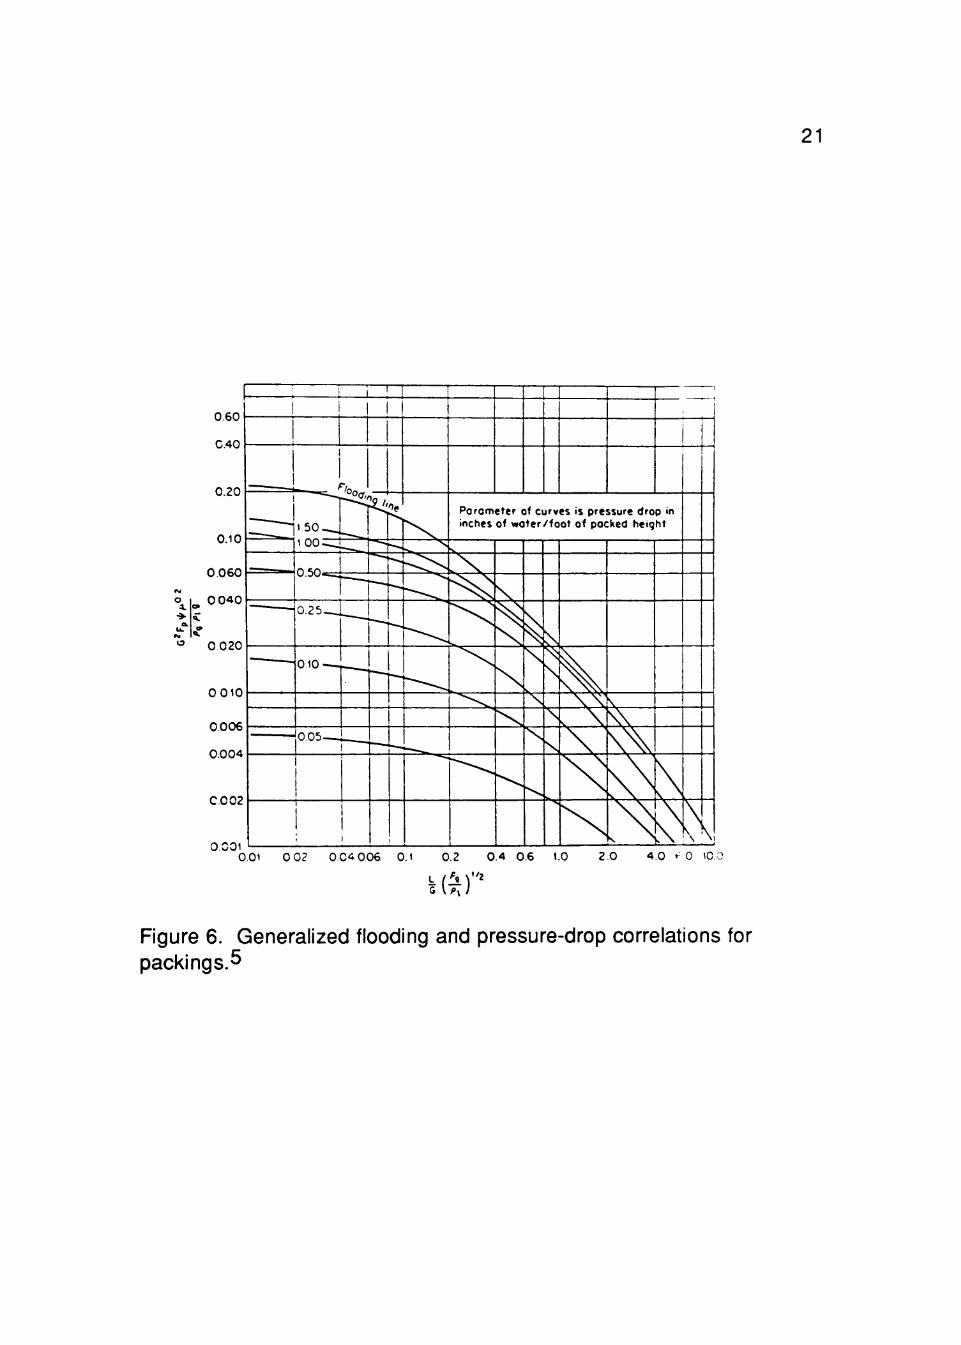
by using the basic algorithm for tower sizing, which is shown in Figure 5. Fig
ure 6, the generalized Eckert correlation for pressure drop^, is used in the al
gorithm. The abscissa in Figure 6 is easily determined from the liquid and
vapor rates and their densities at the bottom of the column. The values of the
flowrates at the bottom of the column are used since they are larger than at
any other point in the column, thus providing a more conservative design. For
absorbers, the inlet gas stream is usually a process stream from another piece
of equipment, and therefore, is well-defined in terms of flowrate (G) and densi
ty (PG)- Generally, a specified amount of solute must be recovered by a liquid
solvent, giving pL- The liquid rate, L, is based on some multiple, usually 1.15-
1.3, of the minimum liquid rate needed to saturate the exiting gas stream at in
finite column height.
After the flowrates have been determined, a packing type and size must
be chosen in order to obtain Fp, the packing factor which characterizes the
vapor flow capacity.^ Tables listing packing factors for various types of con
ventional packings are provided in the Chemical Engineers' Handbook.
While the values listed in such publications are suitable for initial design pur
poses, packing manufacturers should be consulted for reliable values of Fp.9
The initial values of the packing factor are determined experimentally. If these

20
Preferred L and G fixed
\ /
Choose packing type and preliminary size
± Obtain F,
I Fix P
\ /
Calculate G" using Figure 6
± Calculate diameter
2iL Yes
^
^ No
Figure 5. Tower-sizing algorithm'
21
o 3.
0.60
C.40
0.20
0.10
0 060
0 040
•^ 0 0 2 0
0 0 1 0
0.006
0 .004
CO 02
0.C01
1 1 1
t
I
«:;;^/
1 UU—..
n " n .
0.25-_
010 —
1
f ^
~-f
005 L__ 1
1 1
1
^
I
•
1
Parometer o< curves is pressure drop in inches o< v»ater/foot of pocked height
" ^ ^ v ^
V \
\ \
0.01 0 02 0 04 0 0 6 0.1 0.2 0.4 0.6 1.0
9 \ " 2
2.0 4.0 ^ 0 (CO
H )
Figure 6. Generalized flooding and pressure-drop correlations for packings.5
22
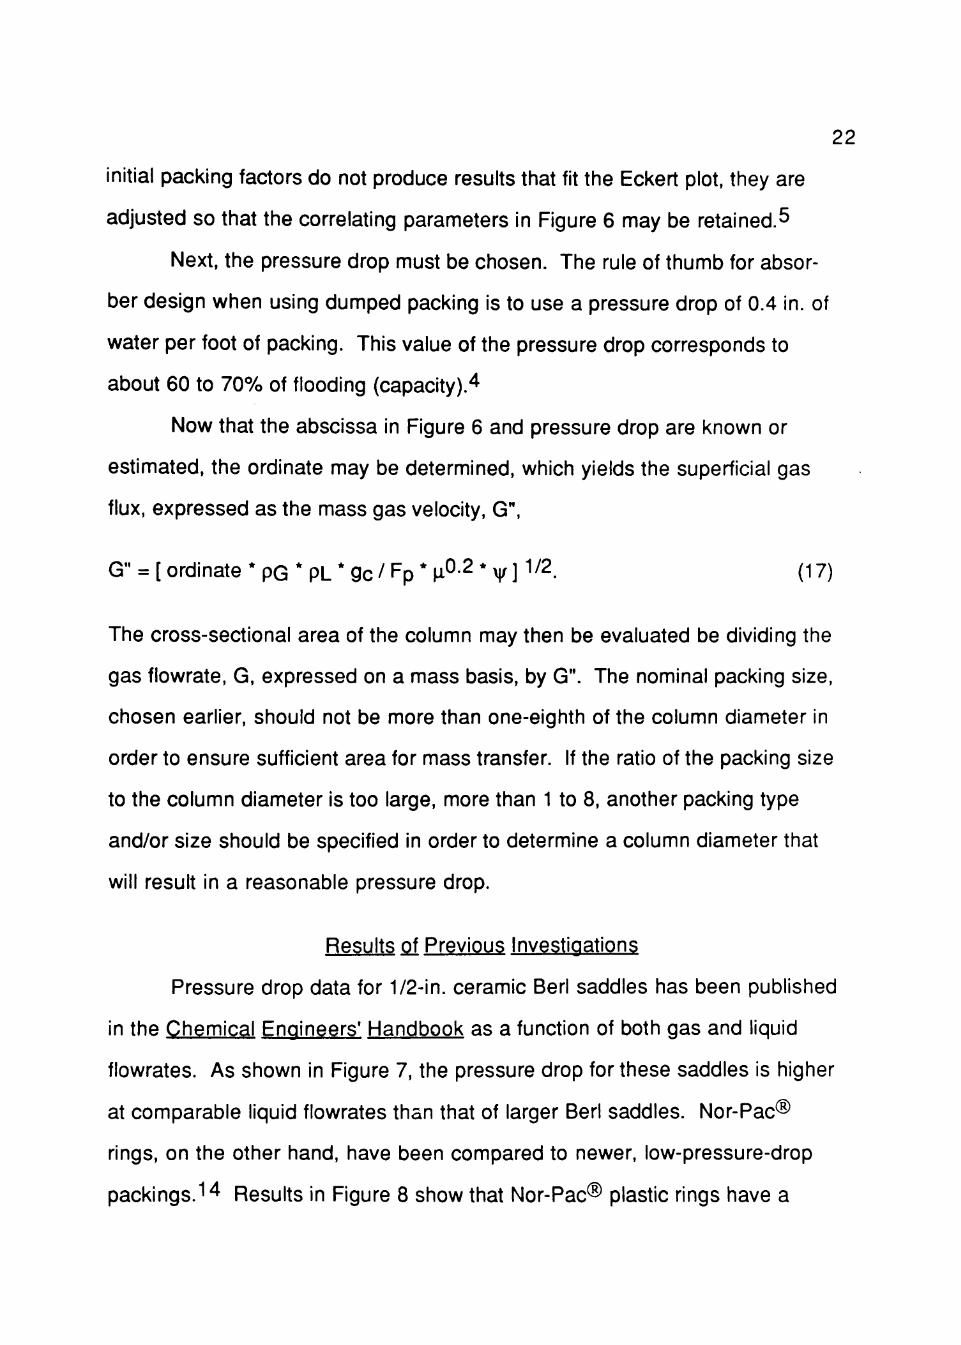
initial packing factors do not produce results that fit the Eckert plot, they are
adjusted so that the correlating parameters in Figure 6 may be retained.^
Next, the pressure drop must be chosen. The rule of thumb for absor
ber design when using dumped packing is to use a pressure drop of 0.4 in. of
water per foot of packing. This value of the pressure drop corresponds to
about 60 to 70% of flooding (capacity).^
Now that the abscissa in Figure 6 and pressure drop are known or
estimated, the ordinate may be determined, which yields the superficial gas
flux, expressed as the mass gas velocity, G",
G" = [ ordinate * pG * PL * gc/ Fp * ^0-2 * y ] 1/2. (17)
The cross-sectional area of the column may then be evaluated be dividing the
gas flowrate, G, expressed on a mass basis, by G". The nominal packing size,
chosen earlier, should not be more than one-eighth of the column diameter in
order to ensure sufficient area for mass transfer. If the ratio of the packing size
to the column diameter is too large, more than 1 to 8, another packing type
and/or size should be specified in order to determine a column diameter that
will result in a reasonable pressure drop.
Results of Previous Investications
Pressure drop data for 1/2-in. ceramic Beri saddles has been published
in the Chemical Engineers' Handbook as a function of both gas and liquid
flowrates. As shown in Figure 7, the pressure drop for these saddles is higher
at comparable liquid flowrates than that of larger Berl saddles. Nor-Pac®
rings, on the other hand, have been compared to newer, low-pressure-drop
packings.''^ Results in Figure 8 show that Nor-Pac® plastic rings have a

23
2.0
1.0
Q5
AP
0.2
0.1
0.05
002
0.01 /
,/
/
1 1 1 ^ 1 1
1/2 in.
'
/
f
/
/ h
1
Berl Soddles
o / <-./ 1
IJ Jr/
1
7. //
i
o o
1
7
T
•"I
<V' LT
/'^i \ / / /
/
/
1 1 1
10 20 50 100 200
( 0 ) ^
500 1000
1.0
-\/^«
/
1 1 i
J '
/ I
^ /
/
1
1. Beri Soddles
- o / < /
A »/
/ ' / ' f
f . 1 /
/ / / / • / / -ta i
/ 1 o.
1
' J I
/ , ( A /7 y /
— r-1 a/ / — o / —V
M / ///' -^Vv ^/X ult-"// 0 f
o |
C\J |
o / / i
' '^'1/ /
(\ /
7<\i ID /
4"
10 20 50 100 200 500 1000 20C0
T (b)
Figure 7. Pressure drop data for ceramic Beri saddles: a) 1/2 in., b) 1 in.13

24
Ammonia-Air/Woler 1 bar,293K
<»0 22mO.6230 1/mllO m /m^h ©03 •• .6340 •• o .- .. .4890 •• B
G ,5120 15
CNorobenzene/Ethylbenzene L7V=1 0.22 m 0.6195 l/m^
•33mbor.o67mbar.ci33 mbor
AmmofMO -Air/Water 1 bar.293K, 10 m /m^h
CD
E
a. <3 a. o * •o Ol
to Ol
o.
Ol o. tn •o o; S o
O; 06 0 8 1 15 2 3 04 06 0 8 I 1
Vapor capacity factor F,, (m s kg 1
Figure 8. Modified specific pressure drop as a function of the vapor capacity factor. 1^

25
considerably lower pressure drop when compared to several other packings,
such as the comparably sized ceramic Pall rings and ceramic Hiflow rings.
The mass-transfer capability of the Beri saddles are also shown in the
Chemical Engineers' Handbook and compared to similarly sized Rashig
rings. Figure 9. These data show that the mass-transfer efficiency of Berl sad
dles decreases as the gas flowrate increases but increases as the liquid flow-
rate increases. These results were obtained through the use of the same ab
sorption system used for this study, the air-ammonia-water system. As of Jan
uary 1, 1989, no published results based on laboratory data has been found
for the mass-transfer efficiency of plastic Nor-Pac® rings.

26
5
4 1/2 in, Raschig rings and
— 1/2 in. Berl saddles
0.8
0.6
0.4
= /500!::./fr-n:
200 300 500 1000 Gos moss velocity, G, lb./(sq.ft.)(hr.)
Figure 9. Comparison of mass-transfer capabilities of Berl saddles and Rashig rings.l^
CHAPTER V
EXPERIMENTAL APPARATUS, PROCEDURE, AND SAFETY
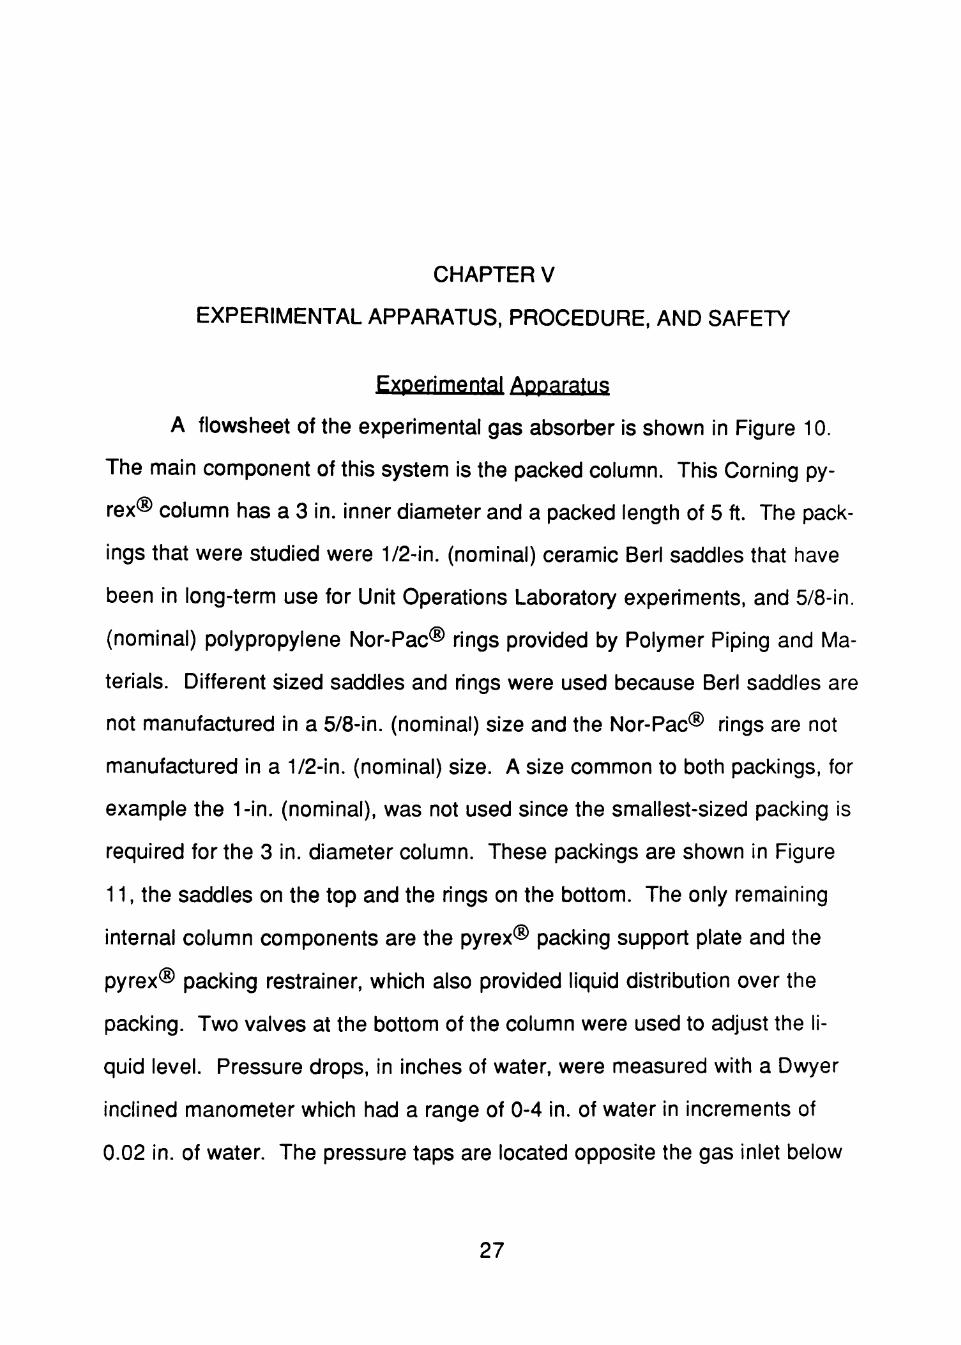
Experimental Apparatus
A flowsheet of the experimental gas absorber is shown in Figure 10.
The main component of this system is the packed column. This Corning py-
rex® column has a 3 in. inner diameter and a packed length of 5 ft. The pack
ings that were studied were 1/2-in. (nominal) ceramic Beri saddles that have
been in long-term use for Unit Operations Laboratory experiments, and 5/8-in.
(nominal) polypropylene Nor-Pac® rings provided by Polymer Piping and Ma
terials. Different sized saddles and rings were used because Beri saddles are
not manufactured in a 5/8-in. (nominal) size and the Nor-Pac® rings are not
manufactured in a 1/2-in. (nominal) size. A size common to both packings, for
example the 1-in. (nominal), was not used since the smallest-sized packing is
required for the 3 in. diameter column. These packings are shown in Figure
11, the saddles on the top and the rings on the bottom. The only remaining
internal column components are the pyrex® packing support plate and the
pyrex® packing restrainer, which also provided liquid distribution over the
packing. Two valves at the bottom of the column were used to adjust the li
quid level. Pressure drops, in inches of water, were measured with a Dwyer
inclined manometer which had a range of 0-4 in. of water in increments of
0.02 in. of water. The pressure taps are located opposite the gas inlet below
27

28
Sannpling Port Outlet Gas to
Exhaust Vent
Compressed Air
Figure 10. Experimental gas absorber.

29
Figure 11. Column packings: a) 1/2 in. (nominal) ceramic Beri saddles, b) 5/8 in. (nominal) polypropylene Nor-Pac® rings.

30
the packing support plate and opposite the water inlet above the packing re-
strainer.
Volumetric flowrates were measured by the use of three calibrated ro
tameters. The air rotameter, Brooks model 1110, consists of a type R-8M-25-2
tube and a type 8-RS-8 spherical float made of stainless steel. The scale
readings range from 0-250 mm with increments of 2 mm, which correspond to
air flowrates of 0-4.15 CFM at 14.7 psia and 700F. This rotameter was cali
brated in increments of 0.05 CFM. The ammonia rotameter, also a Brooks
rotameter model 1110, consists of a type R-6-25-B tube and a spherical sap
phire float. The scale readings range from 0-40 mm in increments of 2 mm
which correspond to ammonia flowrates of 0-16 l/min at 14.7 psia and 70OF.
This rotameter was calibrated in increments of 0.1 l/min. Calibration curves
converting scale reading to CFM for air and scale reading to l/min for ammo
nia, originally supplied by Brooks, are provided in Appendix A. The water ro
tameter is a Brooks model 1110, with a type R-7M-25-1 tube and a spherical
stainless steel float. The direct-reading scale ranges from 0-22 GPH with in
crements of 0.2 GPH.
For the analysis of exiting gas and liquid streams, an Orion model 901
lonalyzer and an Orion model 95-10 ammonia electrode were used. The lon-
alyzer has a sensing range of 0.02-17,000 ppm ammonia and, therefore, is
well suited for use in the experiments completed for this comparison.
Detailed operating procedures for operating the gas absorber system
described above are provided in Appendix B. Instructions for obtaining cali
bration curves and analyzing samples using the Orion lonalyzer are provided
in Appendix C.

31
Experimental Procedure
The capacity and the mass-transfer efficiency of each packing were
evaluated from laboratory data using equations for gas absorption systems
exhibiting dilute UMD behavior. The data necessary for determining the gas-
handling capacity of a packing at a specific liquid flowrate are the pressure
drops across the packing over a range of gas flowrates.
In order to make a useful efficiency evaluation of each packing, this
data must be collected at several liquid flowrates. The procedure for obtain
ing this data begins with setting a liquid flowrate and establishing a constant
level for the liquid syphon at the bottom of the column. The liquid used for ex
perimentation was Lubbock city water. Appendix D contains a list of the
chemical constituents of this water. Since the gas absorber is clear pyrex®
glass, the liquid level was visually determined and manually maintained with
in ±1 /2 in.
Next, air is introduced into the column and minor adjustments are made
to keep the liquid level constant. Once the air flowrate, the water flowrate, and
the liquid level are constant, the pressure drop across the column may be
measured on the manometer. The air flowrate is then set to a new value for
the next pressure drop measurement. After the pressure drop has been re
corded over the desired range of air flowrates, the water flowrate is changed
to a new value and the procedure is repeated. The flowrate ranges used for
these data sets were 0.55-4.11 CFM for air (at 14.7 psia and 700F) and 5-20
GPH for water.
The flooding and loading points of each packing at each water flowrate
must be known in order to operate the air-ammonia-water system under ac
ceptable conditions. The flooding point is established as the second

32
breakpoint in a log-log plot of pressure drop versus gas velocity,^ while the
loading point is defined as the first breakpoint in the same plot.9 Once the
flooding and loading points at each water flowrate are known, a total gas
flowrate of air and ammonia may be chosen in order to collect mass-transfer
data. The total gas flowrate was selected at approximately the center of the
operating range as determined from pressure drop versus L/G plots. When
evaluated by the method of Bain and Hougen,6 these points were found to at
70-85% of flooding. In addition, the ammonia flowrate was chosen in such as
way as to make the entering gas mixture 5-8% ammonia by volume. The am
monia was supplied in anhydrous from at 99.99% purity. The air and ammo
nia flowrate ranges used were 1.2-3.48 CFM and 2.0-5.2 l/min, respectively,
both at 14.7 psia and 70OF.
After the inlet stream rates have been set, it is possible to collect the
data necessary to complete the efficiency evaluation for each packing. This
data consists of the air, ammonia, and water flowrates as well as the steady-
state concentrations of ammonia in both the entering and the exiting gas and
liquid streams.
Collection of mass-transfer data begins by establishing the desired air,
ammonia, and water flowrates in the column. After approximately 30 minutes,
a sample of the liquid exiting through the bottom drain hose is collected in a
150-200 ml flask and its ammonia content evaluated (Appendix C contains
instnjctions in determining sample concentrations). Sampling of the exiting
liquid stream is continued at 10-minute intervals until three consecutive sam
ples measure within ± 2 mV (± 0.00015 N in the range of 0.05-0.005N). At this
point, maximum approach to equilibrium is assumed, and a sample of the

33
exiting gas stream is collected and analyzed for ammonia. The air sample is
collected from a sampling port at the exhaust vent using a 50 ml syringe.
An ammonia mass balance should be performed at this point as a pre
caution against using unacceptable data. Repeated analysis over almost two
years failed to show any detectable ammonia content in city water or in the
compressed air supply, making the mass balance much simpler. An ammonia
mass balance closure of at least 80% was considered to be an acceptable
indicator of data validity. Most of the ammonia lost during operation of the gas
absorber was lost to an iron-ammonia-carbonate scale deposited on the
packing and inner walls of the column.''5 Regular cleaning after approxi
mately 20 hours of operation time is needed to remove the scale. That the
formation of this scale is significant in accounting for the lost ammonia is evi
dent by the amount of scale flakes that can be seen floating in the mild acetic
acid solution used for cleaning. After each cleaning, the column was flushed
with 8-10 GPH of water for at least 8 hours before conducting further mass-
transfer experiments. No mass balance closures were greater than 100%.
Experimental Safety
For this study, experimental safety revolves mainly around preventing
ammonia leaks and any spills of the 10 M NaOH solution used in the proce
dure for analyzing samples of the entering and exiting streams of the ab
sorber. OSHA has set the time weighted average exposure limit of anhydrous
ammonia at 50 molar ppm ammonia. Depending on the concentration in
haled, ammonia may cause burning sensations, coughing, wheezing, short
ness of breath, headache, nausea, and possible eventual collapse. High
concentrations of vapor or liquid will cause caustic-like dermal burns and

34
inflammation and swelling of the eyes with possible loss of vision. Prompt
medical attention is required in all cases of overexposure to ammonia.
The overhead gas is discharged to an exhaust vent. A fan, located at
this vent, draws fresh air from the laboratory into and through the absoriDer
area while removing low level ammonia fumes from the absorber liquid dis
charge that may mask a critical ammonia leak. Glacial acetic acid, placed in a
plastic bucket into which the exiting liquid discharges before entering the
drain. Is used to neutralize the waste and to further reduce low level ammonia
fumes. If a small ammonia leak is detected, for example, at a loose tubing fit
ting, the ammonia supply to the absorber should be shut off at the source and
the leak repaired. In the event large quantities of ammonia are released into
the laboratory, all personnel should be evacuated from the laboratory. As an
added precaution, the drain valve at the bottom of the absorber should be
opened to prevent flooding or damaging the column. Leaks of such large
quantities should be contained only by emergency personnel equipped with
appropriate self-contained breathing apparatus. Ammonia also presents an
extreme explosion and fire hazard.
All sodium hydroxide and acetic acid spills should be cleaned up im
mediately. To protect against burns and splashes from the 10 M NaOH, the
use of goggles and rubber gloves and aprons are required. Also, hard hats
are required personal protective equipment in Texas Tech's Unit Operations
Laboratory. In addition, all of the personal protective equipment listed here is
required for operating the absorber. An eyewash and safety shower are locat
ed within 8 ft. of the absorber as an added precaution. Medical assistance
may be needed for burns resulting from contact with the sodium hydroxide or

35
acetic acid solutions and most certainly will be required if they are splashed
into the eyes.

CHAPTER VI
RESULTS
Capacity Comparison
As stated in Chapter IV, the vapor flooding velocity at a specific liquid
flowrate represents the upper limit on vapor throughput in a packed column.
The vapor flooding velocity, vp, is the superficial gas velocity at the second
breakpoint in a log-log plot of pressure drop versus gas velocity.^ The load
ing point is defined as the first breakpoint on the same plot. These break
points are determined subjectively by visual inspection of the plots. Figures
12 and 13 represent, respectively, the pressure drop data at selected liquid
flowrates for 1/2-in. ceramic Beri saddles and 5/8-in. polypropylene Nor-Pac®
rings. Complete pressure drop data sets are located in Appendix E. These
rings exhibit pressure drops that are approximately 20-25% of those of the
saddles. Based on these data, the average pressure drops at flooding and
loading for the saddles are 0.98 in. of water and 0.36 in. of water, respectively.
The corresponding values for the rings are 0.14 in. of water and 0.05 in. of
water.
The average capacity factor at flooding (Figure 14), Cvp^. are 0.11 ft/s
for the Berl saddles and 0.30 ft/s for the Nor-Pac® rings, giving columns
packed with these rings a higher vapor throughput than one packed with
these saddles. Reporting average flooding capacitiy factors was chosen for
36

37
10
I 1 Q. O
Q
(0 in 0)
.01
-Q- L = 5GPH -•- L = 20GPH
• • - ' I I I I I I
10 100 1000
Air Flowrate (Ibm/sq ft-hr)
Figure 12. Selected pressure-drop curves for Beri saddles.
To
"o c
Q. 2 o 3 V) <n a>
.01 10
• • • » • I
1- L = 7.5 GPH •- L = 20GPH
'
100 Air Flowrate (Ibm/sq ft-hr)
1000
Figure 13. Selected pressure-drop curves for Nor-Pac® rings.

38
0.4
u <D Ui ^ 0.2 > O
0.1
0.0
Nor-Pac® rings
Cv = 0.3123-0.00271
Berl saddles *£L
Cv = 0.1274-0.0011 L
X
10 15
L (GPH)
20 25
Figure 14. Capacity as a function of liquid flowrate. (Simple linear regression by Cricket Graph™)

39
two reasons: (1) vp was determined over the same range of water flowrates
for each packing and (2) Cvp was found to have no obvious dependence on
the water flowrate. The reason Cvp is independent of the water flowrate in
this study is that the water flowrates used for both packings were always 3-4
times the minimum needed for the system rather than the 1.15-1.3 times the
minimum used as the "rule-of-thumb" standard. These results show that the
5/8-in. Nor-Pac® rings have a vapor capacity approximately 2.7 times greater
than the 1/2-in. Beri saddles.
The operating ranges for these two packings, based on the gas flow-
rates at the average flooding and loading pressure drops, are distinctly dif
ferent, however. The operating range for the saddles is 6.9 times larger than
that of the rings. This being the case, a column packed with the 5/8-in. Nor-
Pac® rings will require better controls for the liquid, and, especially, the gas
flowrates in order to ensure that the column is fully loaded and to avoid flood
ing.
Figure 15 indicates that the rings used here are consistently associated
with lower pressure drops at various water flowrates than are the saddles.
The 5/8-in. Nor-Pac® rings have pressure drops approximately one order-of-
magnitude smaller than the 1/2-in. Beri saddles at any gas velocity. These
Nor-Pac® rings, therefore, are more energy efficient and should contribute to
lower operating costs.
Figures 16 and 17 represent a portion of the flooding data of both the
Beri saddles and the Nor-Pac® rings presented in the format used in the Eck
ert correlation. Figure 6. While the laboratory gas absorber exhibits flooding
at pressure drops much lower than those established by Eckert and others,^-^
the data do exhibit the same general curve as compared to the Eckert

40
1 r
c o a
2. To
"o c
Q. O
o
(/> (/> a>
Berl saddles
Water Flowrates
.01
.001
Nor-Pac® rings H3-
-•-
-O-
-•-
-»-
•°-
7.5 GPH 14 GPH 20 GPH 7.5 GPH 14 GPH 20 GPH
0.10 0.15 0.20
Cv (ft/sec)
0.25 0.30
Figure 15. Capacity comparison of Beri saddles and Nor-Pac® rings.

41
.1
o O)
Q.
CM
d •
u.
CVJ
.01 :
c H
>•
.001
•
.
.
•
*
-
•
. •
•
1
"~2~*
3 *""** ^ *V
.1 10
X = U G * ( P G / P L ) 0.5
Figure 16. Flooding and pressure-drop cun/es for Beri saddles.
.01 r
o • _ i Q . •
Q.
CJ
d
* .001 -
eg
II
>
.0001
X = U G * ( P ^ / P j 0.5
Figure 17. Flooding and pressure-drop curves for Nor-Pac® rings.

42
correlations. This property of the laboratory data establishes its validity for
use in determining flooding and loading points as well as capacity charac
teristics. The flooding data has been correlated by exponential regression
using Cricket Graph™, as shown by the following equations:
Curve 1: Y = 0.0253 * 10 -0.48X^ ^P = 1.20 in. of water, R2 = 0.98 (18)
Cun/e 2: Y = 0.0159 * 10 -0.322X^ ^p = o.90 in. of water, R2 = 0.85 (19)
Curve 3: Y = 0.0089 * 10 -0.2456X ^p ^ o.60 in. of water. R2 = 0.96 (20)
Cun/e 4: Y = 0.0046 * 10 -0.526X^ ^p = o.30 in. of water. R2 = 0.41 (21)
Curve 5: Y = 4.09E-4 * 10 -0.1812X^ ^P = 0.03 in. of water, R2 = 0.88. (22)
The probable reason the laboratory column floods at much lower pressure
drops than normally expected is that the ratios of the nominal packing size
and tower diameter, at 1 to 6 for the Beri saddles and approximately 1 to 5 for
the Nor-Pac® rings, are larger than the 1 to 8 ratio commonly accepted as the
largest usable value for packed column design.
Mass-Transfer-Efficiency Comparison
Figures 18 and 19, respectively, show the HTU for 1/2-in. Beri saddles
and 5/8-in. Nor-Pac® rings as functions of the gas and water flowrates. These
rings have an average HTU of 1.09 ft compared to 3.42 ft for the saddles. The
HTU for these saddles in 3.1 times larger than for these particular rings. Next,
the values of K Q G a''© shown as functions of the gas and water flowrates in
Figures 20 and 21, respectively. The average value of K Q G or the Nor-Pac®
rings is 2.18 * 10 -3 Ibmol / min-ft2-atm compared to 2.87 * 10 "- Ibmol / min-
ft2-atm for the Berl saddles. The average KQG for the rings is about 7.6 times
larger than that for the saddles. Both of the average HTUs and both of the

10-r
X
• iMAMAMtWMMWWW
1 -
.1 + 100
lOrXMWMWXHWWWH
I MMMMWMMMMA
= =
lAMWWMMk^ M . I
- r f kMMMMMWWWWMtMWWMtWMMAMMMM^ •
H M nnMMMMMtnMMnnnnMnnnnnnnMMMnn^ i ^ n ^ r w n n M n m m n n M n n M M M m M n n M W
J- "5 EI
a i
MI^MMAAM^PL
IVWWWWWWMW>M«M*M«MWWWWWtMMMMM«W KMM
Berl saddles
"Q-ia-
U tuWWWWWWWUWWWMr
¥
Nor-Pac® rings....
200 300
Gas Flowrate (Ibm/hr-sq ft)
Figure 18. Comparison of HTU as a function of gas flowrate.
43
400
X
10
—
Nbr-Pac® rings
rw<nwr»'»»» • * » « * » * ' <"
1000 2000 3000 4000
Water Flowrate (Ibm/hr-sq ft)
Figure 19. Comparison of HTU as a function of water flowrate.

.01
E To
I
sr
% .001 E
o
.0001 100
---irjr :
&
•—• jT- i :
•
^ Nor-Pac® rings 1MMMMMWMIMI nOM
• «
...d-JO. -S-Beri saddles
« „
•
200 300
Gas Flowrate (Ibm/hr-sq ft)
Figure 20. Comparison of K Q G as a function of gas flowrate.
44
400
E 7a
I
cr v> c E ^> o E .o
.01
.001
.0001
•MMmn^Mn^ IWWWWW^ NWWWWWW I
B "• r 'xrwrOTnnr^nnK ¥ • « • • • • • ' » • • • • !
i Nor-Pac® rings
i.J.
Berl saddles
——' JGL
^ ^
"^^
0 1000 2000 3000
Water Flowrate (Ibm/hr-sq ft)
Figure 21. Comparison of K QQ as a function of water flowrate.
4000

45
average K Q G S are significantly different, having a 99.95% probability that they
are not the same using a Case ll-t-distribution test. Both the lower average
HTU and the higher average K Q G indicate that these particular rings are more
efficient in their mass-transfer capabilities than are these particular saddles.
As an aside, the average HTUs and average K Q G S are reported because of
the lack of an obvious trend on Figures 18, 19, 20, or 21.
Discussion
As stated in Chapter II, all data sets were collected for the Beri saddles
before the Nor-Pac® rings were placed in the absorber. In order to assure
random data, the packings would have to have been switched often. Chang
ing packings includes many steps:
1) cleaning the column and the original packings,
2) disassembling the packed section from the packing support
plate and packing restrainer,
3) removing the original packing,
4) reassembling and repacking the column with the other packing,
and
5) settling the packing and refilling the top of the column as
needed.
This process is evidently time-consuming and can be expensive if any of the
pyrex® column components are damaged or broken. Collecting all data sets
for one packing before switching packings, although necessary for this study,
will reduce the randomness of the data.
While the average K Q G S are almost an order-of-magnitude different,
the average HTUs are only different by a factor of 3.1. This difference is due

46
to the fact that K Q G is calculated by the use of the interfacial area per unit vol
ume of packing, a, which is specific for each packing. HTU is determined us
ing stream and equilibrium compositions only. The average capacity coeffi
cients, KoGa. of these packings would be much more similar than their KQGS
appear to be.
With most tower packings, a general tradeoff between high capacity at
low pressure drop and high mass-transfer efficiency is the accepted norm.
These rings oppose this norm in that they exhibit all three of these qualities.
These Nor-Pac® rings have less restriction to flow due to their open structure,
thus producing low pressure drops and high capacity. These rings also have
a larger surface area than these Beri saddles (Appendix G), and thus more
area for mass-transfer. Another factor that may contribute to the high mass-
transfer rates shown by the Nor-Pac® rings is their structure. Films of liquid
can form in the openings of the rings and between the pieces of packing, thus
creating more mass-transfer surface area.

CHAPTER VII
CONCLUSIONS AND RECOMMENDATIONS
Based on data obtained from the air-water system, it is concluded that
the 5/8-in. polypropylene Nor-Pac® rings exhibit superior performance in
terms of pressure drop and capacity than the 1/2-in. ceramic Beri saddles.
This conclusion is supported by the approximately ten-fold-lower pressure
drops associated with these rings over all gas and liquid flowrate ranges used
in this study as well as the three-times-higher vapor capacity obtained from
these rings.
It is further concluded that the mass-transfer efficiency of these rings is
also superior to that of the saddles. This conclusion is supported by the three
fold-lower HTU and the fact that the K Q G associated with these rings in the
air-ammonia-water system is 7.6 times larger than for these saddles. While
the specific values of HTU and K Q G niay vary, these general results are appli
cable to the air-ammonia-water system. Similar results are to be expected
with other highly ionic, highly soluble, inorganic gas systems using water as
the liquid solvent.
There are several recommendations for future experimentation. First,
the existing 3 in. inner diameter column should be replaced with a column
having a diameter of at least 6 in. Additional columns should also be in
stalled in the laboratory so that completely random experimentation of equally
sized Nor-Pac® rings, conventional packings, as well as structured packings
47

48
may be performed. These columns must have liquid distributors that will
distribute the liquid evenly over the packings. Second, if possible, experi
mentation should be done to determine how much the performance of the
Nor-Pac® rings is dependent on their unusual structure. Third, the Nor-Pac®
rings should be studied using other gas-solute-solvent systems, especially
those involving the absorption of moderately or slightly soluble solute/solvent
combinations. Fourth, a circulating water system is needed to provide dis
tilled or demineralized-deionized water to the absorber. This should improve
the ammonia mass balance closure.

LIST OF REFERENCES
''• Treybal, Robert E.: Mass-Transfer Operations: 3rd ed.; McGraw-Hill Book Co.; NewYori<; 1980.
2- Basta, Nicholas; "Facelift for Distillation": Chemical Encineerina: Vol. 94; No. 3; 1987.
3- "Nor-Pac® Plastic Packing: Lowest Pressure Drop Column Packing"; Polymer Piping and Materials; Houston, TX; Product Bulletin No. 650.
4- Henley, Ernest J., and J. D. Seader: Equilibrium-Stage Separation Operations in Chemical Enoineering: John Wiley and Sons; New York; 1981.
5- Eckert, J. S.; "Selecting the Proper Distillation Column Packing" in Perry's Chemical Encineers' Handbook: Green, Don W.; ed.; 6th ed.; McGraw-Hill Book Co.; 1984.
6- Bain, W. A., Jr.; and O. A. Hougen; "Flooding Velocities in Packed Columns"; Trans. AlChE: Vol. 40; 1944.
7- Sherwood, T. K.; G. H. Shipley, and F. A. L. Holloway; "Flooding Velocities in Packed Columns"; Ind- Eng. Chem.: Vol. 30; No. 7; 1938.
S- Eckert, J. S.; "Selecting the Proper Distillation Column Packing"; Chemical Engineering Progress: Vol. 66; No. 3; 1970.
9- Kunesh, John G.; "Practical Tips on Tower Packing"; Chemical Enoineering: Vol. 94; No. 18; 1987.
"•O- Harrison, Mark E.; and John J. France; "Distillation Column Troubleshooting"; Chemical Encineerina: Vol. 96; No. 4; 1989.
"• "• • McCabe, Warren L.; Julian C. Smith, and Peter Harriott: Unit Operations in Chemical Engineering: 4th ed.; McGraw-Hill Book Co.; New York; 1985.
49

50 "•2. Fellinger, S. D.; in Perry's Chemical Engineers' Handbook: Perry,
Robert H.; and Cecil H. Chilton, Sr.; eds; 5th ed.; McGraw-Hill Book Co.; 1973.
"• 3. Tillson, S. M.; in Perry's Chemical Engineers' Handbook: Perry, Robert H.; Cecil H. Chilton, Sr.; and Sidney D. Kirkpatrick; eds.; 4th ed.; McGraw-Hill Book Co.; 1963.
1^- Billet, R.; "Performance of Low Pressure Drop Packings": Chemical En-qineerinc Communications: Vol. 54; 1987.
"•5. Blackmer, G. L.; personal communication to R. M. Bethea; Texas Tech University; 1986.
16. "Unit Operations Laboratory Manual"; Department of Chemical Engineering; Texas Tech University; 1986.
17. "Chemical Analysis of the City of Lubbock Water Supply"; Water Laboratory Services; Department of Water Utilities; Lubbock, TX; 1989.

APPENDIX A
ROTAMETER CALIBRATION CURVES
51

52
-+H \ i 1 ! l i i -—fa. 1 1 - - - - - - - - - U - - - f - - - A 1 1 1 i 1 i
—:U 1 Mv 1 i i : : : : : : : : : : -T ' 1 \ V i -
, L i^^^^^^^u^^Jsli^ 1 — — — 1 1 . 1 1 1 1 1 I I , I I i . . \ 1 ^ - ^ lo, 1 1 1 1 i 1 1 i l l i\-tv
U - l i 1 1 1 1 1 1 \ l 1 1 1 L u _ U ^ 1—1 1 1 1 i \ | 1 ^ \ M i l H ! 1 ; i ' 1 \ i — \ 1
M 1 i 1 \--> 1 1 1 1 \ l i —
! i 1 1 1 : 1 ! i i 1 1 i \ 1 1 i 1 — '-1 1 ' •<&+- ! - . i • i i i i i \ i i 1 — ! ' 1 i g ! 1 ' I ' l l ^ . 1 i 1 1 1 1 1 1 ' N H - ; - I ; 1 I ' I M — \ ' 1 — M ' 1 1 7 1 1 i ' 1 ' i 1 1 i \ 1 M
I n 4 - i 1 1 i 1 1—i—M\ M 1 1 1 1 1 i 1 \ 1 ; ! 1 1 1 1 1 ' i \ ! 1
i 1 i 1 1 1 1 1 \ i l l 1 i 1 i i i lX ' ' 1 f\ M 1^ 1 ' 1 Pi 1 1 1 1 ' 1 \ H—'Ki--^-H H k-J—MH—^v-1 ' T ' ' ' 1 1 i ' i * 1 1 i 11 ^ 1 ' 1 1 1 | \ 1 1 ^ ' ' M l M . 1 • 1 1 1 ' 1 1 1 1 1 t v l 1 1 1 ^ ' I i M 1 1 1 1 ' i l . i .V i . . . 1 i :>. i 1 ' v M i 1
t ' 4 M - ' - - H 1 . < ' M ' ' ^ ' M 1
! ! Jn. Q ! 1 M ^ M J^M M , I 5 . !<!. 1 : 1 l l 1 ' " ^ i 1 l i i i i*^ r v ^j i - ' t 1 " ^ ! 1 Ml 1 \t -J K i
I ' a . L<4 0 ! r t i ^ iVn i 1 ' ^' ' ^ 1 ^ i V i7^ ' ^ > N U r^ M 1 M 1 M l 1 cYs ' ' S J I
' I , \ j - ^ 7 ^ ' - ^ M ! > ^ -. ^v? ^ J ' 1 1 li J
•rt xV • ^ ' r r ^ ' ^ ' ^ ' ' 0 ' ? . t >1- . ^ ^ . 1 ^
. /^- ' > 5 : ' l l 1 ^ - 'n.V y^ M 'r> » 1 l*^
: : . \ l^V' ^ c£\- ^ \ \ 1 1 M 1 J-"' 1 M 1 1 i 1 1 1 1 1 M . I 1 1 M W I .-: 1 L-, I h"i 1 i 1 1 1 1 i l l >: i i ^N i i^ '^ ' ^ 1 ' 1
' : 1 ^ • > ! ^ 1 i ^ - , „ « !>J , ^ : , ^ M t 'li '1 - J UL' S > t M § ' ^ i ! ^ Si ^ ' •
' ; 1 I 1 1 ^ i ^ iv? : " M : ' ' M ' ri L \J* U" 1^ . • ' M l i ' PQ K > <>*. ! i
' ' - ' ' ' ' ' 1 1 1 1 1 1 1 ' ' ' 1 . . . 1 . . , . ' , I 1 . ' 1 1 ' 1 ' ' 1 1 1 ' 1 M • . .>o . L 1 1 ' 1 1 1
.> 1 : 1 1
M M ' i ! M M i t M — ' ' M ' ' ' ! • • ! M 1 ; 1 * * ' M i i ' ' ' i ' 1 ' ' ' i ' ' 1 • 1 i l l — M i l l M i M i ' 1 ' ' 1 ' ' — ' ' M ' ' ' ' 1——^-.—1 M ; . M M i ' M 1 M M ' ' ' 1 — • 1 1 . • 1 1 1 — M M 1 ' ' ! • ' ' ' — M 1 : 1 1 i 1 — ^ — u - — ^ * - . — ; 1 1 M
— i 1 M M M — ' 1 1 M ' 1 ' 1—1 1 i i 1 1 1 M — 1 M ' 1 i 1 i ' ' ' ! ' 1 M ! 1 1 1 i ! M ' M 1 M ' i
M l ! ! ' — 1 ' 1 ' i 1 M — M ' i M — I I I M M i 1—i i 1 M 1 M i 1 1 i 1 1 1 M ] — M 1 j 1
i^u.»^l^^^^J^VAJ2^a/^ ; ! j 1 1 i j j : , — 1 —1 1 1—1—•—1—1—•—1—1 / 1—1 1 1 1—1 \ \ \—1——1—V ' - t
>-i——H-f4 ' 1 M i 4 h^M 1 — 1 I 1 -;_ ]— \—U4-| f *^—Mi l , LJ(N—L4_LH—tcvi l i i -
.1-1111 j i i 1 1 i! ! i i 1: 4 ^ ^ J : : - : : \ l ) 1 1 i 1—t-i_M_u;- .,..u -M 4 - -
|\! 1 111 i ! 1!':!! 1 t—t " " - " " —' \ M ' '—1 ; I M ' I—^t^—.—M_| M — \ M 1—' ' i M M ! 1—''MM \-\^r-
1 1 M \ M 1 1 i l l 1 M ' 1 1 1 1
1 M \ i ' i 1 ' Ml 1 ! + - t -+ 1 1 1 1 l \ l - . - . _ 1 1 t_i—1 1—tJ ! _ . _ .
i l l I'fv^: ' ! ' ' ' ' 1 ' M 1 1 1 ' M - \ • 1 M M ' 1 ' M h -H ! 1 —
M M ^ • \ M M l 1
1 1 1 V 1 . 1 , ^ . M . ,
i 1 ! 1 i ; V M M 1 1 1 1 1 i 1 M \ M 1 M l
1 1 1 1 U X - U - U . - - U - . - l r - i .
-t+-H—^ ^—V^^— \—H h-' 1 \ j ! 1 M l i i \ 1 1 i 1 i M l
^ iV M M ' ^ 1 \ I I 1 M \ 1 1 4 - \ . - i - -U-^—M 1 M
— \ - 4 - X H — 1 1 • i 1 ^ i \ M i l l
\ . . . \ . 1 1 1 \ ' , . . — , • « . . , I l l ' i \ ' ' \ i i i i 1 i 1 1 \ \ ' i M 1 1 I
M 1 \ ' 1 ....... \ 1 M l 1 , 1 1 \ ' \ ' \ • '
1 M 1 l \ \ ' i M i 1 1 1 1 i 1 1 i M 1 \ 1 \ • 1 M i 1 ; 1 i 1 1 1 1 ' M v • M I I '
1 M 1 1! 1 \ M M \ i i i 1 I I 1 1 1 1 1 W \ M 1 fc\ : 1 1 ; 1 1 1 1 1 1 i 1 1 \ ' 1 ' \ ' I 1 > 1 1
M M M 1 1 1 \ i i M 1 \ ' 1 ! i 1 M I I I 1 1 \ 1 M 1 • i ' * ' • ' i i
M l ! M M M M\I i M ' 1 1 'X ' ' M 1 1 M M 1 1 1 ' 1 1 1 1 \ 1 1 M 1 ' ' \ ' M 1 M M ' 1 1 M 1 1 ' 1 i \ • ' • 1 1 ' 1 ' \ -
1 ' 1 1 ' 1 1 1 • 1 1 ' M 1 \ 1 ' M i 1 1 1 1 i 1 1 • ' • 1
, 1 1 i ; 1 1 1 i t ' 1 i • i 1 \ • ' i 1 1 i 1 1 ' ' i ' ' '
' , M M M i M M i i M ' X • M 1 i ! • 1 • i . i . i • ' t 1 ' ' ' 1 1 1 1 1 • 1 1 ' \ t • ; ' 1 i i 1 • 1 t 1 •
' 1 ——1—\ 1
i i I i 1 ' ' M "-r- :,: II -n ^--W
^xxOL
:::::_L_U-: : : : : X L L U .
:ft : !
M - ^ M 2
? M • • • 1 ^ • 1 M Q' • M' M M " —m ' '^ 1 1 ' * l ^ ^ > . 1 1 1 1 , > r '
1 ' M 5 ! S
• —r- -.—• C A / -M 1 1—1—;-.-5k_ 1 i 1 ; ,-' .
' ' -AJ i l l 1 ^ ^ ^
1 M * * ' J
I ' t-T ! ?
1 1 ' ' i l l
1 1 1 , ,
i ' ' ! 1 '^^ ' i 1 • 1 ^ .
1 I ' ; 1 , 1
I I I 1 1 1 i
1 ! ' 1 ; i i 1
M l ^ ' 1 ' i l l . " ^ • 1 1 M • 1
1 1 1 t i 1 . I 1
! 1 ; . 1
1 • 1
M ' ' 1 1 ,
L-o— -rSfii
-rfS- • t v i " •^-xvi: -\fY- y:^ . , _ _ _ _ . L _ , / .
::f^Od^^<^CV7/ -^ '^'0^:/0£^^^T^ ma/j/-^
Figure 22. Air rotameter calibration curve.

53
. . . t ~Srn.\k-^^n.<lrnj^mm : • j ' M
Figure 23. Ammonia rotameter calibration curve.

APPENDIX B
GAS ABSORBER OPERATING PROCEDURE^e
54

55 Operating Procedure
1. Open main drain valve at bottom of column to avoid filling air rotameter and manometer with water.
2. Check that both water drain lines empty directly into floor drain.
3. Open water rotameter control valve.
4. Turn on water supply.
5. Adjust water rotameter to 20 GPH and flush column for 10 minutes.
6. Make sure NH3 V-port valve is closed.
7. Completely open air rotameter control valve.
8. Slightly open main air supply valve.
9. Very slowly open secondary air supply valve enough to make the air rotameter read 240 mm.
10. Using the air rotameter control valve, adjust air flowrate to desired value.
11. Slowly adjust water rotameter to desired flowrate.
12. Close both drain valves at bottom of column.
13. Adjust liquid level control valve to maintain constant water level in lower leg of bottom cross.
14. Verify existence of equilibrium level in drain leg.
15. Turn on laboratory exhaust fan.
16. Open NH3 cylinder valve. The pressure gauge should indicate between 3 and 6 psi.
17. Completely open NH3 rotameter control valve.
18. Slowly open NH3 V-port valve. Watch NH3 rotameter to verify flow.
19. Using NH3 rotameter control valve, adjust NH3 flowrate to desired value.
20. After 30 minutes collect exit liquid sample and analyze.
21. Continue analysis every 10 minutes until equilibrium is achieved.

56 22. Collect and analyze exit gas sample.
23. At equilibrium record rotameter settings and pressure drop over the column.
24. Adjust flowrates for next set of data and repeat steps 20-23.
Shut Down
1. Close NH3 cylinder valve.
2. Open NH3 rotameter control valve to relieve pressure on NH3 supply line.
3. When NH3 tank pressure is zero, close NH3 V-port valve.
4. Open main drain valve at bottom of column.
5. Set air rotameter at 120 mm and water rotameter at 20 GPH. Operate column for 10 minutes.
6. Turn off air supply valves.
7. Turn off water supply valve.
8. Turn off fan.

APPENDIX C
CALIBRATING AND OPERATING PROCEDURE:
ORION lONALYZER AND SPECIFIC ION ELECTR0DE16
57
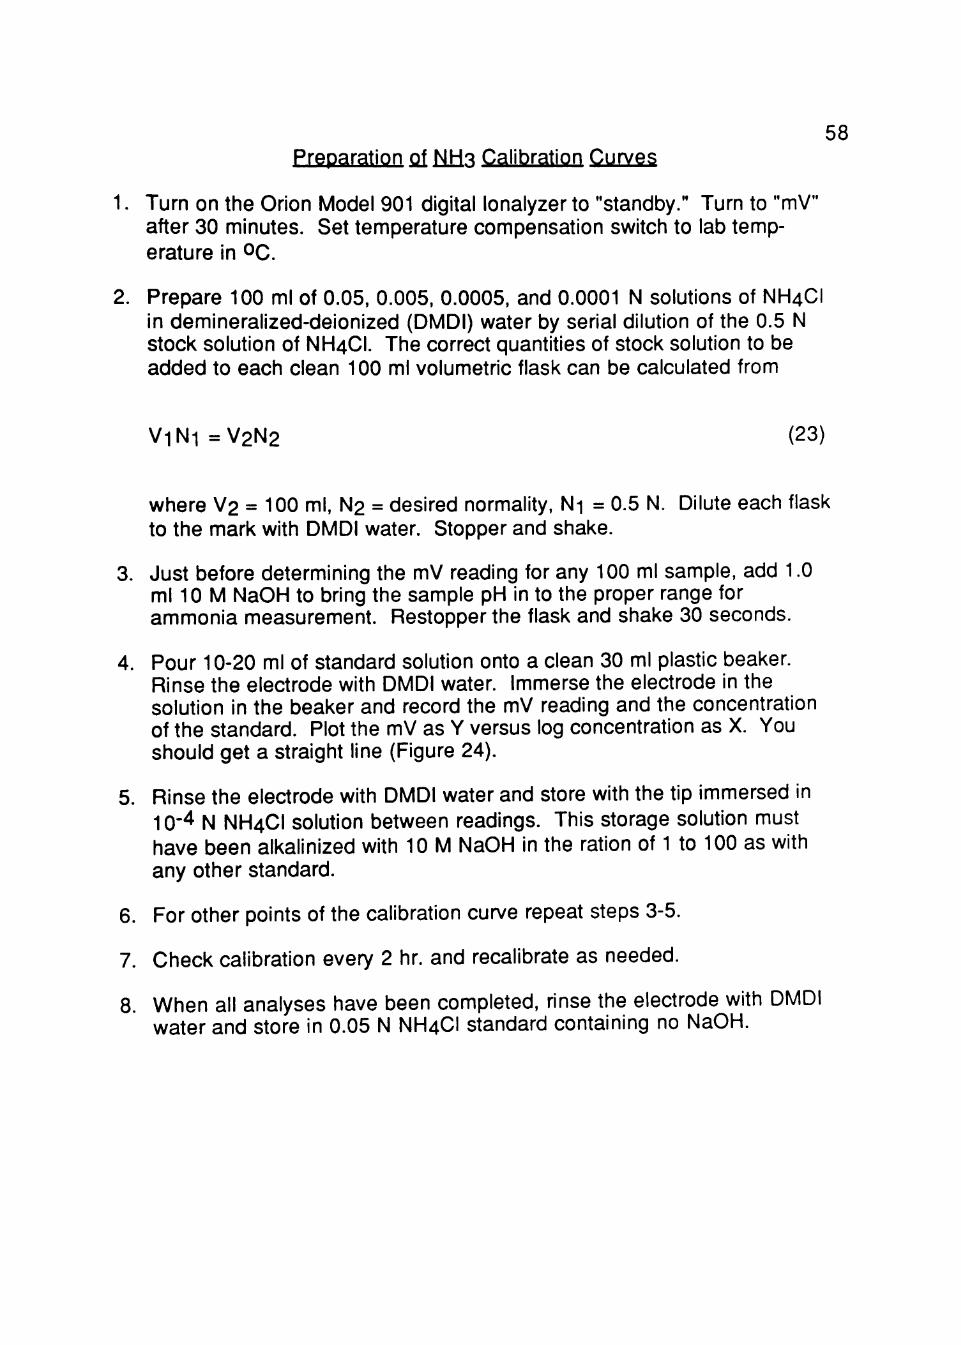
58 Preparation of NH': Calibration Curves
1. Turn on the Orion Model 901 digital lonalyzer to "standby." Turn to "mV" after 30 minutes. Set temperature compensation switch to lab temperature in OC.
2. Prepare 100 ml of 0.05, 0.005, 0.0005, and 0.0001 N solutions of NH4CI in demineralized-deionized (DMDI) water by serial dilution of the 0.5 N stock solution of NH4CI. The correct quantities of stock solution to be added to each clean 100 ml volumetric flask can be calculated from
V iN i=V2N2 (23)
where V2 = 100 ml, N2 = desired normality, Ni = 0.5 N. Dilute each flask to the mark with DMDI water. Stopper and shake.
3. Just before determining the mV reading for any 100 ml sample, add 1.0 ml 10 M NaOH to bring the sample pH in to the proper range for ammonia measurement. Restopper the flask and shake 30 seconds.
4. Pour 10-20 ml of standard solution onto a clean 30 ml plastic beaker. Rinse the electrode with DMDI water. Immerse the electrode in the solution in the beaker and record the mV reading and the concentration of the standard. Plot the mV as Y versus log concentration as X. You should get a straight line (Figure 24).
5. Rinse the electrode with DMDI water and store with the tip immersed in 10-4 N NH4CI solution between readings. This storage solution must have been alkalinized with 10 M NaOH in the ration of 1 to 100 as with any other standard.
6. For other points of the calibration curve repeat steps 3-5.
7. Check calibration every 2 hr. and recalibrate as needed.
8. When all analyses have been completed, rinse the electrode with DMDI water and store in 0.05 N NH4CI standard containing no NaOH.

59
m ^
mV
Figure 24. Typical electrode response: liquid samples.

60 Liquid Sample Analysis
1. Collect 100 ml of liquid sample.
2. Add 1.0 ml 10 M NaOH to bring the sample pH into the proper range for ammonia measurement. Shake.
3. Pour 10-20 ml of sample into a clean 30 ml plastic beaker.
4. Rinse electrode with DMDI water then immerse in sample.
5. Read mV. Rinse electrode with DMDI water and store with tip immersed in lO-^ N NH4CI solution adjusted to proper pH.
6. Read concentration from NH3 calibration curve.
Analvsis of Exit Gas Samples
Air Standards
1. Add graduated amounts (1 ml, 5 ml, 10 ml, etc. up to 20 ml) of air standard stock solution (34.43 mg NH4CI /1.0 I DMDI water) to a series of labelled 25 ml volumetric flasks. Dilute each to the mark with DMDI water. Stopper and shake 30 seconds.
2. Just be determining the mV reading, add 0.25 ml 10 M NaOH to bring the pH of the sample into the proper range. Restopper and shake.
3. Pour 10-20 ml of standard solution into a clean 30 ml plastic beaker. Rinse the electrode with DMDI water. Immerse the electrode in the solution in the beaker and record the mV reading and the concentration of the standard. Plot the mV as Y versus log concentration as X. You should get a straight line (Figure 25).
4. Rinse the electrode with DMDI water and store with tip immersed in 10'" N NH4CI solution between readings. This storage solution must have been alkalinized with 10 M NaOH in the ration of 1 to 100 as with any other standard.
5. For other points on the calibration cun/e, repeat steps 2-4.
6. Check calibration every 2 hrs. and recalibrate as needed.
7. When all analyses have been completed, rinse the electrode with DMDI water and store in 0.05 N NH4CI standard containing no NaOH.

61
Each 1 ml of the stock solution is equivalent to 50 ppm NH3 in the exit
gas. If concentrations below 50 ppm are needed, prepare a new set of air
calibration standards by first diluting (with DMDI water) 10 ml of the original
stock solution to 100 ml in a volumetric flask and proceeding as above.
Exit Gas Samples
1. Draw 10 ml DMDI water into a 50 ml polypropylene syringe.
2. After drawing in 40 ml gas sample in to the 50 ml syringe, cap the needle with a piece of silastic scrap and shake 1 minute. Expel the liquid into a 10 ml volumetric flask.
3. Add 0.1 ml 10 M NaOH to the flask, stopper and shake 30 seconds.
4. Follow steps 3, 4, and 7 of the calibration procedure for air standards.
5. Obtain the ppm NH3 from the calibration curve.

62
CO 'c O
e E < E
Figure 25. Typical electrode response: air samples.

APPENDIX D
COMPOSITION OF LUBBOCK CITY WATER
63

Table 1: Composition of Lubbock city water. 17
August 8, 1989 Total Hardness (as CaC03) pH P. Alkalinity (as CaC03) Total Alkalinity (as CaC03) Carbonate Bicarbonate Conductivity (micromhos / cm) Suspended solids Dissolved oxygen Carbon dioxide Turbidity (NTU) Lead Selenium Copper Calcium Magnesium Sodium Potassium Iron Manganese Ammonia (as NH3-N) Sulfate Chloride Nitrate (as NO3-N) Total phosphate Flouride Silica Chlorine residual Standard plate count (100 mis) Total coliform (100 mis)
Lake Meredith Surface Supply
before after treatment treatment
269.00 7.96
0.00
161.00 0.00
161.00
1737.00
4.00 7.00 3.90 7.55
<0.01 <0.01 0.20
56.90 30.90
300.40 8.40 0.29
<0.10
0.06 270.00 378.00
<0.25 0.49 0.62
10.14 0.00
0 1200.0
<1.00
280.00 7.66
0.00
157.00 0.00
157.00
1885.00
3.00 6.50 6.95 0.14
<0.01 <0.01 <0.10 56.00 33.90
302.10 8.00
<0.10 <0.10
0.32 280.00 374.00
<0.25 <0.20 0.61 8.46 2.50
63.00
0.00
Well Supply Sandhill
Field
234.00 7.16
0.00
212.00 0.00
212.00
488.00
1.00 not available
11.00 0.33
<0.01 <0.01 <0.10 51.80 25.30 32.10
6.40 <0.10 <0.10
<0.05 30.00 13.00
3.47 <0.20
1.50 42.00
0.90
10.00
0.00
64

Table 1: continued 65
Hypothetical Combinations: Calcium bicarbonate Calcium sulfate Magnesium bicarbonate Magnesium chloride Magnesium flouride Magnesium silicate Magnesium sulfate Magnesium nitrate Magnesium phosphate Sodium sulfate Sodium chloride Sodium silicate Potassium chloride Potassium silicate Ferric chloride Ferric silicate Aluminum chloride Aluminum flouride Aluminum nitrate Aluminum phosphate Aluminum silicate Manganese chloride Manganese flouride Manganese silicate |
Lake Meredith Surface Supply
before after treatment treatment
214.54 13.21
0.00
0.00
0.00
0.00
152.86
0.00
0.00 204.62 595.84
0.00
16.03
0.00 0.92 0.00
2.72
0.00 0.00
0.00 0.00
0.23
0.00
0.00
208.68 15.07
0.00
0.00
0.00
0.00
167.70
0.00
0.00 199.95 603.77
0.00
15.27
0.00 0.32 0.00
0.68
0.37 0.29
0.26 0.00
0.00
0.17
0.00
Well Supply Sandhill
Field
209.63 0.00
65.29
17.46
2.46
1.07
37.55
4.14
0.28 0.00 0.00
64.25
0.00
10.16 0.00 0.30
0.00
0.00 0.00
0.00 0.04
0.00
0.00
0.18

Table 1: continued 66
Ammonium chloride Ammonium flouride Ammonium silicate Total dissolved solids
0.19
0.00
0.00
1202.16
0.00
0.56
0.15
1213.22
0.00
0.00
0.12
412.93
Results in mg /1 except as noted

APPENDIX E
PRESSURE DROP DATA
67

68 Table 2: Pressure-drop data for Beri saddles.
L = 5GPH
Air (Ibm/sq ft-hr)
360.184 348.270 335.439 318.942 304.278 288.697 274.034 259.370 244.705 230.042 215.378 202.546 186.966 172.302 157.638 143.890 129.226 114.562
99.899 84.318 68.738 50.408
AP (in. H2O) 1.48 1.27 1.16 1.08 1.02 0.95 0.87 0.80 0.75 0.68 0.62 0.58 0.52 0.36 0.30 0.28 0.21 0.17 0.14 0.11 0.08 0.05
L = 7.5 GPH
Air (Ibm/sq ft-hr) 360.184 345.521 335.439 318.942 302.445 288.697 274.034 256.620 244.705 226.376 213.545 198.880 181.467 158.554 151.223 134.725 120.978 105.397
88.901 59.573
AP (in. H2O) 1.55 1.40 1.30 1.20 1.10 1.00 0.95 0.90 0.85 0.78 0.70 0.62 0.55 0.52 0.49 0.45 0.42 0.39 0.28 0.13

Table 2: Continued 69
L=10GPH
Air (Ibm/sq ft-hr)
363.851 348.270 331.773 326.274 317.109 304.278 288.697 273.117 257.537 244.705 230.042 226.376 200.713 186.050 171.386 156.722 143.890 129.226 114.562
99.899 84.318 68.738 51.324
AP (in. H2O) 1.82 1.68 1.57 1.31 1.25 1.15 1.06 0.99 0.92 0.84 0.79 0.72 0.67 0.60 0.57 0.50 0.42 0.24 0.19 0.15 0.11 0.08 0.05
L=12GPH
Air (Ibm/sq ft-hr)
376.682 353.769 336.355 318.942 304.278 288.697 273.117 259.370 244.705 231.874 217.211 201.630 186.966 172.302 158.554 143.890 131.059 114.562
99.899 84.318 68.734 51.324
AP (in. H2O) 1.75 1.58 1.42 1.31 1.22 1.12 1.05 0.94 0.88 0.82 0.74 0.67 0.60 0.55 0.51 0.42 0.28 0.20 0.17 0.12 0.09 0.06

Table 2: Continued 70
L=14GPH
Air (Ibm/sq ft-hr)
362.934 348.270 334.522 318.942 304.278 288.697 274.034 259.370 244.705 230.042 215.378 201.630 186.050 172.302 156.722 142.058 131.059 116.396
99.899 84.318 68.738 51.324
AP (in. H2O) 1.76 1.63 1.52 1.41 1.29 1.21 1.07 0.98 0.91 0.83 0.75 0.69 0.63 0.60 0.52 0.48 0.44 0.40 0.36 0.14 0.09 0.06
L=16GPH
Air (Ibm/sq ft-hr)
363.851 348.270 333.606 318.942 304.278 304.278 288.697 282.282 274.034 259.370 244.705 237.373 230.042 227.292 215.378 202.546 186.966 172.302 157.638 143.890 129.226 114.562
99.899 92.567
AP (in. H2O) 1.83 1.68 1.49 1.36 1.24 1.22 1.18 1.12 1.06 0.97 0.90 0.85 0.82 0.78 0.74 0.67 0.63 0.55 0.50 0.43 0.41 0.36 0.18 0.16

71 Table 2: Continued
L=18GPH
Air (Ibm/sq ft-hr)
351.936 336.355 320.775 316.193 307.028 292.363 274.034 261.203 247.455 233.708 219.044 205.296 189.715 175.968 160.387 146.640 132.893 117.312 102.648
84.318 68.738 62.322 54.990 51.324
AP (in. H2O) 2.34 2.14 2.00 1.80 1.62 1.42 1.25 1.12 1.05 0.96 0.88 0.80 0.75 0.67 0.60 0.52 0.48 0.42 0.37 0.30 0.25 0.20 0.15 0.10
L = 20GPH
Air (Ibm/sq ft-hr)
362.934 348.270 331.773 318.942 304.278 290.530 274.034 259.370 244.705 230.042 215.378 201.630 196.131 186.966 172.302 160.387 143.890 131.059 114.562 108.147
99.899 84.318 68.738 51.324
AP (in. H2O) 2.46 2.32 2.12 1.92 1.75 1.64 1.48 1.38 1.30 1.20 1.10 1.02 0.80 0.74 0.66 0.59 0.52 0.48 0.42 0.24 0.20 0.15 0.11 0.08
( ((

Table 3: Pressure drop-data for Nor-Pac® rings. 72
L = 5 G P H
Air (Ibm/sq ft-hr)
175.968 133.809 127.394 126.477 115.479 114.562
98.982 90.733
AP (in. H2O) 0.11 0.08 0.08 0.06 0.06 0.06 0.05 0.05
L = 7.5 GPH
Air (Ibm/sq ft-hr)
318.942 305.195 288.697 274.950 259.370 243.789 229.125 219.044 201.630 187.882 173.218 157.638 144.807 130.143 114.562 100.815 84.776 68.738 52.699 36.660
AP (in. H2O) 0.38 0.36 0.33 0.30 0.19 0.16 0.15 0.12 0.11 0.10 0.09 0.09 0.08 0.06 0.05 0.05 0.04 0.03 0.03 0.02
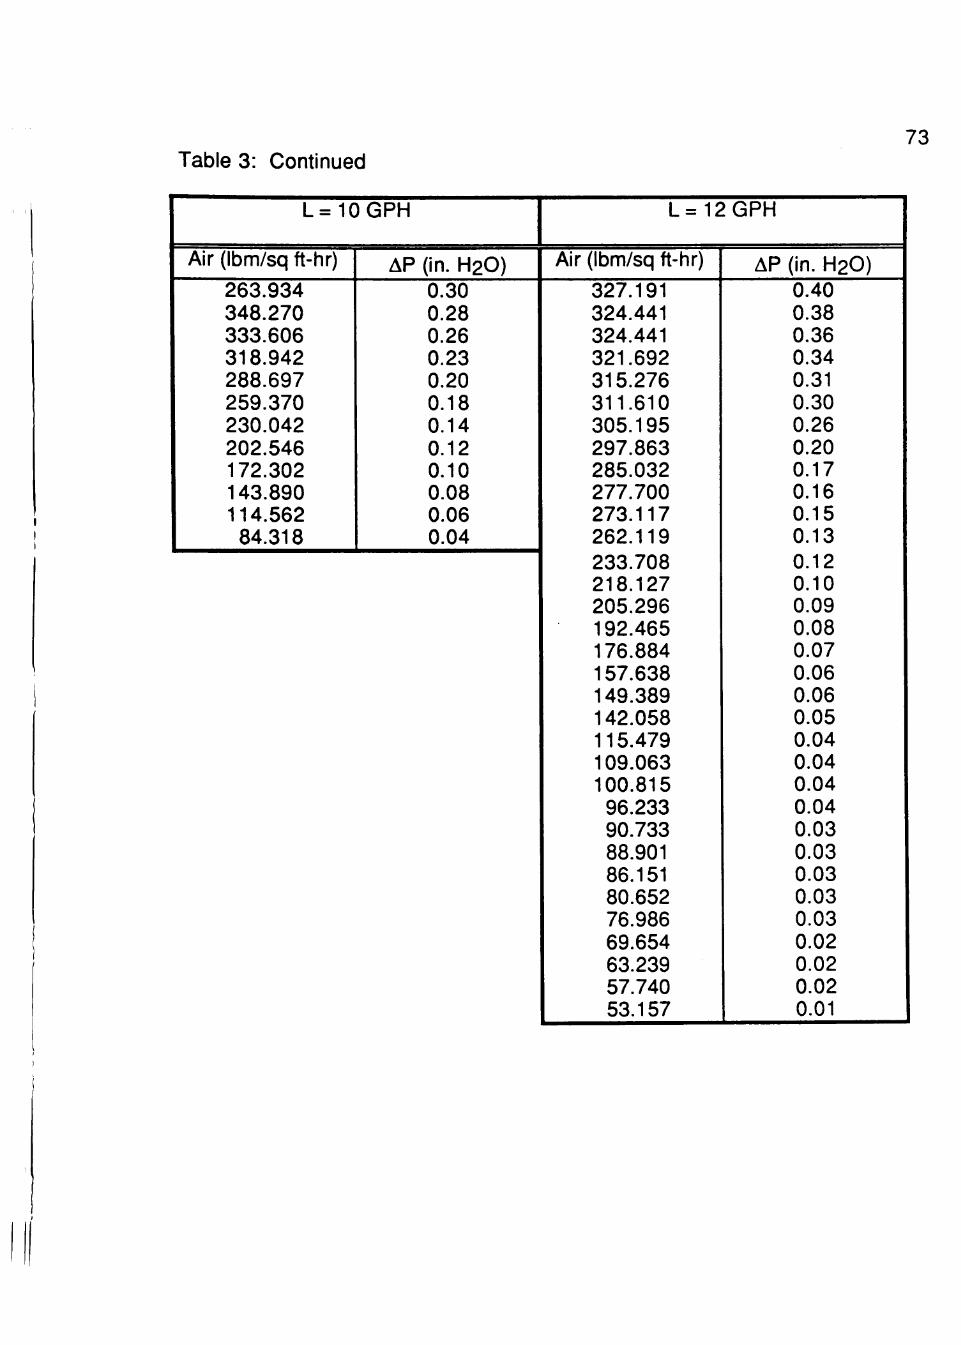
Table 3: Continued 73
L=10GPH
Air (Ibm/sq ft-hr)
263.934 348.270 333.606 318.942 288.697 259.370 230.042 202.546 172.302 143.890 114.562
84.318
AP (in. H2O) 0.30 0.28 0.26 0.23 0.20 0.18 0.14 0.12 0.10 0.08 0.06 0.04
L=12GPH
Air (Ibm/sq ft-hr)
327.191 324.441 324.441 321.692 315.276 311.610 305.195 297.863 285.032 277.700 273.117 262.119 233.708 218.127 205.296 192.465 176.884 157.638 149.389 142.058 115.479 109.063 100.815
96.233 90.733 88.901 86.151 80.652 76.986 69.654 63.239 57.740 53.157
AP (in. H2O) 0.40 0.38 0.36 0.34 0.31 0.30 0.26 0.20 0.17 0.16 0.15 0.13 0.12 0.10 0.09 0.08 0.07 0.06 0.06 0.05 0.04 0.04 0.04 0.04 0.03 0.03 0.03 0.03 0.03 0.02 0.02 0.02 0.01

Table 3: Continued 74
L= 14.25 GPH
Air (Ibm/sq ft-hr)
369.350 346.437 333.606 318.942 304.278 288.697 275.866 261.203 230.042 215.378 201.630 186.966 172.302 158.554 141.141 129.226 117.312
99.899 84.318 68.738 51.324
AP (in. H2O) 0.47 0.44 0.40 0.38 0.36 0.33 0.31 0.29 0.14 0.12 0.11 0.09 0.08 0.07 0.06 0.06 0.04 0.04 0.03 0.02 0.02
L=16GPH
Air (Ibm/sq ft-hr)
374.848 362.934 344.604 333.606 320.775 304.278 288.697 247.455 241.956 230.042 217.211 201.630 186.966 172.302 158.554 143.890 129.226 114.562 99.899 84.318 68.738 51.324
AP (in. H2O) 0.52 0.49 0.45 0.44 0.43 0.40 0.39 0.35 0.33 0.20 0.17 0.14 0.12 0.10 0.08 0.07 0.06 0.05 0.04 0.03 0.03 0.02

Table 3: Continued 75
L= 18.5 GPH
Air (Ibm/sq ft-hr)
376.682 362.934 351.936 333.606 318.942 307.028 288.697 270.368 259.370 247.455 230.042 216.294 203.463 186.966 172.302 159.471 143.890 129.226 114.562
99.899 84.318 68.738
AP (in. H2O) 0.84 0.79 0.76 0.71 0.67 0.62 0.38 0.36 0.21 0.19 0.16 0.15 0.13 0.12 0.10 0.09 0.08 0.07 0.05 0.04 0.04 0.03
L = 20GPH
Air (Ibm/sq ft-hr)
362.934 351.936 333.606 322.608 395.195 288.697 274.034 265.785 257.537 256.620 244.705 238.290 226.376 215.378 205.296 186.966 172.302 159.471 146.640 129.226 117.312 102.648
84.318 68.738
AP (in. H2O) 0.90 0.86 0.80 0.76 0.70 0.67 0.62 0.56 0.50 0.40 0.20 0.18 0.17 0.15 0.14 0.12 0.11 0.08 0.07 0.06 0.05 0.04 0.04 0.03

APPENDIX F
FINAL RESULTS
76

Table 4: Values for pressure-drop comparison of Beri saddles. 77
L = 7.5 GPH
AP (in. H2O)
0.75 0.70 0.70 0.65 0.60 0.55 0.45
Cv (ft/sec) 0.293 0.279 0.260 0.248 0.230 0.217 0.202
L=14GPH
AP (in. H2O)
1.00 0.95 0.85 0.75 0.70 0.65 0.60 0.55 0.50
Cv (ft/sec)
0.263 0.248 0.233 0.219 0.205 0.189 0.175 0.159 0.144
L = 20 GPH
AP (in. H2O)
0.85 0.80 0.70 0.50 0.45 0.40 0.35 0.35
Cv (ft/sec)
0.233 0.219 0.205 0.190 0.175 0.163 0.146 0.133
Table 5: Values for pressure-drop comparison of Nor-Pac® rings.
L = 7.5 GPH
AP (in. H2O)
0.08 0.07 0.06 0.05 0.04 0.04 0.03
Cv (ft/sec)
0.191 0.176 0.160 0.147 0.132 0.116 0.102
L=14GPH
AP (in. H2O)
0.09 0.08 0.07 0.06 0.05 0.05 0.04 0.03
Cv (ft/sec)
0.219 0.204 0.189 0.175 0.161 0.143 0.131 0.119
L = 20GPH
AP (in. H2O)
0.15 0.14 0.12 0.11 0.10 0.09 0.07 0.06 0.05
Cv (ft/sec)
0.242 0.229 0.219 0.208 0.189 0.175 0.162 0.149 0.131

Table 6: Values for mass-transfer-efficiency comparison of Beri saddles. 78
L (IbnrVsq ft-hr)
1697.5 2037.0 2367.5 2716.0 3055.5 3395.0 2716.0 2716.0 2716.0 2716.0
848.8 1697.5 1697.5
G (Ibm/sq ft-hr)
219.0 198.7 186.9 198.9 181.5 186.9 169.5 157.6 186.9 230.0 186.0 290.5 290.5
HTU (ft)
2.87 2.50 2.20 3.82 3.59 4.24 3.34 5.13 3.84 2.90 2.69 3.80 3.50
KOG (Ibmol/min-sq ft-atm)
*104 3.083 3.069 3.938 2.100 2.050 1.783 2.050 1.240 1.927 3.207 4.350 3.080 3.320
Table 7: Values for mass-transfer-efficiency comparison of Nor-Pac® rings.
L (Ibm/sq ft-hr)
2037.0 2376.5 2716.0 3055.5 3395.5 1273.1 1697.5 2037.2 2418.9 2716.0 2716.0 3055.5 3395.0
G (Ibm/sq ft-hr)
255.7 275.9 295.1 315.5 334.5 151.2 220.8 216.3 158.6 220.8 172.3 172.3 172.3
HTU (ft)
1.06 0.98 1.17 1.26 1.02 0.86 1.69 1.07 0.92 1.34 0.93 0.95 0.97
KoG (Ibmol/min-sq ft-atm)
*103 1.304 1.531 1.359 1.363 1.770 2.660 1.980 3.060 2.600 2.490 2.800 2.740 2.690

APPENDIX G
DATA FOR NOR-PAC® RINGS
79
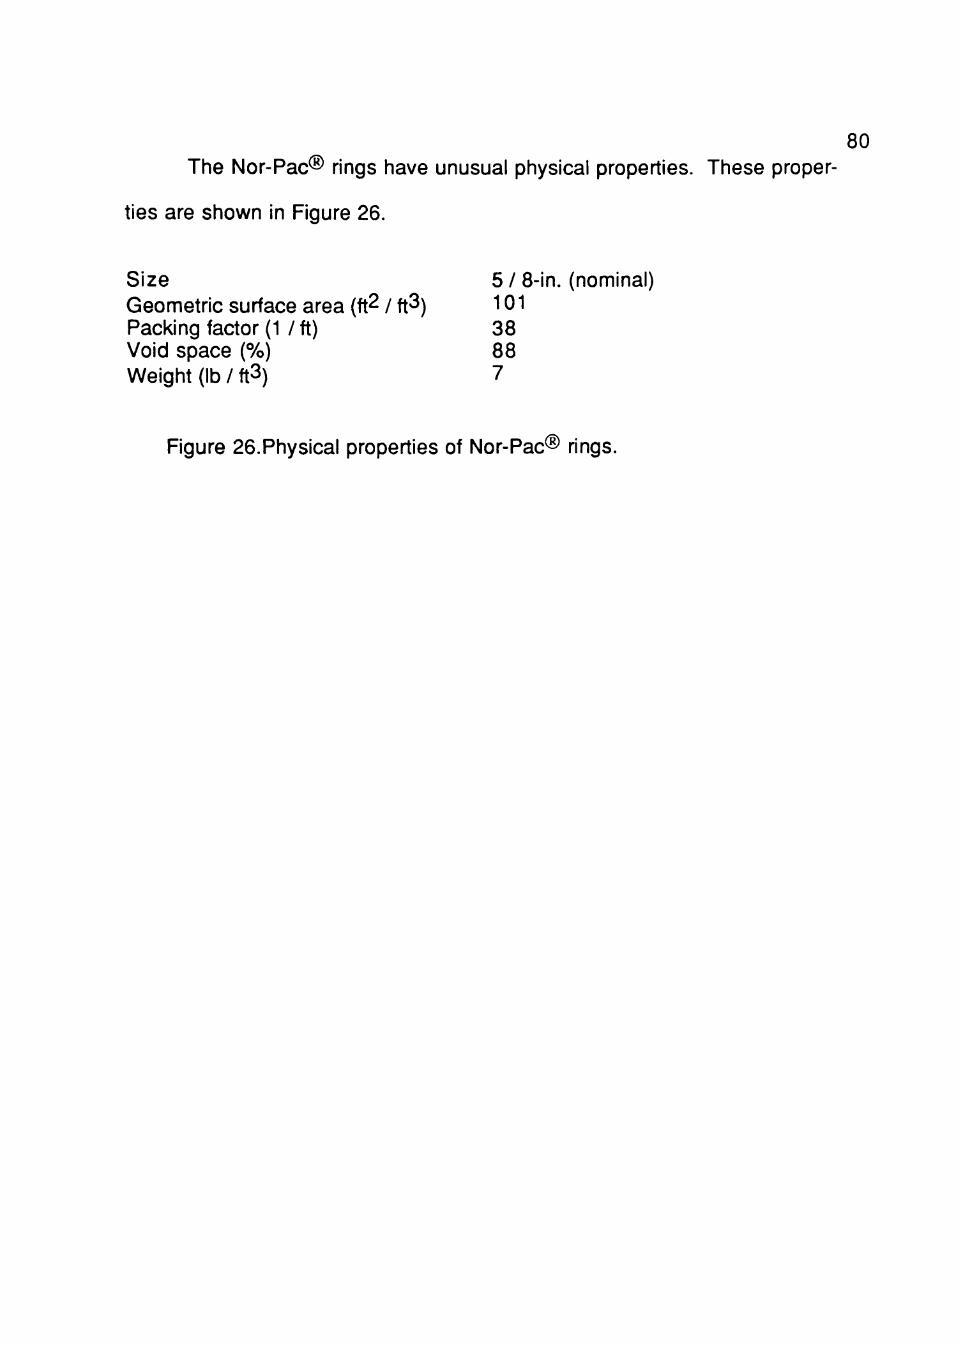
80
The Nor-Pac® rings have unusual physical properties. These proper
ties are shown in Figure 26.
Size 5 / 8-in. (nominal) Geometric surface area (ft^ / ft3) 101 Packing factor (1 /ft) 38 Void space (%) 88 Weight (lb / ft3) 7
Figure 26.Physical properties of Nor-Pac® rings.

PERMISSION TO COPY
In presenting this thesis in partial fulfillment of the
requirements for a master's degree at Texas Tech University, I agree
that the Library and my major department shall make it freely avail
able for research purposes. Permission to copy this thesis for
scholarly purposes may be granted by the Director of the Library or
my major professor. It is understood that any copying or publication
of this thesis for financial gain shall not be allowed without my
further written permission and that any user may be liable for copy
right infringement.
Disagree (Permission not granted) Agree (Permission granted)
Student's signature --^HJU /'7^ 7// // Student's signature
Date Date