a comparison of high school students’ development of...
TRANSCRIPT

A Comparison of High School Students’ Development of Statistical Reasoning Outcomes in
High and Low Statistical Reasoning Learning Environments
by
Basil Manley Conway IV
A dissertation submitted to the Graduate Faculty of
Auburn University
in partial fulfillment of the
requirements for the Degree of
Doctor of Philosophy
Auburn, Alabama
December 12, 2015
Keywords: reasoning, teaching, learning, statistics, education, constructivism
Approved by:
W. Gary Martin, Chair, Professor of Mathematics Education
Marilyn E. Strutchens, Professor of Mathematics Education
Marie Kraska, Professor of Research and Statistics
Huajun Huang, Associate Professor of Mathematics and Statistics

ii
Abstract
The purpose of this study was to study the impact of conformity to Statistical Reasoning
Learning Environment (SRLE) principles on students’ statistical reasoning in Advanced
Placement statistics courses. The study encompassed ten different schools in the Southeast
United States over a school year. A quasi-experimental design was used to compare teachers
with higher and lower levels of conformity to SRLE principles through a matching process used
to mitigate the effects of non-random assignment. This matching process resulted in five pairs of
similar teachers and schools who differed in self-reported beliefs in the effectiveness of SRLE
principles and application of those principles in their instruction.
The impact of teachers’ level of conformity to SRLE principles was determined by using
an instrument to measure students’ statistical reasoning. This instrument was administered as a
pre-test after approximately a quarter of the course was completed and re-administered as a post-
test at the end of the course. Analysis of covariance with post-hoc analysis was used to compare
the development of statistical reasoning between and among teachers’ classrooms with self-
reported beliefs and practice that were either of low or high conformity to SRLE principles.
Increases in students’ statistical reasoning were found at varying levels in both high and
low conformity classrooms. Improvements among teachers with low conformity to SRLE
principles were less varied and consistent with national averages for improvement by college
students. Improvements in classes with high conformity to SRLE principles were more varied,
with the students of two teachers with high levels of conformity to SRLE principles showing

iii
large levels of improvement in statistical reasoning in comparison to national averages and those
of other teachers within the study. While the comparison between classrooms showing low and
high conformity to SRLE principles revealed no statistically significant differences in students’
statistical reasoning ability, results from this study suggest that beliefs and practices aligned with
SRLE principles show potential to increase students’ statistical reasoning at rates above national
averages and teachers with similar characteristics. The variation in classrooms with high
conformity to SRLE principles suggest the need to further research variables affecting their
impact on students’ statistical reasoning.

iv
Acknowledgements
Thank you to Jesus for your undeserving love and mercy. By your generosity I live, not to earn
my life, but rather to show your love to others (Ephesians 2:8). By your example, others have
modeled your character.
Specifically, thank you to Mallory Conway, my Proverbs 31 wife, for your love, understanding,
and patience. You model the characteristics of Christ; I love you forever.
Thanks be to my biological parents, in-laws, and grandmother. My life would not be as full
without your guidance and compassion.
Thank you to Dr. W. Gary Martin and Dr. Marilyn Strutchens for your mentorship and the
opportunities you have provided me. Dr. Martin, thank you for leading by example. Dr.
Strutchens, your compassion for all students is magnetic in both your teaching and actions. You
both imitate Christ through your servant leadership that I hope to imitate.

v
Table of Contents
Abstract ........................................................................................................................................... ii
Acknowledgements ........................................................................................................................ iv
List of Figures ................................................................................................................................. x
List of Tables ................................................................................................................................ xii
List of Abbreviations ................................................................................................................... xiii
Chapter 1: Introduction ................................................................................................................... 1
Statistics Education as a Discipline ............................................................................................. 2
The Problem ................................................................................................................................ 4
International Assessments ....................................................................................................... 5
National Assessments .............................................................................................................. 7
Teacher Knowledge ................................................................................................................. 9
Summary................................................................................................................................ 10
Steps to Understanding a Solution ............................................................................................ 11
Chapter 2: Literature Review ........................................................................................................ 14
Learning of Statistics ................................................................................................................. 14
Statistical Learning Levels .................................................................................................... 15
Cognitive Barriers to Statistical Learning ............................................................................. 29
Affective barriers to learning................................................................................................. 37

vi
Summary................................................................................................................................ 46
Teaching Statistics ..................................................................................................................... 47
Establish Mathematics Goals to Focus Learning .................................................................. 47
Implement Tasks that Promote Reasoning and Sense Making ............................................. 53
Use and Connect Representations ......................................................................................... 56
Pose Purposeful Questions .................................................................................................... 58
Build Procedural Fluency from Conceptual Understanding ................................................. 62
Support Productive Struggle.................................................................................................. 65
Orchestrate Productive Discourse ......................................................................................... 67
Elicit and Use Evidence of Student Thinking. ...................................................................... 69
Summary................................................................................................................................ 73
Technology for Statistics Teaching ........................................................................................... 74
Statistics Curriculum ................................................................................................................. 79
Curriculum Priorities ............................................................................................................. 80
Programs ................................................................................................................................ 95
Statistical Progressions .......................................................................................................... 95
Summary................................................................................................................................ 97
Assessment ................................................................................................................................ 99
Projects .................................................................................................................................. 99
Portfolios ............................................................................................................................. 103
Multiple Choice Tests.......................................................................................................... 105
Open Ended Responses ....................................................................................................... 107
Summary.............................................................................................................................. 108

vii
Synthesis .................................................................................................................................. 109
Statistical Reasoning Learning Environments ..................................................................... 113
Constructivist Theory .......................................................................................................... 115
Measuring Conformity of Instruction with Constructivist Theory ...................................... 116
Research Questions ............................................................................................................. 123
Chapter 3: Methodology: ............................................................................................................ 125
Theoretical Framework ........................................................................................................... 125
Design ...................................................................................................................................... 127
Instrumentation ........................................................................................................................ 128
Statistics Teaching Inventory .............................................................................................. 128
Comprehensive Assessment of Student Outcomes in Statistics .......................................... 133
Procedure ................................................................................................................................. 135
Population ............................................................................................................................ 136
Teacher Participation and Matching .................................................................................... 137
Student Participation ........................................................................................................... 139
Data Analysis .......................................................................................................................... 140
Summary ................................................................................................................................. 142
Chapter 4: Results ....................................................................................................................... 143
Responses to the Statistics Teaching Inventory ...................................................................... 143
Identification of Matched Pairs of Participants ....................................................................... 149
Student Responses ................................................................................................................... 156
Initial Analysis of Pre-Test Results ......................................................................................... 158
Statistical Reasoning Improvement in High Conformity Classrooms .................................... 161

viii
Testing conditions for use of ANCOVA ............................................................................. 162
Analysis ............................................................................................................................... 165
Exploratory Analysis ........................................................................................................... 168
Statistical Reasoning Improvement in Low Conformity Classrooms ..................................... 170
Testing conditions ............................................................................................................... 171
Analysis ............................................................................................................................... 175
Exploratory Analysis ........................................................................................................... 178
Comparison of Statistical Reasoning Improvement between High and Low Conformity
Classrooms .............................................................................................................................. 179
Testing conditions ............................................................................................................... 180
Analysis ............................................................................................................................... 183
Exploratory Analysis ........................................................................................................... 185
Chapter 5: Conclusions and Implications ................................................................................... 193
Limitations .............................................................................................................................. 193
Conclusions ............................................................................................................................. 195
The Development of Reasoning in High Conforming SRLE Classrooms .......................... 195
The Development of Statistical Reasoning in Low Conformity SRLE Classrooms ........... 197
Difference between the Development of Statistical Reasoning in Low and High
Conformity Classrooms ....................................................................................................... 198
Implications ............................................................................................................................. 200
Teachers, Curriculum Writers, and Teacher Educators ....................................................... 200
Future Research ................................................................................................................... 205
References ................................................................................................................................... 208

ix
Appendix A: Statistics Teaching Inventory ............................................................................ 22921
Appendix B: Comprehensive Assessment of Outcomes Permission Forms .......................... 26433
Appendix C: Permission Forms ................................................................................................ 2296

x
List of Tables
Table 1 Teaching Practices Related to Selected Statistics Education Literature ....................... 12
Table 2 A Comparison of Demands in Mathematics and Statistics Education .......................... 22
Table 3 Instructional Practices that Support Development of Statistical Learning ................... 52
Table 4 Statistics Teaching Inventory Question Direct and Reverse Coding ........................... 132
Table 5 Possible Matches Grouped by Years of Experience .................................................... 151
Table 6 Comparison of Matched Teachers at All Levels .......................................................... 156
Table 7 Student Response Rates ............................................................................................... 157
Table 8 Teacher Sample Sizes of Pre-tests, Post-tests, and Matched Tests ............................. 158
Table 9 Percent Correct on Entire CAOS Pre-Test .................................................................. 159
Table 10 Percent Correct for 24 CAOS Pre-Test Items Covering Graphical Representation,
Boxplots, Data Collection and Design, Descriptive Statistics, and Bivariate Data .... 160
Table 11 Pre-test and Post-test Summary Statistics for High Conformity Classrooms ............. 162
Table 12 ANCOVA Pre-Screening for Homogenous Slopes ...................................................... 165
Table 13 ANCOVA Test for Differences between Teachers’ Post-Test Scores while
Controlling for Pre-Tests ............................................................................................. 167
Table 14 High Conformity Post-test Means and Adjusted Post-Test Means for High
Conformity Classrooms ............................................................................................... 168
Table 15 Percent of Increase from Pre-Test to Post-Test in High Conformity Classrooms ..... 169
Table 16 Pre-test and Post-test Summary Statistics for Low Conformity Classes .................... 171
Table 17 ANCOVA Test for Interaction in Low Conformity Classrooms .................................. 175
Table 18 ANCOVA Test for Differences between Low Conformity Teachers ........................... 177

xi
Table 19 Adjusted and Non-Adjusted Post-Test Means for Low Conformity Classrooms ........ 177
Table 20 Percent of Increase from Pre-Test to Post-Test in Low Conformity Classrooms ...... 178
Table 21 Pre-Screening Test for Homogeneity of Slopes between Conformity Levels .............. 183
Table 22 ANCOVA Test for Differences between Conformity Levels after Controlling for
Pre-Tests ...................................................................................................................... 184
Table 23 ANCOVA Test for Differences between Teachers after Controlling for Pre-Tests .... 186
Table 24 Adjusted Class Mean Comparisons between Matched Teachers ............................... 187
Table 25 Comparison of Percent of Increase between Matched Teachers ............................... 188
xii
List of Figures
Figure 1. TIMSS data and probability subscale for years 1995 through 2011. .............................. 6
Figure 2. NAEP data analysis, statistics, and probability subscales for 1990-2013 in grades 4,
8, and 12. ........................................................................................................................ 9
Figure 3. Two different views of the relationship of literacy, reasoning, and thinking as
proposed by delMas (2002). ......................................................................................... 26
Figure 4. Litearcy, reasoning, and thinking taxonomy triangle. .................................................. 27
Figure 5 The Assessment Triangle by Petit, Zawojewski, and Lobato (2010). ........................... 71
Figure 6. Order of matching procedure for possible participants within study. ......................... 138
Figure 7. Histograms of self-reported teaching practices for possible participants by
subscale. ..................................................................................................................... 145
Figure 8. Histogram of possible participants’ self-reported practices average. ......................... 146
Figure 9. Histogram of possible participants’ beliefs in effectiveness of
SRLE principles. ........................................................................................................ 146
Figure 10. Scatter plot of possible participants’ beliefs and practices subscales
from the STI. .............................................................................................................. 147
Figure 11. Histogram of total average conformity to SRLE conformity. .................................. 148
Figure 12. Histogram of post test scores for high conformity. ................................................... 161
Figure 13. Q-Q plot for high conformity post-test scores. ......................................................... 163
Figure 14. Scatterplot of pre-test vs. post-test for high conformity. .......................................... 164
Figure 15. Normal QQ plot for post-pest scores in low conformity classrooms ........................ 172
Figure 16. Histogram for post-test scores for low conformity classrooms. ............................... 173
Figure 17. Scatter plot of pre-test vs. post-tests for low conformity classrooms. ...................... 174
Figure 18. Histogram for all post-test scores.............................................................................. 180
Figure 19. Normal QQ plot for post scores for all participants. ................................................. 181
Figure 20. Scatter plot for pre-test vs. post scores for all participants. ...................................... 182

xiii
List of Abbreviations
ANCOVA Analysis of Covariance
CAOS Comprehensive Assessment of Outcomes in Statistics
CCSS-M Common Core State Standards for Mathematics
FHSM Focus in High School Mathematics
GAISE Guidelines for Instruction and Assessment in Statistics Education
IMP Interactive Mathematics Program
NAEP National Assessment of Educational Progress
NCTM National Council of Teachers of Mathematics
NGSS Next Generation Science Standard
PBL Project Based Learning
PCK Pedagogical Content Knowledge
PISA Program for International Student Assessment
PSSM Principles and Standards for School Mathematics
PtA Principles to Action
SATS-36 Survey of Attitudes Toward Statistics
SRLE Statistics Reasoning Learning Environment
STI Statistics Teaching Inventory Survey
TIMSS Trends in International Mathematics and Science Study
TPCK Technological, Pedagogical and Content Knowledge

xiv
TTLP Thinking Through a Lesson Protocol

1
Chapter 1: Introduction
Research in statistics education is a relatively new field (Rossman & Shaughnessy, 2013).
Statistics education research has focused in recent years on the increase of statistical reasoning in
one cognitive area (Slauson, 2008; Jacobs, 2013; Zieffler & Garfield, 2009; Reading & Reid,
2006; Ben-Zvi, 2004). Joan Garfield (2002) stated that statistical thinking and reasoning should
be the desired outcomes for a course; however, “no one has yet demonstrated that a particular set
of teaching techniques or methods will lead to the desired outcomes” (p.10). Since Garfield’s
discussion (2002), the limited number of studies that have attempted to measure outcomes in
statistics education based on teaching methods have had mixed outcomes (Loveland, 2014).
Studies that have compared outcomes within statistical courses with the treatment of different
teaching methods have used the same teacher using different pedagogical techniques and are at
potential risk of errors in treatment effects (Baglin, 2013; Loveland, 2014; Slauson, 2008).
Baglin (2013) and Loveland (2014) both looked at promoting reasoning and thinking
holistically, but in one class being taught by the same instructor in two different ways. There has
been little to no empirical research in statistics education on what pedagogical strategies improve
statistical reasoning and thinking (Baglin, 2013; Loveland, 2014). There has also been little
attention to pedagogical strategies within statistics education that promote conceptual
understanding, thus the literature review in this dissertation uses mathematics education to help
fill these gaps in pedagogical content knowledge needed for statistics. Studies from mathematics
education were considered relevant to the study of promoting statistical reasoning because of
their similarities but also compared because of their differences (delMas, 2004).

2
Statistics Education as a Discipline
The Guidelines for Assessment and Instruction in Statistics Education (GAISE) written
by Franklin et. al. (2005) stated that statistics has “become a key component of the K-12
mathematics curriculum” (p. 3). Society is becoming more and more data driven, and students’
fundamental understanding of statistics is integral if they are to be informed decision makers in a
democratic society and prepared to enter the new statistical driven workforce (Franklin et. al,
2007; National Mathematics Advisory Panel, 2008). The difficulty students have in dealing with
variation and context in real world data makes the attention of statistics education starkly
different from mathematics (delMas, 2004). Cobb and Moore (1997) stated that:
Statistics is a methodological discipline. It exists not for itself, but rather to offer to other
fields of study a coherent set of ideas and tools for dealing with data. The need for such a
discipline arises from the omnipresence of variability.
The understanding of statistics is fundamental; The National Council for Teachers of
Mathematics’ (NCTM, 2000) Principles and Standards for School Mathematics (PSSM) and the
National Governor’s Association for Best Practices and Council of Chief State School Officers
(NGA & CCSSO, 2010) Common Core State Standards for Mathematics (CCSS-M) have
included data analysis and probability objectives at all grades. Ideas within these documents have
pushed many teachers of mathematics and statistics to rethink the curriculum in their courses and
their pedagogy. Similar to mathematics reform movements over the last fifty years attempting to
shift teachers instructional roles from “a sage on the stage” to “a guide on the side”, statistics
educators have also emphasized the facilitation of learning rather than the dissemination of
content (Chance & Garfield, 2002). Reform movements in statistics education have promoted the
use of real world data, cooperative groups, alternative assessments, and technology to develop

3
student understanding of statistics and statistical concepts (Garfield and Ben-Zvi, 2008; Chance,
2002; Chance, 1997; Keeler & Steinhorst, 1997; Mills, 2002; Franklin et. al, 2007; Cobb, 1992).
In addition to changes in pedagogical approaches, many teachers have been emphasizing
less pure probability in their courses in order to develop stronger understanding of statistical
concepts (Rossman & Chance, 2002; Cobb & Moore, 1997; Shaughnessy, 2003). Others have
devoted less time to computation of asymptotic structures of statistics in favor of understanding
these structures of data through randomized designs for tests of difference (Tintle, Topliff,
Vanderstoep, Holmes, & Swanson, 2012; Cobb & Moore, 1997; Rossman & Chance, 2013;
Cobb, 2013). In fact, the newest document for the Statistics Education of Teachers (Franklin et.
al, 2015) purposefully does not include asymptotic structures for probability.
Though statistics has been considered a discipline of mathematics for many years,
statistical content has continuously shifted in value (Moore, 1993; Cobb & Moore, 1997,
McAfee & Brynjolfsson, 2012; Cobb, 2013). Powerful computational capabilities and large
amounts of data collected via the internet and through large scale corporations have reshaped the
need for statistics on a global level (Moore, 1993; Cobb & Moore, 1997; McAfee &
Brynjolfsson, 2012; Cobb, 2013). Random number generation, statistical computation,
bootstrapping, big data collection, and reiteration are just a few of the processes once only
dreamed of by statisticians approximately three decades ago (Moore, 1993; Cobb & Moore,
1997; Cobb & Moore, 2000; Cobb, 2013). McAfee and Brynjolfsson (2012) and Lohr (2012)
discussed recent changes in the collection, use, and analysis of big data to increase business
revenue and change managerial responsibilities and qualifications. The power of computational
procedures, ease of data collection, and condensed storage space has increased the need for
statistics and created new jobs that require the understanding of statistical designs and

4
programming in small and large businesses to become profitable (Konold & Higgins, 2003;
McAfee & Brynjolfsson, 2012).
Based on trends in 2004, the American Diploma Project’s Ready or Not: Creating a High
School Diploma that Counts recommended that high schools increase their attention to data
analysis, statistics, and their applications to ensure students were ready for more advanced
subjects in post-secondary education and prepared for growing jobs in a data rich society.
Horton, Baumer, and Wickham (2014) suggested that giving students learning experiences in
introductory statistics and math courses that develop reasoning and conceptualization of statistics
can help those dealing with statistics understand the differences between “big data” and statistics.
Understanding these differences can allow for the use of big data in better business decision
making. The problem however lies in the monitoring of conceptualization of statistics at both the
national and international level.
The Problem
Our data rich society has increased attention to the need for statistical literacy, reasoning,
and thinking by students and teachers. To monitor this need at the national level, the National
Assessment of Educational Progress (NAEP), the “Nation’s Report Card”, began monitoring
data analysis, statistics, and probability subscales in 1990 every two years in grades four, eight,
and twelve. The Trends in International Mathematics and Science Study (TIMSS) started in 1995
with collection periods every four years in grades four, eight, and twelve. The Program for
International Student Assessment (PISA) for fifteen year olds began in 2000 and assesses
students on probability and statistics every three years. These assessments have been used to
both monitor student and teacher knowledge of statistical literacy, reasoning, and thinking.

5
International Assessments
In 2007, TIMSS reported that 92% of teachers felt well prepared to teach data analysis
and probability; however, in 2011 83% felt well prepared to teach data analysis and probability.
Moreover, the 2011 TIMSS reported that “only 62 percent of students on average internationally,
had teachers who felt very well prepared to teach the data and chance topics” (Mullis, Martin,
Foy, & Arora, 2012, p. 303). The closest rival of all content domains measured on the TIMSS
report was geometry in which 85% of students’ teachers felt well prepared. This extreme
difference shows approximately a quarter or fewer of teachers felt well prepared to teach content
in data and chance as opposed to any other content domain and almost half of current educators
do not feel well prepared to teach topics of data and chance. Mullis et. al (2012) also reported
that data and chance topics were given the least attention internationally at the eighth grade and
had the largest variation between countries on the TIMSS. The introduction of new probability
and statistics standards in the United States through large state adoption in 2010 of the CCSS-M
has affected many classrooms’ and teachers’ focus in the United States (Franklin & Jacobbe,
2014; Franklin et. al, 2015). These standards may have potentially contributed to the negative
trend in teachers’ self-reported preparedness to teach probability and statistics (Franklin et. al,
2015).
Though less teachers feel comfortable with statistics and probability standards, students
have reported approximately an 8% increase in their teachers’ focus on data analysis and
probability standards. In 2007, 83% of students reported being taught data analysis and
probability standards; however, in 2011, 91% reported being taught data analysis and probability
standards (U.S. Department of Education, 2014). A larger emphasis on data analysis and

6
probability standards with less confidence seems to be a recipe for disaster in student
achievement.
According to TIMSS, the data analysis and probability subscale has been flat for the last
16 years in both grade 4 and grade 8 with the exception of a significant increase from the years
1999 to 2003 in grade 8 (Mullis et. al, 2012). By 2011, however, the grade 8 scaled score was
again below that recorded in 2003. Internationally, the United States scored above average;
however, this is likely correlated with teacher preparedness at the international level. Teacher
preparedness to teach or shifting standards in the CCSS-M may also potentially explain the
decrease in the United States subscale from 2007 to 2011 in grade 8. Figure 1 summarizes the
TIMSS data for the U. S. and international averages from the years 1995 to 2011.
Figure 1. TIMSS data and probability subscale for years 1995 through 2011.
Scoring rubrics from the TIMSS indicated that students on average were at an
intermediate stage in which they can apply their mathematical knowledge in basic situations but
lack the ability to use their knowledge to solve problems and apply them to complex situations
470
480
490
500
510
520
530
540
550
560
1995 1999 2003 2007 2011
Scal
ed S
core
Year
Grade 8 Grade 4 International Average in Grade 4 and Grade 8

7
(Provasnik et. al, 2012). Results from the TIMSS (Provasnik et. al, 2012) also highlighted the
stagnation in student achievement in mathematics and in particular data display, data, and
chance. The Program for International Assessment (PISA, OECD, 2014) reported that students
struggled with tasks involving the creation, use, and interpretation of real world data and the use
of reasoning about this data. Results from the 2009 and 2012 PISA indicated that the United
States average score was still below the international average (OECD, 2014). These results make
apparent the need for increased attention in probability and statistics at the K-12 level that
emphasizes the use of real world data and reasoning in the United States.
National Assessments
When the NAEP chose to monitor the content domain of statistics and probability, the
proportion of questions addressing this domain increased from 6% in 1986 to 20% in 1996 for
grade twelve students (Shaughnessy, 2003). The most recent version given to grade twelve
students in 2013 included approximately 25% of problems related to data analysis, statistics, and
probability. Similarly, grade 8 problems related to probability and statistics were increased by
15% from 1986 to 1996 for students at the fourth grade level in 1996 (Shaughnessy, 2003). The
2013 version of the NAEP included approximately 15% of problems for grade eight students and
10% of problems for grade four students (U.S. Department of Education, 2014). This data has
shown an increase in the monitoring of probability, statistics, and data analysis at the national
level, but not necessarily at the classroom level.
Shaughnessy (2003) reported that 12% of twelfth grade students in 1990 had experience
with statistics, data analysis, and probability in high school and 20% in 1996 from NAEP data.
Unfortunately, the NAEP has not measured students experience with statistics, data analysis, and
probability since 1996. The complement to the data in 1996, however, was that approximately

8
80% of students had no experience with data analysis, statistics, and probability in the secondary
school setting. These students left the high school setting to enter a very wide range of
professions that called for a very diverse use of statistics, data analysis, and probability. With so
few students having experience in their high school careers with statistics, K-12 stakes holders
leave a great deal of responsibility on the development of knowledge related to data analysis,
statistics, and probability at the tertiary level.
The data analysis, statistics, and probability subscale scores on NAEP have been flat,
even more dramatically than international assessments. The largest gains seem to have occurred
between the years 1996, 2000, and 2003 in grades 4 and 8. The grade 8 subscale increased from
270 to 275 from 1996 to 2000 and from 275 to 280 in 2003. The grade 4 subscale increased from
228 to 237 from the year 2000 to 2003. From 2003 to 2013, grade 4 subscale scores have only
increased by a scaled score of five and grade 8 scaled scores have only increased by a scaled
score of 6. Figure 2 summarizes NAEP data for data analysis, statistics, and probability for the
years 1990 to 2013 in grades 4, 8, and 12.

9
Figure 2. NAEP data analysis, statistics, and probability subscales for 1990-2013 in grades 4, 8,
and 12.
Teacher Knowledge
The problem of student achievement in statistics is potentially manifested by the lack of
teacher statistical pedagogical and statistical content knowledge. In addition, the lack of
experience students have in the secondary setting is also potentially strongly associated with
teacher knowledge. In 2007, Jacobbe used NAEP questions to assess three teachers’ content
knowledge of statistics in the 4th grade. All three teachers answered 90% of problems correctly
that required less difficult procedural knowledge but only 37.5%, 62.5%, and 75% of difficult
procedural knowledge problems (Jacobbe, 2007). When assessed conceptually, these teachers
did not recognize the difference between histograms and bar graphs and had no familiarity with
boxplots and histograms (Jacobbe, 2007). Similarly, these three teachers could calculate the
mean of a data set, but could not determine the meaning of mean and mode or exhibit the ability
to use the mean or median appropriately (Jacobbe, 2007). These three teachers also had difficulty
0
50
100
150
200
250
300
350
1990 1992 1996 2000 2003 2005 2007 2009 2011 2013
Scal
ed S
core
Year
Grade 12 Grade 8 Grade 4

10
in understanding range, applying the range to a histogram, and understanding spread about a
certain location (Jacobbe, 2007).
In 2011, Jacobbe and Carvalho analyzed teachers’ knowledge of average and found
strong reliance on procedural skills. This fact highlights students’ inability to create, use, and
interpret real world data and use of reasoning about data in the PISA (OECD, 2014) and use their
knowledge to solve problems and apply them to complex situations on the TIMSS (Provasnik et.
al, 2012). According to Jacobbe (2007), it seems illogical to ask these teachers to teach students
material that exceeds their own level of knowledge. Jacobbe and Carvalho (2011) stated, “A
teacher that feels uncomfortable with statistics may have a tendency to reduce or omit statistical
topics from their enacted curriculum” (p. 16). This suggests that teachers’ lack of understanding
of statistics was possibly causally related to the inclusion of statistical content in the enacted
curriculum. Jacobbe’s studies highlighted the need at the post-secondary level to increase teacher
knowledge of statistics education.
Summary
These assessments have highlighted the need for improvement in K-12 statistics
education. The United States scored above average internationally in both grade 4 and grade 8
since the beginning of the TIMSS and below average on the PISA. According to the OECD
(204), reasons for scoring below average on the PISA related to student use of real world data
and the ability to reason about data. With the exception from 1999 to 2003 on the grade eight
TIMSS report, little difference has been seen between scaled scores in grades 4 and grade 8 in
national and international results. Grade 12 United States scaled data analysis, statistics, and
probability scores have similarly shown little improvement in the last decade. At a national level,
NAEP results have highlighted an increase in the monitoring of probability and statistical

11
standards. In addition, the NAEP results have shown gradual increases but recent decreases in
student achievement in probability and statistics. Assessments and research have highlighted the
fact that teacher preparedness is in need of improvement (Jacobbe, 2010). The increase in rigor
and number of data analysis and probability standards in both national and international
assessments make the teaching of statistics a pressing issue in current education.
Steps to Understanding a Solution
This study was guided by the broad question, “What instructional practices promote
statistical reasoning most effectively?” Thus, this study exists to help explore the impact of
effective teaching practices to the development of statistical reasoning. Though teaching methods
promote reasoning, other factors such as technology, curriculum, and assessment have the ability
to promote statistical reasoning as well. For this reason, attention to teaching, technology,
curriculum, and assessment are also potentially important components to consider in answering
this broad question.
In order for students to learn statistics at deeper levels, they must learn statistics in ways
that develop conceptual understanding of important statistical ideas at all levels of education
(Pesek & Kirshner, 2000/2002; Feldman, Konold, Coulter, & Conroy, 2000; Mokros & Russell,
1995). NCTM (2014) stated that effective teaching and learning is composed of eight major
practices related to learning mathematics and statistics. Table 1 summarizes the Principles to
Action’s (PtA) teaching practices and correlates them with related statistics education literature
(NCTM, 2014). Teachers should recognize and devote attention to breaking cognitive and
affective domain barriers during their teaching.

12
Table 1
Teaching Practices Related to Selected Statistics Education Literature
Mathematics Teaching Practices
(NCTM, 2014)
Selected Guiding Statistical and
Mathematical Literature
focus on establishing clear statistical goals Franklin et al, 2007; NCTM, 2000
implementing tasks that promote reasoning
and sense making
Shaughnessy, Chance, & Kranendonk, 2009
use and connect representations Chance & Rossman, 2006
pose purposeful questions Smith & Stein, 2011; Herbal-Eisenmann &
Breyfogle, 2005
build procedural fluency from conceptual
understanding
Pesek & Kirshner, 2000/2002; Feldman,
Konold, Coulter, & Conroy, 2000; Mokros &
Russell, 1995; Konold, 2002
support productive struggle Warshauer, 2011; Hiebert and Grouws, 2007
orchestrate productive discourse Smith & Stein, 2011
elicit and use evidence of student thinking Chance, 2002; Garfield, 2002; delMas, 2002
Teaching that promotes statistical reasoning also incorporates the use of curriculum,
technology, and assessment that is aligned with learning goals to promote in-depth learning
(Garfield and Ben-Zvi, 2008, 2009; NCTM, 2014, 2000). Curricula should provide progressions
that allow students to build upon and develop their own knowledge through high-level tasks
(NCTM, 2014). Teachers should use technology to build students’ conceptual understanding of
statistics and not just as a means for computing statistics or presenting presentations (Chance &

13
Rossman, 2006). Teachers should use assessments as an instructional tool. This provides a way
for students to gain understanding while at the same time allow the teacher to gage student
understanding (Petit, Zawojewski, & Lobato, 2010; Chance, 1997; NCTM, 1995). Teachers who
align their curriculum to in-depth learning goals, use technology to build conceptual
understanding, and use assessment as a learning tool are more likely to promote statistical
reasoning and thinking.
This study aimed to understand the extent to which students’ statistical reasoning and
thinking ability improve in classrooms whose teacher had self-reported beliefs and practices that
that had higher or lower levels of alignment with best practices in mathematics and statistics
education. These best practices were aligned with research in teaching, learning, curriculum, and
assessment in mathematics and statistics education found within Chapter 2. In addition to
analyzing the extent to which students improved in reasoning in these classes, this study
quantified differences found between these two different types of classrooms.

14
Chapter 2: Literature Review
To understand the impact of instruction on students’ statistical development, the
following literature review is subdivided in a similar manner to National Council for Teachers of
Mathematics (NCTM) (2014, 2000, 1991) documents that promote a strong vision for
mathematics education. The focus of the review highlights five major aspects of statistics
education: teaching, learning, technology, curriculum, and assessment. The learning section
expounds on statistical learning levels, cognitive barriers to learning, and affective barriers to
learning. The teaching section explicates teaching strategies that promote student learning at in-
depth levels as categorized by NCTM (2014). The technology section details technology that has
been used to teach statistics and research that has been conducted in the area of technology and
instruction. The curriculum section reviews important statistical content, programs, and
progressions that promote teaching and learning of statistics at in-depth levels. The assessment
section highlights the use of assessments in statistics education that have been used to monitor
the efforts of statistical achievement. The final section synthesizes this information to describe a
learning environment that promotes statistical reasoning and thinking.
Learning of Statistics
NCTM’s (2014) Principles to Action: Ensuring Mathematical Success for All (PtA)
stated that setting clear learning goals sets the stage for everything within mathematics
instruction. For this reason, learning was reviewed first in this literature review. NCTM’s (2000,
2014) vision for the learning of mathematics requires students to understand and actively build
new knowledge from experience and prior knowledge. NCTM (2014) reiterated support for this

15
vision of learning through principles of Adding It Up (Kilpatrick, Swafford, & Findell, 2001).
This vision of mathematical learning proficiency has five intertwined strands: conceptual
understanding, procedural fluency, strategic competence, adaptive reasoning, and productive
disposition (Kilpatrick, Swafford, & Findell, 2001). Each of these strands are interconnected and
develop upon and with one another. These strands are all key ingredients in a mathematically
proficient student.
Just as each of these strands are essential for mathematical proficiency (Kilpatrick,
Swafford, & Findell, 2001; NCTM, 2014), the learning of statistics with literacy, reasoning, and
thinking should be critical elements within the statistics classroom. Literacy, reasoning, and
thinking are all key components in what makes a statistically proficient student. The following
sections look at how the concepts of statistical literacy, reasoning, and thinking defined in
statistics education research play a fundamental role in learning experiences of statistics
classrooms.
Statistical Learning Levels
An outside observer might interpret the three terms statistical reasoning, statistical
thinking, and statistical literacy as synonymous. Indeed many in statistics education have used
literacy, reasoning, and thinking interchangeably in the past (delMas, 2002). Though these terms
have overlapped one another in research, there have been specific distinct characteristics in
statistics education research that encompass each (delMas, 2002; Rumsey, 2002; Garfield, 2002;
Chance, 2002). Statistical literacy has been a very broad term that researchers have used to
define citizens reading statistical graphs in the news (Rumsey, 2002). Rumsey (2002) also
described students interpreting statistical output in classrooms as statistical literacy. Students
who reason statistically have the ability to move from the reading and writing of statistics to the

16
understanding behind certain principles like sampling distributions, sampling designs, and testing
procedures (Garfield, 2002). Statistical thinkers have the ability to view statistics as an iterative
and conjoined process through the four major goals of asking questions, collecting and
representing data, analyzing data, and making conclusions (Chance, 2002). The next four
sections look into these levels or goals for statistical instructors in more detail and discuss some
of the interconnections between each.
Statistical Literacy. Rumsey (2002) wrote that a statistically literate student was able to
recognize information they were exposed to on a daily basis, assess its validity, and make
adequate decisions based on this information. Many people can claim statistical literacy in this
very broad definition. Rumsey’s (2002) definition of statistical literacy does not provide a clear
distinction of statistical literacy for a classroom, a high school, or a nation. To help provide
clarity for this needed distinction, Rumsey (2002) describes statistical literacy as either
“statistical citizenship” or “statistical competency”.
Many teachers being pushed for time in their classes may potentially teach more towards
statistical competency. Rumsey (2002) described statistical competency in greater detail as data
awareness, an understanding of certain basic statistical concepts and terminology, knowledge of
the basics of collecting data and generating descriptive statistics, basic interpretation skills, and
basic communication skills. These skills require statistically competent students to explain
results to others, describe results within context, and know and perform certain statistical
methodology (Rumsey, 2002). Though all of these concepts are extremely important, they are
only marks of what makes a statistically competent individual.
Rumsey (2002) discussed that teachers of statistics should want more from a class that
statistical competency, including students understanding of why and how. Students have been

17
rarely pushed in statistical classes to look for reasoning behind statistical tests and formula
construction (the why), but rather look for how to complete a procedure and interpret its results
correctly (Rumsey, 2002). Pushing statistical students to be statistically literate helps make them
be better readers and criticizers of research results. Teaching for statistical literacy also makes
grading and instruction easier for teachers through explicit logic to conclusions, procedures to
complete tests through software, and complete mathematical calculations that result in one
solution. In short, many teachers who teach only for statistical literacy or competency miss
broader goals of the reasoning behind statistics and lose the ability to be sophisticated criticizers
of research and statistical reports.
Research on Improving Statistical Literacy. Verkoeijen, Imbos, van de Wiel, Berger, &
Schmidt (2002) described students who have gained conceptual understanding of statistical
knowledge as having the ability to use statistical terms, apply formulas, complete arithmetic
procedures, understand the conditions for application of the learned knowledge, interpret
outcomes of mathematical calculations, and understand theoretical background knowledge
correctly. All of the characteristics that Verkoeijen et al. (2002) used to describe conceptual
understanding were those of statistical literacy (Rumsey, 2002; delMas, 2002). Verkoeijen et al.
(2002) looked into the effects of increasing literacy using a constructivist-learning environment
in health sciences statistics classrooms.
Verkoeijen et. al (2002) subjected 107 students to a four-week constructivist-learning
environment, and then used free recall to understand students’ development of knowledge.
Drawing on Verkoeijen et al.’s (2002) implementation of the constructivist learning
environment, it could be seen that Verkoeijen et. al’s (2002) learning environment was not in
complete alignment with this learning theory. Students were introduced to concepts in a lecture

18
format before being allowed to construct their knowledge. This may promote procedural
interference with students’ statistical reasoning (Pesek & Kirshner, 2000/2002; Feldman,
Konold, Coulter, & Conroy, 2000; Mokros & Russell, 1995). Scaffolding which potentially lead
to explaining (Verkoeijen et. al, 2002) during group work was also being administered by
“advanced undergraduate students” or “staff members” who may have not learned important
aspects of good questions and fostering discourse (Stein, Engle, Smith, & Hughes, 2008).
Verkoeijen et al. (2002) used a free recall protocol to understand student conceptions
because of the difficulty of tapping into knowledge constructs of students by use of multiple-
choice tests. Verkoeijen et. al (2002) used concept maps to identify how much information
students were able to “freely recall” correctly and incorrectly related to content covered during
the four-week session. As Verkoeijen et al. (2002) suggested, assessment using free recall did
not form a seamless technique for students to demonstrate understanding the way it was
developed which could misrepresent acquired data. The assessment rubric was also not clearly
disseminated to students. The use of rubric dissemination would allow students to share the
knowledge they do have and make the assessment technique more open (NCTM, 1995).
Verkoeijen et al. (2002) reported that only 40% of students developed conceptual
understanding or Rumsey’s (2002) statistical literacy within the course. Students were also
highly likely to be unable to recall information taught in the four-week session and recall it
accurately (Verkoeijen et al., 2002). Analysis was not judged as a comparison to other learning
environments but as meeting a set of standards to be checked off in Verkoeijen et al. (2002)
study. This lack of comparison makes it difficult to assess the constructivist learning
environments true effectiveness on statistical literacy.

19
Statistical Reasoning. Past statistics education research using the word statistical
“reasoning” has mentioned the incorporation of statistical comprehension, planning and
execution of statistical procedures, and evaluation and interpretation of statistical procedures
very similar to literacy (Garfield, 2002). Statistical reasoning is more; it is the actual process one
must take to understand and be able to implement a statistical procedure in multiple contexts.
Garfield (2003), a leading researcher in statistical reasoning, defined statistical reasoning as “the
way people reason with statistical ideas and make sense of statistical information” (p.23).
Statistical reasoning has been of extreme importance in the development of curriculum
that fosters student development of knowledge (Garfield, 2003). Good statistical reasoning
pushes students to give appropriate reasoning to descriptions, judgments, inferences, and
opinions about data (Garfield, 2003). For this reason, Garfield (2003) pointed out that paper and
pencil exams are extremely hard to measure statistical reasoning, and statistical reasoning is best
understood through face-to-face discussions and highly detailed student work.
Shaugnessy, Chance, and Kranendonk (2009) used the following action words to describe
habits of mind that illuminate statistical reasoning: describing, analyzing, explaining, looking for
structure, critiquing, considering, creating, questioning, evaluating, applying, noticing,
understanding, connecting, determining, justifying, determining plausibility, and validating.
Shaughnessy, Chance, and Kranendonk (2009) focused on the relationship between student
reasoning and formulating questions, designing and employing a plan for collecting data,
analyzing and summarizing data, and interpreting the results from the analysis. Projected student
discourse was used throughout the text to help teachers foster meaningful classroom small
groups and whole class discussions that develop statistical reasoning. Plots were given to help
clarify and give statistical justification to student discussions while side box notes for teachers

20
were given to point out objectives of the classroom teacher during their discussions. Although
not explicitly stated, Shaugnessy, Chance, and Kranendonk (2009) described the important role
discourse has on the development and assessment of statistical reasoning.
Statistical Questions from the Classroom (Shaughnessy & Chance, 2005) promoted
statistical literacy by helping teachers and students alike understand certain concepts of statistics
that many times seem unexplainable to non-mathematicians. One particular portion was a
discussion of why population variance was divided by N, the population size, and sample
variance divided by n-1, the sample size minus one. Other concepts of particular interest from
this text for middle school teachers focused on the reason why the standard deviation was
preferred to the mean absolute deviation found within the standards. Justification of why the
average standard deviation was less biased to be divided by n-1 was shown through
computations of statistics with n-1 and N with known population parameters to develop
statistical reasoning. Justification for the difference between measures of variation was shown
similarly through examples and graphs. Shaughnessy and Chance’s book was designed to
develop teacher reasoning with important statistical content.
NCTM’s (2000) Principles and Standards for School Mathematics (PSSM) provided
multiple examples of reasoning in mathematics education more generally and in probability and
statistics more specifically. NCTM (2000) pushed students to make and investigate conjectures,
develop and evaluate arguments, communicate thinking to others, organize and consolidate
information coherently and in different ways, use appropriate language, make connections
between major concepts, apply to the real world, and build new knowledge through problem
solving in fostering statistical reasoning. In particular, PSSM (NCTM, 2000) stated that teachers
creating activities that push students to explain their reasoning, make sense of problems, clarify

21
thinking, critique one another’s arguments, and find new ways to solve problems should
intertwine reasoning and proof within mathematics and statistics continually. To encourage
reasoning teachers were encouraged to ask why rather than how and push students to justify their
thinking process to ensure conceptual understanding.
Though mathematical reasoning and statistical reasoning are very similar, statistical
reasoning provides an extra complexity with the inclusion of variation (Garfield, 2003). DelMas
(2004) went into detail over the differences and difficulties of mathematical and statistical
reasoning. Of particular importance, delMas (2004) discussed how statistics relies on data. Many
of the concepts within statistics are abstract in nature making it very difficult to teach (delMas,
2004). In addition, statistics often provides different formal inferences from different viewpoints
and the importance of context within statistics can never be disregarded (delMas, 2004; Cobb &
Moore, 1997). In mathematics, context may or not matter and may interfere with abstraction
during mathematical tasks (delMas, 2004). On this note, delMas (2004) suggested that removing
causation from bivariate data was a difficulty for students moving from mathematical to
statistical conclusions. Because of this heavy reliance on context and abstraction, statistical
reasoning for students can become flawed in many different ways making it harder to understand
student misconceptions (delMas, 2004; Cobb & Moore, 1997). Table 2 summarizes some of the
differences between teaching mathematics and statistics.

22
Table 2
A Comparison of Demands in Mathematics and Statistics Education
Mathematics Statistics
Reason with highly abstract concepts and
relationships without variation
Reason with highly abstract concepts and
relationships with variation
Begin with context for familiarity, then
generalize outside the context of a situation
Analyze within context and describe within
context
Teacher focuses on mathematical reasoning
errors
Teacher must focus on reasoning errors
contextual and/or mathematical.
Contextual situations compared case by case
to find patterns and apply generalization
Contextual situations generalized with
variation in anticipation of errors
Research on Improving Statistical Reasoning. Slauson (2008) investigated the
difference between student learning of variation from a standard lecture based format and a
format emphasizing experimentation in two different sections of an introductory statistics course
at the tertiary level. To measure outcomes of the experiment, Slauson (2008) used a pre and post
multiple-choice assessment that focused on statistical reasoning. Results were also gathered
through student interview questions related to variation. In analyzing results from the reasoning
assessment, Slauson (2008) found improvement in students’ statistical reasoning about standard
deviation in the hands-on experiment group but not in the lecture based group. There was no
improvement found in students reasoning about sampling distributions (Slauson, 2008). The
effect size, however, was minimal with approximately only one more questions being answered
correctly (Slauson, 2008). For this reason, there was no statistically significant differences found

23
between differences in pretest and posttest for the hands-on experiment learning and lecture
based classes.
Difficulties in the study design might help to understand the findings. Slauson (2008) did
not completely allow for student exploration of variation in the hand-on experiment class
because the first two days were devoted to explaining the formula for standard deviation in a
lecture setting. Slauson (2008) also lacked attention to discourse that fosters an active learning
approach. Students’ prior experience with the lecture based learning environment could be a
confounding factor in Slauson’s (2008) study. The inclusion of student background variables
might have helped in explaining differences in student outcomes.
Loveland (2014) subdivided one section of an introductory statistics course at the
university level into two sections taught by the same teacher. One section was taught with
entirely lecture based teaching methods and the other with largely active learning methods that
included group work, hands on activities to gather data, and teacher facilitation with minimal
amount of lecture. Loveland (2014) was investigating whether students developed more
conceptually, procedurally, or both using active learning environments. After completing the
courses, Loveland (2014) found no difference between students’ ability to comprehend statistics
or complete statistical procedures in the traditional lecture based and active learning based
course. Loveland (2014) used stepwise selection to determine the most significant affects in her
study. This procedure found that previous GPA, pre-test points, and attendance were the most
contributive predictors of student achievement with whether classes were lecture based or
activity based being insignficant.
Statistical Thinking. Beth Chance (2002) described multiple views of statistical thinking
in research. The overarching theme from Chance (2002) has suggested that statistical thinking be

24
a global view of the statistical process. Those who think statistically have the ability to critique,
evaluate the process in its entirety, and immerse themselves in fine-tuning the process to produce
better results. Chance (2002) presented six habits of mind that characterize statistical thinkers:
1. consider how to best obtain meaningful and relevant data to answer the question at hand
2. constant reflection on the variables involved and curiosity for other ways of examining
and thinking about the data and problem at hand
3. seeing the complete process with constant revision of each component
4. omnipresent skepticism about the data obtained
5. constant relation of the data to the context of the problem and interpretation of the
conclusions in non-statistical terms
6. thinking beyond the textbook
Her analysis of statistical thinking was based on the development of the constant
critiquing nature of a statistician. Chance (2002) went on to describe the needed relationship
between assessment and instruction: if an instructor wants students to gain the habits of mind of
a statistical thinker, they must include follow up questions in assignments and projects that
develop this process and hold students accountable for this information.
Research on Improving Statistical Thinking. Baglin (2013), as well as Chance and
Garfield (2002), discussed the lack of empirical evidence in statistics education literature to show
increases in student reasoning and thinking. Baglin (2013) reported two different attempts to
show increases in student thinking and affection of statistics through a Project Based Learning
(PBL) environment called Island. This environment required students’ to make decisions in
simulated case studies about whether to conduct experimental studies or use observational data
to make inferences. Baglin’s (2013) first study gave qualitative evidence for further investigation

25
of the PBL. Surveys administered by Baglin (2013) showed connection between the use of the
PBL and the development of statistical thinking and affection.
To more quantitative evidence after completing the first qualitative study, Baglin (2013)
taught one section of an introductory statistics course with use of the PBL Island. Based on
student decisions to proceed on the Island, some students completed content related to
observational and others experimental studies. For this and ethical reasons, all students had some
exposure to the PBL which could have in turn enhanced thinking characteristics on later
comparisons of treatments (Baglin, 2013). Baglin hoped to find evidence to support stronger
statistical thinking for students who completed specific portions of the PBL. Quantitative
analysis found no significant difference between students’ statistical thinking of observational
and experimental studies using the PBL Island (Baglin, 2013).
DelMas (2004) discussed how the relationship between literacy, reasoning, and thinking
could be very difficult if not impossible to separate through only the content of a problem. The
goals of a statistical task however were much easier to separate into literacy, reasoning, and
thinking (delMas, 2002). DelMas (2004) described a person who uses statistical thinking as “a
person who knows how and when to apply statistical knowledge” (p. 85). This then creates the
justification that statistical thinking and reasoning were not separate in human cognition, but
were relevant to the task or problem posed by the instructor. Statistical problems and tasks posed
by the instructor should represent goals of the instructor (Garfield & Chance, 2000). DelMas
(2002) diagrams in Figure 3 illustrate the difficulty in separating the concepts of literacy,
reasoning, and thinking in statistics education.

26
Figure 3. Two different views of the relationship of literacy, reasoning, and thinking as proposed
by delMas (2002).
Though delMas (2002) did not propose literacy, reasoning, and thinking to be hierarchal,
their descriptions fall in close relationship to Bloom’s Taxonomy (Marriott, Davies, & Gibson,
2009). DelMas (2002) suggested that statistical literacy allows students to identify, describe,
rephrase, translate, interpret, and read statistics; statistical reasoning allows students to explain
the process of statistics such as why and how; and statistical thinking allows students to apply,
critique, evaluate, and generalize statistical situations. Similarly, Shaugnessy, Chance, and
Kranendonk (2009) used words such as describing, analyzing, explaining, looking for structure,
considering, creating, questioning, evaluating, noticing, understanding, connecting, determining,
determining plausibility, and validating to describe habits of mind that illuminate statistical
reasoning. These views of statistical learning fall in line with Bloom’s Taxonomy and Depth of
Knowledge (citation) assessment levels of tasks. These levels have been shown to be hierarchical
in student understanding but debate has been given over whether these levels are progressive

27
(Marriott, Davies, & Gibson, 2009). Figure 4 illustrates the relationship between Bloom’s
taxonomy and statistical literacy, reasoning, and thinking.
Figure 4. Litearcy, reasoning, and thinking taxonomy triangle.
The relationship of statistical tasks to thinking, reasoning, and literacy is also aligned
with many studies observing students’ conceptions of statistics (Reid & Petocy, 2002; Bulmer
and Rolka, 2005; Bond, Perkins, & Ramirez, 2012); they also align with delMas’ (2002)
diagrams shown in Figure 3. The proposed model is more hierarchical than linear and relates to
the recommendations of the GAISE report (Franklin et. al, 2007). The GAISE report suggested
that the development of student conceptions of formulating questions, collecting data, analyzing
data, interpreting results, and understanding variability must begin at level A and develop into
level C (Franklin et. al, 2007). Though level C was not explicitly described as statistical thinking,
guidelines at level A do not require procedures for each process component, but encourage
students to observe association in displays, note differences, and display variability (Franklin et
Thinking
apply, critique, evaluate, generalize, create, justify,
question,
Reasoning
analyze, explain, look for structure, consider, understand, connect,
determine plausibility, and validate
Literacy
apply, identify, describe, rephrase, translate, determine, interpret, and reading

28
al., 2007). Students at level A develop data sense by bringing data into context, generating
questions of interest, analyzing with basic tools, and making informal inferences (Franklin et. al,
2007).
Though these criteria for task difficulty were hierarchical in nature, there were conflicting
views on whether the development of these cognitive skills is linear (Marriot, Davies, & Gibson,
2009; Krathwohl, 2002). The general view from researchers in mathematics education (Pesek &
Kirshner, 2000/2002), as well as statistics education (Garfield & Ben-Zvi, 2008; Chance, 2002;
Feldman, Konold, & Coulter, 2000; Mokros & Russell, 1995), was that incorporating tasks at
higher levels of difficulty also promotes understanding and limit numbers of misconceptions.
Researchers in this area however have been quick to highlight Vygotsky’s (1978) zone of
proximal development, which requires that tasks or activities introduce limited amounts of new
information to students while connecting to prior knowledge in order to ensure cognitive
development.
Though literacy, reasoning, and thinking are intertwined, tasks can be categorized by the
levels of statistical literacy, reasoning, and thinking (delMas, 2004). It is therefore hypothesized
that as teachers’ goals shift towards higher levels of student statistical understanding--that is,
reasoning and thinking--their learning environments should also shift (Chance, 2002; Garfield &
Ben-Zvi, 2008). Introductory statistics classes should move beyond simple literacy, the
interpretation of certain statistics correctly by a student, to statistically thinking and providing
proper reasoning for abstract statistical ideas. Students who think statistically can make sound
judgments about the creation of a statistical experiment from its creation to interpretation and can
look backwards and forwards toward improvement. Students who reason statistically can justify

29
their responses and provide responses to solutions that go beyond surface level understanding of
statistical concepts.
Cognitive Barriers to Statistical Learning
Though statistical questions, data collection, data analysis, and making conclusions seem
to be linear, these standards are interdependent and cyclic in nature (Konold & Higgins, 2003;
Marriott, Davies & Gibson, 2009). This interdependency also requires students to use a habit of
mind that may be unfamiliar to them (Shaughnessy, Chance, and Kranendonk, 2009; Baglin,
2013). Students who think statistically anticipate the statistical process to pose answerable
questions as well as look backwards during the process to monitor digression from the problem,
potential problems with earlier steps in the statistical design, and ways to enhance the design in
the future (Shaughnessy, Chance, and Kranendonk, 2009; Chance, 2002). These habits of mind
in statistics may also create difficulty in student learning, faulty reasoning, or misconceptions at
different times during instruction (Baglin, 2013). The following section reviews certain
misconceptions students may bring to the table in statistical questions, data collection, data
analysis, and making conclusions.
Asking Questions. Many students have difficulty in the development of a statistical
question. Students at an early level have been encouraged to collect data and describe the
collection of data from a mathematical or descriptive position (Franklin et. al, 2007). For
example students may ask, “What percent of the M&Ms are green,” “What percent of the class is
male,” or “How many students ride the bus?” These students do not anticipate variability within
their questions but rather answer mathematical questions that are then displayed. Moving
students away from descriptive questions to statistical questions is important in order to move to
the next phase of statistical objectives (Franklin et. al, 2007). Better questions for students may

30
be were there more green candies in a bag of M&Ms than any other color (Froelich, Stephenson
& Duckworth, 2008), “Are there a larger percent of males in every class at the school” or “How
many students ride the bus on a given day?” These type of questions anticipate variability and
look for quantitative comparisons.
Once students have learned and are able to anticipate variability within their questions,
difficulty can still arise within the interdependence of the statistical process. “Often in trying to
make a question more precise, students lose track of what they want to know in the first place”
(Konold & Higgins, 2003, p. 195). Of similar confusion, students and teachers tend to use data to
serve as pointers to themselves, friends, or the more complex event creating a case-oriented view
(Konold, Higgins, & Russell, 2000 as cited in Konold and Higgins, 2003; Prodromou & Pratt,
2006; Jacobbe, 2007). Connecting data and graph values is important for younger students
through pictographs and other elementary content objectives. Similarly, moving students to the
understanding that data can become objects that can be manipulated and queried, independent of
the actual event, pushes students to think and reason statistically (Konold & Higgins, 2003).
Konold and Higgins (2003) stated that students should view the process of asking a question as
an opportunity to gain more insight into the world around them rather than representing
themselves as a key element to progression within statistical reasoning.
Students who abstract data very well for manipulation may easily fall into the pitfalls of
losing the context of the question, however (Lehrer & Romberg, 1996). Lehrer and Romberg
(1996) described students analyzing lunch menus for elementary students and those who
participate to find association between item choices and preference; however, students failed to
look at the relationship between similar items within the data set. Students described by Lehrer
and Romberg (1996) abstracted their data so much that they fell away from the context; the
31
students failed to relate similar items in their data set. DelMas (2004) described the importance
of context in statistics and the difficulty of removing this context from statistical problems for
students during mathematical generalization. For this reason, context within statistics must be
handled with care as to help provide mathematical generalization and abstraction but at the same
time be considered during the statistical process.
Data Collection. Another important part of developing a statistical question lies in the
understanding of the “population of interest” and how to sample that population appropriately.
Jacobs (1998/2002) found that nearly a third of her students could not differentiate between
biased and unbiased sampling techniques after being confronted with conflicting data results.
These students based their decisions on personal experience or the experience of others (Jacobs,
1998/2002). Nonbiased sampling techniques are at the heart of good experimental designs, yet
many students have had difficulty accepting ideas that a sample is representative of a population
and have been skeptical of using random sampling techniques (Schwartz, Goldman, Vye, &
Barron, 1998).
Cobb and Moore (1997) discussed the importance of students understanding of
randomness in data collection and experimentation as contributions to causation within studies.
In introductory statistics, an important concept for students to differentiate has been the
difference between an observational and experimental study (Cobb & Moore, 1997; Prodromou
& Pratt, 2006). Baglin (2013) also found student difficulty in students’ ability to think
statistically about experimental and observational designs. Baglin (2013) suggested the use of
Project Based Learning to increase student thinking of observational and experimental designs.
Though Baglin’s (2013) study did not provide statistical evidence for generalization, qualitative
analysis suggested increase in conceptualization of experimental and observational studies.

32
Prodromou and Pratt (2006) reported that students have a strong attachment to a case-
oriented view during data collection. To reduce this case oriented view, Prodromou and Pratt
(2006) suggested a data centric perspective devoted to the understanding of variation and shape
the through sampling processes. Prodromou and Pratt (2006) used a Microworld simulation of a
basketball player shooting baskets into a goal that was controlled by sliders. These sliders
controlled the shooters distance from goal, release height, release speed, and release angle
(Prodromou & Pratt, 2006). Though each one of these characteristics were interconnected and
played a part of having a successful throw, not just one played a key casual role on the successful
attempt of making a basket (Prodromou & Pratt, 2006). In addition to these controls for the
students, random error was included in the model of ringing the basket, so reiterations of the
same shooting paths could have slight variations (Prodromou & Pratt, 2006). Students taking
place in this experiment were able to see characteristics of a shooting path that were causal and
those that were not. Students were also able to see how these variables related to one another.
Prodromou and Pratt (2006) showed how moving students to a data centric environment could
help in reducing student misunderstanding of correlation and causation.
Analyzing Data. Once data is collected and analysis begins, many students at the tertiary
level recollect methods of analysis they have learned in elementary and secondary schooling
(Cobb and Moore, 1997). Konold, Pollatsek, Well, and Gagnon (1997) elaborated the difficulty
for introductory statistics students to choose an analysis procedure for comparing distributions
because of their reliance on the curricula and teacher instead of basing judgments on exploratory
data analysis or the answering of a question. Cobb and Moore (1997) stated that students cannot
automatically read and interpret graphs and disaggregate the use of central and spread analysis

33
procedures any better than they can read and write equations in mathematics. For this reason, it is
paramount for teachers to build conceptual understanding of statistical analysis procedures.
Often in mathematics as well as statistics, teachers have introduced procedures before
students have had a chance to understand conceptually its use, thus interfering with conception
(Pesek & Kirshner, 2000/2002). “Educators often encourage students to use plots and summaries
before they sufficiently understand them and, by doing so, effectively pull the rug from beneath
them” (Feldman, Konold, Coulter, & Conroy, 2000, p. 119). Mokros and Russell (1995)
described 2% of third graders, 85% of sixth graders, and 90% of ninth graders referring to the
standard mean algorithm when asked about how weather forecasters determine average
temperatures. Additionally Mokros and Russell (1995) suggested that those students who were
prematurely introduced to the standard algorithm for means generally misunderstand,
misinterpret, and misapply it conceptually.
Another important idea for students when analyzing data is choosing graphs and scales to
aid in analysis. Shaughnessy, Chance, and Kranendonk (2009) described students analyzing data
sets of the geyser, Old Faithful. The interesting aspect of this discussion focuses on how the
change in scale presents two different stories. At a smaller scale, students were able to see a
bimodal histogram, but at larger scales, the data appears to have only one mode. Konold and
Higgins (2003) highlighted the fact that not any one representation is necessarily better than
another, but some graphs lead to different analyses of the data.
Shaughnessy, Chance, and Kranendonk (2009) focused student reasoning on the
comparison of two different scatter plots of Olympic 200m race times of males and females.
When the data were plotted separately and on different scales, students were less likely to make
comparing statements between the two predictive models and reasoning for extrapolation errors

34
(Shaughnessy et. al, 2009). In addition, Konold and Higgins (2003) reported student
misconceptions and difficulty on the creation of scales on graphs. These graphs only included
actual numbers from the data thus lacked extension or ability to decide on how to graph to justify
a question they were intending to answer (Konold & Higgins, 2003). The analysis of data
graphically is a key component to extending student reasoning to variation and covariation.
When analyzing spread of data, Konold and Higgins (2003) suggested using tools such as
Tinker Plots and Core Math Tools that allow students to place plots side by side and on the same
scale. Students were able to relate different graphs to one another and understand that each graph
helps tell a different story of center, shape, and spread (Konold & Higgins, 2003). The use of
graphs also allow for students to explore covariation between two variables as well. Noss, Pozzi,
and Hoyles (1999) discussed how practicing nurses could not readily see a relationship between
increase in age and blood pressure; however, when the researchers prompted the nurses to make
vertical separations in the data to disaggregate age, nurses perceived a trend showing that the
covariability in the data was masking the overall relationship. Noss, Pozzi, and Hoyles’ (1999)
study demonstrates the importance of students developing understanding of bivariate graphs and
their relationship to univariate parameters.
The GAISE report advocated a similar approach to helping students understand the
analysis of an r value through a quadrant count ratio (Franklin et. al, 2007). The GAISE report
describes the construction of vertical and horizontal dotted lines for the mean values of the x-axis
and y-axis (Franklin et. al, 2007). This creates four quadrants within the bivariate scatter plot in
which students can count the number of data points that fall in each of the four quadrants
(Franklin et. al, 2007). A ratio is then created that produces a perfect 1 relationship if all data
points were in the upper right and lower left quadrants showing a positive relationship and a

35
perfect -1 relationship if all points were in the upper left and lower right quadrants (Franklin et.
al, 2007). When students complete this activity, they have an opportunity to develop
understanding of how the covariation between the two variables relate to the association between
the two mean values in the quadrant count ratio and are more able to extend this knowledge to a
conceptual understanding of Pearson’s R (Franklin et. al, 2007).
Making Conclusions. No one would argue that probability plays a fundamental role in
analyzing and making conclusions in statistics; however, the emphasis in introductory statistics
courses has been suggested to be limited (Cobb and Moore, 1997; Shaughnessy, 2003). Cobb
and Moore (1997) argued that “informal probability was sufficient for a conceptual grasp of
inference" and that “probability is conceptually the hardest subject in elementary mathematics”
(p. 821). Former NCTM president and leading researcher in the area of probability was
questioned about the most important concepts in statistics education. He mentions only long-
range relative frequency and the power of simulations to estimate probability as important
probabilistic concepts (Rossman & Shaughnessy, 2013). Cobb and Moore (1997) described how
the understanding of sampling distributions, the reiteration of many experimental samples,
underlie all of the introductory statistics conceptual ideas. Similarly, Chance and Rossman
(2006) described the use of technological tools for sample distributions and simulating and
making informal inference to help develop conceptual understanding of p-values and confidence
intervals. For these reasons, Cobb and Moore (1997) and Shaughnessy (2003) encouraged
teachers to focus on the conceptual understanding of sampling distributions, an essential idea of
statistics, rather than try to illuminate how formal probability relates to statistics.
When drawing conclusions, the use of null and alternative hypothesizes are extremely
important (Cobb & Moore, 1997). Based on this idea and lack of formal probability, sampling

36
distributions play a fundamental role in students making appropriate conclusions when
performing statistical tests or creating confidence intervals. Schwarz and Sutherland (1997)
described using a capture-recapture experiment to illustrate the concept of a sampling
distribution and computer simulation to investigate the estimation of a population parameter.
This in essence helps remove some of the “black magic” many students describe during
statistics. Similarly, Lunsford, Rowell, and Goodson-Espy (2006) highlighted the importance for
students to use these simulation tools to develop understanding of sampling distribution instead
of the teacher just demonstrating these simulation tools.
If statistics was seen as climbing a ladder, students’ ability to compare two groups should
land somewhere midway on that ladder, according to Konold and Higgins (2003). Students often
have difficulty knowing how to compare two groups even when they know a great deal about
averages (Konold & Higgins, 2003). As students compare two groups, they tend to move
towards comparisons of what was typical using modal clumps, yet lack the ability to look at the
difference in typical values from the two groups (Bright & Friel, 1998). Using averages to
compare two groups requires students to view averages as a way to represent the entire group
and not just parts of it (Konold & Higgins, 2003). Dambolena (1986) along with Gordon and
Gordon (1989) encouraged the use of simulation and graphics to look for the differences between
two populations; however, not all differences are between two quantitative variables.
When students analyze data in contingency tables, they often only look at the marginal
distribution to decide for association in affect only comparing the percent of times two events
occur and in essence lack the ability to understand covariation (Konold & Higgins, 2003). Kader
and Perry (2007) discussed the role that variability plays in categorical variables and how the use
of the coefficient of “unalikability” can be used to develop reasoning behind other statistical

37
tests. Shaughnessy and Chance (2005) provided ideas for students to develop the understanding
for degrees of freedom in chi-square tests by having students finish completing contingency
tables to develop common formulas found for tests of dependence and homogeneity and the
understanding of degrees of freedom in these procedures.
To promote deep statistical learning, it is important for teachers to grapple with certain
cognitive misconceptions that may develop or have developed over time. This section has
highlighted four major areas in the statistical process conclusions that students have cognitive
difficulties in developing learning: asking questions, data collection, analyzing data, and making.
However, difficulties in learning of mathematics and statistics are not limited to cognitive
difficulties. The next section highlights affective barriers that have played a part in the learning
of mathematics and statistics.
Affective barriers to learning
Research has shown that mathematical classrooms have been seen as boring and
unimportant to many students’ everyday lives (Mitchell, 1993). This negative view has
contributed to the decline of mathematics performance in the United States (Mitchell, 1993;
National Mathematics Advisory Panel, 2008). The number of students engaging in rigorous
mathematics courses and pursuing fields in Science, Technology, Mathematics, and Engineering
(STEM) careers were not meeting demands from the contemporary world (National Mathematics
Advisory Panel, 2008; Middleton and Jansen, 2011). These discrepancies were even more
dramatic when comparing subpopulations by race and gender in the United States (Flores, 2007).
Kilpatrick, Swafford, and Findell (2001) stated that “habitual inclination to see
mathematics as sensible, useful, and worthwhile, coupled with a belief in diligence and one’s
own self efficacy” encompasses productive disposition. For this reason, it is important for

38
teachers to not only focus on the learning of statistics in the cognitive domain, but also the
affective domain. This section examines at ways in which researchers have chosen to monitor the
affective domain or productive disposition within statistics. Explanation may also be found in
students’ prior knowledge of statistics, pre-conceived notions of statistics, and relationship to
student experiences (Griffith, Adams, Gu, Hart, & Nichols-Whitehead, 2012; Schraw,
Flowerday, & Lehman, 2001). The discussion begins by highlighting some important definitions
in the understanding of the affective domain related to and outside of mathematics education.
This is followed by a review of measurement instruments developed to monitor the affective
domain in statistics education and research in this area. This section concludes with a discussion
of research that has been done conducted on the development of students’ attitudes towards
mathematics and statistics.
Definitions. Research related to interest has spanned through multiple content domains,
but the area of mathematics has been especially targeted by researchers outside the field of
mathematics education (Garofalo & Lester, 1985; Zan, Brown, Evans, & Hannula, 2006;
Middleton & Jansen, 2011). Middleton and Jansen (2011) suggested that the study of interest has
been a focus in the mathematics community by psychologists because of no significant
differences being found in the learning of mathematics with other subjects; however, common
perceptions of being “good” or “not good” in mathematics are rampant. The study of students’
interest in mathematics has led to descriptions of interest as being described as situational or
personal.
Situational and personal interest. Situational interest was what many researchers dub as
the aspect of interest that can be changed in the classroom by instructional methods. The teacher
can promote these changes in students spontaneously, transitorily, or environmentally (Schraw,

39
Flowerday, & Lehman, 2001). Schraw, Flowerday, and Lehman (2001) described situational
interest as being different from personal interest. Personal interest was more related to a persons’
internal motivation to learn or do mathematics. Mitchell (1993) described situation interest as the
single best way to increase student interest in mathematics as though personal interest was purely
controlled by the student. The increase in situational interest has been correlated to teachers who
increase student autonomy and choice (Schraw, Flowerday, & Lehman, 2001). Similarly,
situational interest has been related to student’s prior knowledge of the subject and problem
(Schraw, Flowerday, & Lehman, 2001). For these reasons, it is not only important to teach
students cognitively, but affectively (Middleton & Jansen, 2011). Classroom environments that
promote appropriate student discussion, respect students ideas and curiosity, respect and
responds to diverse experiences and interests, and encourage full participation by all students are
much more likely to provide the means necessary to increase situational interest (Middleton &
Jansen, 2011; Smith and Stein, 2011; NCTM, 1991).
Metacognition, mathematical task knowledge, and mathematical strategy knowledge.
Metacognition “has two separate but related aspects: (a) knowledge and beliefs and cognitive
phenomena, and (b) the regulation and control of cognitive actions” (Garofalo & Lester, 1985).
Metacognition therefore directly relates to student interest in subject matter. Metacognition is
what controls for students’ belief in what they like about, understand of, or affection towards
mathematics and statistics. Garofalo and Lester (1985) categorized metacognition into
knowledge of cognition and regulation of cognition. Studies in this area have had large criticism
because data gathering methods require self-reporting (Garofalo & Lester, 1985). Self-reporting
may interfere with the cognitive process, and lacks of clear definitions provide trouble for
scientific investigation (Garofalo & Lester, 1985).

40
Very similar to metacognition in the psychological realm is the term mathematical task
knowledge in the mathematics education realm (Garofalo & Lester, 1985). Mathematical task
knowledge includes what one believes “about the subject of mathematics as well as beliefs about
the nature of mathematical tasks” (Garofalo & Lester, 1985, p. 167). This is different than
mathematical strategy knowledge, “a person’s awareness of strategies to aid in comprehending
problem statements, organizing information or data, planning solution attempts, executing plans,
and checking results” (Garofalo & Lester, 1985, p. 168). Metacognition and mathematical task
knowledge have significant impact on student motivation and interest (Garofalo & Lester, 1985).
Garofalo and Lester (1985) showed that attempts to understand interest and motivation are
slippery, and that any attempt should control for factors in students prior mathematical and
statistical knowledge.
Intrinsic and extrinsic motivation. Intrinsic and extrinsic motivation is motivational
terminology commonly referred to across educational disciplines and psychology. Intrinsic
motivation relates to a student’s encouragement to complete a task, do a homework assignment,
etc. based purely on the students own self-interest or satisfaction (Middleton & Jansen, 2011;
Sengondan & Iksan, 2012). Extrinsic motivation arises from teachers, family, other students, the
environment, etc. (Middleton & Jansen, 2011; Sengondan & Iksan, 2012). These motivational
techniques may come in the form of praise, rewards, gifts, and good grades (Middleton &
Jansen, 2011; Sengondan & Iksan, 2012). Studies have shown that extrinsic motivation can work
temporarily, but if overused can negatively affect student achievement (Sengondan & Iksan,
2012). In order to encourage student pursuit of and achievement in mathematics and statistics,
students’ intrinsic motivation must be increased. Middleton and Jansen (2011) suggested that the

41
context of a problem can increase student motivation and more specifically increase student
intrinsic motivation.
Measuring interest. The focus and methods of much of mathematical and statistical
interest research has been on the creation and monitoring of students by student attitudinal
surveys (Zan, Brown, Evans, & Hannula, 2006). The Statistics Attitude Survey, Attitude
Towards Statistics, Survey of Attitudes Toward Statistics (SATS36), and Expectant Value
Theory scale have been validated as methods to understand students’ perceptions of statistics
(Ramirez, 2012; Schau, & Emmioglu, 2012). Though many of the studies directly related to
interest contain these attitudinal surveys, many qualitative studies also directly deal with
students’ perceptions of mathematics and its connection to their lives (Boaler, 2002, 2011). The
distinction between these two types of research was largely based on the connection of student
interest terminology and the focus of studies.
Schau and Emmioglu (2012) explored how introductory statistics courses affect student
attitudes in the United States through voluntary sampling of students throughout the United
States. Using the SATS36 (VanHoof, Kuppens, Castro Sotos, Verschaffel, & Onghena, 2011)
containing 7-point Likert scale items, students in Schau and Emmioglu’s (2012) study completed
pre and post surveys in their introductory statistics courses. A total of approximately 2200
students and 101 sections completed the survey (Schau & Emmioglu, 2012). Their results
showed that introductory statistics courses throughout the United States had no significant effect
on attitudes toward affect, cognition, competence, and difficulty of statistics (Schau &
Emmioglu, 2012). Value, interest, and effort actually showed decreases at the national level.
Internal consistency was critiqued and all correlations with the below measures were larger than
.76, showing strong validity in measurement of the phenomenon (Schau & Emmioglu, 2012).

42
1. Affect (6 items) – students’ positive and negative feelings concerning statistics – “I am
scared by statistics.”
2. Cognitive Competence (6 items) – students’ attitudes about their intellectual knowledge
and skills when applied to statistics – “I can learn statistics.”
3. Value (9 items) – students’ attitudes about the usefulness, relevance, and worth of
statistics in personal and professional life – “I use statistics in my everyday life.”
4. Difficulty (7 items) – students’ attitudes about the difficulty of statistics as a subject –
“Most people have to learn a new way of thinking to do statistics.”
5. Interest (4 items) – students’ level of individual interest in statistics – “I am interested in
using statistics.”
6. Effort (4 items) – amount of work the student expends to learn statistics – “I plan to work
hard in my statistics course.” (Schau & Emmioglu, 2012)
Carnell (2008) performed a study to determine differences in attitude and achievement
using the SATS36 (VanHoof et. al, 2011). Carnell (2008) treated or assigned random classes a
group statistical project while leaving other classes untreated. To ensure treatment affects were
based solely on the given project, little in-class time was devoted to the project. No significant
differences were found between the two classes in end of course evaluations and student interest
in statistics.
Bond, Perkins, and Ramirez (2012) explored students’ attitudes, conceptualizations, and
content knowledge of statistics by using the SATS36 instrument and qualitative analysis of 47
students in an introductory college statistics course. Bond, Perkins, and Ramirez (2012) coded
qualitative data in a hierarchical fashion related to content knowledge and conceptualizations.
This coding showed significant improvement in students perceived content knowledge and

43
conceptions of statistics after taking a statistics course; however, data from the SATS-36 suggest
attitudes did not change (Bond, Perkins, & Ramirez, 2012). Even after coding implied increased
conceptualization, usefulness and value strata in the SATS-36 actually lowered from pre to post
surveys. Bond, Perkins, and Ramirez (2012) suggested that the fuzziness of the word statistics
might affect the validity of attitudinal surveys. This may indeed be true based on students’ lack
of experience in introductory statistics courses.
Bond, Perkins, and Ramirez (2012) found differences largely in the cognitive ability of
students to understand statistics with no differences in the affective domain. Bond, Perkins, and
Ramirez (2012) made plausible concern for what does positively affect student interest in
mathematics and especially statistics. The difficulty, however, was student’s preconceived
notions of statistics. Reid and Petocy (2002); Bulmer and Rolka (2005); Bond, Perkins, and
Ramirez (2012) described students entering an introductory statistics course with very little
adequate conceptions of statistics and finishing courses with a much clearer definition. When
students come into classes with very little knowledge of what statistics means, pre and post
attitudinal surveys lose validity effectiveness results. With this knowledge, pre and post
quantitative assessments of the affective domain must be considered with care.
Research outside of mathematics and mathematics education has also confirmed results
that undergraduate students have negative conceptions of statistics and mathematics before and
after completing courses (Griffith et. al, 2012). Undergraduate students many times leave
statistics as one of their final courses because of the perceived difficulty, reporting that statistics
was an obstacle to obtaining their degree (Griffith et. al, 2012). Similarly, many postgraduate
students do not feel adequately prepared to report findings from their own research and to
understand the research of others. NCTM’s publication of Lessons Learned from Research

44
(Sowder & Schappelle, 2002) to make mathematics education research more readable for
practicing teachers is a direct example of efforts that have been made to make research more
understandable to practitioners.
Increasing Interest. Mitchell (1993) suggested two motivational strategies to encourage
students’ interest and motivation called catch and hold. The incorporation of techniques such as
games, group work, puzzles, the use of technology and computers were methods Mitchell (1993)
described as catches. Pedagogical catches are ways to promote interest or stimulate student
participation, but do little to affect student intrinsic or personal motivation (Mitchell, 1993). Hold
strategies involve creating meaningfulness to a problem and involvement in the process of
learning (Mitchell, 1993). These strategies empower students toward an end of accomplishment
and make use of the structure and methods being implored (Mitchell, 1993). Gal and Ginsburg
(1994) suggested the same approach for improving motivation with statistical instruction.
Incorporating the usefulness of statistics to students’ everyday lives by diving into questions
students are interested about may positively increase student perceptions of statistics.
Research on statistical interest has suggested that situational interest may also relate to
students’ statistical or mathematical background and students’ perceived relatedness to their
college major (Griffith et. al, 2012). Though Griffith et. al (2012) included some qualitative
aspects pertaining to reasons for lack of statistical interest, pedagogical techniques used by
instructors were not controlled for or monitored. Perhaps techniques in the classes in this study
did not provide environments that foster reasoning and sense making, respect for ideas by all
students, and the chance to build on prior knowledge (NCTM, 1991; Smith & Stein, 2011).
Griffith et. al (2012) suggested providing more context for problems with limited
attention to pedagogical techniques. Griffith, et. al (2012) attempted to improve students’

45
interest, but introduced an important confounding factor related to pedagogy. Though context
may produce increases in student situational interest, closer attention to teaching in addition to
situational interest may have longer lasting effects of students’ interest and ability in statistics
(NCTM, 1991; Smith & Stein, 2011). Incorporating strategies that develop the context of
problems has also been shown to help English Language Learners in introductory statistics
courses (Lesser & Winsor, 2009). Boaler (2002, 2011) suggested that allowing students to
grapple with problems that encourage practical implications to their everyday lives increases
their perception of mathematical task and strategy knowledge, empowers students to use and
view mathematics positively, and promotes the use of mathematics in their everyday lives. In
addition to not controlling for pedagogical techniques, Griffith et. al (2012) did not control for
confounding factors of more mathematically proficient students encompassing specific majors.
Any study attempting to understand the phenomena of interest will improve in rigor by including
cognitive aspects of the students and pedagogical techniques used by the instructor.
Though statistics and mathematics are different, they complement one another (delMas,
2004). Research involving statistical interest could easily be confounded with mathematical
interest (Bond, Perkins, & Ramirez, 2012). This makes the distinction of affection mathematics
and statistics very challenging to discriminate. Though they are different, research in these two
areas can also be very similar and used to build and strengthen existing research. It has been
hypothesized that the use of best teaching practices from mathematics classrooms such as
discourse and appropriate tasks to teach statistics can promote student understanding and interest
in statistics (Boaler, 2002, 2011; Middleton & Jansen, 2011; Smith & Stein, 2011). Many
projects looking into the development of student interest and understanding in statistics do not
attempt to teach in a constructivist manner in which students build up their own knowledge from

46
authentic experiences with statistical content. Much of the research to date does little to integrate
the effect of teaching and learning methods in statistics with increases in motivation. For this
reason, a more detailed look into the influence of pedagogical techniques used during statistical
instruction on student interest would be worthwhile.
Summary
This section has highlighted the differences and similarities in statistical literacy,
reasoning, and thinking. Each of these plays a fundamental role in students’ understanding of
statistics. In particular, statistically literate students can read, write, and interpret statistics
(Rumsey, 2002). Students who reason about statistics are able to make connections and express
these relationships between statistical concepts (Chance, 2002; Chance & Garfield, 2002).
Students who have the ability to think statistically are able to critique, question, and develop
statistical designs in order to improve their understanding (Chance, 2002; Chance & Garfield,
2002; Garfield, 2002). The goals of literacy, reasoning, and thinking are interconnected (delMas,
2002). In order for students to develop at each of these levels, direct attention must be played to
these certain goals.
Barriers for learning at these different levels have also been discussed from both the
cognitive and affective domains. Though these barriers exist, they can be overcome. Teachers’
attention to common misconceptions in the learning process can help students’ develop
reasoning and sense making and reduce errors in reasoning before they occur in students (Baglin,
2013; Konold & Higgins, 2003; Loveland, 2014). Teachers can diminish affective barriers by
increasing student interest through catch and hold strategies of real world contexts that interest
students and provide meaning to their real lives (Mitchell, 1993; Griffth et. al, 2012). The next

47
section highlights effective teaching practices that address learning at deep levels, reducing
student misconceptions, and promoting interest towards mathematics and statistics.
Teaching Statistics
The Principles to Actions (NCTM, 2014) describes eight mathematics teaching practices
that are effective in promoting student learning: Establish mathematics goals to focus learning,
implement tasks that promote reasoning and problem solving, use and connection mathematical
representations, facilitate meaningful mathematical discourse, pose purposeful questions, build
procedural fluency from conceptual understanding, support productive struggle in learning
mathematics, and elicit and use evidence of student thinking. This section takes a detailed look at
each of these areas in relation to statistics teaching, providing relationships to statistics education
research when available.
Establish Mathematics Goals to Focus Learning
PtA stated that “goals should describe what mathematical concepts, ideas, or methods
students will understand more deeply as a result of instruction and identify the mathematical
practices that students are learning to use more proficiently” (NCTM, 2014, p. 12). This
description of goals by the PtA highlighted both goals towards content and practices. Goals of
practice highlight characteristics that teachers foster in students during instruction.
Standards. Probability and Statistics Units for Junior High Schools (1984) by
Chaweewan Sawetamalya attempted to find “a set of potential objectives for the probability and
statistics units” that were consistent through current mathematical literature and educators in the
1980s (p. 37). His content review focused on literature in the National Assessment of
Educational Progress (NAEP), Priorities in School Mathematics: Executive Summary of PRISM
Project, the 1978 Alabama Course of Study, NCTM publications, American Statistical

48
Association (ASA) publications, mathematics textbooks dealing with probability and statistics in
elementary and secondary levels, and surveys of educators. Using a non-parametric rank based
statistical technique, Sawetamalya (1984) found junior high school statistics had three focuses.
The primary focus of statistics from his study was on interpreting data that were present in forms
such as tables, graphs, charts, diagrams, pictographs, maps, and flowcharts (Sawetamalya, 1984,
p. 42). Following closely behind this large focus was the objective of defining, finding, and
comparing central tendency measurements such as mean, median, and mode (Sawetamalya,
1984). Objectives of spread or dispersion from central tendency measurements were found last in
the ranking system. Reviewing Sawetamalya’s (1984) work highlights the change of core
statistical ideas in the United States, specifically the change in emphasis of variation.
A report by Cobb (1992), published by the Mathematical Association of American
(MAA) support, sought to highlight important issues in statistics by setting up an e-mail focus
group of MAA members. The meeting of MAA members resulted in three large calls for change
in statistics education related to variation. The first call was for an emphasis in statistical
thinking that centered on variation (Cobb, 1992). Two of the four major ideas for statistical
thinking emphasized the “omnipresence of variability” and the “quantification and explanation
of variability” of data in sampling and analysis (Cobb, 1992). This call for change has been seen
in statistical documents such as the PSSM and GAISE report including the conceptual
understanding of variation throughout their standards. In addition, the CCSS-M introduces
variation concepts such as mean absolute deviation as early as sixth grade (NGA & CCSSO,
2010).
Garfield and Ben-Zvi (2008) discussed key components of introductory statistics courses
content as being data, distributions, variability, center, randomness, covariation, and sampling.
49
Shaughnessy, Chance, and Kranendonk (2009) provided six chapters focusing on students’
reasoning and sense making in statistics. These chapters require students to formulate questions,
design and employ a plan for collecting data, analyze and summarize the data, and interpret the
results from the analysis. Gelman and Nolan (2002) summarized their introductory courses into
sampling, descriptive statistics, inference, and probability. Though different wording has been
used across recent research, there are two fundamental similarities in content objectives (Burrill,
Franklin, Godbold, & Young, 2003; Tintle et. al, 2012; Franklin et. al, 2007). The first has been
that student creation and understanding of data sets is pivotal to developing understanding of
inference and omnipresence of variability. The second has been the need for analyzing these data
sets to make useful predictive inferences or summative reports through the understanding of
probability and random designs (Burrill, Franklin, Godbold, & Young, 2003; Tintle et al, 2012).
Content objectives for introductory statistics largely fall into one of these two rather broad areas.
Processes and Practices. Attention to processes and practices in statistics “can benefit
students at all levels by engaging them in doing mathematics in ways that make sense to them”
(NCTM, 2014, p. 66). Effective processes and practices help focus student learning at in depth
levels such as statistical literacy, reasoning, and thinking. These processes and practices should
not be seen as a set of objectives for teachers to check off, but rather tools for students to use to
develop mathematical content proficiency.
Principles and Standards for School Mathematics. The PSSM (2000) identified five
process standards for students to acquire during mathematics instruction: problem solving,
reasoning and proof, communication, connections, and representation. Problem solving requires
students to build new mathematical knowledge through problem solving, solve problems that
arise in mathematics and in other contexts, apply and adapt a variety of appropriate strategies to
50
solve problems, and monitor and reflect on the process of mathematical problems solving. PSSM
(2000) also required students to recognize reasoning and proof as fundamental aspects of
mathematics, make and investigate mathematical conjectures, and develop and evaluate
mathematical arguments and proofs. PSSM (2000) encouraged students to communicate about
mathematics by organizing and consolidating their mathematical thinking precisely and
evaluating and analyzing their own and others thinking. Students should develop an ability to
draw connections outside of mathematics to make a coherent whole (PSSM, 2000). Lastly
students should create and use representations to organize, record, and communicate
mathematical ideas, select, apply and translate among mathematical representations to solve
problems, and use representations to model and interpret physical social, and mathematical
phenomena (PSSM, 2000).
Reasoning and Sense Making Habits of Mind in Statistics. Shaughnessy, Chance, and
Kranendonk (2009) described five habits of mind that help develop reasoning and sense making
in statistics and probability: analyzing a problem, implementing a strategy, monitoring one’s
progress, seeking and using connections, and reflecting on one’s solution (Shaughnessy, Chance,
& Kranendonk, 2009). These five habits of mind help students develop literacy, reasoning, and
thinking in statistics.
Students who effectively analyze a problem are able to find hidden structure in data;
make preliminary deductions and conjectures; analyze and explain variation; and describe
overall patterns (Shaughnessy, Chance, & Kranendonk, 2009). Being able to select and critique
data collection based on their questions; create meaningful data displays and summaries;
consider the random components behind the data; and draw deductions beyond the data are able
to implement strategies effectively (Shaughnessy, Chance, & Kranendonk, 2009). Students who

51
monitor their progress are said to compare various graphical and numerical representations;
compare interpretations of data; evaluate the consistency of an observation with a model;
question whether the observations make sense in the context of the problem; evaluate the
consistency of different components within analysis; and apply the iterative statistical process to
the investigation (Shaughnessy, Chance, & Kranendonk, 2009). By seeking and using
connections to communicate connections between graphical and numerical representations;
recognize common mechanisms of analyses; comprehend the sensitivity of an analysis to
numerous components; and link conclusions and interpretations to the context of the problem
students are able to develop reasoning and sense making (Shaughnessy, Chance, & Kranendonk,
2009). In order to develop reasoning and sense making students should: reflect on one’s
solutions; consider and evaluate alternate explanations; understand the allowable scope of
conclusions; determine whether a conclusion based on the data is plausible; justify or validate the
solution or conclusion by using inferential reasoning; analyzing and account for variability; and
look for connections between the context of the situation and the data (Shaughnessy, Chance, &
Kranendonk, 2009). Though each of these habits of mind are distinct, they are very much
entangled with statistical literacy, reasoning, and thinking.
Common Core State Standards for School Mathematics Practice Standards. CCSS-M’s
inclusion of rigorous practice standards into states content standards have made many teachers
rethink the way they teach mathematics. These practice standards have called for students inside
the classroom to make sense of problems and persevere in solving them, reason abstractly and
quantitatively, construct viable arguments and critique the reasoning of others, model with
mathematics, use appropriate tools strategically, attend to precision, look for and make use of
structure, and look for and express regularity in repeated reasoning (NGA & CCSSO, 2010).

52
These mathematical practice standards were developed from the PSSM (2000) and Kilpatrick,
Swafford, and Findell’s (2001) report, Adding It Up: Helping Children Learn Mathematics.
While these practice standards may seem new to some in education, they fall in close
relationship to PSSM (NCTM, 2000) and statistical literacy, reasoning, and thinking in statistics
education. These mathematical practice standards were developed from the PSSM and the
National Research Council’s report, Adding It Up: Helping Children Learn Mathematics
(CCSSO, 2010). Though these practice standards may seem unique to some in education, they
fall in close relationship to PSSM (NCTM, 2000) and statistical literacy, reasoning, and thinking,
as shown in Table 3.
Table 3
Instructional Practices that Support Development of Statistical Learning
CCSS-M Practice
Standards
PSSM (NCTM,
2000)
Habits of Mind in FHSM Helps
Develop
Statistical…
1. Make sense of
problems and persevere
in solving them.
Problem Solving
Communication
Representation
Analyzing a problem,
implementing a strategy,
monitoring one’s progress,
seeking and using
connections, and reflecting
on one’s solution
Reasoning
and Literacy
2. Reason abstractly
and quantitatively.
Problem Solving
Reasoning and Proof
Implementing a strategy and
monitoring one’s progress
Reasoning
and Literacy
3. Construct viable
arguments and critique
the reasoning of others.
Reasoning and Proof
Communication
Representation
Reflecting on one’s solution
and
monitoring one’s progress
Thinking,
Reasoning,
and Literacy

53
4. Model with
mathematics.
Problem Solving
Reasoning and Proof
Connections
Representation
Seeking and using
connections and
implementing a strategy
Reasoning
and Literacy
5. Use appropriate
tools strategically.
Problem Solving
Representation
Connections
Implementing a strategy,
seeking and using
connections, and reflecting
on one’s solution
Thinking,
Reasoning,
and Literacy
6. Attend to precision. Problem Solving
Communication
Analyzing a problem Literacy
7. Look for and make
use of structure.
Problem Solving
Reasoning and Proof
Connections
Analyzing a problem Reasoning
and Literacy
8. Look for and express
regularity in repeated
reasoning.
Problem Solving
Connections
Reasoning
and Literacy
Implement Tasks that Promote Reasoning and Sense Making
NCTM’s (2014) second practice said that effective teaching engages students in solving
and discussing tasks that promote reasoning and problem solving and allow for multiple entry
points and varied solution pathways. When students have multiple pathways and entry points to
solve problems, lessons become differentiated and have the ability to reach a diverse range of
students. Students meeting this second practice are allowed to build on one another’s
understanding and critique the reasoning of others. In addition, Smith and Stein’s (2011) 5
Practices for Orchestrating Productive Mathematics Discourse relies on setting up cognitively
challenging tasks for students.
54
Erlwanger (1973/2004) suggested that meaningful mathematics should foster
opportunities to discover patterns, seek relationships, generalize, and verify mathematical
concepts and principals. Erlwanger (1973/2004) took a detailed look at the progress of Benny, a
successful and fast tracking student in an Individually Prescribed Instruction (IPI) mathematics
program. The IPI program was very similar to remedial math courses taught at the junior
colleges in which learners were self-paced on their own needs and work to answer questions in
which a specific answer was expected from a practiced algorithm (Erlwanger, 1973/2004). These
programs, when used exclusively from teaching, encourage learners to guess and check or
essentially be on a “wild goose chase” for answers, as Benny says (Erlwanger, 1973/2004, p. 53).
As a result, Benny created his own rules and algorithms for computing solutions in which
many were incorrect and use no sense making (Erlwanger, 1973/2004). His cognition of
mathematics was based on rules in which meaning was pointless (Erlwanger, 1973/2004). When
confronted with conflicting views of his mathematical sense and algorithms, Benny based his
rules on format issues of answers in the program (Erlwanger, 1973/2004). Later discussions with
Benny suggested that manipulatives should be used to address his misunderstandings as his
understanding of problems lacked any number sense (Erlwanger, 1973/2004). Benny’s situation
highlights the need for students to develop reasoning and sense making from tasks and hands on
manipulatives that build conceptual knowledge rather than use formulas haphazardly.
Froelich, Stephenson, and Duckworth (2008) described a set of tasks involving M&Ms
that can be used to encompass the entire introductory statistics course. Froelich et. al (2008)
activity started with students understanding the difference between quantitative and qualitative
data through actual sampling of M&Ms, next proceeded to measuring weight of the M&Ms to
discover the normal distribution and empirical rule, thirdly predicted bag weight based on using

55
the individual weight of candies, and lastly designed an experiment to predict bag weight and
individual M&M weight. Froelichs et. al’s (2008) activities using a similar experiment can
potentially reduce confusion for students changing contexts of problems throughout the class,
however this also has drawbacks. Not allowing students to perform experiments from multiple
contexts reduces the importance of how important context is in statistics and the chance to build
students situational and personal interest.
Focus in High School Mathematics: Reasoning and Sense Making in Statistics and
Probability (FHSM) by Shaughnessy, Chance, and Kranendonk (2009) provided six different
tasks for teachers to develop reason and sense making in high school statistics and probability.
Though each of these tasks focus on certain statistical objectives, they had similarities in
structure (Shaughnessy, Chance, Kranendonk, 2009). Each of FHSM’s (Shaughnessy, Chance,
Kranendonk, 2009) tasks focused on promoting student discourse and building habits of mind.
These tasks allow students to analyze a problem, implement a strategy to solve the problem,
monitor one’s progress in solving the problem, seek and use connections to analyze the problem,
and reflect on ones or others solutions (Shaughnessy, Chance, Kranendonk, 2009).
FHSM (Shaughnessy, Chance, & Kranendonk, 2009) used a mock class discussion to
highlight the use and comparison of range and interquartile range as a measure of spread at grade
9. The student discussion focused on the ranges inability to truly measure spread. Probably the
most strikingly similarity between all of these tasks involves the teacher and student interactions
during the discussion (Shaughnessy, Chance, & Kranendonk, 2009). The discussion was largely
student centered with little interaction from the teacher. This highlights the fact that good tasks
should be student centered and allow for student explorations of important statistical ideas that
builds habits of mind towards statistical reasoning and thinking.

56
Use and Connect Representations
The third teaching practice in PtA stated that effective teaching of mathematics engages
students to make connections among different representations (NCTM, 2014). This allows for
deeper understanding of concepts and procedures. When students use representations to build
deeper understanding, they are able to use representations as tools for problem solving. Statistics
education has highlighted representation through the incorporation of statistical software,
simulation, and internet applets. In addition to computer based randomized experiments and
inference, many educators still use randomized experiments in classes to connect statistical
concepts (Chance & Rossman, 2006; Tintle et. al, 2012; Cobb & Moore, 1997; Rossman &
Chance, 2013; Rossman & Chance, 2002).
NCTM (2014) elaborated on the interconnection of students’ verbal, symbolic, visual,
physical, and contextual representations and the use of each of these representations like a lens
for students’ development of understanding. In particular, NCTM (2014) highlighted the critical
role that visual representations play on students building of conceptual knowledge in
mathematics and linking relationship between quantities. Through discussion of the
interconnection of manipulatives, graphs, charts, symbols, tables, and diagrams in context
students are able to better build conceptual knowledge and gain number sense (NCTM, 2014).
Chance and Rossman (2006) have developed online applets to help students make
connections between abstract concepts such as long run probability, sampling distributions,
biased sampling, sampling distributions of regression lines, sampling distributions of odds ratios,
and simulating randomized tests. Chance and Rossman (2006) described the use of applets as a
way for students to make abstract concepts more concrete through different representations of
the same concept. One of the practical suggestions given by Chance and Rossman (2006) and

57
Lunsford, Rowell, and Goodson-Espy (2006) described the importance of involvement by the
students in the representation process. When the teacher allows for students to be involved in this
process, students have a chance to develop ownership, interact to develop understanding, create a
link between tactile and computer simulations, be given immediate feedback, test their own
reasoning and conjectures, and reinforce key ideas. Teachers who allow students to create these
representations are much more likely to help develop statistical reasoning.
Chance, Ben-Zvi, and Medina (2007) discussed the use of statistical software packages
that have helped students and largely industries deal with statistical analysis. These software
packages have moved to more menu driven features to help in usability; however, educational
software such as Fathom, Inspiredata, and Tinkerplots have concentrated on the use of multiple
representations of a data set concurrently. Other free software like StatCrunch and NCTM’s Core
Math Tools also allow students to represent data in different ways, calculate different summary
statistics, and perform randomization experiments. Chance, Ben-Zvi, Garfield, and Medina
(2007) highlighted the role that technology has played on students metacognitive process to
connect different representations and connect data with different representations. The world of
technology has fundamentally shifted the way teachers can help students understand statistics
through representation (Chance et. al, 2007).
Bridgette Jacob’s (2013) dissertation focused on the development of introductory
statistics students’ informal inferential reasoning and its relationship to their formal inferential
reasoning. Questions posed during the study were “Does their informal inferential reasoning
develop?” and “If their informal inferential reasoning develops, what are the characteristics of
this informal inferential reasoning as it develops?” Jacob (2013) used three subcategories of
statistical content to analyze this development: comparing two distributions of data, drawing

58
conclusions based on sampling and estimating a probability, and comparing data from a single
sample to the sampling distribution of all such samples. Within these categories, Jacob (2013)
paid particular attention to the representations of statistics through different graphical displays.
Qualitative analysis of student responses showed strong relationships between students’
representations of median and mode to distributional shape, but the lack of relating distributional
shape to spread in context. Students also found difficulty in relating distributional representations
to statistical intervals and testing procedures (Jacob, 2013)
Pose Purposeful Questions
PtA’s fifth teaching practice stated that “Effective teaching of mathematics uses
purposeful questions to assess and advance students’ reasoning and sense making about
important mathematical ideas and relationships” (NCTM, 2014, p. 35). When teachers use
effective questioning, students are able to explain and reflect on their thinking through
meaningful mathematical discourse. This questioning allows teachers to discern what students do
and do not know (NCTM, 2014). Effective mathematics teaching relies on questions that
encourage students to explain and reflect on their thinking as an essential component of
meaningful mathematical discourse.
Smith and Stein’s (2011) first step in 5 Steps to Orchestrating Productive Mathematical
Discussion was posing purposeful questions. Too many times teachers and textbooks were
caught in the trap of funneling students to solutions (NCTM, 2014). When teachers step students
through a cognitively challenging task, they in effect lower the cognitive difficulty (NCTM,
2014). Good questioning habits by teachers, textbooks, and tasks encourage students to think at a
deeper level and be responsible for their own understanding and communication of this
understanding (Smith & Stein, 2011).

59
Herbal-Eisenmann and Breyfogle (2005), Smith and Stein (2011), and NCTM (2014)
discussed the misuse of the Initiate, Respond, and Evaluate (IRE) pattern of questioning (Mehan,
1979, as cited in NCTM, 2014) in many classrooms. In this pattern, teachers pose a question, the
student responds, and then the teacher evaluates the response as correct or incorrect. To break
this cycle, develop deeper level thought processes, and encourage responsibility for learning by
students, Herbal-Eisenmann and Breyfogle (2005) encourage teachers to shift from funneling
questions to focusing questions. When using focusing questions, the teacher listens to the
student’s solutions and guides them based on their thoughts (Herbal-Eisenmann & Breyfogle,
2005). When teachers use focusing questions, they help students make connections and articulate
their thinking by referring back to common activities within the classroom and student
contributions (Herbal-Eisenmann & Breyfogle, 2005). These actions value and draw out student
thinking which in turn supports specific goals the teacher may have (Herbal-Eisenmann &
Breyfogle, 2005).
Smith and Stein (2011) discussed the use of the Thinking Through a Lesson Protocol
(TTLP), another approach to breaking the IRE cycle. Part of the TTLP calls for teachers to work
through tasks to understand all the possible ways they could be solved. By doing these teachers
have a chance to pinpoint common misconceptions before the task and develop questioning
patterns that were not funneling but relate students’ prior knowledge to a new task (Baglin, 2013;
Stein & Smith, 2011; Herbal-Eisenmann & Breyfogle, 2005). The TTLP also called for teachers
to work through high need questioning patterns to ensure students completion of a task: how to
help a group get started, how to focus students’ direction on key mathematical portions of the
task, advance understanding of the key mathematical ideas, how to assess students understanding
of these key ideas, and how to hold each student accountable for their own construction of

60
knowledge during the task. The TTLP was essentially a tool for teachers to anticipate how
students may go about solving a task in order to guide students to understanding through
questioning rather than funnel them to a particular solution.
Though anticipating student responses is essential for good questioning, teachers should
also be careful during classroom discussions to hold students accountable for acquiring
knowledge during tasks. The teacher, to clarify student responses and questions that were not
loud enough for others to hear or present the same conception in a more understandable format,
provided the revoicing technique, but revoicing should be used with care so as to not strip
meaning or authorship from the student (Smith & Stein, 2011). It is actually better for teachers to
call on students to revoice if at all possible, because this reinforces student ownership, provides a
means for formative assessment during class, and holds students accountable for understanding
others ideas (Smith & Stein, 2011). Smith and Stein (2011) also offered strategies such as wait
time to help foster this accountability by students.
NCTM (2014) suggested four types of questions that help to advance student reasoning
and sense making about important mathematical content. The first type of question helps direct
students toward starting a task. These questions gather information and push students to recall
facts, definitions, or procedures. The second type of questioning habit probes student thinking by
asking them to elaborate, clarify, or explain their reasoning. The third type of question makes a
student make the mathematics visible to others through representation, structures, patterns, or
other methods the student may use. The fourth type of question encourages justification,
extension, and reflection by the student to generalize their concept. The important part of these
questions require students to explain their reasoning which in turn breaks the IRE pattern and
requires students to make sense of mathematics discussed by themselves and others. NCTM

61
(2014) elaborated this idea through two different questioning patterns for relating a dot plot and
box plot that funnel students to the relationship between the two plots and those that focus
students on the relationship.
Lampert (1990/2004) offered an environment for educating students related to a
mathematical community similar to mathematicians. This community fostered collaboration and
questioning, but at the same time required confidence and courage to share solutions (Lampert,
1990/2004). Lampert (1990/2004) had purposefully created this environment by entertaining
actions and discussion by students and herself that promoted the success of the classroom
environment. Students were expected to give solutions and explain their reasoning while at the
same time allowing modification of thought processes based on other students’ responses.
Lampert’s (1990/2004) study focused on this environment and the creation of an activity to build
laws of exponents when multiplying like bases. Her findings suggested that it was possible for
students, particularly in elementary grades, to engage in reasoning and sense making with
argumentation. Lampert’s (1990/2004) study highlighted the impact that using purposeful
questions to foster reasoning can have on students’ conceptual understanding of mathematics.
Though statistics education literature does not include much attention to questioning
habits during student tasks, Chance (1997) elaborates on questioning in assessments that promote
statistical thinking. Chance (1997) highlights the role that teachers’ questions play in what was
seen as meaningful learning in the classroom. Chance (1997) also highlights the teacher’s role in
allowing students to question the process of statistics and the difficulties students face when
faced when students were asked to question themselves and their work.
Shaughnessy, Chance, and Kranendonk (2009) also highlight the role that teacher
questioning plays in part of fostering thinking habits in their six tasks. Though many of the

62
discussions center on student discussion in the statistical tasks, teacher’s input were normally
questioning in nature and not explanatory (Shaughnessy, Chance, & Kranendonk, 2009).
Teachers in the discussions ask probing questions and questions that move students forward like,
“Do you think the equation for the gap is a good one?”, Is there a pattern over time that we can
use to predict the future?”, “How are they changing?”, “What is the slope of this line, and what
does it mean in our context?” (Shaughnessy, Chance, & Kranendonk, 2009, p.48-49).
Build Procedural Fluency from Conceptual Understanding
The sixth teaching practice in PtA stated that mathematics should build procedural
fluency on a conceptual underpinning (NCTM, 2014). Students will become over time skillful in
using these procedures to solve contextual and mathematical problems (NCTM, 2014). To
achieve this goal teaching should focus on both conceptual understanding and procedural fluency
(NCTM, 2014). When procedures are connected with their underlying concepts, students will
more likely retain these procedures and be more able to apply them to different situations.
With strong emphasis in recent years on standards and assessment, many teachers have
been pulled towards teaching instrumentally rather than conceptually (Pesek & Kirshner,
2000/2002); however, this discussion was highlighted much earlier (cf. Brownell, 1947/2002).
All students, young and old, and even non-students look for shortcuts and easy methods to solve
problems (Pesek & Kirshner, 2000/2002). Instrumental teaching fosters shortcut methods that
students and parents enjoy, but interfere with understanding (Pesek & Kirshner, 2000/2002).
Many students who “enjoy” this “luxury” of mathematical instruction perform algorithms and
apply formulas haphazardly, without thought, and many times outside applicable context (Pesek
& Kirshner, 2000/2002). Martin (2009) emphasized that students should be able to know when to
apply a specific procedure and what procedure was most productive in a given situation, and

63
what the procedure will accomplish or result in. Methodical application of procedures without
conceptual knowledge often leads to results that are strange (Martin, 2009). Students receiving
instrumental instruction were also much less likely to understand concepts such as area outside
the sphere of the mathematical classroom to real life applications (Pesek & Kirshner,
2000/2002).
Jacobs (1998/2002) discussed possible outcomes for teaching for understanding through
invented arithmetic algorithms rather than traditional algorithms. Jacob’s (1998/2002) suggest
that students gain understanding of place value and become better problem solvers when given
the opportunity to build their own algorithms for operations with whole numbers. Findings by
Jacob (1998/2002) do not suggest that students invented algorithms are more efficient
computationally. As Pesek and Kirshner (2000/2002) suggest, allowing students time to gain
relational understanding increases retention and ability to interconnect concepts (Brownell,
1947/2002; Jacob, 1998/2002).
Brownell (1947/202) discussed major implications for the teaching of arithmetic,
generalizable to any mathematical concept, meaningfully. He defines the meanings of arithmetic
and describes the processes in which teachers may setup tasks of instruction that foster reasoning
and sense making (Brownell, 1947/2002). The increase of interest in student understanding of
arithmetic Brownell (1947/2002) described as coming from the armed forces evidences and
testimonies, teachers experiences above elementary school, and evidence from the broader
community of adults and their day-to-day activities. Brownell (1947/2004) also addressed four of
the major objections for teaching arithmetic or mathematical topics meaningfully: (1) Does it
really matter if you know why something works? (2) Is knowing how something works worth
the time it takes to understand it? (3) Is knowing why something works too difficult for students

64
to understand? (4) Do students suffer by creating and using their own algorithms for
mathematical concepts?. Brownell (1947/2004) painted clear answers to these questions but has
little reference to answering these objections from research. His answers hinge on factors such as
stronger retention, functional value, conception producing better results than memorization, and
goals of learning and teaching such as reasoning, sense making, and problem solving (Brownell,
1947/2004). These answers have guided research in the preceding years laying strong
foundations for research and practice in the mathematical education community.
These same issues have also been discussed in statistics education specifically. The ASA
published an article on the importance of teaching statistics more in the light of conception and
less of procedural processes titled, Improving Mr. Miyagi's Coaching Style: Teaching Data
Analytics with Interactive Data Visualizations (Leman & House, 2012). Feldman, Konold,
Coulter, and Coyer (2000) discussed the impacts of introducing graphical summaries to students
before they were conceptually ready to understand certain characteristics of these graphs.
Mokros and Russell (1995) similarly discussed the interference of introduction to the standard
mean algorithm before a conceptual underpinning has been established. These studies have
highlighted the need to build procedural fluency from conceptual understanding.
Jacob (2013) stated that students “primarily relied on their procedural knowledge for
formal statistical inference” (p. 150). Jacob (2013) suggests future research is needed to relate
the connection of formal inference and procedural knowledge with representations that build
conceptual understanding. It would be suggested however that future studies similar to Jacob’s
(2013) study looking to understanding the connection between representations, conceptual
knowledge, and procedural knowledge of confidence intervals and hypothesis testing attend to

65
the inference of procedural knowledge with conceptual understanding (Pesek & Kirshner,
2000/2002; Feldman, Konold, Coulter, & Coyer, 2000; Mokros & Russell, 1995; Konold, 2002).
Procedural fluency is very important in mathematics and statistics; however, it has been
shown to interfere with student conception of important mathematics and statistics when
introduced prematurely (Konold & Higgins, 2003; Pesek & Kirshner, 2000/2002; Feldman,
Konold, & Coulter, 2000; Mokros & Russell, 1995). Effective teaching builds fluency with
procedures on a foundation of conceptual understanding (NCTM, 2014). By having a strong
conceptual foundation before developing procedural skills, students can become skillful in using
these procedures flexibly in different contexts and mathematical problems (NCTM, 2014).
NCTM (2014) also discussed students’ ability to better retain procedural skills when connected
to conceptual understanding and the cause of anxiety in mathematics with early incorporation of
procedural skills.
Support Productive Struggle
NCTM’s (2014) seventh teaching practice stated that student productive struggle is a
necessary component of promoting a class that fosters learning mathematics with understanding.
In addition to promoting conceptual understanding, NCTM (2014) recognized the fact that
students who experience productive struggle receive long-term benefits and the ability to apply
their knowledge into multiple contexts. CCSS-M’s first mathematical practice standard stated
that students should be able to make sense of problems and preserve in solving them (NGA &
CCSSO, 2010). Persistence for each individual is different and requires teachers’ attention to
both the cognitive and affective domain of instruction (Turner et. al, 2002).
Turner et. al (2002) suggested ways that the classroom environment’s goal structure,
classroom discourse, and students reporting of avoidance strategies may inhibit student learning

66
in the affective domain and discourage avoidance strategies. Classroom goal structures that focus
on grades and use grades as motivating factors tend to affect negatively student performance and
affection toward mathematics and statistics (Turner et. al, 2002). When the classroom
environment promotes discourse free of criticism and the sharing of ideas is still promoted,
student cognitive and affective abilities in mathematics increase and avoidance strategies
decrease (Turner, et. al, 2002; NCTM, 1991; Smith & Stein, 2011). Teachers who attend to the
affective aspects of teaching during instruction have also reported lower amounts of avoidance
strategies by students. This in turns help teachers assess and develop tasks that promote student
understanding and usefulness for the content (Turner et. al, 2002). Attention to good scaffolding,
promotion of discourse and conjecture, and allowing time for the sharing of ideas help develop
students persevere in problem solving (Turner et. al, 2002). These techniques have a much
stronger chance of increasing student’s ability to understand and find meaning for mathematics
and statistics, which provides support for the increase of interest (Turner et. al, 2002).
Unfortunately, teachers and students many times equate student struggle as an indication
that the teachers have failed (NCTM, 2014). In order for a classroom to embrace productive
struggle, it is imperative that the teacher and student reshape what it means to teach and learn
mathematics (NCTM, 2014). Teague et. al (2011) discussed the possible negative view of
struggle many advanced students face when confronted with cognitively difficulty tasks.
Students who have succeeded in classes that require memorization and the use of repetitive
algorithms may have difficulty in problem solving tasks that require application and number
sense (Teague et. al, 2011).
Hierbert and Grouws (2007) make two strong arguments for effective teaching in
mathematics. Effective teaching should attend explicitly to important concepts as discussed

67
earlier and students’ productive struggle. This productive struggle requires students to make
sense of the mathematical concepts that are being taught during an activity. Warshauer (2011)
focused on this issue in middle school mathematics, finding that teacher responses to student
struggle can be categorized as either telling, directed guidance, probing guidance, or affordance.
These responses to struggle were then related to their ability to maintain the cognitive level of
the activity, provide support for the student, and build on student thinking (Warshauer, 2011).
Providing tasks that create struggle for students and handling these struggles appropriately are
integral components to building students conceptual understanding in mathematics (Hierbert and
Grouws, 2007; Warshauer, 2011).
Though statistics education has been rather silent in the area of productive struggle,
Chance (2002) recognized the issue of teaching for statistical thinking being different from many
mathematics courses because of the need for understanding errors in the statistical process.
DelMas (2004) also recognized many unique struggles teachers may face that are different in
statistics from mathematics such as incorporating variability in conclusions. Being able to
anticipate these struggles and design lessons that address these areas are important for teachers to
progress conceptual understanding in their statistics course. This makes the use of productive
struggle with teacher support that maintains the cognitive demand very valuable in both
mathematics and statistics education.
Orchestrate Productive Discourse
PtA’s fourth teaching practice stated that teachers should encourage discourse among
students (NCTM, 2014). Productive discourse allows opportunities for students to build the
understanding of mathematical ideas by examining and comparing one another’s arguments and
methods. When teachers effectively use discourse to advance mathematical learning, students are

68
more likely to develop conceptual understanding and make mathematics meaningful to
themselves (NCTM, 2014). Discourse involving mathematics should include purposeful
exchanges of ideas between students in verbal, visual, and in written communication (NCTM,
2014). Mathematics classrooms that promote discourse focus on tasks that promote reasoning
and problem solving in the classroom (NCTM, 2014).
Analyzing discourse within the classroom can provide strong evidence of what is valued
within the classroom. Orchestrating productive mathematical discussions is an art that provides a
means for students to build mathematical power and continually assess understanding (Smith &
Stein, 2011). Through monitoring, teachers can provide sequenced explanations that build on
each student strengths and help build connections between mathematical concepts (Smith &
Stein, 2011).
NCTM (1991) made clear that students must talk with one another as well as in response
to the teacher. The teacher’s role is to initiate and orchestrate discourse that was meaningful and
fosters student learning by being perceptive and skillful in analyzing the culture of the
classroom, monitoring inequity, dominance, and low expectations of students (NCTM, 1991). In
addition, NCTM (1991) advocated that the center for knowledge be on the reasoning and sense
making of students, not teacher dissemination of knowledge. To facilitate this type of discourse,
NCTM (1991) elaborated that teachers should:
1. Listen carefully to student’s ideas
2. Pose questions and tasks that elicit student thinking
3. Ask clarifying and justifying questions orally and in writing
4. Decide what to pursue in depth based on student ideas
5. Decide when is best to introduce certain notation and vocabulary

69
6. Decide when to appropriately clarify an issue, lead the class, or let students
struggle
7. Monitor student participation and decide when and how to encourage student
participation
To enhance discourse effectively in the classroom, NCTM (1991) stated that the means
for communication must be broad and varied. This meaning that students not only have multiple
forms for communicating ideas but also that there are multiple approaches to a problem. Tasks
and problems for students should not rely on conventional forms of mathematical symbols and
encourage the use of different tools drawings, diagrams, graphs, and analogies. Smith and Stein
(2011) suggested this as being the first stage or step zero of orchestrating meaningful discourse
in the classroom. Creating and using tasks that promote students to reason and think statistically
help enhance productive student discourse.
FHSM (Shaughnessy, Chance, and Kranendonk, 2009) strongly support the idea that
classroom discourse is essential for effective classroom teaching, learning, and assessment.
FHSM (Shaughnessy, Chance, and Kranendonk, 2009) described the use of student discussion to
monitor students’ habits of mind through six chapters presented in forms of investigations that
secondary students can complete. Sample student discourse was used throughout the text to help
teachers foster meaningful classroom discourse in small groups and class discussions and
understand common pitfalls in reasoning by students (Shaughnessy, Chance, and Kranendonk,
2009).
Elicit and Use Evidence of Student Thinking.
PtA’s eighth teaching practice focused on eliciting and using evidence of student thinking
to promote mathematical understanding and adjust instruction (NCTM, 2014). Eliciting and

70
using evidence has been an essential component of formative assessment (NCTM, 2014; Petit,
Zawojewski, & Lobato, 2010). PtA also emphasized that teachers should continually look for
ways in which they can generate evidence of student learning and use this to adapt their
instruction to meet the needs of their students (NCTM, 2014). Student indicators should identify
important factors in student thinking, plan for ways to elicit that information, interpret what the
evidence means in respect to student thinking, and then make a decision on how to respond
based on this information (NCTM, 2014).
Assessments geared toward increasing understanding are commonly referred to as
formative assessments. Petit, Zawojewski, and Lobato (2010) described formative assessment as
“a way of thinking about gathering, interpreting, and taking action on evidence of learning by
both the teachers and students as learning occurs” (p. 68). According to Petit, Zawojewski, and
Lobato (2010), formative assessments should improve instruction by clarifying and sharing
learning intentions and criteria for success, providing feedback that moves learners forward, and
activating students as instructional resources for one another.
Petit, Zawojewski, and Lobato (2010) clarified that formative assessments should activate
students as the owners of their learning. Effective forms of formative assessment may entail
classroom discussions, questions, and learning tasks that elicit evidence of learning (Petit et. al,
2010). Activating students as owners of their own learning provides openness (NCTM, 1995)
within an assessment that is not offered in all mathematical classrooms. Students who complete
self-assessment tasks may be asked to create an individual work plan, create problem-solving
activities to explore, provide opportunities to evaluate their own performance against their work
plan or against jointly created criteria for performance, or identify specific problems they are
having (NCTM, 2014; Petit, Zawojewski, & Lobato, 2010; Chance, 1997).

71
Developing and analyzing formative assessments is potentially enhanced with the use of
Petit, Zawojewski, & Lobato (2010) assessment triangle (Figure 5). The assessment triangle’s
vertices consist of observation, interpretation, and cognition (Petit, Zawojewski, & Lobato,
2010). The cognition vertex refers to the ways students understand, misrepresent, misunderstand,
or use prior knowledge that influences this understanding of a particular concept (Petit,
Zawojewski, & Lobato, 2010). The observation vertex refers to descriptions from research that
produce specific responses (Petit, Zawojewski, & Lobato, 2010). Interpretation in the assessment
triangle represents the tools and methods used to reason from the evidence (Petit, Zawojewski, &
Lobato, 2010). “To develop effective assessments that lead to sound inferences, each corner of
the assessment triangle must connect to the other in a significant way regardless of the level of
assessment” (Petit, Zawojewski, & Lobato, 2010, p. 70-71).
Figure 5. The Assessment Triangle by Petit, Zawojewski, and Lobato (2010).
Assessments in statistics and mathematics should focus on student growth, improvement
of instruction, reorganization of student accomplishment, and modification to the class or
Observations
Opportunities for students to demonstrate and practice mathematics
Interpretation
Measurement tools and methods used to reason
about student knowledge
Cognition
How do students learn the content most
effectively
72
program (Garfield & Chance, 2000; NCTM, 1991, 1995, 2014; Hubbard, 1997; Garfield, 2003;
Chance, 1997). Thus, assessment or eliciting and using student evidence are very similar in both
mathematics and statistical literature. Garfield and Chance (2000) described innovative methods
of assessment of individual students and instructional practice in statistics such as: individual and
group projects, case studies and authentic tasks, portfolios of students’ work, concept maps,
critiques of statistical ideas or issues in the news, and minute papers. These assessments are
encouraged to assess and develop deep conceptual understanding of student. If multiple-choice
items are used, these items should focus on matching concepts or appropriate explanations rather
than pure procedures (Garfield & Chance, 2000). To use assessment effectively, PSSM (NCTM,
2000, 2014) argued the assessment should support the learning of mathematics and furnish useful
information to both teachers and students for improvement.
Garfield (2003) emphasized a reformation that has been happening in statistics
assessment to more align with instructional techniques. This type of assessment is used to
improve student learning rather than solely evaluate student performance. Assessments in
mathematics and statistics should move students forward in their understanding of a concept
(NCTM, 2014). Slauson (2008) found that eliciting and using student evidence was helpful in
promoting student statistical reasoning. Making expectations and objectives clear helps students
achieve satisfactory results by demonstrating how students can achieve these expectations (Petit,
Zawojewski, & Lobato, 2010; NCTM, 1995). Teachers who provide feedback to student
assessments encourage self-reflection; however, identifying special actions a student can do that
can support improvement are even stronger methods that can be used for student improvement
(Petit, Zawojewski, & Lobato, 2010).

73
Chance (1997) provided a summary of assessment techniques used in an introductory
statistics course. Assessment techniques emphasized by Chance (1997) were journals, writing lab
reports, presenting homework problems, traditional quizzes, take home exam questions, and
projects to promote statistical literacy, reasoning, and thinking. Chance’s (1997) description of
labs seemed to emphasize reasoning and literacy skills while journals and projects emphasize
statistical thinking. An important aspect of Chance’s (1997) methods for assessment emphasized
the importance of understanding students learning in a more formative manner. Chance (1997)
acknowledged the importance of measuring student learning and having them assess their own
learning as the course progresses. Chance (1997) promoted the idea that students should
understand the assessment process and the goals for each activity in order to gain completely
from assignments.
Formative assessment is one of the most robust tools teachers can use to improve student
learning (Petit, Zawojewski, & Lobato, 2010). Though it may seem like more work for a teacher
who has not incorporated these strategies in the past, students engaging in self-reflection and
critique actually take the burden away from teacher grading and move toward teacher facilitation
and self-assessment. Good instruction uses formative assessment in ways that when summative
assessment takes place, there was no surprise. It is imperative that teachers use these tools
appropriately to improve student understanding within the classroom.
Summary
This section on teaching has highlighted eight critical areas to consider during the
teaching of mathematics and statistics. Building procedural fluency from conceptual
understanding has been a key target for much of the recent statistical literature (Jacob, 2013;
Leman & House, 2012; Mokros & Russell, 1995; Konold & Higgins, 2003; Feldman, Konold,

74
Coulter, & Coyer, 2000). Literature related to representations in statistics education has pushed
towards randomized experiments to help building students informal reasoning to formal (Chance
& Rossman, 2006; Tintle et. al, 2012; Rossman & Chance, 2013; Chance & Rossman, 2001;
Jacobs, 2012). The development of statistical content should focus on visual representations and
computer simulations (Chance & Rossman, 2006; Cobb & Moore, 1997; Chance & Rossman,
2001; Jacob, 2013). Statistics education literature has not explicitly addressed teachers’ use of
productive discourse in their classrooms and use of purposeful questions. Though some of these
areas have not been directly addressed in statistics education literature, the relationship between
effective mathematics and statistics instruction can be seen as very similar, thus mathematics
education literature was used to fill some of these gaps (Smith & Stein, 2011; NCTM, 2014).
This chapter has also highlighted the interconnection between learning and teaching. In
order for students to gain high levels of student learning, teaching techniques must be used that
facilitate this (NCTM, 2014). Implementing statistical tasks that promote reasoning must also
include productive struggle (NCTM, 2014). Students involved in these tasks are much more
likely to need and use discourse within the classroom to facilitate learning (Smith & Stein,
2011). Lastly, assessments used in the classroom should foster learning of statistics by eliciting
and using evidence of students reasoning and thinking (Garfield & Chance, 2000; NCTM, 1991,
1997; Hubbard, 1997; Garfield, 2003; Chance, 1997). The difficulty however are the resources
many teachers have to help teach effectively and encourage deep learning. For this reason, the
next sections looks closer at technology and curriculum related to statistics education.
Technology for Statistics Teaching
PtA stated that excellent mathematics programs integrate “the use of mathematical tools
and technology as essential resources to help students learn and make sense of mathematical

75
ideas, reason mathematically, and communicate their mathematical thinking” (NCTM, 2014, p.
78). PSSM (NCTM, 2000) stated that technology is essential in teaching and learning
mathematics and influences what is learned. PtA described tools in mathematics such as
counters, snap-cubes, base-ten blocks, pattern blocks, and building blocks in the lower grades,
and algebra tiles, geoboards, protractors, compasses and straightedges, and geometric models in
the upper grades (NCTM, 2014). Current statistical literature has pushed for introductory
statistics courses to begin with the use of tools such as dice, playing cards, etc. to understand
randomized experiments that can then be carried through multiple iterations using technology
(Cobb, 2013).
The technological landscape is rapidly changing. While many classrooms use basic
calculators in early grades for basic operation and more advanced calculators for graphing in
upper grades, tablets and mobile devices are blurring the lines between computing and
educational devices. For this reason, PtA (2014) recognized technology as “interactive
whiteboards and a wide range of handheld, tablet, laptop, and desktop-based devices that can be
used to help students make sense of mathematics, engage in mathematical reasoning, and
communicate mathematically” (NCTM, 2010, p. 78). This makes the platform for technology
less important and brings to the forefront what technology is actually being used for (NCTM,
2014).
Chance, Ben-Zvi, Garfield, and Medina (2007) addressed technological changes within
statistics education. These changes have largely dealt with the introduction of high power
computing and power of re-sampling within statistics itself and education as a whole (Chance et.
al. 2007). These changes have also been directed toward change in pedagogical strategies,
curriculum, content, and focus (Chance, et. al, 2007). Chance et. al (2007) described some of the
76
most popular statistical software packages as both language and menu driven, however focus was
given to software written explicitly for instructional purposes by drag and drop methods like
Fathom, Tinkerplots, and InspireData. Other focuses by Chance et. al (2007) were on website
applets, graphing calculators, spreadsheet software, multimedia methods, data and material
repositories, and ability of this software to aid instruction.
In particular Chance et. al (2007) dealt with recommendations for teachers of statistics to
not focus on computational statistics, but emphasize more cooperative learning with technology.
Focus has also been given on the use of technology to facilitate and develop conceptual
understanding (Chance, et. al, 2007). Chance et. al (2007) also discussed barriers to using
technology in statistics including such as: the need to reinvestigate learning goals, lack of
awareness and familiarity with available technology, lack of support for teachers, lack of class
time that fosters reasoning and sense making, instability of technology, and unclear role of
distance learning (Chance et. al, 2007). The integration of technology can help support student
learning but it offers complexities that instructors need to anticipate (Chance et al, 2007).
Mishra and Koehler (2009) and Voogt, Fisser, Pareja, Tondeur, and van Braak (2013)
described Technological, Pedagogical and Content Knowledge (TPACK) as the use of
technology in conjunction with pedagogical and content knowledge. This was an extension of
work related to Pedagogical Content Knowledge (PCK), introduced by Shulman (1987). The
PCK represented how particular aspects of subject matter were organized, adapted, and
represented for instruction in relationship to content and pedagogy. Hill, Ball, and Schilling
(2008) extended PCK to describe the mathematical knowledge needed for teaching. The PCK
can be used to help distinguish between common and specialized content knowledge.

77
PCK and TPACK frameworks have shown how the use of technology has benefited
classrooms when focus has been given to the integration of content, pedagogy, and technology
(Mishra & Koehler, 2009; Hill, Ball, & Schilling, 2008; Voogt et. al, 2013). To use technology
appropriately, teachers need to use technologically appropriate tools that enhance instruction and
learning while helping students to make connections to previous knowledge (NCTM, 2014).
When a teacher uses their content, pedagogical, and technological content knowledge to help
students learn, this can be described by the TPACK framework (Mishra & Koehler, 2008).
Similar to Hill, Ball, & Schilling’s 2008 article on specialized content knowledge in
mathematics, Lee & Hollebrands (2011) developed the Technological Pedagogical Statistical
Knowledge (TPSK) framework. This framework characterized the important aspects of
knowledge needed to teach statistics with technology into: using the six components of the
Statistical Knowledge (SK) in the Wild and Pfannkuch (1999) model; understanding of how to
use technology to explore statistical ideas; and understanding of pedagogical issues related to
teaching statistics. Teachers who teach with statistical knowledge, pedagogical knowledge, and
technological knowledge understand students’ learning and thinking of statistical ideas (Lee &
Hollebrands, 2011). Teachers who integrate technology according to the TPSK framework
should use technology tools and representations to support statistical thinking (Lee &
Hollebrands, 2011). The TPSK framework also encourages the utilization of instructional
strategies for developing statistics lessons with technology (Lee & Hollebrands, 2011). Lastly,
the TPSK framework calls for teachers to evaluate and use curricula materials for teaching
statistical ideas with technology (Lee & Hollebrands, 2011). The TPSK framework supports the
idea of the integration of technology, statistical content knowledge, and pedagogical knowledge.

78
Bayés, Meletiou-Mavrotheris, and Paparistodemou (2014) developed a program called
EarlyStatistics to help develop early and middle grades teachers Statistics Technological and
Pedagogical Content Knowledge (STPACK). The EarlyStatistics course focused on investigation
through four components: clarifying and formula a problem answerable by data, designing and
employing a plan to answer the question, analyzing data by graphical and numerical techniques,
and interpreting results (Bayés et. al, 2014). The STPACK emphasized the integration of
statistical content knowledge, pedagogical content knowledge, and statistics technological
technology.
Cobb (2013) described the current uses for technology in statistics as: a tool to distribute
resources, a tool used in the art of teaching, a tool for curricular content, and a tool as curricular
content. Cobb (2013) defined open source classrooms as classrooms where individuals can
participate in open source textbooks. These textbooks can be used to share information to help
instruct individual or groups of statistical learners. Reform curriculum (ZIG) from Zieffler,
Isaak, and Garfield (as cited by Cobb, 2013) was presented as a one of the kind curricula
material. ZIG relies on the use of computers to complete applied problems that rely on
randomized experimentation and student exploration to develop understanding. Cobb (2013)
anticipated hopeful changes in introductory statistics courses content as technology becomes
more integrated in the classroom. Cobb (2013) hoped these changes would create a stronger
emphasis on bootstrapping and randomization that approximates the normal distribution,
increase the use of Bayesian methods through randomization, allow for data mining of large data
sets, complete multiple regression and multiple way ANOVAs, and complete generalized linear
models with logistic regression.

79
The following review has highlighted how many of the features of technology have
changed the way and what statistics was being taught. For teachers to utilize technology
effectively, attention must be played to statistical content knowledge, pedagogical content
knowledge, and technological content knowledge. Though tools such as playing cards, dice, etc.
are important for beginning insight into randomization, the computers’ ability to harness multiple
iterations must be used to develop student reasoning (Cobb, 2013). The transition of course
content and curricula to randomized methods may require many teachers to develop their
statistical content and pedagogical content knowledge more fully (Cobb, 2013).
Statistics Curriculum
When teachers and stakeholders in education use the word curriculum, it is important that
this be properly defined. District leaders and teachers may view curriculum as a pacing guide
that describes the order in which content objectives are to be taught (Stein, Remillard, and Smith,
2007). Curriculum may also be seen as the set of instruments that are used to instruct which in
turn defines many ways how the content is taught (Stein, Remillard, and Smith, 2007). Though
standards and curriculum are interwoven, they are different. Stein, Remillard, and Smith (2007)
described curriculum as “the substance or content of teaching and learning” (p. 321). Standards
may be taught through many different curricula that encompass different methods or approaches
to instruction, materials that are used, and order of instruction. Curriculum is essentially the
means to meet standards through instructional materials, activities, tasks, units, lessons, and
assessments (PtA, 2014).
PSSM (NCTM, 2000) stated that “curriculum is more than a collection of activities; it
must be coherent, focused on important mathematics, and well-articulated across the grades” (p.
14). Though many teachers piece together different activities that have worked for them through

80
years of experience (Gelman & Nolan, 2002), a curriculum must be coherent with the teaching
and learning goals of the instructor. For this reason, the focus of programs should highlight
important goals of introductory statistics and helped students move beyond statistical literacy to
statistical reasoning and thinking.
The following report of curriculum reviews statistics education literature related to
priorities for instruction, programs, and progressions. This section begins with what is important
to teach in statistics at the K-12 setting and in Advanced Placement (AP) statistics according to
current literature in mathematics and statistics education. After this, arguments for programs that
encourage coherent teaching and learning of important statistics are presented. Lastly,
progressions of the K-12 standards and AP statistics courses are discussed from the literature.
Curriculum Priorities
Calls for change in statistics education have emphasized the use of active learning
principles with more data and concepts, less theory, and fewer recipes for interpretation (Cobb,
1992; Chance, 1997; Keeler & Steinhorst, 1997). Statistics education literature has pointed
statistics more toward a conceptual understanding with less emphasis on procedural
computational abilities (Cobb, 1992; Chance, 1997; Keeler & Steinhorst, 1997). To be most
comprehensive, the following sections highlight current frameworks for introductory statistics
classrooms in the K-12 curriculum that have fostered this call. The PSSM, GAISE report, and
CCSS-M focused on the K-12 setting, while the AP statistics program focused on reducing
redundancy between the high school and tertiary levels (Klopfenstein & Thomas, 2009). Though
these frameworks were created for different levels, there are striking similarities and differences
(Rossman & Chance, 2013) discussed. In addition to these set of standards, the Next Generation
Science Standards are reviewed and compared to these frameworks for standards. The overall

81
intention of the following sections is to articulate some of these major frameworks for curricula
in statistics education in more detail, then describe their similarities and differences.
Principles and Standards for School Mathematics. PSSM was created to make an
argument for all students learning important mathematics with understanding and describing
ways all students can attain this understanding (NCTM, 2000). PSSM (NCTM, 2000) attempted
to address mathematics teachers, teacher leaders, developers of curricula, professional
development leaders, educating mathematics teachers, pre-service teachers, schools, sates,
administrators, and policy makers. PSSM (NCTM, 2000) (NCTM, 2000) presented six
“principles” and five “process standards” that articulated and guided mathematics for the last
decade by presenting a coherent vision for mathematics education. A brief discussion follows
related to NCTM’s (2000) principles and standards.
Principles. The six principles in PSSM (NCTM, 2000) highlighted particular features of
high-quality mathematics education. Their overarching principles in PSSM (NCTM, 2000) were
equity, curriculum, teaching, learning, assessment, and technology. Though these principles do
not address specific mathematics content, they are crucial for effective mathematics instruction.
NCTM’s (2000) equity principle has vision for those involved with students to have high
expectations and strong support for all students. To ensure equity, PSSM (NCTM, 2000)
required the accommodation for differences of individual learners, providing opportunities and
resources for all. The curriculum principle stated that curriculum is more than a set of activities,
and must be coherent, focused on essential mathematics, and progressed to maximize
effectiveness in learning (NCTM, 2000). PSSM’s (NCTM, 2000) teaching principle required
teachers to understand what students know and need to learn then support them to move forward.
Moving students forward requires teachers to provide a challenging and supportive learning

82
environment for students and understand the mathematics students are learning (NCTM, 2000).
NCTM’s (2000) learning principle required students learn mathematics with understanding by
building on new knowledge from experience and prior knowledge (NCTM, 2000). PSSM’s
(NCTM, 2000) assessment principle required teachers to make assessments that were valuable
for making instructional decisions and enhancing student learning. NCTM’s (2000) technology
principle stated that technology should support effective mathematics instruction and enhance
mathematics learning of important mathematics.
Standards. The PSSM (NCTM, 2000) standards were divided into five important content
standards: number and operation, algebra, geometry, measurement, and data analysis and
probability. In addition to content standards, PSSM’s (NCTM, 2000) process standards were also
investigated and discussed in detail in the goals of practice section. These categories were
explored in relationship to four different grade bands: PreK-2, 3-5, 6-8, and 9-12 (NCTM, 2000).
The data analysis and probability standards through these grade bands explicate what students
should know and need to know to move students forward.
PSSM’s (NCTM, 2000) content standards at each grade band were divided into four
overarching subcategories: formulating questions and addressing data collection, organizing, and
presenting data, selecting and using appropriate statistical methods for data analysis, developing
and evaluating inferences and predictions based on data, and understanding and applying basic
concepts of probability. PSSM (NCTM, 2000) provided clear progression of each of these
subcategories at each grade band with examples of the content standards, habits of mind that
move students forward, and students’ demonstration of mastery of standards. The progression of
content was clearly intertwined with goals of instruction that promoted PSSM’s (NCTM, 2000)
guiding principles.

83
Guidelines for Assessment and Instruction in Statistics Education Report. The GAISE
report produced by the ASA provided key concepts, activities that help develop these key
concepts, and levels for student understanding within statistics that should be sought in the K-12
curriculum. The GAISE used the PSSM as a foundation for its own framework and did not
attempt to replace the PSSM (Franklin et. al, 2007, p. 5). More specifically, the GAISE report
created three sequential levels within K-12 education at which students should be able to apply
statistical concepts or statistical process components such as formulating questions, collecting
data, analyzing data, interpreting results, and understanding variability (Franklin et. al, 2007).
The GAISE report did not directly correlate the three sequential levels of statistical
understanding with grade levels; however, it detailed process components by looking at the
complexity of a question it could entail.
Objectives in the GAISE of level A students required teachers to formulate statistical
questions and students distinguish between solutions and fixed answers (Franklin et. al, 2007).
Students at level A in the GAISE should conduct census information, understand individual to
individual variability, conduct simple experiments with non-random assignment, and understand
variability that may be attributed by an experimental condition, induced, measured, or natural
(Franklin et. al, 2007). Level A students should begin to understand the idea of a distribution,
tools to explore those distributions, and observe the association between two variables while
comparing individuals to individual or individuals to a group (Franklin et. al, 2007). Level A
students may restrict their analysis to the classroom, but should recognize that their data may
show different results in other classes or groups (Franklin et. al, 2007). Generating questions and
incorporating tools that potentially answer these questions were characteristics of developing
level A students in the GAISE as well (Franklin et. al, 2007).

84
Unlike level A students, level B students “become more aware of the statistical question
distinctions” (Franklin et. al, 2007, p. 35). Level B students develop methods to analyze their
questions by selecting measureable variables and determining how to measure them (Franklin et.
al, 2007). Tools such as two-way frequency tables, numerical summaries, mean absolute
deviation, quadrant count ratios, and graphical displays such as box plots were expanded in the
GAISE to help answer more sophisticated questions that involve multiple variables with
emphasis on association (Franklin et. al, 2007). Probability should also expanded from level A
students to level B students by the introduction of inducing random selection and assignment to
conduct experiments and show causation (Franklin et. al, 2007). The introduction of sampling
helps build students understanding of variability to sampling during experiments. Level B
students were also encouraged to move beyond their classroom models to understanding the uses
and misuses of statistics in the real world (Franklin et. al, 2007).
Level C students in the GAISE report should be able to create statistical questions that
can be answered by the collection of data while using experimental, observational, survey, and
comparative designs appropriately (Franklin et. al, 2007). Once students create these questions,
level C students should be able to devise a reasonable plan to sample and an experiment to
answer their questions (Franklin et. al, 2007). When this process is completed, level C students
should be able to use their data to draw and support their conclusions (Franklin et. al, 2007).
Level C students should use tools for conclusions that draw on the use of sampling distributions,
correlation coefficients, and statistical tests (Franklin et. al, 2007). Level C students are able to
understand the role variability plays in the sampling, measurement, and conclusion process and
incorporate the reduction and reporting of this variability in their conclusions (Franklin et. al,
2007).

85
The GAISE report’s levels of instruction also incorporated statistical activities that
teachers may use to help develop students’ statistical reasoning. The GAISE report’s articulation
of major content and inclusion of content outside many curriculum standards such as quadrant
count ratios and mean absolute deviation made it a unique set of standards for teachers in K-12
education. Though the GAISE report did not tell how to teach, activities found within the GAISE
report embed the importance of conceptual understanding, the development of statistical
reasoning, and development of CCSS-M.
Common Core State Standards for Mathematics. The CCSS-M is a set of standards
formed by the National Governor’s Association and Council of Chief State School Officers that
was fully implemented in 45 states and the District of Columbia in 2014. The importance of
statistics can be found within the CCSS-M as domains of study, Measurement and “Data” and
“Statistics and Probability”, throughout K-12 instruction (NGA & CCSSO, 2010). NCTM’s K-
12 standards within PSSM (NCTM, 2000) provided a similar emphasis on measurement, data,
statistics, and probability and was used as a road map for the CCSS-M (NGA & CCSSO, 2010).
The CCSS-M standards have increased rigor and cognitive demand in many state
curricula in addition to remapping standards to different grade levels (Porter, 2011a, 2011b). The
combination of these new demands has provided increased stress for teachers in middle grades
who come from varying backgrounds. Though middle grades content objectives have increased
in statistics, the CCSS-M placed very little emphasis on data analysis and statistical standards in
grades K-5 (Rossman & Chance, 2013). Rossman and Chance (2013) suggested some small
adjustments of statistical content in grades K-5 instead of a reduction in standards to barely
nothing. Though K-5 standards in statistics are very slim, a sudden shift in student expectations
in statistics and probability occurs at the 6th and 7th grade levels with push of understanding of

86
distributional shape, center, and spread. Experts within curriculum development and assessment
at a conference in Arlington, VA noted a key recommendation for successful implementation of
the CCSS-M was to “focus attention to content changes at the middle grades” (Garfunkel et. al,
2011, p. 12). These expert participants claimed there were “substantial increase in the number
and nature of learning goals… at middle grades” (Garfunkel et. al, 2011, p. 12).
Porter (2011a, 2011b) tried to quantify the relationship between changes in standards for
many different states after adopting the pre-CCSS-M. Porter (2011a, 2011b) described a shift of
needed content knowledge for teachers and new standards for students for many states. The
policy workshop, Gearing Up for the Common Core State Standards in Mathematics (2011),
focused on pivotal standards for grades K-8 professional development (Institute for Mathematics
and Education, Center for Science, Mathematics, and Computer Education, & Institute for
Research on Mathematics and Science Education, 2011). The CCSS-M’s emphasis in grades six
and seven were on ratios and proportional relationships with emphasis on developing statistical
critical thinking.
Although little emphasis is placed on probability and statistics at the K-5 level, the
emphasis from 6-8 continues to increases at the high school level. Both quantity and depth of
knowledge of statistical standards was increased by the adoption of the CCSS-M by most states
in the United States (Rossman & Chance, 2013). CCSS-M’s high school standards are divided
into four domains: Interpreting categorical and quantitative data, making inferences and
justifying conclusions, conditional probability and the rules of probability, and using probability
to make decisions (NGA & CCSSO, 2010).
Standards in the CCSS-M place an emphasis on the understanding of variability in
context especially in their first two domains. These first two domains also emphasize the

87
understanding of tools that can be used to understand variability both numerically and
graphically. Students are required to interpret measures of center and spread while also using
them for comparison between different distributions. Attention to the relationship of these
measures with the shape of distributions also plays a key role. Similarly, students are required to
relate the probability of an event to the normal distribution. The second domain continues in this
relationship by having students make decisions and inferences based on random processes. An
interesting characteristic of the second domain is an emphasis on random processes to describe
events and the use of simulation to help in inference.
The third and fourth domains from statistics and probability in the CCSS-M focus largely
on theoretical rules of probability and the understanding of mathematical representations of
random processes. Some standards place emphasis on applying a rule, while others place more
emphasis on the understanding of a rule. An example of one standard that helps in the
understanding and development of the mathematical formulas for conditional and independent
events requires students to develop this relationship through the construction of two-way
frequency tables. The fourth domain emphasizes the use of mathematical expectations in student
decision making and begins to intertwine the first three domains within the statistics and
probability conceptual category.
Next Generation Science Standards. The development of the Next Generation Science
Standards (NGSS) began in 2011 and went through multiple reviews by the public, state, and
critical stakeholders before being released for adoption in 2013. Though it has not been as
strongly embraced as the Common Core State Standards for Mathematics (CCSS-M) and English
Language Arts, twenty six states lead in its completion and eleven states have adopted these
standards as of June 24, 2014 (National Center for Science Education). The NGSS was

88
characterized by disciplinary core ideas of physical science, life science, earth and space science,
and engineering, technology, and applications science. The NGSS was also characterized by
cross cutting concepts such as patterns; cause and effect; scale, proportion, and quantity; systems
and system models, energy and matter, structure and function, stability and change;
interdependence of science, engineering, and technology; and influence of engineering,
technology, and science on the nature and world.
The third characterization of standards of the NGSS relates to statistics education. The
NGSS discussed eight practices of science and engineering that were essential for students to
learn (NGSS Lead States, 2013). A blue print for implementing these practices was described
first in A Science Framework for K-12 Science Education (National Research Council, 2011).
These eight practices are: (1) asking questions (for science) and defining problems (for
engineering), (2) developing and using models, (3) planning and carrying out investigations, (4)
analyzing and interpreting data, (5) using mathematics and computational thinking, (6)
constructing explanations (for science) and designing solutions (for engineering), (7) engaging in
argument from evidence, and (8) obtaining, evaluating, and communicating information
(National Research Council, 2011). The NGSS acknowledged and suggested overlap in its
practice standards, which was also called for in much mathematics and statistics education
literature (NGSS Lead States, 2013).
Though these practices each relate to statistics education, analyzing and interpreting data
practices has direct relationship to statistical standards. Analyzing data in K–2 built on prior
experiences and progresses to collecting, recording, and sharing observations (NGSS Lead
States, 2013). Analyzing and interpreting data in 3–5 built on K–2 experiences and progresses to
introducing quantitative approaches to collecting data and conducting multiple trials of

89
qualitative observations (NGSS Lead States, 2013). Emphasis in grades 3-5 NGSS practices are
on graphical displays such as bar graphs, picto-graphs, pie charts and informal comparisons of
recorded data to refine or evaluate a problem (NGSS Lead States, 2013).
Analyzing and interpreting data in NGSS grades 6–8 built on K–5 experiences and
progressed to extending quantitative analysis to investigations, distinguishing between
correlation and causation, and basic statistical techniques of data and error analysis. Practices in
this NGSS area focused on constructing, analyzing, and/or interpreting graphical displays of data
and/or large data sets to identify linear, nonlinear, temporal, and spatial relationships while
understanding the difference between cause and correlation. NGSS practices in grades 6-8 also
emphasized the use of mean, median, mode, and variability as tools to characterize and analyze
data then use these tools to make conclusions and improve objects, tools, or processes (NGSS
Lead States, 2013).
Analyzing data in NGSS’ grades 9–12 built on K–8 experiences and progressed to
introducing statistical analysis, comparisons of data sets for consistency, and using models to
generate and analyze data (NGSS Lead States, 2013). NGSS (NGSS Lead States, 2013) practices
in grades 9-12 include using data to fit slope, intercept, and determine correlation coefficients
and apply these values to questions and problems. These NGSS (NGSS Lead States, 2013)
practices also required students to consider the limitations of data analysis as well as compare
and contrast different types of data sets.
Data analysis and statistics is the connection between mathematics and science. For this
reason, it is imperative for both mathematical and science standards to include them in their
content standards. The NGSS, CCSS-MNGA, GAISE, and PSSM correlate very strongly with
one another in relationship to objectives, pacing, and practice. Though content objectives in the

90
NGSS differ in their major scope for student learning via statistics, the NGSS’ emphasis in
practices make them essential within the classroom at all grade levels just as the CCSS-M,
GAISE, and PSSM. Though major content objectives differ in these documents, bridges can be
built between their standards with the use of collaboration between different content teachers and
constructivist teaching principles that use the exploration and collection of real world data (Cobb
& Moore, 2000; Garfield & Ben-Zvi, 2008, 2009).
Advanced Placement Statistics. The Advanced Placement (AP) program began in 1957
as a means for high school students to earn college credit for learning college material
(Klopfenstein & Thomas, 2009). The intention for the creation of the AP program was to reduce
course work repetition in early college years (Klopfenstein & Thomas, 2009). Today the
program has broadened in use as an indicator by colleges for motivation and high achievement
(Klopfenstein & Thomas, 2009). Though the AP program has been shown to be excellent
indicators for higher education, the AP program itself does not cause this effect. When self-
selection of individual students and available opportunities for students were introduced into
models, Klopfenstein and Thomas (2009) found that the AP program did not contribute to
student achievement in higher education.
The AP statistics course was added to the AP program in 1996 as the enrollment of
students in statistics courses in higher education had increased by 45% reportedly by the
Chronicle of Higher Education in 1990. The AP statistics course sponsored by the College Board
takes place in many high schools throughout the U.S. Data reported from Rodriguez (2012) and
Pierson (2013) showed that the numbers of students taking AP statistics has increased
approximately 12% a year but approximately 75% more students are taking AP calculus than AP
statistics. The NAEP’s 2014 state of education reported that in 1990 only 1% of students were

91
taking statistics and probability in high school and in 2013 the amount of students had increased
to 11%.
The topic outline for the AP statistics course encompassed exploring data, sampling and
experimenting, anticipating patterns, and making statistical inference (College Board, 2010). The
College Board (2010) labels a major topic as exploring data, which pushes students to describe
patterns and departures from patterns. The major topic of sampling and experimentation which in
the AP statistics objectives (College Board, 2010) required students to plan and conduct
experiments. Anticipate patterns in the AP statistics course description (College Board, 2010)
required students to understand random phenomena using probability and simulation. The course
description (College Board, 2010) for AP statistics courses in the major topic of statistical
inference required students to estimate population parameters and test hypothesizes. The AP
statistics course outline and descriptions (College Board, 2010) aligned very well with other
standards in the CCSS-M and GAISE.
Differences and Similarities in PSSM, GAISE, CCSS-M, and AP Statistics. The
PSSM, GAISE report, CCSS-M, and AP statistics program mainly provided a set of content and
depth of standards for statistics. Individual course progressions and limitations of how to teach
certain concepts were not given in any of these documents although some examples were given
in the GAISE. A similar characteristic but not the focus in each of these documents push students
to explore and make sense of real world problems. All three sets of these documents push for
active learning by the student in which students develop conceptual understanding through
engaging experiences. Though the GAISE, PSSM, and AP statistics guidelines were more
explicit about the inclusion of active learning principles, the CCSS-M’s inclusion of
mathematical practice standards for students related to many of the active learning principles

92
found within the GAISE and AP statistics documents. A distinctive feature, however, concerning
the difference between the standards for AP statistics and all other three documents was its lack
of instructional principles, which was the reason AP statistics, was not included in statistics
education. It should be noted, however, that the AP statistics section (College Board, 2010) for
instructional practices did cite PSSM (NCTM, 2000) in its discussion of effective teaching
practices.
Though the CCSS-M , GAISE report, and PSSM were released at different times, were
created for different reasons, and serve currently in different roles for statistics education, there is
considerable consistency in respect to the statistical standards of spread, central tendency, and
display methods. The introduction to the spread of data, many times described as variance, in all
three documents was first found in display techniques like histograms, dot plots, and stem-and-
leaf plots in elementary grades. Although the standards did not emphasize the spread of data and
implications of these plots, they lead students to the intuition of spread, differences among
samples, and randomness. These display techniques were expanded upon in middle grade bands
of 6-8 to include box plots and quantitative measures of data variation in the CCSS-M. The
CCSS-M moved some standards of PSSM’s high school grade bands (9-12) to the middle grade
bands (6-8) such as the understanding of variability at a more complex level.
The first quantitative measure for spread within all documents excluding the CCSS-M
was range, difference of the largest and smallest value of a data set. The interquartile range,
difference between the third and first quartile, was included in the GAISE and AP statistics
standards. Interestingly, the CCSS-M did not include range as a content objective in
mathematics. Perhaps with reasoning that the nature of the calculation of range is very prone to
outliers and does not take into effect other observed data points; however, the interquartile range,

93
the first measure of spread in the CCSS-M, is more robust. AP statistics past open-ended
solutions commonly reported range as a measure of spread when comparing distributions.
Though the range and interquartile range are measures commonly reported in statistical
analysis, these measures are purely order based and do not take into account each data point of a
sample and its effect on the actual spread of data. In fact, statistics based on order is called non-
parametric statistics and is usually preferred over parametric methods when outliers may be
present and not disregarded. The GAISE and CCSS-M both introduce the mean absolute
deviation (MAD), a parametric version of the spread of data, as a quantitative measure for spread
at level B and in grade 6 respectively while the AP curriculum does not include it. The GAISE
reports that the MAD, the sum of the absolute differences of the sample mean and each data
point divided by the number of data points, “serves as a precursor to the standard deviation
developed at Level C” (Franklin et. al, 2007, p. 44). AP statistics objectives (College Board,
2010) do not include MAD as a content objective but does discuss range and median.
Actual statistical content objectives for middle grades students from the GAISE, PSSM,
and CCSS-M are very similar and in fact the GAISE report was based from the PSSM. High
school standards in the CCSS-M, PSSM, and levels B and C within the GAISE strongly relate to
AP statistics objectives. The CCSS-M has seventeen standards with nine sub standards (NGA &
CCSSO, 2010). The PSSM had four major objectives with ten descriptions of how to meet these
major objectives (NCTM, 2000). The GAISE report categorized students’ statistical
understanding at levels that do not necessarily correlate with grade. The AP curriculum consists
of seventy numbered standards that are grouped into four major objectives and fifteen
subcategories (College Board, 2010). Although the GAISE report does not imply that levels A, B
and C correspond to elementary, middle grades, and high school, the report makes clear that

94
these are concepts that should be obtained by grade 12 for college statistical readiness. There
were many similarities of level B in the GAISE report content with middle grades content in the
PSSM and CCSS-M.
Probably the most pivotal similarity within these documents and other statistical content
frameworks is their categorization of standards. The GAISE required students to formulate
questions that can be analyzed by the collection of data, select and use appropriate statistical
methods to analyze data, develop and evaluate predictions and inferences based on data, and
apply basic properties of probability (Franklin et. al, 2007). The CCSS-M required students to
interpret categorical and quantitative data, make inferences and justify conclusions, use rules of
probability, and use probability to make decisions (NGA & CCSSO, 2010). The AP statistics
standards required students to explore data patterns, plan and implement statistical experiments,
explore random phenomena using probability and simulation, and make statistical inference
(College Board, 2010). Each of these frameworks subcategorize topics into four very similar sets
of standards: asking statistical questions, data collection, analyzing data, and making
conclusions.
Another important similarity but also difference between the CCSS-M and GAISE is
their setting of specific standards at certain grade levels. The GAISE report does not specify
certain grade levels for specific standards; however, the CCSS-M sets standards for specific
grade levels from K-8 and does not for grades 9-12. The AP statistics standards required students
have taken an advanced high school algebra course before completing the course, thus ensuring
most students are near the end of high school before completing the course (College Board,
2010). Though none of these frameworks requires certain curricula, certain curricula foster some
of the visions, principles, and practices within these documents. School system and teacher

95
selection of curriculum within the classroom should be chosen wisely to foster specific learning
environments (NCTM, 1991).
Programs
Based on the priorities of curriculum, program selection or the intended curriculum plays
a key part of teachers’ enacted curriculum (Stein, Remillard, and Smith, 2007). The selection of
resources and course materials by school leaders lay the foundation for expectations of teachers
and students. With this being the case, resources should be chosen that harness the importance of
context in statistics and focus on student-centered instruction (Cobb & Moore, 1997). Programs
should focus on curricula that foster the development of learning, teaching, and curriculum that
have been previously discussed.
Standards based programs and conventional programs are best used with specific goals in
mind (Stein, Remillard, and Smith, 2007). Standards based programs focus largely on students
building knowledge with the guidance of the teacher while conventional programs lead the
transfer, mediation, and creation of knowledge primarily by the teacher (Stein, Remillard, and
Smith, 2007). Both standards based and conventional programs share the idea that mathematics
should be understood and conceptualized by all. They differ in their emphasis on procedural
skills, standard integration, and emphasis on non-routine problems (Stein, Remillard, and Smith,
2007).
Statistical Progressions
The Common Core Standards Writing Team (CCSWT) (2012) has drafted a progressions
framework for the standards in the CCSS-M. This progression document outlined subdomains of
probability and statistics with connections from the middle school to these domains. In addition
to outlining the progression of the CCSS-M, CCSWT (2012) provided contexts to teach certain

96
standards, explanations of standards, and examples for problems in the CCSS-M standards.
CCSWT (2012) also provided additional mathematics that students should learn in order to be
prepared for more advanced courses. This progression framework related much of the framework
provided through the GAISE.
The CCSWT (2012) was geared largely towards practicing teachers and helping them
understand standards and their connections within the high school CCSS-M. Clear connections
were made to the CCSS-M standards with corresponding descriptions in the margin. The
CCSWT could provide to be an excellent resource for teachers to understand the meaning of a
particular standard or connect the standard to student’s previous knowledge. Using this
document may also paint a clearer picture for how one standard may relate to another.
Chance and Rossman (2001) carried on a healthy debate on possible progressions for
introductory statistics courses and offer arguments and rebuttals for common progression
changes. Their debate focused on four major points: when to teach data analysis in respect to
data collection, when to teach descriptive analyses for bivariate data, when to teach inferences
for means and proportions, and when to teach significance testing in respect to confidence
intervals. Chance and Rossman (2001) did not declare a one size fits all progression, but do
elaborate on the difficulties faced in each progression.
If teachers start classes by focusing on the importance of sampling, they mirror the nature
of statistics (Chance & Rossman, 2001); however, Cobb and Moore (1997) stated that
exploratory data analysis builds confidence for students and introduces them early to one of the
key aspects of statistics variation. Chance and Rossman (2001) also argued that performing
descriptive analysis of bivariate data allows association and causation relationships to develop at
an early stage of the course and be developed throughout. Chance and Rossman (2001) also

97
argued that early bivariate descriptions allow students to build conceptions of variables relating
to one another; however, they argue that this can be negative. Students may look at bivariate
descriptive analysis as largely on using and manipulating formulas. In addition, by waiting on the
introduction of bivariate analysis, students can be introduced to statistical inference of bivariate
data as a complete package rather than focusing on descriptive analysis then reverting back later
in the course to inferential aspects of bivariate analysis.
Chance and Rossman (2001) similarly argued for the incorporation of inferences for
means before or after inferences for proportions. Chance and Rossman (2001) argued that
inferences for both mean and proportion could also be introduced to students as side-by-side
comparisons because of their strikingly similar conceptual framework. The benefits of
proportions rely on one parameter representing both the center and spread of the data and its easy
incorporation into statistical investigations. The benefits of performing mean inferences first
result in students gaining a better understanding of spread alongside of center because of their
separate parameter values (Chance and Rossman, 2001). Though these inference procedures are
similar, there are multiple ways to teach and conduct statistical tests. Chance and Rossman
(2001) argued that randomized experiments lead naturally into hypothesis testing and empirical
rules lead naturally into conceptual frameworks for confidence intervals. Though both hypothesis
testing and confidence intervals are different, they tell much of the same story. Chance and
Rossman (2001) actually implied that they should be connected for students’ conceptual
understanding.
Summary
Three major points emerge from this review of statistics curriculum. First, good teaching
is not just what you teach, but how you teach. Similarities between PSSM, GAISE, CCSS-M,

98
and the AP statistics frameworks make it clear that teaching should foster active learning
principles. What teachers foster inside their classroom through their enacted curriculum will
describe what learning takes place (Stein, Remillard, and Smith, 2007). Resources teachers have
at hand play an integral part in what was performed inside the classroom, thus district leaders,
policy makers, and curriculum leaders who want students to learn how to reason and think
statistically need to put curriculums that foster this in the hands of teachers.
Second, the type of program that is chosen in a school significantly impacts what
happens in the classroom (Stein, Remillard, and Smith, 2007). The priorities of a curriculum
should be well articulated and integrated into the choice of program. Thirdly, progressions of
standards should foster students’ conceptual understanding. Similarities in PSSM, GAISE,
CCSS-M, and NGSS standards progression can be easily extended to AP statistics progressions.
Though different progressions are possible, teachers should have reasons for decisions that
choose to make in progressions and be aware of misconceptions that may arise in certain
progressions (Chance and Rossman, 2001).
In conclusion, progression of standards, goals, and guiding principles should be
integrated. Student learning targets, programs, and progressions in statistics should be clearly
established through sources such as PSSM, GAISE, and CCSS-M. Programs should be chosen
that make seamless expectations between principles of good effective teaching of mathematics
for teachers and mathematical standards for students. These programs should integrate with
expectations from the priorities of the curriculum with standards, practice, and progressions.
School leaders highlight these expectations through the adoption and support of different
programs in their districts.

99
Assessment
Assessments are often used as a means to evaluate students, but assessments should do
more (NCTM, 2014; NCTM, 2001; NCTM, 1995). There is a subtle difference between
evaluation and assessment. The previous section in teaching: eliciting and using evidence of
student thinking developed some key ideas of formative assessment. Evaluations are many times
viewed as summative assessments, a final product that demonstrates student conception or
understanding of a concept (NCTM, 1995). The following section on assessment reviews the
roles different forms of assessment have played in largely the summative or evaluation phase of
statistics education literature.
Projects
Though teachers of mathematics use projects many times as a summative assessment
tool, projects can also be used as methods for students to develop and construct knowledge.
Projects are often used to build and show mastery of the complete statistical process in
introductory statistics courses. Carnell (2008) performed a study treating or assigning two classes
a group statistical project while leaving other class untreated to determine differences in attitude.
To ensure treatment affects were based solely on the given project, Carnell (2008) devoted little
in-class time to the project and change in instructional methods. No significant differences were
found between the two classes in end of course evaluations and student interest in statistics.
Studies such as Carnell’s (2008) highlight the role of the interconnection between assessment,
instruction, and curriculum in the development of attitudes and conceptual understanding. The
inclusion of only a statistical project, with no change in other factors, had no effect on students’
conceptions of statistics.

100
Starkings (1997) highlighted the role the teacher plays in the successful completion of
statistical projects in introductory statistics classes. Starkings (1997) suggested limiting questions
for projects to ensure adequate completion. Starkings (1997) also suggested the use of
collaborative groups and staged assessment to ensure adequate completion of projects. Limiting
question types provides for easier grading by the teacher and provides clear goals for students
but lowers the taxonomic level needed for students to succeed. Starkings (1997) suggested mixed
ability groupings for projects to help students reinforce their own ideas while simultaneously
being peer mentors for others. Starkings (1997) recommended staged assessment as a way for the
teacher to provide feedback to students as they progress through the project. This in turn
provides a means of formative assessment for an assessment tool that was many times used as a
culminating summative assessment tool.
Starkings (1997) suggested two models for assessing projects while using a staged
assessment strategy. The Analysis, Design, Implementation, and Design divides a project into
four stages of assessment that were graded as a group collectively. The 4P model, however,
emphasized more writing in the project and was graded individually through a project log,
written project report, practical development, and project presentation at different stages set by
the instructor (Starkings, 1997). Both of these models could be used differently for projects
within statistics classes; however, it should be noted the interconnection between each of these
stages. Using projects towards the end of a course could help students make the interconnection
of different stages within a statistical study.
Though Starkings (1997) lacked suggestions for specific pedagogical strategies, she did
highlight the role of instruction during the project. Starkings (1997) recommended that project
work should foster an active environment of problem solving and experimentation. Starking

101
(1997) also suggested that asking for certain criteria on the project before it was presented in
class creates problems with project selection and methods used to complete the project. Sarkings
(1997) feedback for students was paramount during and after completion of certain stages and
showed how a project can be used as a means of formative assessment to guide and develop
student understanding. Starkings (1997) advised using a help factor scale, which allows students
to ask for help during the project before the due date with minor deductions. The staged
assessment process should be cohesive with instruction. This can help maximize the
development of student knowledge when using a project (Starkings, 1997).
Ramirez-Faghih (2012) investigated how students’ statistical reasoning and motivation
develop when allowed to complete a statistical project. Ramirez-Faghih (2012) projects were
completed in a college mathematics one class with 73 participants. Ramirez-Faghih’s (2012)
project provided students the opportunity to pick their own topics, write their own survey
questionnaire, collect their own data, and analyze the results. Results concerning motivation
were analyzed qualitatively through Wigfield and Eccles’ (as cited by Ramirez-Faghih, 2012)
Expectancy-Value theory. Results suggested that students “with high values in terms of their
interest, attainment, and utility (positive subjective-task values) can effectively surpass the
relative cost of engaging in the statistical investigation” (Ramirez-Faghih, 2012).
Students in Ramirez-Faghih’s (2012) study who did not complete the project or had
unsatisfactory results had difficulty in developing a research question and writing a survey
instrument which further developed difficulties in data analysis and inference. This finding falls
in line with GAISE recommendations for guided instruction through three cognitive levels of
statistical literacy and misconceptions discussed by Konold and Higgins (2003). This may have
also been assisted through Starkings (1997) proposal of staged assessment during the project.

102
Ramirez-Faghih (2012) found a significant difference between students who completed the
project successfully using categorical data and those who used continuous data. This suggests
further evidence into the relationship between components of statistical thinking and GAISE
process components with informal statistical inference and formal statistical inference.
Ramirez-Faghih’s (2012) lack of focus on pedagogical techniques used by the instructor
was a weakness. This could have potentially influenced student development to complete the
statistical project. The only clear evidence of pedagogy used was homework assignments that
were devoted to the four steps of the project as described earlier (Ramirez-Faghih, 2012). The
second underlying weakness was Ramirez-Faghih’s (2012) pre and post-statistical assessment.
Objectives addressed by the assessment tended to be procedural and did not fit the overarching
scheme of the report to develop statistical reasoning (Ramirez-Faghih, 2012). This also suggests
pedagogical techniques used in the classroom possibly did not support the development of
statistical reasoning as proposed by the CCSS-M, AP standards, and GAISE report but instead
focused on statistical literacy separate from reasoning and thinking.
Studies reviewed in this section concerning projects have highlighted the use of projects
as a means to develop cognition and affection towards statistics. These studies have also stressed
the impact of alignment between projects and the goals of instruction (Ramirez-Faghih, 2012).
An important characteristic of projects that have been used positively in the statistics classroom
have focused on the assessment tool as not just an evaluation instrument but as a tool used to
build and assess understanding, blurring the lines of a project being strictly a formative or
summative assessment tool.

103
Portfolios
In statistics and mathematics instruction, portfolios are many times used as summative
assessments in which students present some of their best work. Research on the use of projects
and portfolios, however, encourages providing ongoing support and feedback for particular
phases of the process. Keeler (1997) discussed the use of a portfolio in her graduate level
statistics course as a way to develop students’ ability to incorporate research models and
complete statistical procedures. Keeler’s (1997) article was largely divided into four sections: the
use of a portfolio in a constructivist-learning environment, the development of a portfolio, a
portfolio sketch, and issues and concerns in the use of portfolios as an assessment tool.
The use of portfolios has the ability to tie directly into a constructivist framework of
learning. Teachers using a constructivist approach to instruction construct their own
understandings instead of inertly absorbing or replicating the understandings of the instructor.
Keeler (1997) stated, “learning is the result of an action in which students participate, not the
inevitable product of encountering materials” (p. 3). The use of a portfolio maintains this
environment in the assessment phase of instruction making teaching in a constructivist manner
seamless in the classroom. Students become responsible for their own learning and improvement
during assessment.
Keeler (1997) maintained the following three criteria should be communicated to
students when using a portfolio as an assessment: the assessment purpose, the criteria or methods
for determining what was put into the portfolio, and the evaluation criteria for scoring the pieces
or the collection. This directly relates to the openness standard in NCTM’s (1995) Assessment
Standards. Keeler (1997) stated, “the portfolio can do what traditional assessment in most cases
does not do, provide direct evidence for evaluating the student’s progress over time, at mastering

104
the essential concepts and techniques of the course” (p. 4). The portfolio becomes meaningless
without clearly identifying a goal, incorporating ways for this goal to be accomplished, and
determining a way that this can be analyzed in a meaningful way,
Driessen et. al (2006) described a portfolio’s goal as a means to measure students’ ability
to reflect on the professional and personal development. Unique to the portfolio assessment was
the students’ ability to determine what should be included in the portfolio (Keeler, 1997).
Because of this, teachers must be especially careful to provide opportunities for students to
engage in meaningful work. Finding meaningful activities and students incorporating these
activities in the portfolio can be ways of monitoring student progress in learning.
Keeler’s (1997) use of the portfolio in the graduate course also reflected the traditional or
longitudinal portfolio where student work was gathered over time in order to demonstrate
growth. Keeler (1997) used periodic checks of student work to make the assessment technique
more formative and open in grading by providing written feedback to students. Keeler (1997)
also exemplified student work that demonstrated goals for the assessment. A portion of Keeler’s
(1997) portfolio required students to correct their tests and highlight areas of weakness or further
study. The incorporation of a reflective journal by Keeler (1997) also allowed the teacher to
reflect on the cognitive processes of students. This process also served as a metacognitive
process for students in which students learn about how they learn best (Keeler, 1997) and
develop the habits of mind of a continuous learner and statistician.
Delcham and Sezer (2010) compared a traditional college statistics course where
information was conveyed to students and students provide results with limited in-class support
from the instructor to a writing centered classroom where the teacher uses writing assignments to
evaluate student understanding throughout the course very similar to a portfolio. Delcham and

105
Sezer (2010) emphasized the role of writing and reading skills and the need for nurturing of
development of these skills in the classroom. Delcham and Sezer (2010) posed nine assignments
in this writing intensive class that focused on particular content areas. Delcham and Sezer (2010)
writing assignments focused around topics such as explanations of graphical representations and
appropriate uses of central tendency to the normal probability distribution and its relationship to
the central limit theorem and sampling distributions. Though Delcham and Sezer (2010) did not
attempt to compare results of a writing centered class with other approaches, the need for writing
within statistics was apparent. Attending to and requiring writing in a statistics had positive
consequences for Delcham and Sezer (2010) teaching and their respective students.
This section has highlighted the potential impact of portfolios in a range of classrooms
especially a constructivist learning environment. Positive use of portfolios in a classroom should
focus around student metacognition of statistics through writing. Portfolios allow opportunities
for students to clarify understanding and prove conception of big ideas. These works also
provide teachers the opportunity to guide instruction and provide for a means of summative
assessment for their course.
Multiple Choice Tests
The Statistical Reasoning Assessment (SRA, Garfield & Chance, 2000) instrument is a
multiple choice test in which choices were statements of reasoning for a particular solution. The
SRA was developed as part of the ChancePlus Project in an attempt to understand student
reasoning by the use of multiple-choice tests (Garfield & Chance, 2000). The SRA (Garfield &
Chance, 2000) focused on reasoning about data, statistical measures, samples, uncertainty, and
association and misconceptions such as sample size, outcome orientation, averages, law of small
numbers, representativeness of a sample, and equiprobability bias.

106
The Comprehensive Assessment of Outcomes in Statistics (CAOS) was a test designed
by DelMas et. al (2007) through an NSF grant entitled Assessment Resource Tools for
Improving Statistical Thinking (ARTIST). The test was designed over a three-year process of
question construction and test validation with teachers of statistics (delMas et. al, 2007). Test
questions required students to think through and reason with statistics rather than compute
formulas, recall definitions, or use formulas (delMas et. al, 2007). During the construction, two
large class assessments were given to students in high school AP statistics courses and
introductory statistics courses at the tertiary level and a smaller assessment was given to 30
teachers of statistics (delMas et. al, 2007). Results from individual portions of the assessment
showed little improvement in students understanding of visual and descriptive representations of
standard deviation, extrapolation during regression, spread within data given boxplots,
probability from a two way table, understanding of sampling variability and confidence intervals
(delMas et. al, 2007).
Though Delmas et. al’s (2007) article went into detail concerning specific test questions,
the focus on overall test results were interesting. The reliability coefficient, Cronbach’s alpha,
from the latest version was .81 showing acceptable internal consistency in questioning (delMas
et. al 2007). The large scale testing showed increases of only approximately 9% from 44.9% to
54.0% in all pre-test and post-test scores (delMas et. al, 2007). Though this increase was not very
large, it was found to be significant at the 1% alpha level in the study (delMas et. al, 2007).
Disaggregation of testing results showed that questions had gains from 23% to 60% while others
had decreases in results from 7% to 15% (delMas et. al, 2007). Although Slauson (2008) found
improvement in once class focused on group work and not in one lecture based classroom with
the use of the CAOS, results from large-scale implementation beg the question to what were

107
these instructors doing differently than one another to promote achievement on the CAOS
assessment.
The AP Statistics exam consists of 40 multiple-choice questions in 90 minutes (College
Board, 2010). Questions on the test do not require intensive calculations such as standard
deviation, but do require students to use formulas appropriately and technology to calculate these
results (College Board, 2010). Questions require students to use statistical output to calculate
statistical tests or perform statistical analysis using a graphing calculator (College Board, 2010).
Even though these types of questions were intertwined in the assessment and different from SRA
and CAOS questions, some questions focus on conceptual ideas of central tendency, graphs,
variation, and interpreting results correctly. Different than the SRA and CAOS assessment, the
AP multiple-choice section did not provide reasoning for specific answers but does provide
distractors for student misconceptions. There were also questions on the AP multiple choice
exam (College Board, 2010) that require the calculation of conditional, independent, binomial,
and other probabilities that makes it drastically different than the CAOS assessment and more
similar to the SRA.
Open Ended Responses
The AP statistics exam (College Board, 2010) is also composed of an open-ended section
where students must construct and justify their solutions to problems in 90 minutes. The six
questions in this section are divided into different parts that probe students understanding into
major components of the AP curriculum (College Board, 2010). One of these five questions is an
investigative task involving more extended reasoning (College Board, 2010). The AP College
Board (2010) stated that statistics is a discipline where clear and complete communication is
essential, thus this section of the exam requires students to use these skills to solve non-routine

108
problems. These problems relate major curriculum topics in the course and requires students to
validate their statistical reasoning. Though these problems require the connection of ideas in the
AP statistics class, the problems are many times subdivided into specific portions to ensure
equitable grading and to provide openness (NCTM, 1991) to students during the assessment
process (College Board, 2010). The AP exam weighted each portion of its test as 50% multiple
choice, 25% open ended response questions 1-5 and 25% for the investigative task.
Even though open-ended questions elicit the most knowledge of students’ statistical
reasoning and thinking, they are extremely hard to evaluate on large scales. Garfield and Chance
(2000) discuss this extensively. Large groups of teachers grade the AP open-ended statistics test
in June and July of each calendar year, and graders have explicit instructions on what to count as
partial and essentially correct solutions. In order for students to perform well on this portion of
the exam, it is imperative that they understand what graders were looking for when asked
specific questions. When asked to compare distributions, students are required to describe
differences and similarities in shape, outliers, spread, and center. These questions often did not
explicitly state the requirements for full credit. Similarly, students are required when asked to
perform statistical tests to check for certain conditions, state null and alternative hypothesizes,
perform the calculation correctly, and make appropriate conclusions that are not explicitly stated
in directions. Based on these grading procedures, a three-part question many times becomes sub-
divided into six graded portions in which the students must understand and explain engrained
questions to perform well on the test.
Summary
Though decisions about what assessments or evaluation tools used at district, state, and
nation levels may be out of the hands of teachers, teachers can often choose assessment tools in

109
their classroom. Thus, teachers should understand that their use of assessment fosters and
encourages what students perceive as worthy within the classroom (Healy & Hoyles, 2000;
Chance, 2002). Questions that teachers use can bring out reasoning that helps develop student
understanding (Garfield, 2003; Smith & Stein2011). An important conclusion from both Healy
and Hoyles (2000) and Brenner, Herman, Ho, and Zimmer (1999) is that students should be
encouraged to use multiple representations to show understanding and make connections within
mathematics. The use of projects, portfolios, multiple-choice tests, and open-ended responses all
have benefits and drawbacks in use and ability to develop student reasoning. Forms of
summative assessment in this section have been shown to be valid ways of understanding
students understanding, but assessments must do more. Summative assessments should be used
to improve mathematics and statistics programs. Using assessments in these ways will in turn
improve student learning (NCTM, 1995). It is important for teachers to not only understand the
purposes of certain assessments but also use assessments to progress student understanding and
program development.
Synthesis
Biggs (2003) and Webb (1997) described the importance of alignment between
assessment, teaching, learning, and curriculum in program development. Sowder & Schappelle
(2002) categorized mathematics education research into four sections of teaching, learning,
assessment, and curriculum, recognizing the overlap within research of these separate but equally
important ideas. NCTM’s Professional Standards for Teaching Mathematics (1991) similarly
described the alignment of curriculum, assessment, teaching, and learning as being pivotal for
students, instructors, school systems, and industry. NCTM (2014) discussed the use of learning
and teaching with curriculum and assessment as key components to improving mathematics

110
education. Documents such as these have outlined the importance and interconnection of
learning, teaching, technology, curriculum, and assessment. These interconnections are just as
important in statistics education.
Teachers’ goals for instruction play a critical role in what should be taught within the
statistics classroom (Chance, 2002). Though literacy is important, it can be argued that reasoning
and thinking are just as important (Chance, 2002). If readers and users of statistics are to be truly
literate, they must understand all of the components of the statistical process that validate a study
or could make a study invalid (Chance, 2002). Reviews from the literature have proposed four
focuses of introductory statistics instruction: asking statistical questions, the data collection
process, analyzing data, and making conclusions. In order for teachers to develop reasoning and
thinking, specific attention should be played to each of these areas of the introductory statistics
course.
If teachers want students to be able to think and reason with statistics, teachers need to
incorporate reasoning into their assessment practices (Chance, 2002; Garfield, 2003). If students
are to reason through statistics, teachers should be give students opportunities to develop this
reasoning in class. Teachers need opportunities to elicit and use evidence of student reasoning in
the guiding of instruction and discussions. Students should also play a key role in the assessment
process. When students are a part of the assessment process, they are more likely to develop
reasoning and thinking ability, control for misconceptions, and create an open environment for
assessment (Garfield, 2003; Chance, 2002; NCTM, 1995).
Teaching practices should promote student growth through clear learning goals and tasks
that promote reasoning, sense making, and connection to prior knowledge (NCTM, 2014). Even
though not as much attention to what teachers do in the classroom has been observed in statistics

111
education literature, mathematics education literature has played particular importance to this.
Teachers supporting productive struggle, posing purposeful questions, and promoting productive
discourse are essential in moving students forward in reasoning and thinking. When teachers
attend to teaching practices, they are more likely to promote statistical reasoning and thinking.
Building procedural fluency from conceptual understanding and using representations to
foster this process have been studied in statistics education literature (Jacob, 2013; Feldman,
Konold, Coulter, & Conroy, 2000; Mokros & Russell, 1995; Konold, 2002; Leman & House,
2012). Students’ development of statistical reasoning is prominently tied to visualizations and
experiences they have in the classroom. Premature exposure to algorithms has been shown to
interfere with students’ conceptual understanding of important mathematical and statistical
content. For these reasons, it is important for teachers not focus as much on traditional
algorithms in introductory statistics courses but on the development of reasoning and thinking
skills. Statistical reasoning and thinking skills are vital to the understanding of the complete
statistical process.
Teachers should use technology to help develop students’ understanding of statistical
content that is difficult to visualize and understand in small classroom experiments (Cobb, 2013).
Importantly, the use of technology should be used to help develop students understanding
through tasks that allow them to explore and make sense of problems themselves (Chance et. al,
2007). For teachers to use technology effectively in the classroom, it has been shown that
teachers and teacher educators should attend to the intersection of statistical content knowledge,
pedagogical knowledge of statistics, and the knowledge of technology in statistics (Wild and
Pfannkuch, 1999). Research has highlighted the need for the integration of statistical content
knowledge, pedagogical content knowledge, and statistics technological technology to ensure

112
technology is used effectively (Lee & Hollebrands, 2011; Bayés, Meletiou-Mavrotheris, &
Paparistodemou, 2014).
Context and variation have been discussed as important elements separating
mathematical and statistical reasoning (delMas, 2004). DelMas (2004) suggested that
mathematical problem solving is independent of developing questions, collecting data, and
making conclusions in statistics (delMas, 2004). For this reason, it is imperative for instruction in
the introductory statistics classroom to allow students to deal with real world data and
mathematics simultaneously. The collection of data introduces variability at early stages within a
statistics course and allows students to understand this from different points in statistics such as
the sampling and analysis stage. This data could be extracted from the classroom or through data
sets to help promote meaningful contexts that stimulate certain important concepts such as
variation (Shaughnessy et. al, 2009). Using real world data also promotes affective catch and
hold strategies that have been shown to increase student affection (Mitchell, 1993). Using
meaningful data sets will in essence promote student interest and create meaningful contexts for
students to investigate and develop statistical reasoning and thinking.
This review of literature has shown four key ingredients to advancing student
achievement in statistics. The first goal for any instructor should be to set clear goals for their
students that promote statistical literacy, reasoning, and thinking in the cognitive domain and
interest in the affective domain (NCTM, 2014). Once these goals are in place, teaching strategies
that promote literacy, reasoning, and thinking should be incorporated (NCTM, 2014). These
teaching practices should use curriculum and technology that foster the development of the
students’ cognitive and affective goals. In the midst of these teaching strategies, assessment

113
should be used to elicit student understanding in obtaining these goals and used to improve
individual and program achievement.
Statistical Reasoning Learning Environments
The previous sections have highlighted the need for learning statistics with literacy,
reasoning, and thinking. Statistical reasoning and thinking are clear goals for instruction that
require much more effort to develop and assess. The use of effective teaching practices that
incorporate technology, curriculum, and assessment as learning tools have been said to increase
students’ statistical reasoning and thinking. The description for the integration of teaching,
technology, curriculum, and assessment that Garfield and Ben-Zvi (2008, 2009) have
summarized foster statistical reasoning and thinking in a description.
Garfield and Ben-Zvi’s (2008, 2009) description of a socio-constructivist approach to
instruction was called the Statistical Reasoning Learning Environment (SRLE). Instruction with
use of the SRLE alls in close alignment with NCTM teaching principles (2014, 2000) that foster
student engagement and classroom discourse between students and the teacher, NCTM
professional teaching standards to promote discourse (1991), and other educational research on
promoting discourse (Shaughnessy et. al, 2009; Middleton & Jansen, 2011; Smith & Stein,
2011). The SRLE also includes components of assessment that include students in the
assessment process and use assessment to advance student reasoning and thinking. The SRLE
has six principles of instructional design that are aligned with Cobb and McClain (as cited by
Garfield and Ben-Zvi, 2009).
1. Focus on developing central statistical ideas rather than on presenting set of tools and
procedures.

114
2. Promote classroom discourse that includes statistical arguments and sustained exchanges
that focus on significant statistical ideas.
3. Use assessment to learn what students know and to monitor the development of their
statistical learning as well as to evaluate instructional plans and progress.
4. Integrate the use of appropriate technological tools that allow students to test their
conjectures, explore and analyze data, and develop their statistical reasoning.
5. Use real and motivating data sets to engage students in making and testing conjectures.
6. Use classroom activities to support the development of students’ reasoning.
Though empirical studies of teaching practices in introductory statistics have been
lacking (Baglin, 2013; Loveland, 2014; Chance & Garfield, 2002), there have been many
pedagogical practices presented in this literature review that describe ways to develop statistical
reasoning and thinking. Garfield and Ben-Zvi (2008, 2009) did not separate their key ideas into
teaching, learning, curriculum and assessment categories; however, their inclusion of each of
these elements in the SRLE implies that the SRLE framework will be extremely applicable and
useful for monitoring statistical classrooms holistically based on this literature review. It is
hypothesized that effective use of Garfield and Ben-Zvi’s (2008, 2009) Statistical Reasoning
Learning Environment (SRLE) can promote statistical reasoning based on this synthesis.
There has been minimal empirical evidence to what extent the SRLE in its entirety does
in fact improve students’ statistical reasoning and thinking (Baglin, 2013; Loveland, 2014).
Garfield and Ben-Zvi (2009) also believed that the SRLE approach to statistical instruction could
promote student interest in statistics. This question, however, is not be addressed in this study
because of students’ current lack of experience with what statistics is before entering an
introductory course (Reid & Petocy, 2002; Bulmer & Rolka, 2005; Bond, Perkins, & Ramirez,

115
2012). This lack of true understanding currently in the population at large makes affective pre-
tests not very affective in true measurement of affection on a large scale.
Constructivist Theory
Based on the description of the SRLE’s six components and its categorization as a socio-
constructivist learning environment, this section briefly describes the constructivist theory.
Current views of constructivism come largely from ideas of John Dewey’s pragmatism (Brewer,
2007). Dewey’s ideas were revolutionary in American Education in the 1920s because most
classrooms at the time were teacher centered, controlled by the teacher, lecture and text based,
and large amounts of oral written recitation (Brewer, 2007). Dewey believed curriculum should
be based on students’ interests and involve active experiences (Brewer, 2007). Dewey also
believed that active curriculum should be integrated, rather than divided into subject-matter
segments (Brewer, 2007). Dewey (Brewer, 2007) believed teachers were responsible for
achieving the goals of the school, but the specific topics to be studied to meet those goals cannot
be determined in advance because the topics should be of the interest to the children (Brewer,
2007).
Dewey believed that learning was active and schooling was unnecessarily long and
restrictive (Neill, 2005). He believed that students should be actively involved in real-life tasks
and challenges (Neill, 2005). Dewey's educational philosophy helped forward the progressive
education movement (Neil, 2005). This philosophy of education began the development of
experiential education programs and experiments (Neill, 2005). These views of pragmatism are
very similar to today’s view of constructivism.
Though Dewey’s ideas of learning are very similar to constructivist principles today,
constructivism today is said to center on ideas from Lev Vygtosky (1978) and Jean Piaget

116
(Wadsworth, 1996; Broody & Davidson, 1998). Piagetian constructivists believe that knowledge
is constructed through an individual process (Wadsworth, 1996). Social constructivists, such as
Vygtosky (1978), believe that knowledge is not located in individuals but rather in communities.
How the learner constructs this knowledge is one of the main differences between constructivist
and socio-constructivist theories. Both constructivist methodologies encourage hands-on
approaches to teaching; however, the socio constructivist view focuses on this development
being constructed in cooperative settings of discourse (Brody & Davidson, 1998). Current
movements related to constructivism are very socio-constructivist in nature using learning in
cooperative groups and meaningful tasks that promote discourse (Brody & Davidson, 1998).
Teachers who promote socio-constructivist views depended on group interaction and learning
activities and assignments that foster the development of knowledge. Both constructivist and
socio-constructivist approaches encourage trial and error, experimentation, and interaction with
learners, guided by instructors, which allow students to develop their own understanding from
real life context (Brody & Davidson, 1998).
The introduction of constructivist learning theory into the American education system has
not been completely embraced since its inception, thus classroom-teaching philosophies are still
very diverse (Klein, 2003). This paradigm has caused researchers to coin the term “reform
mathematics” as efforts to shift from the behaviorist approaches to instruction to constructivist
approaches. Because of the overlap between teachers’ experiences and teacher education, the
ability to monitor “reform mathematics” classrooms has been a challenge for researchers.
Measuring Conformity of Instruction with Constructivist Theory
The Constructivist Learning Environment Survey (CLES) was first presented at the
American Education Research Association in 1991. The main purpose or use of the first CLES

117
survey was to monitor reform efforts of teachers towards constructivist instruction (Taylor,
Fraser, & White, 1994). Taylor et. al (2004) modified the original CLES toward use in a
mathematics classroom. Taylor et. al (1994) discussed how the CLES could also be used as a
predictor or criterion variable for other studies. Even though these were the practical uses of the
CLES in research, Taylor et. al (1994) largely focused on the viability of the CLES scales to
understand the mathematics classroom through triangulation of multiple sources. The CLES
scales were personal relevance, shared control, critical voice, student negotiation, and
uncertainty. Taylor et. al (1994) believed that a constructivist-learning environment should
promote the use of these scales.
Personal relevance questions within the survey attempted to monitor how students’
everyday lives were being used as a meaningful context to develop knowledge (Taylor et. al,
2004). The shared control scale monitored how students were developing as autonomous learners
by monitoring their own learning and developing learning activities or assessments that build
their knowledge (Taylor et. al, 2004). The critical voice scale monitored the extent at which
students have a voice to control the pedagogical techniques and instruction within the classroom
(Taylor et. al, 2004). The student negotiation scale related very similarly to the other three scales
(Taylor et. al, 2004); however, this scale was geared more toward monitoring how well the
teacher moves away from individual and cooperative group assignments of working and
checking problems, to classrooms where students explain reasoning and justify results from
learning activities. The uncertainty scale attempted to monitor the myth that mathematics exist
independently from human experience as well as the coexistence of multiple answers and
pathways to problems (Taylor et. al, 2004).

118
Support for the scales was provided quantitatively and qualitatively (Taylor et. al, 2004).
Means, standard deviations, and Cronbach’s alpha were provided for each scale (Taylor et. al,
2004). A correlation matrix was also provided between the scales (Taylor et. al, 2004). Questions
with low correlation or negative correlation within each scale were also discussed (Taylor et. al,
2004). The researchers largely used the statistical analysis to subdivide groups for qualitative
interviewing (Taylor et. al, 2004). Researcher’s semi-structured interview questions focused on
survey questions that had large standard deviation and survey questions that had low or negative
correlation with similar scale questions within the pilot class (Taylor et. al, 2004). The
interviewer had observed the class many times and attempted to create an atmosphere where
students would feel free to share their concerns (Taylor et. al, 2004). The class being investigated
was using a 9-week study of how to find the surface area of an egg and one of the researchers
involved in the study was that actual teacher with 13 years of teaching experience (Taylor et. al,
2004).
The original CLES consisted of samples of over 500 students; however, the sample for
the mathematical revision of the survey consisted of only 34 students in eighth or ninth grade
from Australia (Taylor et. al, 2004). The 34 students consisted of only one class in which one of
the authors of the study taught (Taylor et. al, 2004). Findings from the study suggested that
negatively worded questions on the scale might create conceptual difficulties for students to
respond accurately to on a scale that produces negative results (Taylor et. al, 2004). Questions
that were geared towards absence of constructivism in the mathematics classroom did not
directly relate to the appearance of these criteria possibly because of cultural contexts of
mathematics and past experiences in the mathematics classroom (Taylor et. al, 2004).
Questioning of student responses after the survey also revealed that classroom pedagogies,

119
constructivism in particular, may not be mutually exclusive from one another and may actually
work side by side especially in the perceptions of students involved (Taylor et. al, 2004).
Researchers completing this project cautioned others considering use of the survey to monitor
the development of the constructivist environment because of students’ past experiences and
diverse conceptions of their future (Taylor et. al, 2004).
Similar to the CLES, Henry (2003) attempted to measure the learning environment of
Florida middle school classrooms through the development of a teacher survey. Henry (2003)
created separate scales for both traditional approaches and constructivist. Scales were grouped to
encompass classroom management approaches, teaching activities, and assessments that were
sub categorized as traditional or constructivist (Henry, 2003). Henry’s (2003) sub scales
encompassed teacher control, teacher rigidity, and teacher presentation to measure traditional
approaches of classroom activities. Student engagement and student control variables were used
to quantify the amount of constructivism in classroom activities (Henry, 2003). The amount of
constructivism towards assessment was monitored through subscales of teacher or student
control and types of assessment used in the classroom (Henry, 2003). Classroom management
subscales were teacher control, centrality of instruction, and student interaction (Henry, 2003).
Through piloting the survey in a smaller setting, Henry (2003) was able to reduce the questions
from 71 to 57 and increase internal reliability by removing questions that were inconsistent with
the scale, producing a Cronbach’s reliability coefficient well above .6 on all scales. The final
version had decreases in reliability coefficients, which would be expected without any
bootstrapping or hold out procedures from the pilot study; however, the final reliability for all
scales was still over .6 with the exception of teacher control on both the assessment and teaching
methods scales that were not included in the original pilot (Henry, 2003). Henry’s (2003) scales
120
showed strong positive correlation between constructivist approaches scales and traditional
scales. Interestingly, however, Henry (2003) did not report cross correlations between the
assessment, management, and activities scales.
Hassad (2011) chose to survey teachers to understand students’ learning environment, but
chose to focus on specifically introductory statistics classrooms. Hassad (2011) claimed to have
developed a first of its kind survey, Teaching of Introductory Statistics Scale (TISS), to
understand behaviorist and constructivist approaches of tertiary level statistics teachers. Hassad’s
(2011) TISS survey was originally constructed of 14 different type items that were reiterated up
to 30 times in the survey. These items were shared with different statistical instructors from
different fields (Hassad, 2011). Two different forms of qualitative analysis via in person
interviews or e-mail correspondence followed this (Hassad, 2011). After the qualitative analysis,
questions were revised, added to, and removed based on consensus of interviews and
administered to 30 statistical instructors via e-mail (Hassad, 2011). Following this pilot, items
were assessed for variability and validity with potential discriminant value for each item
(Hassad, 2011). Items believed to need revision were discussed with teachers of introductory
statistics courses then finalized to a set of 10 items for large sampling (Hassad, 2011). The final
versions sampling consisted of 227 statistical teachers involved with different professional
organizations, department heads dissemination in public four-year institutions, and published
research in statistics education (Hassad, 2011).
Hassad (2011) claimed orthogonality between the two scales, however it has been shown
that behaviorist and constructivist approaches may be mixed in many statistics and mathematics
classrooms, especially those of teachers who were experiencing pedagogical transition (Zieffler,
Park, Garfield, delMas, & Bjornsdottir, 2012; Fraser, 1998). Interestingly, Hassad (2011) found

121
through international sampling that behaviorist approaches were more common in the United
States and with professors having mathematics and engineering degrees. Constructivist
approaches were more common with instructors who were affiliated with professional
organizations (Hassad, 2011). The final scale factors used in the study were deemed reliable, but
difficulty still existed in the non-orthogonal nature of behaviorist and constructivist theories for
disaggregation purposes (Hassad, 2011). Note that Hassad’s (2011) survey fails to segregate the
relationship between instruction, curriculum, and assessment in behaviorist and constructivist
pedagogical techniques, which may contribute to lower reliability between the two scales.
Zieffler et. al (2012) similarly chose to survey teachers to understand learning
environments of introductory statistics classes in the post-secondary and AP Statistics setting.
The Statistics Teaching Inventory (STI) (Zieffler et. al, 2012), was a fifty item survey that
underwent different phases before its final revision and large-scale dissemination. Zieffler et. al
(2012) briefly discussed similar studies and gave references to similar elementary, secondary,
and tertiary schools studies. The aim of this survey was to determine how teachers of statistics
within post-secondary education conform to the traditional approach to teaching and reform
based instruction (Zieffler et. al, 2012). Zieffler et. al (2012) also associated their survey to the
SRLE. Definitions were given for these two methods of teaching with emphasis on the GAISE
report for reform-based instruction. Of the 101 participants in the pilot study (response rate
25%), over 75% reported familiarity with the GAISE report and 75% of those reported teaching
practices that were either mostly or completely aligned to the GAISE report. Graphs within the
report implied a significant portion of those surveyed straddling a statistical instruction fence of
behaviorist and constructivist approaches (Zieffler et. al, 2012). Zieffler et al. (2012) suggested
one possible reason: administration of the survey might itself cause change within the teacher.

122
The STI’s initial and final survey questions were grouped into mainly four categories not
including demographic questions: teaching practice, assessment practice, assessment beliefs, and
teaching beliefs (Zieffler et. al, 2012). The original survey pilots contained 102 items that were
administered to the Consortium for the Advancement of Journal of Statistics Education
Undergraduate Statistics Education (CAUSE) and the Research Advisory Board of CAUSE. NSF
advisors to the project also provided written feedback of the pilot version of the test. After the
pilot, questions were refined and reduced (Zieffler et. al, 2012). After revision of the initial
survey, questions were read aloud to faculty teaching statistics in Florida and analyzed
qualitatively to ensure the questions were measuring what was intended (Zieffler et. al, 2012).
After interviews and analysis were completed, researchers reduced the survey to 50 questions
and completed a small pilot in Minneapolis/St. Paul area to create the version of the STI reported
by Zieffler et. al (2012).
Zieffler et. al (2012) mentioned that surveys were not always adequate measures, so an
interview process was used to help with this discrepancy. Often what teachers reported was
different from what was actually observed in classrooms (Zieffler, 2012). Zieffler et. al (2012)
discussed that there was a low volunteer resampling for interviews. Even with a survey followed
by an interview process, what happens inside the classroom cannot be appropriately judged
without actual observations of classrooms.
Based on misperception of teacher’s use of constructivist principles, a student survey has
often been used for cross validation of learning environments (Fraser, 1998). A student survey
also corresponds with ideas from constructivist theory, that knowledge was not just disseminated
from the teacher to the students, but rather created by the students and facilitated by the teacher.
Based on this view of the construction of knowledge, the best place to monitor the learning

123
environment should be through the learners who create and live within the environment both the
teacher and students. However, a relevant student survey to measure a statistical classroom’s
learning environment was not found in the literature.
Research has shown that the degree to which a classroom is a constructivist-learning
environment can be measured (Taylor et. al, 1994; Hassad, 2011; Zieffler, et. al, 2012); however,
difficulties do exist with teacher perception and reality. Taylor et. al’s (1994) and Henry’s (2003)
research on the monitoring of constructivism in mathematics classrooms pointed out the need for
clarity in measurement. Hassad (2011) and Zieffler et. al (2012) both focused attention to
measurement of constructivism in statistics classrooms. Taylor et. al (1994) and Henry (2003)
used much more broad subscales to monitor this development while Hasad (2011) and Zieffler
et. al (2012) used much more content specific terminology.
Research Questions
The previous sections have highlighted the role that teaching, learning, curriculum,
technology, and assessment have on student achievement. These sections have also highlighted
the fact that it is not just what you teach, but how you teach. Current empirical studies have
lacked the combination of teaching, learning, curriculum, and assessment in monitoring students’
learning outcomes however. Additionally, empirical studies measuring reasoning and thinking
are lacking related to teaching, learning, curriculum, and assessment (Baglin, 2013; Loveland,
2014). There have also not been studies monitoring the development of students’ statistical
reasoning and thinking composed of multiple teachers’ use of active learning and lecture based
classes. In addition, current statistics instruction teacher surveys (Zieffler et. al, 2012; Hassad,
2011) have not been linked to reasoning and thinking assessments such as the CAOS and SRA.

124
This study attempts to fill the void in the lack of empirical evidence to monitor the
students’ increase in statistical reasoning and thinking with instructional practices from the
mathematics and statistics education literature. In addition, this research also attempts to fill the
gap of generality for best teaching practices by monitoring multiple teachers’ use of instructional
practices rather than just one. Based on these gaps in the literature, the following research
questions were developed:
1) To what extent do students’ statistical reasoning and thinking ability improve in classrooms
that show high levels of conformity to a Statistical Reasoning Learning Environment?
2) To what extent do students’ statistical reasoning and thinking improve in classrooms that do
not conform to a Statistical Reasoning Learning Environment?
3) To what extent do students’ ability to reason and think about statistics differ between classes
that do and do not conform to a Statistical Reasoning Learning Environment?

125
Chapter 3: Methodology:
The intent of this study was to show the effectiveness of the six components of the
Statistical Reasoning Learning Environment (SRLE) (Garfield and Ben-Zvi, 2008, 2009) in
developing students’ statistical reasoning. This chapter begins with a description of the
postpositivist theoretical framework underlying the study. The design section then describes the
need and use for quasi-experimentation. The chapter then details instrumentation used to
measure conformity to SRLE principles and gains in statistical reasoning. Next, this chapter
describes the population and methods used for recruitment. Following this, the chapter details
procedures for matching teachers on two levels of teacher demographics and one level of student
demographics. Finally, the section presents methods of data analysis to answer the research
questions with their required assumptions for use.
Theoretical Framework
Simon (2009) advocated that researchers must be proponents of different theories of
knowledge other than their own worldviews or philosophies. Using theories of knowledge as
tools and lenses emphasizes the fact that certain theories may be more effective at answering
certain questions than others (Simon, 2009; Bernard & Ryan, 2010; Creswell, 2013). Creswell
(2013) stated that to build a new theory, one must first advance a theory, collect data to test it,
then reflect on whether the theory was confirmed or disconfirmed by the results in the study. The
review of literature in this study identified aspects of teaching, learning, technology, curriculum,
and assessment that may have influence on students’ ability to reason and think about statistics.
Based on these pedagogical techniques, the Statistical Reasoning Learning Environment (SRLE)

126
was chosen as an effective framework to represent factors that influence statistical literacy,
reasoning, and thinking.
A postpositivist epistemology forms the basis for this study, using quantitative tools to
answer the research question (Creswell, 2013; Bernard & Ryan, 2010). A postpositivist
epistemology was chosen because this philosophy has elements of logic, cause and effect, and
determinism based on a priori theories (Creswell, 2013), in this case examining how well the use
of an SRLE, an a priori theory, influences students’ statistical reasoning.
Causation is limited by the use of a postpositivist epistemology. Specifically, using a
single measure to understand students’ development of statistical reasoning, as was the case in
this study, may not adequately capture all the effects of the SRLE. This study’s use of the
Comprehensive Assessment of Outcomes (CAOS) (delMas et. al, 2007) is limited in its ability to
measure student reasoning by only containing multiple choice questions. In fact, Garfield (2003)
a co-author for both research tools being used to measure statistical reasoning of students and the
teachers’ conformity levels to the SRLE in this study, the CAOS and STI respectively, discussed
the difficulty of developing a tool to measure statistical reasoning.
A postpositivist epistemology also assumes that there is an objective truth that is being
measured, students’ statistical reasoning ability. Though statistical reasoning has been defined in
the previous chapter, statistical reasoning can potentially vary and shift relative to the researcher,
reader, or study participants. The continuity of similar authorship and institutions of research
tools in this study reduced this limitation. Dr. Joan Garfield coauthored the frameworks for the
SRLE, STI, and CAOS, and delMas co-authored the STI and CAOS. At an institutional level,
researchers from the University of Minnesota were involved in developing the SRLE, STI, and
CAOS. The use of instruments developed by the same authors to monitor statistical reasoning by
127
students and the conformity level of teachers to SRLE principles can potentially reduce the
effects of differing definitions of statistical reasoning.
Design
Creswell (2013) as well as Bernard and Ryan (2010) stated that the goals of research
should influence the approaches a researcher should take. The goal of this study was to monitor
the impact of principles from the SRLE on the development of students’ statistical reasoning. For
this reason, a quasi-experimental design using comparative groups was used. This study was
considered a quasi-experimental design because it had no control over the allocation of treatment
to participants and did not use a randomized sampling procedure (Reichardt and Mark, 2004).
In order to adjust for likely dependent relationships that may occur in a quasi-
experimental design, matching was used to reduce confounding and bias within the study that
potentially occurs through lack of random sampling and assignment (Reichardt and Mark, 2004;
Stuart & Rubin, 2008). Teachers were matched on their teaching experience, prior course work
in statistics, professional development, and their school’s percent of students receiving free and
reduced lunch and differences of conformity to SRLE principles. Teachers who were in
transition between beliefs and practices or had dissimilarity between beliefs and practices were
omitted from the analysis in order to help ensure SRLE and GAISE principles were enacted.
Likewise, teachers who did not match on demographics while having contrasting conformity
levels compared to other teachers were discarded from the analysis. The matching procedure
potentially reduced bias resulting from the lack of randomization by matching teachers and
schools who were very similar (Reichardt and Mark, 2004; Stuart & Rubin, 2008).

128
Instrumentation
This study used two different measurement tools. The first instrument measured teachers’
self-reported agreement with beliefs and practices related to the SRLE through an online survey.
This survey was also used to identify teacher characteristics for matching purposes. The second
instrument assessed students’ reasoning and thinking skills through a multiple-choice test that
was administered by paper. The second instrument also collected the last completed mathematics
course by the student. This information was used to understand the school and student
demographics more specifically within Advanced Placement (AP) statistics classrooms.
Statistics Teaching Inventory
In order to assess teachers’ level of agreement in belief and practice with the SRLE, the
researcher asked teachers to complete a modified version of the Statistics Teaching Inventory
(STI) survey (Zieffler, et. al, 2012). This version of the survey was modified by the original
authors and was expected to be an even better instrument than the initial version of the STI
proposed by Zieffler, et. al (2012). The following section highlights Zieffler, et. al’s (2012)
development of the published version of the STI. Garfield provided the newest unpublished
version of the STI through e-mail for use in this study. The researcher, for purposes of this study,
included only questions related to face-to-face instruction and additional questions particular to
this study were added. The modified version of the STI used in this study was administered
through the online system Qualtrics (2013) and is located in Appendix A. The following four
sections describing validity and reliability, the measurement of conformity, demographics, and
coding and analyzing the responses relate to this modified STI instrument.
Validity and Reliability of the Statistics Teaching Inventory. The initial version of the
STI consisted of 102 items drawn up to align with the GAISE report by a project team consisting

129
of members of the statistics education community (Zieffler, et. al, 2012). This education
community consisted of the Consortium for the Advancement of Undergraduate Statistics
Education (CAUSE) and the Research Advisory Board of CAUSE (Zieffler, et. al, 2012). The
GAISE was correlated with six general principles as defined by the SRLE (Garfield & Ben-Zvi,
2008, 2009). Teachers attending this conference gave written feedback for each item and results
were analyzed for consistency, redundancy, and missing topics (Zieffler, et. al, 2012). Using this
information, the STI was revised and given as think-a-loud interviews to a group of statistics
instructors from post-secondary institutions throughout the United States and two statistics
education researchers from the University of Minnesota (Zieffler, et. al, 2012). Based on the
interviews, researchers revised the STI to 50 questions consisting of six parts: (1) Teaching
Practice; (2) Assessment Practice; (3) Course Characteristics; (4) Teaching Beliefs; (5)
Assessment Beliefs; and (6) Additional Information (Zieffler, et. al, 2012).
These 50 items were pilot tested by 101 out of about 400 registrants attending the 2009
United States Conference on Teaching Statistics conference (Zieffler, et. al, 2012). Researchers
conducted subsequent qualitative interviews with a group of sixteen teachers for validation
purposes (Zieffler, et. al, 2012). Approximately 79% of those participating in the pilot survey
had instructional practices that matched their beliefs, and 86% had assessment practices that
matched their beliefs (Zieffler, et. al, 2012). Two graduate students rated the sixteen participants
on a scale of 1-10 for their conformity to reform methodology as described by the GAISE report
(Franklin et. al, 2007) and SRLE principles (Garfield & Ben-Zvi, 2008, 2009; Zieffler, et. al,
2012). After removing 4 participants who showed inconsistency in interviews and STI survey
results, raters’ scores and STI surveys resulted in a Pearson’s correlational (r) value of .77
(Zieffler, et. al, 2012).

130
Based on the removal of these four outliers in the development of the STI, improvements
for the STI were suggested by Zieffler, et. al (2012). Questions 16-25 responses were suggested
to be changed from dichotomous values of agree and disagree to interval scales (Zieffler, et. al,
2012). Questions related to technology were revised in order to discriminate between teachers
using calculators and presentation software from those using tools and technology to develop
statistical reasoning and thinking (Zieffler, et. al, 2012).
Though the STI was assumed a valid and reliable measurement tool for SRLE principles
based on past research, methods for analysis are unpublished. The first sections begin with
categorization of question types in the STI in practice, beliefs, and demographics in the version
of the STI included in this study (Appendix C). The concluding section details the procedure
used by the researcher to analyze questions in the STI (Appendix C) to measure conformity to
principles of the SRLE. The following section will describe the use of the STI to determine
conformity to the SRLE in practice and beliefs. These two sections will be followed by included
demographics in the STI and finalize with how these dichotomous values were coded and
analyzed for discrimination of conformity to SRLE.
Measuring Conformity to a Statistical Reasoning Learning Environment in Practice
and Beliefs. Parts one through four of the STI required teachers to answer questions related to
their classroom practice. These questions required teachers to reflect on their practice and answer
questions as if they were a student in the class. Questions in part one of the STI emphasized
pedagogical practice. Part two of the STI focused on curricular emphasis. The third part of the
STI measured the use of technology in the classroom. The fourth part of the STI measured
assessment practices.

131
The fifth portion of the survey required teachers to answer questions related to their belief
in effectiveness of SRLE principles and not necessarily their practice. This part of the survey
measured a teacher’s beliefs about teaching, learning, and assessment in statistics in one
unseparated section. The beliefs section was analyzed as a whole because of this grouping of
questions.
Demographics Obtained by Statistics Teaching Inventory. Part six and seven of the
survey were added by the researcher to gather information about characteristics of the teacher
completing the survey for matching purposes. Characteristics of teachers that were included in
the STI are years of teaching experience in introductory statistics, graduate course work in
statistics, teaching constraints, experience in applied statistics, and number of professional
development courses. The matching procedure was used to reduce confounding that occurs with
use of quasi-experimentation. Finally, a question about their interest in allowing students to
participate in the administration of the student reasoning assessment later in the course was
included.
Coding and Analyzing the STI. Table 4 maps coding of the STI into categories of
pedagogy, curriculum, technology, assessment, and beliefs. The researcher eliminated some
questions in the analysis of the survey because of inability to identify clearly high and low
conformity levels to SRLE principles in question wording. Table 4 also summarizes questions
that favored conformity to SRLE principles and questions that did not. Questions that did favor
SRLE principles were reverse coded to provide consistency in measurement of SRLE principles.

132
Table 4
Statistics Teaching Inventory Question Direct and Reverse Coding
Practice Beliefs
Part I Part II Part III Part IV Part V
Questions Pedagogy Curriculum Technology Assessment Mixed
Directly
transformed
2, 5b, 5c,
5d, 5f
10 3, 4, 5 3, 4, 5, 6 4, 5, 6, 7, 10,
11, 12, 15
Reverse Coded and
transformed
1, 3, 5a 1 1, 2 3, 8, 9
Disregarded 4 1,2 3, 4, 5, 6,
7, 8, 9
2 1, 2, 13, 14,
16, 17
Questions in the survey were largely Likert-type scale responses and percentage
questions. Based on Zieffler et. al (2012)’s suggestions for improvement, responses on the Liker-
type scale within parts two through five of the STI were transformed to decimals between 0 and
1 for comparison between questions that have percentage responses. Questions on the STI
incorporate 3, 4, and 5-point scales. This transformation from ordinal data to proportions was
completed based on suggestions made for improvement from Zieffler et. al (2012) because of the
need for consistent comparison in the instrument. Decimal numbers closer to one imply close
conformity to SRLE principles and decimal numbers close to zero represent less conformity to
SRLE principles.
Likert scale results in each part of the survey were summed and divided by the total
questions in the section. This was completed for parts one through four of the STI survey in

133
Appendix C to produce conformity levels for each portion of the survey. The averages for parts
one through four were then summed and divided by four to produce an overall scale of
conformity of practices to the SRLE. Likert scale responses from part five were summed and
divided by the total questions to produce a raw score of conformity of beliefs in components of
the SRLE. The averages for each participant were then placed as ordered pairs to ensure
consistency between practice and beliefs. Teachers who showed inconsistency between practice
and beliefs were removed from the study.
Comprehensive Assessment of Student Outcomes in Statistics
The Comprehensive Assessment of Outcomes in Statistics (CAOS) was used to assess
students’ reasoning and thinking skills. The CAOS is a test designed by delMas et. al (2007)
through a National Science Foundation grant entitled Assessment Resource Tools for Improving
Statistical Thinking (ARTIST). Questions on the CAOS require students to think through and
reason with statistics rather than compute formulas, recall definitions, or use formulas (delMas
et. al, 2007). The instrument is included in Appendix B.
Validity and Reliability of the Comprehensive Assessment of Student Outcomes in
Statistics. The test was designed over a three-year period of creation and revision (delMas et. al,
2007). The first round consisted of dissemination and discussion between the ARTIST team of
researchers and graduate students (delMas et. al, 2007). The second round of revisions were
made after giving the test to Advanced Placement (AP) statistics teachers and teachers of
introductory statistics at the tertiary level who used the test as a pre and post assessment tool in
their classrooms (delMas et. al, 2007). The third round of feedback came from 30 AP statistics
exam readers in June 2005 (delMas et. al, 2007).

134
The final version consists of 40 questions that assess a student’s ability to reason and
think statistically (delMas et. al, 2007). Students are required to read responses in order to
determine which response produces the best reasoning. Students must also read studies using
statistical thinking to determine errors or provide improvements for a statistical study. Content
objectives in the CAOS focus on data collection and design, descriptive statistics, graphical
representations, the normal distribution, bivariate data, probability, sampling variability,
confidence intervals, and significance tests (delMas et. al, 2007).
To validate the instrument, 1,470 students completed the final version of the CAOS,
which included students enrolled in introductory statistics courses at two-year colleges, four-year
colleges, and universities (delMas et. al, 2007). Seven hundred and sixty three of these students
completed the instrument as a pretest and posttest. Cronbach’s alpha reliability coefficient from
this large-scale dissemination was .82 showing acceptable internal consistency for college-level
introductory statistics courses (delMas et. al, 2007). The large-scale testing showed increases of
approximately 9% from 44.9% to 54% in all pre-test and post-test scores (delMas et. al, 2007).
Slauson (2008) reported pre-CAO scores of approximately 43% and post assessment scores of
47% in a combination of students in two classrooms focusing on both active learning and
lecture-based principles. Tintle et. al, (2012) reported increases from 48.4% to 57.2% in a
traditional lecture-based class and increase from 44.7% to 55.7% for a new curriculum centered
on reform. These results highlighted the small effect that instruction has had on increasing
statistical reasoning and thinking in many statistical classrooms throughout the United States.
These reports also highlighted that baseline scores on the CAOS used as a pretest have ranged
from 43% to 48.4% (delMas et. al, 2007).

135
Using the Comprehensive Assessment of Outcomes. This study used the CAOS as a
pre-test and post-test to assess students’ statistical reasoning ability. The teachers of the course
administered the pre-test after approximately a quarter of the course was completed. Teachers of
the course administered the post-test after the course was completed. Disaggregated student data
with broad statistical categorization of percent of correct responses was provided to instructors to
encourage focus within the course. This same data was provided to teachers at the end of course
for program development. Solutions to the CAOS were not provided to teachers in the study
before or after the study.
Procedure
The overall procedure for this study required the collection of both teacher and student
data from a project supporting the development and success of AP statistics courses. The
researcher collected teacher data from the STI at the beginning of the school year and used the
data to classify teachers’ beliefs and practices relative to SRLE principles. The researcher also
used demographic information included on the STI to match pairs of teachers who had high
conformity to SRLE principles with teachers who had low conformity to SRLE principles.
Teachers were matched if they had the same amount of teaching experience, similar coursework
in statistics, similar professional development, and similar school socio-economic status.
Teachers who were matched then administered the CAOS as a pre-test and post-test in their
course to measure the amount of improvement in statistical reasoning. Students completed pre-

136
assessments after approximately a quarter of the course and post-assessments at the end of the
course.
Population
Participants were drawn from the A+ College Ready project being conducted in the
southeast region of the United States; see http://www.apluscollegeready.org. This project
focused on the development of Advanced Placement (AP) science, English, and mathematics
courses. The A+ project aimed to increase the numbers of students taking AP courses and
making qualifying exam scores of 3, 4, and 5 on the end of course examinations. For this reason,
more teachers from A+ were new to teaching AP courses. To ensure teachers were well prepared
for teaching AP courses, the project provided professional development through AP conferences.
AP conference presenters presented sessions on AP statistics content as well as activities and
tools used to teach the content. Conferences lasted anywhere from four to five days. The A+
project also supported this goal by providing similar professional development for teachers
during the school year by local presenters. In addition to providing professional development to
teachers involved in the program, monetary benefits existed for teachers and students involved in
the program. This may have produced extrinsic motivation for teachers and students. Low-
income students also had the benefit of no out-of-pocket expense for the end of course AP
examination due to state funding, AP waivers, and cost reimbursement through the program.
Similarly, all students received a partial reduction in the normal AP exam cost.
For the purposes of this study, only AP statistics teachers who were a part of the A+
project were included, along with their students. The A+ project promoted principles from the
Advanced Placement program (College Board, 2010), which were predicted to increase the
likelihood of finding classrooms that conform to the SRLE. These principles are supported

137
through professional development for teachers, and expert teachers who led Saturday sessions
for students.
The researcher sent e-mails to AP statistics teachers involved in the A+ project inviting
them to participate in the study. Thus, only AP statistics teachers involved in the A+ project in
past and present were available to participate. AP statistics teachers could potentially be involved
with the A+ project for one to six years at the start of this project. Teachers’ involvement in
professional development opportunities varied through experience in summer workshops and
attendance in various numbers of professional development activities sponsored by the program.
Teacher Participation and Matching
Teachers who responded to the request for participation were asked to complete the STI
survey, which was used to identify teachers’ beliefs and practices related to the SRLE. The STI’s
intended use was to measure conformity of beliefs and instructional practice to SRLE principles
and the recommendations from the Guidelines for Assessment and Instruction in Statistics
Education (GAISE). The STI results were used to divide possible participants into two groups of
more conformity and less conformity to the SRLE principles. Teachers who had inconsistent
scores on the beliefs and practices subscales on the survey or who were unwilling to participate
in the student assessment portion of the study were removed from possible matching and further
analysis.
Teachers with more conformity to the SRLE in belief and practice were matched with
teachers who showed less conformity to the SRLE based first on teaching experience in
statistics. If multiple teachers had the same amount of teaching experience and different
conformity levels, they were then compared more closely by matching their amount of
completed coursework and professional development in statistics education. If two or more

138
teachers were still available as potential matches, they were then compared by their schools’
socio-economic status to make a final selection. Figure 6 summarizes the order for the matching
process of differing conformity levels of teachers.
Figure 6. Order of matching procedure for possible participants within study.
First, teachers from the high conforming group and low conforming group were
categorized by their experience teaching introductory statistics from 0 years, 1 year, 2 years, and
3 or more years. The teachers in the high and low conformity levels were compared by
experience level to establish potential matches. Next, the teachers were compared by the sum of
their courses completed in applied and theoretical statistics to refine the set of potential matches
further. If more than one potential match existed based on years of experience and completed
coursework in statistics, teachers’ professional development in statistics education as measured
by the sum of hours in workshops, short courses, AP conferences, and other professional
development opportunities in the last two years was used for matching.
Teacher
• (1) Experience Teaching Statistics (years)
• (2) Graduate Courses in Statistics and Professional Development in Statistics Education (classes)
School• (3) School Socio-economic Status

139
Finally, the school demographic information of the number of students receiving free and
reduced lunch was if necessary to establish final matches. This matching procedure was used to
help ensure similar teaching constraints. School demographics was used as the least restrictive in
the matching process because student pre-tests were considered as covariates in the Analysis of
Covariance (ANCOVA) procedures.
The goal for this matching was to obtain at least five pairs of teachers who had similar
teaching experience, courses taken in statistics, professional development, and school
demographics but different levels of conformity to the SRLE. Five sets of teachers were used in
order to ensure a quasi-random selection of participants and ensure sample size for student
participation was large enough to support the statistical analysis.
Student Participation
The researcher contacted the superintendents of the school districts of the five matched
pairs of teachers to obtain consent for participation in the study. After superintendents gave
permission for the students to participate, teachers sent opt-out letters to students’ parents or
guardians; see Appendix C. After allowing at least one week for return of opt-out letters,
students and parents who chose to participate in the study completed the pre-test CAOS.
Students participating in the study were given the CAOS pre-assessment in late October.
The researcher contacted all teachers participating in the study to ensure they administered the
pre-assessment after the topics included on the CAOS: graphical representation, boxplots, data
collection and design, descriptive statistics, and bivariate data. The beginning of the course was
used to create appropriate benchmark scores for individual students that would later be used as
covariates in the analysis. The researcher asked teachers to encourage students to perform well
on the pre-assessment by providing disaggregated data from the pre-assessment that could be

140
used to make instructional decisions in their course. This was included in the design process to
help produce reliable pre-assessment results and provide teachers with information that could
potentially increase their effectiveness.
The CAOS post-test was administered approximately one week after the completion of
their final unit of instruction before transition to instruction focusing on preparing students for
the AP examination, thus maximizing the effects of the SRLE on student reasoning and
mitigating effects of test preparation on the CAOS. Teachers were given a summary of the
students’ scores shortly after returning the student assessments in order to assist teachers in
determining certain areas for improvement before the AP test at the beginning of May.
Data Analysis
To answer the research questions, a one-way Analysis of Covariance (ANCOVA) design
was used to determine if differences between instructional practice and beliefs groupings of
classrooms post-tests differed while controlling for students’ pre-test scores as covariates. Cook
and Campbell (1979) stated that this design for quasi-experimentation is a more powerful
procedure for detecting differences than traditional pre and post-test difference designs. Given
the variation between and among groupings in the quasi-experiment, type III sum of squares was
used in SPSS to control for differences in sample sizes of students in both groupings by teacher
and by high or low conformity.
In order to complete an ANCOVA design, Mertler and Vannatta (2010) list several
assumptions that must be verified. The first assumption is of random sampling and reliable
covariates. Observations within this study were quasi-experimental, thus lacked true
randomization; however, the matching procedure attempted to mitigate this difficulty present in
most educational research. In addition, a previously developed and validated assessment

141
instrument was used as a covariate. The second assumption listed by Mertler and Vannatta
(2010), stated that in order to perform an ANCOVA, the dependent variable should be
approximately normal. Mertler and Vannatta (2010) also stated that the ANCOVA test is not
largely affected by this assumption when group sizes are fairly large and equivalent. Though
testing procedures for normality are highly sensitive, the procedure was completed as an
additional means of analysis. Based on the sensitivity to normality testing, further exploration
was given as needed to justify the assumption of normality.
Mertler and Vannatta (2010) also recommended several tests for homogeneity of
variances between groups on the post-test. Homogeneity of variances in this study ensures that
the variation between each groups’ post-test scores were approximately equal. A Levene’s test
was used in this study to ensure the assumption between groups was not violated. The covariate
of pre-test scores given at similar times in the course was expected to be linearly related to the
dependent variable of post-test scores making it a reliable linear predictor. This assumption was
still verified through scatter plots and calculations of correlation coefficients before each testing
procedure.
A critical assumption, as described by Mertler and Vannatta (2010), is the assumption of
homogeneous regression slopes during the analysis. Inequality in regression slopes would imply
that the relationship of students’ pre-test scores and post-test scores were different in different
classrooms. Homogeneity of slopes is simply stating that students in one teacher’s classrooms
has a similar increase in scoring rates from the pre-test to post-test within each other teachers’
class. This assumption was tested by conducting an F test for interactions. If no interactions
existed, a full factorial model was specified and used for analysis.

142
The first ANCOVA procedure determined if significant differences were found between
student post-test results among teachers that were categorized as high conformity to SRLE
principles while controlling for students’ pre-test scores. The second ANCOVA procedure
determined if significant differences existed between student post-test scores among teachers
who had less conformity to SRLE principles while controlling for students’ pre-test scores. The
third ANCOVA procedure determined if there was a significant difference between post-test
scores of teachers with high conformity and low conformity to the SRLE while controlling for
pre-test scores.
Summary
This chapter began with a discussion of the theoretical framework used for this study, a
postpositivist epistemology and the methodology used to investigate the extent to which students
develop statistical reasoning based on more or less conformity of their teachers with SRLE
principles. A matching procedure based on teacher and school demographics was used to create a
quasi-experimental design. The STI was used to identify teacher beliefs and practices related to
instructional practice and the CAOS was used to monitor the development of students’ statistical
reasoning. Data was analyzed using a series of ANCOVA tests.

143
Chapter 4: Results
The first section in this chapter details the selection of participants in this study based on
the Statistics Teaching Inventory (STI) (Zieffler, et. al, 2012) and the previously described
matching procedures using demographic information. The second section of this chapter
analyzes post-assessment scores on the Comprehensive Assessment of Outcomes (CAOS)
(delMas et. al, 2007) for teachers at low levels and high levels of conformity to Statistical
Reasoning Learning Environment principles (SRLE) (Garfield and Ben-Zvi, 2009) after
adjusting for pre-assessment scores on the CAOS. The final section in this chapter analyzes post-
assessment CAOS scores after adjustment for pre-assessment CAOS scores between groups of
teachers at low and high levels and between matched teachers of high and low levels of
conformity to SRLE principles.
Responses to the Statistics Teaching Inventory
Twenty teachers of statistics provided responses to the STI from an e-mail list of fifty-
two teachers during a two-week collection period (38.4% response rate). One of the respondents
did not complete the survey and four were not interested in having their students participate in
the second phase of the study, the student assessment. Based on this information, five
participants were removed from any further analysis. Responses from the STI survey were coded
0 to 1 with higher values representing higher conformity to SRLE principles as prescribed in
Chapter 3. Figure 7 summarizes the average conformity levels for each possible participant in the
STI categories of pedagogy, curriculum, technology, and assessment in histograms. These four

144
parts were averaged to create a self-assessment average that anticipated how well teachers
believed their classes actually conformed to SRLE principles (see Figure 8). The eleven
questions from the beliefs portion of the STI were averaged to create a belief scale in the
effectiveness of SRLE principles (see Figure 9).

145
Figure 7. Histograms of self-reported teaching practices for possible participants by subscale.

146
Figure 8. Histogram of possible participants’ self-reported practices average.
Figure 9. Histogram of possible participants’ beliefs in effectiveness of SRLE principles.

147
A scatter plot (see Figure 10) was constructed for the averages of survey participants’
self-assessment results vs. beliefs to help identify teachers with similar beliefs and practice.
Because this research project had the goal of evaluating the effect of SRLE principles on student
statistical reasoning, participants who were inconsistent in their beliefs and practices were
removed from possible matching. Thus, the participant scoring a belief level of .83 and a practice
level of .34 was excluded from possible matching and analysis, leaving 14 possible participants
for the full study. The Pearson’s correlation coefficient for possible participants was .81 between
the scores for beliefs and practices.
Figure 10. Scatter plot of possible participants’ beliefs and practices subscales from the STI.

148
Teachers were categorized as high conformity when their responses were higher than the
typical average response in belief and practice, the upper right quadrant of Figure 10. Teachers
were categorized as low conformity to the SRLE principles when their responses were lower
than the average in beliefs and practices, the lower left quadrant of Figure 10. Of 14 possible
teachers for matching, eight were categorized as low conformity and six were categorized with
higher conformity levels. To produce an overall level of conformity with SLRE, participants’
beliefs in SRLE principles were averaged with perceived use of SRLE principles in the
classroom, thus allowing univariate comparison (see Figure 11).
Figure 11. Histogram of total average conformity to SRLE conformity.

149
Identification of Matched Pairs of Participants
After identifying possible participants for the study and their conformity grouping
through the STI, teachers were ordered based on their conformity level and numbered for
purposes of anonymity. Teachers were then grouped by zero, one, two, and greater than two
years of experience. Based on the groupings it was determined how many potential matches
existed between lower conformity and higher conformity classrooms. The best match was
determined in each grouping by first observing coursework in statistics, then professional
development in statistics education. Given a matching existed, school demographics were
compared for each matching.
The first level of separation to create matches identified three teachers with no experience in
teaching statistics, three teachers with one year experience, four teachers with two years of
experience, and four teachers with more than two years of experience (see

150
Table 5). Based on this grouping of teachers by years of experience it was possible to
select one set of teachers with zero years of experience, one set of teachers with one year of
experience, two sets of teachers with two years of experience, and one set of teachers with at
least three years of experience.
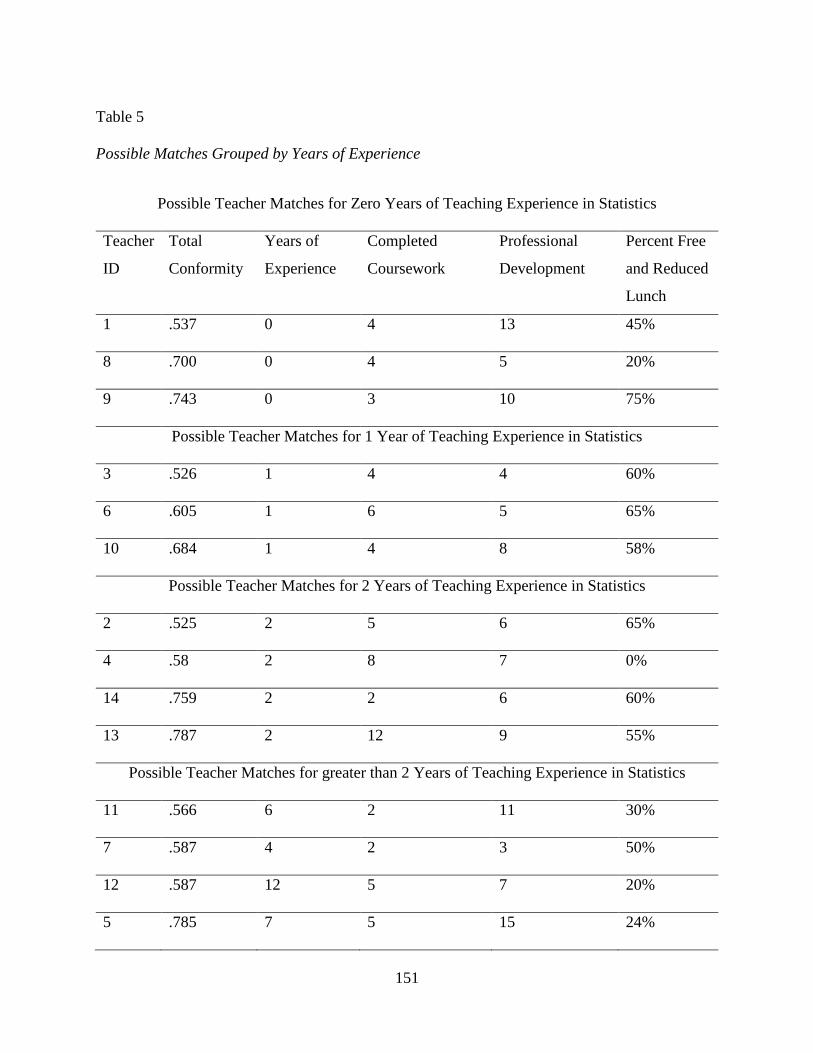
151
Table 5
Possible Matches Grouped by Years of Experience
Possible Teacher Matches for Zero Years of Teaching Experience in Statistics
Teacher
ID
Total
Conformity
Years of
Experience
Completed
Coursework
Professional
Development
Percent Free
and Reduced
Lunch
1 .537 0 4 13 45%
8 .700 0 4 5 20%
9 .743 0 3 10 75%
Possible Teacher Matches for 1 Year of Teaching Experience in Statistics
3 .526 1 4 4 60%
6 .605 1 6 5 65%
10 .684 1 4 8 58%
Possible Teacher Matches for 2 Years of Teaching Experience in Statistics
2 .525 2 5 6 65%
4 .58 2 8 7 0%
14 .759 2 2 6 60%
13 .787 2 12 9 55%
Possible Teacher Matches for greater than 2 Years of Teaching Experience in Statistics
11 .566 6 2 11 30%
7 .587 4 2 3 50%
12 .587 12 5 7 20%
5 .785 7 5 15 24%

152
The second round of matching required the pairs of teachers to be matched as closely as possible
on previously completed coursework in statistics and professional development in statistics
education as shown in

153
Table 5. Teachers with no experience in teaching statistics consisted of two high conforming
teachers and one low conforming. Based on the similarity of completed coursework for all three
teachers, professional development in statistics education was used to match Teacher 1 and 9;
see

154
Table 5. This also maximized the distance between conformity levels for teachers with
zero years of experience. Although Teacher 1 and 9 were matched at the second level, the
number of reported students receiving free and reduced lunch were 30% larger for the higher
conformity classroom. However, Teacher 9 was still a better match than Teacher 8 to Teacher 1
on this criterion.
For teachers with one year of experience, the high conformity Teacher 10 could have
been matched with either Teacher 6 or 3, both lower conformity, based on years of experience.
At the next level of matching Teacher 10 best matched with Teacher 3, based on professional
development. This matching also maximized the difference between conformity levels. This was
also a better match on reported free and reduced lunch participants. Teacher 10 was thus matched
with Teacher 3 based on similarity at all levels of matching.
There were two possible pairings for teachers with 2 years of experience in teaching
statistics. Teachers 14 and 13 could have been matched with Teachers 4 or 2. At the second level
of matching, Teacher 14 matched most closely with Teacher 2. Teacher 4 matched most closely
with Teacher 13. Similarly, Teachers 14 and 2 were more closely matched as well as 13 and 4
based on professional development. Though larger differences existed for completed coursework
and professional development for Teacher 4 and 13, it is important to highlight the fact that these
two teachers reported the most experience in completed coursework and professional
development within the STI survey. Teacher 14 and 2 were very similar on the school students
receiving free and reduced lunch while Teacher 4 and 13 were very different. Even though the
difference in school socio-economic status existed, Teacher 4 and 13 were matched closely on
teaching experience, completed coursework in statistics, and professional development. In
conclusion, Teacher 14 matched Teacher 2 because they had similar teacher characteristics and

155
school demographics to qualify for comparison. Teacher 13 matched Teacher 4 largely on
teacher demographics but not on school demographics. Though these two Teachers differed on
school demographics, school demographics was the less strenuous matching factor in the study.
For teachers who had greater than 2 years of experience, there existed only one high
conformity teacher for possible matching. Teacher 5 could have potentially been matched with
Teacher 7, 11, or 12 based on years of experience and previously completed coursework. At the
second level, professional development, Teacher 11 more closely matched Teacher 5. The
matching of Teachers 11 and 5 also maximized the distance of conformity for teachers with three
or more years of experience. Although the third level was not used for matching purposes,
Teachers 11 and 5 had a difference of approximately 6% in students’ receiving free and reduced
lunch for teachers with more than two years of experience. The matching of Teachers 11 and 5
were thus matched because of similar years of experience while simultaneously reducing for
differences in completed coursework and percent of free and reduced lunch school
demographics.
This process resulted in the identification of five sets of teachers with identical teaching
experience in statistics, similar coursework in statistics, and similar school demographics. Table
6 summarizes the pairing of teachers in this experiment. Note, however, the mismatch of
Teachers 13 and 4 in school demographics.

156
Table 6
Comparison of Matched Teachers at All Levels
Higher
Conformity
to SRLE
Teacher
Number
Lower
Conformity
to SRLE
Teacher
Number
Difference
in
Conformity
Levels
Years of
Experience
Teaching
Statistics
Completed
Coursework in
Statistics
Percent Free and
Reduced Lunch
Higher Lower Higher Lower
9 1 .206 0 3 4 45% 75%
10 3 .158 1 4 4 58% 60%
14 2 .234 2 2 5 60% 65%
13 4 .207 2 12 8 55% 0%
11 5 .219 >2 5 2 24% 30%
Student Responses
After matching teachers and the collection of opt-out letters from parents, teachers were
directed to administer the CAOS as a pre-assessment. These assessments were then mailed to the
researcher for analysis. Similarly, teachers administered the CAOS as a post-test at the end of the
course. Tests were then mailed to the researcher for analysis. Student absences on the assessment
dates reduced the number of students participating in both the pre- and post-test design. Incorrect
coding of anonymous identifiers by participants also reduced the total number of participants
who had pre- and post-test scores that could be matched. Based on this protocol, exact response
rates could not be calculated. An underestimate of response rates for students in a teacher’s entire
statistics classroom were calculated by using the number of matched pre- and post-tests to the
total available from each teachers’ classes in Table 7.

157
Table 7
Student Response Rates
Low Conformity Classrooms High Conformity Classrooms
Mat
ch
Tea
cher
Num
ber
Mat
ched
Tes
ts
Tota
l
Stu
den
ts
Res
ponse
Rat
e
Aver
age
Cla
ss S
ize
Tea
cher
Num
ber
Mat
ched
Tes
ts
Tota
l
Stu
den
ts
Res
ponse
Rat
e
Aver
age
Cla
ss S
ize
1 5 60 69 .87 17.25 11 46 65 .71 20.67
2 3 11 15 .73 15 10 5 7 .71 5
3 4 23 34 .68 12.5 13 12 13 .92 6.5
4 2 14 15 .93 15 14 7 8 .88 7
5 1 70 87 .80 17.5 9 17 23 .74 17
Total 178 220 87 116
Observations with missing data were excluded from analysis, thus only observations that
had matching pre-test and post-test results were used to answer research questions. Table 8
identifies the total number of students taking part in each teachers pre- and post-test and the
number of matched samples used in the statistical analysis. Pre-screening of the data did not
identify any univariate outliers. Class sizes and the number of students each teacher instructed
varied considerably. Class sizes for teachers with less conformity to SRLE principles were
generally larger than high conformity classrooms as presented in Table 7. Similarly, the low
conformity teachers tended to have more opportunities to teach the content on a given day as
seen in Table 8.

158
Table 8
Teacher Sample Sizes of Pre-tests, Post-tests, and Matched Tests
Low Conformity High Conformity
Mat
ch
Tea
cher
Num
ber
Pre
-tes
t
Post
-tes
t
Mat
ched
Tes
ts
Num
ber
of
Cla
sses
Tea
cher
Num
ber
Pre
-tes
t
Post
-tes
t
Mat
ched
Tes
ts
Num
ber
of
Cla
sses
1 5 69 61 60 4 11 52 62 46 3
2 3 14 12 11 1 10 7 6 5 1
3 4 28 27 23 2 13 12 13 12 2
4 2 14 15 14 1 14 7 8 7 1
5 1 83 78 70 4 9 20 20 17 1
Total 208 193 178 12 98 109 87 8
Initial Analysis of Pre-Test Results
Based on a later start to the study than expected, pre-tests were administered
approximately nine weeks into a thirty six-week school schedule leading up to the administration
of the AP exam. To reduce the effects of this late administration, the researcher contacted each
teacher to ensure that they had all covered the same material before administration of the pre-
tests. Teachers were directed to administer the exam after the topics of graphical representation,
boxplots, data collection and design, descriptive statistics, and bivariate data were covered in the
course. Due to its late administration in the school year, effects of the SRLE could have been
found in pre-test results. These effects could potentially also be misrepresented by prior
experience with mathematics coursework because of association of the first few chapters of an

159
introductory statistics course with mathematical standards in the state. For this reason, results on
the pre-test results were compared looking both at responses to the entire pre-test and responses
to questions on content that had been taught by teachers in the study before the administration of
the pre-test. Twenty-four out of forty questions were taught by all teachers in the experiment
before administration of the pre-test.
A summary of the average percent of correct responses out of 40 for each class’ pre-test
is given in Table 9. Table 10 represents the average percent correct of the 24 previously
completed questions related graphical representation, boxplots, data collection and design,
descriptive statistics, and bivariate data. Differences in percent correct for pre-test results on the
entire test were very small between matched teachers. When only looking at questions on the
pre-test that had been previously taught, differences between higher conformity teachers and
lower conformity teachers were in three of the five matches.
Table 9
Percent Correct on Entire CAOS Pre-Test
Higher Conformity Lower Conformity Difference in Averages
Match 1 46.5% 46.0% 0.5%
Match 2 42.5% 35.5% 7.0%
Match 3 40.0% 52.7% -12.7%
Match 4 42.5% 42.3% 0.2%
Match 5 44.4% 41.3% 3.1%

160
Table 10
Percent Correct for 24 CAOS Pre-Test Items Covering Graphical Representation, Boxplots,
Data Collection and Design, Descriptive Statistics, and Bivariate Data
Higher Conformity Lower Conformity Difference in Averages
Match 1 50.6% 49.8% 0.8%
Match 2 41.1% 37.8% 3.3%
Match 3 46.2% 62.3% -16.1%
Match 4 46.4% 44.3% 2.1%
Match 5 48.5% 44.7% 3.8%
Based on pre-test results, four high conformity teachers’ classrooms outperformed their
matched counterparts. To ensure that this phenomenon was not due to treatment effects of the
SRLE, a subsequent analysis included only items on the text addressing previously covered
content. Out of the four higher conformity teachers that whose students outperformed their
respective matches, three of these teachers’ students widened the difference when only analyzing
previously covered material. The one match in which a lower conformity teacher’s classroom
outperformed its respective match also widened its difference when only analyzing previously
covered material. Thus, pre-test results were mixed and initial effects of the SRLE were not
apparent.

161
Statistical Reasoning Improvement in High Conformity Classrooms
The first research question in this study asked the extent to which students’ statistical
reasoning and thinking ability improve in classrooms that show high levels of conformity to
SRLE principles. There were 87 students with matching pre-test and post-test results among five
different teachers who were identified as having high conformity to SRLE principles. Response
rates for student participation were unavailable based on the use of student anonymous
identifiers as described by IRB protocol.
Table 11 provides summary information for all pre-test and post-test data received. A
histogram of post-test scores for students in high conformity classrooms is presented in Figure
12. An ANCOVA procedure was used to test for differences in post-test scores among teachers
categorized as high conformity classrooms while controlling for the students’ pre-test scores.
Figure 12. Histogram of post test scores for high conformity.

162
Table 11
Pre-test and Post-test Summary Statistics for High Conformity Classrooms
Mean Standard Deviation Sample Size
Pre-Test 17.88 4.30 98
Post-Test 19.96 5.305 109
Testing conditions for use of ANCOVA
An ANCOVA was used to determine if differences existed between the number of
questions answered correctly on post-test scores after adjusting for pre-test scores among
teachers within high conformity classrooms. Before performing the ANCOVA procedure to
measure outcomes in the high conformity classrooms, post-test scores were tested for normality.
The Shapiro-Wilkson Test for normality failed to reject that the population was normal while the
Komogorov-Smirnov test rejected normality at the .05 alpha level. Based on this contradiction
and testing sensitivity, this phenomenon was investigated further looking at a histogram of the
scores (see Figure 12) and a Q-Q plot (see Figure 13). Based on these plots and observation of
kurtosis levels, post-test scores appeared to be approximately normal; consequently, data were
used without transformations.

163
Figure 13. Q-Q plot for high conformity post-test scores.
Mertler and Vannatta (2010) also recommended a test for homogeneity of variances using
a Levene’s test. This test was used to ensure that the covariate is linearly related to the dependent
variable. The Levene’s test produced F(4, 82) =.959 with a p-value of .435 indicating a failure to
reject equality of variances between different teachers at a significance level of .05. A linear
relationship was also explored between pre-test and post-test scores. The scatter plot (see Figure
14) and the correlation coefficient of .338 indicated that there was a weakly positive association
between students’ pre-tests and post-tests in high conformity classrooms (Salkind, 2004).

164
Figure 14. Scatterplot of pre-test vs. post-test for high conformity.
The ANCOVA procedure requires homogeneity of regression slopes for independent
factors in the ANCOVA model. Mertler and Vannatta (2010) recommended testing for
interaction between these factors by observing the F ratio and p-value for the interaction (see
Table 12). The ANCOVA indicated no significant interaction between teachers and the pre-test,
F(4, 77)=1.306, p=.275. Because no significant interaction existed between teachers and their
pre-test scores, it was assumed that each teacher in the study improved at similar rates within the
study, making it safe to use the ANCOVA procedure (Mertler & Vannatta, 2010).

165
Table 12
ANCOVA Pre-Screening for Homogenous Slopes
Source
Type III Sum of
Squares Df Mean Square F Sig.
Partial Eta
Squared
Corrected Model 915.947 9 101.772 5.208 .000 .378
Intercept 134.941 1 134.941 6.905 .010 .082
Teacher 224.848 4 56.212 2.876 .028 .130
Pretest 256.210 1 256.210 13.110 .001 .145
teacher * pretesta 102.104 4 25.526 1.306 .275 .064
Error 1504.765 77 19.542
Total 38594.000 87
Corrected Total 2420.713 86
Note. a. The teacher*pretest factor was used for interpretation of interaction
Thus, assumptions for completing the ANCOVA were verified. The assumption of
homogenous slopes was not rejected. The covariate of pre-tests was projected to be a significant
factor to reduce variability in students’ post-test scores. The assumption of homogenous
variances between teachers was not rejected. Students’ post-test scores were assumed to be from
a normal distribution. Based on these assumptions, analysis was performed to test for differences
among teachers in high conformity classrooms post-test scores.
Analysis
A full factorial ANCOVA was completed (see Table 13). The ANCOVA procedure
found that after adjustment for the significant covariate of pre-tests, post-test scores varied
significantly among teachers in high conformity classrooms, F(4,81)=6.78, p<.001. This

166
statistically significant difference among teachers in high conformity classrooms highlights
differences in students reasoning ability among teachers even after adjustment for students’ prior
knowledge. A partial-Eta Squared of .264 also indicates a moderate effect size (Ferguson, 2009)
of teachers within the high conformity grouping. Post-hoc comparisons between teachers in high
conformity classrooms were not performed because of confounding factors apparent in the
matching process. Factors such as teaching experience may have significant impact on
differences found between pairwise comparisons. The adjusted means in Table 14 represent post-
test problems correct for each teacher assuming that each teacher were assumed to have students
with equal pre-test scores. Comparison of adjusted with non-adjusted teacher means, displayed in
Table 14, revealed four teachers’ classes increases in adjusted means while one teachers’ classes
decreased. Increases in four adjusted means with only one decrease elaborates a weighted sample
in which one teacher’s students potentially had higher pre-test results than others within the
group. A lack of student improvement in this teacher’s classes may have also contributed to this
decrease in adjusted mean. Exploratory analysis was used to understand improvement in high
conformity classrooms further.

167
Table 13
ANCOVA Test for Differences between Teachers’ Post-Test Scores while Controlling for Pre-
Tests
Source
Type III Sum of
Squares Df Mean Square F Sig.
Partial Eta
Squared
Corrected Model 813.844 5 162.769 8.205 .000 .336
Intercept 682.142 1 682.142 34.386 .000 .298
Pretest a 467.948 1 467.948 23.589 .000 .226
Teacher b 537.999 4 134.500 6.780 .000 .251
Error 1606.869 81 19.838
Total 38594.000 87
Corrected Total 2420.713 86
Notes. a The Pretest factor was used to test significance of the covariate. b.The Teacher factor was
used to test for differences between groups of students’ post-test scores by each high conformity
teacher.

168
Table 14
High Conformity Post-test Means and Adjusted Post-Test Means for High Conformity
Classrooms
Teacher Number Adjusted Mean Non-Adjusted Mean
9 19.103 19.06
13 25.472 24.33
14 19.734 19.14
11 19.048 19.59
10 25.848 24.60
Mean of Teachers’ Means 21.841 21.344
Exploratory Analysis
To further understand these differences in adjusted means of the high conformity group,
an exploratory analysis was performed looking at raw percent increases. The numbers of students
influenced by each teacher was also compared. Teachers with higher adjusted means had student
increases from pre-test to post-test of over 20% gains. Table 15 summarizes these results.

169
Table 15
Percent of Increase from Pre-Test to Post-Test in High Conformity Classrooms
Teacher Post-Test Pre-Test Difference Number of Students
9 47.7% 44.3% 3.4% 17
13 61% 40% 21% 12
14 47.9% 42.5% 5.4% 7
11 49% 46.5% 2.5% 46
10 61.5% 42.5% 19% 5
The improvements in Teachers 13 and 10 were approximately 21% and 19% respectively
on the assessment, whereas the national average for improvement was only 9% for college
students. The other three classes’ non-adjusted post-test score means in the high conformity
grouping were approximately 6% lower than the national average for college students. Teacher
11’s forty-six students accounted for over half of the high conformity grouping. Students of this
teacher increased by only approximately 2.5% while the Teacher 14 improved by approximately
5.4%.
Of the five high conformity teachers, Teacher 11 had the least improvement, but the
teacher also had the least amount of students receiving free and reduced lunch. Of the two
highest performing teachers’ classes, Teacher 13 completed significantly more coursework than
other participants in the study. When finding the mean of each teachers’ mean on post-tests, the
average for high conformity classrooms was approximately 53%, 2% higher than the national
average for college students.
170
Thus, results from the high conformity grouping showed improvement in statistical
reasoning at varied levels. Two teachers had substantial increases in statistical reasoning while
three others had relatively small gains. The reduction in Teacher 11’s adjusted mean was verified
to be related to a low improvement rate from pre-test to post-test. Additionally, a decrease in the
adjusted mean of only Teacher 11’s post-test scores was related to the large number of students
in their class. Other teachers in the high conformity grouping had substantially less students
taking AP statistics. In conclusion, high conformity classrooms showed increases in statistical
reasoning substantially above the national improvement rates for college students in two cases,
and below the national improvement rate for the other 3.
Statistical Reasoning Improvement in Low Conformity Classrooms
Research question two in this study analyzed the extent to which students’ statistical
reasoning and thinking ability improve in classrooms that show low levels of conformity to
SRLE principles. There were 176 students with matched pre-test and post-tests among five
different teachers who were identified as having lower conformity to SRLE principles. Response
rates for student participation were unavailable based on the use of student anonymous
identifiers as described by IRB protocol. Table 16 provides summary information for all pre-test
and post-test data received. A histogram of post-test scores for high conformity classrooms is
presented in Figure 16.

171
Table 16
Pre-test and Post-test Summary Statistics for Low Conformity Classes
Mean Standard Deviation Sample Size
Pre-Test 17.625 4.39 208
Post-Test 20.88 4.91 191
Testing conditions
An ANCOVA was used to determine if differences existed between students’ post-test
scores after adjusting for pre-test scores among low conformity teachers. Before performing the
ANCOVA procedure to measure outcomes in the low conformity classrooms, post-test scores
were tested for normality. The Komogorov-Smirnov (p=.027) and Shapiro-Wilkson (p=.030) test
rejected normality at the .05 alpha level. Based on the discrete structure of the post-test scores, a
histogram (see Figure 16) and Q-Q plot (see Figure 15) was created to further analyze this
assumption. The histogram appeared approximately normal and the Q-Q plot was roughly linear.
Based on the robustness of the procedure to this assumption and given plots, it was determined to
use the dependent variables without transformation and proceed with further assumption testing.
Mertler and Vannatta (2010) also recommended a test for homogeneity of variances using
a Levene’s test. This test was used to ensure that the covariate was linearly related to the
dependent variable. The Levene’s test for equality of variances produced F(4,171)=1.601with a
p-value of .176 indicating a failure to reject equality of variances between different teachers at a
significance level of .05. A linear relationship was also explored between pre-test and post-test
scores. The scatter plot (see Figure 17) and the correlation coefficient of .557 indicated that there
was an association between students’ pre-tests and post-tests. With a moderately high positive

172
correlation, it was assumed that the pre-test scores would serve well as a covariate to reduce or
control for the variability in post-test scores.
Figure 15. Normal QQ plot for post-pest scores in low conformity classrooms

173
Figure 16. Histogram for post-test scores for low conformity classrooms.

174
Figure 17. Scatter plot of pre-test vs. post-tests for low conformity classrooms.
The assumption of homogeneity of slopes was tested by observing the interaction
between different teachers and their pre-tests by observing the F ratio and p-value for the
interaction. The ANCOVA summary indicated no significant interaction between teachers and
the pre-test, F(4, 166)=1.501, p=.204 (see Table 17). With no statistically significant interaction
between teachers and their pre-test scores, the assumption for homogeneity of slopes referred to
by Mertler and Vannatta (2008) was met for the ANCOVA comparison between teachers
procedure.

175
Table 17
ANCOVA Test for Interaction in Low Conformity Classrooms
Source
Type III Sum of
Squares df Mean Square F Sig.
Partial Eta
Squared
Corrected Model 1626.179a 9 180.687 11.488 .000 .384
Intercept 613.854 1 613.854 39.029 .000 .190
Teacher 45.711 4 11.428 .727 .575 .017
Pretest 387.051 1 387.051 24.609 .000 .129
teacher * pretesta 94.404 4 23.601 1.501 .204 .035
Error 2610.860 166 15.728
Total 79643.000 176
Corrected Total 4237.040 175
Note. aThe teacher*pretest factor was used for testing of homogeneity of slopes.
Thus, assumptions for completing the ANCOVA were verified. The assumption of
homogenous slopes was not rejected. The covariate of pre-tests was projected to be a significant
factor to reduce variability in students’ post-test scores. Students’ post-test scores were assumed
to be from a normal distribution. Assumptions of homogenous variance between teachers was
not rejected. Based on these assumptions, analysis was performed to test for differences among
low conformity teachers.
Analysis
A full factorial ANCOVA was completed (see Table 18). The ANCOVA procedure
found that after adjustment for the significant covariate of pre-tests, post-test scores varied

176
significantly among low conformity teachers, F(4,166)=6.78, p=.010 (see Table 18). Thus,
assuming teachers’ students had similar reasoning abilities, post-test reasoning ability was
determined to be different. A partial Eta-Squared of .075 revealed a small effect size of teachers
in the low conformity grouping (Ferguson, 2009). Match wise comparisons using post-hoc
analysis were not performed because of obvious confounding factors present in the matching
procedure. Comparison of adjusted teacher means, displayed in Table 18, revealed two low
conformity teachers’ adjusted student means decreased and three adjusted student means
increased. Table 19 presents adjusted means of post-test scores after pre-test score adjustments
and raw post test score averages among teachers for comparison purposes. Teacher 4’s post-test
scores were reduced by nearly three questions indicating a large adjustment based on pre-
assessment scores (see Table 19).

177
Table 18
ANCOVA Test for Differences between Low Conformity Teachers
Source
Type III Sum of
Squares Df Mean Square F Sig.
Partial Eta
Squared
Corrected Model 1531.775 5 306.355 19.251 .000 .362
Intercept 969.176 1 969.176 60.903 .000 .264
Pretest 785.560 a 1 785.560 49.365 .000 .225
Teacher 218.173 b 4 54.543 3.428 .010 .075
Error 2705.264 170 15.913
Total 79643.000 176
Corrected Total 4237.040 175
Note. a The Pre-test factor was used to test significance of the covariate. b.The Teacher factor was used
to test for differences between teachers with low conformity to SRLE principles.
Table 19
Adjusted and Non-Adjusted Post-Test Means for Low Conformity Classrooms
Teacher Number Adjusted Mean Non-Adjusted Mean
5 20.672 21.18
3 17.162 16.36
2 19.796 19.57
1 20.274 19.8
4 22.067 25.33
Mean of Teachers’ Means 19.994 20.448

178
Analysis of low conformity classrooms revealed differences between individual teachers.
Though differences existed, the effects of these teachers were relatively small. Teachers in the
low conformity grouping thus increased at similar but significantly different rates. Increases in
teachers with low conformity classrooms were very similar to national averages for improvement
by college students.
Exploratory Analysis
To further understand these differences in adjusted means of the high conformity group,
an exploratory analysis was performed with raw percent increases. The number of students
influenced by each teacher was also compared. Teachers with higher adjusted means had higher
amounts of student increase and teachers with lower adjusted means had lower amounts of
student increase in statistical reasoning. Table 20 summarizes these results.
Table 20
Percent of Increase from Pre-Test to Post-Test in Low Conformity Classrooms
Teacher Post-Test Pre-Test Difference Number of Students
5 53% 46% 7% 70
3 40.9% 36.8% 4.1% 23
2 48.9% 42.3% 5.6% 11
1 49.5% 41.3% 8.2% 60
4 63.3% 52.7% 10.6% 14
The highest performing teacher among low conformity classrooms was Teacher 4.
Teacher 4’s school reported 0% free and reduced lunch students and the teacher had significantly
more course work in statistics than others in the lower conformity group. Teacher 4 scored
approximately 12% higher than the national average. Note, however, that Teacher 4’s pre-test

179
average was approximately 2% higher than the national average on the post-test. This implies
that this teacher’s students improved by approximately 10%, which is 1%, more improvement
than the national average. Though this teacher seemingly had high performances on the post-test,
after adjustment for pre-test scores, it was very similar to other teachers within the low
conformity grouping.
Teacher 5’s teacher had 6 years of experience, and students’ increased by approximately
7% and scored 2% above the national average without adjustment for pre-test scores. Post-test
averages for Teachers 1 and 2 were approximately 2% below the national average while Teacher
1 improved by approximately 8% and Teacher 2 by 6.5%. The lowest performing class, Teacher
3, improved by 4%, and scored 11% below the national average on the post-test. When finding
the mean of students influenced by each teacher, the average for low conformity classrooms was
approximately equal to the national average of 51% for college students.
Thus, results from the low conformity grouping showed improvement in statistical
reasoning. One teacher had increases in statistical reasoning above the national average while
four others had gains less than the national average. Even though teachers had significantly
different post-test scores after adjustment for pre-test scores, variation between teachers’ students
was not large as indicated by the partial Eta-Squared and relatively similar increases to national
averages for increase. In conclusion, low conformity classrooms showed increases in statistical
reasoning substantially similar to or below national improvement rates for college students.
Comparison of Statistical Reasoning Improvement between High and Low Conformity
Classrooms
Research question three in this study analyzed the extent to which students’ statistical
reasoning and thinking ability differed between teachers that show low and high levels of

180
conformity to SRLE principles. An ANCOVA was used to determine if differences existed
between the groupings of high and low conforming classrooms post-test scores after adjusting
for pre-test scores.
Testing conditions
Before performing the ANCOVA procedure to measure outcomes, post-test scores were
tested for normality. The Komogorov-Smirnov (p<.001) and Shapiro-Wilkson (p=.003) test
rejected normality at the .05 alpha level. A histogram (see Figure 18) and Q-Q plot (see Figure
19) was created to further analyze this assumption. The histogram appeared approximately
normal and the Q-Q plot was roughly linear. Based on the robustness of the procedure to this
assumption (Mertler and Vannatta, 2010) and given plots, it was determined to use the dependent
variables without transformation and proceed with further assumption testing.
Figure 18. Histogram for all post-test scores.

181
Figure 19. Normal QQ plot for post scores for all participants.
Mertler and Vannatta (2010) also recommended a test for homogeneity of variances using
a Levene’s test. This test was used to ensure that the covariate is linearly related to the dependent
variable. Levene’s test produced F(1,261)=3.756 with a p-value of .054 indicating a failure to
reject equality of variances between different teachers at a significance level of .05. A linear
relationship was also explored between pre-test and post-test scores (see Figure 20). The scatter
plot and correlation coefficient of .508 indicated that there was an association between students’
pre-tests and post-tests and the inclusion of pre-test scores to be appropriate. Since there was a
moderate relationship between students’ pre-test and post-test scores, pre-test scores were
assumed to serve as a controlling covariate to reduce the variability within students’ post-test
scores.

182
Figure 20. Scatter plot for pre-test vs. post scores for all participants.
The assumption of homogeneity of slopes was tested by observing the interaction
between different teachers and their pre-tests by observing the F ratio and p-value for the
interaction (see Table 21). The ANCOVA indicated no significant interaction between teachers
and the pre-test, F(1, 259)=62.275, p=.076. No significant interaction between teachers and their
pre-tests implied that the assumption of equal slopes for the covariate of pre-test across teachers
was approximately the same. With the testing assumption for homogeneity of slopes and others
as suggested by Mertler and Vannatta (2008) fulfilled, a full factorial ANCOVA was completed.

183
Table 21
Pre-Screening Test for Homogeneity of Slopes between Conformity Levels
Source
Type III Sum of
Squares df Mean Square F Sig.
Partial Eta
Squared
Corrected Model 1594.973a 3 531.658 27.169 .000 .239
Intercept 1647.314 1 1647.314 84.181 .000 .245
Conformity 44.102 1 44.102 2.254 .135 .009
Pretest 1207.730 1 1207.730 61.717 .000 .192
conformity * pretesta 62.275 1 62.275 3.182 .076 .012
Error 5068.305 259 19.569
Total 118237.000 263
Corrected Total 6663.278 262
Note. a The conformity*pretest factor tests for homogeneity of slopes.
Thus, assumptions for completing the ANCOVA were verified. The assumption of
homogenous slopes was not rejected. The covariate of pre-tests was determined to be used
reduce variability in students’ post-test scores. Students’ post-test scores were assumed to be
from a normal distribution based on QQ plots and histograms. Assumptions of homogenous
variance between high and low conformity groupings was not rejected. Based on these
assumptions, analysis was performed to test for differences between high and low conformity
classrooms.
Analysis
The ANCOVA procedure was completed in SPSS using Type III sum of squares to
determine if differences existed in students’ statistical reasoning between high and low

184
conformity classrooms. The ANCOVA testing procedure found that after adjustment for the
significant covariate of pre-tests, post-test scores did not significantly vary between high and low
conformity teacher groupings, F(1,260)=.953, p=.330, ɳ2=.024 (see Table 22). Thus, reasoning
ability was not statistically different between grouping of teachers into high and low conformity
sets adjusting for pre-test scores. A partial Eta Squared of .024 was deemed a low effect size
(Ferguson, 2009).
Table 22
ANCOVA Test for Differences between Conformity Levels after Controlling for Pre-Tests
Source
Type III Sum of
Squares df Mean Square F Sig.
Partial Eta
Squared
Corrected Model 1532.698a 2 766.349 38.836 .000 .230
Intercept 1609.612 1 1609.612 81.570 .000 .239
Pretest 1527.173 1 1527.173 77.392 .000 .229
conformity 18.797 1 18.797 .953 .330 .004
Error 5130.580 260 19.733
Total 118237.000 263
Corrected Total 6663.278 262
Note. a The conformity factor tests for differences between high conformity and low conformity
to SRLE principles grouping.
The unadjusted post-test score averages for high conformity classrooms was 20.39 and
for low conformity classrooms was 20.7. The adjusted post-test score average for high
conformity classrooms was 20.3 and for low conformity classrooms was 20.8. The decrease in
adjusted means for high conformity classrooms may potentially be related to higher pre-test
scores in the grouping. Though effects of the SRLE were mixed from initial analysis of pre-test

185
results, higher pre-test scores caused a reduction in adjusted student post-test means for high
conformity teachers. Similarly, the increase in adjusted means for post-test scores in low
conformity classrooms indicated lower than average pre-test scores.
Thus, statistically significant results were not found between students’ reasoning ability
after adjustment for students’ prior reasoning ability as measured by the CAOS. Though
statistical differences were not found between the grouping of teachers’ students into high and
low conformity groupings, the answer to research question three was not clear. The extent to
which differences did exist between high and low conformity classrooms needed more detail,
because variation between teachers’ students in the experiment was quite evident from research
questions one and two. Potential weighting by total students’ participating in each teachers’
classrooms may have skewed differences that existed between matches. To understand further
the effects of conformity to SRLE principles on students’ statistical reasoning, exploratory
analysis was conducted to understand the variation between teachers, specifically matched
teachers.
Exploratory Analysis
Given the differences in the number of participating students from each teacher deemed
as having high conformity and low conformity to SRLE principles, individual differences
between matched teachers within the study were explored. Before assuming that there was a
difference between individual teachers however, an ANCOVA was performed in order to
determine if significant differences existed between different teachers’ post-assessment scores
while controlling for pre-test scores. Before performing the ANCOVA for differences between
each teachers’ classes within the study, testing conditions were checked.

186
Equality of variances was checked using a Levene’s test which resulted in F(9,253)=1.46
and a p-value of .163 giving no evidence to reject equality of variances between teachers.
Previously checked assumptions from the ANCOVA on conformity level were sufficient to
proceed with the ANCOVA procedure testing for differences between teachers in the experiment
after adjusting for students’ pre-test scores (see Table 23).
Table 23
ANCOVA Test for Differences between Teachers after Controlling for Pre-Tests
Source
Type III Sum of
Squares df Mean Square F Sig.
Partial Eta
Squared
Corrected Model 2351.098 10 235.110 13.740 .000 .353
Intercept 1678.883 1 1678.883 98.112 .000 .280
Pretest 1253.462 1 1253.462 73.251 .000 .225
Teacher 837.197 9 93.022 5.436 .000 .163
Error 4312.179 252 17.112
Total 118237.000 263
Corrected Total 6663.278 262
Note. a The teacher factor tests for differences among all teachers in the study.
After adjusting for the significant covariate of students’ pre-test scores, there was a
statistically significant difference between teachers’ students statistical reasoning on the post-
test, F(9,252)=5.436, p<.001, ɳ2=.163. This significant difference meant that differences existed
in students’ post-test scores between at least one pair of teachers in the study. A ɳ2 of .163
indicated that teachers had a moderate effect for differences in students’ post-test scores. Based
on confounding factors between different matches, only students’ post-test adjusted means were

187
compared between matched teachers (see Table 24). This post-hoc analysis confirmed three sets
of matched classrooms in the experiment that had differences in post-test scores that had a less
than 10% probability happening by chance. Ten percent was chosen for further analysis because
of the exploratory nature of the analysis and the clear division of p-values between matched
participants in the study. Of these, one lower conforming teacher’s classes outperformed a higher
conforming teacher’s classes (Match 1) and two higher conforming teachers’ classes
outperformed their respective lower conforming teacher’s class when accounting for students’
pre-test scores (Match 2 and 3). Table 25 was also created to further understand these differences
in adjusted means, by comparing increases from pre-test to unadjusted post-test score means
between matched teachers.
Table 24
Adjusted Class Mean Comparisons between Matched Teachers
Match High Conformity
Teachers Adjusted
Mean
Low Conformity
Teachers Adjusted
Mean
Difference P-value for
pairwise
comparison
1 18.771 20.767 -1.996 .017
2 24.680 17.205 7.475 .003
3 25.149 22.208 2.941 .088
5 18.916 20.335 -1.419 .210
4 20.542 19.846 .696 .730

188
Table 25
Comparison of Percent of Increase between Matched Teachers
High Conformity Low Conformity
Mat
ch
Tea
cher
Num
ber
Pre
-tes
t P
erce
nt
Corr
ect
Post
-tes
t P
erce
nt
Corr
ect
Per
cent
of
Incr
ease
Tea
cher
Num
ber
Pre
-tes
t P
erce
nt
Corr
ect
Post
-tes
t P
erce
nt
Corr
ect
Per
cent
of
Incr
ease
Difference in
Average Increase
between Low
and High
Conformity
1 11 46.5% 49% 2.5% 5 46% 53% 7% -4.5%
2 10 42.5% 61.5% 19% 3 36.8% 40.9% 4.1% 14.9%
3 13 40% 61% 21% 4 52.7% 63.3% 10.4% 10.6%
Using adjusted means, students of Teachers 10 and 13 had substantial higher statistical
reasoning ability on the post-test in comparison to their matched teachers and all others within
the study. The average percent correct in these two teachers’ classes was over 60%. Similarly,
Teachers 10 and 13 also increased on pre-test to post-test scores by 19 and 21% respectively.
Both of these teachers were from the higher conformity grouping. This implies that the largest
gains on post-test scores were from two teachers within the higher conformity groupings after
controlling for pre-test scores. The only other teacher to have improvements higher than the
national average of 9.1% was Teacher 4, who had an improvement in its score of 10.6%. In
addition, this teacher’s class had pre-test results higher than the national average post-test.
The lowest performing high conformity teacher (Teacher 11) represented over half of the
total high conformity group. Thus, potential also existed for unequal allocation between matched
189
samples to overweight conformity levels. The matched Teachers 1 and 9 represented
approximately 39.3% of the low conformity group and approximately 19.5% of the high
conformity group respectively. Because of unequal allocations of students in the high and low
conformity groupings by different teachers, potential weighting of means existed in the
ANCOVA testing procedure. This can be exhibited by comparing the mean of teachers’ means in
Table 14 and Table 19 of 21.3 for high conformity and 20.4 for low conformity with the overall
low conformity mean of 20.7 and 20.3 and for high conformity classrooms. These results
produce mixed interpretations for the increase of statistical reasoning based on weighting of
students’ post-test scores. We will now take a closer look at the three pairs of matched teachers
with statistically significant pairwise differences (see Table 24).
Match 1. Match 1 consisted of Teacher 5 with 70 (33.5% of low conformity group) total
student participants and Teacher 11 which had 46 (52.9% of high conformity group) total student
participants. Match 1 consisted of teachers with the most experience teaching statistics in the
study, six and seven years. These teachers also had similar coursework in statistics and
professional development. Both teachers within this match consisted of schools who reported
less than 30% free and reduced lunch.
Though Teacher 11 had the most experience teaching statistics, student performance in
the class was the lowest within the high conformity grouping considering both adjusted and non-
adjusted means. Teacher 5 was the second highest performing low conformity teacher given
either the adjusted or the non-adjusted means. Teacher 5 increased by 7% from pre-test to post-
test while Teacher 11 increased by 2.5%. The difference between the two teachers’ classes was
approximately two questions on the post-test given the adjusted and non-adjusted means. The
probability of a difference this large or larger to occur by chance was calculated to be

190
approximately 1.7%. Thus, differences found between these two teachers’ students were not due
to chance alone. Based on the raw percent of increase being low in the high conformity teachers’
classes compared to national averages and this study’s average, this statistical difference may
more likely be due to a low performance of students in the high conformity teachers’ classes
rather than high performing students in the low conformity teachers’ classroom.
Match 2. Match 2 consisted of two teachers with one year of experience. Teacher 3, the
the teacher found to have low conformity to SRLE principles, consisted of 11 (6.2% of low
conformity group) students and Teacher 10 consisted of five students (5.7% of high conformity
group). Teachers of the classrooms both reported similar teaching coursework in statistics while
Teacher 10’s teacher reported approximately four more hours of professional development. Both
schools reported between 58% and 60% free and reduced lunch.
The low conformity Teacher 3 had the lowest student performance within the study and
classroom 10 was the highest performing high conformity teacher. Teacher 3’s students
increased by only 4.1% from pre-test to post-test results while Teacher 10’s students increased
by 19%. After accounting for pre-test scores, the high conformity teachers’ students correctly
answered approximately 7.5 more questions, or 19% of the post-test. The probability of a
difference this large or larger to occur by chance was calculated to be approximately .3%. Thus,
differences found between these two teachers’ students were probably not due to chance alone.
Though the low conformity teacher was the lowest performing teacher within the low conformity
group, Teacher 10 had student improvement rates and post-test scores much higher than the
national average. This difference was likely due to high performance in student reasoning in the
high conformity teacher’s class rather than low performance by students in low conformity
teacher’s class.

191
Match 3. Match 3 consisted of Teacher 4 and 13. Teacher 4 had 23 (12.9% of total low
conformity group) total students participate and Teacher 13 had 12 (13.8% of high conformity
group) total students. Both teachers within this matching reported two years of experience
teaching statistics with between 8 and 12 courses in statistics. These teachers also reported very
high amounts of professional development in statistics education, 7 and 9 hours. Teacher 13 had
higher amounts of coursework and reported professional development in both situations. Teacher
4 reported 0% free and reduced lunch while Teacher 13 reported 50% free and reduced lunch.
Teacher 13, a high conformity teacher, after adjusting for pre-test scores outperformed
the lower conformity Teacher 4 by approximately 3 questions or 7.5% higher on the post-test.
Teacher 13 increased by 21% from pre-test to post-test while Teacher 4 increased by 10.6%.
Given the difference in potential student demographics and opportunity to learn, this matching is
eye opening. Students from a lower socio-economic school with low pre-assessment scores
increased to nearly the same level of performance on post-test scores as their higher socio-
economic status counterparts. The probability of a difference in increase this large or larger to
occur by chance was calculated to be approximately 8.8%. Thus, differences found between
these two teachers’ students were probably not due to chance alone.
Based on individual matched comparisons, significant differences existed in student post-
test scores between three matched high and low conformity teachers. The difference observed in
favor of lower conformity teachers (Match 1) was likely due to a low performing high
conformity teacher rather than the high performance of the high conformity teacher. This is
based on a student increase of only 7% in the low conformity teacher’s class. Differences in
favor of higher conformity teachers were more likely due to high performance of students in the
high conformity teachers’ classes rather than the low performance of students in the low

192
conformity teachers’ classes. This is because Matches 2 and 3 had improvement rates nearly
double and triple their matched low conformity counterparts. These differences shed light on
implications for researchers, teachers, and teacher educators.
Based on the high performance of students’ post-test scores and improvement rates in
these teachers’ classes, the difference observed between these matchings were likely due to high
improvement rates of the high conformity classroom. Matching 3 also illustrated the potential for
SRLE principles to cross barriers of school demographics that were measured in this study by
free and reduced lunch. Students’ pre-test scores were approximately 13% lower in the high
conformity classroom, while raw post-test scores were very similar.
In summary, no statistical difference in reasoning ability was found between groupings of
low conformity and high conformity classrooms. These results were potentially biased however
by weighting of the pool of students in each grouping by the number of students each teacher
influenced. Further exploratory analysis revealed statistically different pairwise comparisons
between matched teachers. Individual comparisons revealed that these differences were related
more to the presence of high variation among teachers with high conformity to SRLE principles.
Two high conformity teachers had substantial increases in students’ statistical reasoning as
compared to their similar low conformity teachers and one high conformity teacher had
substantially lower student increases in reasoning than its similar low conformity teacher’s
students.
193
Chapter 5: Conclusions and Implications
In this chapter, the limitations and conclusions of the study are presented. This is
followed by the implications of the study for teachers and teacher educators. Lastly, directions
for future research studies are suggested.
Limitations
This study is quasi-experimental, which has several inherent limitations. Possibly the
largest limitation of this type of design is its lack of randomization. The methodology proposed
attempted to reduce lack of randomization by matching teachers based on their previous
statistical teaching experience, content knowledge of statistics at the teacher level, and on school
socio-economic status. Matching of teachers were exact at the first level and varied slightly at the
second and third levels. Matching 4 varied largely at the third level around socio-economic status
but was included because of the teachers’ high levels of statistical content knowledge. Though
these matches attempted to produce a quasi-randomization, confounding factors could easily be
present. A noteworthy confounding factor present in the study was actual class sizes in Table 7;
high conformity teachers’ classrooms were smaller on average than low conformity classrooms
across matched and non-matched classrooms.
Because of the lack of assignment to particular conformity groups, there were also
unequal treatment allocations by each teacher within both high and low conformity groupings.
One teacher had five total participants in the study while another in the group with the same
conformity had forty-six. This large difference within conformity levels could affect conclusions

194
made in the study. To adjust for this phenomenon, type III sum of squares was used to reduce the
effects of weighted means. Analysis was also performed between conformity levels and between
teachers with type III sum of squares to reduce this potential for error and maximize potential to
observe differences.
Since the study included young students or vulnerable populations, Institutional Review
Board approval of the study was delayed. Based on a later start of the study than anticipated, pre-
tests were administered approximately after 25% of the course was completed. With this in mind,
effects of the Statistical Reasoning Learning Environment (SRLE) (Garfield and Ben-Zvi, 2008,
2009) may have been found in pre-test results. This would have limited the effect size observed
from pre-tests to post-tests. Pre-tests were compared between and across matched groups
because of this limitation in the study. Though student pre-tests were similar between most
matched teachers, the matched teachers with large difference between school socio-economic
statuses also had large differences in pre-test results. The large difference in pre-test scores
between these two teachers’ students could have potentially had maturation bias. Pre-tests being
administered at earlier stages in the course could help increase effect size observed in similar
future studies.
Though the Statistics Teaching Inventory (STI) (Zieffler, et. al, 2012) was assumed an
improvement from its previously completed counterpart, the instrument itself was not fully
validated before the study. Thus, teachers identified as being high or low conformity could have
been potentially misidentified. The technology component of the STI failed to collect
information from teachers based on their identification of calculator use. This may have
potentially misrepresented the use of technology within the course. The use of the STI, a purely

195
quantitative instrument based on teachers’ perceived use and beliefs in effectiveness of SRLE
principles, could have potentially produced biased results.
Participants in this study were largely new teachers of statistics. Remillard (2005)
emphasized the impact that teacher experiences, content knowledge, and pedagogical content
knowledge play on enacting an intended reform based curriculum. Thus newer teachers and their
variation in experiences, content knowledge, and pedagogical content knowledge could have
substantially influenced the relationship of the intended and enacted curriculum. Stein,
Remillard, and Smith (2007) discussed the differences between the intended and enacted
curriculum in education and specifically with two new elementary teachers. The intended
curriculum was represented in this study by the beliefs and practice scale in the STI while the
enacted curriculum was unmeasured. The discrepancy between the intended and enacted
curriculum could have potentially produced higher or lower conformity rates for participants
within the study potentially skewing results in unpredictable ways.
Conclusions
Although the data did not yield statistically significantly results between levels of
conformity with the SRLE model, there were significant differences within high conformity
teachers’ classrooms, within low conformity teachers’ classrooms, and between matched
teachers. Key results for each of the research questions are presented in the sections below.
The Development of Reasoning in High Conforming SRLE Classrooms
Research question one examined the extent to which students’ statistical reasoning and
thinking ability improve in classrooms that show high levels of conformity to a Statistical
Reasoning Learning Environment. For teachers identified as high conformity to SRLE
principles, significant differences existed in students’ post-test scores after adjustment for their

196
pre-test scores. Results for student improvement and post-test scores among high conformity
teachers’ varied. Post-hoc analysis revealed two sets teachers which had significantly higher
student scores and levels of improvement than three others in the high conformity grouping.
These two sets of teachers improved by approximately 20% and had post-test scores 10% higher
than others in the group. In addition, these two teachers’ students scored 10% higher than
national averages for college students in improvement and post-test scores. The three other
teachers’ students in the high conformity group scored below the national average for college
students in both improvement and post-test scores.
Though significant differences did exist between students’ development of statistical
reasoning among high conformity teachers, these differences must be interpreted with caution.
The lack of randomization and quasi-experimental matching between these high conformity
teachers substantially limits the ability to draw comparisons. Years of experience, coursework in
statistics, professional development in statistics education, and school socio-economic status
were not grouped similarly. These findings do suggest however that the use of SRLE principles
(Garfield and Ben-Zvi, 2008, 2009) did produce two classrooms with significantly larger test
scores and improvements than both the national average for college students and other teachers
identified as high conformity in this study. Variation within groupings of high conformity
teachers’ students suggest either unmeasured discrepancy between belief and practice for
participants involved in the study, confounding factors that may have impacted results, or STI
factor weighting for identification of SRLE conformity.
The extent to which students’ reasoning ability increased among high conformity
teachers varied considerably. Two teachers’ students had improvement rates roughly three times
as much as others in the grouping and twice as much as national averages for improvement.

197
Three of the teachers in the high conformity grouping had student increases lower than the
national average improvement rates.
The Development of Statistical Reasoning in Low Conformity SRLE Classrooms
Research question two examined the extent to which students’ statistical reasoning and
thinking improve in teachers’ classrooms that do not conform to the SRLE. Significant
differences between students’ post-test scores among teachers in the low conformity grouping
existed after adjustment for pre-test scores. A small effect size (Ferguson, 2009), however,
indicated minor variation between teachers in the low conformity grouping.
Four of the teachers in the lower conforming group had student improvement rates less
than the national average for improvement while one teachers’ students improved 1% more than
the national average for improvement. Two of the teachers, without adjustment for student pre-
test scores, students scored above the national average for college students. Of note, the one low
conformity teacher who students improved 1% more than the national average for college
students also had a student pre-assessment average as high as national average post-test scores.
Similar to teachers in the high conformity grouping, comparisons between low
conformity groupings must be interpreted with caution. Many confounding variables have been
identified and uncontrolled for in these comparisons. Unique to the low conformity group
however is the effect of maturation for Teacher 4. With a baseline average as high as national
averages for college students, students may show growth at different rates than others within the
study. The extent to which students reasoning ability increased in low conformity teachers’
classrooms was not substantially different than national averages for improvement. One teacher
had student improvements larger than the national average while four others had rates smaller.

198
Results for low conformity teachers’ classrooms were also more consistent with national
averages for improvement than the high conformity teachers.
Difference between the Development of Statistical Reasoning in Low and High Conformity
Classrooms
Research question three examined the extent to which students’ ability to reason and
think about statistics differ between teachers’ classes that do and do not conform to the SRLE
principles. No statistical difference in student post-test scores was found between the groupings
of high conformity and low conformity teachers’ students after adjustment for pre-test scores in
the Analysis of Covariance design. Unadjusted and adjusted means were slightly higher for
lower conformity teachers’ classrooms than high conformity teachers’ classrooms. The
comparison of high conformity and low conformity groups, however, should be used with
caution. Larger numbers of influences on students for certain teachers in the experiment
weighted the effects of the teacher in high and low conformity groupings.
Based on the difference in the number of students each teacher influenced, further
exploratory analysis was conducted to understand differences between the high and low
conformity matchings. Statistical differences among students’ post-test scores in the study did
exist between three matched teachers in the study while controlling for students’ pre-test scores.
Post-hoc analysis compared matched teachers in the quasi-experiment.
Two lower conformity teachers’ students outperformed their matched high conformity
matches and three higher conformity teachers’ students outperformed their low conformity
teachers’ students. Of the two lower conformity teachers whose students outperformed their
respective higher conformity classrooms, only one match had statistically significant differences.

199
Of the five matched teachers, three of the high conformity classrooms outperformed their
matched low conformity classrooms. The likelihood for two of these three to occur by chance
were less than 10%. Noteworthy from initial pre-test analysis, four of the high conformity
classrooms also outperformed their matched lower conformity classrooms.
The extent to which students reasoning ability differed between low and high conformity
classrooms was not statistically different. Pairwise comparisons of matched teachers in the
experiment revealed three cases in which statistically significant differences did exist. Details of
these differences revealed two high conformity classrooms that demonstrated substantially high
amounts of improvement in statistical reasoning and one high conformity group that showed low
amounts of improvement in statistical reasoning.
In conclusion, this study has found evidence to support the use of SRLE principles to
improve students’ statistical reasoning. These improvements were both substantially above and
below their respective peers. The discrepancy in improvement levels of classrooms categorized
as high conformity to SRLE principles provides reason for further investigation. Perhaps certain
factors of the SRLE contribute more to the increase in students’ statistical reasoning than others
or a strong combination of all factors within the STI are equally important. Based on results of
this study, the use of the SRLE in its entirety does more to improve students’ statistical reasoning
than negatively effect it.

200
Implications
The results from this study can inform both teachers, curriculum writers, and teacher
educators who engage in statistics or mathematics education and also suggest possible directions
for future research.
Teachers, Curriculum Writers, and Teacher Educators
As teachers, curriculum writers, and teacher educators consider the results of the study,
they might consider the potential for increases in reasoning with use of SRLE principles, which
are related to the mathematical teaching practices described in Principles to Action (PtA)
(NCTM, 2014). In particular, Match 2 and 3 in this experiment revealed potential to narrow
achievement gaps present in schools throughout the nation. Furthermore, two classrooms with
high amounts of professional development and coursework in statistics had very high post-test
scores. These results support the importance of teacher professional development in both
pedagogical and content knowledge in statistics.
Equity. Matching 3 in this quasi-experiment differed in socio-economic status of
students but both ended at high values of post-test scores in relationship to other classrooms in
the study. The high conformity Teacher 10’s school also reported free and reduced lunch
amounts larger than most participating teachers’ schools. Teacher 10 and 13 also had national
averages for improvement and post-test scores well above national averages for college students.
Students in these two teachers’ classrooms were able to perform and improve in statistical
reasoning well above the norm and their low conformity counterparts.
These situations exemplify what NCTM (2014) describes as “equity and access.” When
students have access to engaging mathematics curriculum, effective teaching and learning, and
the support and resources needed through organizations like A+ College Ready to maximize

201
their learning potential, they can perform at high levels of statistical reasoning. The two high
conformity classrooms with large amounts of improvement and high post-test scores also support
the fact that SRLE principles (Garfield and Ben-Zvi, 2008, 2009) and teacher practices in PtA
can overcome differences in prior knowledge that may exist between students. Though Teacher
4’s class had substantially larger pre-test scores than other sin the study with reportedly no free
and reduced lunch, Teacher 10 and 13’s classes improved to similar end of course reasoning
ability
Based on the levels of improvement and end of course reasoning ability by students in
Teachers 10 and 13 class within this study, teachers and teacher educators of statistics should
help provide access to statistical courses that promote reasoning and sense making. This can be
encouraged through the emphasis of statistical reasoning during development of teacher
candidates in the post-secondary setting. All students in statistical classes should be asked to
reason and make sense of mathematics regardless of students’ prior knowledge. The
development of high levels of reasoning and sense making in statistics is achievable in all classes
that make this a priority.
Effective Teaching Practices. Substantial student gains and end of course reasoning
ability in Teacher 10 and 13’s classes also support the relationship between effective teaching
practices in mathematics and statistics education. Students’ ability to reason about statistics in
classrooms with high conformity to SRLE principles exemplify the use of instructional practice
and learning environments of students. In addition, these improvements demonstrate the
relationship between effective teaching and learning in mathematics and statistics.
The SRLE’s first principle requiring the focus of central statistical ideas rather than on
presenting set of tools and procedures closely aligns with the PtA’s goal of the establishment of

202
goals for learning and the use of mathematical teaching practices. The establishment of clear
learning goals for specific outcomes is stressed within PtA. Teachers should set clear learning
targets for their students. If teachers believe that reasoning and sense making is important to the
development of students, learning should focus around this and not be expected to happen by
coincidence. Similarly, teacher educators should stress this during teacher preparation. The SETS
document recommended that prospective teachers learn statistics in ways that enable them to
develop a deep conceptual understanding of the statistics they will teach through appropriate
modeling (Franklin et. al, 2015). Setting student goals that stretch beyond mere statistical
competency and recitation of knowledge, that focus on reasoning and sense making in statistics
should be a focus of student learning.
The SRLE’s (Garfield & Ben-Zvi, 2008, 2009) principles of promoting classroom
discourse through statistical arguments and sustained exchanges on significant statistical ideas is
key in PtA’s teaching practice standards as well. In particular, PtA stressed the use of meaningful
mathematical discourse. PtA stated that students should have discourse among students that build
shared understanding of mathematical ideas by analyzing and comparing student approaches and
arguments (NCTM, 2014). Teachers should focus on developing a learning environment that
promotes the reasoning and critiquing of others’ statistical ideas. Similarly, teacher educators
should provide opportunities for teacher candidates to experience this in their own classrooms.
This can be illustrated through in-class demonstrations or teaching experiences and practice in
field settings. The focus of discourse for teachers and teacher educators based on SRLE
principles and PtA teaching practices should however be placed on students.
The use of technology as a tool to build student understanding in mathematics and
statistics classes can help build students reasoning (Chance, et. al, 2007; NCTM, 2014). The

203
SRLE requires students’ teachers to integrate the use of appropriate technological tools that
allow students to test their conjectures, explore and analyze data, and develop their statistical
reasoning. Teachers of statistical classrooms should use technology to build students
understanding rather than just use it as a pedagogical tool. Teachers can do this by designing
lessons around technology designed for specific learning targets. Activities that begin with
smaller experiments can be developed and implemented using technology to gain deeper
conceptual understanding then extended to asymptotic structures. Teacher educators can
illustrate this in their own programs by providing opportunities to mix statistical content and
technology in their coursework and methods courses. Focus should be placed however on the use
of the technology to develop specific statistical content rather than programs to perform statistics
for students without reasoning.
The use of effective curriculum that builds on student prior knowledge as well as
promotes conceptual knowledge can be used to build statistical reasoning (NCTM, 2000). The
SRLE requires teachers to use real and motivating data sets to engage students in making and
testing conjectures. PtA supports curriculum that develops important mathematics along coherent
learning progressions (NCTM, 2014). These progressions should be used to develop connections
among areas of mathematical and statistical study and the real world (NCTM, 2014). The SRLE
also promotes the use classroom activities to support the development of students’ reasoning
(Garfield & Ben-Zvi, 2008, 2009). Similarly, PtA encourages the implementation of tasks that
promote reasoning and problem solving (NCTM, 2014). Teachers should use tasks that engage
students in solving and discussing tasks (NCTM, 2014). These tasks should promote
mathematical reasoning and problem solving in mathematics and statistics and allow for multiple
entry points and varied solution strategies (NCTM, 2014). Teacher educators can reinforce these

204
ideas by using curriculums in their methods courses that reinforce the creation and critiquing of
student knowledge in their lessons.
Using evidence of student thinking through formative and summative assessments to
build student understanding and guide instruction promote students’ ability to statistically reason
(NCTM, 2014). The SRLE required teachers to use assessment to learn what students know and
to monitor the development of their statistical learning as well as to evaluate instructional plans
and progress (Garfield & Ben-Zvi, 2008, 2009). PtA’s last teaching practice promotes the
elicitation and use of evidence to promote student thinking and learning (NCTM, 2014).
Teachers should use evidence of student thinking to assess progress toward students’
development of reasoning and sense making. Teachers can do this and teacher educators can
model this by using authentic and performance based assessments as a tool of, for, and as
learning.
Teacher Knowledge. Similarly, two of the three teachers (Teachers 4 and 13) who had
experienced the most coursework in statistics also had students score substantially higher than
the national average. Though more improvement was found in the higher conformity Teacher 13,
teacher content knowledge may be a contributing factor to students’ statistical reasoning ability
(Jacobson & Lehrer, 2000/2002). For this reason, it is imperative for future teachers of statistics
to have experiences with statistical content. Given mathematical content standards and trends of
these standards, mathematics teacher educators should provide experiences for their teacher
candidates to be successful. The Statistics Education of Teachers (SETS) (Franklin et. al, 2015)
highlights some of the experiences that may potentially be worthwhile for teacher candidates.
The SETS document recommended that because many currently practicing teachers have
not had an opportunity to learn statistics during their pre-service preparation programs, robust

205
professional development opportunities need to be developed to advance in-service teachers’
understanding of statistics (Franklin et. al, 2015). Similarly, SETS recommended all courses and
professional development experiences for statistics teachers allow teacher candidates to develop
the habits of mind of a statistical thinker and reasoner (Franklin et. al, 2015). Institutions need to
provide opportunities for the development of currently practicing and future teachers’ statistical
knowledge at in-depth levels of reasoning and thinking. This development should stretch across
disciplines and focus on the improvement of statistics teaching at all levels (Franklin et. al,
2015).
Future Research
Based on previously mentioned limitations, current research, and findings within this
study, an extension of this study would be profitable in gaining additional insights into the
impact of the SRLE on students’ statistical reasoning. Factors that should be considered in an
extension should include the effects of teachers taking part in the STI survey itself. It is possible
that teachers taking part in the survey before the course could have exhibited reflection that
influenced actual practice. This could be addressed by re-administration of the STI after the
course. The reasoning assessment itself could be replaced with instruments that specifically
monitor statistical reasoning habits such as analyzing a problem, implementing a strategy,
monitoring one’s progress, seeking and using connections, and reflecting on one’s solution
(Shaughnessy, Chance, and Kranendonk, 2009). A newer assessment tool using constructed
responses and multiple choice items such as the Levels of Conceptual Understanding in Statistics
(Jacobbe, 2015) could be used to help monitor the development of students’ reasoning and
conceptual understanding of statistics, especially at the K-12 levels.

206
Based on the experience of conducting this research experiment, it would be advisable to
especially control for the difference between the intended and enacted curriculum (Stein,
Remillard, and Smith, 2007). This could be addressed by a design that included observations of
participants’ instructional practice and/or a student survey on perceived instructional practice
after the course. Using observation or a student survey may potentially reduce conflicts between
teachers intended and enacted curriculum. Currently no known student survey exists that
measures SRLE principles; thus, a useful first step would be the creation and validation of such a
survey. Work by Taylor, Fraser, & White (1994) could be used as an excellent starting point for
such a survey. Such a survey could easily be administered before or after the administration of
the CAOS.
Two teachers’ classes within this study had substantial gains compared to others within
the study and to the national improvement rates for college students. Both of these classes’
teachers were categorized as high conformity to SRLE principles. Potential exists to examine
differences between high conformity classrooms with intentions of understanding the variation
observed within high conformity classrooms. Specific questions may address the influence of
NCTM’s (2014) suggested mathematics teaching practices and principles from the SRLE
(Garfield and Ben-Zvi, 2008). The lowest and highest increases in statistical reasoning were
found within the high conformity classrooms making the understanding of this variance
important for effective use of SRLE principles (Garfield and Ben-Zvi, 2008). Perhaps certain
SRLE principles or mathematical teaching practices have differing impact levels on students’
ability to reason. This could suggest priorities in professional development and teacher
education. In addition, class size may have had more impact in high conformity classrooms than
low conformity classrooms based on the need for student interaction and teacher facilitation.

207
Future research looking at the impact of SRLE principles on statistical reasoning might also
explicitly address class size.
Comparison of teachers’ classes with different levels of socio-economic status led to
interesting results. The one low conformity teacher whose students scored as well as the two high
conformity classrooms had extremely high pre-test scores and reported 0% free and reduced
lunch. Students within this teacher’s classrooms reported taking and completing high levels of
math such as AP Calculus AB during their junior year in high school. This fact highlights the
role that potential earlier coursework can play on students’ ability to reason statistically.
Unfortunately, research related to equity in statistics education and the effects of SRLE
principles on inequity are very limited. NCTM (2000, 2014) has emphasized the role of equity
and access to effective instruction in mathematics classes. Future research looking to understand
the effects of SRLE principles for under-represented, at-risk, and/or lower level students could
expand and contribute significantly to literature in statistics education.
In conclusion, even though results were not statistically significant when comparing low
and high conformity classrooms when grouped as a whole, post hoc comparisons of the
classrooms did provide evidence that supported the effectiveness of SRLE principles focusing on
research based teaching, learning, assessment, and technology for promoting students’ statistical
reasoning. Findings from this study suggest the importance of continuing to study the
development of students statistical reasoning. In addition, SRLE principles have shown potential
to advance students’ statistical reasoning.

208
References
American Diploma Project. (2004). Ready or not: Creating a high school diploma that counts.
Washington, DC: Achieve Inc. Retrieved from www.achieve.org/files/ReadyorNot.pdf.
Baglin, J. (2013). Evaluating Learning Theory-based Methods for Improving the Learning
Outcomes of Introductory Statistics Courses (Doctoral dissertation, RMIT University).
Ben-Zvi, D. (2004). Reasoning about variability in comparing distributions. Statistics Education
Research Journal, 3(2), 42-63. Retrieved from http://iase-web.org/.
Bernard, H., & Ryan, G. (Eds.). (2010). Analyzing qualitative data: Systematic approaches.
Thousand Oaks, CA: Sage.
Biggs, J. (2003). Aligning teaching and assessing to course objectives. Teaching and Learning in
Higher Education: New Trends and Innovations, 2, 13-17.
Boaler, J. (2002). Open and closed mathematics: Student experiences and understanding. In J.
Sowder and B. Schappelle (Eds.), Lessons learned from research, (pp. 135-42). Reston,
VA: National Council for Teachers of Mathematics.
Boaler, J. (2011). Stories of success: Changing students’ lives through sense making and
reasoning. In Strutchens, M. E., & Quander, J. Reed. (Eds.). Focus in high school
mathematics: Fostering reasoning and sense making for all students (pp. 1-16). Reston,
VA: National Council of Teachers of Mathematics.
Bond, M., Perkins, S., & Ramirez, C. (2012). Students perceptions of statistics: An exploration
of attitudes, conceptualizations, and content knowledge of statistics. Statistics Education
Research Journal, 11(2), 6-25. Retrieved from http://stat.auckland.ac.nz/serj.

209
Brenner, M., Herman, S., Ho, H., & Zimmer, J. (1999). Students’ conceptual knowledge of
functions. In J. Sowder & B. Schappelle (Eds.), Lessons learned from research (pp. 213-
217). Reston, VA: National Council of Teachers of Mathematics.
Brewer, J. A., (2007). Introduction to early childhood education. Boston, Massachusetts:
Pearson.
Bright, G. W., & Friel, S. N. (1998). Graphical representations: Helping students interpret data.
In S. P. Lajoie (Ed.), Reflections on statistics: Learning, teaching, and assessment in
grades K–12 (pp. 63–88). Mahwah, NJ: Erlbaum.
Brody, C., & Davidson, N. (Eds.). (1998). Professional development for cooperative learning:
issues and approaches. New York: State University of New York Press.
Brownell, W. (2004). The place of meaning in the teaching of arithmetic. In Carpenter, J. A.
Dossey & J. L. Koehler (Eds.). Classics in mathematics education research (pp. 9-14).
Reston, VA: National Council of Teachers of Mathematics. (Reprinted from Elementary
School Journal, 47, pp. 256-265, by W. Brownell, 1947)
Bulmer, M., & Rolka, K. (2005). The “A4-Project” – Statistical world views expressed through
pictures. In H. L. Chick & J. L. Vincent (Eds.), Proceedings of the 29th Conference of the
International Group for the Psychology of Mathematics Education (Vol. 2, pp. 193-200).
Melbourne, Australia: Psychology of Mathematics Education.
Burrill, G., Franklin, C., Godbold, L., & Young, L. (2003). Navigating through data analysis in
grades 9-12. Reston VA: National Council of Teachers of Mathematics.
Carnell, L. J. (2008). The effect of a student-designed data collection project on attitudes toward
statistics. Journal of Statistics Education, 16(1). Retrieved from
http://www.amstat.org/publications/jse/.

210
Chance, B. L. (1997). Experiences with authentic assessment techniques in an introductory
statistics course. Journal of Statistics Education, 5(3). Retrieved from
http://www.amstat.org/publications/jse/.
Chance, B. L., & Garfield, J. B. (2002). New approaches to gathering data on student learning
for research in statistics education. Statistics Education Research Journal, 1(2), 38-41.
Retrieved from http://iase-web.org/.
Chance, B., & Rossman, A. (2001). Sequencing topics in introductory statistics: A debate on
what to teach when. The American Statistician, 55(2), 140-144.
Chance, B., & Rossman, A. (2006). Using simulation to teach and learn statistics. In A. Rossman
& B. Chance (Eds.), Proceedings of the Seventh International Conference on Teaching
Statistics (pp. 1-6). Voorburg, The Netherlands: International Statistical Institute.
Chance, B., Ben-Zvi, D., Garfield, J., & Medina, E. (2007). The role of technology in improving
student learning of statistics. Technology Innovations in Statistics Education, 1(1), 1-26
Retrieved from https://escholarship.org/uc/item/8sd2t4rr.
Chance, Beth L. (2002). Components of statistical thinking and implications for instruction and
assessment. Journal of Statistics Education, 10(3). Retrieved from
http://www.amstat.org/publications/jse/v10n3/chance.html.
Cobb, G. & Moore, D. (2000). Statistics and mathematics: Tension and cooperation. American
Mathematical Monthly, 107(7), 615-630.
Cobb, G. (1992). Teaching statistics. In Heeding the call for change: Suggestions for curricular
action, Ed. L.A. Steen, pp. 3-43. Washington, D.C.: Mathematical Association of
America.

211
Cobb, G. (2013). Comment: Technology and the future of statistics education. Technology
Innovations in Statistics Education, 7(3), 1-4.
Cobb, G., & Moore, D. (1997). Mathematics, statistics, and teaching. American
Mathematical Monthly, 104, 801-823.
College Board. (2010). Statistics course description. Retrieved from
http://media.collegeboard.com/digitalServices/pdf/ap/ap-statistics-course-description.pdf
on March 2, 2014.
Common Core Standards Writing Team. (2012, April 21). Progressions for the common core
state standards in mathematics (draft). Retrieved from http://commoncoretools.me/wp-
content/uploads/2012/06/ccss_progression_sp_hs_2012_04_21_bis.pdf on August 29,
2015.
Cook, T., & Campbell, D. (1979). Quasi-experimentation: Design & analysis issues for field
settings. Boston: Houghton Mifflin.
Creswell, J. W. (2013). Research design: Qualitative, quantitative, and mixed methods
approaches. Thousand Oaks, CA: Sage.
Dambolena, I. G. (1986), Using simulation in statistics courses. Collegiate Microcomputer, 4(4),
339-344.
Delcham, H. & Sezer, R. (2010). Write skewed: Writing in an introductory statistics course.
Education, 130(4), 603-615.
delmas, G., Garfield, J., Ooms, A., & Chance, B. (2007). Assessing students’ conceptual
understanding after a first course in statistics. Statistics Education Research
Journal, 6(2), 28-58. Retrieved from http://iase-web.org/.

212
delMas, R. (2002). Statistical literacy, reasoning, and thinking: A commentary. Journal of
Statistics Education, 10(3). Retrieved from http://www.amstat.org/publications/jse/.
delMas, R. C. (2004). A comparison of mathematical and statistical reasoning. In D. Ben-Zvi &
J. Garfield (Eds.), The challenge of developing statistical literacy, reasoning and
thinking (pp. 79-95). Netherlands: Springer.
Driessen, E., Overeem, K., van Tartwijk, J., van der Vleuten, C., & Muijtjens, A. (2006).
Validity of portfolio assessment: Which qualities determine ratings? Medical Education,
40(9), 862-866.
Erlwanger, S. H. (2004). Benny’s conception of rules and answers in IPI mathematics. In
Carpenter, J. A. Dossey & J. L. Koehler (Eds.). Classics in mathematics education
research (pp. 49-58). Reston, VA: National Council of Teachers of Mathematics.
(Reprinted from Journal of Children’s Mathematical Behavior, 1, pp. 7-26, by S.
Erlwanger, 1973)
Feldman, A., Konold, C., Coulter, B., & Conroy, B. (2000). Network science, a decade later:
The Internet and classroom learning. Mahwah, NH: Erlbaum.
Ferguson, C. J. (2009). An effect size primer: A guide for clinicians and researchers.
Professional Psychology: Research and Practice, 40(5), 532-538.
Flores, A. (2007). Examining disparities in mathematics education: Achievement gap or
opportunity gap. High School Journal, 91(1), 29-42.
Franklin, C. & Jacobbe, T. (2014, March). The statistics education of teachers. AMSTAT News,
441, 28.
213
Franklin, C., Bargagliotti, A., Case, C., Kader, G., Scheaffer, R., Spangler, D. (2015). Statistics
education of teachers. Retrieved from The American Statistical Association website:
www.amstat.org/education/SET/SET.pdf.
Franklin, C., Kader, G., Mewborn, D., Moreno, J., Peck, R., Perry, M., & Scheaffer, R. (2007).
Guidelines for assessment and instruction in statistics education report. Alexandria, VA:
American Statistical Association.
Fraser, B. J. (1998). Classroom environment instruments: Development, validity and
applications. Learning environments research, 1(1), 7-34.
Froelich, A., Stephenson, W., & Duckworth, W. (2008). Assessment of materials for engaging
students in statistical discovery. Journal of Statistics Education, 16(2). Retrieved from
http://www.amstat.org/publications/jse/.
Gal, I., & Ginsburg, L. (1994). The role of beliefs and attitudes in learning statistics: Towards an
assessment framework. Journal of Statistics Education,2(2).
Garfield, J. & Ben-Zvi, D. (2008). Preparing school teachers to develop students’ statistical
reasoning. In C. Batanero, G. Burrill, C. Reading & A. Rossman (Eds.), Proceedings of
the Joint ICMI/IASE Study on Statistics Education in School Mathematics: Challenges
for Teachning and Teacher Education. Monterrey, Mexico: ITESM.
Garfield, J. & Ben-Zvi, D. (2009) Helping students develop statistical reasoning: Implementing a
statistical reasoning learning environment. Teaching Statistics, 31(3), 72–77.
Garfield, J. & Chance, B. (2000). Assessment in statistics education: Issues and challenges.
Mathematics Teaching and Learning, 2, 99-125.
Garfield, J. (2002). The challenge of developing statistical reasoning. Journal of Statistics
Education, 10(3). Retrieved from http://www.amstat.org/publications/jse/.

214
Garfield, J. (2003). Assessing statistical reasoning. Statistics Education Research Journal, 2(1),
22-38. Retrieved from http://iase-web.org/.
Garfunkel, S., Hirsch, C., Reys, B., Fey, J., Robinson, E., & Mark, J. (2011). A summary report
from the conference “Moving forward together: Curriculum & assessment and the
common core state standards for mathematics”. Arlington, VA: Consortium for
Mathematics and Its Application.
Garofalo, J., & Lester Jr, F. (1985). Metacognition, cognitive monitoring, and mathematical
performance. Journal for research in mathematics education, 16(3), 163-176.
Gelman, A., & Nolan, D. (2002). Teaching statistics: A bag of tricks. New York: Oxford
University Press.
Gordon, F., and Gordon, S. (1989). Computer graphics simulations of sampling
distributions. Collegiate Microcomputer, 7, 185-189.
Griffith, J., Adams, L., Gu, L., Hart, C., & Nichols-Whitehead, P. (2012). Students’ attitudes
toward statistics across the disciplines: A mixed-methods approach. Statistics Education
Research Journal, 11(2), 45-46.
Hassad, R. A. (2011). Constructivist and behaviorist approaches: Development and initial
evaluation of a teaching practice scale for introductory statistics at the college
level. Numeracy: Advancing Education in Quantitative Literacy, 4(2), 7.
Healy, L. & Hoyles, C. (2000). A study of proof concepts in algebra. In J. Sowder & B.
Schappelle (Eds.), Lessons learned from research (pp. 183-190). Reston, VA: National
Council of Teachers of Mathematics.

215
Henry, B. (2003). Frequency of use of constructivist teaching strategies: Effect on academic
performance, student social behavior, and relationship to class size (Doctoral dissertation,
University of Central Florida Orlando, Florida).
Herbal-Eisenmann, B., & Breyfogle, M. (2005). Questioning our patterns of
questioning. Mathematics Teaching in the Middle School, 10(9), 484-489.
Hierbert, J. & Grouws, D. (2007). The effects of classroom mathematics teaching on students’
learning. Second handbook of research on mathematics teaching and learning, 1, 371-
404.
Hill, H., Ball, D. L., & Schilling, S. (2008). Unpacking pedagogical content knowledge:
Conceptualizing and measuring teachers' topic-specific knowledge of students. Journal
for Research in Mathematics Education, 39(4), 372-400.
Horton, N., Baumer, B., & Wickham, H. (2014). Teaching precursors to data science in
introductory and second courses in statistics. Paper session presented at the meeting of
International Conference on Teaching Statistics 9, Flagstaff, Arizona.
Hubbard, R. (1997). Assessment and the process of learning statistics. Journal of Statistics
Education, 5(1). Retrieved from http://www.amstat.org/publications/jse/.
Hughes, G., Daro, P., Holtzman, D., & Middleton, K. (2013). A Study of the alignment between
the NAEP mathematics framework and the Common Core State Standards for
Mathematics (CCSS-M). American Institutes for Research. Retrieved from
http://files.eric.ed.gov/fulltext/ED545238.pdf.
Institute for Mathematics and Education, Center for Science, Mathematics, and Computer
Education, & Institute for Research on Mathematics and Science Education (2011). Draft
Report of the policy workshop gearing up for the common core state standards in

216
mathematics. Retrieved from http://commoncoretools.me/wp-
content/uploads/2011/12/2011_12_06_gearing_up.pdf.
Jacob, B. (2013). The development of introductory statistics students' informal inferential
reasoning and its relationship to formal inferential reasoning (Doctoral Dissertation,
Syracuse University). Retrieved from http://iase-
web.org/documents/dissertations/13.BridgetteJacob.Dissertation.pdf
Jacobbe, T. (2007). Elementary school teachers’ understanding of essential topics in statistics
and the influence of assessment instruments and a reform curriculum upon their
understanding. (Doctoral dissertation, Clemson University). Retrieved from
www.stat.auckland. ac.nz/~iase/publications.
Jacobbe, T. (2010). Preparing elementary school teachers to teach statistics: an international
dilemma. In Proceedings of the eight international conference on teaching
statistics. Ljubljana: International Association for Statistical Education. Retrieved from
www. stat. auckland. ac. nz/~ iase/publications/icots8.
Jacobbe, T. (2015). NSF funds research in statistics education: LOCUS. AMSTAT News, 453, 35-
36.
Jacobbe, T., & Carvalho, C. (2011). Teachers’ understanding of averages. In C. Batanero, G.
Burrill, & C. Reading (Eds.), Teaching statistics in school mathematics-Challenges for
teaching and teacher education (pp. 199-209). Springer Netherlands.
Jacobs, V. (2002). A longitudinal study of invention and understanding: Children’s multidigit
addition and subtraction. In J. Sowder & B. Schappelle (Eds.), Lessons learned from
research (pp. 93-100). Reston, VA: National Council of Teachers of Mathematics.

217
(Reprinted from Journal for Research in Mathematics Education, 29, pp. 3-20, by V.
Jacobs, 1998)
Jacobson, C. & Lehrer, R. (2002). Teacher appropriation and student learning of geometry
through design. In J. Sowder & B. Schappelle (Eds.), Lessons learned from research (pp.
85-91). Reston, VA: National Council of Teachers of Mathematics. (Reprinted from
Journal for Research in Mathematics Education, 31, pp. 71-88, by C. Jacobson & R.
Lehrer, 2000).
Kader, G., & Perry, M. (2007). Variability for categorical variables. Journal of Statistics
Education, 15(2), 1-17.
Keeler, C. (1997). Portfolio assessment in graduate level statistics courses. In I. Gal, & J.B.
Garfield (Eds.) The Assessment Challenge in Statistics Education. (pp. 165-178).
Nethardlands: IOS Press.
Keeler, C., & Steinhorst, K. (2001). A new approach to learning probability in the first statistics
course. Journal of Statistics Education, 9(3), 1-24.
Kilpatrick, J., Swafford, J., & Findell, B. (Eds.). (2001). Adding it up: Helping children learn
mathematics. Washington, DC: National Academies Press.
Klein, D. (2003). A brief history of American K-12 mathematics education in the 20th century.
Retrieved August 29, 2015 from http://www.csun.edu/~vcmth00m/AHistory.html.
Klopfenstein, K., & Thomas, M. K. (2009). The link between advanced placement experience
and early college success. Southern Economic Journal, 75(3), 873-891.
Konold, C. (2002). Teaching concepts rather than conventions. New England Journal of
Mathematics, 34(2), 69-81.

218
Konold, C., & Higgins, T. L. (2003). Reasoning about data. . In Kilpatrick, J., Martin, W. G., &
Schifter (Eds.), A research companion to principles and standards for school
mathematics (pp. 193-215). Reston, VA: National Council for Teachers of Mathematics
Konold, C., Pollatsek, A., Well, A., & Gagnon, A., (1997). Students analyzing data: Research of
critical barriers. In J.Garfield & G. Burrill (Eds.), Research on the role of technology in
teaching and learning statistics (pp. 151–168). Voorburg, Netherlands: International
Statistical Institute.
Krathwohl, D. (2002). A revision of Bloom's taxonomy: An overview. Theory into
practice, 41(4), 212-218.
Lampert, M. (2004). When the problem is not the question and the solution is not the answer:
Mathematical knowing and teaching. In Carpenter, J. A. Dossey & J. L. Koehler (Eds.).
Classics in mathematics education research (pp. 153-171). Reston, VA: National Council
of Teachers of Mathematics. (Reprinted from American Educational Research Journal,
27, pp. 29-63, by M. Lampert, 1990).
Lee, H., & Hollebrands, K. (2011). Characterizing and developing teachers’ knowledge for
teaching statistics. In C. Batanero, G. Burrill, C. Reading, & A. Rossman (Eds.),
Teaching statistics in school mathematics - Challenges for teaching and teacher
education: A joint ICMI/IASE study (pp. 359-369). New York, NY: Springer.
Lehrer, R., & Romberg, T. (1996). Exploring children's data modeling. Cognition and
Instruction, 14(1), 69-108.
Leman, S., & House, L. (2012). Improving Mr. Miyagi's Coaching Style: Teaching Data
Analytics with Interactive Data Visualizations. Chance, 25(2), 4-12.
219
Lesser, L., & Winsor, M. (2009). English language learners in introductory statistics: Lessons
learned from an exploratory case study of two pre-service teachers. Statistics Education
Research Journal, 8(2), 5-32.
Lohr, S. (2012, February 11). The age of big data. New York Times. Retrieved from
http://www.nytimes.com.
Loveland, J. L. (2014). Traditional lecture versus an activity approach for teaching statistics: A
comparison of outcomes. (Doctoral dissertation, Utah State University).
Lunsford, M., Rowell, G. H., & Goodson-Espy, T. (2006). Classroom research: Assessment of
student understanding of sampling distributions of means and the central limit theorem in
post-calculus probability and statistics classes. Journal of Statistics Education, 14(3).
Retrieved from http://www.amstat.org/publications/jse/.
Marriott, J., Davies, N., & Gibson, L. (2009). Teaching, learning and assessing statistical
problem solving. Journal of Statistics Education, 17(1). Retrieved from
http://www.amstat.org/publications/jse/.
Martin, W. G. (2009). The NCTM high school curriculum project: Why it matters to you.
Mathematics Teacher, 103(3), 164-166.
McAfee, A., & Brynjolfsson, E. (2012). Big data: the management revolution. Harvard Business
Review, 90(10), 60-68.
Mertler, C. & Vannatta, R. (2010). Advanced and multivariate statistical methods: Practical
application and interpretation. Glendale, CA: Pyrczak Publishing.
Middleton, J. & Jansen, A. (2011). Motivation matters and interest counts: Fostering engagement
in mathematics. Reston, VA: National Council of Teachers of Mathematics.

220
Mills, J. D. (2002). Using computer simulation methods to teach statistics: A review of the
literature. Journal of Statistics Education, 10(1). Retrieved from
http://www.amstat.org/publications/jse/.
Koehler, M., & Mishra, P. (2009). What is technological pedagogical content knowledge?
Contemporary Issues in Technology and Teacher Education, 9(1), 60-70.
Mitchell, M. (1993). Situational interest: Its multifaceted structure in the secondary school
mathematics classroom. Journal of Educational Psychology, 85(3), 424-436.
Mokros, J., & Russell, S. (1995). Children's concepts of average and representativeness. Journal
for Research in Mathematics Education, 26, 20-39.
Moore, D. (1993). A generation of statistics education: An interview with Frederick
Mosteller. Journal of Statistics Education, 1(1). Retrieved from
http://www.amstat.org/publications/jse/.
Mullis, I. , Martin, M., Foy, P., and Arora, A. (2012). TIMSS 2011 international results in
mathematics. Chestnut Hill, MA: TIMSS & PIRLS International Study Center.
National Center for Science Education. (August 6, 2015). NGSS adopted in Iowa. Retrieved
from http://ncse.com/news/2015/08/ngss-adopted-iowa-0016567.
National Council of Teachers of Mathematics. (2000). Principles and standards for school
mathematics. Reston, VA: Author.
National Council of Teachers of Mathematics. (2014). Principles to action: Ensuring
mathematics success for all. Reston, VA: Author.
National Council of Teachers of Mathematics. (1991). Professional Standards for Teaching
Mathematics. Reston, VA: Author.

221
National Council of Teachers of Mathematics. (1995). Assessment standards for school
mathematics. Reston, VA: Author.
National Mathematics Advisory Panel. (2008). Foundations for success: The final report of the
national mathematics advisory panel. Washington, D.C.: U. S. Department of Education.
National Governor’s Association Center for Best Practices & Council of Chief State School
Officers (2010). The Common Core State Standards (Mathematics). Washington, D. C.:
Authors.
National Research Council. (2011). A framework for K-12 science education: Practices,
crosscutting concepts, and core ideas. Washington, DC: The National Academies Press.
Neill, J. (2005). John Dewey, philosophy of education. Retrieved from
http://www.wilderdom.com/experiential/JohnDeweyPhilosophyEducation.html
NGSS Lead States. (2013). Next generation science standards: For states, by states. Achieve,
Inc. on behalf of the twenty-six states and partners that collaborated on the NGSS.
Retrieved from http://www.nextgenscience.org/ on July 9, 2014.
Noss, R., Pozzi, S., & Hoyles, C. (1999). Touching epistemologies: Meanings of average and
variation in nursing practice. Educational Studies in Mathematics, 40(1), 25-51.
OECD (2014). PISA 2012 results: What students know and can do – Student performance in
mathematics, reading and science. Paris: OECD Publishing.
Pesek, D. & Kirshner, D. (2002). Interference of instrumental instruction in subsequent relational
learning. In J. Sowder & B. Schappelle (Eds.), Lessons learned from research (pp. 101-
107). Reston, VA: National Council of Teachers of Mathematics. (Reprinted from
Journal for Research in Mathematics Education, 31, pp. 524-540, by D. Pesek & D.
Kirshner, 2000)

222
Petit, M., Zawojewski, J., & Lobato, J. (2010). Formative assessment in secondary school
mathematics classrooms. In J. Lobato (Ed.), Teaching and learning mathematics:
Translating research for secondary school teachers (pp. 67-75), Reston, VA: NCTM.
Pierson, S. (2013, October 4). AP statistics sustains strong growth in 2013. [Web log post]. ASA
Community. Retrieved from http://community.amstat.org/blogs/steve-
pierson/2013/10/04/ap-statistics-sustains-strong-growth-in-2013.
Porter, A., McMaken, J., Hwang, J., & Yang, R. (2011b). Assessing the Common Core
Standards: Opportunities for Improving Measures of Instruction. Educational
Researcher, 40(4), 186-188.
Porter, A., McMaken, J., Hwang, J., & Yang, R. (2011a). Common core standards: The new US
intended curriculum. Educational Researcher, 40(3), 103-116.
Prodromou, T., & Pratt, D. (2006). The role of causality in the co-ordination of two perspectives
on distribution within a virtual simulation. Statistics Education Research Journal, 5(2),
69-88. Retrieved from http://iase-web.org/.
Provasnik, S., Kastberg, D., Ferraro, D., Lemanski, N., Roey, S., & Jenkins, F. (2012).
Highlights from TIMSS 2011: Mathematics and science achievement of US fourth-and
eighth-grade students in an international context. Washington, DC: National Center for
Education Statistics, Institute of Education Sciences, U.S. Department of Education.
Qualtrics (2013). The ridiculously powerful insight platform. Provo, UT. Retrieved from
www.qualtrics.com.
Ramirez-Faghih, C. (2012). Fostering change in college students’ statistical reasoning and
motivation through statistical investigation (Doctoral dissertation, University of

223
Californa). Retrieved from http://iase-
web.org/documents/dissertations/12.Ramirez.Dissertation.pdf.
Reading, C., & Reid, J. (2006). An emerging hierarchy of reasoning about distribution: From a
variation perspective. Statistics Education Research Journal, 5(2), 46-68. Retrieved from
https://www.stat.auckland.ac.nz/~iase/serj/SERJ5(2)_Reading_Reid.pdf.
Reichardt, C., & Mark, M. (2004). Quasi-experimentation. Handbook of practical program
evaluation, 19, 126.
Reid, A. & Petocv, P. (2002). Students conceptions of statistics: A phenomenographic study.
Journal of Statistics Education, 10(2). Retrieved from
www.amstat.org/publications/jse/v10n2/reid.html.
Remillard, J. T. (2005). Examining key concepts in research on teachers’ use of mathematics
curricula. Review of Educational Research, 75(2), 211-246.
Rodriguez, B. (2012, September 1). More than 1 million and counting: The growth of advanced
placement statistics. [Web log post]. AMSTATNEWS. Retrieved from
http://magazine.amstat.org/blog/2012/09/01/prescolumnsept2012/.
Rossman, A. & Chance, B. (2013). Comment: Focusing on Learning. Technology Innovations in
Statistics Education, 7(3). Retrieved from http://escholarship.org/uc/item/2m4222dt.
Rossman, A. & Chance, B. (2002), A data-oriented, active-learning, post-calculus introduction to
statistical concepts, applications, and theory. In B. Phillips (Ed.), Proceedings of the Sixth
International Conference on Teaching of Statistics, Cape Town. Voorburg, Netherlands:
International Statistical Institute.

224
Rossman, A. & Shaughnessy, M. (2013). Interview with Mike Shaughnessy. Journal of Statistics
Education, 21(1). Retrieved from
http://www.amstat.org/publications/jse/v21n1/dunn/rossmanint.pdf.
Rumsey, D. (2002). Statistical literacy as a goal for introductory statistics courses. Journal of
Statistics Education, 10(3). Retrieved from
www.amstat.org/publications/jse/v10n3/rumsey2.html
Sawetamalya, Chaweewan. (1984). Probability and statistics units for junior high school
(Doctoral dissertation, Auburn University). Retrieved from http://etd.auburn.edu/search.
Salkind, N. J. (2004). Statistics for people who think they hate statistics. Thousand Oaks, CA:
Sage Publications.
Schau, C., & Emmioğlu, E. (2012). Do introductory statistics courses in the United States
improve students' attitudes?. Statistics Education Research Journal, 11(2), 70-79.
Retrived from https://www.stat.auckland.ac.nz/~iase/serj/SERJ11(2)_Schau.pdf.
Schraw, G, Flowerday, T. and Lehman, S. (2001). Increasing situational interest in the
classroom. Educational Psychology Review, 13(3), 211-224. Retrieved from
https://www.msu.edu/~dwong/CEP991/CEP991Resources/Schraw-SituationalInterest.pdf
Schwarz, C., & Sutherland, J. (1997). An on-line workshop using a simple capture-recapture
experiment to illustrate the concepts of a sampling distribution. Journal of Statistics
Education, 5(1).
Schwartz, D., Goldman, S. R., Vye, N. J., & Barron, B. J. (1998). Aligning everyday and
mathematical reasoning: The case of sampling assumptions. In S. P. Lajoie (Ed.),
Reflections on statistics: Learning, teaching, and assessment in grades K-12 (pp. 233-
273). Mahwah, NJ: Lawrence Erlbaum Associates.

225
Sengondan, V. & Iksan, Z. (2012). Students’ learning styles and intrinsic motivation in learning
mathematics. Asian Social Science, 8(16), 17-23.
Serradó Bayés, A., Meletiou-Mavrotheris, M., & Paparistodemou, E. (2014). EarlyStatistics: A
course for developing teachers' statistics technological and pedagogical content. Statistique
et Enseignement, 5(1), 5-29.
Shaughnessy, J. M. (2003). Research on students’ understanding of probability. In Kilpatrick, J.,
Martin, W. G., & Schifter (Eds.), A research companion to principles and standards for
school mathematics (pp. 216-226). Reston, VA: National Council for Teachers of
Mathematics.
Shaughnessy, J. M., & Chance, B. (2005). Statistical questions from the classroom. Reston, VA:
National Council for Teachers of Mathematics.
Shaughnessy, J. M., Chance, B., and Kranendonk, H. (2009). Focus in high school mathematics:
Fostering reasoning and sense making in statistics and probability. Reston, VA: National
Council of Teachers of Mathematics.
Shulman, L. (1987). Knowledge and teaching: Foundations of the new reform. Harvard
educational review, 57(1), 1-23.
Simon, M. (2009). Amidst multiple theories of learning in mathematics education. Journal for
Research in Mathematics Education, 40(5), 477–490.
Slauson, L. (2008). Students’ conceptual understanding of understanding of variability (Doctoral
dissertation, The Ohio State University).
Smith, M. & Stein, M. (2011). 5 practices for orchestrating productive mathematical
discussions. Reston, VA: NCTM.
Sowder, J., & Schappelle, B. (2002). Lessons learned from research. Reston, VA: NCTM.

226
Starkings, S. (1997). Assessing student projects. In I. Gal & J. Garfield (Eds.), The assessment
challenge in statistics education (pp. 139-151). Amsterdam: IOS Press and the
International Statistical Institute.
Stein, M.; Remillard, J. & Smith, M. (2007). How curriculum influences student learning. In F.
Lester Jr. (Ed.), Second handbook of research on mathematics teaching and learning (pp.
319-369). Charlotte: Information Age Publishing.
Stein, M., Engle, R. A., Smith, M., & Hughes, E. (2008). Orchestrating productive mathematical
discussions: Five practices for helping teachers move beyond show and
tell. Mathematical Thinking and Learning, 10(4), 313-340.
Stuart, E., & Rubin, D. (2008). Best practices in quasi-experimental designs. In J. Osborne
(ed.), Best practices in quantitative methods (pp. 155-176). Los Angeles: Sage
Publications.
Taylor, P., Fraser, B., & White, L. (1994, April). CLES: An instrument for monitoring the
development of constructivist learning environments. In annual meeting of the American
Educational Research Association, New Orleans, LA.
Teague, D., Avineri, T., Belledin, C., Graves, J., Noble, R., Hernandez, M., Robinson, D. (2011).
Issues of equity for advanced students. In Strutchens, M. E., & Quander, J. Reed. (Eds.).
Focus in high school mathematics: Fostering reasoning and sense making for all students
(pp. 65-83). Reston, VA: National Council of Teachers of Mathematics.
Tintle, N., Topliff, K., Vanderstoep, J., Holmes, V. L., & Swanson, T. (2012). Retention of
statistical concepts in a preliminary randomization-based introductory statistics
curriculum. Statistics Education Research Journal, 11(1). Retrieved from http://iase-
web.org/.

227
Turner, J., Midgley, C., Meyer, D., Gheen, M., Anderman, E. A., Kang, J. & Patrick, H. (2002).
The classroom environment and students’ reports of avoidance strategies in mathematics:
A multi-method study. Journal of Educational Psychology, 94, 88-106.
U.S. Department of Education, Institute of Education Sciences, National Center for Education
Statistics, National Assessment of Educational Progress. (2014, June). Mathematics
Assessment. Washington, D.C.: Authors. Retrieved from
http://nces.ed.gov/nationsreportcard/naepdata on July 12, 2014.
VanHoof, S., Kuppens, S., Castro Sotos, A. E., Verschaffel, L., & Onghena, P. (2011).
Measuring statistics attitudes: Structure of the survey of attitudes toward statistics
(SATS-36). Statistics Education Research Journal, 10(1), 35-51. Retrieved from
http://www.stat.auckland.ac.nz/~iase/serj/SERJ10%281%29_Vanhoof.pdf.
Verkoeijen, P., Imbos, T., van de Wiel, M., Berger, M., & Schmidt, H. (2002). Assessing
knowledge structures in a constructive statistical learning environment. Journal of
Statistics Education, 10(2). Retrieved from
www.amstat.org/publications/jse/v10n2/verkoeijen.html
Voogt, J., Fisser, P., Pareja Roblin, N., Tondeur, J., & van Braak, J. (2013). Technological
pedagogical content knowledge–a review of the literature. Journal of Computer Assisted
Learning, 29(2), 109-121.
Vygotsky, L. (1978). Interaction between learning and development. Readings on the
development of children, 23(3), 34-41.
Wadsworth, B. J. (1996). Piaget's theory of cognitive and affective development: Foundations of
constructivism. London: Longman Publishing.

228
Warshauer, Hiroko. (2011). The role of productive struggle in teaching and learning middle
school mathematics. (Doctoral dissertation the University of Texas at Austin).
Webb, N. (1997). Criteria for alignment of expectations and assessments in mathematics and
science education. Madison, WI: National Institute for Science Education.
Wild, C., & Pfannkuch, M. (1999). Statistical thinking in empirical inquiry. International
Statistical Review, 67(3), 223-248.
Zan, R., Brown, L., Evans, J. & Hannula, M.S. (2006). Affect in mathematics education: An
introduction. Educational Studies in Mathematics, 63, 113-121.
Zieffler, A., Park, J., Garfield, J., delMas, R., & Bjornsdottir, A. (2012). The Statistics teaching
inventory: A survey on statistics teachers’ classroom practices and beliefs. Journal of
Statistics Education, 20(1). Retrieved from
http://www.amstat.org/publications/jse/v20n1/zieffler.pdf.
Zieffler, A., & Garfield, J. (2009). Modeling the growth of students’ covariational reasoning
during an introductory statistics course. Statistics Education Research Journal, 8(1), 7-
31. Retrieved from http://iase-web.org/.

229
Appendix A: Statistics Teaching Inventory
Statistics Teaching Inventory
The following survey will take approximately 15 minute of your time. Please answer each
question carefully and candidly and respond to all the questions in reference to an introductory
statistics course. Refer to the AP statistics course that you currently teach or have recently
taught.
Directions: For questions with a radio button: Select only one answer. For questions with a
checkbox: Select all that apply. For some questions, you will be asked for a percentage. Use the
slider to mark the percentage for these questions. If you are unsure of an exact percent, please
enter an approximation. Use the arrows at the bottom right to move to the next set of questions.
This survey was first created and modified by Andrew Zieffler, Jiyoon Park, Joan Garfield,
Robert delMas, and Audbjorg Bjornsdottir through a grant from the National Science
Foundation (STEPS Project, NSF DUE-0808862).

230
Part I.
Consider the total amount of time that you meet face-to-face with your students. Approximately
what percentage of this time is spent on each of the following? (Note: The percentages below
should add up to 100%)
______ 1. Students meeting together as a whole class (not in small groups) for lecture,
discussion, or demonstration:
______ 2. Students working in groups:
______ 3. Students working individually on an activity:
______ 4. Students taking an assessment:
5. Consider a student who was fully engaged in your course. To what extent do you think that
student would agree or disagree with the following statements about this course?
Strongly Disagree
Disagree Agree Strongly
Agree
a) The content was presented mostly through the
instructor's lectures.
b) The instructor asked challenging questions that
made me think.
c) The course frequently required students to work
together.
d) The content was presented mostly through
activities.
e) This course encouraged students to discover ideas
on their own.
f) This course often used technology (e.g. web
applets, statistical software) to help students
understand concepts.

231
Part II.
The following items will ask you about your curricular emphasis. Consider the entirety of your
course as you complete this section. To what extent are the following addressed in your course?
Seldom or not
at all A few times
Repeatedly
1. The need to base decisions on evidence (data)
2. Difficulties involved in getting good quality data
3. The study of variability is at the core of statistics
4. The need to select an appropriate model for making a
statistical inference
5. The process of selecting an appropriate model for
making a statistical inference
To what extent do you emphasize each of the following approaches to statistical inference in
your course?
Not at
all To some extent
A major emphasis
6. Parametric methods (e.g. t-test, z-test)
7. Bayesian methods
8. Simulation/resampling (e.g. randomization, bootstrap
methods)
9. Other (Please describe):
10. Of all the data sets students see in this course, what portion of them are real data?
None
A few
About half
Most of them
All of them

232
Part III.
1. Other than hand calculators, do students use technology tools during the course?
Yes
No
If Yes Is Selected, Then Skip To 3. In what settings do students work ...If No Is Selected, Then Skip To 2.
What are your reasons for not using...
2. What are your reasons for not using technology other than hand calculators in your course?
(Select all that apply.)
there is no computer technology available
there are departmental constraints on technology use
students are already provided with statistical output
students use hand calculators to compute statistics using formulas
Other ____________________
If 2. What are your reasons fo... Is Greater Than or Equal to 0, Then Skip To End of Block
3. In what settings do students work with each of these technology tools? (Select all that apply.)
Delivery of
course content Activities and assignments (e.g. homework, projects)
Assessments (e.g. quizzes, exams)
Statistical Analysis Packages
(minitab, SPSS, IMP,
StatCrunch, etc.)
Graphing calculators with built in
statistical functions
Spreadsheet tools (e.g. Excel)
Web Applets
Conceptual Software (e.g.
TinkerPlots, Fathom, etc.)
Other:

233
Questions 4 and 5 ask you to consider how students use technology. In answering these
questions, consider the total amount of time students use technology. (These responses do not
need to add up to 100%.)
______ 4. What percentage of time that students spend using technology is designed to spent
analyzing data?
______ 5. What percentage of time that students spend using technology is designed to be
spent understanding statistical concepts?

234
Part IV.
Consider your total set of assessments that count for a grade in your class. Approximately what
percentage of the students’ grade is dedicated to evaluating each of the following? (These
percentages do not need to add up to 100%.)
______ 1. Students’ ability to use formulas to produce numerical summaries of a data set:
______ 2. Students’ ability to perform step-by-step calculations to compute answers to
problems:
______ 3. Students’ ability to critically examine statistics in the media:
______ 4. Students’ ability to interpret results of a statistical analysis:
______ 5. Students’ ability to reason correctly about important statistical concepts:
______ 6. Students’ ability to successfully complete a statistical investigation (e.g., a course
project):
______ 7. Other (please describe):

235
Part V.
Please rate the extent to which you agree or disagree with each of the following statements as
they reflect your beliefs (but not necessarily your actual teaching) regarding the teaching,
learning, and assessment of introductory statistics:
Strongly Disagree
Disagree Undecided Agree Strongly
Agree
1. Rules of probability should be included in
an introductory statistics course.
2. The topic of theoretical probability
distributions (e.g., the binomial distribution)
should be included in an introductory
statistics course.
3. Students should learn how to read
statistical tables of theoretical distributions
(e.g., t-table, F-table).
4. Technology tools should be used to
illustrate most abstract statistical concepts.
5. Students should learn the importance of
using appropriate methods for collecting data.
6. Students should learn connections between
the quality/nature of the data and inferences
that are made.
7. Students should learn fewer topics in
greater depth instead of learning more topics
in less depth.
8. Lectures should be the primary way for
students to learn statistical content.
9. Quizzes and exams should be used as the
primary way to evaluate student learning.
10. Alternative assessments (e.g., projects,
presentations,) should be used to provide
important information about student learning.
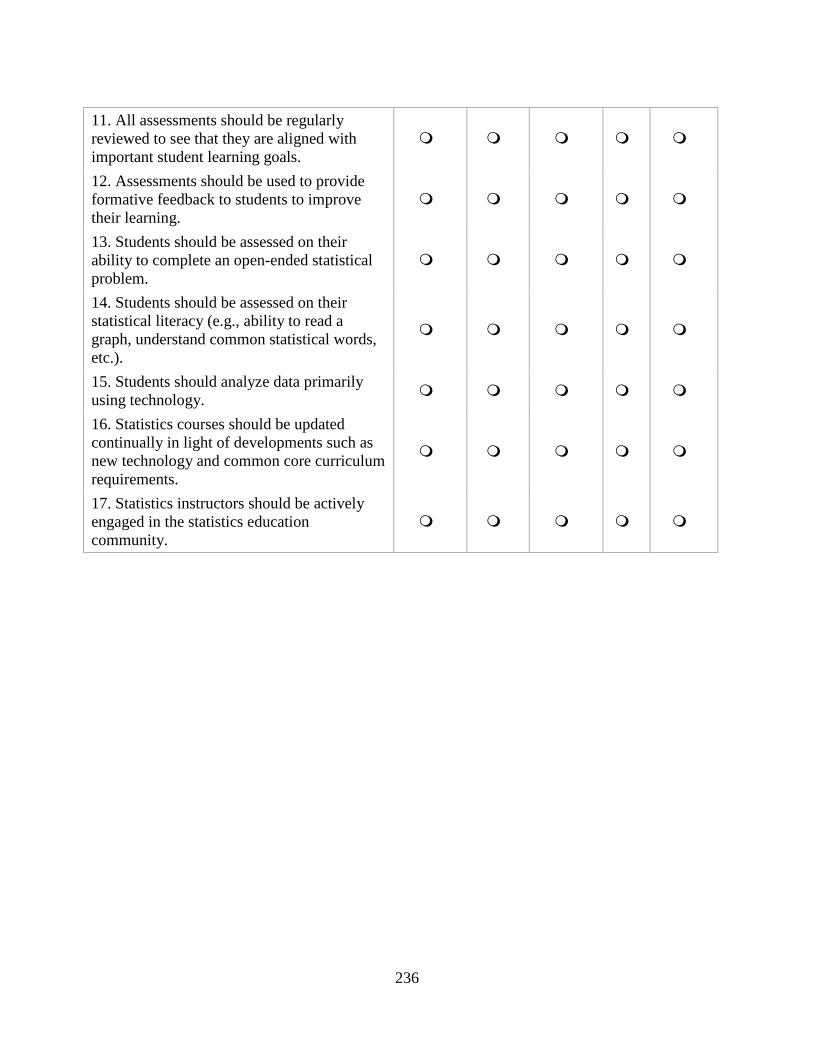
236
11. All assessments should be regularly
reviewed to see that they are aligned with
important student learning goals.
12. Assessments should be used to provide
formative feedback to students to improve
their learning.
13. Students should be assessed on their
ability to complete an open-ended statistical
problem.
14. Students should be assessed on their
statistical literacy (e.g., ability to read a
graph, understand common statistical words,
etc.).
15. Students should analyze data primarily
using technology.
16. Statistics courses should be updated
continually in light of developments such as
new technology and common core curriculum
requirements.
17. Statistics instructors should be actively
engaged in the statistics education
community.

237
Part VI.
1. How many students are enrolled in one typical section of this course?
2. Please indicate the mathematical prerequisite for this course:
Calculus
Pre-Calculus
Algebra II
None
Other ____________________
3. Identify any constraints that keep you from making changes that you would like to implement
to improve your course. (Select all that apply):
Personal time constraints
Departmental or institutional constraints
The teaching assistants you work with
Technology constraints (e.g., lack of computer lab, cost of software)
Characteristics of students (ability, interest, etc.)
Limitations in terms of what can be done within the classroom management system
Your own comfort level with the classroom management system
Other ___________________

238
Part VII.
1. How many years have you been teaching an introductory statistics course?
2. In your graduate coursework, how many courses did you take in theoretical statistics (e.g.,
mathematical statistics, probability)?
None
1
2
3
4
5 or more
3. In your graduate coursework, how many courses did you take in applied statistics (i.e.,
involved the analysis of data)?
None
1
2
3
4
5 or more
4. Please rate the amount of experience you have had in analyzing data outside of your
coursework in statistics (e.g., in your own research, consulting, etc.).
No experience
Very little experience
Some experience
A lot of experience

239
For items 5-8, please indicate the number of professional development opportunities in which
you have participated during the last 2 years to improve your teaching of statistics.
0 1 2 3 4 5 or more
5. Live or pre-recorded webinars (online seminars):
6. Workshops
7. Short courses/minicourses
8. Other:
9. How many years have you been a part of the A+ College Ready program?
10. Please provide any additional comments in the space below.
11. The purpose of this research is to monitor student reasoning in your statistics class. Teachers
whose students participate in this research will be required to administer a pre-assessment and
post-assessment that measures students’ statistical reasoning ability. In addition, teachers will be
required to distribute opt-out letters to students at the beginning of the course to ensure student
and parent willingness to participate. The researcher will contact the teachers’ district leader
responsible for research for approval before the teacher sends home consent letters to parents.
Would you be willing to participate further in this research if your district leader approves?
Yes
No
If No Is Selected, Then Skip To End of Survey. If Yes Is Selected, Then Skip To While all responses will
remain c...

240
While all responses will remain confidential, your contact information is needed for further
participation in this research.
Name:
School:
E-mail:
Number of Students Enrolled at
your school in grades 9-12:
Number of Students in your AP
Statistics course:
Percent of Students with
Free/Reduced Lunch:

241
Appendix B: Comprehensive Assessment of Outcomes
Comprehensive Assessment of Outcomes Cover Sheet
Please read and follow these directions to fill out your Scantron.
You have up to 1 hour to complete this exam. Please use a pencil on the
Scantron form to ensure proper scoring. This test does not require a
calculator, but can be used during testing. There are 40 questions on this
exam.
In the name section of your Scantron form, use the following information to
create your unique anonymous ID.
1. your middle initial - use "X" if you do not have a middle name
2. the first initial of your mother's first name - use "X" if unknown
3. the first initial of your father's first name - use "X" if unknown
4. first digit of your birth month - (01, 02, …, 12)
5. second digit of your birth month - (01, 02, …, 12)
6. number of older siblings - use "9" if greater than nine
Write in the subject the name of your last completed mathematics course.
Write the date you are taking the exam in the date section.
Write in the hour box your teachers name.
When you are finished, please check your Scantron for stray marks and ensure
the rectangles are filled completely.
DO NOT TURN THE PAGE UNTIL DIRECTED TO DO SO.

242
Comprehensive Assessment of Outcomes for a first course in Statistics (CAOS)
CAOS 4
Developed by the Web ARTIST Project https://app.gen.umn.edu/artist/
Funded by a grant from the National Science Foundation NSF CCLI ASA- 0206571
Principal Investigators:
Joan Garfield and Bob delMas, University of Minnesota Beth Chance, Cal Poly – San Luis Obispo Post-doctoral
Research Assistant:
Ann Ooms, University of Minnesota
Version 31
September 8, 2005

243
ARTIST CAOS 4 POSTTEST
The following graph shows a distribution of hours slept last night by a group of college
students.
1. Select the statement below that gives the most complete description of the graph in a
way that demonstrates an understanding of how to statistically describe and interpret
the distribution of a variable.
a. The bars go from 3 to 10, increasing in height to 7, then decreasing to 10. The tallest
bar is at 7. There is a gap between three and five.
b. The distribution is normal, with a mean of about 7 and a standard deviation of about
1.
c. Most students seem to be getting enough sleep at night, but some students slept
more and some slept less. However, one student must have stayed up very late and
got very few hours of sleep.
d. The distribution of hours of sleep is somewhat symmetric and bell-shaped, with an
outlier at 3. The typical amount of sleep is about 7 hours and overall range is 7
hours.

244
2. Which box plot seems to be graphing the same data as the histogram in question 1?
a. Boxplot A.
b. Boxplot B.
c. Boxplot C.

245
Items 3 to 5 refer to the following situation:
Four histograms are displayed below. For each item, match the description to the
appropriate histogram.
3. A distribution for a set of quiz scores where the quiz was very easy is represented by:
a. Histogram I.
b. Histogram II.
c. Histogram III.
d. Histogram IV.
4. A distribution for a set of wrist circumferences (measured in centimeters) taken from
the right wrist of a random sample of newborn female infants is represented by:
a. Histogram I.
b. Histogram II.
c. Histogram III.
d. Histogram IV.

246
5. A distribution for the last digit of phone numbers sampled from a phone book (i.e., for
the phone number 968-9667, the last digit, 7, would be selected) is represented by: a.
Histogram I.
b. Histogram II.
c. Histogram III.
d. Histogram IV.
6. A baseball fan likes to keep track of statistics for the local high school baseball team.
One of the statistics she recorded is the proportion of hits obtained by each player
based on the number of times at bat as shown in the table below. Which of the
following graphs gives the best display of the distribution of proportion of hits in that
it allows the baseball fan to describe the shape, center and spread of the variable,
proportion of hits?
Proportion
Player of hits
BC 0.301
AA 0.143
HK 0.341
RS 0.261
CR 0.115
MD 0.125
Player
Proportion
of hits
Player
Proportion
of hits
BH 0.305 SU 0.270
HA 0.229 DH 0.136
JS 0.281 TO 0.218
TC 0.097 RL 0.267
MM 0.167 JB 0.270
GV 0.333 WG 0.054
RC 0.085 MH 0.108

247
7. A recent research study randomly divided participants into groups who were given
different levels of Vitamin E to take daily. One group received only a placebo pill. The
research study followed the participants for eight years to see how many developed a
particular type of cancer during that time period. Which of the following responses
gives the best explanation as to the purpose of randomization in this study?
a. To increase the accuracy of the research results.
b. To ensure that all potential cancer patients had an equal chance of being selected for
the study.
c. To reduce the amount of sampling error.
d. To produce treatment groups with similar characteristics.
e. To prevent skewness in the results.
A
B
C
D
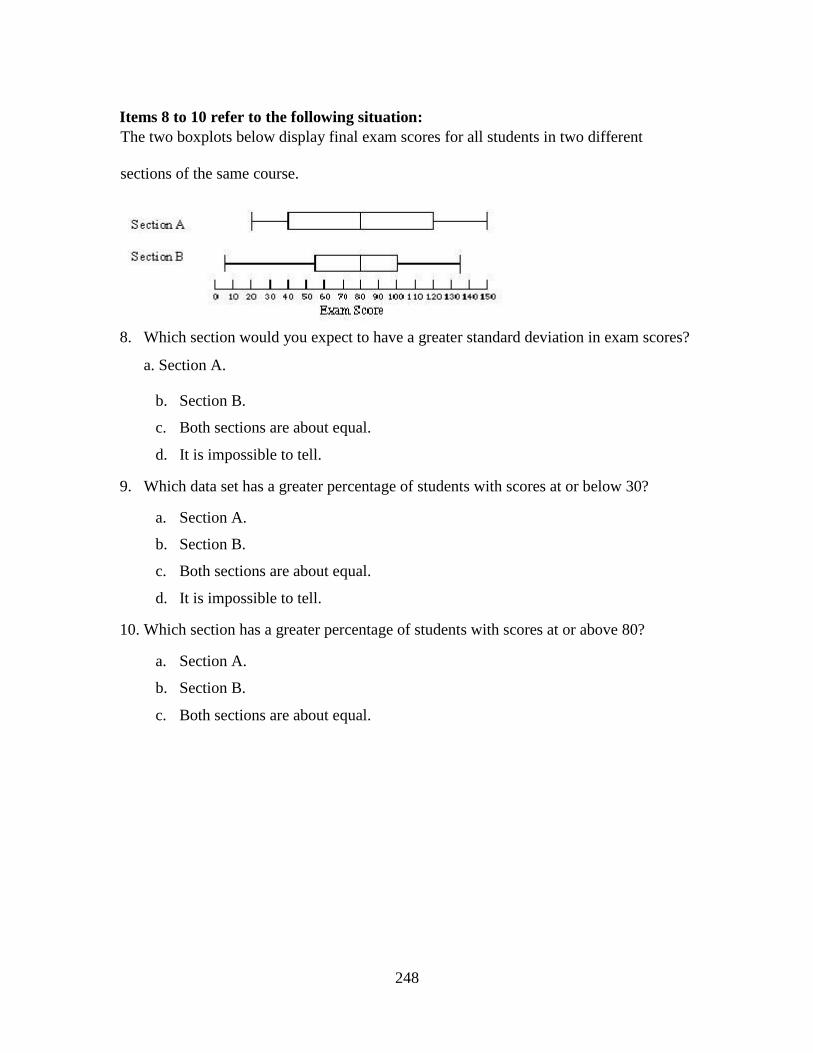
248
Items 8 to 10 refer to the following situation:
The two boxplots below display final exam scores for all students in two different
sections of the same course.
8. Which section would you expect to have a greater standard deviation in exam scores?
a. Section A.
b. Section B.
c. Both sections are about equal.
d. It is impossible to tell.
9. Which data set has a greater percentage of students with scores at or below 30?
a. Section A.
b. Section B.
c. Both sections are about equal.
d. It is impossible to tell.
10. Which section has a greater percentage of students with scores at or above 80?
a. Section A.
b. Section B.
c. Both sections are about equal.

249
Items 11 to 13 refer to the following situation:
A drug company developed a new formula for their headache medication. To test the
effectiveness of this new formula, 250 people were randomly selected from a larger
population of patients with headaches. 100 of these people were randomly assigned to
receive the new formula medication when they had a headache, and the other 150 people
received the old formula medication. The time it took, in minutes, for each patient to no
longer have a headache was recorded. The results from both of these clinical trials are
shown below. Items 11, 12, and 13 present statements made by three different statistics
students. For each statement, indicate whether you think the student’s conclusion is valid.
11. The old formula works better. Two people who took the old formula felt relief in
less than 20 minutes, compared to none who took the new formula. Also, the worst
result - near 120 minutes - was with the new formula.
a. Valid.
b. Not valid.
12. The average time for the new formula to relieve a headache is lower than the
average time for the old formula. I would conclude that people taking the new
formula will tend to feel relief about 20 minutes sooner than those taking the old
formula.
a. Valid.

250
b. Not valid.
13. I would not conclude anything from these data. The number of patients in the two
groups is not the same so there is no fair way to compare the two formulas. a. Valid.
b. Not valid.

251
Items 14 and 15 refer to the following situation:
Five histograms are presented below. Each histogram displays test scores on a scale of 0
to 10 for one of five different statistics classes.
14. Which of the classes would you expect to have the lowest standard deviation, and
why?
a. Class A, because it has the most values close to the mean.
b. Class B, because it has the smallest number of distinct scores.

252
c. Class C, because there is no change in scores.
d. Class A and Class D, because they both have the smallest range.
e. Class E, because it looks the most normal.
15. Which of the classes would you expect to have the highest standard deviation, and
why?
a. Class A, because it has the largest difference between the heights of the bars.
b. Class B, because more of its scores are far from the mean.
c. Class C, because it has the largest number of different scores.
d. Class D, because the distribution is very bumpy and irregular.
e. Class E, because it has a large range and looks normal.
16. A certain manufacturer claims that they produce 50% brown candies. Sam plans to
buy a large family size bag of these candies and Kerry plans to buy a small fun size
bag. Which bag is more likely to have more than 70% brown candies?
a. Sam, because there are more candies, so his bag can have more brown candies.
b. Sam, because there is more variability in the proportion of browns among larger
samples.
c. Kerry, because there is more variability in the proportion of browns among smaller
samples.
d. Kerry, because most small bags will have more than 50% brown candies.
e. Both have the same chance because they are both random samples.
17. Imagine you have a barrel that contains thousands of candies with several different
colors. We know that the manufacturer produces 35% yellow candies. Five students
each take a random sample of 20 candies, one at a time, and record the percentage
of yellow candies in their sample. Which sequence below is the most plausible for
the percent of yellow candies obtained in these five samples?
a. 30%, 35%, 15%, 40%, 50%.
b. 35%, 35%, 35%, 35%, 35%.
c. 5%, 60%, 10%, 50%, 95%.
d. Any of the above.

253
18. Jean lives about 10 miles from the college where she plans to attend a 10-week
summer class. There are two main routes she can take to the school, one through the
city and one through the countryside. The city route is shorter in miles, but has more
stoplights. The country route is longer in miles, but has only a few stop signs and
stoplights. Jean sets up a randomized experiment where each day she tosses a coin
to decide which route to take that day. She records the following data for 5 days of
travel on each route.
Country Route - 17, 15, 17, 16, 18
City Route - 18, 13, 20, 10, 16
It is important to Jean to arrive on time for her classes, but she does not want to arrive too
early because that would increase her parking fees. Based on the data gathered, which route
would you advise her to choose?
a. The Country Route, because the times are consistently between 15 and 18 minutes.
b. The City Route, because she can get there in 10 minutes on a good day and the
average time is less than for the Country Route.
c. Because the times on the two routes have so much overlap, neither route is better
than the other. She might as well flip a coin.
19. A graduate student is designing a research study. She is hoping to show that the
results of an experiment are statistically significant. What type of p-value would she
want to obtain?
a. A large p-value.
b. A small p-value.
c. The magnitude of a p-value has no impact on statistical significance.

254
20. Bone density is typically measured as a standardized score with a mean of 0 and a
standard deviation of 1. Lower scores correspond to lower bone density. Which of
the following graphs shows that as women grow older they tend to have lower bone
density?
a. Graph A.
b. Graph B.
c. Graph C.

255
21. The following scatterplot shows the relationship between scores on an anxiety scale
and an achievement test for science. Choose the best interpretation of the
relationship between anxiety level and science achievement based on the scatterplot.
a. This graph shows a strong negative linear relationship between anxiety and
achievement in science.
b. This graph shows a moderate linear relationship between anxiety and achievement
in science.
c. This graph shows very little, if any, linear relationship between anxiety and
achievement in science.
22. Researchers surveyed 1,000 randomly selected adults in the U.S. A statistically
significant, strong positive correlation was found between income level and the
number of containers of recycling they typically collect in a week. Please select the
best interpretation of this result.
a. We can not conclude whether earning more money causes more recycling among
U.S. adults because this type of design does not allow us to infer causation.
b. This sample is too small to draw any conclusions about the relationship between
income level and amount of recycling for adults in the U.S.
c. This result indicates that earning more money influences people to recycle more
than people who earn less money.

256
Items 23 and 24 refer to the following situation:
A researcher in environmental science is conducting a study to investigate the impact of
a particular herbicide on fish. He has 60 healthy fish and randomly assigns each fish to
either a treatment or a control group. The fish in the treatment group showed higher
levels of the indicator enzyme.
23. Suppose a test of significance was correctly conducted and showed no statistically
significant difference in average enzyme level between the fish that were exposed
to the herbicide and those that were not. What conclusion can the graduate student
draw from these results?
a. The researcher must not be interpreting the results correctly; there should be a
significant difference.
b. The sample size may be too small to detect a statistically significant difference.
c. It must be true that the herbicide does not cause higher levels of the enzyme.
24. Suppose a test of significance was correctly conducted and showed a statistically
significant difference in average enzyme level between the fish that were exposed
to the herbicide and those that were not. What conclusion can the graduate student
draw from these results?
a. There is evidence of association, but no causal effect of herbicide on enzyme levels.
b. The sample size is too small to draw a valid conclusion.
c. He has proven that the herbicide causes higher levels of the enzyme.
d. There is evidence that the herbicide causes higher levels of the enzyme for these
fish.

257
Items 25 to 27 refer to the following situation:
A research article reports the results of a new drug test. The drug is to be used to decrease
vision loss in people with Macular Degeneration. The article gives a p-value of .04 in the
analysis section. Items 25, 26, and 27 present three different interpretations of this pvalue.
Indicate if each interpretation is valid or invalid.
25. The probability of getting results as extreme as or more extreme than the ones in this
study if the drug is actually not effective. a. Valid.
b. Invalid.
26. The probability that the drug is not effective.
a. Valid.
b. Invalid.
27. The probability that the drug is effective.
a. Valid.
b. Invalid.
Items 28 to 31 refer to the following situation:
A high school statistics class wants to estimate the average number of chocolate chips in
a generic brand of chocolate chip cookies. They collect a random sample of cookies,
count the chips in each cookie, and calculate a 95% confidence interval for the average
number of chips per cookie (18.6 to 21.3). Items 28, 29, and 30 present four different
interpretations of these results. Indicate if each interpretation is valid or invalid.
28. We are 95% certain that each cookie for this brand has approximately 18.6 to
21.3 chocolate chips.
a. Valid.
b. Invalid.

258
29. We expect 95% of the cookies to have between 18.6 and 21.3 chocolate chips.
a. Valid.
b. Invalid.
30. We would expect about 95% of all possible sample means from this population to
be between 18.6 and 21.3 chocolate chips.
a. Valid.
b. Invalid.
31. We are 95% certain that the confidence interval of 18.6 to 21.3 includes the true
average number of chocolate chips per cookie.
a. Valid.
b. Invalid.
32. It has been established that under normal environmental conditions, adult
largemouth bass in Silver Lake have an average length of 12.3 inches with a
standard deviation of 3 inches. People who have been fishing Silver Lake for
some time claim that this year they are catching smaller than usual largemouth
bass. A research group from the Department of Natural Resources took a random
sample of 100 adult largemouth bass from Silver Lake and found the mean of this
sample to be 11.2 inches. Which of the following is the most appropriate
statistical conclusion?
a. The researchers cannot conclude that the fish are smaller than what is normal
because 11.2 inches is less than one standard deviation from the established
mean (12.3 inches) for this species.
b. The researchers can conclude that the fish are smaller than what is normal
because the sample mean should be almost identical to the population mean with
a large sample of 100 fish.
c. The researchers can conclude that the fish are smaller than what is normal
because the difference between 12.3 inches and 11.2 inches is much larger than
the expected sampling error.

259
A study examined the length of a certain species of fish from one lake. The plan was to
take a random sample of 100 fish and examine the results. Numerical summaries on
lengths of the fish measured in this study are given.
Mean 26.8mm
Median 29.4mm
Standard Deviation 5.0 mm
Minimum 12.mm
Maximum 33.4mm
33. Which of the following histograms is most likely to be the one for these data?
a. Histogram a.
b. Histogram b.
c. Histogram c.
Items 34 and 35 refer to the following situation:
Four graphs are presented below. The graph at the top is a distribution for a population of test
scores. The mean score is 6.4 and the standard deviation is 4.1.
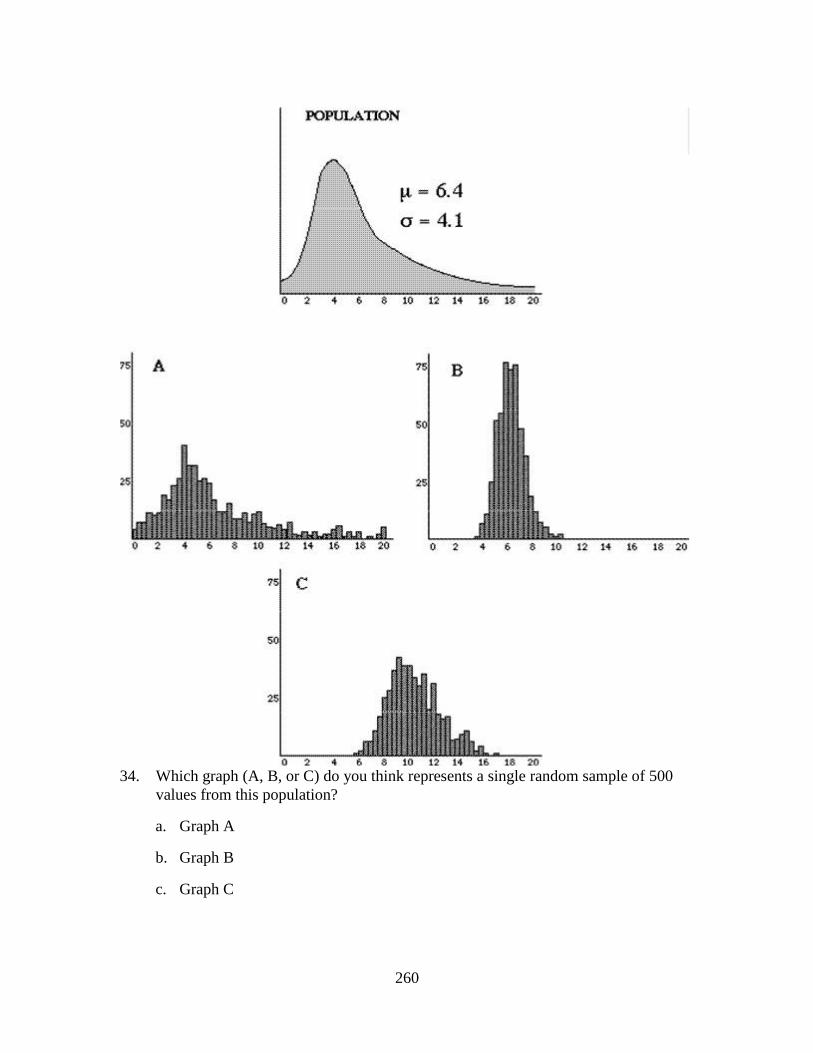
260
34. Which graph (A, B, or C) do you think represents a single random sample of 500
values from this population?
a. Graph A
b. Graph B
c. Graph C

261
35. Which graph (A, B, or C) do you think represents a distribution of 500 sample
means from random samples each of size 9?
a. Graph A
b. Graph B
c. Graph C
36. This table is based on records of accidents compiled by a State Highway Safety and
Motor Vehicles Office. The Office wants to decide if people are less likely to have
a fatal accident if they are wearing a seatbelt. Which of the following comparisons
is most appropriate for supporting this conclusion?
a. Compare the ratios 510/412,878 and 1,601/164,128
b. Compare the ratios 510/577,006 and 1,601/577,006
c. Compare the numbers 510 and 1,601

262
37. A student participates in a Coke versus Pepsi taste test. She correctly identifies
which soda is which four times out of six tries. She claims that this proves that she
can reliably tell the difference between the two soft drinks. You have studied
statistics and you want to determine the probability of anyone getting at least four
right out of six tries just by chance alone. Which of the following would provide an
accurate estimate of that probability?
a. Have the student repeat this experiment many times and calculate the percentage
time she correctly distinguishes between the brands.
b. Simulate this on the computer with a 50% chance of guessing the correct soft drink
on each try, and calculate the percent of times there are four or more correct guesses
out of six trials.
c. Repeat this experiment with a very large sample of people and calculate the
percentage of people who make four correct guesses out of six tries.
d. All of the methods listed above would provide an accurate estimate of the
probability.
38. A college official conducted a survey to estimate the proportion of students
currently living in dormitories about their preference for single rooms, double
rooms, or multiple (more than two people) rooms in the dormitories on campus.
Which of the following does NOT affect the college official's ability to generalize
the survey results to all dormitory students?
a. Five thousand students live in dormitories on campus. A random sample of only
500 were sent the survey.
b. The survey was sent to only first-year students.
c. Of the 500 students who were sent the survey, only 160 responded.
d. All of the above present a problem for generalizing the results.

263
39. The number of people living on American farms has declined steadily during the
last century. Data gathered on the U.S. farm population (millions of people) from
1910 to 2000 were used to generate the following regression equation: Predicted
Farm Population = 1167 - .59 (YEAR). Which method is best to use to predict the
number of people living on farms in 2050?
a. Substitute the value of 2050 for YEAR in the regression equation, and compute the
predicted farm population.
b. Plot the regression line on a scatterplot, locate 2050 on the horizontal axis, and read
off the corresponding value of population on the vertical axis.
c. Neither method is appropriate for making a prediction for the year 2050 based on
these data.
d. Both methods are appropriate for making a prediction for the year 2050 based on
these data.
40. The following situation models the logic of a hypothesis test. An electrician uses an
instrument to test whether or not an electrical circuit is defective. The instrument
sometimes fails to detect that a circuit is good and working. The null hypothesis is
that the circuit is good (not defective). The alternative hypothesis is that the circuit
is not good (defective). If the electrician rejects the null hypothesis, which of the
following statements is true?
a. The circuit is definitely not good and needs to be repaired.
b. The electrician decides that the circuit is defective, but it could be good.
c. The circuit is definitely good and does not need to be repaired.
d. The circuit is most likely good, but it could be defective.

264
Appendix C: Permission Forms

265

266

267