a comparison of the lending technologies between private
TRANSCRIPT
DPRIETI Discussion Paper Series 16-E-023
A Comparison of the Lending Technologiesbetween Private and Public Banks
UCHIDA HirofumiKobe University
The Research Institute of Economy, Trade and Industryhttp://www.rieti.go.jp/en/

RIETI Discussion Paper Series 16-E-023
March 2016
A Comparison of the Lending Technologies between Private and Public Banks†
UCHIDA Hirofumi
Graduate School of Business Administration, Kobe University
Abstract
Using very unique data on loan screening by a large public bank and private banks in Japan, this
paper empirically compares the lending technologies used for lending to small- and medium-sized
enterprises between the two types of banks. We find that the public bank uses financial statement
lending, but does not extensively use relationship lending or lending based on collateral or guarantee.
These findings are in sharp contrast with those for private banks that extensively use all three types
of lending technologies. We also find less frequent visits by loan officers at the public bank to, and
the bank’s greater geographic distance from, its borrowers, which may contribute to the public
bank’s less extensive screening. However, we also find uniqueness in the public bank’s loan
screening in the form of its greater emphasis on borrowers’ business plans and on-site visits to
borrowers’ establishments.
Keywords: Public banks, Private banks, Lending technology, Screening
JEL classification codes: H81, G21
RIETI Discussion Papers Series aims at widely disseminating research results in the form of professional
papers, thereby stimulating lively discussion. The views expressed in the papers are solely those of the
author(s), and neither represent those of the organization to which the author(s) belong(s) nor the Research
Institute of Economy, Trade and Industry.
† This study is a product of the Workshop on the Evaluation of Policy-based Financing at the Small and Medium Enterprise Unit of the Japan Finance Corporation (JFC-SME). It is also conducted as a part of the Project “Research on Efficient Corporate Financing and Inter-firm Networks” undertaken at the Research Institute of Economy, Trade and Industry (RIETI). An earlier version of this paper has been presented at the JFC-SME and the RIETI. The author acknowledges JFC-SME for various forms of research support including the conducting of the corporate survey used in this paper. An earlier version of this paper has been presented at the JFC-SME. The author is grateful for Ryoichi Aoki, Kaoru Hosono, Masayuki Morikawa, Masato Motonishi, Atsushi Nakajima, Jungo Ohkawa, Arito Ono, Peng Xu, Iichiro Uesugi, Wako Watanabe, Nobuyoshi Yamori, and the participants to the JFC-SME and RIETI workshops for their comments, for Hidenori Takahashi for his research assistance, and for the Grant-in-Aid for Scientific Research (S, #25220502) from the Japan Society for the Promotion of Science for financial support.

1
1. Introduction
Public ownership of banks is large and pervasive around the world (La Porta et al. 2002).
Publically owned banks, or public banks in short, have long been a subject of controversy. For
example, the “development” view for public banks argues that in countries with poor private
financial institutions, public banks can contribute to their economic growth. However, the
“political” view argues that governments may acquire banks as a means for politicians to
provide benefits to their supporters (La Porta et al. 2002). On the other hand, public banks can
play an important role in providing funds in economic downturns where private banks shrink
their loan supply. However, private banks often criticize public banks as strong competitors
with favorable treatment from the government in the form of subsidies and tax treatments, for
example.
Although these views have conflicting implications for the role of public banks, they are
common in the sense that they all implicitly assume that loans from public and private
financial institutions are close substitutes to each other. This is indeed a reasonable
assumption because from a borrowers’ viewpoint, funds are funds irrespective of who provide
them. However, the studies on lending technologies suggest that even among private banks,
different banks may have different lending processes and make decisions differently (e.g.,
Berger and Udell 2002, 2006), and there are some empirical support for this prediction.1 Thus,
we can well expect that there are similar, or more extensive, differences in lending technologies
used by public and private banks, which may make the two types of lenders imperfect
substitutes. However, to the best of the author’s knowledge, there have been no study on the
lending technologies for public banks, much less on the comparison of lending technologies
used by public and private banks.2
The aim of this paper is to empirically investigate this difference in the lending technologies
used by public and private banks. We use very unique data from a corporate survey conducted
1 The approach to lending technologies categorizes loans based on a combination of information to use, screening and decision procedures, loan contract structure, and monitoring of debt (Berger and Udell 2006). See Section 2 for the literature review including empirical studies on lending technologies used by private banks. 2 There is only one study that makes a small reference on the predicted use of lending technologies by public banks (Berger and Udell 2006). It argues that because of their similar (large) size, public banks use a lending technology that is similar to what large private banks use.

2
in Japan. The target of the survey are small- and medium-sized enterprises (SME) that are
potential borrowers of one of the most important public banks in Japan, the Small and
Medium Enterprise Unit of the Japan Finance Corporation (hereafter JFC-SME), which
provides long-term loans to SMEs for policy objectives.3 In the survey, responding firms
(SMEs) answer questions on the extent to which their lenders – the JFC-SME and private
banks – focus on (or emphasize) different firm characteristics when they underwrite their loans.
We mainly use this information to identify the lending technologies used by these banks.
Our analysis consists of two stages.4 At the first stage, we focus on each of the different firm
characteristics that the public and private banks emphasize. We start by describing the actual
emphasis by the public bank and private banks, and then make a comparison between them.
To control for differences in firm characteristics between borrowers of the JFC-SME and those
of private banks, the comparison is made within firms by limiting the sample to those
borrowing from both the public and private banks. At the second stage of our analysis, we more
elaborately identify lending technologies used by the two types of banks by focusing on
simultaneous emphasis on similar (multiple) firm characteristics as the theory on lending
technology predicts. In this vein, we conduct factor analysis on the characteristics that lenders
emphasize. Using the measures of lending technologies identified by the factor analysis, we
also run multivariate regressions to examine what determines the use of the lending
technologies.
The findings of this study can be summarized as follows. First, from the first stage of our
analysis, we find that the public bank (JFC-SME) puts more emphasis on borrowers’ business
plans, profitability (e.g., profit to sales ratio), soundness (e.g., capital ratio), and the voluntary
disclosure of financial statements. This finding suggests that the public bank uses financial
statement lending that is based primarily on information from financial statements. We also
find that the public bank puts some emphasis on soft (qualitative and non-quantifiable)
information or on collateral, which is consistent with the use of relationship lending or
fixed-asset lending.
3 See Section 3 for institutional details of JFC-SME. 4 In some analysis, we use the same methodology as that in existing studies (Uchida et al. 2008, Uchida 2011, and Bartoli et al. 2013), but they all focus on private banks, and we also add new analysis to compare lending technologies between the public and private banks.

3
Second, the first stage analysis on private banks reveals that they put much emphasis on
profitability and soundness, suggesting that they also use financial statement lending. However,
we also find that private banks’ emphasize other characteristics that the JFC-SME does not
focus: borrowers’ business basis (e.g., customers and products); capabilities or talent of the
CEOs; collateral; and firms’ wealth (including CEO’s); their main-bank status; and trust
between the firm and the bank’s loan officer. These findings suggest that private banks also use
relationship lending and lending based on collateral or guarantee.
Third, from the within-firm comparison between public and private banks, we find that
private banks put greater emphasis on a larger number of firm characteristics than the public
bank does. Consistent with this finding, we also find that loan officers at the public bank make
less frequent contact with, and the bank has a longer distance from, as compared with private
banks, which is probably because the JFC-SME has a significantly smaller number of branch
offices than private banks does. However, we instead find that the public bank puts greater
emphasis on business plans and on-site inspection of borrowers’ establishments than their
private counterparts do. These results imply that due to the resource constraint that stems
from a small number of branches, the public bank deeply focus on a limited number of
screening factors that are most relevant to the type of loans they provide, i.e., long-term loans
for SMEs.
Fourth, from the analysis at the second stage, we identify three lending technologies –
financial statement lending, relationship lending, and lending based on collateral and
guarantee – for both the public and the private banks, in the sense that they simultaneously
emphasize multiple firm characteristics that are relevant to the respective technologies.
However when we also take into account the results from the first stage for the JFC-SME, the
characteristics that are related to the latter two lending technologies are not emphasized by the
public bank, and so we can conclude that the JFC-SME does not extensively use relationship
lending or lending based on collateral and guarantee.
Fifth and finally, the regression results from the second stage of our analysis reveal that
private banks do not differently use the three lending technologies depending on firm
characteristics, suggesting that these technologies are ubiquitously used. However, we find that
depending on specific firm characteristics, the JFC-SME uses the lending technologies that it

4
does not commonly use, e.g., relationship lending for firms with older CEO, and lending based
on collateral and guarantee for smaller firms.
The main contribution of this paper is to examine, for the first time, lending technologies
used by a public bank, and to compare them with those used by private banks. Our findings
suggest that the loan screening by the public bank is indeed distinctive, and so the public and
private banks may make different loan-granting decisions for the same firm. In this sense, the
two types of banks may not be perfect substitutes, and the public bank may not be an almighty
competitor for private banks.
This paper also suggests that the loan screening by this public bank reflects the type of loans
that this bank provides as an institution for a policy operation, i.e., long-term loans to SMEs.
Note that there are many types of “public” banks around the world, e.g., from the banks that
are mostly similar to private banks except for public ownership, to the ones with full
commitment to policy objectives like financing for economic development or SME lending. Our
findings suggest that loan screening and loan granting decisions are likely to differ depending
on the type of the public bank, so our findings call for further analysis on different types of
“public” banks other than those focusing on SME lending like the JFC-SME.
This paper is organized as follows. Section 2 reviews the literature on lending technology.
Section 3 explains the institutional background behind the JFC-SME and public banks in
Japan. Section 4 describes the data and Section 5 analyzes the importance of screening policies
by examining individual firm characteristics that the public and private banks focus on. Section
6 performs factor analysis to better identify lending technologies, and regression analysis to
examine determinants of the lending technologies. Section 7 concludes the paper.
2. Lending technology
The theoretical framework of lending technology, first proposed by Berger and Udell (2002),
is to categorize a variety of loans from financial institutions to firms based on differences in
several dimensions of the loan characteristics, e.g., information used in loan screening, and the
use/non-use of collateral or guarantee. Lending technologies are categorized into two broad
types: transactions(-based) lending and relationship lending (Berger and Udell 2002, 2006).
Transactions lending is a lending that is based primarily on quantitative information or
5
information on financial figures called hard information that can easily be verified to third
parties. Figures on financial statements and the value of the firms’ assets or CEO’s personal
wealth are typical examples of hard information.
Transactions lending are further categorized into several lending technologies. First,
financial statement lending is lending that relies on figures on firms’ financial statements.
Second, fixed assets lending is lending based on fixed-assets (immovable assets, real estates) as
collateral. Third, asset-based lending (ABL) is lending based on the collateral value of movable
assets such as accounts receivable or inventories. Fourth, credit scoring is lending primarily
based on a score automatically calculated from a model based on information on the firm or its
CEO. Other types of transaction lending include factoring where a lender called factor
purchases accounts receivable of a borrower, and leasing where a lender known as a lessor
purchases fixed assets and lends physical assets rather than money to the borrower.
The other broad type of lending technology is relationship lending, lending based primarily
on soft information, i.e., qualitative information which is difficult to measure. Soft information
is difficult to observe and to transmit to others. Examples of soft information include CEO’s
skills or integrity, and future prospect of the firms’ market.
Does this framework of lending technology have empirical relevance? There have been many
empirical studies that have tried to answer this question using data for private banks. One
strand of the literature focuses on specific lending technologies and examine when they are
used (e.g., Jiménez et al. 2009 for fixed-asset lending and Garcia-Appendini 2011 for
relationship lending). Some strand of the literature examine whether multiple lending
technologies are actually used by using survey information on banks’ examination policy, loan
contract terms, or borrower characteristics (de la Torre et al. 2010 and Berger and Black 2011).
These studies are also interested in whether relationship lending is the only technology for
SME lending.
The other strand of the literature, which is most closely related to the present paper, uses
information from corporate surveys that directly ask firm characteristics that banks focus in
lending to the responding firms (Uchida et al. 2008, Uchida 2011, and Bartoli et al. 2013).
Uchida et al. (2008) and Bartoli et al. (2013) focus on complementarities or substitutability of

6
different lending technologies. 5 Uchida (2011) descriptively examines individual firm
characteristics and also conduct factor analysis to identify lending technologies.
However, these studies focus on lending technologies used by private banks. To the best of
the author’s knowledge, there has been no study on lending technologies used by public banks.
The main contribution of the present paper is to examine, for the first time, lending
technologies used by a public bank by using data on the JFC-SME, a large public bank in Japan.
Methodologically, the approach in this paper is similar to that in Uchida (2011), but this paper
applies the approach for both the public and private banks. Furthermore, this paper also
compares lending technologies of public and private banks by comparing the results within
firms that borrow from both the public and private banks.
3. Institutional background6
3.1 Japan Finance Corporation (JFC)
The Japan Finance Corporation (JFC) is a public corporation wholly owned by the Japanese
government. As one of the government-affiliated financial institutions in Japan, the JFC “aims
to complement financial activities carried out by private financial institutions and contributes
to the improvement in the living standards of Japanese people” (cited from the JFC homepage).
Although there are many “public banks” around the world, and many of them are similar to
private banks except for public ownership, the JFC fully commits to providing loans for policy
purposes, and do not take deposits.
The JFC was established in 2008 after the merger of the four government-affiliated financial
institutions: the Agriculture Forestry and Fisheries Finance Corporation (AFFFC), which
provided loans to firms in agriculture, fishery, and food industries; the National Life Finance
Corporation (NLFC), which provided loans to micro businesses; the Japan Finance
Corporation for Small and Medium Enterprises (JASME), which provided long-term loans to
SMEs for policy purposes; and the Japan Bank for International Cooperation (JBIC), which
provided support for the government’s foreign economic policy initiatives and economic
5 Bartoli et al. (2013) also examine the relation between the use of transaction/relation lending and the banks’ production of soft information 6 See, for example, Uchida and Udell (2014, Sec. 36.2.2.8) for more detailed account for public banks in Japan.

7
cooperation programs.7 Even after the merger, the businesses and the accounting of the
predecessor banks are separated inside the JFC. The JFC currently has three units: The
Agriculture, Forestry, Fisheries and Food Business Unit (JFC-AFFFB) that succeeded the
AFFFC; the Micro Business and Individual Unit (JFC-MBI) that succeeded the NLFC; and the
Small and Medium Enterprise Unit (JFC-SME) that succeeded the JASME.
The JFC does not compete with private banks in deposit markets, because it does not accept
deposits. The funds that the JFC (and the JFC-SME) uses for its loans are raised mostly
through the Fiscal Investment Loan Program (FILP), the program by the government to
provide long-term low interest loans and investments to achieve policy objectives. More
specifically, the JFC relies on the funds that the government raises by issuing special
government bonds (FILP bonds) for the purpose of raising funds for the FILP program.
3.2 Small and Medium Enterprise Unit of JFC (JFC-SME)
The JFC-SME, which we focus in this paper, provides long-term loans to SMEs as a public
bank and so it competes with private banks in the long-term SME loan market in Japan. The
loans by the JFC-SME are program-based, and borrowers apply for different loan programs
that the JFC-SME offers. The programs are designed to provide funds to SMEs for different
policy-purposes. Safety-net Loans, Loans for Enhancing Corporate Vitality, and New Business
Development Loans are examples of the JFC-SME’s loan programs.
The terms of the program loans are predetermined, but vary depending on internal rating
that the JFC-SME assigns to borrowers. The JFC-SME screens loan applications to determine
whether or not to grant loans, and what internal rating to assign.8
The JFC-SME has 63 branches (as of January 2016) in their nationwide operations. However,
this number is significantly smaller than those for private banks. For example, if we calculate
the total number of private banks’ branches by bank types as of March 2015 (from the Japan
Bankers’ Association’s homepage), 5 city banks that operate nationwide have 2,037 branches,
64 regional banks that operate mainly around one of the 47 prefectures in Japan have 6,781
7 Later in 2012, the JBIC was made an independent institution again. 8 Note that an ex-banker at the JFC-SME tells that they do not change the intensity of their loan screening depending on the extent to which other lenders (especially private banks) actively involve in lending relationships with the borrower, or on the borrower’s industry.
8
branches, and 41 second regional banks that operate mostly within one prefecture have 2,895
branches.9
There are also other public banks in Japan that provide business loans. The first is the
JFC-MBI, another JFC unit, but there is segregation between the JFC-MBI and the JFC-SME
depending on firm size: the former targets micro businesses and the latter targets larger SMEs.
Second, Shoko Chukin Bank (SCB) also provides loans to SMEs. The targets of the SCB and the
JFC-MBI or the JFC-SME overlap, but the SCB is more privatized than JFC-SME. The SCB
raises most of its funds through deposits and its own bonds, provides short- as well as
long-term loans, and does not provide loans on the program basis. Thus, the bank is more
similar to private banks than the JFC-SME does. Finally, the Development Bank of Japan
(DBJ) also provide business loans, but the main target of the bank is large companies, and the
DBJ also focus on a provision of sophisticated financial products, e.g., structured finance and
derivatives.
4. Data
4.1 Data source and original sample
The source of the data used in this paper is the Survey on SME’s Attitude toward Banks,
which was conducted from February to March 2013. The survey was designed by a group of
researchers to obtain information on lending relationship between firms and their banks (both
public as well as private) and on firms’ behavior after the so-called Lehman shock in Japan in
September 2008.10 The survey was outsourced to the Tokyo Shoko Research, Ltd. (hereafter
TSR), one of the two largest credit reporting agencies in Japan.
The targets of the survey are 15,000 SMEs in Japan that are chosen to include borrowers of
9 City banks are the largest banks in Japan with nationwide and overseas operations. Trust banks can provide trust services in addition to banking services and also operate nationwide, but have a small number of branches. Regional banks are mid-sized regional financial institutions that typically operate in areas around one of the 47 prefectures in Japan. Second-regional banks also operate regionally but in areas smaller than regional banks’. Shinkin banks and credit cooperatives are not-for-profit cooperative banks that operate inside a prefecture. Shinkin banks are larger than credit cooperatives. See Uchida and Udell (2014, section 36.2.2) for types of banks in Japan. 10 The failure of Lehman Brothers was the landmark event for the Japanese Economy and called the “Lehman shock,” because the worldwide financial crisis triggered by the turmoil in the U.S. subprime residential mortgage market spread in the Japanese economy after the Lehman’s failure (see Uchida and Udell 2014, Section 36.3.3.4).

9
public banks, with borrowers of the JFC-SME as the main targets, and to also include
borrowers of private banks with comparable characteristics. As for borrowers of the public
banks, we selected from the JFC-SME’s database firms that meet the following three criteria:
(1) firms that are recorded as borrowers of the JFC-SME at the end of September 2012, that did
not go into bankruptcy afterwards, and that had more than 20 employees11; (2) firms that are
not associated companies of larger companies (the criterion to focus on non-affiliated firms);
and (3) firms on which accounting information is available from 2007 to 2011 (the criterion for
different analysis using financial information, which is irrelevant to the present study where no
accounting information is used). There are 17,910 firms in the JFC-SME’s database that meet
these criteria, and from these firms, we randomly choose 7,500 firms (one-half of the whole
targets) on a pro-rata basis in terms of industry and region.
The remaining half of the sample firms (another 7,500 firms) are chosen from the TSR
database as control firms that do not borrow from the JFC-SME. More specifically, we select
firms that belong to the industries that are targets of the JFC-SME’s loan programs and that
meet the above three criteria for the treatment firms. However, we relax criterion (3) and allow
for missing accounting information for one year, because not doing so reduces the number of
candidate control firms smaller than 7,500. From 61,085 firms that meet these criteria, we
randomly pick 7,500 firms on a pro-rata basis in terms of industry and region.
After distributing the survey questionnaire by hard mail to the 15,000 target firms, we
receive responses from 4,635 firms. Among these firms, 2,289 are from the 7,500 treatment
firms (potential borrowers of the JFC-SME) and 2,346 are from the 7,500 control firms. After
eliminating responses that do not contain meaningful answers, 4,379 firms remain (the
effective response rate is 29.2%), which makes our original sample.
The questionnaire of the Survey on SME’s Attitude toward Banks (in Japanese) is composed
of five parts: “1. Your company”; “2. Transactions with financial institutions”; “3. Business
conditions pre- and post-Lehman shock in September 2008”; “4. Transactions with financial
institutions pre- and post-Lehman shock”; and “5. Others.” The questions on lending
11 The final criterion on the number of employees was chosen because more than 80% of the JFC-SME’s customers have 20 or more employees (based on information from the JFC-SME’s internal database).

10
technologies are in the fifth part, and we mainly use this information for our analysis. We also
use information on firms’ transactions with private and with public banks, which is obtained
from the questions in the second part, and on firm characteristics, which is obtained from the
questions in the first part.
4.2 Sample selection for borrowers of the JFC-SME
The survey first asks the responding firm the amounts of borrowing from the four public
banks: the three units of the JFC (JFC-AFFFB, JFC-MBI, and JFC-SME) and from Shoko
Chukin Bank (SCB). Because the SCB provides not only long-term but also short-term loans,
the survey separately asks the amount of short-term and long-term loans for the SCB. The
survey subsequently asks questions on details of the firm’ transactions with the public bank
that lends the most to them (among the above four banks or among the three (excluding the
SCB), depending on the questions).
Among the 4,379 effective responses, 2,716 firms have a positive amount of loans from at
least one public bank (33 firms from the JFC-AFFFB, 418 firms from the JFC-MBI, 2,020 firms
from the JFC-SME, and 1,495 and 636 firms from the SCB for long- and short-term loans,
respectively). The largest public lender is, the JFC-AFFB for 4 firms, the JFC-MBI for 48 firms,
the JFC-SME for 726 firms, the SCB (long-term loans) for 280 firms, and the SCB (short-term
loans) for 72 firms. If we exclude the SCB, the largest public lender is the JFC-AFFB for 8 firms,
the JFC-MBI for 63 firms, and the JFC-SME for 1,088 firms. We thus use the sample of 726
firms, with respect to the questions on the largest public bank among the four, or 1,088 firms,
with respect to those among the three, for the analysis on the JFC-SME.12 However, due to
missing answers on each question, the number of observation is smaller depending on the
analysis.
4.3 Sample selection for borrowers of private banks
As for the analysis on private banks, we first choose, from the sample firms, those respond to
12 It is technically possible to conduct similar analysis for the other three public banks, i.e., the JFC-AFFFB, the JFC-MBI, and the SCB. However, the number of observations for the two other units of the JFC is too small. The analysis on the SCB is impossible, because we cannot identify whether responding firms answer subsequent questions with respect to its short- or long-term loans.

11
any of the questions on their private lending banks. More specifically, the survey first asks
attributes (including identity) of the firm’s “main bank” that is identified by the firm itself as
the private bank with the closest relationships in terms of deposits, loans, etc., and then asks
questions on detailed transactions with the main bank. We selected firms that respond to these
questions.
However, we find that some firms answer as “the main bank” a financial institution that is
not apparently a private bank. We thus eliminate firms that answer, as the type of their main
banks, “others” or “with no main bank” instead of “city or trust banks,” “regional or
second-regional banks,” “Shinkin banks,” or “credit cooperatives.” We also eliminate firms that
answer as the name of their main banks names of public banks, agricultural cooperatives,
non-bank lenders, non-financial institutions, or multiple names. As a result, among 4,277 firms
that answer the type or the name of the main banks, 244 firms are eliminated. The remaining
4,033 firms constitute our sample for the analysis on private banks, although the number of the
observations may be smaller depending on the availability of the variables to use. Below, we
sometimes present results by bank types, but we do not present ones for credit cooperatives
because of the small sample.
5. Analysis of screening items
5.1 Methodology
5.1.1 Screening criteria and lending technology
To identify lending technologies, we use information in the survey on loan screening by the
largest public bank and by the private main bank. The survey asks responding firms to grade
the extent to which the relevant bank emphasize (or focus on) specific borrower characteristics
when underwriting their loans. There are 18 candidate criteria (borrower characteristics) as
shown in Table 1, and for each criterion, the responding firms grade their main banks on a 1-5
scale (categorical).
The 18 criteria capture different dimensions of borrowers that the relevant bank may
evaluate in their screening process. We categorize these criteria based on theoretical prediction
on lending technologies. First, criteria 2 (size), 6 (profitability), and 7 (soundness) represent
quantitative information from financial statements (hard information). A finding of emphasis

12
on these criteria means that financial statement lending is an important lending technology.
Second, criteria 8 (collateral), 9 (guarantee), 10 (public guarantee) and 12 (wealth) represent
the emphasis on collateral/guarantee. A finding of emphasis on criterion 8 alone indicate the
importance of fixed-asset lending, and a finding of emphasis on these criteria as a whole means
that lending based on collateral and guarantee is important. Finally, criteria 11 (CEO’s
capabilities and talent), 13 (main bank status), 14 (relationship length) and 16 (trust with loan
officers) capture creditworthiness information that is difficult to quantify, or the strength of the
SME-Bank relationship. Thus, these criteria are related to relationship lending.
To measure the emphasis on these criteria, we generate for each criterion a categorical
variable that takes the value of 5 if the firm responds that the importance of the criterion is
“very much,” 4 if “important,” 3 if “neither important nor unimportant,” 2 if “rarely important,”
and 1 if “never important.” We label the relevant variables for the JFC-SME char_pb1 to
char_pb18, and those for private banks char_bk1 to char_bk18. We examine these variables
individually in this section, while we apply factor analysis on these variables in the next section
to examine simultaneous emphasis on multiple criteria.
Note that these responses are based on the subjective evaluation from the borrowers’
viewpoint, and so may not adequately capture emphasis that lenders actually make. However,
it is very difficult to obtain confidential information on loan screening from banks. Thus, being
able to use information on loan screening at firm levels sufficiently compensate this
shortcoming as far as we interpret the results carefully. Also, in the analysis on the comparison
of the lending technologies between the public and private banks, we will control for firm fixed
effects by comparing them within firms.
5.1.2 The strength of relationships
Although we mainly focus on the variables above when examining lending technologies, we
also use other pieces of information when we identify relationship lending. First, we take into
account the distance between the branch of the public or private banks and the borrower. The
survey directly asks the distance, where the responding firms choose from the six options: “a.
500 m or less,” “b. 1 km or less” (and more than 500m), “c. 10 km or less” (and more than 1
km), “d. 30 km or less” (and more than 10 km), “e. 50 km or less” (and more than 30 km), and

13
“f. more than 50 km.” We create variables JFCdist (for the JFC-SME) and maindist (for the
private main bank) that takes the median value of the interval of the chosen option.13 Theory
predicts that when banks use relationship lending, more soft information is accumulated as the
geographic distance becomes smaller (see e.g., Petersen and Rajan 2002); thus, we expect that
the smaller values for these variables are associated with more focus on relationship lending.
Second, we measure the frequency of visits of the bank’s loan officer to the borrower, based
on firms’ answer to the relevant question. The option to choose are: (1) every day; (2) once a
week; (3) once a month; (4) once in half a year; (5) once a year; (6) no meeting in the previous
one year. The variable JFCfreq (for the JFC-SME) and mainfreq (for the private main bank)
indicate the frequency of visits per year, taking the value of 365 if the answer is (1), 52 if (2), 12
if (3), 2 if (4), 1 if (5), and 0 if (6). Theory of relationship lending predicts that a lender can
obtain a larger amount of soft information as the lender visits the borrower more frequently
(see e.g., Boot 2000 for theory and Berger et al. 2005 for an empirical analysis). We thus expect
that this variable is large when relationship lending is used.
Third, we consider the actual length of lending relationships between the SME and the bank,
although the relevant information is available for the private main bank only. As a question on
an attribute of the private main banks, the survey directly asks the length (years) of the
relationships with the bank. Based on the answer, we generate the variable mainlength. Theory
of relationship lending also predicts that banks can accumulate more soft information as the
relationship becomes longer (see e.g., Boot 2000 for theory and Berger et al. 2005 for an
empirical analysis). Thus, the larger value of this variable is consistent with the use of
relationship lending.
5.2 Univariate results
5.2.1 Result for the JFC-SME
Table 2 presents the summary statistics for the variables char_pb1 to char_pb18 that
measure the emphasis on the 18 criteria by the JFC-SME. The boldface figures in the table
mean that the mean (average) of the relevant variable exceeds the value of 3.5 that is between
13 More specifically, these variables take the value of 0.25, 0.75, 5, 20, 40, or 100 (km), if the firm chooses options 1, 2, 3, 4, 5, or 6 respectively.

14
“important” and “neither important nor unimportant.” This is to indicate that the variable is
emphasized, although the cutoff value of 3.5 is set arbitrarily.
The results show that the means of many variables take the value larger than 3. In particular,
the means for criteria 4 (business plan), 6 (profitability), and 7 (soundness) are larger than 4
(meaning “important”), the mean for criterion 15 (active disclosure) is close to 4, and the mean
for criteria 3 (business basis), 8 (collateral), and 11 (CEO’s capabilities/talent) exceed 3.5. The
finding for criteria 6, 7, and 15 indicate emphasis on financial statement lending, the findings
for criteria 3 and 11 implies that relationship lending is important, and the finding for criterion
8 indicates that fixed-asset lending is also important.
However, the findings that the means are smaller than 3 for criteria 10 (public credit
guarantee), 13 (main bank status), and 18 (tax accountant/CPA) suggest that the JFC-SME
does not put much emphasis on these criteria in its loan screening. Note that the finding for
criterion 10 is consistent with the fact that loans from the JFC-SME cannot obtain public credit
guarantee. Also, the finding for criterion 13 suggests that the main bank status is not important
for public banks.
Table 2 also shows the summary statistics for the two variables for relationship lending. The
average distance between a branch of the JFC-SME and its borrower is 33km, and the average
frequency of visit of JFC-SME’s loan officer is five per year (once in 2.4 months).
5.2.2 Results for private banks
Table 3 presents the results for private banks. Panel A reports the results for the whole
sample (private banks as a whole), Panel B for the case where the main banks are city or trust
banks, Panel C for regional/second-regional banks 2, and Panel D for Shinkin Banks. Similar to
Table 2, boldface figures indicate the means larger than the value of 3.5.
As for the variables from char_bk1 to char_bk18, the four panels show similar findings. The
criterion that is emphasized the most is 6 (profitability), which is followed by criterion 7
(soundness), both of which have the means larger than 4. These findings indicate that private
banks put much emphasis on financial ratios. The criteria that follow are criterion 3 (business
basis) and 15 (active disclosure), which are then followed by 4 (business plans) and 11
(capabilities/talent of CEO), 2 (firm size), 8 (collateral), 12 (wealth), 13 (main bank status), 16

15
(trust with loan officers), and 17 (attitude of other banks). Compared with the findings for the
JFC-SME (Table 2), we find that private banks emphasize criteria that the JFC-SME does not,
e.g., criteria 2, 12, 13, 16, and 17.
Turning to the criteria that are not emphasized by private banks, we find that criterion 18
(tax accountant/CPA) has a mean smaller than 3. When compared with the JFC-SME, there
are three criteria with means smaller than 3 in Table 2, so private banks emphasize a larger
number of screening criteria than the JFC-SME.
When we focus on the results for the final three variables for relationship lending, we find
that the average length of bank-firm relationships (mainlength) is 36 years for the whole banks,
34 years for city/trust banks, 38 years for regional/second-regional banks, and 34 years for
Shinkin banks. Although there are some differences by bank types, the length is on balance
long. The firm-bank distance (maindist) is on average 7.1 km for the whole sample, but is
shorter for smaller bank types, e.g., 5.2 km for Shinkin banks. Similarly, the frequency of visits
(mainfreq) is 49 times a year for the whole sample, and is higher for smaller bank types, e.g.,
90 times a year for Shinkin banks. Compared with the JFC-SME, private banks have branches
that are located far closer to their borrowers, and visit the borrowers very frequently. These
findings are consistent with the fact that the JFC-SME has a significantly smaller number of
branches than private banks.
5.3 Comparison between the JFC-SME and private banks
The analysis in the previous subsection examined screening by the JFC-SME and by private
banks independently. Although we find some intriguing differences in the results, we should
take into account the fact that the sample firms for Tables 2 and 3 are different, and so the
differences may simply be an artifact of different sample characteristics.
To make a more adequate comparison, this subsection focuses on firms that answer
questions for both the JFC-SME and private banks. For those firms, we can examine the
differences in the variables for the 18 screening criteria. More specifically, we generate 18 new
variables, char_dif1 to char_ dif18, that are defined as “char_pb1 - char_bk1” to “char_pb18 -
char_bk18” respectively. We also compute the difference in the bank-borrower distance,
dist_dif, and in meeting frequency, freq_dif, in a similar manner.

16
Table 4 presents the summary statistics for these difference variables. This table shows the
differences between the JFC-SME and the private main banks as a whole in Panel (A), and
between the JFC-SME and each type of private main banks in Panels (B)‒(D). In each panel,
we also report the results (p-value) for the test of differences in means. The p-values with
asterisks ***, **, and * respectively indicate that the null hypothesis of the difference being zero
is rejected at 1%, 5%, and 10% level of the statistical significance.
As for the whole sample (Panel A), we find that the emphasis on screening criteria differs
significantly between the JFC-SME and private banks for all but three criteria (1, 8, and 15) at
the 1% level of significance. Most of the differences are negative, meaning that private banks
put more emphasis on these criteria. Also, consistent with the finding in subsection 5.2, we find
that the branch-firm distance is larger and the frequency of visit is lower for the JFC-SME than
for private banks. These findings suggest that loan officers at the JFC-SME cannot directly visit
borrowers frequently because they are located afar, which results in smaller emphasis on many
screening criteria.
However, we also find intriguing results with respect to criteria 4 (business plan) and 5
(on-site inspection). The JFC-SME puts more emphasis on these criteria than private banks do,
although these criteria area also important for private banks. Especially, the finding of greater
emphasis on on-site examination by the JFC-SME than by private banks is interesting because
it is private banks that are located closer to, and have more frequent contact with, borrowers.
The finding suggests that, due to the constraint that stems from a small number of branches,
the JFC-SME puts its resources to extensively screen a limited number of screening factors that
are most relevant to the types of loans they provide, i.e., long-term loans for SMEs.14 The
finding also implies that private banks may visit borrowers for purposes other than loan
screening, e.g., for collecting deposits or for selling financial products such as mutual funds or
insurance.
As for analysis by bank types (Panels (B) ‒ (D)), the results are qualitatively similar to those
for the whole sample, but there are also some differences. First, the results for city/trust banks
14 Consistent with this view, an ex-loan officer at the JFC-SME tells that the public bank attaches particular importance on on-site inspection, and takes care for its bankers to make decisions based on their own direct inspections.

17
(Panel (B)) show that the statistical significances of the differences in emphasis with the
JFC-SME is smaller with respect to criteria 5, 14, and 16. We also find no significant difference
for criterion 18. Second, as for regional/second-regional banks (Panel (C)), different from the
results in Panel (A), we find significant differences even for criteria 1 and 15. These findings
imply that regional/second-regional banks emphasize a larger number of screening criteria,
and in this sense the JFC-SME is more similar to large banks (city or trust banks), which is
consistent with the prediction in Berger and Udell (2006). However, even compared with
regional/second-regional banks, the JFC-SME puts more emphasis on criteria 4 and 5. Third,
compared with Shinkin banks (Panel (D)), we find a smaller number of significant differences.
This finding implies that Shinkin banks do not focus on many screening criteria. However,
because typical borrowers of the JFC-SME are larger than those of Shinkin banks, the finding
may be an artifact of Shinkin banks’ exerting less effort in costly screening for creditworthy
borrowers. We should also take into account the smaller number of observations for Panel (D).
6. Factor analysis
6.1 Identification of lending technologies
6.1.1 Methodology
In the previous section, we individually focus on each of the screening criteria. However, the
original idea of lending technology focuses on combined or simultaneous emphasis on
screening criteria of similar kinds rather than on individual criterion. For example, in
relationship lending, lenders take advantage of long-term relationships (criterion 14) to
accumulate soft information such as CEO’s capabilities or talent (criteria 11) through their loan
officers’ trustable relationship with the borrowers (criterion 16). Thus, the use of relationship
lending should result in simultaneous emphasis on these criteria.
A statistical approach that is suitable in this vein is factor analysis. Factor analysis assumes
that for observations of multiple variables, there are a small number of unobservable (latent)
variables called common factor that produces the variations in the observed variables. Under
this assumption, factor analysis derives the common factors using data of the observed
18
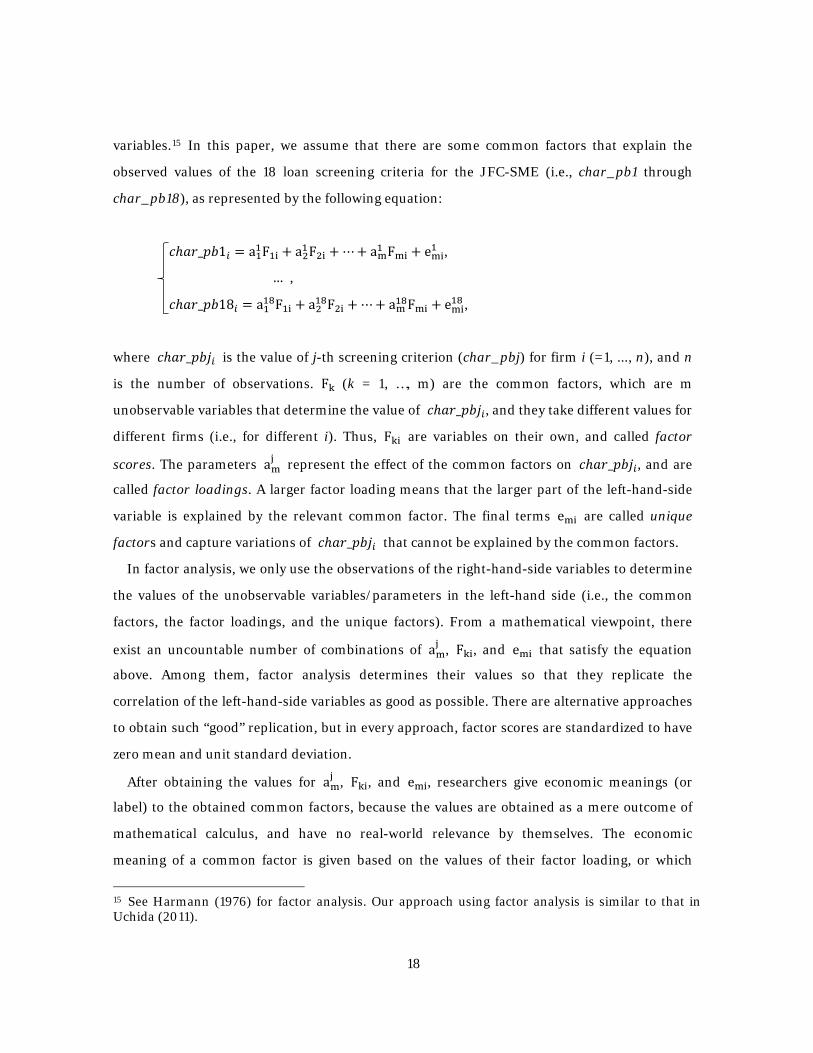
variables.15 In this paper, we assume that there are some common factors that explain the
observed values of the 18 loan screening criteria for the JFC-SME (i.e., char_pb1 through
char_pb18), as represented by the following equation:
𝑐𝑐ℎ𝑎𝑎𝑎𝑎_𝑝𝑝𝑝𝑝1𝑖𝑖 = a11F1i + a21F2i + ⋯+ am1 Fmi + emi1 ,
… ,
𝑐𝑐ℎ𝑎𝑎𝑎𝑎_𝑝𝑝𝑝𝑝18𝑖𝑖 = a118F1i + a218F2i + ⋯+ am18Fmi + emi18 ,
where 𝑐𝑐ℎ𝑎𝑎𝑎𝑎_𝑝𝑝𝑝𝑝𝑝𝑝𝑖𝑖 is the value of j-th screening criterion (char_pbj) for firm i (=1, ..., n), and n
is the number of observations. Fk (k = 1, …, m) are the common factors, which are m
unobservable variables that determine the value of 𝑐𝑐ℎ𝑎𝑎𝑎𝑎_𝑝𝑝𝑝𝑝𝑝𝑝𝑖𝑖, and they take different values for
different firms (i.e., for different i). Thus, Fki are variables on their own, and called factor
scores. The parameters amj represent the effect of the common factors on 𝑐𝑐ℎ𝑎𝑎𝑎𝑎_𝑝𝑝𝑝𝑝𝑝𝑝𝑖𝑖, and are
called factor loadings. A larger factor loading means that the larger part of the left-hand-side
variable is explained by the relevant common factor. The final terms emi are called unique
factors and capture variations of 𝑐𝑐ℎ𝑎𝑎𝑎𝑎_𝑝𝑝𝑝𝑝𝑝𝑝𝑖𝑖 that cannot be explained by the common factors.
In factor analysis, we only use the observations of the right-hand-side variables to determine
the values of the unobservable variables/parameters in the left-hand side (i.e., the common
factors, the factor loadings, and the unique factors). From a mathematical viewpoint, there
exist an uncountable number of combinations of amj , Fki, and emi that satisfy the equation
above. Among them, factor analysis determines their values so that they replicate the
correlation of the left-hand-side variables as good as possible. There are alternative approaches
to obtain such “good” replication, but in every approach, factor scores are standardized to have
zero mean and unit standard deviation.
After obtaining the values for amj , Fki, and emi, researchers give economic meanings (or
label) to the obtained common factors, because the values are obtained as a mere outcome of
mathematical calculus, and have no real-world relevance by themselves. The economic
meaning of a common factor is given based on the values of their factor loading, or which
15 See Harmann (1976) for factor analysis. Our approach using factor analysis is similar to that in Uchida (2011).

19
left-hand-side variables the relevant common factor strongly affects. In this manner, factor
analysis is an approach to “let the data tell.” However, what meaning to give may more or less
depend on the researchers’ subjectivity, which is often pointed out as a shortcoming of factor
analysis.
In this paper, we refer to common factors Fk lending technology factors, because in our
context, common factors determine the extent to which different lending technologies are used.
That is, we give to the obtained common factors meanings based on theory of lending
technologies, with an assumption that the underlying lending technologies determine to what
extent the 18 lending criteria are emphasized.
We also conduct the same analysis for private banks. In this case, we simply replace
𝑐𝑐ℎ𝑎𝑎𝑎𝑎_𝑝𝑝𝑝𝑝𝑝𝑝𝑖𝑖 with 𝑐𝑐ℎ𝑎𝑎𝑎𝑎_𝑝𝑝𝑏𝑏𝑝𝑝𝑖𝑖 in the above equation. As in Uchida (2011), we do not split the
sample depending on bank types when obtaining amj , Fki, and emi. Rather, we compare the
obtained lending technology factors among different bank types when we conduct regression
analysis in subsection 6.2.
The specific approach that we follow when obtaining the results reported below is as follows.
We first set the number of common factors to 3 based on a standard that is conventionally used.
The first five eigenvalues of the correlation matrix of char_pb1 through char_pb18 are 4.92,
1.81, 1.67, 1.21, and 1.04, and we have significant drop between the third and the fourth
eigenvalues. The choice of the three common factors are also justified by the Scree test (see
Harmann 1976), because on a plot of the eigenvalues, we find a gentler slope after from the
fourth eigenvalue. On the other hand, the eigenvalues for private banks are 5.31, 1.78, 1.46, 1.21,
and 0.99, and so there is less clear difference between the third and the forth eigenvalues.
However, to keep consistency with the analysis on the public bank, we adopt 3 common factors.
For the three common factors, we obtain the initial solution using the iterated principal factor
method. The results below are qualitatively unchanged even if we obtain the solution by the
maximum likelihood method, but there are some differences, which will be reported below.
Finally, we rotate the initial solution using the Promax method.
6.1.2 Results for the public bank
Table 5 reports the results for the factor analysis for the JFC-SME. In this table, the three

20
columns in the middle (“Factor1” through “Factor3”) report the factor loadings (a1j , a2
j and a3j ,
j=1, …, 18) of the three lending technology factors (common factors) for each screening
criterion (j). For example, the value of 0.409 for the factor loading of Factor 1 on char_pb1
means that when the first common factor increases by one unit, which is equal to one standard
deviation, the value of the first loan screening factor (char_pb1) increases by 0.409. The final
column shows the values of the unique factors (i.e., emi), which indicate the fraction of the
emphasis on the relevant screening criterion (i.e., char_pbj) that is not explained by the three
lending technology factors. For example, the value of 0.783 on the top raw indicates that 21.7%
(= (1-0.783)*100) of the variation in char_pb1 is not explained by the three lending technology
factors. To interpret the results, we focus on the variables that the three lending technology
factors better explain, or on what variables the factors have larger factor loadings. To facilitate
the interpretation, we indicate the loadings larger than 0.5, which is one possible (but ad hoc)
threshold, in bold figures.
Table 5 shows that the first lending technology factor (Factor1) have significant impact on
criteria 13 (main bank status), 16 (trust), 17 (attitude of other banks), and 18 (reputation of tax
accountant/CPA). Because these are criteria that represent the importance of relationship
lending, we can label this factor the relationship lending factor. However, when interpreting
the findings here, we need to take into account the findings in subsection 5.2 as well. More
specifically, we already find in subsection 5.2 (Table 2) that the values of char_pb13, 16, 17, 18
are not so large, and so the JFC-SME does not emphasize these criteria very much. Taken
together, although the larger value of the first (relationship lending) factor simultaneously
increases the emphasis on these screening criteria that are related to relationship lending, the
level of the emphasis is low even after the increase. Thus, on balance, we can conclude that
relationship lending is not a very important lending technology for the JFC-SME.
Turning to the second lending technology factor (Factor2), it has a large positive impact on
screening criteria 3 (customer basis), 6 (profitability), and 7 (soundness). When we use the
maximum likelihood method to obtain the initial solution, the factor loading for criterion 3
becomes smaller (0.358). Because criteria 6 and 7 are focus on financial ratios, we can call the
second factor the financial statement lending factor. Because we find in subsection 5.2 that
criteria 6 and 7 are most emphasized by the JFC-SME, we can conclude that the financial

21
statement lending is a very important lending technology for the JFC-SME.
Finally, the third lending technology factor (Factor3) has a large positive impact on criteria 9
(guarantee) and 12 (wealth). We can thus call this factor the collateral/guarantee factor.
However, this factor does not have a significantly large impact on criteria 8 (collateral) and 10
(public credit guarantee) that are also the factors related to lending based on collateral or
guarantee. Also, we already find in subsection 5.2 that criteria 9 and 12 are not emphasized by
the JFC-SME, although criterion 8 is emphasized. Thus, our findings suggest that the JFC-SME
does not emphasize guarantee, and focus on collateral only. This finding is consistent with the
use of fixed asset lending.
On balance, we find the three lending technology factors for the JFC-SME: the relationship
lending factor, the financial statement lending factor, and collateral/guarantee factor. These
findings are consistent with those in Uchida (2011) for private banks. However, by taking into
account the findings in the previous section, we can conclude that the JFC-SME puts less
emphasis on the factors other than the financial statement lending factor. Rather, we find in
the previous section that criteria 4 (business plan), 15 (active disclosure), 3 (business basis),
and 8 (collateral) are independently emphasized. Thus, financial statement lending is the main
lending technology that the JFC-SME uses, and the bank may not extensively emphasize
relationship lending or lending based on collateral or guarantee.
6.1.3 Results for private banks
The results from the factor analysis for private banks are shown in Table 6. The structure of
the table is the same as that of table 5. The first lending technology factor has a positive and
significant impact on screening criteria 13 (main bank status), 14 (relationship length), 16
(trust), 18 (reputation of tax accountant/CPA). Thus, we can call this factor the relationship
lending factor.16 Different from the case for the JFC-SME, relationship lending is important
for private banks, because criteria 13 and 16 are important even when we examine each
criterion individually (see subsection 5.2). Thus relationship lending is an important lending
16 When we use the maximum likelihood method to obtain the initial solution, the factor loading of
this factor becomes larger than 0.5 for criterion 15, but smaller than that for criterion 18. When we use the cutoff of 0.4, instead of 0.5, regardless of the method to use, criteria 5, 11, and 13-18 have high loadings.

22
technology for private banks. Compared to the relationship lending factor of a public bank, the
factor loading of private banks is larger for criterion 14 and is smaller for criterion 17.
As for the second lending technology factor, we find that it has a large factor loadings for
criterion items 6 (profitability) and 7 (soundness), so this factor can be called the financial
statement lending factor. The finding of these impacts for private banks is similar to that for
the public bank. We already find in subsection 5.2 that private banks focus on these factors (as
the JFC-SME does), so the financial statement lending is an important lending technology for
private banks.
Finally, regarding the third lending technology factor, its factor loading is large for criteria 8
(collateral), 9 (guarantee), 10 (public credit guarantee), and 12 (wealth). We can thus label this
factor the collateral/guarantee factor. Because criterion 8 and 12 are individually emphasized
by private banks (see subsection 5.2), we find that credit prediction is important for private
banks. Compared to the collateral/guarantee factor for the JFC-SME, private banks focus not
only criteria 9 and 12 but also 8 and 10, although the JFC-SME does not emphasize collateral
or guarantee.
On balance, we find three lending technology factors for private banks: the relationship
lending factor, the financial statement lending factor, and the collateral/guarantee factor.
These findings are consistent with our findings for the JFC-SME, and the findings in Uchida
(2011) for private banks. However, the number of the screening criteria that each lending
technology factor affects is larger, and the absolute level of the emphasized screening criteria
are higher, in the case of private banks than in the case of the JFC-SME. Thus, the main
difference between the JFC-SME and private banks is the use of all the three lending
technologies by private banks.
6.2 Regression analysis for the determinants of lending technology
6.2.1 Methodology
In this section, we perform regression analysis where the dependent variable is the factor
scores (Fki) obtained in the factor analysis in the previous section for the three lending
technology factors: relationship lending factor; financial statement lending factor; and
collateral/guarantee factor. The independent variables are different variables to indicate

23
borrowers’ and lenders’ characteristics. Factor scores of a lending technology factors indicate
the importance of the relevant lending technologies for the relevant borrower. Thus, this
regression analysis examines the determinants of the different use in lending technologies
depending on borrower or lender characteristics. A finding of no statistically significant impact
of a variable means that whether to use the relevant lending technology does not depend on the
firm/bank characteristics represented by the variable. Note that such a finding of no
significance does not mean that the relevant lending technology is unimportant, because, as we
already examined in the previous section, the importance (or emphasis) is measured by the
level of the screening criteria variable (i.e., char_pbj) that the lending technology factor has a
large impact. The variables we use are listed in Table 7 (for the analysis of the JFC-SME) and
Table 8 (for the analysis of private banks) together with their summary statistics. The
definitions of these variables are explained below. We run the regressions by Ordinary Least
Squares (OLS).
The dependent variables in this analysis are the three factor scores. As a method to obtain
the scores, we use the Bartlett method and the regression method, but as the results are
qualitatively similar, we mainly report the results using the Bartlett method, and report the
results using the regression method when we find significant differences.
As for the analysis on the JFC-SME, we only use the factor score of the financial statement
lending factor, which we label fin_pb, as the dependent variable. We do not use the two other
lending technology factors for the JFC-SME, because the lending criteria that are closely
related to these two factors are not emphasized by the JFC-SME (see subsection 5.2.1). As for
the analysis on private banks, we use the factor scores of all the three identified screening
factors: fin_bk, the financial statement lending factor; col_bk, the collateral/guarantee factor;
and rel_bk, the relationship lending factor. Note that in factor analysis, factor scores are
standardized to have zero mean and unit standard deviation.
We use many variables for independent variables. First, we use variables to represent firm
characteristics that are available from the survey. The variable employee is the number of
employees, which is a proxy for firm size. The variable firmage is the age of a firm defined as
the difference between the survey year and the year of firms’ foundation. As shown in Table 7,
the average firm hires 76 employees and is 57 years old. The variable founder is a dummy

24
variable that takes the value of one if the current CEO of the firm is a founder, and zero
otherwise. We also use CEOgender, the dummy variable for the gender of the current CEO that
takes the value of one if the current CEO is female, and CEOage, the age of the CEO. In our
sample, 15.6% of our sample firms have a founder-CEO, 3.2% of them have a female CEO, and
the average age of the CEOs is 58 years old.
As performance measures of the firm, we also use different variables. First, sales_inc and
sales_dec are dummy variables that take the value of one if the firm’s sales respectively
increase and decrease in the most recent accounting year. As shown in Table 7, sales_inc = 1
for 39.4% of the sample firms, and sales_dec = 1 for 32.4% of them. We also use dummy
variables to indicate the firm’s net profit in the previous two years: prof_ds indicating a change
in the net profit from deficit to surplus; prof_sd indicating its change from surplus to deficit;
prof_dd indicating two consecutive deficits, where the default is the firms with two consecutive
surpluses. In our sample, 11.9% of them experience an increase in net profit, 8.5% experience a
decrease, 9.8% experience consecutive deficits, and the reminder (around 70%) has surpluses
for two consecutive accounting periods.
We also use variables for characteristics of the firms’ main banks: as for the type of the firms’
main bank (private banks), mainbk_reg indicates that the main bank is a regional or second
regional bank, mainbk_shi indicates a Shinkin Bank, and mainbk_coo indicates a credit
cooperative. The default is the firms with a city or trust bank as their main banks. In our
sample, the main bank is a regional/second regional bank for 57.6% of the sample firms, a
Shinkin bank for 12.4%, and a credit cooperative for 1.1%, with a city or trust bank for 29%.
Finally, we also use variables for the bank-firm relationships that we focused above:
mainlength is the length of the relationships between the borrower and its private main bank;
JFCdist and maindist measure the bank-firm distance, and JFCfreq and mainfreq measure the
frequency of contact between the firm and the bank’s loan officer. To take into account
non-linear impact of these variables, we use the natural logarithm of these variables (i.e.,
ln_JFCdist, ln_JFCfreq, ln_maindist, and ln_mainfreq).
6.2.2 Results for the public bank
Table 9 reports the regression results for the JFC-SME’s financial statement lending factor

25
(fin_pb). We find few significant independent variables. This finding suggests that the
JFC-SME does not differently use the financial statement lending depending on the
characteristics of the firm or its private main bank. We already find in the previous section that
the financial statement lending is a key lending technology of the JFC-SME. On balance, our
findings suggest that the public bank ubiquitously uses financial statement lending.
There are however two variables that have significant and significant effect on fin_pb, i.e.,
ln_JFCdist and ln_JFCfreq. The finding for ln_JFCdist implies that the public bank is more
likely to use financial statement lending for distant borrowers. The finding for ln_JFCfreq, on
the other hand, implies that the public bank is more likely to use financial statement lending as
its loan officer visits the firm more frequently. This finding is inconsistent with a prediction of
relationship lending theory that banks make frequent contact to obtain soft information (or for
relationship lending). Rather the finding here might imply that the public bank tries to obtain
soft information in addition to financial statement information for borrowers with a specific
characteristic such as those with deteriorating creditworthiness.
6.2.3 Results for private banks
The regressions results for private banks are reported in Table 10. The format of this table is
the same as that of Table 8. First, in Panel (A) where we report the results for financial
statement lending, we find no statistically significant variables except for prof_sd and
ln_JFCfreq. For many firm/bank characteristics, private banks do not change the use of
financial statement lending depending on many firm/bank characteristics. Note, however, that
the results in the previous section show that private banks do emphasize financial statement
lending. The findings for prof_sd and ln_JFCfreq are difficult to interpret, but when the factor
score is calculated by the regression method, prof_sd has no statistically significant coefficient.
Second, in Panel (B), the results for lending based on collateral/guarantee show that the
number of employees, employee, has a negative impact on its use. Similar to the case of
JFC-SME, private banks also focus on credit protection for smaller borrowers. We also find
that the dummy variable to indicate a decrease in net profit has a positive and statistically
significant coefficient. This finding may imply that private banks focus on collateral/guarantee
when firm performance deteriorates, but the finding is not robust because we find no

26
statistically significant impact for this variable when we use scores calculated by the regression
method. When using the scores by the regression method, we also find a positive and
significant impact for CEOage (10% level), suggesting that the collateral/guarantee is
important for an older CEO.
We also find in Panel (B) that lending based on collateral or guarantee is important for
Shinkin Banks and credit cooperatives, with a larger impact for the latter. These findings
suggest that small banks put more emphasis on collateral or guarantee. Finally, collateral or
guarantee is less important for borrowers when private banks’ loan officers have frequent
contact with the borrower (ln_mainfreq). This finding suggests that lending based on
collateral/guarantee and relationship lending are substitutes rather than complements.
Turning finally to Panel (C), we find two variables that have significant impact on the use of
relationship lending: mainlength and ln_JFCfreq. The finding for mainlength suggests that as
theoretically predicted, relationship lending is important as the length of firm-bank
relationship is longer and more soft information is accumulated. The finding for ln_JFCfreq
means that private banks are more likely to use relationship lending when the JFC-SME
frequently visits the borrower, although it is difficult to interpret this finding. Finally, no
significance for the other variables implies that private banks do not differently use
relationship lending depending on those factors, although private banks put much emphasis on
relationship lending (see subsection 5.2).17
As for private banks, similar regression analysis is also conducted in Uchida (2011) using
similar information obtained from a corporate survey. After identifying the same three lending
technology factors, Uchida (2011) also generate factor scores in a similar manner. On balance,
Uchida (2011) reports a larger number of significant variables than this paper does, and so the
results in the two paper are inconsistent with each other. However, we cannot directly compare
the two results because the independent variables are different, and the sample characteristics
are also different. Most importantly, the size of the sample firms for Uchida (2011) is larger
with larger variation in the size. 18 This lack of heterogeneity in the sample firms may
17 When we use the factor score based on the regression method, we find that CEOage has a positive
and statistically significant (10%) impact, as it does for the JFC-SME. 18 The summary statistics for the number of employee reported in Uchida (2011) are: the mean of 156.8; the standard deviation of 895.3; the minimum of 1; and the maximum of 22,724. Thus, our

27
contribute to the many insignificant results in Table 10. However, note again that both papers
consistently find the three lending technology factors
7. Conclusion
Focusing on the JFC-SME, a large public bank that play an important role in providing loans
to SMEs, we examined its loan screening from the viewpoint of lending technology, and find
intriguing results on lending technologies that the JFC-SME uses. First, the public bank
emphasizes quantitative information in financial statements, such as borrowers’ profitability
and soundness, which suggests that the bank uses financial statement lending. Because the
emphasis on this technology does not differ depending on borrower characteristics, it is the
technology that is ubiquitously used in the JFC-SME. However, we do not find evidence that
the JFC-SME extensively use relationship lending that is based on soft (qualitative)
information or of lending based on collateral/guarantee.
Second, compared with these results for the public bank, we find that private banks put more
emphasis on a larger number of screening criteria, and use relationship lending and lending
based on collateral/guarantee in addition to financial statement lending. Consistent with the
limited emphasis on financial statement lending by the JFC-SME, we also find that loan
officers at private banks make more frequent contact with, and the banks have a shorter
distance from, their borrowers than the public bank does.
Third, however, as uniqueness in loan screening by the JFC-SME, we find that the public
bank put significant emphasis on business plan of the borrowers, and on on-site inspection of
borrowers’ establishments. These findings imply that the JFC-SME inputs its limited resources
to a limited number of screening criteria.
On balance, our findings suggest that the loan screening by the public bank is distinctive, and
so the public and private banks may make different loan-granting decisions for the same firm.
In this sense, the two types of banks may not be perfect substitutes, and the public bank may
not be an almighty competitor for private banks. Also, our findings suggest that the loan
screening by the public bank may reflect the type of loans, i.e., long-term loans to SMEs for
sample firms (see Table 9) are smaller on average, with a smaller number of very small and very large firms.

28
policy purposes. There are many types of “public” banks around the world, and loan screening
and loan granting decisions may differ depending on the types. Examining differences in loan
screening among different types of “public” banks is an intriguing topic for future studies.
References
Bartoli, F., G. Ferri, P. Murro, and Z. Rotondi, 2013, SME financing and the choice of lending
technology in Italy: Complementarity or substitutability?, Journal of Banking & Finance 37,
5476-5485.
Berger, A.N., and L. K. Black, 2011, Bank size, lending technologies, and small business finance,
Journal of Banking & Finance 35, 724-735.
Berger, Allen N., N. H. Miller, M. A. Petersen, R. G. Rajan, and J. C. Stein, 2005, Does function
follow organizational form? Evidence from the lending practices of large and small banks,
Journal of Financial Economics 76, 237-269.
Berger, A.N. and G.F. Udell, 2002, Small business credit availability and relationship lending:
The importance of bank organizational structure, Economic Journal 112, pp. F32–F53.
Berger, A.N. and G.F. Udell, 2006, A more complete conceptual framework for SME finance,”
Journal of Banking and Finance 30, 2945-2966.
Boot, A.W.A., 2000, Relationship banking: What do we know?, Journal of Financial
Intermediation 9, 7-25.
de la Torre, A., M.S. Martínez Pería, and S.L. Schmukler, 2010, Bank involvement with SMEs:
Beyond relationship lending, Journal of Banking & Finance 34, 2280-2293.
Denis, D.J., and V.T. Mihov, 2003, The choice among bank debt, non-bank private debt, and
public debt: Evidence from new corporate borrowings, Journal of Financial Economics 70,
3-28.
Garcia-Appendini, E., 2011, Lending to small businesses: The Value of soft information.
Available at SSRN: http://ssrn.com/abstract=1750056.
Harmann, H.H., 1976, Modern Factor Analysis, 3rd edition, University of Chicago Press,
Chicago.
Jiménez, G., V. Salas, and J. Saurina, 2009, Organizational distance and use of collateral for
business loans, Journal of Banking & Finance 33, 234-243.

29
La Porta, R., F. Lopez-De-Silanes, and A. Shleifer, 2002, Government ownership of banks.
Journal of Finance 62, 265-301.
Petersen, M. A., and R. G. Rajan, 2002, Does distance still matter? The information revolution
in small business lending, Journal of Finance 57, 2533-2570.
Uchida, H., 2011, What do banks evaluate when they screen borrowers? Soft information, hard
information and collateral, Journal of Financial Services Research 40, 29-48.
Uchida, H. and G. Udell, 2014, Banking in Japan, in A. Berger, P. Molyneux, and J. Wilson eds.,
Oxford Handbook of Banking, 2nd edition, Ch. 36, Oxford University Press.
Uchida, H., G.F. Udell, and N. Yamori, 2008, How do Japanese banks discipline small and
medium-sized borrowers? An investigation of the deployment of lending technologies.
International Finance Review 9 (Institutional Approach to Global Corporate Governance),
57-80.

30
Tables
Table 1 Characteristics banks emphasize in their loan screening process 1. SME’s industry 2. SME’s size 3. SME’s business basis (e.g., customers and products) 4. SME’s business plan 5. Bank’s on-site inspection of SME’s establishments (e.g., plant and stores) 6. SME’s profitability (e.g., profit to sales ratio) 7. SME’s soundness (e.g., capital ratio) 8. SME’s collateral 9. Solvency of SME’s personal guarantor 10. Availability of public credit guarantee 11. CEO’s capabilities or talent 12. SME’s wealth (including CEO’s personal wealth) 13. Banks’ main bank status (whether the bank is the main bank or not) 14. Length (years) of the SME-Bank relationship 15. SME’s active disclosure (e.g., accounting information) to Bank 16. SME’s trust with Bank’s loan officers 17. [Lending] attitude of other financial institutions 18. Reputation of SME’s licensed tax accountant or CPA
Table 2 Emphasis on screening criteria by the JFC-SME
VariablesNumber of
obs.Mean
Standarddeviation
Minimum Maximum
char_pb1 676 3.297 0.867 1 5char_pb2 672 3.363 0.783 1 5char_pb3 677 3.795 0.768 1 5char_pb4 675 4.027 0.822 1 5char_pb5 663 3.179 0.931 1 5char_pb6 682 4.155 0.727 1 5char_pb7 681 4.041 0.777 1 5char_pb8 674 3.739 0.960 1 5char_pb9 674 3.258 0.948 1 5char_pb10 658 2.540 1.069 1 5char_pb11 679 3.729 0.806 1 5char_pb12 673 3.342 0.857 1 5char_pb13 665 2.722 0.918 1 5char_pb14 675 3.089 0.879 1 5char_pb15 677 3.938 0.812 1 5char_pb16 674 3.393 0.809 1 5char_pb17 669 3.129 0.880 1 5char_pb18 672 2.635 0.907 1 5JFCdist 996 32.693 36.025 0.25 100JFCfreq 1078 5.010 12.225 0 365

31
Table 3 Emphasis on screening criteria by private banks
VariablesNumberof obs.
MeanStd.dev.
Min. Max.Numberof obs.
MeanStd.dev.
Min. Max.Numberof obs.
MeanStd.dev.
Min. Max.Numberof obs.
MeanStd.dev.
Min. Max.
char_bk1 3,433 3.386 0.904 1 5 1,071 3.360 0.901 1 5 1,897 3.400 0.898 1 5 434 3.376 0.927 1 5char_bk2 3,433 3.527 0.838 1 5 1,072 3.537 0.796 1 5 1,900 3.541 0.841 1 5 430 3.442 0.903 1 5char_bk3 3,446 3.938 0.790 1 5 1,078 3.925 0.779 1 5 1,898 3.929 0.784 1 5 439 3.991 0.855 1 5char_bk4 3,458 3.850 0.877 1 5 1,080 3.804 0.880 1 5 1,913 3.878 0.868 1 5 433 3.818 0.909 1 5char_bk5 3,380 3.047 0.949 1 5 1,048 2.962 0.978 1 5 1,876 3.060 0.932 1 5 425 3.169 0.946 1 5char_bk6 3,508 4.288 0.721 1 5 1,097 4.301 0.714 1 5 1,940 4.285 0.720 1 5 440 4.255 0.748 1 5char_bk7 3,485 4.165 0.753 1 5 1,089 4.189 0.762 1 5 1,926 4.165 0.739 1 5 438 4.096 0.798 1 5char_bk8 3,455 3.649 1.021 1 5 1,079 3.622 1.043 1 5 1,905 3.634 1.018 1 5 440 3.723 0.978 1 5char_bk9 3,421 3.328 1.007 1 5 1,062 3.270 1.016 1 5 1,892 3.312 1.010 1 5 436 3.489 0.946 1 5char_bk10 3,399 3.159 1.168 1 5 1,048 3.023 1.169 1 5 1,884 3.181 1.163 1 5 436 3.362 1.149 1 5char_bk11 3,471 3.820 0.846 1 5 1,083 3.743 0.835 1 5 1,922 3.828 0.851 1 5 434 3.947 0.835 1 5char_bk12 3,433 3.604 0.876 1 5 1,068 3.606 0.857 1 5 1,900 3.580 0.881 1 5 435 3.674 0.890 1 5char_bk13 3,427 3.647 0.950 1 5 1,068 3.595 0.957 1 5 1,894 3.674 0.927 1 5 433 3.647 1.010 1 5char_bk14 3,447 3.401 0.915 1 5 1,073 3.346 0.893 1 5 1,909 3.401 0.911 1 5 434 3.525 0.969 1 5char_bk15 3,487 3.984 0.821 1 5 1,090 3.943 0.827 1 5 1,927 4.004 0.814 1 5 439 3.993 0.837 1 5char_bk16 3,455 3.584 0.842 1 5 1,081 3.528 0.831 1 5 1,906 3.593 0.839 1 5 436 3.665 0.867 1 5char_bk17 3,439 3.567 0.843 1 5 1,073 3.541 0.847 1 5 1,902 3.569 0.841 1 5 433 3.610 0.849 1 5char_bk18 3,438 2.834 0.913 1 5 1,071 2.688 0.903 1 5 1,903 2.878 0.914 1 5 432 2.977 0.890 1 5mainlength 3,723 36.328 18.687 1 200 1,140 34.304 18.851 1 130 2,063 37.873 19.118 1 200 485 34.470 15.902 1 80maindist 3,917 7.09 12.44 0.25 100 1,231 9.42 17.31 0.25 100 2,149 6.25 9.53 0.25 100 501 5.15 7.95 0.25 100mainfreq 3,907 49.12 86.60 0 365 1,228 24.71 45.07 0 365 2,146 51.99 87.19 0 365 498 89.97 124.52 1 365

32
Table 4 Public-private differences in emphasis on screening criteria

33
VariablesNumberof obs.
Mean Std. dev. Min. Max. p- value Numberof obs.
Mean Std. dev. Min. Max. p- value
char_dif1 637 -0.046 0.762 -3 4 0.132 203 -0.049 0.782 -3 3 0.370char_dif2 631 -0.143 0.772 -4 4 0.000 *** 201 -0.219 0.769 -4 2 0.000 ***char_dif3 635 -0.153 0.688 -3 4 0.000 *** 203 -0.148 0.743 -3 2 0.005 ***char_dif4 634 0.170 0.743 -2 3 0.000 *** 202 0.193 0.771 -2 3 0.000 ***char_dif5 623 0.100 0.829 -3 4 0.003 *** 196 0.148 0.843 -3 3 0.015 **char_dif6 642 -0.156 0.605 -3 4 0.000 *** 204 -0.206 0.584 -3 1 0.000 ***char_dif7 639 -0.139 0.646 -3 4 0.000 *** 204 -0.191 0.657 -3 2 0.000 ***char_dif8 633 -0.058 1.100 -4 4 0.182 203 -0.049 1.181 -4 4 0.553char_dif9 635 -0.121 0.784 -3 4 0.000 *** 204 -0.152 0.763 -3 4 0.005 ***char_dif10 620 -0.690 1.237 -4 3 0.000 *** 194 -0.753 1.276 -4 3 0.000 ***char_dif11 641 -0.126 0.628 -4 4 0.000 *** 205 -0.117 0.615 -4 2 0.007 ***char_dif12 634 -0.285 0.715 -3 4 0.000 *** 202 -0.327 0.685 -3 2 0.000 ***char_dif13 627 -0.860 1.187 -4 4 0.000 *** 199 -0.894 1.203 -4 3 0.000 ***char_dif14 637 -0.248 0.889 -4 4 0.000 *** 204 -0.142 0.879 -3 3 0.022 **char_dif15 638 -0.041 0.652 -3 3 0.115 202 -0.010 0.646 -3 3 0.828char_dif16 635 -0.170 0.699 -3 4 0.000 *** 204 -0.093 0.699 -3 2 0.058 *char_dif17 631 -0.474 1.023 -4 4 0.000 *** 202 -0.490 1.103 -4 2 0.000 ***char_dif18 633 -0.073 0.504 -3 2 0.000 *** 202 -0.010 0.478 -3 2 0.769dist_dif 923 26.775 35.891 -60 99.8 0.000 *** 316 7.511 16.630 -20 99.8 0.000 ***freq_dif 1000 -42.889 83.997 -365 353 0.000 *** 337 -23.697 48.474 -363 10 0.000 ***
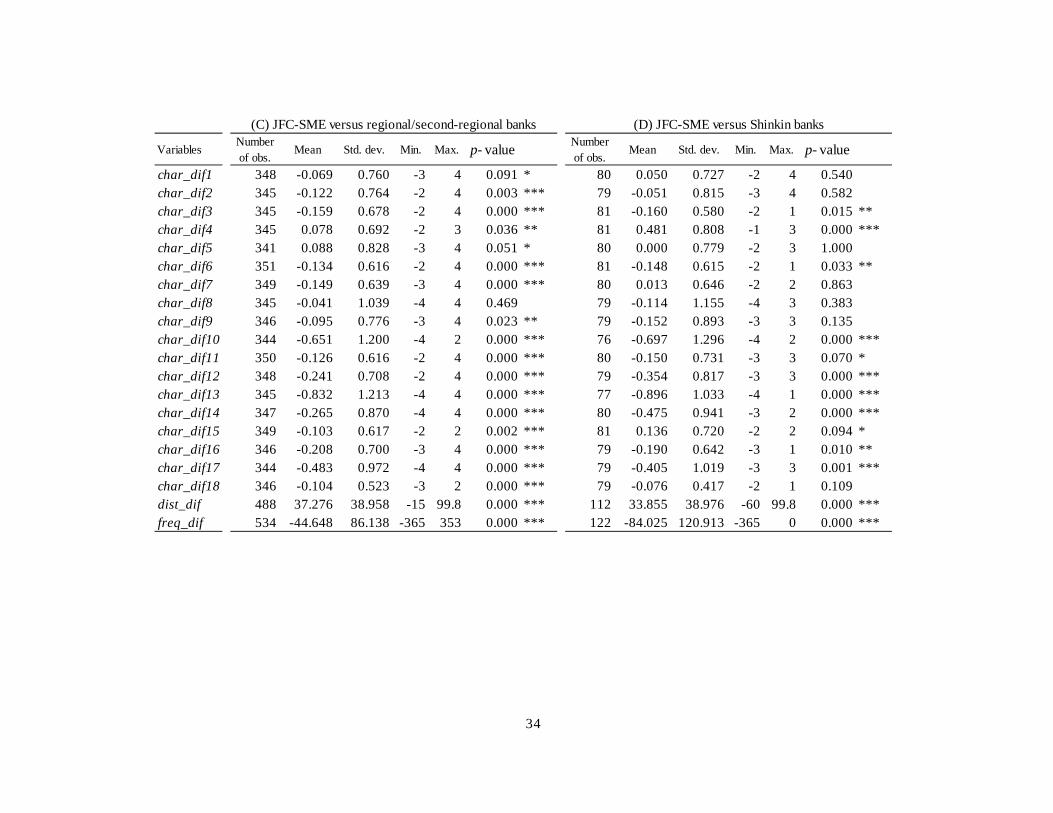
34
VariablesNumberof obs.
Mean Std. dev. Min. Max. p- value Numberof obs.
Mean Std. dev. Min. Max. p- value
char_dif1 348 -0.069 0.760 -3 4 0.091 * 80 0.050 0.727 -2 4 0.540char_dif2 345 -0.122 0.764 -2 4 0.003 *** 79 -0.051 0.815 -3 4 0.582char_dif3 345 -0.159 0.678 -2 4 0.000 *** 81 -0.160 0.580 -2 1 0.015 **char_dif4 345 0.078 0.692 -2 3 0.036 ** 81 0.481 0.808 -1 3 0.000 ***char_dif5 341 0.088 0.828 -3 4 0.051 * 80 0.000 0.779 -2 3 1.000char_dif6 351 -0.134 0.616 -2 4 0.000 *** 81 -0.148 0.615 -2 1 0.033 **char_dif7 349 -0.149 0.639 -3 4 0.000 *** 80 0.013 0.646 -2 2 0.863char_dif8 345 -0.041 1.039 -4 4 0.469 79 -0.114 1.155 -4 3 0.383char_dif9 346 -0.095 0.776 -3 4 0.023 ** 79 -0.152 0.893 -3 3 0.135char_dif10 344 -0.651 1.200 -4 2 0.000 *** 76 -0.697 1.296 -4 2 0.000 ***char_dif11 350 -0.126 0.616 -2 4 0.000 *** 80 -0.150 0.731 -3 3 0.070 *char_dif12 348 -0.241 0.708 -2 4 0.000 *** 79 -0.354 0.817 -3 3 0.000 ***char_dif13 345 -0.832 1.213 -4 4 0.000 *** 77 -0.896 1.033 -4 1 0.000 ***char_dif14 347 -0.265 0.870 -4 4 0.000 *** 80 -0.475 0.941 -3 2 0.000 ***char_dif15 349 -0.103 0.617 -2 2 0.002 *** 81 0.136 0.720 -2 2 0.094 *char_dif16 346 -0.208 0.700 -3 4 0.000 *** 79 -0.190 0.642 -3 1 0.010 **char_dif17 344 -0.483 0.972 -4 4 0.000 *** 79 -0.405 1.019 -3 3 0.001 ***char_dif18 346 -0.104 0.523 -3 2 0.000 *** 79 -0.076 0.417 -2 1 0.109dist_dif 488 37.276 38.958 -15 99.8 0.000 *** 112 33.855 38.976 -60 99.8 0.000 ***freq_dif 534 -44.648 86.138 -365 353 0.000 *** 122 -84.025 120.913 -365 0 0.000 ***
(D) JFC-SME versus Shinkin banks(C) JFC-SME versus regional/second-regional banks

35
Table 5 Result from factor analysis: JFC-SME
Table 6 Results from factor analysis: private banks
Variables Factor1 Factor2 Factor3 Uniqueness char_pb1 0.409 0.120 -0.065 0.783char_pb2 0.312 0.243 -0.046 0.779char_pb3 0.179 0.588 -0.161 0.546char_pb4 0.175 0.446 -0.010 0.696char_pb5 0.408 0.147 0.013 0.748char_pb6 -0.152 0.720 0.172 0.502char_pb7 -0.195 0.772 0.223 0.420char_pb8 -0.078 0.244 0.426 0.748char_pb9 0.002 0.115 0.714 0.442char_pb10 0.241 -0.146 0.485 0.686char_pb11 0.208 0.386 0.137 0.672char_pb12 0.024 0.209 0.587 0.548char_pb13 0.560 -0.173 0.282 0.608char_pb14 0.377 0.092 0.209 0.721char_pb15 0.142 0.479 -0.091 0.698char_pb16 0.620 0.128 -0.182 0.559char_pb17 0.529 0.067 0.011 0.677char_pb18 0.708 -0.258 0.175 0.535
Variables Factor1 Factor2 Factor3 Uniqueness char_bk1 0.346 0.152 0.001 0.799char_bk2 0.289 0.269 0.006 0.756char_bk3 0.337 0.445 -0.151 0.602char_bk4 0.343 0.318 0.029 0.643char_bk5 0.472 0.008 0.050 0.750char_bk6 -0.106 0.847 0.004 0.368char_bk7 -0.131 0.757 0.095 0.461char_bk8 -0.074 0.098 0.680 0.519char_bk9 -0.040 -0.034 0.841 0.343char_bk10 0.046 -0.054 0.545 0.704char_bk11 0.431 0.161 0.122 0.633char_bk12 0.039 0.121 0.535 0.619char_bk13 0.642 -0.058 -0.007 0.629char_bk14 0.665 -0.154 -0.010 0.652char_bk15 0.487 0.204 -0.024 0.626char_bk16 0.767 -0.092 -0.089 0.527char_bk17 0.438 0.092 0.025 0.743char_bk18 0.520 -0.226 0.149 0.747

36
Table 7 Summary statistics for regression variables: public bank
VariablesNumber of
obs.Mean Std. dev. Min. Max.
fin_pb 469 -0.016 1.142 -4.586 2.395employee 469 75.994 84.548 13 954firmage 469 56.953 31.802 10 415founder 469 0.156 NA 0 1CEOgender 469 0.032 NA 0 1CEOage 469 57.776 10.677 29 93sales_inc 469 0.394 NA 0 1sales_dec 469 0.324 NA 0 1prof_ds 469 0.119 NA 0 1prof_sd 469 0.085 NA 0 1prof_dd 469 0.098 NA 0 1mainbk_reg 469 0.576 NA 0 1mainbk_shi 469 0.124 NA 0 1mainbk_coo 469 0.011 NA 0 1mainlength 469 37.247 18.255 2 110ln_maindist 469 1.620 0.841 0.223 3.714ln_mainfreq 469 3.195 1.051 0.693 5.903ln_JFCdist 469 2.983 1.196 0.223 4.615ln_JFCfreq 469 1.415 0.736 0.000 3.970
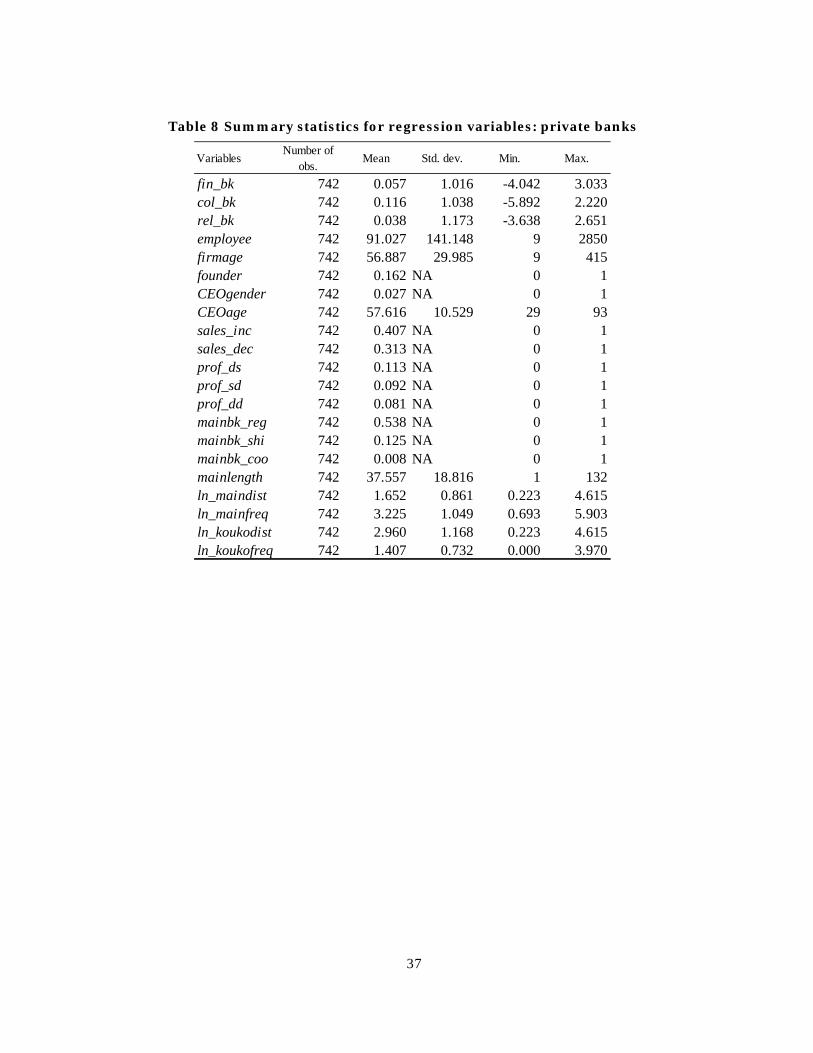
37
Table 8 Summary statistics for regression variables: private banks
VariablesNumber of
obs.Mean Std. dev. Min. Max.
fin_bk 742 0.057 1.016 -4.042 3.033col_bk 742 0.116 1.038 -5.892 2.220rel_bk 742 0.038 1.173 -3.638 2.651employee 742 91.027 141.148 9 2850firmage 742 56.887 29.985 9 415founder 742 0.162 NA 0 1CEOgender 742 0.027 NA 0 1CEOage 742 57.616 10.529 29 93sales_inc 742 0.407 NA 0 1sales_dec 742 0.313 NA 0 1prof_ds 742 0.113 NA 0 1prof_sd 742 0.092 NA 0 1prof_dd 742 0.081 NA 0 1mainbk_reg 742 0.538 NA 0 1mainbk_shi 742 0.125 NA 0 1mainbk_coo 742 0.008 NA 0 1mainlength 742 37.557 18.816 1 132ln_maindist 742 1.652 0.861 0.223 4.615ln_mainfreq 742 3.225 1.049 0.693 5.903ln_koukodist 742 2.960 1.168 0.223 4.615ln_koukofreq 742 1.407 0.732 0.000 3.970

38
Table 9 Regression results: public bank
Coef. Std. Err. t P>temployee 0.000 0.001 -0.190 0.851firmage 0.002 0.002 0.950 0.343founder 0.212 0.168 1.260 0.210CEOgender 0.219 0.306 0.710 0.475CEOage 0.002 0.005 0.280 0.779sales_inc -0.038 0.133 -0.290 0.774sales_dec -0.133 0.139 -0.960 0.340prof_ds -0.244 0.171 -1.420 0.155prof_sd -0.219 0.198 -1.110 0.268prof_dd -0.096 0.186 -0.520 0.606mainbk_reg -0.073 0.131 -0.550 0.581mainbk_shi 0.150 0.193 0.780 0.439mainbk_coo 0.575 0.531 1.080 0.279mainlength 0.001 0.003 0.380 0.704ln_maindist 0.108 0.066 1.640 0.103ln_mainfreq -0.012 0.054 -0.230 0.822ln_JFCdist 0.083 0.050 1.660 0.097 *ln_JFCfreq 0.237 0.075 3.180 0.002 ***(intercept) -0.867 0.400 -2.170 0.031 **No. of obs. 469F (18, 450) 1.48Prob > F 0.092Adj R -squared 0.018
Financial statement lending factor(dependent variable = fin_pb )
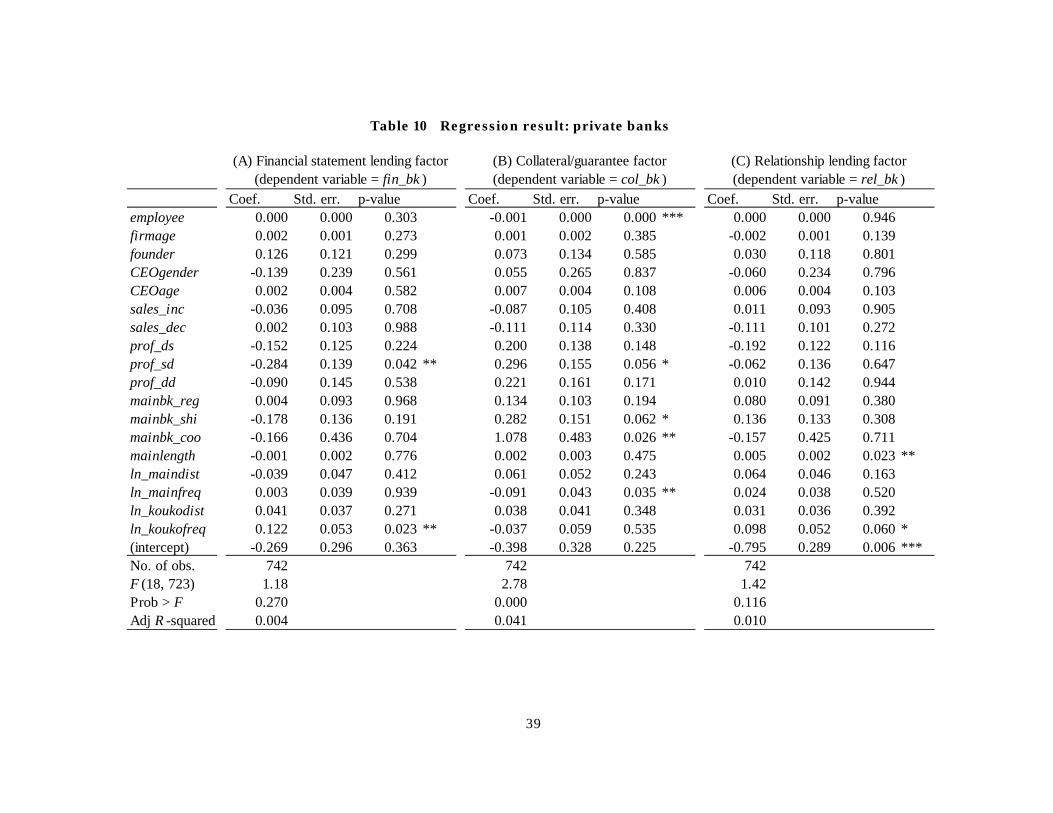
39
Table 10 Regression result: private banks
Coef. Std. err. p-value Coef. Std. err. p-value Coef. Std. err. p-valueemployee 0.000 0.000 0.303 -0.001 0.000 0.000 *** 0.000 0.000 0.946firmage 0.002 0.001 0.273 0.001 0.002 0.385 -0.002 0.001 0.139founder 0.126 0.121 0.299 0.073 0.134 0.585 0.030 0.118 0.801CEOgender -0.139 0.239 0.561 0.055 0.265 0.837 -0.060 0.234 0.796CEOage 0.002 0.004 0.582 0.007 0.004 0.108 0.006 0.004 0.103sales_inc -0.036 0.095 0.708 -0.087 0.105 0.408 0.011 0.093 0.905sales_dec 0.002 0.103 0.988 -0.111 0.114 0.330 -0.111 0.101 0.272prof_ds -0.152 0.125 0.224 0.200 0.138 0.148 -0.192 0.122 0.116prof_sd -0.284 0.139 0.042 ** 0.296 0.155 0.056 * -0.062 0.136 0.647prof_dd -0.090 0.145 0.538 0.221 0.161 0.171 0.010 0.142 0.944mainbk_reg 0.004 0.093 0.968 0.134 0.103 0.194 0.080 0.091 0.380mainbk_shi -0.178 0.136 0.191 0.282 0.151 0.062 * 0.136 0.133 0.308mainbk_coo -0.166 0.436 0.704 1.078 0.483 0.026 ** -0.157 0.425 0.711mainlength -0.001 0.002 0.776 0.002 0.003 0.475 0.005 0.002 0.023 **ln_maindist -0.039 0.047 0.412 0.061 0.052 0.243 0.064 0.046 0.163ln_mainfreq 0.003 0.039 0.939 -0.091 0.043 0.035 ** 0.024 0.038 0.520ln_koukodist 0.041 0.037 0.271 0.038 0.041 0.348 0.031 0.036 0.392ln_koukofreq 0.122 0.053 0.023 ** -0.037 0.059 0.535 0.098 0.052 0.060 *(intercept) -0.269 0.296 0.363 -0.398 0.328 0.225 -0.795 0.289 0.006 ***No. of obs. 742 742 742F (18, 723) 1.18 2.78 1.42Prob > F 0.270 0.000 0.116Adj R -squared 0.004 0.041 0.010
(C) Relationship lending factor(dependent variable = rel_bk )
(A) Financial statement lending factor(dependent variable = fin_bk )
(B) Collateral/guarantee factor(dependent variable = col_bk )