a comprehensive survey of endocrine active compounds and ......apr 29, 2011 · a comprehensive...
TRANSCRIPT

A Comprehensive Survey of Endocrine Active Compounds and Fish Effects in the Chicago Area Waterway System
A presentation at the
Metropolitan Water Reclamation DistrictOf Greater Chicago
April 29, 2011
Heiko L. Schoenfuss,Aquatic Toxicology Laboratory, St. Cloud State University, MN


Diethylstilbestrol (DES)
•1940-1970 prescribed to prevent miscarriage.
•1953 found to be ineffective.
•Continued prescribed during pregnancies until 1971.

DES – “Women”• Increased risk of breast cancer.
DES – Sons•Possible association with gender dysphoria and genital abnormalities.
DES – Daughters•Increased risk of a rare cancer.
DES – Third Generation•Higher incident rate of irregular menstrual periods

prescribed as estrogen-replacement until 1997.

An exogenous chemical that causes adverse health effects in an organism, or its progeny, consequent to changes in the
endocrine function.
Endocrine Active Compounds (EACs)

Complexity of the Endocrine System

Little change in the past 300+ million years.
Hormones in fish and humans are remarkably similar.
Reproduction & Behavior
Pituitary Gland
Ovaries &Testicles
Hypothalamus
Endocrine Active Compounds (EACs)

•
•Kolpin, Furlong, Meyer, Thurman, Zaugg, Barber, and Buxton, 2002, Pharmaceuticals, hormones, and other organic wastewater contaminants in U.S. Streams, 1999-2000: A national Reconnaissance: ES&T, v. 36, p. 1202.
22 Antibiotics14 Prescription Drugs
5 Nonprescription Drugs 15 Hormones and Steroids
39 Household and Industrial
This USGS Survey Found:
Endocrine Active Compounds (EACs)


A snapshot from effluents flowing into the Mississippi River:
Natural Estrogens:
nd - 7.3 ng/L
nd - 50 ng/L
Synthetic Endocrine Active Compounds:• Ethynylestradiol (birth control):
• up to 3 ng/L• Nonylphenol (detergent):
• up to 13,000 ng/L• Total alkylphenols: > 50,000 ng/L• Combined Mood-altering drugs:
• ~ 10,000 ng/L• Triclosan (anti-microbial): up to 318 ng/L
• Bisphenol A (BPA): ~100-1,000 ng/L
nd = non-detectable; ng/L = parts per trillion
Endocrine Active Compounds (EACs)
nd - 40 ng/L

1. Vitellogenin – an egg yolk protein usually found in female fish, but also produced in males when exposed to estrogens.
Vitellogenin= VTG
Endocrine Active Compounds (EACs)
Common Endpoints

2. Histology of the reproductive tissues
Endocrine Active Compounds (EACs) –Common Endpoints

Documented Environmental Effects -Experimental Lakes Area – Ontario, Canada
The potent estrogen Ethynylestradiol (EE2) at a concentration of 5ng/L was added to the lake during three consecutive summers (2001‐2003).

+EE2
+EE2
+EE2
shift
shift
shift
Kidd et al., 2007. PNAS
Collapse of Fish Population

Boulder Creek, CO(Vajda et al. 2008)
Total Estrogenicity: 11 to 31 ng/L E2
Vitellogenin in Males: 500x control conc.
Fish Sex Ratio: < 25% males
Intersex Frequency: 18 – 22% of males
Documented Environmental Effects

Documented Environmental Effects
North Shore Channel, IL(Barber et al. In review)
Total Estrogenicity: 9 to 19 ng/L E2
Vitellogenin in Males: 1,000x control conc.
Fish Sex Ratio: ~ 50% males
Intersex Frequency: 0% of males

North Shore Channel, IL(Barber et al. In review)
Total Estrogenicity: 9 to 19 ng/L E2
Vitellogenin in Males: 1,000x control conc.
Fish Sex Ratio: ~ 50% males
Intersex Frequency: 0% of males
Boulder Creek, CO(Vajda et al. 2008)
Total Estrogenicity: 11 to 31 ng/L E2
Vitellogenin in Males: 500x control conc.
Fish Sex Ratio: < 25% males
Intersex Frequency: 18 – 22% of males
Documented Environmental Effects

Why Study Urban Aquatic Environments?
•They are more common than you think.
•Their abundance is likely to increase in the next 50 years.
•Resources are most utilized by the human population.
•They are aquatic habitats.


Study Overview
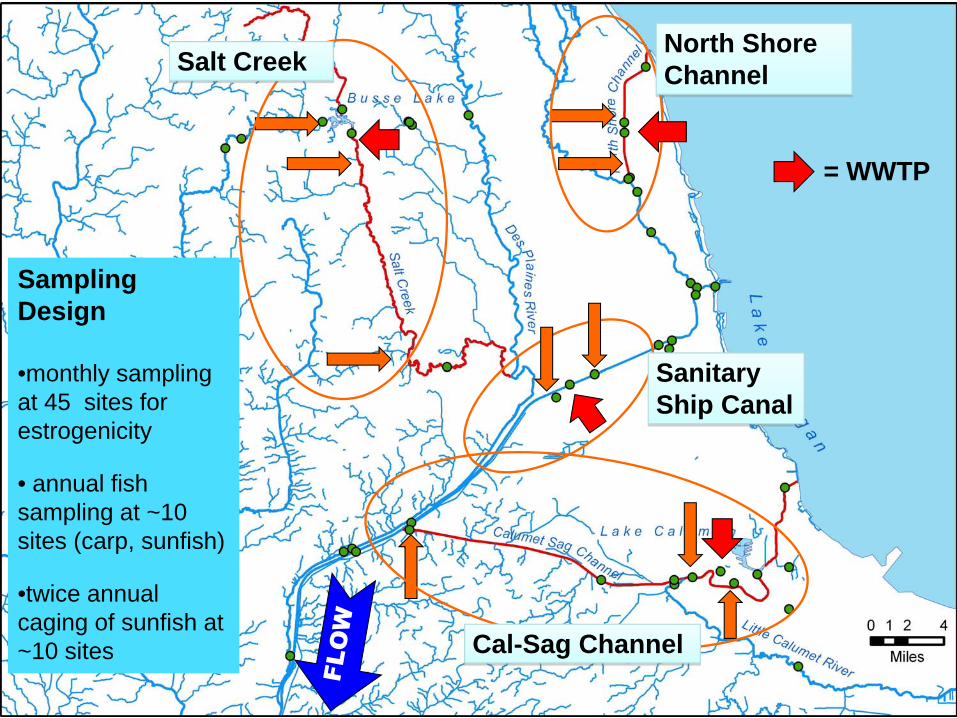
Salt Creek
Cal-Sag Channel
North Shore Channel
Sanitary Ship Canal
= WWTP
Sampling Design
•monthly sampling at 45 sites for estrogenicity
• annual fish sampling at ~10 sites (carp, sunfish)
•twice annual caging of sunfish at ~10 sites

Water Estrogenicity Sampling24 Consecutive Months
Water SamplingCollected water samples from 38 waterway locations and 7 Treatment Plants monthly.
Solid-phase extracted, eluded and curated > 1,000 samples
Analyzed quarterly samples for estrogenicity.

Plate cells
Sample
Dose cells
Read luminescence
Add Luciferin
In Vitro Endpoint – Estrogenicity
Estrogenicity Gradient
not measured
0
1
2
3
4
5
6
Only background estrogenicity (natural sources)
Elevated estrogenic activity (expected with human activity)
High estrogenic activity (likely to result in physiological response in fish)

Site ID April 2009 July 2009 October 2009 May 2010 June 2010 September 2010
18 1 0 0 0 not measured 024 not measured not measured not measured 0 not measured 029 2 0 1 0 0 035 3 3 3 5 0 136 2 0 2 not measured 0 337 2 4 1 6 0 239 0 2 not measured 3 0 240 2 3 not measured 0 0 241 0 3 not measured 3 2 not measured42 not measured 5 not measured 5 4 243 3 2 2 3 0 246 2 2 0 4 0 348 not measured 3 not measured 4 2 049 not measured 0 1 2 0 150 2 2 0 0 not measured 152 2 3 2 0 0 255 0 2 2 0 0 056 0 not measured 2 2 0 257 1 0 2 not measured 0 258 2 2 0 2 3 159 2 3 2 2 0 not measured73 2 5 1 6 2 374 2 0 not measured 2 0 275 1 5 not measured 0 3 276 3 6 2 3 0 377 0 not measured 1 0 not measured not measured78 2 5 2 3 not measured 379 5 0 2 0 0 080 2 2 1 0 0 086 1 3 not measured not measured 0 389 2 0 2 4 0 092 2 0 not measured 0 2 396 2 2 0 0 0 399 0 6 not measured 4 not measured 1100 0 0 not measured 2 0 2101 2 0 2 6 3 2102 2 2 2 6 0 2108 1 3 not measured 3 2 2110 2 0 0 2 0 0rp1 2 0 1 2 0 2rp2 2 3 0 3 0 0rp3 3 6 3 4 0 3rp4 0 0 0 3 0 4rp5 2 4 not measured 4 0 3rp6 3 3 2 4 2 4rp7 2 2 1 3 0 2
Estrogenicity Gradient
not measured
0
1
2
3
4
5
6

Mean Estrogenic
Potency
Low
High
Site ID Mean ng/L SDCV
(SD/MEAN)*100
24 0.00 0.0018 0.06 0.13 223.6177 0.32 0.56 173.2129 0.37 0.59 162.2349 0.39 0.48 124.7956 1.03 1.79 173.1957 1.48 1.74 117.0455 1.50 2.98 197.84110 1.66 2.76 165.9980 1.74 3.23 185.5174 3.15 4.10 130.37100 3.27 4.63 141.58rp1 3.33 3.57 107.3650 3.58 3.60 100.7292 3.64 5.30 145.7636 3.79 5.16 136.0396 4.48 6.87 153.4452 4.53 4.95 109.2540 5.10 8.38 164.3059 5.17 5.55 107.3739 5.75 6.12 106.5958 5.85 5.96 101.8689 6.20 11.96 192.8943 7.17 7.53 104.96rp7 7.30 7.29 99.8886 8.55 10.45 122.21rp4 9.42 16.34 173.46rp2 9.87 14.41 146.0346 10.49 12.10 115.3179 11.75 28.19 240.00108 12.17 10.28 84.4841 14.82 13.17 88.8548 15.13 17.89 118.2375 17.80 27.72 155.7035 18.97 26.29 138.61rp5 20.60 23.00 111.6378 22.04 22.91 103.91rp6 23.83 14.98 62.8776 27.52 36.18 131.4537 28.96 50.44 174.19rp3 32.76 47.91 146.27101 35.61 78.23 219.72102 39.59 86.55 218.6242 42.90 28.24 65.8399 52.20 84.51 161.8973 56.01 96.08 171.54
6 of 7 WWTP in upper 50% of
estrogenic potency

Temporal Variation
Site ID Mean ng/L SDCV
(SD/MEAN)*100rp6 23.83 14.98 62.8742 42.90 28.24 65.83108 12.17 10.28 84.4841 14.82 13.17 88.85rp7 7.30 7.29 99.8850 3.58 3.60 100.7258 5.85 5.96 101.8678 22.04 22.91 103.9143 7.17 7.53 104.9639 5.75 6.12 106.59rp1 3.33 3.57 107.3659 5.17 5.55 107.3752 4.53 4.95 109.25rp5 20.60 23.00 111.6346 10.49 12.10 115.3157 1.48 1.74 117.0448 15.13 17.89 118.2386 8.55 10.45 122.2149 0.39 0.48 124.7974 3.15 4.10 130.3776 27.52 36.18 131.4536 3.79 5.16 136.0335 18.97 26.29 138.61100 3.27 4.63 141.5892 3.64 5.30 145.76rp2 9.87 14.41 146.03rp3 32.76 47.91 146.2796 4.48 6.87 153.4475 17.80 27.72 155.7099 52.20 84.51 161.8929 0.37 0.59 162.2340 5.10 8.38 164.30110 1.66 2.76 165.9973 56.01 96.08 171.5456 1.03 1.79 173.1977 0.32 0.56 173.21rp4 9.42 16.34 173.4637 28.96 50.44 174.1980 1.74 3.23 185.5189 6.20 11.96 192.8955 1.50 2.98 197.84102 39.59 86.55 218.62101 35.61 78.23 219.7218 0.06 0.13 223.6179 11.75 28.19 240.0024 0.00 0.00
Low
High
6 of 7 WWTP in lower 2/3 of
temporal variability

Water Chemistry – Salt Creek
0
20
40
60
80
100
120
140
160
180
Busse Devon Wolf
ng/L
E1
E2 A
E2 B
E3
EE2
BPA
Non
Nonylphenol

Water Chemistry – Salt Creek
0
2
4
6
8
10
12
14
16
18
Busse Devon Wolf
ng/L
E1
E2 A
E2 B
E3
EE2
BPA
BPA BPA
BPA
E3

Water Chemistry – North Shore Channel
0
2
4
6
8
10
12
14
16
18
20
Oakton Touhy
ng/L
E1
E2 A
E2 B
E3
EE2
BPA
BPA
BPA
E1
E2A
E2B
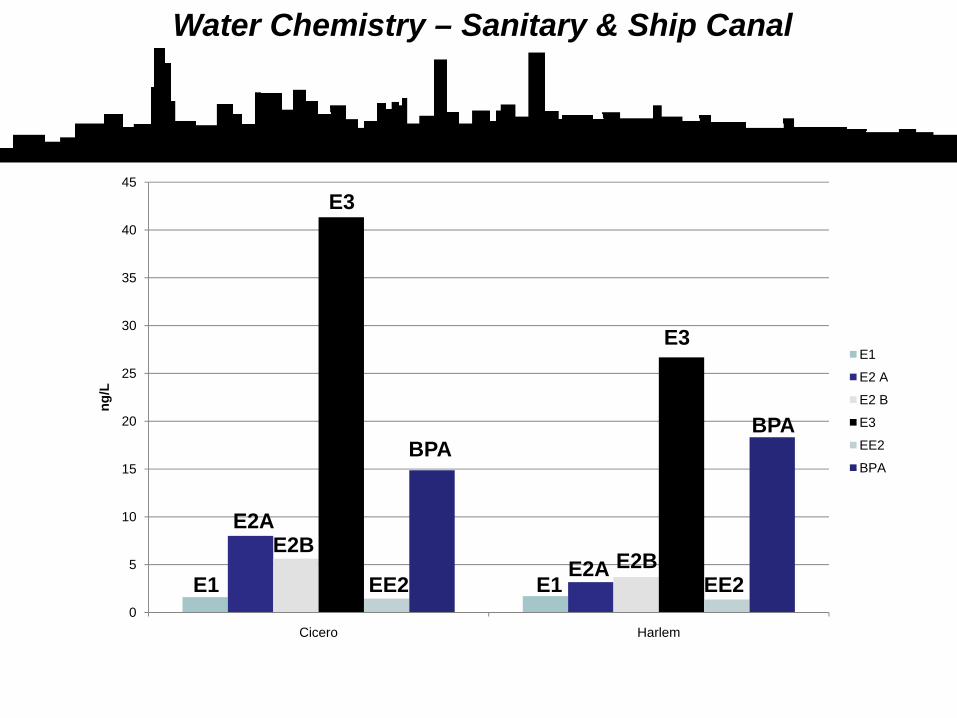
Water Chemistry – Sanitary & Ship Canal
0
5
10
15
20
25
30
35
40
45
Cicero Harlem
ng/L
E1
E2 A
E2 B
E3
EE2
BPABPA
BPA
E1
E2A
E2BE1
E2AE2B
E3
E3
EE2 EE2

Water Chemistry – Cal Sag Channel
0
5
10
15
20
25
30
35
40
45
50
Calumet Indiana Halstead SEPA 5
ng/L
E1
E2 A
E2 B
E3
EE2
BPA
BPA
E3
BPA
BPA
BPA
E3
E3
E3

Water Chemistry – Total Estrogenicity
Estr
adio
l Equ
ival
ency
[ng/
L]

Calculated vs. Cell-based Total Estrogenicity
Estr
adio
l Equ
ival
ency
[ng/
L]

Water Chemistry - Summary
• A variety of estrogenic endocrine active compounds are found throughout the study areas.
• WWTP effluent contributes to the presence of these compounds.
• Cell-based estrogenicity results and water chemistry suggest additional sources of estrogens in the Chicago Waterways.

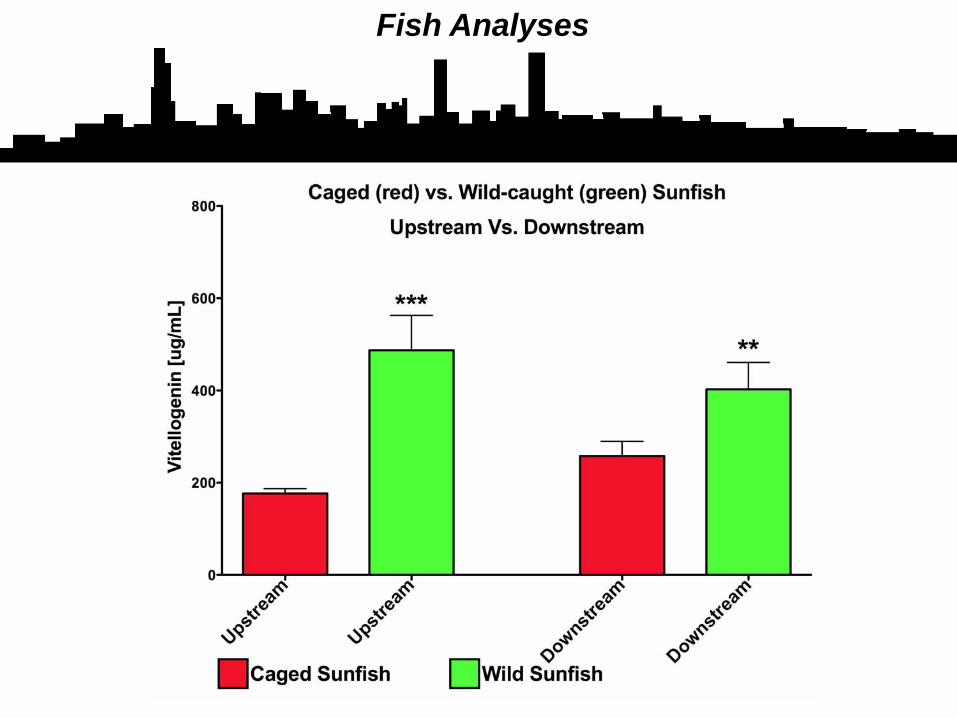
Fish Analysis – Vitellogenin & Histology

Fish Analyses – Vitellogenin in Caged Sunfish

Fish Analyses

Fish Analyses

Fish Analyses

Fish Analyses

Fish Analyses

Fish Analyses

* p<0.05; ** p<0.01 Student T test
Fish Analyses


Fish Analyses
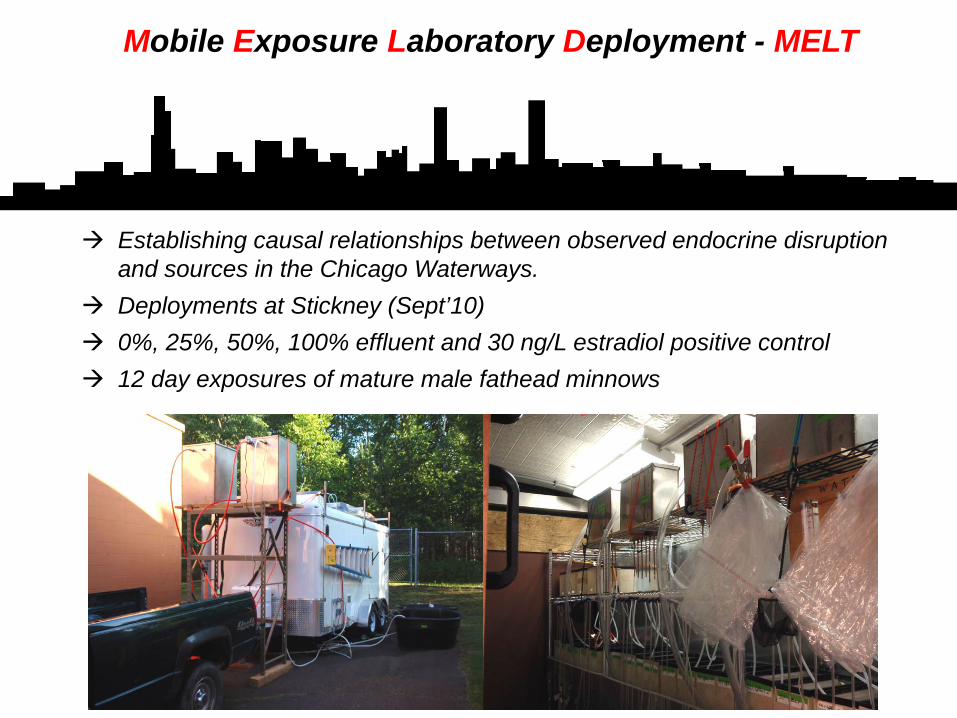
Mobile Exposure Laboratory Deployment - MELT
Establishing causal relationships between observed endocrine disruption and sources in the Chicago Waterways.Deployments at Stickney (Sept’10)0%, 25%, 50%, 100% effluent and 30 ng/L estradiol positive control 12 day exposures of mature male fathead minnows

Mobile Exposure Laboratory Deployment - MELT
Stickney, September 2010
p<0.01 ANOVA p<0.01 Kruskal-Wallis

Fish Analyses - Summary
• In congruence with estrogenicity and water chemistry, fish in the study area are exposed to estrogenic endocrine active compounds.
• Resident fish exhibit greater expression of biomarkers of exposures - indicative of longer exposure periods.
• Seasonality in estrogenic responses is visible but not easily resolved – awaits further analysis.
• A signal of WWTP effluents is visible in the fish data, however, it is overlaid by other exposure sources – these need to be explored.

• Urban aquatic ecosystems are exposed to biologically active compounds through multiple pathways – including treated wastewater effluent.
Understanding other pathways is essential.
• Fish are impacted by these exposures to a varying degree.Identifying vulnerable habitats, species, and life stages will add critical knowledge.
Final Thoughts…..

• Remediation will require a comprehensive approach that involves education as much as technology.
The public is willing to contribute if given the opportunity.
Final Thoughts…..

• Academic - Industry collaborations can provide effective mechanisms to identify and remediate environmental concerns.
The St. Cloud State University –MWRDGC collaboration has been outstanding – Thank You!
Final Thoughts…..

Thank You !
Many thanks ……•Industrial Waste Division and Wastewater Research for sample collection• Analytical Laboratory Division for sample analyses•Microbiology for laboratory support•All MWRDGC staff