a computational study of the aerodynamic performance of a
TRANSCRIPT
IOP PUBLISHING BIOINSPIRATION & BIOMIMETICS
Bioinsp. Biomim. 3 (2008) 026004 (13pp) doi:10.1088/1748-3182/3/2/026004
A computational study of theaerodynamic performance of a dragonflywing section in gliding flightAbel Vargas, Rajat Mittal and Haibo Dong
Department of Mechanical and Aerospace Engineering, The George Washington University,Washington DC 20052, USA
E-mail: [email protected]
Received 6 December 2007Accepted for publication 2 May 2008Published 23 May 2008Online at stacks.iop.org/BB/3/026004
AbstractA comprehensive computational fluid-dynamics-based study of a pleated wing section basedon the wing of Aeshna cyanea has been performed at ultra-low Reynolds numberscorresponding to the gliding flight of these dragonflies. In addition to the pleated wing,simulations have also been carried out for its smoothed counterpart (called the ‘profiled’airfoil) and a flat plate in order to better understand the aerodynamic performance of thepleated wing. The simulations employ a sharp interface Cartesian-grid-based immersedboundary method, and a detailed critical assessment of the computed results was performedgiving a high measure of confidence in the fidelity of the current simulations. The simulationsdemonstrate that the pleated airfoil produces comparable and at times higher lift than theprofiled airfoil, with a drag comparable to that of its profiled counterpart. The higher lift andmoderate drag associated with the pleated airfoil lead to an aerodynamic performance that is atleast equivalent to and sometimes better than the profiled airfoil. The primary cause for thereduction in the overall drag of the pleated airfoil is the negative shear drag produced by therecirculation zones which form within the pleats. The current numerical simulations thereforeclearly demonstrate that the pleated wing is an ingenious design of nature, which at timessurpasses the aerodynamic performance of a more conventional smooth airfoil as well as thatof a flat plate. For this reason, the pleated airfoil is an excellent candidate for a fixed wingmicro-aerial vehicle design.
(Some figures in this article are in colour only in the electronic version)
1. Introduction
The main source of lift and propulsion produced by insects isthrough the flapping of their wings. The dragonfly, considereda high performance flyer, is no exception. It has a flappingfrequency between 30 Hz and 50 Hz (Ruppell 1989), andtypically flies with its forewings and hindwings beating outof phase (Alexander 1984). Flapping flight of dragonflies hasbeen studied extensively by Savage et al (1979), Alexander(1984), Azuma et al (1985), Somps and Luttges (1985),Ruppell (1989), Azuma (1992), Wakeling and Ellington(1997b), Azuma and Watanabe (1988) and Thomas et al(2004). However, gliding flight is also observed frequently
in dragonflies; for instance, Pantala flavescens can sustainglides of 10–15 s at a flight speed of about 15 m s−1 (Hankin1921). The dragonfly of the genus Aeschna is capable ofgliding for up to 30 s without any appreciable loss in altitude(Brodsky 1994). Smaller dragonflies as those filmed in theexperiments of Wakeling and Ellington (1997a) had glidingperiods lasting 0.5 s, covering a distance of approximately 1 m,and achieving maximum gliding speeds of up to 2.6 m s−1.The typical Reynolds number of dragonflies can range from100 to 10 000 (Wakeling and Ellington 1997a), which can becategorized as being in the ultra-low Reynolds number flowregime.
1748-3182/08/026004+13$30.00 1 © 2008 IOP Publishing Ltd Printed in the UK
Bioinsp. Biomim. 3 (2008) 026004 A Vargas et al
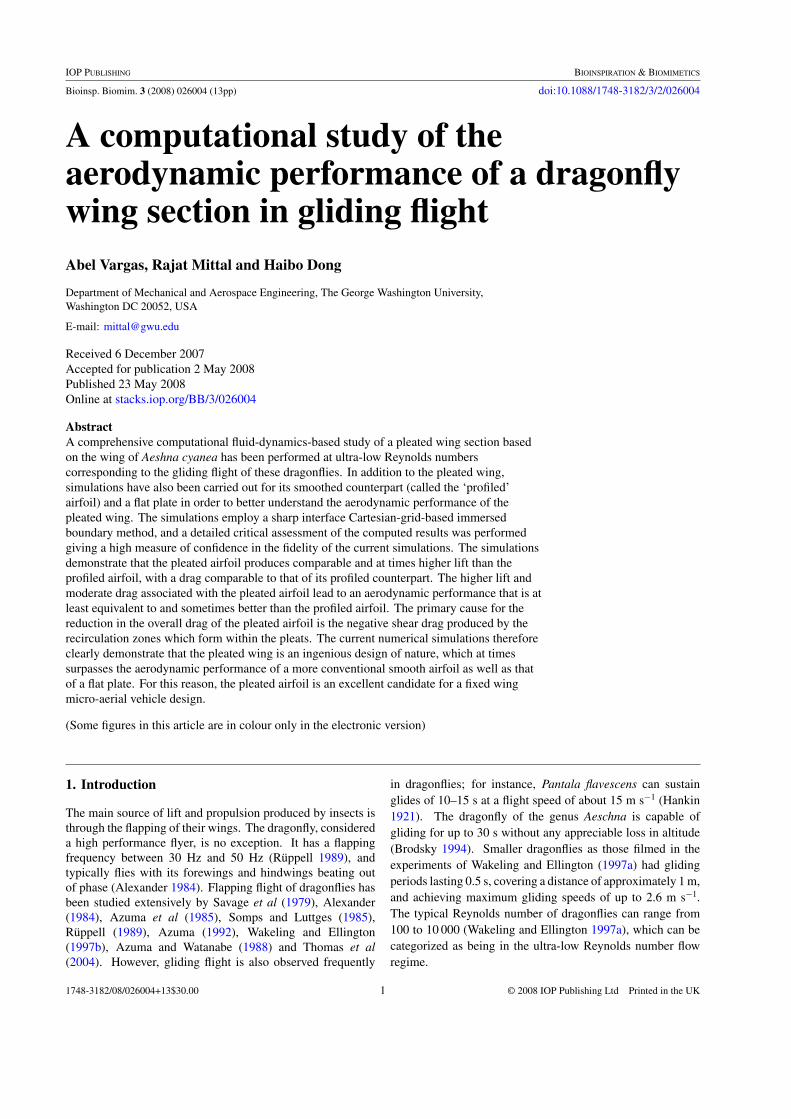
Figure 1. An illustration of typical pleated cross-sections found indragonfly wings (Kesel 2000).
Gliding flight is an advantageous flight mode as it requiresvirtually no effort from the dragonfly (Nachtigall 1974, May1976, 1978). It is therefore not surprising that wing beatfrequency declines considerably while the time spent glidingincreases as the ambient temperature increases (Hankin 1921,May 1978, 1995). At high temperatures, large dragonfliesrun the risk of overheating during active flapping flight, andcan avoid this by sustaining longer glides per wing beat (Miller1987). It has also been hypothesized that dragonflies adopt thisgliding mode to take advantage of convective cooling duringhot weather.
In gliding flight, the dragonfly elevates into the air usingpowered (flapping) flight and makes use of potential energyto move horizontally above the ground (Brodsky 1994). Itis well known that high aspect ratio wings are advantageousin gliding flight and this is the reason why wings with highaspect ratios are employed in sail planes as well as by largesoaring birds. Interestingly, dragonflies have some of thehighest aspect ratio wings in the insect world which allowthem to possess a better glide performance and consume lessenergy during gliding (Ennos 1989). For particular Aeschnajuncea, Ellington (1984b) calculated aspect ratios of 11.63and 8.4 for the forewing and hindwing respectively. Thecrane fly (Tipula paludosa) is comparable to the dragonflywith an aspect ratio of about 11. The dragonfly’s wing aspectratio is quite high compared to other insects such as the fruitfly (Drosophila virilis) which has an aspect ratio of 2 (Vogel1957) and the bumblebee (Bombus terrestris) with an aspectratio of 6.4 (Ellington 1984b). The high aspect ratio dragonflywings, which are narrow at the base with a greater wing areaconcentrated away from the base where airflow is the fastest,are features which probably also provide an aerodynamicadvantage (Wootton and Kukalova-Peck 2000).
Dragonflies have highly corrugated wings where thepleated configuration varies along the spanwise and chordwisedirections. The pleats provide stiffening against spanwisebending, while allowing for torsion and the development ofcamber (Hertel 1966, Newman et al 1977, Newman andWootton 1986, Sudo and Tsuyuki 2000). Stiffness in thespanwise direction arises from the construction of a pleatedwing since the longitudinal veins are located at the maximumand minimum peaks and are connected by the cross veins(Wootton 1981, 1990, 1991, 1992). The pleated wing isstructurally stabilized primarily by the folded configurations,which increases flexural rigidity (Rees 1975a). Rigidity variesthroughout the wing, and the factors which cause this variationare the depth of the pleats and the rigidity of the longitudinalcross veins (Wootton 1991).
The pleated structure found in dragonflies as seen infigure 1 does not resemble a typical engineered airfoil. Thus,it seems at the outset that such a pleated wing would havea poor aerodynamic performance (low lift, extremely highdrag) due to its irregular shape. Steady flow experiments
replicating gliding flight conducted on pleated models inspiredby dragonflies (Rees 1975b, Rudolph 1977, Newman et al1977, Buckholz 1986, Kesel 2000), real dragonfly wings(Okamoto et al 1996) and whole organism dragonflies ingliding flight (Wakeling and Ellington 1997a) have led tosurprising and sometimes inconsistent conclusions, and theseare discussed below.
Early wind tunnel experiments on scale-pleated models ofinsect wings conducted by Rees (1975b), Newman et al (1977)and Rudolph (1977) suggested that the pleated configurationhas no aerodynamic significance. Rees (1975b) and Rudolph(1977) both concluded that fluid flowing over the pleated airfoilbecomes trapped between the folds where it either becomesstagnant or rotates slowly, resulting in the pleated airfoilfunctioning as a streamlined airfoil. The only advantage of thepleated airfoil over the technical airfoils as noted by Rudolph(1977) was that it delayed flow separation at higher anglesof attack, and a stall did not occur abruptly. For Newmanet al (1977), the pleats have no aerodynamic significance, andthe main contributors to the enhanced lift are attributed to thespurs, or microscopic hair-like features, and serrations foundon the leading edge. These microscopic features lie within theboundary layer as they are of the order of micrometers, andcan potentially serve to trip the flow to enhance the transitionto turbulent flow.
However, these conclusions are in contrast to those ofBuckholz (1986) who tested a pleated wing model at Rec =1500 and concluded that the pleated configuration increaseslift. Wakeling and Ellington (1997a) also come to thesame conclusion when filming free gliding dragonflies andconducting wind tunnel experiments on their wings at aReynolds number ranging from 700 to 2400. CLmax recordedfor free gliding dragonflies was 0.93 and 1.07 when tested ina wind tunnel environment. Wakeling and Ellington (1997a)stated that the enhanced lift produced by dragonflies is notattributed to the Reynolds number, the aspect ratio or the wingarea, but rather a surface feature, mainly the corrugations foundin dragonflies.
Other comprehensive wind tunnel experiments on pleatedairfoils compared to technical airfoils were conducted byOkamoto et al (1996) and Kesel (2000). Okamoto et al(1996) conducted several detailed experiments to investigatethe aerodynamic characteristics of dragonfly wings andmodel wings at a Reynolds number ranging from 11 000 to15 000. Their experiments consisted of force and momentmeasurements in a horizontal wind tunnel, auto-rotationalflights in a vertical wind tunnel and gliding flight in stillair. The effects of thickness, camber, pleats and leading edgesharpness were all tested using various models to examinethe lift curve slope, maximum lift coefficient, minimum dragcoefficient and lift-to-drag ratio. From their experiments, athinner flat plate with camber and a sharp leading edge isthe profile that provides the best lift at these low Reynoldsnumbers. The tests also indicated that the pleated plateoutperformed the flat plate at all angles of attack. Theorientation of the leading edge of the pleated plate had asignificant effect on the lift generated at high angles of attack.Okamoto et al (1996) concluded that a downward facing
2
Bioinsp. Biomim. 3 (2008) 026004 A Vargas et al
leading edge had a much better performance than an upwardfacing leading edge. Experimental tests on actual dragonflywings from an Anax parthenope julius produced a CLmax of1.05, which was higher than that produced by streamlinedairfoils.
Kesel (2000) extracted three cross-sections at differentpositions along the span of a wing of an Aeschna cyanea todevelop the pleated models. The aerodynamic performanceof the pleated models was compared to its correspondingprofiled airfoil at a chord Reynolds number of 10 000, and theresults showed that the pleated airfoils generated higher liftthan the profiled airfoils. Pressure measurements performedon a model that represented the front portion of a pleatedairfoil showed that a net negative pressure sufficient toproduce lift occurred only at angles of attack greater than0◦. However, unlike Okamoto et al (1996), Kesel (2000)revealed that the orientation of the leading edge does not havean effect in enhancing the lift production. As with the earlyflow visualization experiments, Kesel (2000) noticed trappedvortices present in the folds that serve to change the effectiveprofile of the airfoil. Yet, according to Kesel (2000), it isthe camber found in dragonfly wings that is preserved eventhough trapped vortices are present in the folds. Kesel (2000)stated that an increase in lift did not arise by simply placinguniform or randomly spaced corrugations along the chord ofan airfoil (Buckholz 1986); rather the airfoil must be finelytuned, a function innate to nature.
The pleated wing provides a structural benefit, allowingfor a low mass yet stiff structure, but the question remainsas to what precisely is the effect of the pleated structureon the wing aerodynamics. With the advent of micro-aerialvehicles (MAVs), it has become clear that there is much thatcan be learned from insect flight that could be translatedinto engineered systems. For fixed wing MAVs, wings thatsimultaneously provide a superior aerodynamic performanceand structural robustness are critical. Thus, if it is found thatthe pleats have an aerodynamic benefit, then such wings couldbe candidates for micro-aerial vehicles and this is the primarymotivation for the current computational study.
The objective of the current research is to use numericalsimulations to examine the aerodynamic performance ofa pleated airfoil inspired from a cross-section of theforewing of a dragonfly (Aeshna cyanea). In order toprovide some perspective for the performance of the pleatedairfoil, simulations are performed of flow past its smoothedcounterpart (profiled airfoil), and a flat plate in glidingflight, at chord Reynolds numbers ranging from 500 to10 000, and angles of attack ranging from 0◦ to 10◦. Theseparameter ranges are relevant for both dragonflies and micro-aerial vehicles. Past experimental studies (Buckholz, 1986,Okamoto et al 1996, Kesel, 2000) have found no intrinsicthree-dimensional effects at these low Reynolds numbers.Thus, 2D simulations are implemented in this study toencompass a relatively wide range of the parameter spacenecessary to draw some general conclusions regarding pleatedairfoils. It should be noted that all computational studies ofthe dragonfly wing performance to date (Gustafson and Leben1991, Wang 2000, Mittal et al 2002, Lentink and Gerritsma
2003, Isogai et al 2004, Sun and Lan 2004) have focusedon flapping flight and have employed wing models which aresmooth.
2. Numerical method
The solver used in the current investigation employs aCartesian grid method wherein flow past immersed complexgeometries can be simulated on non-body conformal Cartesiangrids (Najjar and Mittal 2003, Mittal et al 2004, 2007, Donget al 2006). In addition to these references, further detailsregarding immersed boundary methods can be found in Ye et al(1999), Udaykumar et al (2001), Mittal and Iaccarino (2005).Here we provide a brief overview of the current method.
2.1. Governing equations
The equations governing the flow in the numerical solver arethe time-dependent, viscous incompressible Navier–Stokesequations. The momentum and continuity equations are asfollows:
∂ui
∂xi
= 0 (1)
∂ui
∂t+
∂(uiuj )
∂xj
= − 1
ρ
∂P
∂xi
+ ν∂
∂xj
(∂ui
∂xj
), (2)
where the indices, i = 1, 2, 3, represent the x-, y- andz-directions, respectively, and the velocity components u1, u2
and u3 correspond to u, v and w respectively. The equations arenon-dimensionalized with the appropriate length and velocityscales, in this case the airfoil chord and freestream velocity.Hence, the tensor equations in (2) are written as
∂ui
∂t+
∂(uiuj )
∂xj
= −∂P
∂xi
+1
Re
∂2ui
∂xj ∂xj
, (3)
where Re corresponds to the Reynolds number.The non-dimensional form of the Navier–Stokes
equations is discretized using a cell-centered, collocated(non-staggered) arrangement where all variables (i.e. velocitycomponents and pressure) are located at the same physicallocation. The equations are integrated in time using thefractional step method (Chorin 1967). In the first sub-step of this method, a modified momentum equation issolved and an intermediate velocity is obtained. A second-order Adams–Bashforth scheme is implemented for theconvective terms, while the diffusion terms are discretizedwith an implicit Crank–Nicolson technique which eliminatesthe viscous stability constraint. The second step of thefractional step method is the solution of a pressure correctionequation by solving a Poisson equation. A Neumann boundarycondition is implemented on this pressure correction step atall boundaries. The Poisson equation, being the most time-consuming part of the solution algorithm, is solved witha flexible and efficient geometric multi-grid algorithm witha flexible semi-coarsening strategy (Schaffer 1998, Piquetand Vasseur 2000) which employs a Gauss–Siedel line-SOR(successive overrelaxation) smoother. Performance tests ofthe multi-grid method have been carried out by Bozkurttaset al (2005).
3
Bioinsp. Biomim. 3 (2008) 026004 A Vargas et al
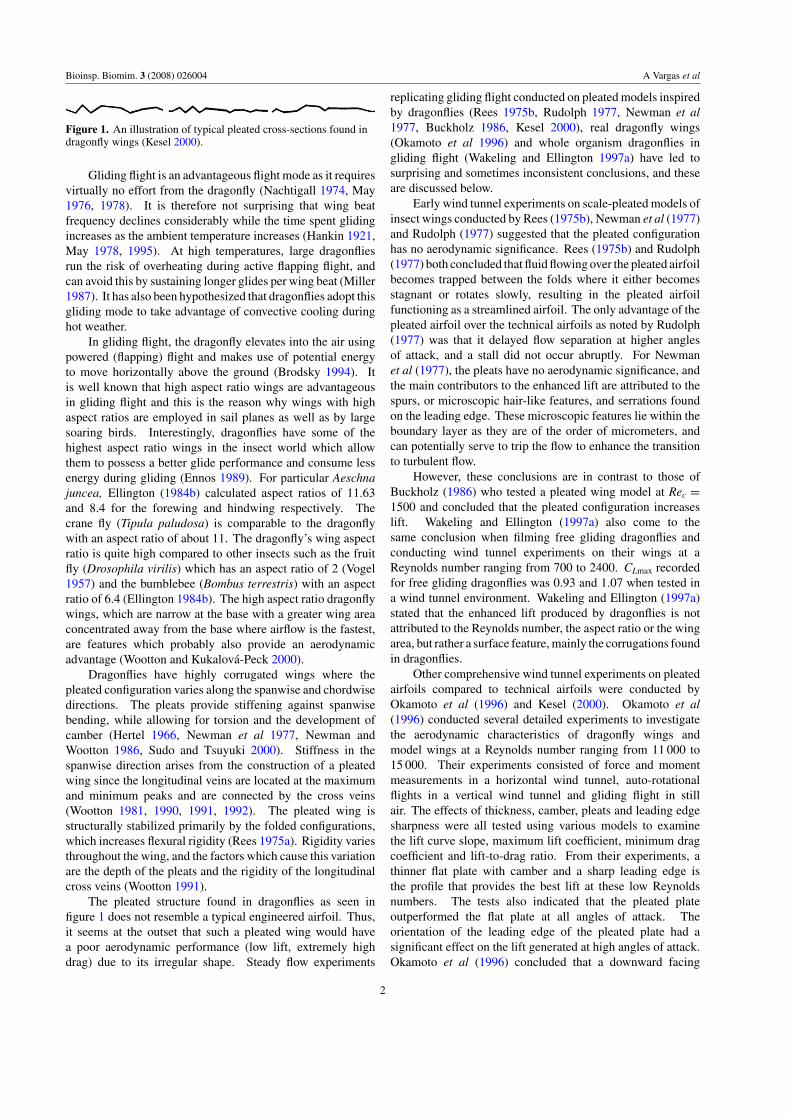
Figure 2. A typical two-dimensional, non-uniform Cartesian grid with prescribed boundary conditions used in the numerical simulations.The airfoils are placed inside the clustered region which contains high grid resolution of dimensions lcrx and lcry representing the lengths inthe x- and y-directions respectively.
The basic concept of the current immersed boundarymethod is to compute the flow variables for the ghostcells (GC), such that boundary conditions on the immersedboundary in the vicinity of the ghost cells are satisfied whilepreserving second-order accuracy. Ghost cells are those cellswhose centers lie inside the immersed body and have at leastone neighboring cell which lies outside the immersed body.The process begins by generating a non-conformal Cartesiangrid followed by the specification of the immersed boundary,which comprise a number of densely spaced marker pointsconnected by linear segments. A procedure that identifies thefluid cells, solid cells and ghost cells is then implemented.
2.2. Boundary conditions
The two-dimensional domains implemented in the currentstudy consist of four boundary conditions located at left, right,top and bottom of the computational domain, as shown infigure 2. A constant inflow velocity (U∞) of unity normal tothe boundary was imposed on the left side of the domain, andthe right edge of the domain was set to an outflow boundarywhere the gradient values are set to zero. A Dirichlet boundarycondition was applied to the top and bottom boundaries witha u-velocity equal to U∞ and the v-velocity component wasset to zero. For this reason, the top and bottom boundariesmust be set to a large distance away from the immersed bodyto minimize the effects of the boundary condition on the flownear the geometry.
2.3. Validation case
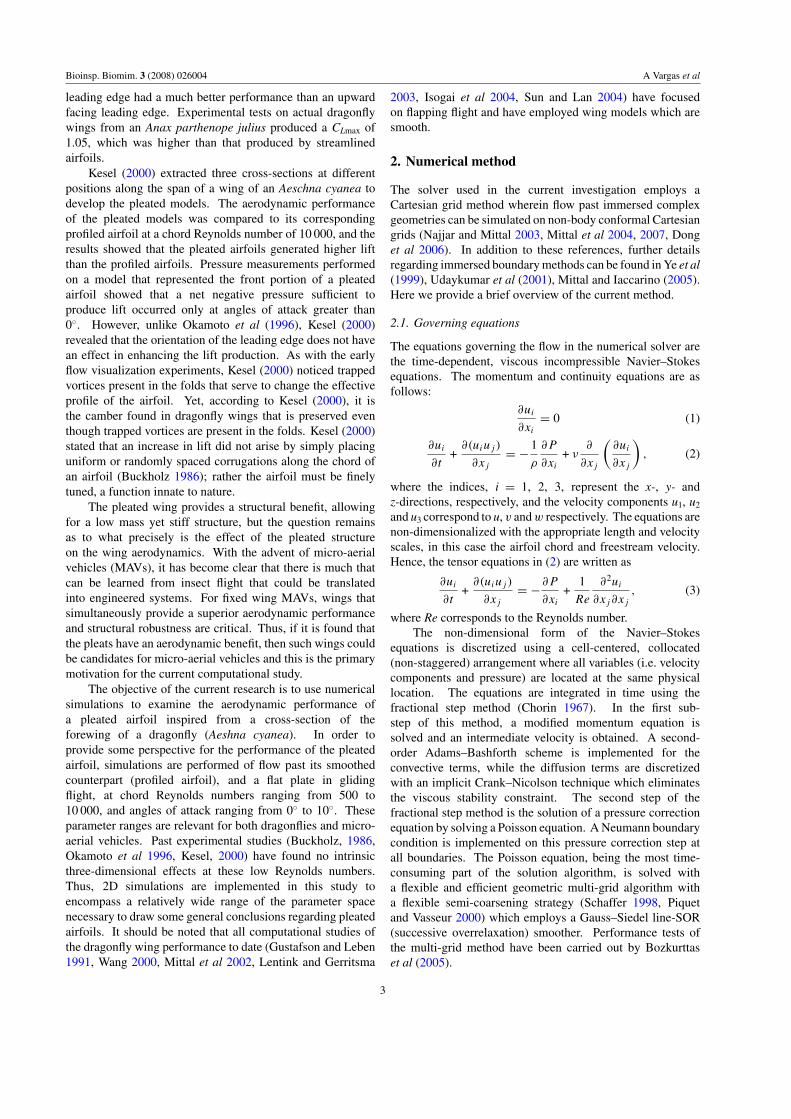
In order to validate the current numerical solver, simulations offlow past a NACA 0008 airfoil were performed and comparedto the published results of Kunz and Kroo (2001). Fourvalidation cases were conducted using a NACA 0008 airfoilat angles of attack of 0 and 4◦ with chord Reynolds numbers(Rec) of 2000 and 6000. The simulations were performed on a926 × 211 (Nx × Ny) non-uniform Cartesian grid with domainsizes of 6.5c × 3.5c and 12.0c × 9.0c for the 0 and 4◦ angle-of-attack cases respectively. The computational domain usedin the validation case at α = 4◦ is shown in figure 3. The
Figure 3. Computational domain with a non-uniform Cartesian gridof 926 × 211 used in the validation case of a NACA 0008 airfoil at4◦ with Reynolds numbers of 2000 and 6000.
domain dimensions and grid sizes were based on a sequenceof simulations, which examined the effect of these factors onthe results (Vargas 2006).
The results of interest in this particular validation casewere the lift and drag coefficients at the two angles of attack.The numerical results displayed in table 1 are time-averagedlift and drag values averaged from a non-dimensionless time,tU∞/c, between 5 and 20 and between 10 and 20 for the airfoilsat α = 0◦ and 4◦ respectively. Table 1 shows a near-zero liftcoefficient obtained numerically as expected for the NACA0008 airfoil at an α = 0◦, while the difference in the dragcoefficient is no more than 3.5%, which is an acceptable value.A lesser percentage difference was obtained at α = 4◦, in whichCL and CD varied no more than 1.15% for Rec = 2000 and 6000.Overall, the numerical results are in good agreement with thoseobtained by Kunz and Kroo (2001) for both angles of attack
4
Bioinsp. Biomim. 3 (2008) 026004 A Vargas et al
Table 1. Comparison of the numerical CL and CD with the results from Kunz and Kroo (2001) for NACA 0008 at α = 0◦ and 4◦ with Rec =2000 and 6000.
α = 0◦ α = 4◦
Rec = 2000 Rec = 6000 Rec = 2000 Rec = 6000
CL CD CL CD CL CD CL CD
Numerical results 0.0005 0.0785 0.0003 0.0441 0.2732 0.0812 0.2396 0.0469Kunz and Kroo (2001) – 0.0760 – 0.0426 0.2719 0.2369 0.2369 0.0465Percentage difference – 3.28% – 3.50% 0.48% 0.99% 1.15% 0.82%
(a)
(b)
(c)
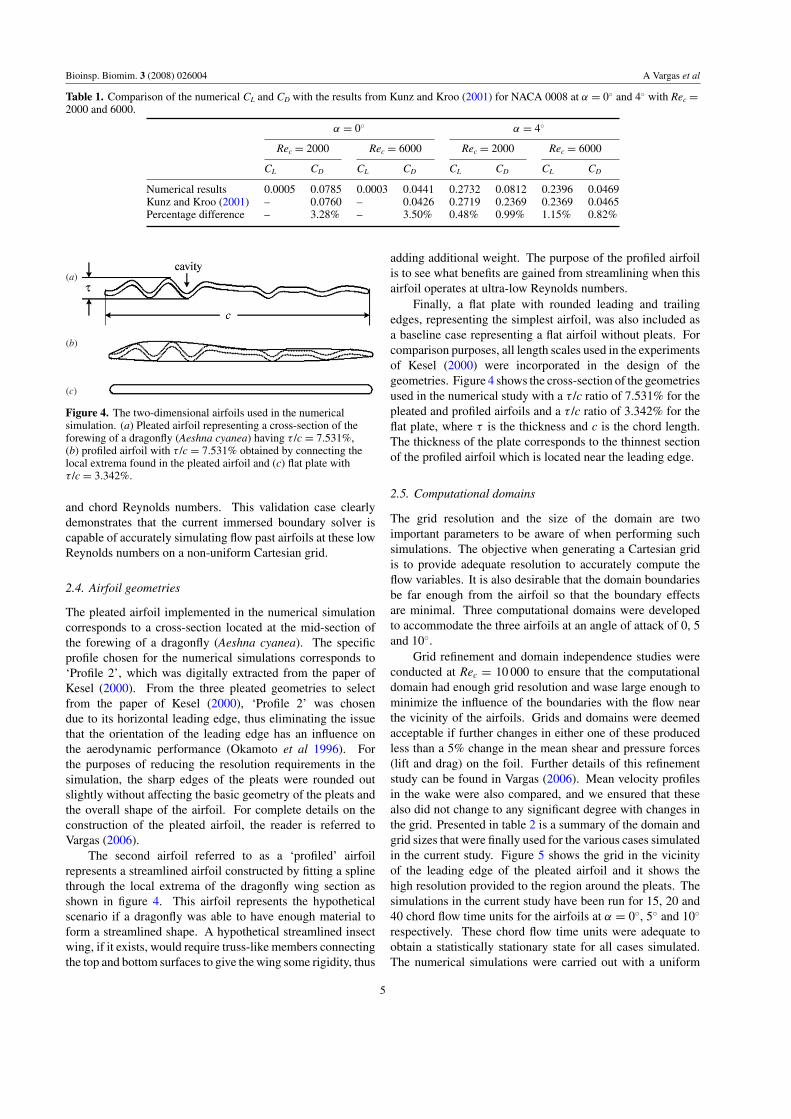
Figure 4. The two-dimensional airfoils used in the numericalsimulation. (a) Pleated airfoil representing a cross-section of theforewing of a dragonfly (Aeshna cyanea) having τ /c = 7.531%,(b) profiled airfoil with τ /c = 7.531% obtained by connecting thelocal extrema found in the pleated airfoil and (c) flat plate withτ /c = 3.342%.
and chord Reynolds numbers. This validation case clearlydemonstrates that the current immersed boundary solver iscapable of accurately simulating flow past airfoils at these lowReynolds numbers on a non-uniform Cartesian grid.
2.4. Airfoil geometries
The pleated airfoil implemented in the numerical simulationcorresponds to a cross-section located at the mid-section ofthe forewing of a dragonfly (Aeshna cyanea). The specificprofile chosen for the numerical simulations corresponds to‘Profile 2’, which was digitally extracted from the paper ofKesel (2000). From the three pleated geometries to selectfrom the paper of Kesel (2000), ‘Profile 2’ was chosendue to its horizontal leading edge, thus eliminating the issuethat the orientation of the leading edge has an influence onthe aerodynamic performance (Okamoto et al 1996). Forthe purposes of reducing the resolution requirements in thesimulation, the sharp edges of the pleats were rounded outslightly without affecting the basic geometry of the pleats andthe overall shape of the airfoil. For complete details on theconstruction of the pleated airfoil, the reader is referred toVargas (2006).
The second airfoil referred to as a ‘profiled’ airfoilrepresents a streamlined airfoil constructed by fitting a splinethrough the local extrema of the dragonfly wing section asshown in figure 4. This airfoil represents the hypotheticalscenario if a dragonfly was able to have enough material toform a streamlined shape. A hypothetical streamlined insectwing, if it exists, would require truss-like members connectingthe top and bottom surfaces to give the wing some rigidity, thus
adding additional weight. The purpose of the profiled airfoilis to see what benefits are gained from streamlining when thisairfoil operates at ultra-low Reynolds numbers.
Finally, a flat plate with rounded leading and trailingedges, representing the simplest airfoil, was also included asa baseline case representing a flat airfoil without pleats. Forcomparison purposes, all length scales used in the experimentsof Kesel (2000) were incorporated in the design of thegeometries. Figure 4 shows the cross-section of the geometriesused in the numerical study with a τ /c ratio of 7.531% for thepleated and profiled airfoils and a τ /c ratio of 3.342% for theflat plate, where τ is the thickness and c is the chord length.The thickness of the plate corresponds to the thinnest sectionof the profiled airfoil which is located near the leading edge.
2.5. Computational domains
The grid resolution and the size of the domain are twoimportant parameters to be aware of when performing suchsimulations. The objective when generating a Cartesian gridis to provide adequate resolution to accurately compute theflow variables. It is also desirable that the domain boundariesbe far enough from the airfoil so that the boundary effectsare minimal. Three computational domains were developedto accommodate the three airfoils at an angle of attack of 0, 5and 10◦.
Grid refinement and domain independence studies wereconducted at Rec = 10 000 to ensure that the computationaldomain had enough grid resolution and wase large enough tominimize the influence of the boundaries with the flow nearthe vicinity of the airfoils. Grids and domains were deemedacceptable if further changes in either one of these producedless than a 5% change in the mean shear and pressure forces(lift and drag) on the foil. Further details of this refinementstudy can be found in Vargas (2006). Mean velocity profilesin the wake were also compared, and we ensured that thesealso did not change to any significant degree with changes inthe grid. Presented in table 2 is a summary of the domain andgrid sizes that were finally used for the various cases simulatedin the current study. Figure 5 shows the grid in the vicinityof the leading edge of the pleated airfoil and it shows thehigh resolution provided to the region around the pleats. Thesimulations in the current study have been run for 15, 20 and40 chord flow time units for the airfoils at α = 0◦, 5◦ and 10◦
respectively. These chord flow time units were adequate toobtain a statistically stationary state for all cases simulated.The numerical simulations were carried out with a uniform
5
Bioinsp. Biomim. 3 (2008) 026004 A Vargas et al
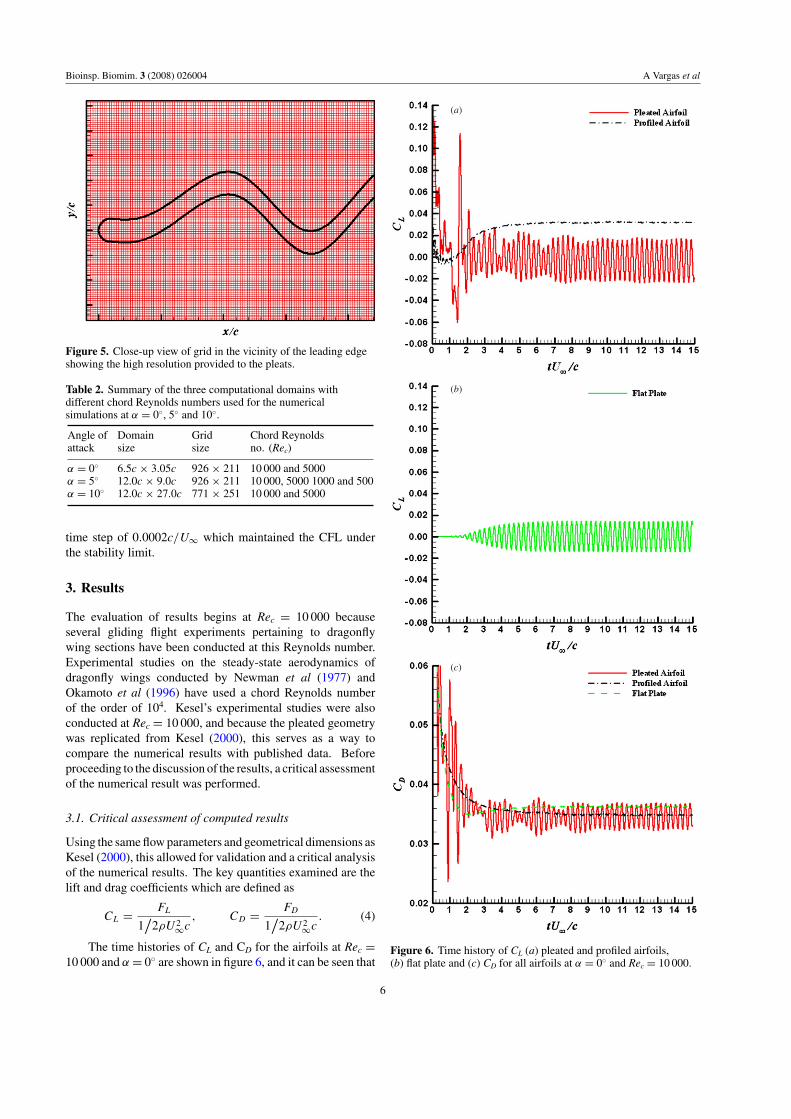
Figure 5. Close-up view of grid in the vicinity of the leading edgeshowing the high resolution provided to the pleats.
Table 2. Summary of the three computational domains withdifferent chord Reynolds numbers used for the numericalsimulations at α = 0◦, 5◦ and 10◦.
Angle of Domain Grid Chord Reynoldsattack size size no. (Rec)
α = 0◦ 6.5c × 3.05c 926 × 211 10 000 and 5000α = 5◦ 12.0c × 9.0c 926 × 211 10 000, 5000 1000 and 500α = 10◦ 12.0c × 27.0c 771 × 251 10 000 and 5000
time step of 0.0002c/U∞ which maintained the CFL underthe stability limit.
3. Results
The evaluation of results begins at Rec = 10 000 becauseseveral gliding flight experiments pertaining to dragonflywing sections have been conducted at this Reynolds number.Experimental studies on the steady-state aerodynamics ofdragonfly wings conducted by Newman et al (1977) andOkamoto et al (1996) have used a chord Reynolds numberof the order of 104. Kesel’s experimental studies were alsoconducted at Rec = 10 000, and because the pleated geometrywas replicated from Kesel (2000), this serves as a way tocompare the numerical results with published data. Beforeproceeding to the discussion of the results, a critical assessmentof the numerical result was performed.
3.1. Critical assessment of computed results
Using the same flow parameters and geometrical dimensions asKesel (2000), this allowed for validation and a critical analysisof the numerical results. The key quantities examined are thelift and drag coefficients which are defined as
CL = FL
1/
2ρU 2∞c, CD = FD
1/
2ρU 2∞c. (4)
The time histories of CL and CD for the airfoils at Rec =10 000 and α = 0◦ are shown in figure 6, and it can be seen that
(a)
(b)
(c)
Figure 6. Time history of CL (a) pleated and profiled airfoils,(b) flat plate and (c) CD for all airfoils at α = 0◦ and Rec = 10 000.
6
Bioinsp. Biomim. 3 (2008) 026004 A Vargas et al
(a) (b)
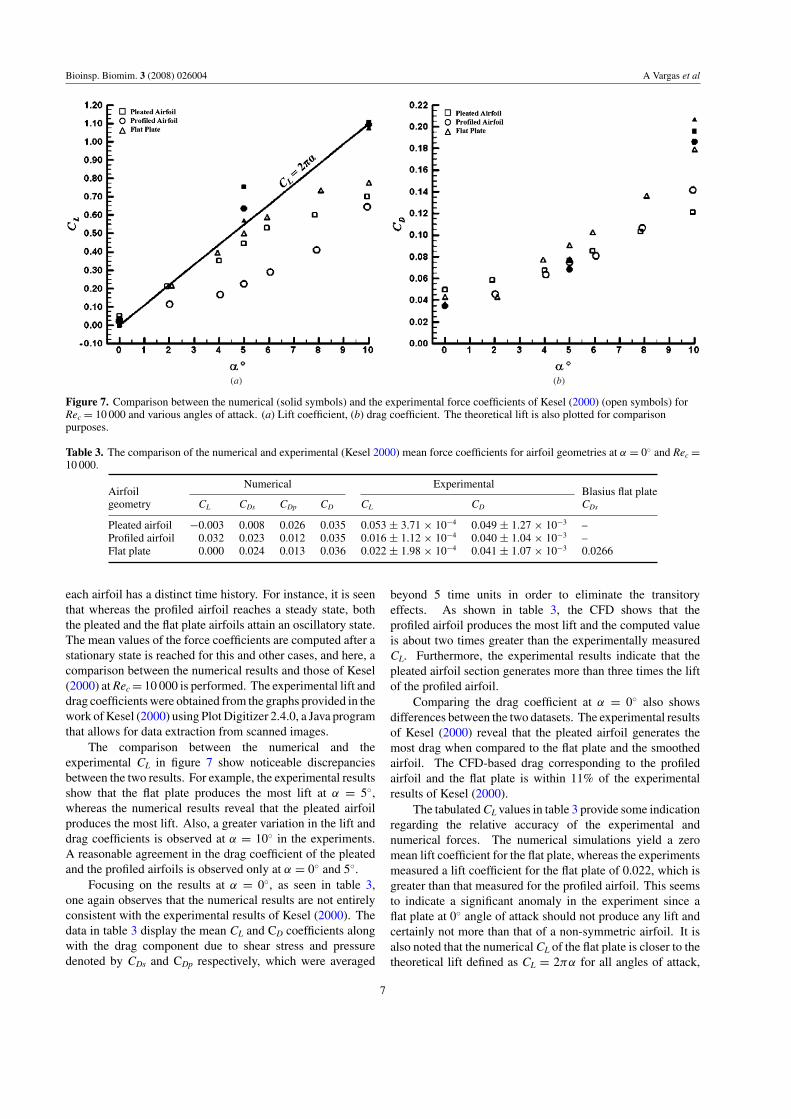
Figure 7. Comparison between the numerical (solid symbols) and the experimental force coefficients of Kesel (2000) (open symbols) forRec = 10 000 and various angles of attack. (a) Lift coefficient, (b) drag coefficient. The theoretical lift is also plotted for comparisonpurposes.
Table 3. The comparison of the numerical and experimental (Kesel 2000) mean force coefficients for airfoil geometries at α = 0◦ and Rec =10 000.
Numerical ExperimentalAirfoil Blasius flat plategeometry CL CDs CDp CD CL CD CDs
Pleated airfoil −0.003 0.008 0.026 0.035 0.053 ± 3.71 × 10⁻⁴ 0.049 ± 1.27 × 10⁻³ –Profiled airfoil 0.032 0.023 0.012 0.035 0.016 ± 1.12 × 10⁻⁴ 0.040 ± 1.04 × 10⁻³ –Flat plate 0.000 0.024 0.013 0.036 0.022 ± 1.98 × 10⁻⁴ 0.041 ± 1.07 × 10⁻³ 0.0266
each airfoil has a distinct time history. For instance, it is seenthat whereas the profiled airfoil reaches a steady state, boththe pleated and the flat plate airfoils attain an oscillatory state.The mean values of the force coefficients are computed after astationary state is reached for this and other cases, and here, acomparison between the numerical results and those of Kesel(2000) at Rec = 10 000 is performed. The experimental lift anddrag coefficients were obtained from the graphs provided in thework of Kesel (2000) using Plot Digitizer 2.4.0, a Java programthat allows for data extraction from scanned images.
The comparison between the numerical and theexperimental CL in figure 7 show noticeable discrepanciesbetween the two results. For example, the experimental resultsshow that the flat plate produces the most lift at α = 5◦,whereas the numerical results reveal that the pleated airfoilproduces the most lift. Also, a greater variation in the lift anddrag coefficients is observed at α = 10◦ in the experiments.A reasonable agreement in the drag coefficient of the pleatedand the profiled airfoils is observed only at α = 0◦ and 5◦.
Focusing on the results at α = 0◦, as seen in table 3,one again observes that the numerical results are not entirelyconsistent with the experimental results of Kesel (2000). Thedata in table 3 display the mean CL and CD coefficients alongwith the drag component due to shear stress and pressuredenoted by CDs and CDp respectively, which were averaged
beyond 5 time units in order to eliminate the transitoryeffects. As shown in table 3, the CFD shows that theprofiled airfoil produces the most lift and the computed valueis about two times greater than the experimentally measuredCL. Furthermore, the experimental results indicate that thepleated airfoil section generates more than three times the liftof the profiled airfoil.
Comparing the drag coefficient at α = 0◦ also showsdifferences between the two datasets. The experimental resultsof Kesel (2000) reveal that the pleated airfoil generates themost drag when compared to the flat plate and the smoothedairfoil. The CFD-based drag corresponding to the profiledairfoil and the flat plate is within 11% of the experimentalresults of Kesel (2000).
The tabulated CL values in table 3 provide some indicationregarding the relative accuracy of the experimental andnumerical forces. The numerical simulations yield a zeromean lift coefficient for the flat plate, whereas the experimentsmeasured a lift coefficient for the flat plate of 0.022, which isgreater than that measured for the profiled airfoil. This seemsto indicate a significant anomaly in the experiment since aflat plate at 0◦ angle of attack should not produce any lift andcertainly not more than that of a non-symmetric airfoil. It isalso noted that the numerical CL of the flat plate is closer to thetheoretical lift defined as CL = 2πα for all angles of attack,
7

Bioinsp. Biomim. 3 (2008) 026004 A Vargas et al
Table 4. Comparison between the theoretical and numerical skinfriction, where the theoretical cds was obtained using the Blasiussolution for a flat plate, CDs = 2.656/
√Rec, at various chord
Reynolds numbers.
Chord Reynolds Theoretical Numerical Percentagenumber CDs CDs difference
10 000 0.0266 0.0236 11.12%5000 0.0376 0.0339 9.64%1000 0.0840 0.0879 4.65%
whereas the experimental lift varies significantly from thisvalue. This in our view indicates that the experimental resultsare significantly modified by end effects from the tunnel wallsand that this effect becomes even more pronounced at higherangles of attack.
Another analysis used to further verify the numericalresults is to compare the numerical skin friction or shear dragdefined as CDs = ∫
(τs, ·n) ds of the flat plate to the Blasiussolution for a flat plate which assumes a thin plate of infinitelength at zero incidence. Comparing the numerical skinfriction to the Blasius solution at zero incidence with Rec =10 000 results in an 11.12% lower value, as seen in table 4.This arises from the fact that the flat plate has rounded leadingand trailing edges where shear stress contribution to dragis lower. It should be pointed out that when the chordReynolds number is lowered and no flow separation occursat the trailing edge, the percentage difference between thenumerical and theoretical skin friction reduces to less than 5%,demonstrating the accuracy and reliability of the numericalresults. As mentioned before, extensive grid refinement anddomain independence studies were conducted such that theresults were independent of the grid density and domain size.Also, the validation case performed on the NACA 0008 airfoilyields a percentage difference in CD and CL of less than 3.5%for all angles of attack and chord Reynolds numbers that weretested.
The above critical assessment of the numerical resultsalong with the grid and domain refinement studies providessufficient confidence in the fidelity of the numericalsimulations. Possible sources of inaccuracy in the experimentsof Kesel (2000) could be the difficulty of measuring smallforces at a low chord Reynolds number and of maintaininga two-dimensional flow across the wind tunnel model, giventhat their model had a spanwise aspect ratio of only 3.469. Nodiscussions of these aspects have been provided in the paperof Kesel (2000).
Table 5. Comparison of the mean aerodynamic coefficients for airfoil geometries at α = 0◦ at Rec = 10 000 and 5000. The averages werecomputed beyond 5 time units in order to eliminate the transient portion of the flow.
Rec = 10 000 Rec = 5000Airfoilgeometry CL CDs CDp CD CL CDs CDp CD
Pleated airfoil −0.003 0.008 0.026 0.035 0.008 0.015 0.032 0.047Profiled airfoil 0.032 0.023 0.012 0.035 0.028 0.035 0.015 0.050Flat plate 0.000 0.024 0.013 0.036 0.000 0.034 0.014 0.047
3.2. Effect of angle of attack
The first step in understanding the aerodynamic performanceof the pleated airfoil was to perform an analysis at α = 0◦ at achord Reynolds number of 10 000 and 5000. The mean forcecoefficients pertaining to their respective airfoil geometry aretabulated in table 5. At zero incidence, the drag productionleads to some interesting observations. As expected, theoverall drag coefficient of each airfoil increases as Rec isdecreased because the viscous effects are more dominant atlower Reynolds numbers which cause the skin friction tobe the major contributor to the overall drag. The profiledairfoil and flat plate produce shear drag that constitutes about65% and 71% of the total drag at Rec = 10 000 and 5000,respectively. In contrast, the shear drag for the pleated airfoilis about 24% and 31% of the total drag at Rec = 10 000 and5000 correspondingly.
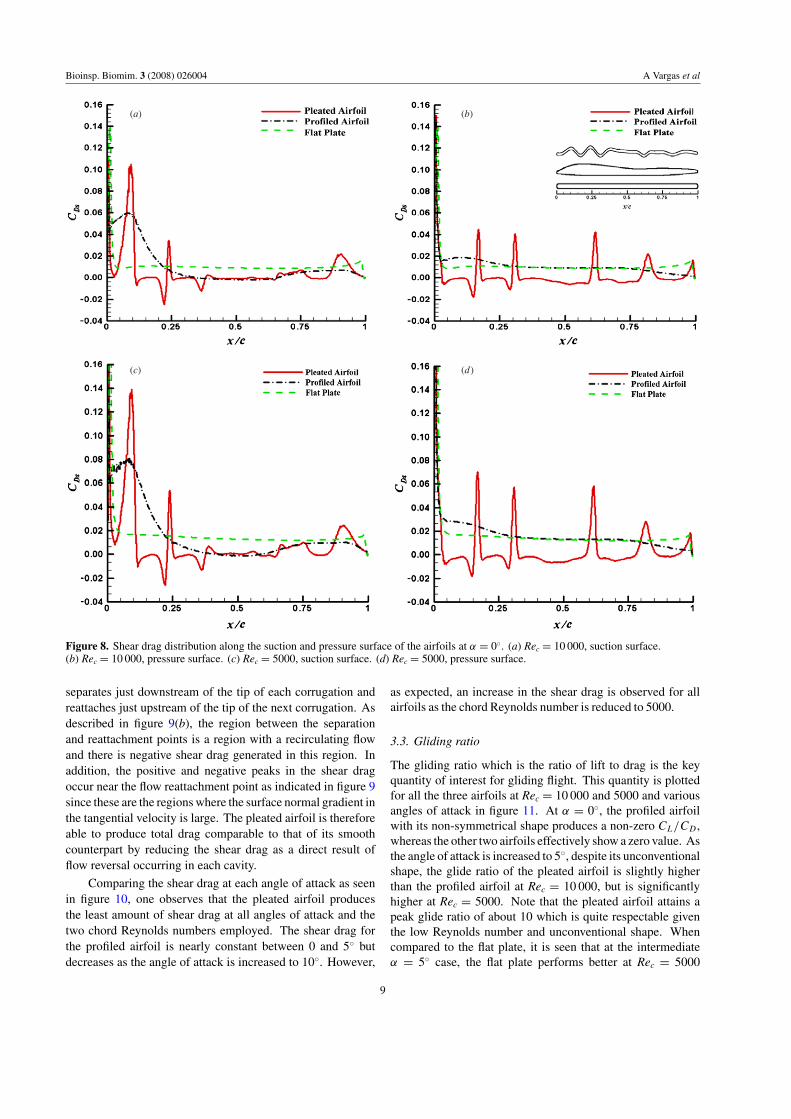
To understand the effect of the airfoil shape on shear drag,the shear drag distribution on the suction and pressure side ofthe airfoils at Rec = 10 000 and 5000 are plotted in figure 8.As seen in the figure, the shear drag distribution at both Rec
follows the same trend with all airfoils experiencing a sharpincrease in shear drag at the leading edge. The profiled airfoilgenerates most of its shear drag on the upper surface nearthe leading edge between 0.0 � x/c � 0.25 and there isanother region of some shear drag production near the trailingedge between 0.65 � x/c � 1.0. In contrast, the flat plategenerates nearly even drag over its entire suction and pressuresurface.
The shear drag distribution of the pleated airfoil issignificantly more complex due to the complexity of the airfoilgeometry. In particular, there are large peaks of shear dragthat are located near the peak of the corrugations on both thesuction and the pressure surface. However, most interestingis the appearance of large regions of negative shear drag inthe intervening spaces. Thus, it becomes clear that the lowshear drag of the pleated airfoil is due to these negative shearregions which negate the effect of positive shear drag in theother regions of the foil.
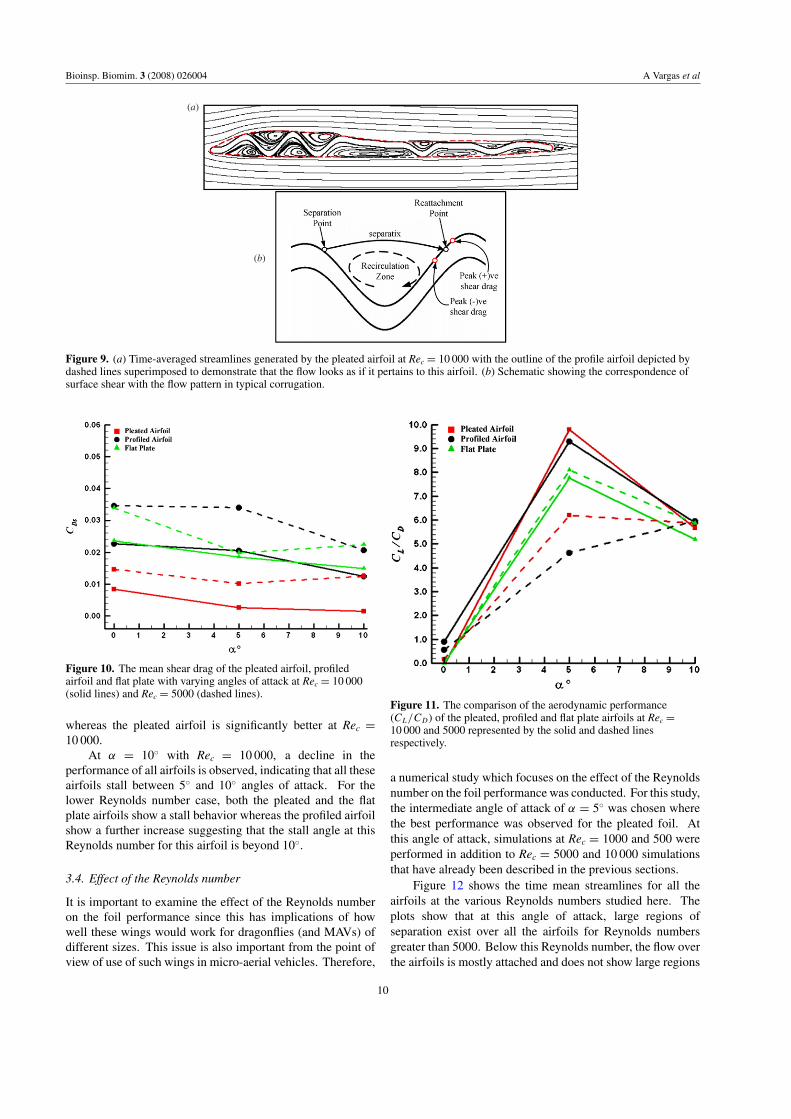
The origin of the positive and negative peaks in theshear drag becomes clear by examining the mean flow overthe airfoil. As seen in figure 9(a), the long time-averagedstreamlines on the pleated airfoil at Rec = 10 000 show thatthere is a trapped vortex in each cavity which causes theoverall flow to resemble that past the profiled airfoil. Thisobservation is in line with the experimental studies of Rees(1975b), Newman et al (1977) and Rudolph (1977), whohypothesized that flow would behave in such a way due tothe trapped vortex inside each cavity. Furthermore, the flow
8
Bioinsp. Biomim. 3 (2008) 026004 A Vargas et al
(a) (b)
(c) (d)
Figure 8. Shear drag distribution along the suction and pressure surface of the airfoils at α = 0◦. (a) Rec = 10 000, suction surface.(b) Rec = 10 000, pressure surface. (c) Rec = 5000, suction surface. (d) Rec = 5000, pressure surface.
separates just downstream of the tip of each corrugation andreattaches just upstream of the tip of the next corrugation. Asdescribed in figure 9(b), the region between the separationand reattachment points is a region with a recirculating flowand there is negative shear drag generated in this region. Inaddition, the positive and negative peaks in the shear dragoccur near the flow reattachment point as indicated in figure 9since these are the regions where the surface normal gradient inthe tangential velocity is large. The pleated airfoil is thereforeable to produce total drag comparable to that of its smoothcounterpart by reducing the shear drag as a direct result offlow reversal occurring in each cavity.
Comparing the shear drag at each angle of attack as seenin figure 10, one observes that the pleated airfoil producesthe least amount of shear drag at all angles of attack and thetwo chord Reynolds numbers employed. The shear drag forthe profiled airfoil is nearly constant between 0 and 5◦ butdecreases as the angle of attack is increased to 10◦. However,
as expected, an increase in the shear drag is observed for allairfoils as the chord Reynolds number is reduced to 5000.
3.3. Gliding ratio
The gliding ratio which is the ratio of lift to drag is the keyquantity of interest for gliding flight. This quantity is plottedfor all the three airfoils at Rec = 10 000 and 5000 and variousangles of attack in figure 11. At α = 0◦, the profiled airfoilwith its non-symmetrical shape produces a non-zero CL/CD ,whereas the other two airfoils effectively show a zero value. Asthe angle of attack is increased to 5◦, despite its unconventionalshape, the glide ratio of the pleated airfoil is slightly higherthan the profiled airfoil at Rec = 10 000, but is significantlyhigher at Rec = 5000. Note that the pleated airfoil attains apeak glide ratio of about 10 which is quite respectable giventhe low Reynolds number and unconventional shape. Whencompared to the flat plate, it is seen that at the intermediateα = 5◦ case, the flat plate performs better at Rec = 5000
9
Bioinsp. Biomim. 3 (2008) 026004 A Vargas et al
(a)
(b)
Figure 9. (a) Time-averaged streamlines generated by the pleated airfoil at Rec = 10 000 with the outline of the profile airfoil depicted bydashed lines superimposed to demonstrate that the flow looks as if it pertains to this airfoil. (b) Schematic showing the correspondence ofsurface shear with the flow pattern in typical corrugation.
Figure 10. The mean shear drag of the pleated airfoil, profiledairfoil and flat plate with varying angles of attack at Rec = 10 000(solid lines) and Rec = 5000 (dashed lines).
whereas the pleated airfoil is significantly better at Rec =10 000.
At α = 10◦ with Rec = 10 000, a decline in theperformance of all airfoils is observed, indicating that all theseairfoils stall between 5◦ and 10◦ angles of attack. For thelower Reynolds number case, both the pleated and the flatplate airfoils show a stall behavior whereas the profiled airfoilshow a further increase suggesting that the stall angle at thisReynolds number for this airfoil is beyond 10◦.
3.4. Effect of the Reynolds number
It is important to examine the effect of the Reynolds numberon the foil performance since this has implications of howwell these wings would work for dragonflies (and MAVs) ofdifferent sizes. This issue is also important from the point ofview of use of such wings in micro-aerial vehicles. Therefore,
Figure 11. The comparison of the aerodynamic performance(CL/CD) of the pleated, profiled and flat plate airfoils at Rec =10 000 and 5000 represented by the solid and dashed linesrespectively.
a numerical study which focuses on the effect of the Reynoldsnumber on the foil performance was conducted. For this study,the intermediate angle of attack of α = 5◦ was chosen wherethe best performance was observed for the pleated foil. Atthis angle of attack, simulations at Rec = 1000 and 500 wereperformed in addition to Rec = 5000 and 10 000 simulationsthat have already been described in the previous sections.
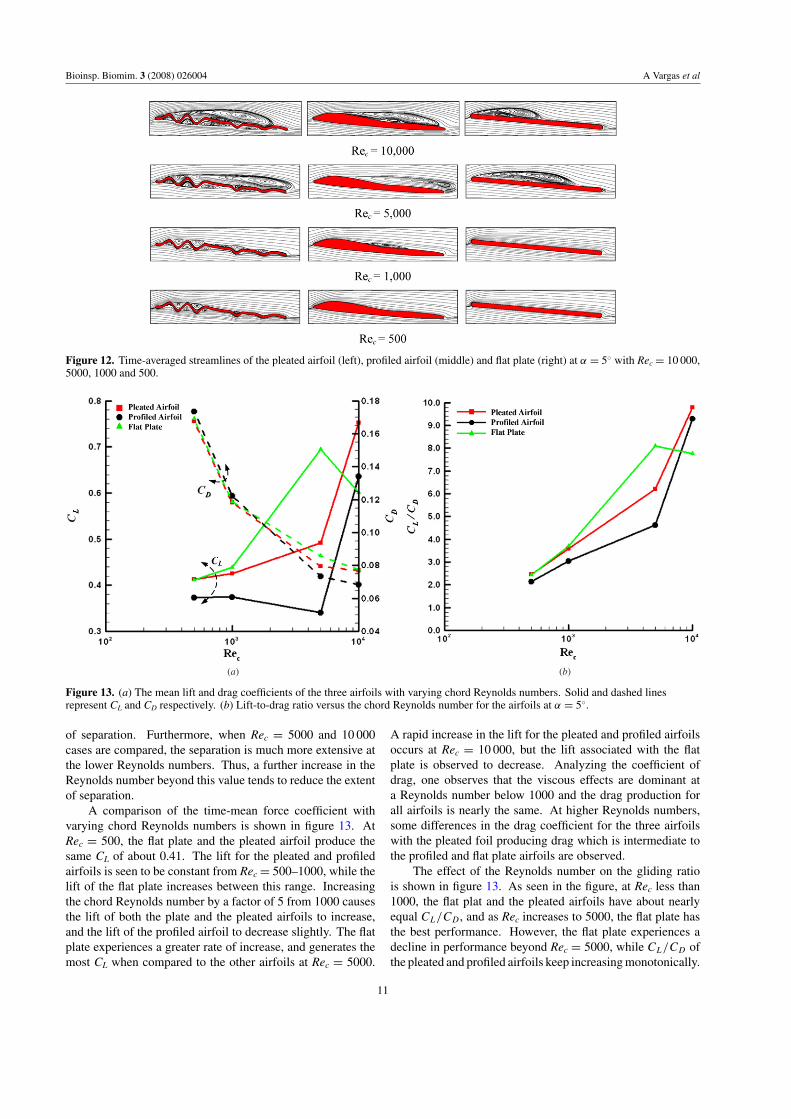
Figure 12 shows the time mean streamlines for all theairfoils at the various Reynolds numbers studied here. Theplots show that at this angle of attack, large regions ofseparation exist over all the airfoils for Reynolds numbersgreater than 5000. Below this Reynolds number, the flow overthe airfoils is mostly attached and does not show large regions
10
Bioinsp. Biomim. 3 (2008) 026004 A Vargas et al
Figure 12. Time-averaged streamlines of the pleated airfoil (left), profiled airfoil (middle) and flat plate (right) at α = 5◦ with Rec = 10 000,5000, 1000 and 500.
(a) (b)
Figure 13. (a) The mean lift and drag coefficients of the three airfoils with varying chord Reynolds numbers. Solid and dashed linesrepresent CL and CD respectively. (b) Lift-to-drag ratio versus the chord Reynolds number for the airfoils at α = 5◦.
of separation. Furthermore, when Rec = 5000 and 10 000cases are compared, the separation is much more extensive atthe lower Reynolds numbers. Thus, a further increase in theReynolds number beyond this value tends to reduce the extentof separation.
A comparison of the time-mean force coefficient withvarying chord Reynolds numbers is shown in figure 13. AtRec = 500, the flat plate and the pleated airfoil produce thesame CL of about 0.41. The lift for the pleated and profiledairfoils is seen to be constant from Rec = 500–1000, while thelift of the flat plate increases between this range. Increasingthe chord Reynolds number by a factor of 5 from 1000 causesthe lift of both the plate and the pleated airfoils to increase,and the lift of the profiled airfoil to decrease slightly. The flatplate experiences a greater rate of increase, and generates themost CL when compared to the other airfoils at Rec = 5000.
A rapid increase in the lift for the pleated and profiled airfoilsoccurs at Rec = 10 000, but the lift associated with the flatplate is observed to decrease. Analyzing the coefficient ofdrag, one observes that the viscous effects are dominant ata Reynolds number below 1000 and the drag production forall airfoils is nearly the same. At higher Reynolds numbers,some differences in the drag coefficient for the three airfoilswith the pleated foil producing drag which is intermediate tothe profiled and flat plate airfoils are observed.
The effect of the Reynolds number on the gliding ratiois shown in figure 13. As seen in the figure, at Rec less than1000, the flat plat and the pleated airfoils have about nearlyequal CL/CD , and as Rec increases to 5000, the flat plate hasthe best performance. However, the flat plate experiences adecline in performance beyond Rec = 5000, while CL/CD ofthe pleated and profiled airfoils keep increasing monotonically.
11
Bioinsp. Biomim. 3 (2008) 026004 A Vargas et al
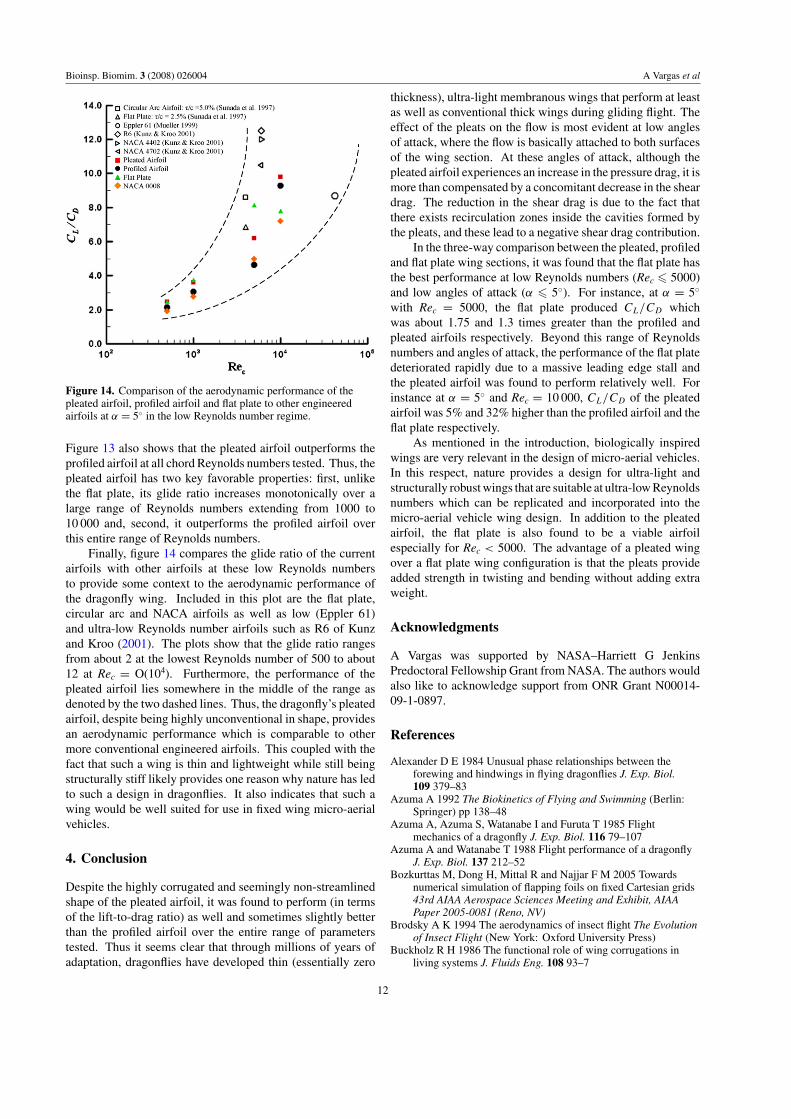
Figure 14. Comparison of the aerodynamic performance of thepleated airfoil, profiled airfoil and flat plate to other engineeredairfoils at α = 5◦ in the low Reynolds number regime.
Figure 13 also shows that the pleated airfoil outperforms theprofiled airfoil at all chord Reynolds numbers tested. Thus, thepleated airfoil has two key favorable properties: first, unlikethe flat plate, its glide ratio increases monotonically over alarge range of Reynolds numbers extending from 1000 to10 000 and, second, it outperforms the profiled airfoil overthis entire range of Reynolds numbers.
Finally, figure 14 compares the glide ratio of the currentairfoils with other airfoils at these low Reynolds numbersto provide some context to the aerodynamic performance ofthe dragonfly wing. Included in this plot are the flat plate,circular arc and NACA airfoils as well as low (Eppler 61)and ultra-low Reynolds number airfoils such as R6 of Kunzand Kroo (2001). The plots show that the glide ratio rangesfrom about 2 at the lowest Reynolds number of 500 to about12 at Rec = O(104). Furthermore, the performance of thepleated airfoil lies somewhere in the middle of the range asdenoted by the two dashed lines. Thus, the dragonfly’s pleatedairfoil, despite being highly unconventional in shape, providesan aerodynamic performance which is comparable to othermore conventional engineered airfoils. This coupled with thefact that such a wing is thin and lightweight while still beingstructurally stiff likely provides one reason why nature has ledto such a design in dragonflies. It also indicates that such awing would be well suited for use in fixed wing micro-aerialvehicles.
4. Conclusion
Despite the highly corrugated and seemingly non-streamlinedshape of the pleated airfoil, it was found to perform (in termsof the lift-to-drag ratio) as well and sometimes slightly betterthan the profiled airfoil over the entire range of parameterstested. Thus it seems clear that through millions of years ofadaptation, dragonflies have developed thin (essentially zero
thickness), ultra-light membranous wings that perform at leastas well as conventional thick wings during gliding flight. Theeffect of the pleats on the flow is most evident at low anglesof attack, where the flow is basically attached to both surfacesof the wing section. At these angles of attack, although thepleated airfoil experiences an increase in the pressure drag, it ismore than compensated by a concomitant decrease in the sheardrag. The reduction in the shear drag is due to the fact thatthere exists recirculation zones inside the cavities formed bythe pleats, and these lead to a negative shear drag contribution.
In the three-way comparison between the pleated, profiledand flat plate wing sections, it was found that the flat plate hasthe best performance at low Reynolds numbers (Rec � 5000)and low angles of attack (α � 5◦). For instance, at α = 5◦
with Rec = 5000, the flat plate produced CL/CD whichwas about 1.75 and 1.3 times greater than the profiled andpleated airfoils respectively. Beyond this range of Reynoldsnumbers and angles of attack, the performance of the flat platedeteriorated rapidly due to a massive leading edge stall andthe pleated airfoil was found to perform relatively well. Forinstance at α = 5◦ and Rec = 10 000, CL/CD of the pleatedairfoil was 5% and 32% higher than the profiled airfoil and theflat plate respectively.
As mentioned in the introduction, biologically inspiredwings are very relevant in the design of micro-aerial vehicles.In this respect, nature provides a design for ultra-light andstructurally robust wings that are suitable at ultra-low Reynoldsnumbers which can be replicated and incorporated into themicro-aerial vehicle wing design. In addition to the pleatedairfoil, the flat plate is also found to be a viable airfoilespecially for Rec < 5000. The advantage of a pleated wingover a flat plate wing configuration is that the pleats provideadded strength in twisting and bending without adding extraweight.
Acknowledgments
A Vargas was supported by NASA–Harriett G JenkinsPredoctoral Fellowship Grant from NASA. The authors wouldalso like to acknowledge support from ONR Grant N00014-09-1-0897.
References
Alexander D E 1984 Unusual phase relationships between theforewing and hindwings in flying dragonflies J. Exp. Biol.109 379–83
Azuma A 1992 The Biokinetics of Flying and Swimming (Berlin:Springer) pp 138–48
Azuma A, Azuma S, Watanabe I and Furuta T 1985 Flightmechanics of a dragonfly J. Exp. Biol. 116 79–107
Azuma A and Watanabe T 1988 Flight performance of a dragonflyJ. Exp. Biol. 137 212–52
Bozkurttas M, Dong H, Mittal R and Najjar F M 2005 Towardsnumerical simulation of flapping foils on fixed Cartesian grids43rd AIAA Aerospace Sciences Meeting and Exhibit, AIAAPaper 2005-0081 (Reno, NV)
Brodsky A K 1994 The aerodynamics of insect flight The Evolutionof Insect Flight (New York: Oxford University Press)
Buckholz R H 1986 The functional role of wing corrugations inliving systems J. Fluids Eng. 108 93–7
12
Bioinsp. Biomim. 3 (2008) 026004 A Vargas et al
Chorin A J 1967 A numerical method for solving incompressibleviscous flow problems J. Comput. Phys. 2 12–26
Dong H, Mittal R and Najjar F M 2006 Wake topology andhydrodynamic performance of low aspect-ratio flapping foilsJ. Fluid Mech. 566 309–43
Ellington C P 1984a The aerodynamic of hovering insect flight: I.The quasi-steady analysis Phil. Trans. R. Soc. 305 1–15
Ellington C P 1984b The aerodynamics of hovering insect flight: II.Morphological parameter Phil. Trans. R. Soc. 305 17–40
Ennos A R 1989 The effect on the optimal shapes of gliding insectand seeds J. Zool. 219 61–9
Gustafson K and Leben R 1991 Computations of dragonflyaerodynamics Comput. Phys. Commun. 65 121–32
Hankin M A 1921 The soaring flight of dragonflies Proc. Camb.Phil. Soc. 20 460–5
Hertel H 1966 Structure, Form, Movement (New York: Reinhold)pp 78–87
Isogai K, Fujishiro S, Saitoh T, Yamamoto M, Yamasaki M andMatsubara M 2004 Unsteady three-dimensional viscous flowsimulation of a dragonfly hovering AIAA J. 42 2053–9
Kesel A B 2000 Aerodynamic characteristics of dragonfly wingsections compared with technical aerofoil J. Exp. Biol.203 3125–35
Kunz P J and Kroo H 2001 Analysis and design of airfoils for use atultra-low Reynolds numbers Fixed and Flapping WingAerodynamics for Micro Air Vehicles Applications: Progress inAstronautics and Aeronautics vol 195 ed T J Mueller (Virginia:AIAA) pp 35–60
Lentink D and Gerritsma M 2003 Influence of airfoil shape onperformance in insect flight 33rd AIAA Fluid Dynamics Conf.and Exhibition, AIAA Paper 2003-3447 (Orlando, FL)
May M L 1976 Thermoregulation and adaptation to temperature indragonflies (Odonata: Anisoptera) Ecol. Monogr. 46 1–32
May M L 1978 Thermal adaptation to temperature in dragonfliesOdonatologica 7 27–47
May M L 1995 Dependence of flight behavior and heat productionon air temperature in the green darner dragonfly Anax junius(Odonata: Aeshnidae) J. Exp. Biol. 198 2385–92
Miller P L 1987 Dragonflies (New York: Cambridge UniversityPress)
Mittal R, Dong H, Bozkurttas M, Najjar F M, Vargas A andvon Loebbecke A 2008 A versatile sharp interface immersedboundary method for incompressible flows with complexboundaries J. Comput. Phys. 227 4825–52
Mittal R and Iaccarino G 2005 Immersed boundary methods Annu.Rev. Fluid Mech. 37 239–61
Mittal R, Najjar F M, Byrganhalli R, Seshadri V and Singh H 2004Simulation of complex biological flows and flow controlproblems on Cartesian grids 5th Int. Conf. on Advances inFluid Mechanics (Lisbon, Portugal)
Mittal R, Utturkar Y and Udaykumar H S 2002 Computationalmodeling and analysis of biomimetic flight mechanisms40th AIAA Aerospace Sciences Meeting and Exhibition AIAAPaper 2002-0865 (Reno, NV)
Mueller T J 1999 Aerodynamic measurements at low reynoldsnumber for fixed wing micro-air vehicles RTO AVT/VKISpecial Course on Development and Operation of UAVs forMilitary and Civil Applications (VKI Belgium)
Nachtigall W 1974 Insects in Flight—A Glimpse Behind the Scenesin Biophysical Research (London: Allen and Unwin)
Najjar F M and Mittal R 2003 Simulations of complex flows andfluid-structure interaction problems on fixed Cartesian gridsProc. of FEDSM’03 4th ASME—JSME Joint FluidsEngineering Conf. FEDSM 2003-45577 (Honolulu, HI)
Newman B G, Savage S B and Schouella D 1977 Model test on awing section of a Aeschna dragonfly Scale Effects in AnimalLocomotion ed T J Pedley (London: Academic) pp 445–77
Newman D J S and Wootton R J 1986 An approach to the mechanicsof pleating in dragonfly wings J. Exp. Biol. 125 361–72
Okamoto M, Yasuda K and Azuma A 1996 Aerodynamiccharacteristics of the wings and body of a dragonfly J. Exp.Biol. 199 281–94
Piquet J and Vasseur X 2000 A nonstandard multigrid method withflexible multiple semi coarsening for the numerical solution ofthe pressure equation in a Navier–Stokes solver Numer.Algorithms 24 333–55
Rees C J C 1975a Form and function in corrugated insect wingsNature 256 200–3
Rees C J C 1975b Aerodynamic properties of an insect wing sectionand a smooth aerofoil compared Nature 258 141–2
Rudolph R 1977 Aerodynamic properties of Libellulaquadrimaculata L. (Anisoptera: Libelludidea), and the flowaround smooth and corrugated wing section models duringgliding flight Odonatologica 7 49–58
Ruppell G 1989 Kinematic analysis of symmetrical flightmaneuvers of odonata J. Exp. Biol. 144 13–42
Savage S B, Newman B G and Wong D T M 1979 The role ofvortices and unsteady effects during the hovering flight ofdragonflies J. Exp. Biol. 83 59–77
Schaffer S 1998 A semi coarsening multigrid method for ellipticpartial differential equations with highly discontinuous andanisotropic coefficients SIAM J. Sci. Comput. 20 228–42
Somps C and Luttges M 1985 Dragonfly flight: novel uses ofunsteady separated flow Science 228 1326–9
Sudo S and Tsuyuki K 2000 Wing morphology of some insectsJSME Int. J. C 43 895–900
Sun M and Lan L 2004 A computational study of the aerodynamicforces and power requirements of dragonfly (Aeschna juncea)hovering J. Exp. Biol. 207 1897–901
Sunada S, Sakaguchi A and Kawachi K 1997 Airfoil sectioncharacteristics at low Reynolds number J. Fluids Eng.119 129–35
Thomas A L R, Taylor G K, Srygley R B, Nudds R L andBomphrey R J 2004 Dragonfly flight: free-flight and tetheredflow visualization reveal a diverse array of unsteadylift-generation mechanisms, controlled primarily via angle ofattack J. Exp. Biol. 207 4299–323
Udaykumar H S, Mittal R, Rampunggoon P and Khanna A 2001 Asharp interface Cartesian grid method for simulating flows withcomplex moving boundaries J. Comput. Phys. 174 345–80
Vargas A 2006 Numerical investigation of the aerodynamiccharacteristics of a dragonfly wing section PhD DissertationThe George Washington University
Vogel S 1957 Flight in drosophila: III. Aerodynamic characteristicsof fly wing and wing models J. Exp. Biol. 46 431–43
Wakeling J M 1997 Odonatan wing and body morphologiesOdonatologica 26 35–52
Wakeling J M and Ellington C P 1997a Dragonfly flight: I. Glidingflight and steady-state aerodynamic forces J. Exp. Biol.200 543–56
Wakeling J M and Ellington C P 1997b Dragonfly flight: II.Velocity, acceleration, and kinematics of flapping flight J. Exp.Biol. 200 557–82
Wang Z J 2000 Two dimensional mechanism for insect hoveringPhys. Rev. Lett. 85 2216–19
Wootton R J 1981 Support and deformability in insect wingsJ. Zool. 193 447–68
Wootton R J 1990 The mechanical design of insect wings Sci.Am. 263 114–20
Wootton R J 1991 The functional morphology of the insect wings ofOdonata Adv. Odonatol. 5 153–69
Wootton R J 1992 Functional morphology of insect wings Annu.Rev. Entomol. 37 113–40
Wootton R J and Kukalova-Peck J 2000 Flight adaptations inPalaeozoic Palaeoptera (Insecta) Biol. Rev. 75 129–67
Ye T, Mittal R, Udaykumar H S and Shyy W 1999 An accurateCartesian grid method for viscous incompressible flows withcomplex immersed boundaries J. Comput. Phys. 156 209–40
13