optimizing uav aerodynamics with computational fluid dynamics · optimizing uav aerodynamics with...
TRANSCRIPT
Optimizing UAV Aerodynamics with Computational Fluid
Dynamics
Joao Nuno Dias [email protected]
Instituto Superior Tecnico, Universidade de Lisboa, Portugal
December 2016
Abstract
The purpose of this paper is to employ low subsonic aerodynamic theories, through CFD analysis,to optimize the main wing of a MALE UAV and achieve an increase in performance superior to10%. The configuration for the MALE UAV was provided by the Portuguese Air Force and ananalysis with the RANS equations, the Menter SST k − ω and the γ − Reθ models, at a Machnumber of 0.2 and a Reynolds number of 2.2 × 10⁶, is performed in order to evaluate the integralcoefficients. To determine the influence of the design parameters of wing tip devices, a sensibilitystudy in a 3D panel method is employed and confirmation of the results is done by analyzing thebest configurations with simulations in RANS. A grid refinement study is then executed to ensureaccuracy of the increases and estimate the exact numerical values for the engineering quantities.Results show that the panel method fails to achieve the desired precision in predicting the increasesin performance but allows a qualitative insight on the influence of the design parameters. RANS sim-ulations determine a 20% increase in L/D and a 30% increase in C
3/2L /CD from the cut-off configuration.
Keywords: Unmanned Aerial Vehicles, External Aerodynamics, Computational Fluid Dynamics,Wing Tip Devices, Sensitivity Study
1. Introduction
According to TEAL Group Corporation, the de-velopment in Unmanned Aerial Vehicles (UAV) inthe twenty-first century has been the most dynamicarea within the entire aerospace industry. The re-cent demand enforces manufacturers and their oper-ating partners to maximize the performance of suchplatforms. From the aerodynamic point of view,this maximization of performance is achieved by re-ducing drag and attentions have been directed to-wards the reduction of wing tip vorticity and there-fore lift-induce drag. [1]
The physics of the wing tip vortex in thenear-field is extremely complex as it is a three-dimensional and turbulent phenomena. Due to thepressure difference between the upper and lowersurface of the wing, a strong cross-flow is inducedand a wing tip vortex is formed. [2] The inclusionof wing tip devices has proven beneficial in reducingthis pressure gradient in airliners at high subsonicapplications and is now target of several studies todetermine the effects in low subsonic flows.
As described by Maughmer [3], early attemptson evaluating the influence of design parametersof winglets for low subsonic applications, at the
Pennsylvania State University, were performed us-ing trial-and-error approaches using flight testing.Ning and Kroo [4], at Stanford University, haveused multidisciplinary optimization techniques todetermine the effects of several tip designs and,in 2014, Panagiotou et al. [5] performed para-metric studies of the design parameters of wingletsfor a Medium-Altitude Long-Endurance UnmannedAerial Vehicles (MALE UAV) for the Hellenic AirForce.
Following this line of studies, this paper inte-grates a broader set of activities developed by thePortuguese Air Force, in collaboration with Insti-tuto Superior Tecnico, for the construction and op-timization of a MALE UAV prototype. Aiming atmaximizing the performance of this platform, thispaper sets out to explore the aerodynamic designof wing tip devices with Computational Fluid Dy-namics (CFD) tools in order to increase range andendurance in, at least, 10%.
2. Theoretical BackgroundEndurance and range are two concepts that, quiteoften, are misused and create confusion. While en-durance can be defined as the maximum time, rangeis the maximum distance an aircraft is airborne un-
1
der a certain flight condition without being refu-eled. [6] These concepts can be mathematically de-fined with the Breguet equations, commonly foundin the imperial unit system. These show that, forpropeller-driven aircrafts, range depends on L/D
ratio, whilst endurance depends on C3/2L /CD. Since
both performance coefficients depend on lift anddrag, maximizing them can be done wither by in-creasing lift or decreasing drag. The current paperfocuses on the second objective. [7]
The total drag of an airplane is frequently dividedin two components, parasite drag and lift-induceddrag. The parasite drag is all the drag that doesnot appear from the creation of lift and the vorticityshed into the wake. It contains the friction/form,interference and wake drag. The lift-induced drag,as the name suggests is the drag that is a result ofthe vorticity shed into the wake. [8] Even thoughparasite drag accounts for a very large part of thetotal aircraft drag, its reduction is the most difficultto accomplish and, in this paper, efforts will only bespent in reducing lift-induced drag.
In fact, reducing drag of this nature can beachieved through the reduction in the intensity ofthe wing tip vortex. The concept of eliminating alltrailing vorticity was first conceived by Lanchesterin 1897 when he proposed the inclusion of wing end-plates. [9] Following Lanchester’s theories, Whit-comb [10] developed the first winglet predicting thatthe lift-to-drag ratio would increase in about 9%.
Attempts on providing interpretations to the re-sults of Lanchester and Whitcomb was proposedby Gudmundsson [11]. In his interpretation, theshape of the wing tip distorts the flow field aroundthe wing, pushing the wing tip vortex closer or fur-ther away from the symmetry plane. This fact ex-plains the reason why a cut-off wing has better per-formance than a round tip wing. The reductionwitnessed in lift-induced drag with the inclusion ofwinglets and raked tips may be interpreted as anincrease in aspect ratio created by the translationof the vortex outward. The final drag coefficient isthen computed with the following equation.
CD = CD0+
C2L
π · (AR+ ∆AR) · e(1)
Results obtained by Gudmundsson [11] with thepotential flow theory show that the winglet and theraked tip are the most efficient wing tip deviceswhen reducing lift-induced drag.
Span extensions, winglets and C-wings weretested by Ning and Kroo [12] and results show that,for negative and zero pitching moments, C-wingsand winglets present a similar drag reduction withwinglets being slightly more efficient. For positivemoments about the aerodynamic center, C-wingsproduce better results.
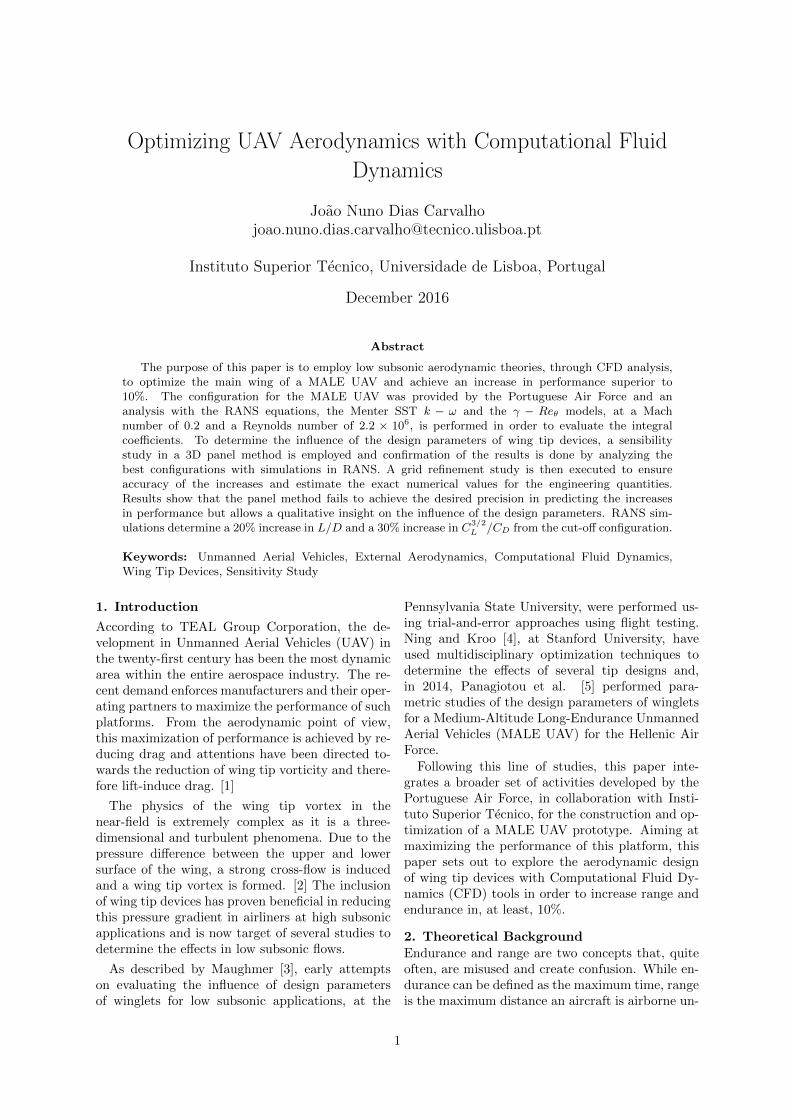
In very recent studies, it has been proven that anoptimized blended winglet in low subsonic flightscan increase the lift-to-drag ratio up to 16%. Thisgeometry is shown bellow in figure 1.
Figure 1: Schematics for a blended winglet. [5]
3. Mathematical Models
The physics of the airflow around an aircraft isa complex problem and an algebraic solution isachievable only for a very limited amount of scenar-ios. Two groups of mathematical models are usedin this paper, surface and volume models. The sur-face model employed is the aerodynamic potential-flow code, commonly known as panel method. Themethod based on the finite volume formulationare the Reynolds-Averaged Navier-Stokes (RANS)equations. A detailed description of these two mod-els is provided in next subsections.
3.1. Panel Method
Deriving from the equation of conservation of mass,the panel method is extremely useful when per-forming simple flow analysis on complex geometries.This method is often used when the flow can be ap-proximated by an inviscid and incompressible po-tential flow, providing results that are in agreementwith experimental results. [13](
1−M2∞)φxx + φyy + φzz = 0 (2)
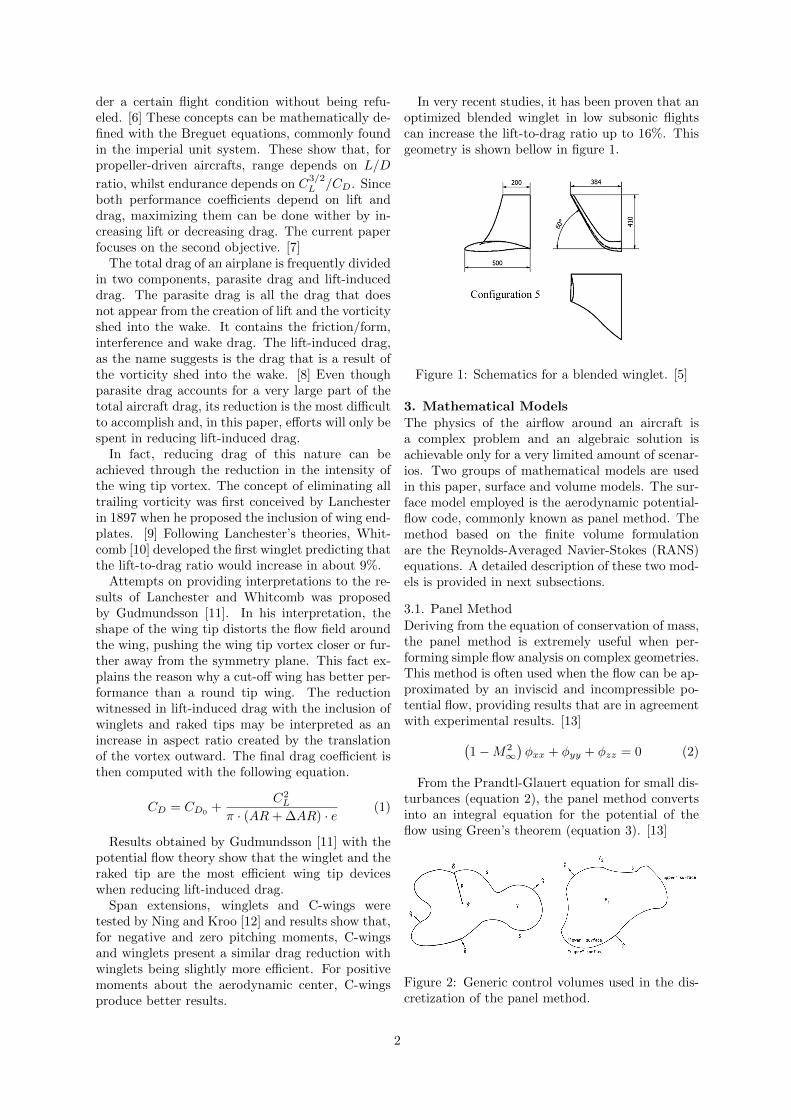
From the Prandtl-Glauert equation for small dis-turbances (equation 2), the panel method convertsinto an integral equation for the potential of theflow using Green’s theorem (equation 3). [13]
Figure 2: Generic control volumes used in the dis-cretization of the panel method.
2
If the generic control volumes present in figure 2are used in the discretization of the Prandtl-Glauertequation, one can arrive to the equation 3 for thepotential of the flow. [13]
φ (P ) = − 1
4π
∫∫S
[n · (∇φU −∇φL)
R−
− (φU − φL) · n · ∇ 1
R
]dSQ (3)
Equation 3 is applied to 2D quadrilateral panels,resultant of the discretization process, that coverboth the aircraft and its wake. Since the panelmethod only discretizes the geometry, it is less re-source consuming than the mathematical modelspresent in subsequent sections.[13]
3.2. Reynolds-Averaged Navier-Stokes – RANSThe RANS equations are obtained through theReynolds-averaged method, by assuming all un-steadiness in the Navier-Stokes equations is aver-aged. This is done by considering that the valueof a property is the sum of the mean value and afluctuation around it. Time-averaging is the com-mon approach for achieving the RANS equations,however, if the unsteady RANS equations are to beachieved, time-averaging is not an option and theensemble-averaging approach must be used. Thisprocess results in the averaged equations of conti-nuity and momentum, present in equations 4a and4b, in tensor notation. [14]
∂ (ρui)
∂xi= 0 (4a)
∂ (ρui)
∂t+
∂
∂xj
(ρuiuj + ρu′iu
′j
)= − ∂p
∂xi+
+∂
∂xj
[µ
(∂ui∂xj
+∂uj∂xi
)](4b)
Due to additional terms that are created with theaveraging of the equations, turbulence models areneeded to create a closed system of equations. [14]
For external CFD analysis with airfoils, the tur-bulence models that provide acceptable predictionsof the flow are the Spalart-Allmaras and the MenterSST k − ω models.
The Spalart-Allmaras is a turbulence model spe-cially designed for aeronautical cases. Weaknessesin the Spalart-Allmaras model have been witnessedin flows with massive separations, wakes with pres-sure gradients and free vortices. [15] This turbu-lence model is a one-equation model that couples,to the RANS equations, a partial differential equa-tion for the kinematic eddy-viscosity parameter, ν.The Menter SST k − ω is a variation of the Will-cox k − ω and the k − ε. This model employs the
k−ω proposed by Willcox near solid walls and takesadvantage of the robustness of the k − ε model inthe free-shear flow. [16] Since the flow is likely tohave both turbulent and laminar regions, transitionhas to be modeled. For this reason, the turbulencemodel employed in this paper is the Menter SSTk − ω coupled with the γ − Reθ transition model.This combination of models has been tested in sev-eral aeronautical cases and the results are in agree-ment with the available experimental results. Pre-diction of laminar separation bubbles and other sep-arations can be achieved with this model. [17]
For this reason the turbulence and transitionsmodels chosen for implementation on this paper arethe Menter SST k − ω and the γ −Reθ models.
4. Initial Configuration
The UAV provided by the Portuguese Air Forceis a propeller driven aircraft and has a twin-boompusher configuration, which is common for MALEUAVs. It is possible to see the provided geometryin figure 3. The given aircraft couldn’t be directlyused in a CFD software, since softwares of such na-ture require more detail than Computer Aided De-sign (CAD) softwares. Therefore, before import-ing in STAR-CCM+, it was necessary to model thegeometry in a CAD software and perform furtheroperations in STAR-CCM+.
In order to simplify the problem and reduce thecomputational effort and time spent on a CFD anal-ysis, the front landing gear and the rear section ofthe fuselage had to be intervened. Even thoughthe CFD software can perform an analysis with theoriginal geometry, these simplifications reduce themesh size with no considerable influence in the dy-namics of the flow or the integral coefficients. Withthe geometry simplified, it was necessary to pre-pare it the for the meshing process. In order to beable to mesh and simulate, it is necessary to cre-ate a closed region with no self-intersecting faces.For this effect, the Surface Wrapper operation wasperformed in STAR-CCM+.
In order to solve the RANS equations, the con-trol volume needs to be discretized. For this pur-pose one of three possible mesh types (structured,block-structured and unstructured) needs to be em-ployed. Most modern CFD codes solve all meshes asunstructured, even if they are structured or block-structured, keeping the connectivity matrix andsolving the equations using this matrix to deter-mine the neighbors of each cell. On the other hand,structured meshes can only be achieved for simplegeometries which are rarely found in real life appli-cations. Block-structured and unstructured meshescan be composed of tetrahedral, trimmed or poly-hedral cells. Prismatic layers are added in order tobetter predict the behavior of boundary layers near
3
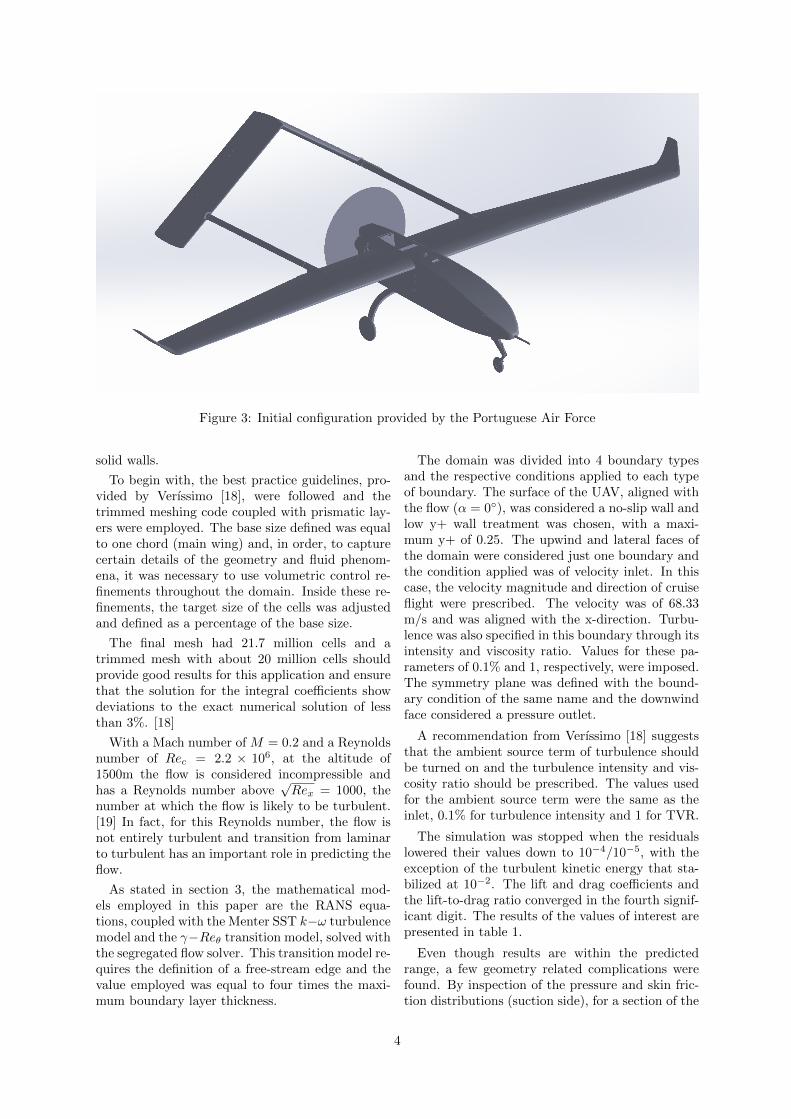
Figure 3: Initial configuration provided by the Portuguese Air Force
solid walls.
To begin with, the best practice guidelines, pro-vided by Verıssimo [18], were followed and thetrimmed meshing code coupled with prismatic lay-ers were employed. The base size defined was equalto one chord (main wing) and, in order, to capturecertain details of the geometry and fluid phenom-ena, it was necessary to use volumetric control re-finements throughout the domain. Inside these re-finements, the target size of the cells was adjustedand defined as a percentage of the base size.
The final mesh had 21.7 million cells and atrimmed mesh with about 20 million cells shouldprovide good results for this application and ensurethat the solution for the integral coefficients showdeviations to the exact numerical solution of lessthan 3%. [18]
With a Mach number of M = 0.2 and a Reynoldsnumber of Rec = 2.2 × 10⁶, at the altitude of1500m the flow is considered incompressible andhas a Reynolds number above
√Rex = 1000, the
number at which the flow is likely to be turbulent.[19] In fact, for this Reynolds number, the flow isnot entirely turbulent and transition from laminarto turbulent has an important role in predicting theflow.
As stated in section 3, the mathematical mod-els employed in this paper are the RANS equa-tions, coupled with the Menter SST k−ω turbulencemodel and the γ−Reθ transition model, solved withthe segregated flow solver. This transition model re-quires the definition of a free-stream edge and thevalue employed was equal to four times the maxi-mum boundary layer thickness.
The domain was divided into 4 boundary typesand the respective conditions applied to each typeof boundary. The surface of the UAV, aligned withthe flow (α = 0◦), was considered a no-slip wall andlow y+ wall treatment was chosen, with a maxi-mum y+ of 0.25. The upwind and lateral faces ofthe domain were considered just one boundary andthe condition applied was of velocity inlet. In thiscase, the velocity magnitude and direction of cruiseflight were prescribed. The velocity was of 68.33m/s and was aligned with the x-direction. Turbu-lence was also specified in this boundary through itsintensity and viscosity ratio. Values for these pa-rameters of 0.1% and 1, respectively, were imposed.The symmetry plane was defined with the bound-ary condition of the same name and the downwindface considered a pressure outlet.
A recommendation from Verıssimo [18] suggeststhat the ambient source term of turbulence shouldbe turned on and the turbulence intensity and vis-cosity ratio should be prescribed. The values usedfor the ambient source term were the same as theinlet, 0.1% for turbulence intensity and 1 for TVR.
The simulation was stopped when the residualslowered their values down to 10−4/10−5, with theexception of the turbulent kinetic energy that sta-bilized at 10−2. The lift and drag coefficients andthe lift-to-drag ratio converged in the fourth signif-icant digit. The results of the values of interest arepresented in table 1.
Even though results are within the predictedrange, a few geometry related complications werefound. By inspection of the pressure and skin fric-tion distributions (suction side), for a section of the
4
CL CD L/D C3/2L /CD
0.3078 0.02310 13.32 7.392
Table 1: Results for the aerodynamic coefficientsfor the initial configuration.
main wing (x/(b/2) = 74.4%), it is possible to ver-ify the existence of oscillations in the same loca-tions due to the lack of smoothness in the geometry.In fact, these oscillations are the result of a seriesof separations and reattachments created by sharpvariations in the airfoil’s geometry.
Figure 4: Pressure distributions (top) and skinfriction coefficient distributions (bottom) computedwith the Menter SST k−ω and the γ−Reθ models(blue) and the Spalart-Allmaras model (red).
This conclusion was achieved by performingsimulations with the Spalart-Allmaras turbulencemodel and observing the presence of the oscillationsin the exact same positions. It is possible to confirmthe statement presented in section 3 that this modelassumes a fully turbulent flow from the beginning,thus not modeling the transition.
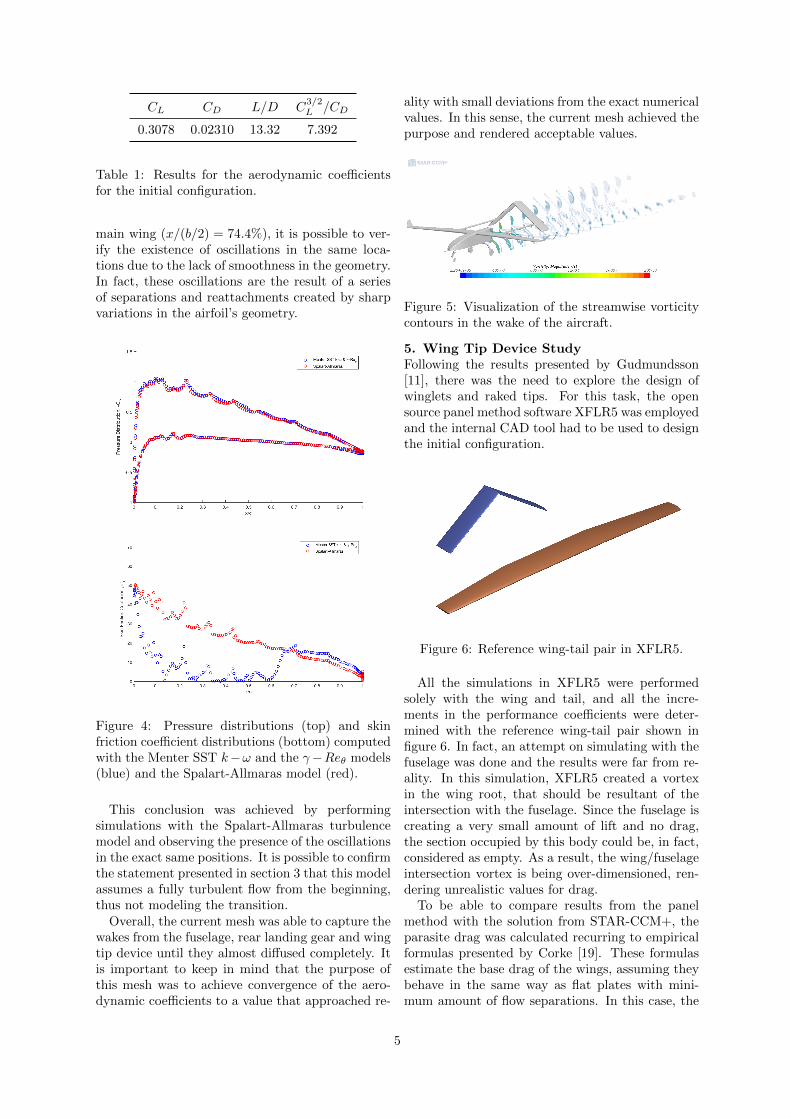
Overall, the current mesh was able to capture thewakes from the fuselage, rear landing gear and wingtip device until they almost diffused completely. Itis important to keep in mind that the purpose ofthis mesh was to achieve convergence of the aero-dynamic coefficients to a value that approached re-
ality with small deviations from the exact numericalvalues. In this sense, the current mesh achieved thepurpose and rendered acceptable values.
Figure 5: Visualization of the streamwise vorticitycontours in the wake of the aircraft.
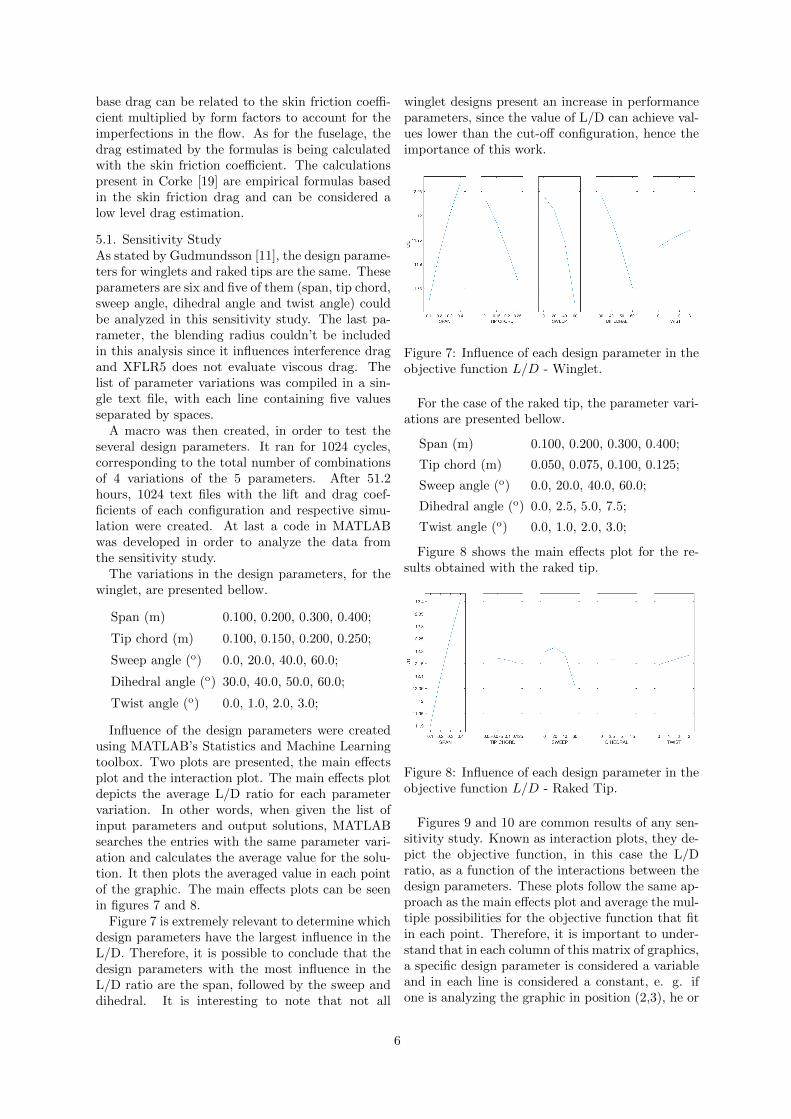
5. Wing Tip Device StudyFollowing the results presented by Gudmundsson[11], there was the need to explore the design ofwinglets and raked tips. For this task, the opensource panel method software XFLR5 was employedand the internal CAD tool had to be used to designthe initial configuration.
Figure 6: Reference wing-tail pair in XFLR5.
All the simulations in XFLR5 were performedsolely with the wing and tail, and all the incre-ments in the performance coefficients were deter-mined with the reference wing-tail pair shown infigure 6. In fact, an attempt on simulating with thefuselage was done and the results were far from re-ality. In this simulation, XFLR5 created a vortexin the wing root, that should be resultant of theintersection with the fuselage. Since the fuselage iscreating a very small amount of lift and no drag,the section occupied by this body could be, in fact,considered as empty. As a result, the wing/fuselageintersection vortex is being over-dimensioned, ren-dering unrealistic values for drag.
To be able to compare results from the panelmethod with the solution from STAR-CCM+, theparasite drag was calculated recurring to empiricalformulas presented by Corke [19]. These formulasestimate the base drag of the wings, assuming theybehave in the same way as flat plates with mini-mum amount of flow separations. In this case, the
5
base drag can be related to the skin friction coeffi-cient multiplied by form factors to account for theimperfections in the flow. As for the fuselage, thedrag estimated by the formulas is being calculatedwith the skin friction coefficient. The calculationspresent in Corke [19] are empirical formulas basedin the skin friction drag and can be considered alow level drag estimation.
5.1. Sensitivity StudyAs stated by Gudmundsson [11], the design parame-ters for winglets and raked tips are the same. Theseparameters are six and five of them (span, tip chord,sweep angle, dihedral angle and twist angle) couldbe analyzed in this sensitivity study. The last pa-rameter, the blending radius couldn’t be includedin this analysis since it influences interference dragand XFLR5 does not evaluate viscous drag. Thelist of parameter variations was compiled in a sin-gle text file, with each line containing five valuesseparated by spaces.
A macro was then created, in order to test theseveral design parameters. It ran for 1024 cycles,corresponding to the total number of combinationsof 4 variations of the 5 parameters. After 51.2hours, 1024 text files with the lift and drag coef-ficients of each configuration and respective simu-lation were created. At last a code in MATLABwas developed in order to analyze the data fromthe sensitivity study.
The variations in the design parameters, for thewinglet, are presented bellow.
Span (m) 0.100, 0.200, 0.300, 0.400;
Tip chord (m) 0.100, 0.150, 0.200, 0.250;
Sweep angle (o) 0.0, 20.0, 40.0, 60.0;
Dihedral angle (o) 30.0, 40.0, 50.0, 60.0;
Twist angle (o) 0.0, 1.0, 2.0, 3.0;
Influence of the design parameters were createdusing MATLAB’s Statistics and Machine Learningtoolbox. Two plots are presented, the main effectsplot and the interaction plot. The main effects plotdepicts the average L/D ratio for each parametervariation. In other words, when given the list ofinput parameters and output solutions, MATLABsearches the entries with the same parameter vari-ation and calculates the average value for the solu-tion. It then plots the averaged value in each pointof the graphic. The main effects plots can be seenin figures 7 and 8.
Figure 7 is extremely relevant to determine whichdesign parameters have the largest influence in theL/D. Therefore, it is possible to conclude that thedesign parameters with the most influence in theL/D ratio are the span, followed by the sweep anddihedral. It is interesting to note that not all
winglet designs present an increase in performanceparameters, since the value of L/D can achieve val-ues lower than the cut-off configuration, hence theimportance of this work.
Figure 7: Influence of each design parameter in theobjective function L/D - Winglet.
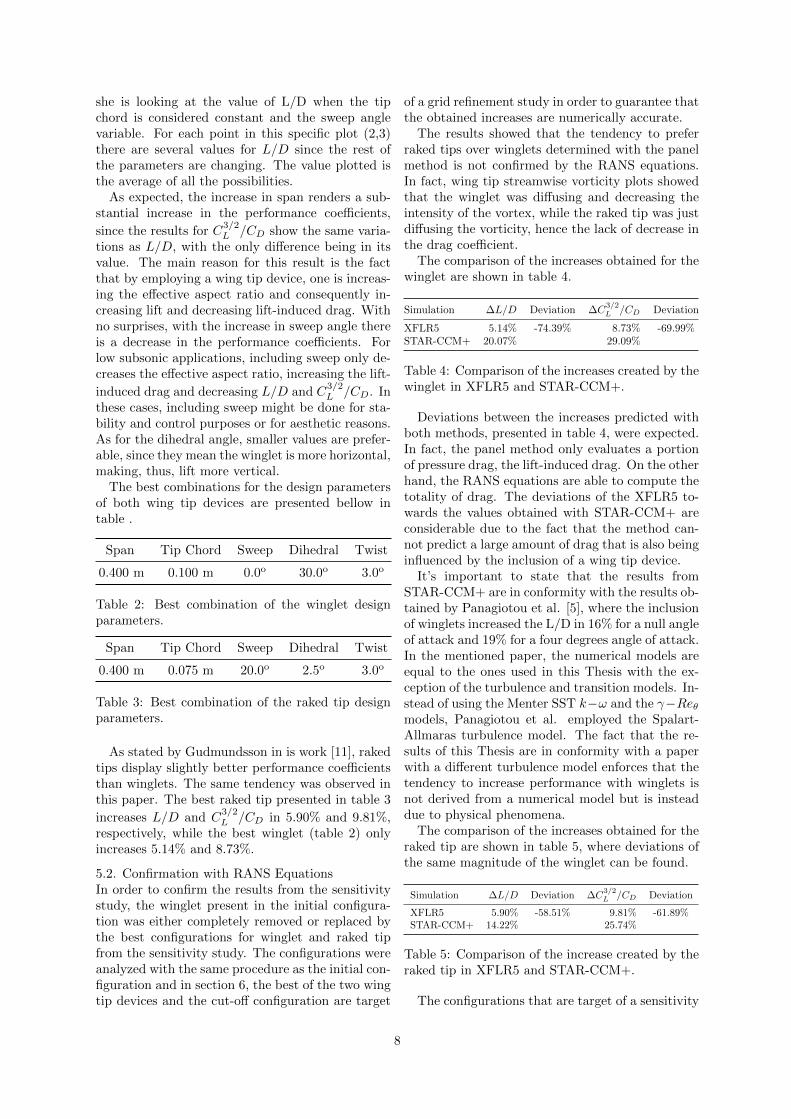
For the case of the raked tip, the parameter vari-ations are presented bellow.
Span (m) 0.100, 0.200, 0.300, 0.400;
Tip chord (m) 0.050, 0.075, 0.100, 0.125;
Sweep angle (o) 0.0, 20.0, 40.0, 60.0;
Dihedral angle (o) 0.0, 2.5, 5.0, 7.5;
Twist angle (o) 0.0, 1.0, 2.0, 3.0;
Figure 8 shows the main effects plot for the re-sults obtained with the raked tip.
Figure 8: Influence of each design parameter in theobjective function L/D - Raked Tip.
Figures 9 and 10 are common results of any sen-sitivity study. Known as interaction plots, they de-pict the objective function, in this case the L/Dratio, as a function of the interactions between thedesign parameters. These plots follow the same ap-proach as the main effects plot and average the mul-tiple possibilities for the objective function that fitin each point. Therefore, it is important to under-stand that in each column of this matrix of graphics,a specific design parameter is considered a variableand in each line is considered a constant, e. g. ifone is analyzing the graphic in position (2,3), he or
6
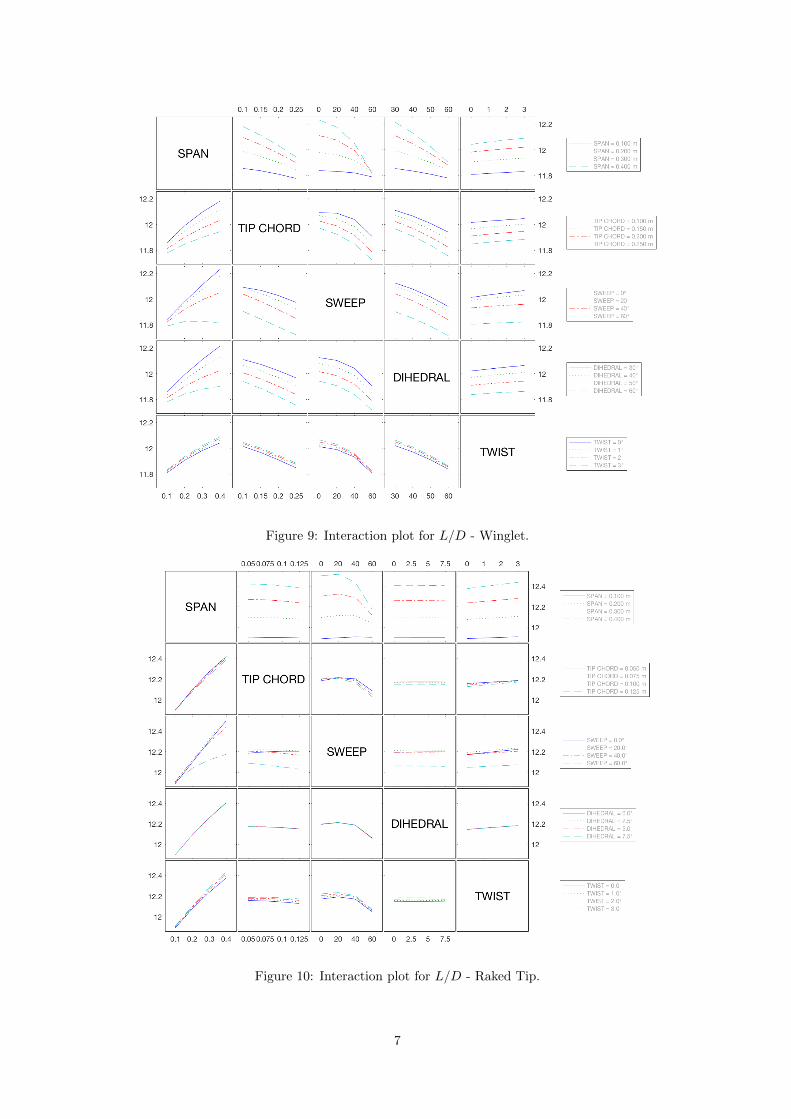
Figure 9: Interaction plot for L/D - Winglet.
Figure 10: Interaction plot for L/D - Raked Tip.
7
she is looking at the value of L/D when the tipchord is considered constant and the sweep anglevariable. For each point in this specific plot (2,3)there are several values for L/D since the rest ofthe parameters are changing. The value plotted isthe average of all the possibilities.
As expected, the increase in span renders a sub-stantial increase in the performance coefficients,
since the results for C3/2L /CD show the same varia-
tions as L/D, with the only difference being in itsvalue. The main reason for this result is the factthat by employing a wing tip device, one is increas-ing the effective aspect ratio and consequently in-creasing lift and decreasing lift-induced drag. Withno surprises, with the increase in sweep angle thereis a decrease in the performance coefficients. Forlow subsonic applications, including sweep only de-creases the effective aspect ratio, increasing the lift-
induced drag and decreasing L/D and C3/2L /CD. In
these cases, including sweep might be done for sta-bility and control purposes or for aesthetic reasons.As for the dihedral angle, smaller values are prefer-able, since they mean the winglet is more horizontal,making, thus, lift more vertical.
The best combinations for the design parametersof both wing tip devices are presented bellow intable .
Span Tip Chord Sweep Dihedral Twist
0.400 m 0.100 m 0.0o 30.0o 3.0o
Table 2: Best combination of the winglet designparameters.
Span Tip Chord Sweep Dihedral Twist
0.400 m 0.075 m 20.0o 2.5o 3.0o
Table 3: Best combination of the raked tip designparameters.
As stated by Gudmundsson in is work [11], rakedtips display slightly better performance coefficientsthan winglets. The same tendency was observed inthis paper. The best raked tip presented in table 3
increases L/D and C3/2L /CD in 5.90% and 9.81%,
respectively, while the best winglet (table 2) onlyincreases 5.14% and 8.73%.
5.2. Confirmation with RANS EquationsIn order to confirm the results from the sensitivitystudy, the winglet present in the initial configura-tion was either completely removed or replaced bythe best configurations for winglet and raked tipfrom the sensitivity study. The configurations wereanalyzed with the same procedure as the initial con-figuration and in section 6, the best of the two wingtip devices and the cut-off configuration are target
of a grid refinement study in order to guarantee thatthe obtained increases are numerically accurate.
The results showed that the tendency to preferraked tips over winglets determined with the panelmethod is not confirmed by the RANS equations.In fact, wing tip streamwise vorticity plots showedthat the winglet was diffusing and decreasing theintensity of the vortex, while the raked tip was justdiffusing the vorticity, hence the lack of decrease inthe drag coefficient.
The comparison of the increases obtained for thewinglet are shown in table 4.
Simulation ∆L/D Deviation ∆C3/2L /CD Deviation
XFLR5 5.14% -74.39% 8.73% -69.99%STAR-CCM+ 20.07% 29.09%
Table 4: Comparison of the increases created by thewinglet in XFLR5 and STAR-CCM+.
Deviations between the increases predicted withboth methods, presented in table 4, were expected.In fact, the panel method only evaluates a portionof pressure drag, the lift-induced drag. On the otherhand, the RANS equations are able to compute thetotality of drag. The deviations of the XFLR5 to-wards the values obtained with STAR-CCM+ areconsiderable due to the fact that the method can-not predict a large amount of drag that is also beinginfluenced by the inclusion of a wing tip device.
It’s important to state that the results fromSTAR-CCM+ are in conformity with the results ob-tained by Panagiotou et al. [5], where the inclusionof winglets increased the L/D in 16% for a null angleof attack and 19% for a four degrees angle of attack.In the mentioned paper, the numerical models areequal to the ones used in this Thesis with the ex-ception of the turbulence and transition models. In-stead of using the Menter SST k−ω and the γ−Reθmodels, Panagiotou et al. employed the Spalart-Allmaras turbulence model. The fact that the re-sults of this Thesis are in conformity with a paperwith a different turbulence model enforces that thetendency to increase performance with winglets isnot derived from a numerical model but is insteaddue to physical phenomena.
The comparison of the increases obtained for theraked tip are shown in table 5, where deviations ofthe same magnitude of the winglet can be found.
Simulation ∆L/D Deviation ∆C3/2L /CD Deviation
XFLR5 5.90% -58.51% 9.81% -61.89%STAR-CCM+ 14.22% 25.74%
Table 5: Comparison of the increase created by theraked tip in XFLR5 and STAR-CCM+.
The configurations that are target of a sensitivity
8
study in the next chapter are the cut-off and thewinglet configurations.
6. Grid Refinement StudyReliability and accuracy are two concepts fre-quently confused. In the context of CFD applica-tions, reliability is associated with the robustnessof the computational method employed and, there-fore, the evaluation of iterative errors. Accuracy iscomposed of two types, the modeling and the nu-merical accuracy. The first is associated with themeasure of the error created by the modeling of thephysics by a certain mathematical model. The lastcan be described as the error generated by the dis-cretization of the control volume.
The objective of this study is indeed to estimatethe exact numerical solution for the engineeringquantities and compute the uncertainty associatedwith the increases predicted in section 5.
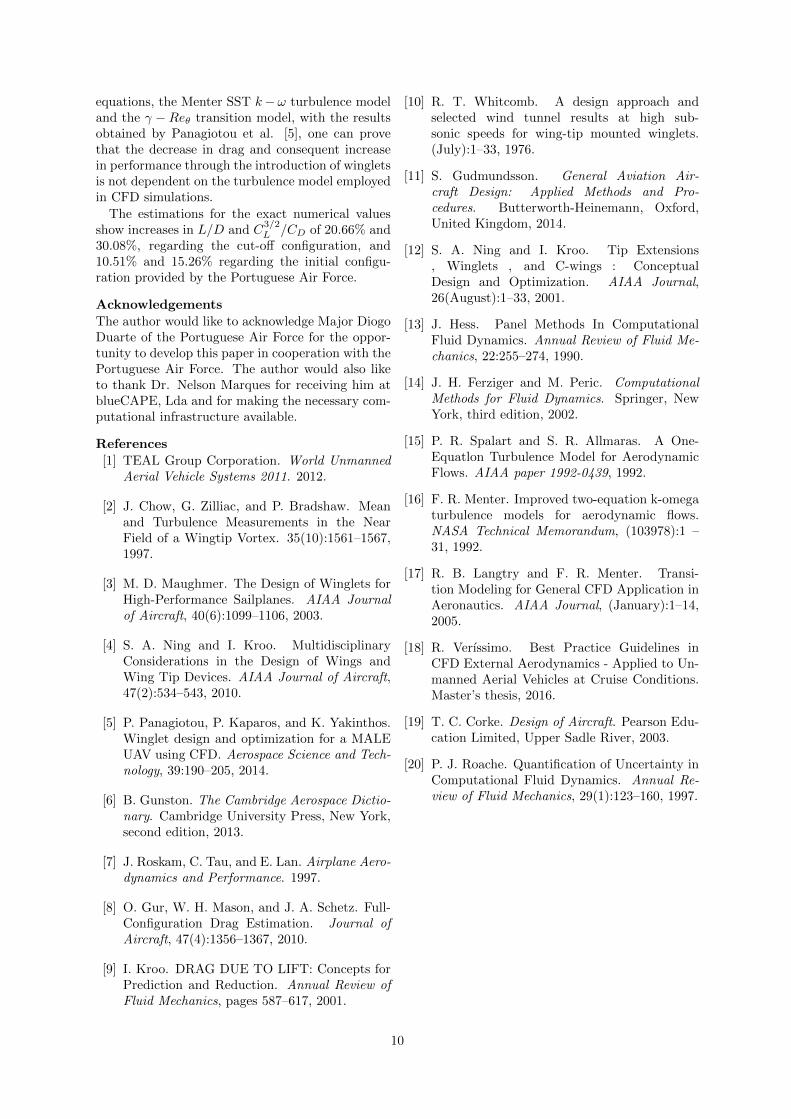
The current study involves three unstructured fi-nite volume meshes: a coarse, an intermediate anda thin mesh. The meshes employed in section 5 wereconsidered the coarse meshes for the study and suc-cessive refinements were performed to arrive to theremaining meshes. These were achieved by succes-sively decreasing the cell base size until the numberof cells was near the target value. The base sizesthat accomplished these meshes were, respectively,0.350m and 0.271m.
The estimation for the exact numerical solutionis obtain through the method proposed by Roache[20], where the value is computed using the Richard-son Extrapolation. This method of computing theuncertainty of the engineering quantity was appliedto the cut-off configuration. The estimations forthe exact numerical solution of the lift and dragcoefficients were 0.288065 and 0.023606, respec-tively. Figure 11 shows the values computed forthe aerodynamic coefficients for the cut-off config-uration (blue) and the Richardson Extrapolation(black), plotted against the grid refinement num-ber, ri =
√hf/hi, where hf is the number of cells
of the thin mesh and hi the number of cells of theintended mesh.
Figure 11: Grid convergence plots for the cut-offconfiguration.
Unlike in the case of the lift coefficient, figure 11
shows an increased difficulty in converging the dragcoefficient.
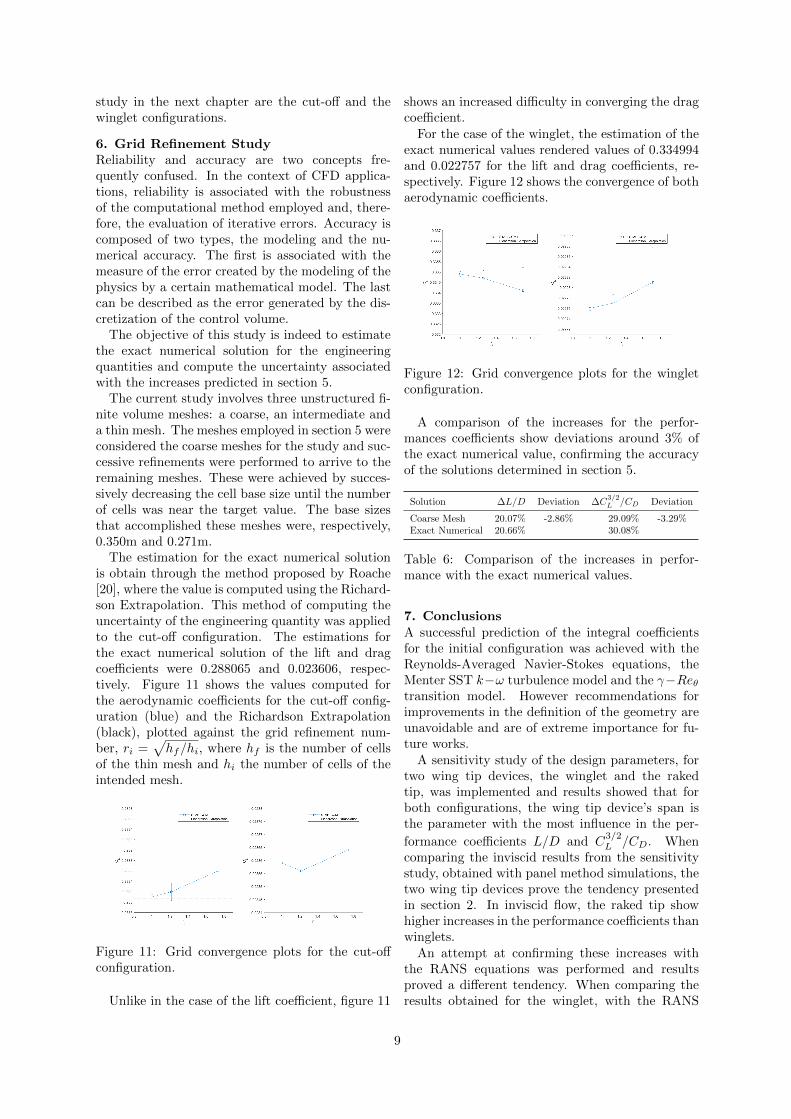
For the case of the winglet, the estimation of theexact numerical values rendered values of 0.334994and 0.022757 for the lift and drag coefficients, re-spectively. Figure 12 shows the convergence of bothaerodynamic coefficients.
Figure 12: Grid convergence plots for the wingletconfiguration.
A comparison of the increases for the perfor-mances coefficients show deviations around 3% ofthe exact numerical value, confirming the accuracyof the solutions determined in section 5.
Solution ∆L/D Deviation ∆C3/2L /CD Deviation
Coarse Mesh 20.07% -2.86% 29.09% -3.29%Exact Numerical 20.66% 30.08%
Table 6: Comparison of the increases in perfor-mance with the exact numerical values.
7. ConclusionsA successful prediction of the integral coefficientsfor the initial configuration was achieved with theReynolds-Averaged Navier-Stokes equations, theMenter SST k−ω turbulence model and the γ−Reθtransition model. However recommendations forimprovements in the definition of the geometry areunavoidable and are of extreme importance for fu-ture works.
A sensitivity study of the design parameters, fortwo wing tip devices, the winglet and the rakedtip, was implemented and results showed that forboth configurations, the wing tip device’s span isthe parameter with the most influence in the per-
formance coefficients L/D and C3/2L /CD. When
comparing the inviscid results from the sensitivitystudy, obtained with panel method simulations, thetwo wing tip devices prove the tendency presentedin section 2. In inviscid flow, the raked tip showhigher increases in the performance coefficients thanwinglets.
An attempt at confirming these increases withthe RANS equations was performed and resultsproved a different tendency. When comparing theresults obtained for the winglet, with the RANS
9
equations, the Menter SST k−ω turbulence modeland the γ − Reθ transition model, with the resultsobtained by Panagiotou et al. [5], one can provethat the decrease in drag and consequent increasein performance through the introduction of wingletsis not dependent on the turbulence model employedin CFD simulations.
The estimations for the exact numerical valuesshow increases in L/D and C
3/2L /CD of 20.66% and
30.08%, regarding the cut-off configuration, and10.51% and 15.26% regarding the initial configu-ration provided by the Portuguese Air Force.
Acknowledgements
The author would like to acknowledge Major DiogoDuarte of the Portuguese Air Force for the oppor-tunity to develop this paper in cooperation with thePortuguese Air Force. The author would also liketo thank Dr. Nelson Marques for receiving him atblueCAPE, Lda and for making the necessary com-putational infrastructure available.
References
[1] TEAL Group Corporation. World UnmannedAerial Vehicle Systems 2011. 2012.
[2] J. Chow, G. Zilliac, and P. Bradshaw. Meanand Turbulence Measurements in the NearField of a Wingtip Vortex. 35(10):1561–1567,1997.
[3] M. D. Maughmer. The Design of Winglets forHigh-Performance Sailplanes. AIAA Journalof Aircraft, 40(6):1099–1106, 2003.
[4] S. A. Ning and I. Kroo. MultidisciplinaryConsiderations in the Design of Wings andWing Tip Devices. AIAA Journal of Aircraft,47(2):534–543, 2010.
[5] P. Panagiotou, P. Kaparos, and K. Yakinthos.Winglet design and optimization for a MALEUAV using CFD. Aerospace Science and Tech-nology, 39:190–205, 2014.
[6] B. Gunston. The Cambridge Aerospace Dictio-nary. Cambridge University Press, New York,second edition, 2013.
[7] J. Roskam, C. Tau, and E. Lan. Airplane Aero-dynamics and Performance. 1997.
[8] O. Gur, W. H. Mason, and J. A. Schetz. Full-Configuration Drag Estimation. Journal ofAircraft, 47(4):1356–1367, 2010.
[9] I. Kroo. DRAG DUE TO LIFT: Concepts forPrediction and Reduction. Annual Review ofFluid Mechanics, pages 587–617, 2001.
[10] R. T. Whitcomb. A design approach andselected wind tunnel results at high sub-sonic speeds for wing-tip mounted winglets.(July):1–33, 1976.
[11] S. Gudmundsson. General Aviation Air-craft Design: Applied Methods and Pro-cedures. Butterworth-Heinemann, Oxford,United Kingdom, 2014.
[12] S. A. Ning and I. Kroo. Tip Extensions, Winglets , and C-wings : ConceptualDesign and Optimization. AIAA Journal,26(August):1–33, 2001.
[13] J. Hess. Panel Methods In ComputationalFluid Dynamics. Annual Review of Fluid Me-chanics, 22:255–274, 1990.
[14] J. H. Ferziger and M. Peric. ComputationalMethods for Fluid Dynamics. Springer, NewYork, third edition, 2002.
[15] P. R. Spalart and S. R. Allmaras. A One-Equatlon Turbulence Model for AerodynamicFlows. AIAA paper 1992-0439, 1992.
[16] F. R. Menter. Improved two-equation k-omegaturbulence models for aerodynamic flows.NASA Technical Memorandum, (103978):1 –31, 1992.
[17] R. B. Langtry and F. R. Menter. Transi-tion Modeling for General CFD Application inAeronautics. AIAA Journal, (January):1–14,2005.
[18] R. Verıssimo. Best Practice Guidelines inCFD External Aerodynamics - Applied to Un-manned Aerial Vehicles at Cruise Conditions.Master’s thesis, 2016.
[19] T. C. Corke. Design of Aircraft. Pearson Edu-cation Limited, Upper Sadle River, 2003.
[20] P. J. Roache. Quantification of Uncertainty inComputational Fluid Dynamics. Annual Re-view of Fluid Mechanics, 29(1):123–160, 1997.
10