studying bicycle wheel aerodynamics with computational ... · pdf filewith computational fluid...
TRANSCRIPT
�
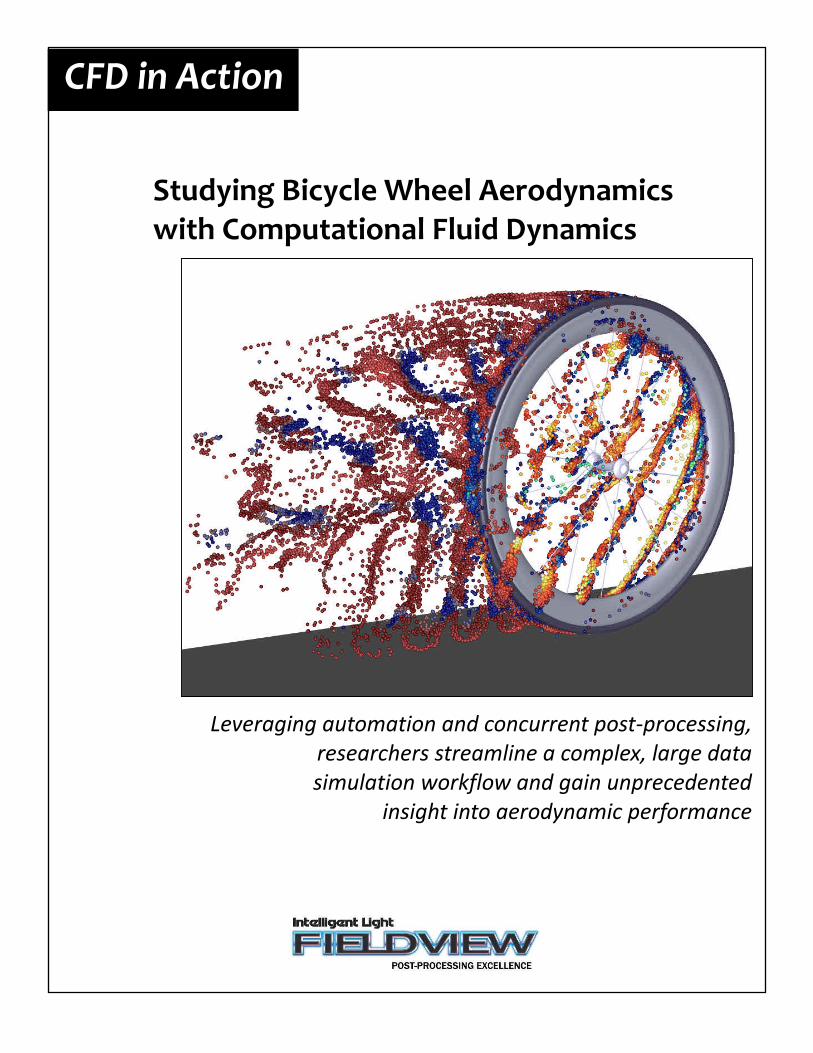
Studying Bicycle Wheel Aerodynamicswith Computational Fluid Dynamics
Leveraging automation and concurrent post-processing,researchers streamline a complex, large datasimulation workflow and gain unprecedented
insight into aerodynamic performance
CFD in Action

In the world of CFD simulation, maximizing return on investmentcomes from reducing the cost of analysis while increasing output.While today’s accessible computing resources and powerfulsolver codes make creating huge amounts of data easy, theinvestment in those resources can’t be fully realized if that datacan’t be analyzed efficiently and accurately. A high productivityCFD workflow is imperative, both economically and competitively,for exploring multiple designs and complex phenomena withintight design cycles.
Intelligent Light’s study of the aerodynamics of a bicycle wheel isa powerful demonstration of both the need for and the value ofrobust, automated post-processing.
Studying the aerodynamic flow around a rotating bicycle wheel,including the front fork and frame components, while in contactwith the ground presented a unique CFD challenge. Multiplewheels and fork/frame combinations at 10 yaw angles werestudied. Two significant new insights gained – an unexpectedvertical force transitionand previously unseen,highly resolved flowstructures – would havebeen lost in a mountainof complex datawithout the post-processing capabilities of FieldView. Approximately 3.6 gigabytesof data were generated during the steady simulations, and theunsteady simulations resulted in nearly 1.2 terabytes of data. Inthe past, this quantity of data, its complexity, and the repetitivenature of the calculations would have posed a seeminglyinsurmountable challenge for researchers.
Here, however, FieldView gave researchers the tools needed toaccelerate the analysis, mine the most valuable information, andcreate compelling images and animations. The major findings –that drag force does depend on the wheel and is influenced bythe choice of the front fork, and that the wheel rim and tire, notthe hub and spokes, dominate the overall drag – challengeconventional wisdom, and open up new avenues of explorationfor bicycle wheel manufacturers and the cycling industry ingeneral.
By leveraging FieldView’s automation and visualizationcapabilities, just a few hours of upfront system design resulted ina highly productive workflow that was repeatedly put to the testas the study progressed with new data and results from multiplesolver codes. The ability to extend the routines to answer newquestions and work with new datasets is an essential capabilityof any high productivity workflow.
Automation speeds the workflow
FieldView’s FVX™ programming language was used to automatemany post-processing tasks, including:
� resolving the forces on the wheel into their drag, side(lift) and vertical components;
� breaking the resolved forces down to those acting oneach component: wheel rim and tire, hub, spokes, andfork;
� calculating the resolved forces along the wheelcircumference;
� creating custom visualizations of flow structures forstandardized quantitative and qualitative evaluation; and
� supporting future development by building on theexisting tools.
The researchers specifically developed automationmethodologies that were geometry-independent and applicableto both steady or transient simulations with few or no changes
for ease of use andflexibility.
In each instance,tasks that would havetaken many weeks toaccomplish in a
traditional, serial workflow were completed in days. After theinitial time invested in writing the routines, they were usedextensively – for example, the same FieldView FVX routine wasrun 60 times to calculate the drag force for all wheel and forkcombinations at two speeds. Some tasks, such as calculatingcircumferential variation, which entailed 3600 calculations foreach wheel and fork combination, would simply not have beenpossible without automation.
Solving the Large-Data CFD Workflow ChallengeFieldView’s automation, visualization, speed create robust, productive process
By leveraging FieldView’s automation and visualizationcapabilities, just a few hours of upfront system design
resulted in a highly productive workflow.
0
90
180
270
-0.004
0.000
0.004
0.008
0.012
0.016
Side Force[Newtons]
00yaw02yaw05yaw08yaw10yaw12yaw14yaw16yaw18yaw20yaw
Direction ofWheel
Rotation
Ground plane
Wheel moves in this direction
Circumferential Variation in Side Force
Front of wheel
Top of wheel
0
90
180
270
-0.004
0.000
0.004
0.008
0.012
0.016
Side Force[Newtons]
00yaw02yaw05yaw08yaw10yaw12yaw14yaw16yaw18yaw20yaw
Direction ofWheel
Rotation
Ground plane
Wheel moves in this direction
Circumferential Variation in Side Force
Front of wheel
Top of wheel

Automation embeds an organization’s best practices, and allowsmore people to put these skills to use. An automated workflowmust also be inherently stable and capable of growth. FieldViewFVX offers a true programming environment, portable acrossplatforms and datasets. Because FieldView is always 100%backward compatible, workflow reliability is ensured andinvestments are protected. Data and routines from one versionof FieldView can be used without modification with futurereleases of FieldView and the associated newer datasets.
Advanced, customizable visualization provides insight
The larger and more complex a dataset, the more critical it is tobe able to quickly and accurately interrogate, analyze, andunderstand the results. Key insights and actionable informationmust be easily identified and shared with key audiences, many ofwhom are not CFD experts. The advanced visualization capabilitiesof FieldView, long one of the product’s most recognized strengths,were put to maximum use in the bicycle wheel study.
From the start, the research team sought to make data outputs‘spreadsheet ready.’ FieldView’s flexibility and sensitivity wasreadily apparent in the creation of the unique, unprecedentedviews of flow features, circumferential variations and helicity. Amethod available within FieldView called ‘streaklines’ addedmassless particles to a set of fixed positions, which allowedresearchers to develop highly detailed animations depicting flowaround the bicycle wheel for the first time.
Much more than just ‘pretty pictures,’ these illustrations andanimations gave the researchers rare insight into the wheel’saerodynamic performance. They were able, in essence, to ‘sit’ onthe edge of the wheel and ride through its rotations, capturingand visualizing, for the first time, the complex interactionshappening unseen with every turn of the wheel.
Processing options fully utilize every investment
In relative terms, computer processors, memory, and disk spaceare cheap compared to the costs represented by people and theirtime. FieldView maximizes existing hardware and solver/softwareresources in both concurrent and scalable operations, whereIntelligent Light’s exclusive batch-only licensing option can cutcosts by up to 90% versus individual interactive licenses, whileparallel processing can be used to reduce post-processing timeon single simulations.
Post-processing the large volume of data in the bicycle wheelstudy was significantly accelerated using FieldView running inparallel on eight processors. FieldView FVX routines allowed theautomated workflow and custom visualizations to be producedin batch mode without user intervention. Batch-only licensing alsomeant the researchers could post-process multiple cases andtime-steps concurrently, while at the same time running thesolver to generate additional solution data.
Performing post-processing while solutions are being generatedgreatly increases engineering capacity and decreases overall time.Hardware and software investments are put to their best use forhigher productivity. The result is that complex, sophisticatedengineering and research studies can be performed within projecttime constraints and while maximizing return on CFD investmentsin both technology and people.n
3.6 gigabytes of
steady simulation data
1.2 terabytes of
unsteady simulation data
Performing post-processing whilesolutions are being generated greatly
increases engineering capacity anddecreases overall time.
...tasks that would have taken many weeks to accomplish in atraditional, serial workflow were completed in days...

Just as computer-aided design and engineering (CAD/CAE) softwaretools have revolutionized product design and development overthe last 30 years, the field of computational fluid dynamics (CFD)has undergone its own transformation. Software applicationsaddressing the complexities of fluid flow have become moresophisticated, and when combined with the powerful computingresources available today, the opportunities for discovery arerapidly increasing.
Intelligent Light undertook a research project in CFD simulation todevelop a comprehensive methodology for the study ofaerodynamic flow around a rotating bicycle wheel in contact withthe ground. By automating routines, processing concurrently inbatch, and exploiting advanced visualization tools, the researcherscreated a time-saving, streamlined approach which offers intriguingimplications for the wider use of CFD simulation in tackling problemsonce considered too complex to be easily solved. In addition, theygained significant new insight into the aerodynamics of a bicyclewheel, including unprecedented visualizations of flow features,computations of the resolved forces acting on the wheel, andillustrations of the variation of these forces along the wheelcircumference.
From the Wheel to the TourOf all the inventions in the centuries of human existence, the wheelcertainly qualifies as one ofthe most revolutionarydiscoveries. While itsbeginnings date backpossibly as far as thePaleolithic era (15,000 to750,000 years ago), generalconsensus places theinvention of the wheel as we know it at around 3500 BC, inMesopotamia (now Iraq).
In the centuries since, the wheel has become commonplace,something we see and use each day without much thought. But formembers of the bicycle racing community, the aerodynamicperformance of a wheel is of supreme importance, offering both achallenge and an opportunity. Bike wheel manufacturers areconstantly testing new design configurations (deeper rims withvarying cross sectional shapes, varying spoke counts) and newmaterials, in their quest for a faster, lighter, stronger wheel and acompetitive advantage in the marketplace. Cyclists, whether theyride for personal pleasure or compete in events such as road racesor triathlons, are also looking for that perfect wheel, and it’s notuncommon for the more competitive triathletes to spend severalthousand dollars just on wheels in that quest.
No cycling event is more prestigious or well-known than the Tourde France, an incredibly scenic but physically grueling race run eachsummer throughout France and bordering countries. Compared bycompetitors to running 20 marathons back to back, the Tour isconsidered among the greatest tests of human strength andstamina in sports today.
Yet for all its challenges – 2,200 miles over 23 days, up and downsteep mountains – the race is often decided by mere seconds. In
the 2007 Tourde France, themargin of victoryseparating thetop three overallfinishers wasjust 31 seconds,after nearly 90hours of racing.In the lastindividual time-trial that year,the top 10 riderswere separatedby less thanthree minutesfor a ride lasting slightly more than one hour. A seemingly smallgain of 1%, or approximately 40 seconds, meant the differencebetween third and eighth place.
Ever since Greg LeMond overcame a 50-second deficit to win thefinal time trial and the 1989 Tour de France by 8 seconds usingaerodynamic handlebars and equipment previously unseen in theevent, the drive for aerodynamic advantage in the tech-savvycycling community has been obsessive. To find that advantage,
manufacturers of racingbicycles and bicyclecomponents haveincreasingly turned to windtunnel testing to optimizewheel designs and individualrider position (Fig. 1).
Wind tunnel testing, originally the purview of airplane andautomotive manufacturers, is now a key element in the design anddevelopment of bicycle wheels. Major wheel manufacturers spendtens of thousands of dollars building physical prototypes of designvariations, delivering them to a wind tunnel, mounting them to atest platform, and running multiple iterations on each wheel. Thewide variation in commercially available components makes it clearthat design innovation is a vital part of this industry.
It’s All About DragWind tunnel testing is all about reducing the forces of drag, andover the last two decades, data collected from wind tunnels havebrought about significant changes in bicycle wheel design. Althoughthe main contributors to overall cycling drag are commonlyrecognized as the rider, the frame (including fork and aerobars),and the wheels, efforts continue to identify the most relevantcontributions to overall performance improvements in bicycleracing. One study concluded that wheel drag alone is responsiblefor 10% to 15% of total aerodynamic drag, and that improvementsin wheel design can reduce drag between the wheels by as muchas 25% and provide an overall reduction in drag on the order of 2%to 3%. That factor may be numerically small, but it would translateinto a huge improvement in the competitive cycling world.
While physical wind tunnel testing is considered state of the art, itdoes have some significant limitations. Making direct comparisons
By applying CFD simulation and post-processing tools, theteam was, in essence, able to ‘sit’ on the edge of the wheeland ride through its rotations, capturing and visualizing,for the first time, the complex interactions happeningunseen with every turn of the wheel.
Figure 1
Phot
ogra
ph c
ourte
sy o
f Elit
e B
icyc
les,
Inc.
, Phi
lade
lphi
a, P
AThe Study

between test results from different facilities can be difficult becauseof variations in wind tunnel configurations, the testing apparatusused to support and rotate the bicycle wheels studied, and whetherthe wheel being studied is rotating or stationary. Godo notes thatin wind tunnel testing, if the wheels are rotated at all, they may bespun at a speed different from that used for upstream conditions,which are often run at only one air speed, typically 30 mph.Corrections are then applied to estimate forces at lower speeds.
Other drawbacks are that the contributions of individualcomponents – wheel, spokes, and hub – cannot be separated outin wind tunnel testing, and that vertical forces, acting either towardor away from the floor, cannot be calculated because the wheelbeing studied is usually affixed to forks in the floor of the windtunnel. Finally, wind tunnel testing is expensive and time-intensive,which limits the number of design variations that can be tested.
Putting CFD to the TestUntil recently, little work has been done to apply CFD to the studyof the flow around a rolling wheel while in contact with the ground.With advancements in the sophistication of CFD software, includingits own CFD post-processing package FieldView™, as well as thegreater availability of high performance, multi-core computingresources, Intelligent Light decided to put CFD simulation to the testand develop a comprehensive approach to model bicycle wheels.
Researchers Matthew N. Godo, Ph.D., FieldView product manager,and Steve M. Legensky, Intelligent Light general manager, along withDavid Corson, senior analyst at ACUSIM Software, set out to meetthe challenge. In the process of creating a novel, robust modelingmethodology, the research team gained a revealing glimpse into theaerodynamics of the wheel and identified two phenomena notpreviously reported: an unexpected transition in vertical forces fromacting downward to acting upward, and a highly resolved periodicflow structure coming from the inner leading edge of the wheel. Byapplying CFD simulation and post-processing tools, the team was,in essence, able to ‘sit’ on the edge of the wheel and ride throughits rotations, capturing and visualizing, for the first time, the complexinteractions happening unseen with every turn of the wheel.
Setting the StageThe first decision Godo and his team made was to limit the study tojust the front wheel, for three reasons. First, it is the part of thebicycle that the wind sees first, and the researchers speculate thatthe aerodynamic performance of bicycle components behind thefront wheel will be affected by events occurring upstream. Second,while the drag associated with an individual rider is dictated by thefixed size and shape of the rider, the design of the front wheel canstill be optimized to improve overall performance and handlingcharacteristics. Finally, wind tunnel data is available for comparisonwith several individual wheel designs over a range of conditionstypically encountered by racing cyclists.
Godo developed a model based on the cross-sectional profile of astandard Zipp™ 404 wheel, a popular wheel used by many athletes,with a Continental™ tubular tire attached. The model was dividedinto two sub-volumes, with one containing the spokes, hub, andinner edge of the wheel rim, and the other containing the remainingwheel surface, the ground contact, and the surrounding area. Notonly does this allow the researchers to understand the contributionsof the individual components, but this approach makes it possibleswap out different wheel designs, or easily change things like the
hub shape or spoke count, in future studies. The final mesh used inthe study and the actual geometry are depicted in Figure 2.
Using AcuSolve™ [ACUSIM Software, Inc.], a general-purpose finiteelement flow solver, the researchers ran steady-state and transientsimulations at speeds of 20 and 30 miles per hour for yaw anglesranging from 0 to 20 degrees. Initially, the yaw angles were chosento match a previously published study, but reviewing earlysimulation results, Godo saw a need to include the 2 degree yawangle and to further break down the range between 5 and 15degrees. The yaw angle is important, Godo says, because dependingon the skill of the cyclist, just the motion of pedaling rocks the bikefrom side to side, changing the wheel’s yaw angle, which in turnchanges the drag. Even professional cyclists are hard pressed tokeep the yaw angle under 2 degrees while riding on open roads.Add in wind, even a slight breeze, and maintaining the yaw angle iseven more difficult. The speeds and yaw angles in this study coverthe range of conditions most commonly experienced by racers ofall skill levels.
FieldView was used to resolve the three force components: drag,side and vertical force. Figure 3 illustrates the direction of each ofthese forces relative to the wheel. The drag force acts in thedirection of the wheel axis. The side force acts normal to the planeof the wheel axis, and the vertical force is acting either toward oraway from the ground plane.
Figure 1Figure 2 Final mesh (left) & actual geometry
Figure 3

An Unexpected InsightIn Figures 4 through 6, the resolved drag, side and vertical forces aresummarized and separated into the component contributions for thetire and rim, the spokes and the hub. The CFD simulations providedan important benefit here – the ability to isolate how each of thewheel components performs is not possible using wind tunnel data.
In Figure 4, as the yaw angle increases, a low point in the drag forcecan be seen. This minimum drag force occurs at a yaw angle of 10degrees for both speeds.
This prediction in behavior is in exact agreement with published windtunnel studies. The researchers also calculated drag coefficients, CD,for the condition of 0 degrees yaw. These values also fall well withinthe range of published wind tunnel data.
By looking at the component breakdown, we can see that the tireand rim is responsible for most of the drag, with the hub and spokescontributing roughly equal amounts over the range of yaw anglesstudied. For this wheel, the drag force ‘performance’ with respect toyaw angle is being driven by the tire and rim.
The interpretation of the side force on the wheel is comparable tounderstanding the lift force acting on an airplane wing. Total sideforces, seen in Figure 5, generally increase in a nearly linear fashionwith respect to increasing yaw for both speeds. Godo believes thatthe departure from linear behavior at yaw angles above 10 degreessignals the start of flow separation from the tire and rim. Side force‘performance’ is again strongly dominated by the tire and rim, withthe hub contributing the least to the total side forces.
Vertical forces provided the first glimpse of an interesting andextremely unexpected transition. At a yaw angle between 6 and 8degrees, the total vertical force switched from acting downwardtoward the ground to acting upward (Figure 6). Looking at theindividual contributions from the tire and rim, the hub and thespokes, the researchers could see that the vertical force on the hubis always acting downward, in agreement with the “Magnus effect,”or the Kutta-Joukowski Lift Theorem predictions for forces on arotating cylinder. What surprised the researchers was that it was thetire and rim departing from the theory – at the higher yaw angles,the vertical force acts upward.
Such a force, not previously reported, might be a factor in controland maneuverability, specifically at higher yaw angles. While a sideforce of 0.1N may seem small, above 10 degrees yaw, this verticalforce to drag force ratio is approximately 10%. Recognizing that thiseffect is limited to just the tire and rim, the researchers speculatethat this force transition will become more relevant for deeperrimmed wheels in use today. As most cyclists know, Godo says, itdoesn’t take much to end up on the ground, and even a small force,acting at the wrong moment, can cause problems. Because this shiftin force direction has not been identified with current wind tunneltesting, further exploration is warranted for wheel and componentdesign.
Vertical Force vs Yaw Angle
Side Force vs Yaw Angle
Figure 6
Figure 5
Axial Drag Force vs Yaw Angle
Figure 4

A New View of Circumferential VariationTo better understand the variations in resolved forces around theperimeter of the wheel, resolved forces were averaged on smallcircular arc segments for each yaw angle and plotted as a functionof the wheel circumference. Circumferential variations have notbeen plotted like this previously; the tools in FieldView enabled thisunique representation of data. In the next three figures, data isshown for the conditions of 20 mph; results are qualitatively similarfor the higher speed of 30 mph. In each of the next three figures,the wheel travels from left to right, spinning in a clockwise direction.For each of the three resolved forces – drag, side, and vertical – thereis a considerable variation around the wheel.
In Figure 7 at right, we see that for all yaw angles, the highest dragforce is acting at the front of the wheel, and the highest drag isoccurring at the highest yaw angle of 20 degrees. Along the trailingedge of the wheel, significant variations in the drag force are visible,suggesting that the flow is quite disrupted after passing over theleading edge of the wheel and the spokes. At the top of the wheel,the difference between the forward motion of the wheel and theoncoming air will be the highest. Just forward of the top of thewheel, the drag force approaches zero for all yaw angles. Theresearchers observed the presence of a flow recirculation zone,resulting from this maximum speed difference. The circumferentialplot of total drag is able to illustrate the exact point on the wheelwhere the onset of flow separation occurs. Where the wheel comesinto contact with the ground, the relative speed difference is zero.Here, the total drag is essentially zero at this ground contact point.
The side forces, shown in Figure 8, also show considerable variationfor each yaw angle. Notably, the side forces are greatest on thetrailing edge of the wheel. This build-up of side forces on the trailingpart of this wheel will cause it to turn into the wind. There is also adifference in the circumferential force distribution when comparingthe leading edge of the wheel to the trailing edge. At the leadingedge, side forces increase somewhat uniformly in proportion toincreasing yaw angles. But on the trailing edge of the wheel, thisuniform increase in side force with increasing yaw is limited to therange of 0 to 10 degrees yaw. From 10 to 20 degrees yaw, the sideforces are nearly the same. For the condition of 10 degrees yaw, wesee the largest difference in side forces between the leading andtrailing edge of the wheel, and the researchers expect that theturning moment will be the greatest at this condition.
In contrast to the circumferential plots for drag and side forces,Figure 9 shows that vertical forces can be either positive or negativedepending on the circumferential position along the wheel. Positivevertical forces (acting upward) are present near the top of the wheel,on the lower front portion of the wheel and on the upper back, ortrailing, edge of the wheel. Negative vertical forces (actingdownward) are present at the upper leading and lower trailing edgesof the wheel. The biggest differences in vertical forces betweenyaw angles occur starting from the lower front quadrant of thewheel, extending to the upper trailing quadrant. As the verticalforces increase over this part of the wheel with increasing yaw, theoverall transition from downward acting to upward acting verticalforce is seen to occur.
0
90
180
270
-0.002
-0.001
0.000
0.001
0.002
0.003
0.004
0.005
Drag Force[Newtons]
00yaw02yaw05yaw08yaw10yaw12yaw14yaw16yaw18yaw20yaw
Direction ofWheel
Rotation
Ground plane
Front of wheel
Top of wheel
Wheel moves in this direction
Circumferential Variation in Drag Force
0
90
180
270
-0.002
-0.001
0.000
0.001
0.002
0.003
0.004
0.005
Drag Force[Newtons]
00yaw02yaw05yaw08yaw10yaw12yaw14yaw16yaw18yaw20yaw
Direction ofWheel
Rotation
Ground plane
Front of wheel
Top of wheel
Wheel moves in this direction
Circumferential Variation in Drag Force
0
90
180
270
-0.004
0.000
0.004
0.008
0.012
0.016
Side Force[Newtons]
00yaw02yaw05yaw08yaw10yaw12yaw14yaw16yaw18yaw20yaw
Direction ofWheel
Rotation
Ground plane
Wheel moves in this direction
Circumferential Variation in Side Force
Front of wheel
Top of wheel
0
90
180
270
-0.004
0.000
0.004
0.008
0.012
0.016
Side Force[Newtons]
00yaw02yaw05yaw08yaw10yaw12yaw14yaw16yaw18yaw20yaw
Direction ofWheel
Rotation
Ground plane
Wheel moves in this direction
Circumferential Variation in Side Force
Front of wheel
Top of wheel
Figure 8
Figure 7
Figure 9
Circumferential Variation in Side Force
Circumferential Variation in Drag Force
0
90
180
270
-0.002
0.000
0.002
Vert Force[Newtons]
00yaw02yaw05yaw08yaw10yaw12yaw14yaw16yaw18yaw20yaw
Direction ofWheel
Rotation
Ground plane
Wheel moves in this direction
Circumferential Variation in Vertical Force
Front of wheel
Top of wheel
0
90
180
270
-0.002
0.000
0.002
Vert Force[Newtons]
00yaw02yaw05yaw08yaw10yaw12yaw14yaw16yaw18yaw20yaw
Direction ofWheel
Rotation
Ground plane
Wheel moves in this direction
Circumferential Variation in Vertical Force
Front of wheel
Top of wheel
Circumferential Variation in Vertical Force

A Surprise in the FlowTo compare and understand the complex flow fields for each yawangle, a visualization method available within FieldView called‘streaklines’ was used. To create the streaklines, researchers firstdefined a set of fixed radial and circumferential positions very nearand relative to the rim and tire. Next, massless particles werecontinually released from these ‘seed’ positions into the flow fieldas the wheel was turning. By following the paths of these masslessparticles, also known as ‘streaklines,’ they were able to develophighly detailed animations depicting flow around the rotating bicyclewheel for the first time.
Figure 10 shows a frame from one of several animations developed,illustrating streakline flow patterns calculated for five different yawangles studied. The viewpoint of the observer is set relative to thewheel in order to make the differences for flow at each yaw anglemore apparent. The bicycle wheel is moving from left to right ineach image, and the massless particles are being carried across anddownstream from the wheel. To gain a further understanding of theflow coming across the wheel, the streaklines were colored by thevelocity component perpendicular to axis of wheel travel. Weakercross flows are present for the smaller yaw angles (0, 2 and 5degrees) and are indicated by the red and blue streaklines locatedvery near to each other. Stronger cross flows are expected at thehigher yaw angles as the upstream flow passes over the leading edgeof the tire. Streaklines (colored by yellow or white) for the 20 degreeyaw case show a very strong cross flow.
These unique visualizations allowed the team to identify severalflow structures, but one in particular caught their attention. At yawangles of 0 and 2 degrees, and to a lesser extent at 5 degrees, asurprising flow structure was revealed coming from the innerleading edge of the wheel – a strong alignment of the masslessparticles, periodically rolled into nearly straight lines, at an anglesloping up toward the top of the wheel. Above a yaw angle of 5degrees, these ‘straight’ flow structures turned into circular arcs,following the curve of the wheel. These circular arcs quickly broke
up and were much wider than the straighter structures seen atlower yaw angles.
Intrigued, Godo then performed a frequency analysis on theresolved forces acting on the wheel, in effect amplifying and‘listening’ to the wheel’s rotation. The results revealed the presenceof a very dominant singular frequency, in effect a unique value, or‘wheel frequency signature,’ which shifted from higher to lowervalues as the yaw angle increased. Yet another surprise was thatthis ‘frequency signature’ did not match the passage of the rotatingspokes, contrary to conventional wisdom which suggests that the
action of the spokes chopping through the oncoming air is thedominant periodic behavior of a rotating bicycle wheel. Now, theresearchers needed to look for the cause of this behavior, comingfrom its source – the wheel rim itself.
Capturing a VortexIn Figure 11, helicity plots are calculated on a slice at circumferentialangle of 14 degrees, an angular position just below the leading edgeof the wheel. The inset side view of the wheel shows the locationof the circumferential plane, relative to the wheel. Three imagesshow helicity on this 14-degree plane for 0, 10 and 20 degrees ofyaw, from left to right, respectively. Helicity and velocity vectorsare colored to show areas of red where the flow is turning clockwiseand areas of blue where the flow is turning the other way,counterclockwise. What Godo and the team discovered was that at0 degrees of yaw at the front of the wheel, there were alternatingregions of circulation being propagated from the front of the tire.But at higher yaw angles, vortices of air were being shed from boththe front of the tire and the inner edge of the wheel rim. Thelocation around the wheel perimeter, the size, and the strength ofthese vortices were strongly related to the yaw angle.
The researchers now speculated that the periodic phenomenonmade visible by the massless particles is caused by the shedding ofthese vortices from the front of the tire and the inner rim along the
Figure 10
A surprising flowstructure wasrevealed comingfrom the innerleading edge of thewheel – a strongalignment of themassless particles,periodically rolledinto nearly straightlines, at an anglesloping up towardthe top of thewheel.

front of the wheel. Could the speed difference between the wheeland the approaching air be relevant?
From the front of the wheel down to the ground contact, thedifference between the speed of the wheel and the oncoming airdecreases. At the ground, the wheel speed and the ground plane aremoving at the same speed; the difference in flow speed is zero.
But, Godo explains, going from the top to the front of the wheel,following the direction of wheel rotation, shedding from the innerrim occurs sooner due to the higherdifference between the wheelvelocity and the oncoming air. As thisrelative speed difference decreasesgoing from the front of the wheeldown to the ground contact, theshedding of the vortex from the inner rim is delayed. This delay isthe phenomena Godo believes responsible for the well-aligned rowsof massless particles. The energy fluctuations associated with theperiodic shedding of these flow structures is the source of thedominant ‘wheel frequency signature,’ and this single parametercould give wheel manufacturers a way to differentiate theperformance of various wheel designs.
CFD Proves ItselfThe new insights gained from this study – the unexpected verticalforce transition and previously unseen flow structures – would havebeen lost in a mountain of complex data without the post-processingcapabilities of FieldView. Approximately 3.6 gigabytes of data weregenerated during the steady simulations, Godo says, and theunsteady simulations resulted in nearly 1.1 terabytes of data.
In the past, this quantity of data, its complexity, and the repetitivenature of the calculations would have posed a seeminglyinsurmountable challenge for researchers with limited software toolsand computing resources. Here, however, post-processing wassignificantly accelerated using FieldView running in parallel on eightprocessors. Godo used FieldView’s FVX™ programming languagefeature to automate much of the post-processing. FieldView FVXscripts handled a range of repetitive tasks, including:
� resolving the forces on the wheel into their drag, side (lift) and vertical components;� breaking the resolved forces into component contributions;� calculating resolved forces along the wheel circumference; and� preparing and reformatting the computed forces for seamless transfer into other software packages for further analysis.
Additional FieldView tools, such as automatic feature detection anddataset comparison, allowed Godo to interrogate the simulation
results quickly and effectively.
FieldView’s flexibility andsensitivity was readilyapparent in the creation of theunique views ofcircumferential variations and
helicity. Much more than just ‘pretty pictures,’ these illustrations andanimations gave Godo and his team rare insight into the wheel’saerodynamic performance. Good agreement with experimental windtunnel studies suggest that the approach Godo’s team developedholds considerable promise, and the findings offer compellingevidence that CFD simulation can be used to provide more definitiveanswers to some of the open questions within the competitive cyclingindustry.
If, as the study indicates, the wheel rim is the primary contributor tothe aerodynamic ‘signature’ of a wheel, design changes to the wheelrim depth and cross-sectional profile would benefit from furtherindependent analysis. Spoke count and shape, wheel diameter (650cor 700c) and tire size are other potential areas for study, and Godosuggests that another worthwhile extension of the study would beincluding and optimizing the front fork and frame and brake calipersin conjunction with a specific wheel.
Used in combination with wind tunnel testing, CFD simulation offersbike wheel manufacturers and designers an efficient, powerful wayto better understand and improve the aerodynamic performance oftheir products. In the race for speed, that 1% advantage is out there,just waiting to be revealed.n
Figure 11
In the past, this quantity of data, its complexity, and therepetitive nature of the calculations would have posed aseemingly insurmountable challenge.

Technology, Teamwork, Trust
For more than 25 years, Intelligent Light has been solving the toughest engineering challenges faced by manufacturing and researchorganizations around the world. Architected for today’s high performance computing environments, the company’s flagshipFieldView™ family of products combines true ease of use with the industry’s most sophisticated CFD post-processing and largedata visualization capabilities. Intelligent Light’s Applied Research Group conducts pure research on the cutting edge of CFD whilecustomizing and delivering real world solutions to customers in industries such as aerospace, automotive, general manufacturingand turbomachinery. Composed of leading experts in CFD, computer science, visualization and more, with a customer focused,results oriented philosophy, Intelligent Light drives CFD simulation for increased productivity, faster answers, deeper insight andmaximum return on investment.
FieldView and FieldView FVX are trademarks of Intelligent Light. AcuSim is a trademark of Acusolve Technologies, Inc.
© 2010, Intelligent Light 301 Rt. 17 North, 7th Floor, Rutherford, NJ 07070 +1.201.460.4700
www.ilight.com
A View from the Field
Josh Poertner knows wheels. An engineer and technical director at Zipp Speed Weaponry (Speedway, IN), Poertner and his teamhave accumulated more hours in the wind tunnel than any other company in cycling. Zipp continues to build on its reputation foradvanced, innovative products, sophisticated tooling, and precision engineering, including painstaking handwork.
With an average product lifecycle of only 12 months, Zipp wheels are constantlyevolving. Zipp was the first company to market with full carbon fiber disc wheels andthe first tri-spoke design wheel in the late 1980s. Subsequent wind tunnel testing onthat design provided drag numbers that completely changed the direction of thecompany’s wheel program and led to Zipp’s creation of deep section rims, now thestandard in professional racing.
Poertner is very impressed by the wheel simulation study presented here, noting that the results validate well against his windtunnel data and reveal phenomena which are not explained by the wind tunnel. “This research matches our experimental datavery closely and beautifully explains much of the ‘why’ that is not explained in raw wind tunnel data,” he says. “We see variousCFD aerodynamics reports all the time and have even been performing our own CFD for some years, but the drag plots nevermatch up to our data – never. This Intelligent Light study does. All the effects outlined in this study are ones that we couldmeasure in the tunnel, but generally could not explain, resulting in a highly iterative and prototype-intensive developmentprocess. The ability to understand and design for these effects before we prototype is a major advantage in both wheelperformance and time to market.”