a computational theory of enterprise transformationnserban/publications/eda/annieetal.pdf · a...
TRANSCRIPT
A Computational Theory of EnterpriseTransformationZhongyuan Yu, William B. Rouse,* and Nicoleta Serban
Tennenbaum Institute, Georgia Institute of Technology, Atlanta, GA 30332-0210A COMPUTATIONAL THEORY OF ENTERPRISE TRANSFORMATION
Received 13 August 2010; Revised 20 December 2010; Accepted 20 December 2010, after one or more revisionsPublished online in Wiley Online Library (wileyonlinelibrary.com). DOI 10.1002/sys.20188
ABSTRACT
This paper translates a qualitative theory of enterprise transformation into a quantitative, mathematicaltheory. This enables computational exploration of the phenomena outlined in the theory, as well as thesensitivity of these phenomena to a range of parameters intended to reflect the elements of the theory.The overall question addressed is, “What should an enterprise do in response to perceptions of impendingsubstantial change?” A mixture of three types of responses is considered—predict better, learn faster, andact faster. As these responses all require investments, it is not the case that an enterprise should alwayspursue all of them. Indeed, there are conditions under which an enterprise should not pursue any of them.This paper elaborates the nature of these conditions, explains why they arise, and discusses theimplications for enterprises entertaining transformation. © 2011 Wiley Periodicals, Inc. Syst Eng 14:
Key words: enterprise transformation; change strategies; computational modeling; change pointdetection
1. INTRODUCTION
Contemporary enterprises face enormous uncertainties. De-fense procurements may no longer be dominated by tradi-tional weapon systems. Healthcare delivery may transitionfrom pay for services to payment for health outcomes. Intel-ligent sensing and control technology may morph the energyecosystem. There are many examples of substantial uncertain-ties in other industries such as education, finance, and food[Rouse and Basole, 2010].
There are, at least, two types of uncertainty. First, theenterprise may not be sure of the nature of the impending
change. For example, the direction of the change may be clear,but its timing and magnitude may be uncertain. The secondtype of uncertainty concerns how best to respond to change.What should one’s offerings and processes become?
Given insights into or answers of these questions, how canone best allocate resources between the enterprise one has andthe enterprise one is striving to become? Thus, the leaders ofthese enterprises must wrestle with the question of whetherthey should invest in becoming better at what they are cur-rently doing versus investing in doing new things that willbetter match emerging market desires. In other words, shouldthey focus on business process improvement or enterprisetransformation?
These are difficult issues. Gerstner [2002, p. 64] portraysthis difficulty, indicating “Reengineering is like starting a fireon your head and putting it out with a hammer.” His approachto enterprise transformation was to turn IBM into a market-driven rather than internally focused, process-driven enter-pr ise. A recent study of four successfultransformations—Lockheed Martin, Newell Rubbermaid,Reebok, and UPS—has shown that there are a variety of
*Author to whom all correspondence should be addressed (e-mail:[email protected]).
Contract grant sponsor: This research was supported, in part, by the Mark &Kimberly Miller Charitable Foundation.
Systems Engineering© 2011 Wiley Periodicals, Inc.
1
Regular Paper

approaches to transformation, but some common underlyingcompetencies including vision, leadership, strategy, planning,communication, and cultural change [Rouse, 2011].
While current levels of uncertainty may seem unprece-dented, this is not the case. We are just entering the 40thdecade of American experience, at least from the perspectiveof European immigrants. In only seven of these decades hasthere not been a war or economic crisis. The 1880s was themost recent of such decades. Change and uncertainty arestrongly woven through American history.
In a study of 200 companies over the past 200 years in thetransportation, computer,1 and defense industries in theUnited States, it was found that many attempted transforma-tion in the face of change—and most failed [Rouse, 1996].More recently, The Economist reported that the Fortune 500has seen a 200% turnover in the past 25 years [Schumpeter,2009]. Thus, the challenge of enterprise transformation hasbeen, and continues to be, very significant.
To provide a framework for exploration of the nature ofenterprise transformation, Rouse [2005, 2006] proposed atheory of enterprise transformation. This theory focuses onwhy and how transformation happens, as well as ways inwhich transformation is addressed and pursued in terms ofwork processes and the architecture of these processes. Thistheory is stated as follows:
Enterprise transformation is driven by experienced and/oranticipated value deficiencies that result in significantly re-designed and/or new work processes as determined by man-agement’s decision making abilities, limitations, andinclinations, all in the context of the social networks ofmanagement in particular and the enterprise in general.
The purpose of this paper is to translate this qualitativestatement of the theory into a quantitative, mathematicaltheory to enable computational exploration of the phenomenaoutlined in the theory, as well as the sensitivity of thesephenomena to a range of parameters intended to reflect theelements of the theory. The overall goal is to address thequestion, "What should an enterprise do in response to per-ceptions of impending substantial change?” A mixture ofthree types of responses is considered—predict better, learnfaster, and act faster. As these responses all require invest-ments, it is not the case that an enterprise should alwayspursue all of them. In fact, there are conditions under whichan enterprise should not pursue any of them. This paperelaborates the nature of these conditions, explains why theyarise, and discusses the implications for enterprises entertain-ing transformation.
2. CONCEPTUAL FORMULATION
2.1. Model ConstructsThe central constructs of the theory are value, work processes,decision making, and social networks. Value is a measure of
the extent to which an enterprise provides a market what theconsumers in this market want. Increasing variations of offer-ings from what consumers want results in decreasing value.
We hasten to acknowledge that value can also accrue fromproviding customers an offering they did not expect, e.g.,Apple’s iPhone. This leads to innovation whereby the marketchanges its desires. Market innovators are usually not trans-formers; their innovations cause the other players in themarket to have to transform. Thus, for example, Wal-Martinnovated in the retail marketplace; K-Mart and Sears werethereby forced to transform.
Work processes are the means for translating an enter-prise’s intentions into market offerings. These processes de-pend on people, information, facilities, and equipment.Changing work processes requires investments, often sub-stantial investments.
There are several aspects of decision making. One con-cerns what is happening in the market. Is the value of offeringsincreasing or decreasing or holding steady? Another decisionconcerns how best to adapt to needed changes. Should oneinvest in predicting better, learning faster, or acting faster?
As elaborated later, another possibility is doing nothingdifferent. This has the advantage of being easy to do andperhaps not requiring any additional investment. Indeed, wehave found in working with numerous large enterprises thatthe status quo is often a very compelling alternative. We laterdiscuss the circumstances under which the status quo is thebest choice.
Social networks play several roles. First, of course, theyconstitute how work gets done in terms of who does what,who knows what, who knows who, and so on. They can alsofacilitate or impede change. Social networks can facilitatechange by embracing and rapidly diffusing change as has beenseen recently for e-mail and smart phones.
Social networks can also impede change, acting in waysanalogous to an enterprise immune system [Rouse, 1998].One way to impede change is to deny that it is needed. Thisdelays recognition of market signals that the value of anenterprise’s offerings is declining. Another impedance is re-luctance to change work processes. Competencies that pro-vided competitive advantage in the past may be preserved,perhaps receiving sustained investment, despite their de-creased relevance to competing in the future.
2.2. Conceptual Model
Figure 1 provides a high level conceptual model of the theoryof enterprise transformation that forms the basis for themathematical model introduced in the next section. Thismathematical model makes the concepts in Figure 1 quiteprecise.
The key elements of this model include the following:
• Management: Represents decisions to allocate re-sources to remediate value deficiencies and maximizeexpected utility
• Production: Represents mapping of resources, via la-bor, to products and services over time
1The roots of the computer industry in the second half of the 20th centurycan be traced back to the cash register and typewriter industries in the 19thcentury. Indeed, the leaders in these two industries were among the keyplayers in the early computer industry.
2 YU, ROUSE, AND SERBAN
Systems Engineering DOI 10.1002/sys

• Market: Represents mapping from products and serv-ices to value that leads to revenues, profits, and cashflows over time
• Social Network: Represents allocation of human atten-tion to deploy resources, including provision of infor-mation for decision making.
The overarching question to be asked of this model con-cerns how market uncertainties and social network charac-teristics affect the decisions management must make toallocate resources, including how the information available,plus predictions, affects the possibility of making well-in-formed decisions.
2.3. Broader Theories
Before addressing the mathematical formulation of the con-ceptual model in Figure 1, it is important to discuss the extentto which this model aligns with contemporary managementtheory. In other words, how does the theory of enterprisetransformation underlying this model fit in with broadertheories of business strategy?
It has long been recognized that strategy formation is nota static mapping, nor a simple mapping, from industry struc-ture to strategic plans to exploit this structure to maximizeprofits [Porter, 1991]. Even earlier, Schendel and Patton[1978] outlined the multidimensional nature of strategy,where profit is but one element. Mintzberg [1978] elaboratedthe interaction of the organization with the environment,
which contributed to Senge’s more recent view of organiza-tional learning [Senge, 1990].
Markides [1999] addressed the dynamic nature of strategyin terms of continuous reassessment and reformation. Milesand colleagues [1978] reviewed how organizations definestrategies relative to product-market domains and then alignstructure and processes to pursue these strategies. Moncrieff[1999] contrasted planned and emergent strategy in terms offive elements:
• Organizational intentions• Organizational response to the environment• Dynamics of the organization• Alignment of action with intentions• Strategic learning.
These elements are reflected in Figure 1, albeit with morecontemporary terminology.
There are additional important subtleties. Eisenhardt andMartin [2000] elaborated a resource-based view of strategyand contrasted moderately versus highly dynamic markets.They summarized evidence that analytical strategies workbest for the former, and experimental approaches work betterfor the latter. However, such differences are not inherent.Kelly and Amburgey [1991] reported that organizationalchange is not always related to discontinuous environmentalchanges, nor does it always relate to chances for survival.
Thus, it would be folly to argue that the theory presentedin this paper reflects how companies will inherently respondto circumstances that should prompt enterprise transforma-tion. Instead, the goal is to elaborate the strategic choicesavailable to companies who address transformation in thismanner and the conditions under which these choices makesense.
3. MATHEMATICAL FORMULATION
The goal is to convert the above conceptual model to as simplea mathematical model as possible that will enable repre-sentation of the central phenomena of interest and supportcomputational exploration of the nature of these phenomena,including their sensitivity to key parameters. Although ourmodel is simplified given the complexity of enterprise trans-
Table I. Summary of Key Parameters
Figure 1. Elements of the theory.
A COMPUTATIONAL THEORY OF ENTERPRISE TRANSFORMATION 3
Systems Engineering DOI 10.1002/sys

formation, it enables fundamental understanding of how keycharacteristics outlined in Figure 1 impact transformation ata higher level.
The model elaborated in this section has four key parame-ters as summarized in Table I. These parameters reflect centralelements of the theory of enterprise transformation. The nextsubsection presents a series of simulation experiments aimedat illustrating the sensitivity of market performance to themodel parameters and the role of these parameters in invest-ment strategies and in driving fundamental changes faced byan enterprise.
3.1. Market and Value ModelsThe market defines value. Hence, elaboration of the modelbegins with the market. The evolution of the market’s desiresis described by
XM(t + 1) = α XM(t) + (1 – α) W(t). (1)
The market’s desire at time t + 1, XM(t + 1), is driven by itsdesire at time t, XM(t), and a stochastic process denoted byW(t). While W(t) could take many forms, in this paper it isassumed to be a Gaussian variable with mean of 100 andvariance of 10. According to this model, the smaller alpha is,the more weight placed on the randomness of the marketimplying an instable market.
The market’s desire, XM, should be viewed as an abstractset of product or service characteristics sought by the market,e.g., price, performance, fuel economy, etc. Changing marketdesires requires a company to change their offerings accord-ingly if these offerings are to continue to be desired by themarket. Value is defined as a function, F, of the differencebetween market desires, XM, and the characteristics of acompany’s offering, XO, as denoted in
VM(t) = F[XM(t), XO(t)]. (2)
This function could take on various forms. The functionalform used for the simulation experiments discussed in thispaper is given by
VM(t) = EXP{–λ ABS[XM(t) – XO(t)]}. (3)
Thus, market value VM is assumed to decrease exponentiallywith absolute differences between market desires and marketofferings. Markets with higher lambda are more discriminat-ing than markets with lower lambda.
Figure 2 depicts the impact of alpha on market desires(upper plot) and perceived market value (lower plot). Whenalpha is large (e.g., alpha ≥ 0.8), the market is more stable,resulting in more predictable market desires and market value.When alpha is smaller (e.g., alpha < 0.5), the market becomes
Figure 2. Impact of market dynamics.
4 YU, ROUSE, AND SERBAN
Systems Engineering DOI 10.1002/sys

noisy, resulting in a more random market behavior regardlessof whether there is a significant trend or not. Later results willshow that as alpha decreases, a company’s abilities to changesuccessfully greatly diminish. This has a direct impact on thechoice of the investment strategy.
Figure 3 shows the impact of lambda, representing theextent to which customers are highly discriminating relativeto differences between XO and XM. Small lambda indicatesforgiving customers, while larger lambda indicates discrimi-nating ones. As expected, perceived market value decreasessubstantially when lambda increases.
An important issue for a company concerns how quicklythey learn about market value, especially when the nature ofvalue is changing [Eisenhardt and Bourgeois, 1989]. Unfor-tunately, many companies are sometimes slow to recognizethat they are no longer delivering value as in the past. This isdue in part to the practicalities of data collection and interpre-tation. However, there are social factors that affect howquickly a company learns, as elaborated below.
The delay in recognizing value changes is represented bydifferentiating perceived value, VP, from actual market value,VM, as defined by
VP(t + 1) = δ1 VM(t) + δ2 VM(t – 1) + δ3 VM(t – 2) + ⋅ ⋅ ⋅.(4)
Ideally, δ1 equals 1 and the higher order deltas δ2, δ3, δ4, ...are zero. Unfortunately, the higher order deltas may dominatewhat a company perceives; e.g., what used to be highly valuedmay be seen by the company as still highly valued, althoughit may not be, as recently illustrated by the automobile com-panies. In this paper, to avoid confusion and extensive nota-tion, when we say that delta equals 2, we mean that the secondorder delta δ2 equals 1 while the other deltas are all zero, forexample.
The challenge for a company in a changing market is toget XO as close as possible to XM to yield the highest VM,subject to the difficulty of only knowing VP. “Closeness” ismost important for highly discriminating markets, although
large variations between XO and XM will be strongly penal-ized by all markets.
3.2. Work Process Model
The work processes of a company determine the charac-teristics of the company’s product and service offerings. If XMchanges suddenly, perhaps due to an economic crisis, a com-pany may find it difficult to immediately shift XO to matchXM. This difficulty is represented by
XO (t + 1) = β XO (t) + (1 – β) XF (t + T) (5)
A company’s offerings at time t + 1, XO(t + 1), are highlyinfluenced by its offerings at time t, XO(t), as well as itsforecast, XF(t + T), of future market desires, XM. Offeringdesign, equipment, and facilities may be such that they cannotbe morphed quickly; e.g., shifting from producing pickuptrucks to economy cars may take time. Beyond being apractical issue, such changes may be impeded by socialforces, as discussed below.
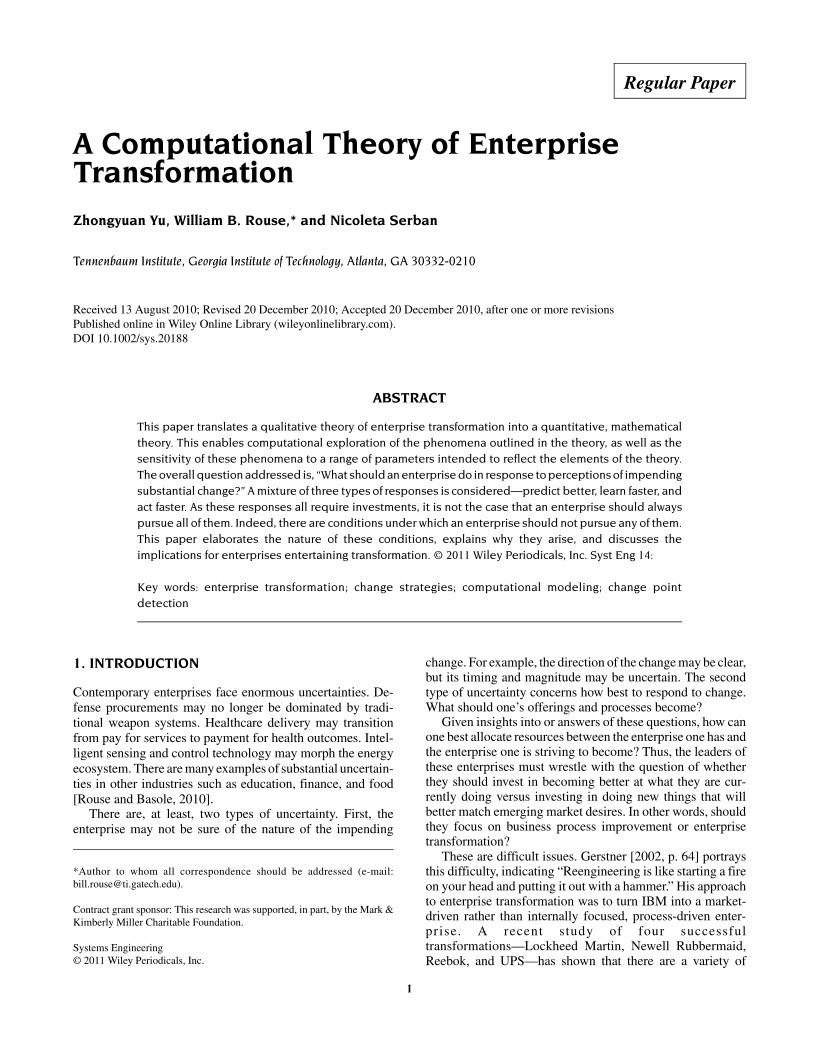
Figure 4 illustrates the impact of the beta parameter on themarket offering XO (upper plot) and on the perceived marketvalue VP (lower plot). For example, in the upper plot, at timet = 120, the market desire is around 220. However when betaequals 0.8, the company can only respond with an offering ofabout XO = 180, which will result in lower market value. Thuslower values of beta imply that the company can act morequickly and is better in tracking changes in market desires.On the other hand, the sluggishness of the company has asubstantial impact on its responsiveness to change.
As indicated in Eq. (5), the characteristics of a company’sofferings are affected by previous offerings XO(t), as well asthe company’s market forecasts, denoted by XF(t + T) withprediction horizon T in Eq. (6).
XF(t + T) = F[XM___^(t), XM___^
(t – 1), XM___^(t – 2), ⋅ ⋅ ⋅] (6)
Figure 3. Impact of market discounting.
A COMPUTATIONAL THEORY OF ENTERPRISE TRANSFORMATION 5
Systems Engineering DOI 10.1002/sys
The many nuances and subtleties of Eqs. (1)–(6), includingthe impacts of α, β, δ, and λ, are discussed in the subsequentsection describing the simulation experiments.
3.3. Decision Making
In this section, attention shifts to the nature of managementdecision making in the context of the proposed computationaltheory of enterprise transformation. Succinctly, what choicesdoes management have and how should resources be allocatedamong these alternatives? There are four major types ofdecisions to be addressed. First of all, given a sluggish com-pany with delayed market feedback, management could de-cide to invest in making better and longer-range predictions,i.e., predict better. This is a good idea to the extent that alphais large enough to enable accurate predictions. For example,this works really well for sales that are driven by demograph-ics, e.g., it is easy to predict how many young children willreach school age next year.
Another, complementary, decision would be to learn faster.This would involve investing in the infrastructure and peoplefor information gathering and interpretation in hope of shift-ing the weights in Eq. (4) towards more recent market data.There can be, as noted earlier, social forces that can inhibitthis. To counteract such forces, companies often employ focusgroups of consumers to get external views of the value of their
products and services. Later discussions consider the impactof such investments on ∆V/∆δ , which should inform invest-ment decision making.
A third complementary decision would be to act faster.This would involve investing in people, processes, equipment,and so on to decrease beta in Eq. (5). The result would be aless sluggish company that can change XO much faster inresponse to forecasts of changing XM. A good example of thisis Honda’s investment in flexible production lines that en-abled shifting production to the smaller cars in its lineup whendemand for larger cars faded. The impact of such investmentson ∆V/∆β is also discussed later.
Finally, management could focus on more quickly detect-ing market changes, i.e., detect faster. This involves the topicof change point detection, which is elaborated in the discus-sion of the simulation experiments. Put simply, there is atradeoff between the “power” of change point decisions, e.g.,the probability of correctly rejecting the null hypothesis of nochange, and the time it takes to conclude that a change hashappened. The power threshold chosen can be highly influ-enced by social forces and cultural attributes of an enterprise.
3.4. Social Networks
A company is not just a set of human, physical, and financialresources organized around creating and delivering what the
Figure 4. Impact of enterprise social network.
6 YU, ROUSE, AND SERBAN
Systems Engineering DOI 10.1002/sys

market desires. A company is also a social system that tendsto have enormous—positive and negative—impact on theenterprise’s abilities to change [Rouse, 1993, 2005, 2006,2007 and the references therein]. This social system canfacilitate change via rapid communication and support ofappealing changes. It can also inhibit change, much like animmune system, when the changes being entertained conflictwith the concerns, values, and perceptions of key stakehold-ers.
Beta and delta within the model elaborated in the previoussection reflect social phenomena just as much as they reflectpractical limitations on change. Acting faster, by decreasingbeta to enable doing new things, will usually compete forresources with the status quo. Indeed, in times of stressfulchange, the “as is” enterprise can consume enormous re-sources trying to sustain the incumbent business model. Jobs,livelihoods, and political support may hang in the balance. Forexample, shifting investments from bending metal to codingsoftware will likely encounter stiff resistance from thoseweaned on bending metal.
Learning faster, by shifting delta to gain market knowledgemore quickly, will compete with organizational belief sys-tems about market value and the extent to which the statusquo remains competitive [Rouse, 1993, 1998]. Denial ofchange is often easier to argue than acceptance of changecoupled with a lack of action. The insularity typical of largesuccessful enterprises is likely one of the reasons the Fortune500 experiences such high levels of turnover [Schumpeter,2009].
There is also a social aspect to the statistical power re-quired for agreement that change has happened. If the thresh-old is very high, say 90–95%, then the company will be quitedelayed in reacting to change. On the other hand, if thethreshold is quite low, perhaps 50–60%, then the companywill react to apparent changes that have not actually occurred.There are typically very strong social forces against abandon-ing a business model that was the source of previous success.This perspective can be quite reasonable when it is not at allclear what new business models will succeed.
4. SIMULATION EXPERIMENTS
To support the qualitative insights into the enterprise transfor-mation theory, computational experiments were conducted toassess the sensitivity of a company’s performance (i.e., aver-age market value realized) to market trends and model pa-rameter settings (i.e., α, β, δ, and λ). Since the theory oftransformation is driven by recognition of experienced oranticipated value deficiencies, these experiments required amechanism for a company to detect change. Consequently,this section begins with consideration of change point detec-tion. With this mechanism defined, focus then shifts to thethree strategic decisions that a company should entertain—predicting better, learning faster, and acting faster.
4.1. Change Point Detection
Change Point Detection Theory. The observations in thisstudy, Yj, j = 1, . . . , n, are the perceived market values VP
realized at different time points tj, j = 1, . . . , n. A companyis interested in deciding whether there is a change in VP withina given period of time.
A simple linear model for the perceived market values isgiven by
Yj = b0 + b1 ∗ tj + εj for j = 1, . . . , n, (7)
where the εj’s are error terms and assumed to be identicallydistributed but correlated. Under this model, the hypothesisof a change point in the perceived market value is
H0: Yj = b0 + b1 ∗ tjj for j = 1, . . . , n, (8)
vs.
HA: Yj = b0 + b1 ∗ tj if j < ρ and
Yj = b0∗ + b1
∗ ∗ tj if j ≥ ρ (9)
where b0 ≠ b0∗ or/and b1 ≠ b1
∗. That is, under the alternativehypothesis the regression line changes its slope and/or itsintercept, which is an indication of a change point at tj in theobserved data. For detecting a change point, one computes atest statistic Uj at a given time point tj using the approachelaborated in the Appendix. High U values indicate a potentialchange in intercept and/or slope at the corresponding timepoints.
However, a high U value alone does not guarantee a changepoint; one has to make an inference of how high the U valueneeds to be using the test p-value. In this study, this is achievedby using bootstrap sampling, since the distribution of the teststatistic under the null hypothesis does not have a closed formexpression. This is because the observations Yj, j = 1, . . . , n,are serially correlated, and, therefore, the classical assumptionof independence does not hold. Application of the bootstrapsampling procedure for obtaining the significance level andthe p-value is described in the Appendix. If the p-value islower than a preset test significance level, specifically 0.05 inthis paper, one accepts the alternative hypothesis of a changepoint. In the context of this study, the p-value corresponds tothe probability of deciding a change in the market value at agiven time point although no change has happened. Thesmaller the p-value, the smaller is the probability of makingan error of deciding that there is a change in the perceivedmarket value when there is in fact not a change.
An important aspect of the testing procedure discussedabove is the power of detecting a change in the market valuegiven market trends and parameter settings (i.e., α, β, λ, andδ). For this, Monte Carlo simulations are employed as dis-cussed in the Appendix. The power of the test provides aprobabilistic assessment of the effectiveness of the changepoint detection procedure described in this paper. The higherthe power, the more accurate the decisions are.
The change point detection procedure is applied to selectedobserved time points—in this study, the actual change pointis time point 101 and the selected observed time units are from101 to 110. Therefore, for each selected time point, we derivetheir corresponding U values, U101, U102, . . . , U110 and
A COMPUTATIONAL THEORY OF ENTERPRISE TRANSFORMATION 7
Systems Engineering DOI 10.1002/sys

p-values, p101, p102, . . . , p110. Then for the same parametersettings, the above simulation procedure is repeated 60 times.The power of the detection test at each of the selected timepoints is obtained by counting the number of simulations thathave p-values less than the 0.05 preset significance level.Detection time is defined as the smallest number of timepoints needed to detect a change. That is, the detection timeis the first time point among t101, . . . , t110 for which thecorresponding power of the detection test is larger than acompany’s decision threshold.
The length of time to discover a change in the market valuevaries from one company to another and from one businesssetting to another, as reflected by market trends and modelparameters (i.e., α, β, δ, and λ). A company may choose adifferent decision threshold, i.e., power threshold, to detect achange. For example, an aggressive company may set thedecision threshold as 60%, implying the company will takeaction when it is 60% sure that there is a change, whereas aconservative company may set this threshold as high as 95%.
Change Point Detection Results show how trend, alpha,beta, lambda, and delta, as well as the company’s decision-making criteria, affect the delay in discovering that changehas happened in the market according to the simulation.
Effect of trend: Not surprisingly it is easier for companiesto detect sudden and rapid changes than slow and stablechanges.
Effect of market dynamics (α): Stable markets (higher α)naturally will display higher power to detect a change pointin the market value. However, when β is quite high (β ≥ 0.5),the sluggishness reduces the effect of alpha; therefore, thedifferences in market value trends for varying alpha are notsignificant.
Effect of enterprise social network (β): Sluggish compa-nies (higher β) can detect change more easily, although theycannot act sufficiently quickly to compensate for this change.
In this way, a company’s sluggishness can act as a filter onmarket signals, which makes change more pronounced.
Effect of market social network (δ): Increasing delta willdirectly delay detection time. The increased delay of detectiontime caused by the delta is approximately the same as theobservation delay of the market value due to larger δ. Assumethe actual change happens at period 101, when there is nodelay in learning the market value (δ1 = 1), it is quite possibleto detect the change at period 102. When there is 2-time-unitdelay (δ3 = 1), one will likely detect change at period 104.
Effect of market discounting (λ): Discriminating custom-ers (higher λ) are those that sharply discount the value ofproducts or services that do not closely match their desires.Such discounting will delay the detection of change, becausethe volatility of market value caused by crisply defined marketdesires rather than trend changes impedes the detection ofchange.
4.2. Decision Making
Predict Better. In a stable market, given a sluggish companywith delayed market feedback, management could decide toinvest in better and longer-range predictions to force thecompany to change by using predictions of future marketdesires to drive the current market offering, much in the sameway that a supertanker captain uses the longer term desiredpath to drive shorter-term steering decisions. This is accom-plished by setting XO(t + 1) = β XO(t) + (1 – β) XF(t + T)with prediction horizon T (T time units ahead), where T canbe determined by beta, the sluggishness of a company.
Figure 5 shows how different look-ahead periods can affectmarket value. If the enterprise social network (β) is equal to0.5, it is better to look ahead 2 time units, as the dotted curvehas the highest market value. For each beta, there are alwaysone or two best look-ahead periods. Figure 6 shows howlook-ahead time units should be adjusted for beta, and howdifferent look-ahead time units affect average market value.
Figure 5. Market value vs. number of time units look ahead.
8 YU, ROUSE, AND SERBAN
Systems Engineering DOI 10.1002/sys

When beta equals 0.5, it is better to look ahead 2 time units,as we can see the dashed curve has the highest average marketvalue. The trend and alpha do not change where the maximaoccur, but change how pronounced the maxima are.
Learn Faster. The delay of change point detection timeleads to lost value. The lost value is calculated by the time-cumulative value until the company catches up with the targetvalue that would have occurred had detection not been de-layed (the area between the nondelayed and delayed detectiontime). Results show that lower α and higher β, i.e., sluggishcompanies in unstable markets, experience greater loss whenthere is a delay in detection of a change. The market socialnetwork (δ) will directly affect the detection time. The in-creased delay of detection time caused by delta is approxi-mately the same as the delta increase.
Figure 7 shows ∆V/∆δ, which is defined as the averagedifference of total lost value caused by the 1 unit detectiontime change as a function of the market dynamics (α). Fromthis figure we can see that higher α results in shorter detectiontimes and smaller total lost value. Also, the longer companieswait to make decisions, the more loss per time unit they willencounter.
Act Faster. One reason for low market value is the slug-gishness of a company (reflected by high beta). A decision toact faster (decrease beta) involves investing in people, proc-esses, equipment, and so on. An enterprise is interested in the
impacts of such investments on ∆V/∆β. These results aresufficiently compelling to discuss them in the next section.
4.3. Summary of Results
The simulation results discussed in this previous section canbe summarized as follows: Change point detection time de-creases with increasing trend and alpha, and increases withincreasing lambda and delta. The best case is a strong trendin a stable market for a responsive company that learnsquickly and has forgiving customers. The worst case is a mildtrend in a noisy market with a sluggish company that is slowto learn and has highly discriminating customers. Interest-ingly, sluggishness is good in the sense that it decreasesdetection time but, on balance, is bad in that it inhibitsresponding to what is detected.
Investments in predicting better can compensate for highbeta, with the optimal prediction period increasing with beta,independent of alpha and trend. Thus, if one’s company ismore like a supertanker than a speedboat, longer-term predic-tions should drive decisions regarding how best to trackmarket desires. Noisier markets will result in less accuratepredictions, but nevertheless these predictions should drivedecisions.
Learning faster results in less lost value due to delayeddetection of change points, which provides greater returns
Figure 6. Average market value vs. beta.
A COMPUTATIONAL THEORY OF ENTERPRISE TRANSFORMATION 9
Systems Engineering DOI 10.1002/sys

(less lost value) for companies with low beta in markets withhigh alpha. Thus, learning faster helps most when the marketis more predictable and a company can respond quickly.
Acting faster by investing in decreasing beta yields im-proved market value, independent of alpha for low initialmarket value, but very much dependent on alpha for higherinitial market value. An enterprise can only approach maxi-mum value in very predictable markets when it can actquickly.
5. IMPLICATIONS FOR INVESTMENTS
These results beg the question of how best to allocate scarceresources to improve market value. Acting faster is powerful,particularly in stable markets with strong trends. If the marketis very noisy or the trend is weak, then investing to reducebeta may not be worthwhile. In such situations, it may be bestto stay with the status quo—after all, this may not require anyadditional investment and the company already knows how todo it. Changing, in contrast, will require investment and, if themarket is sufficiently noisy, may result in a situation just asbad (or worse) as not changing at all.
The overarching question concerns: When to act and whennot to act? We answer this question by assessing the return∆V/∆β for varying values of alpha, beta, and lambda. Ingeneral, ∆V/∆β should exceed some threshold to warrant
investing in change. The threshold will depend on how ∆Vand ∆β are monetized, i.e., what ∆V is worth and what∆β costs. One could easily imagine, for example that ∆V/∆β>1 could be the investment criteria.
Figure 8 shows how much market value increases for betadecreasing from 0.1 to 0. Under this scenario, the return ishigh when alpha and lambda are both high. In other words, ifthe market is more predictable, customers are discriminatingand one can act quickly, the return is high. On the other hand,if the market is noisy or customers are not discriminating, thelikely return (∆V) from investing is not worth the cost of theinvestment (∆β).
Figure 9 illustrates how much market value increases forbeta decreasing from 0.5 to 0.4. Under this scenario, the returnis high for median alpha and median lambda. This may seemcounterintuitive. The reason is that there are two underlyingphenomena.
• When customers are forgiving, it is not worth investingas one is already “hitting the target” of maximum value.
• When customers are highly discriminating, it is notworth investing because one is very unlikely to “hit thetarget.”
• When the market is less noisy, the investment is worthmore until the market becomes highly predictable be-cause in this case one would already be “on target.”
Figure 7. Investments in learning faster, ∆V/∆δ.
10 YU, ROUSE, AND SERBAN
Systems Engineering DOI 10.1002/sys

Figure 10 illustrates how much market value increases forbeta decreasing from 0.9 to 0.8. If customers are discriminat-ing (high λ) and one acts slowly (high β), one is unlikely tohit the target. On the other hand, if the customers are notdiscriminating and the market is noisy, it may be worthinvesting to act a bit faster as it increases the chances of hittingthe target, considering how poorly one is currently perform-ing.
As indicated earlier, predicting better and learning fastercan always be justified, with the prediction horizon adaptedto the level of sluggishness of the company. The returns onsuch investments will be greater for more predictable marketsand less sluggish companies. Considering the likelihood thatsuch investments will be much smaller than those needed todecrease beta, these investments are much easier to justify.
Figure 8. Investments in acting faster, ∆V/∆β (β = 0.0–0.1).
Figure 9. Investments in acting faster, ∆V/∆β (β = 0.4–0.5).
A COMPUTATIONAL THEORY OF ENTERPRISE TRANSFORMATION 11
Systems Engineering DOI 10.1002/sys

To summarize, investing in transformation is likely to beattractive when one is currently underperforming and thecircumstances are such that investments will likely improveenterprise performance. In contrast, if one is already perform-ing well, investments in change will be difficult to justify.Similarly, if performance cannot be improved—due to noisymarkets and/or highly discriminating customers—then in-vestments may not be warranted despite current underperfor-mance.
6. CONCLUSIONS
The computational theory elaborated in this paper predictsthat companies will transform their enterprise by some com-bination of predicting better, learning faster, and acting faster,as long as the market is sufficiently predictable to reasonablyexpect that transformation will improve the market value thecompany can provide. If this expectation is unreasonable, thencompanies will sit tight and preserve resources until themarket becomes more fathomable.2
The theory elaborated in this paper is premised on thenotion that companies make transformation decisions in re-sponse to the dynamic situations in which they find them-selves. These decisions are affected by both what the companyknows (or perceives) and the company’s abilities to predict,learn, and act. Indeed, decisions to transform abilities topredict, learn, and act reflect desires to fundamentally changethe company’s overall ability to create market value. In thisway, transformation decisions can enhance a company’s abili-ties to address the ongoing and anticipated transformationsneeded for success in dynamic markets.
APPENDIX: TEST FOR A CHANGE-POINT INLINEAR REGRESSION
The observations are (Xj, Yj), j = 1, . . . , n, where X jg = (1,
xj,1, . . . , xj,p are a set of predictors. In this article, the responseYj corresponds to perceived market value whereas the predic-tor is time (p = 1).
The null hypothesis of interest is that the observationssatisfy a linear regression model:
H0: Yj + Xjgβ + εj for j = 1, . . . , n. (10)
The alternative hypothesis is HA, that there is a change-pointρ such that
Yj = Xjgβ + εj if j < ρ and
Yj = Xjgβ∗ + εj if j > ρ for β ≠ β∗. (11)
Here εj for j = 1, . . . , n are errors assumed to be identicallydistributed but correlated.
In this study, the likelihood ratio test provided by Kim[1994] was applied to detect changes in linear regressionmodels with the modification of the p-value.
The likelihood test statistic is defined as follows: Fork = 1, …, p, let ak be the (p + k) × 1 vector with 1 and –1 atthe (2k – 1)st and the (2k)th component, respectively, and 0 inall other components, and let Xk,j be the n × (p + k) matrix suchthat
Xk,jek,i = (1jg, 0j
g) for i = 1, (12)
Xk,jek,i = (0jg, 1j
g) for i = 2, (13)
Figure 10. Investments in acting faster, ∆V/∆β (β = 0.8–0.9).
2This can be observed during the current (2010) economic conditions wherecompanies are making strong profits, but hoarding cash rather than investingin increased capacity and/or new offerings due to great uncertainties aboutwhere the economy is headed.
12 YU, ROUSE, AND SERBAN
Systems Engineering DOI 10.1002/sys

Xk,jek,i = xi−1
2,1, . . . , xi=1
2,j 0n−j
g for i = 3, 5, . . . 2k−1,(14)
Xk,jek,i = 0n−j
g , xi−12
,j+1, . . . , xi−12
,n for i = 4, 6, . . . 2k,(15)
Xk,jek,i = xi−1
2,1, . . . , xi−1
2,n for i = 2k + 1, 2k + 3, . . . ,(16)
Xk,jek,i = x i
2,1, . . . , x i
2,n for i = 2k + 2, 2k + 4, . . . , (17)
where 1j is the length vector of 1’s, 0j is the j length vector of0’s, and ek,i is the (p + k) length vector with 1 in the ithcomponent and with 0 in all other components. Fork = 1, …, p, we further define
Uk(j) = a k,j
g (X k,jg X k,j)
−1Xk,jg Y
a k,j
g (X k,jg X k,j)
−1ak,jg
−1
2
, (18)
where Y = (Y1, . . . , Yn)′. Lastly, the test statistic referred asthe U value in this paper is
U(Y) = σ̂−2 maxp ≤ j ≤ n−p
||U(j)||2 = σ̂−2 maxp ≤ j ≤ n−p
{U12(j) + ⋅ ⋅ ⋅ + Up
2(j)}(19)
where σ̂−2 is the maximum likelihood estimate of σ2 underH0.
Worsley [1983] studied the likelihood ratio test (LRT) fortesting H0 against HA, and provided an upper bound for thesignificance level of the test. However, in this case study, theassumption of independence among Y1, . . . , Yn does not holdas they are serially correlated, and therefore, existing LRTresults do not apply. Instead a resampling method calledparametric bootstrap is used to sample from the null distribu-tion of the test statistic defined above which will furtherprovide an approximation of the p-value of the change pointhypothesis test. Specifically, a sample of the test statistic isobtained under the null hypothesis as follows:
1. Fit a linear regression under the null hypothesis:H0: Y
^j = Xj
gβ̂ where β̂ are estimated coefficients. Extractthe residuals Rj = Yj − Xj
gβ̂, j = 1, . . . , n.2. Permute the residuals R1, . . . , Rn to obtain a new sample
from the error distribution: R1∗ , . . . , Rn
∗. 3. Obtain a new sample from the null hypothesis:
Yj∗ = Xj
gβ̂ + Rj∗, j = 1, . . . , n.
4. Repeat 2–3 for B (= 1000) times.
Using this re-sampling technique, we obtain B samplesfrom the null hypothesis Y∗b = (Yj
∗b, . . . , Yj∗b) for b = 1, . . . ,
B and for each sample we can compute the U value,U∗b = U(Y∗b). We approximate the p-value using
p-value = 1B
∑ b=1
B
I(U(Y) ≥ U(Y ∗b)). (20)
An important evaluation criterion of a hypothesis test is itspower, defined as the probability of rejecting the null hypothe-sis when the alternative hypothesis is true. In the context ofthis problem, the power of the test is translated as the prob-ability of detecting a change when a company indeed has achange in the market value. Similarly to the computation ofthe p-value, because one does not have a close form expres-sion for the distribution of the test statistic, Monte Carlosimulations are employed to obtain an approximation of thepower of the change point detection test. Specifically, giventhe parameter settings (i.e., trend, α, β, λ, and δ), S = 60samples are generated from the model. One then evaluates thenumber of times the p-value is smaller than a significancelevel (0.05 in this paper) divided by the number of samples,S.
Remark: In change point detection theory, one tuningparameter that may affect the reliability measured by thep-value and the accuracy measured by power of the testhypothesis for detecting a change is the number of observa-tions set before (past) and after (future) a test time point. Thestudy shows that the test results are not sensitive to theselection of the future and past points as long as the ratiobetween them is less than 2/3 and as soon as the number ofpast time points is between 20 and 40 and the number of futuretime points is 5–15, respectively. However, when, for exam-ple, the number of past time points is too large or the numberof future time points is too small, the accuracy of the decisionregarding change in the market decreases.
REFERENCES
K.M. Eisenhardt and L.J. Bourgeois, Making fast strategic decisionsin high-velocity environments, Acad Management J 32(3)(1989), 543–576.
K.M. Eisenhardt and J.A. Martin, Dynamic capabilities: What arethey? Strategic Management J 21(10–11) (2000), 1105–1121.
L.V. Gerstner, Jr., Who says elephants can’t dance? Inside IBM’shistoric turnaround, Collins, New York, 2002, 64.
E.S. Hanawalt and W.B. Rouse, Car wars: Factors underlying thesuccess or failure of new car programs, Syst Eng 13(4) (2010),189–403.
D. Kelly and T.L. Amburgey, Organizational inertia and momentum:A dynamic model of strategic change, Acad Management J 34(3)(1991), 591–612.
H.-J. Kim, Tests for a chance-point in linear regression, IMS LectureNotes, Monograph Series, Volume 23, Institute of MathematicalStatistics, Beachwood, OH, 1994.
C.C. Markides, A dynamic view of strategy, Sloan Management Rev40(1) (1999), 55–63.
R.E. Miles, C.C. Snow, A.D. Meyer, and H.J. Coleman, Jr., Organ-izational strategy, structure, and process. Acad Management Rev3(3) (1978), 546–562.
H. Mintzberg, Patterns in strategy formation, Management Sci 24(9)(1978), 934–948.
J. Moncrieff, Is strategy making a difference? Long Range Plan Rev32(2) (1999), 273–276.
M.E. Porter, Towards a dynamic theory of strategy, Strategic Man-agement J 12(S2) (1991), 95–117.
A COMPUTATIONAL THEORY OF ENTERPRISE TRANSFORMATION 13
Systems Engineering DOI 10.1002/sys

W.B. Rouse, Catalysts for change: Concepts and principles forenabling innovation, Wiley, New York, 1993.
W.B. Rouse, Start where you are: Matching your strategy to yourmarketplace, Jossey-Bass, San Francisco, 1996.
W.B. Rouse, Don’t jump to solutions: Thirteen delusions that under-mine strategic thinking, Jossey-Bass, San Francisco, 1998.
W.B. Rouse, A theory of enterprise transformation, Syst Eng 8(4)(2005), 279–295.
W.B. Rouse (Editor), Enterprise transformation: Understanding andenabling fundamental change, Wiley, Hoboken, NJ, 2006.
W.B. Rouse, People and organizations: Explorations of human cen-tered design, Wiley, Hoboken, NJ, 2007.
W.B. Rouse, Necessary competencies for transforming an enter-prise, J Enterprise Transformation 1(1) (2011), in press.
W.B. Rouse and R.C. Basole, “Understanding complex product andservice delivery systems,” Handbook of service science, P.Maglio (Editor), Springer, London, 2010, pp. 461–480.
D. Schendel and G.R. Patton, A simultaneous model of corporatestrategy, Management Sci 24(15) (1978), 1611–1621.
J. Schumpeter, Taking flight, The Economist (September 19, 2009),78.
P.M. Senge, The fifth discipline: The art and practice of the learningorganization, Doubleday/Currency, New York, 1990.
K.J. Worsley, Testing for a two-phase multiple regression, Tech-nometrics 25 (1983), 35–42.
Zhongyuan (Annie) Yu is a Ph.D. student in the School of Industrial and Systems Engineering of Georgia Tech and aGraduate Research Assistant at the Tennenbaum Institute. Her research focuses on economic decision analysis andhuman decision making. Zhongyuan has various intern and project experiences in fields ranging from manufacturingto supply chain management, to airline operations research, to real estate consulting and banking, and she has publishedrelated papers, such as “The Application of Industrial Engineering in Manufacturing Management” and “Modeling andSolving the Spatial Block Scheduling Problem in Shipbuilding Industry using Particle Swarm Optimization.”Zhongyuan received a B.S. in Mechanical and Industrial Engineering in Tongji University (Shanghai, China) with aminor in Journalism at Fudan University (Shanghai, China), and an M.S. in Industrial Engineering at Georgia Tech.
Bill Rouse is the Executive Director of the Tennenbaum Institute at the Georgia Institute of Technology. He is also aprofessor in the College of Computing and School of Industrial and Systems Engineering. His research focuses onunderstanding and managing complex public-private systems such as healthcare, energy and defense, with emphasison mathematical and computational modeling of these systems for the purpose of policy design and analysis. Rousehas written hundreds of articles and book chapters, and has authored many books, including most recently EconomicSystems Analysis and Assessment (Wiley, 2011), People and Organizations: Explorations of Human-Centered Design(Wiley, 2007), Essential Challenges of Strategic Management (Wiley, 2001), and the award-winning Don’t Jump toSolutions (Jossey-Bass, 1998). He has edited or co-edited numerous books including Engineering the System ofHealthcare Delivery (IOS Press, 2010), The Economics of Human Systems Integration (Wiley, 2010), EnterpriseTransformation: Understanding and Enabling Fundamental Change (Wiley, 2006), Organizational Simulation: FromModeling & Simulation to Games & Entertainment (Wiley, 2005), the best-selling Handbook of Systems Engineeringand Management (Wiley, 1999, 2009), and the eight-volume series Human/Technology Interaction in Complex Systems(Elsevier). Among many advisory roles, he has served as Chair of the Committee on Human Factors of the NationalResearch Council, a member of the U.S. Air Force Scientific Advisory Board, and a member of the DoD Senior AdvisoryGroup on Modeling and Simulation. Rouse is a member of the National Academy of Engineering and has been electeda fellow of four professional societies—Institute of Electrical and Electronics Engineers (IEEE), the InternationalCouncil on Systems Engineering (INCOSE), the Institute for Operations Research and Management Science (IN-FORMS), and the Human Factors and Ergonomics Society (HFES).
Nicoleta Serban is an assistant professor in the School of Industrial and Systems Engineering at Georgia Institute ofTechnology. She received her Ph.D. and M.S. in Statistics from Carnegie Mellon University. She also holds a B.S. inMathematics and an M.S. in Stochastic Processes and Theoretical Statistics from the University of Bucharest. Dr.Serban’s research crosses multiple disciplines including methodological statistics, molecular biology, healthcare,industrial engineering and socio-economics. Her primary methodological contributions in statistical research are forthe analysis of multiple time-varying random functions. Dr. Serban’s research has been published or accepted in morethan 15 journal articles, most in top journals in statistics, engineering and biology.
14 YU, ROUSE, AND SERBAN
Systems Engineering DOI 10.1002/sys