a critical role for the right fronto-insular cortex in - daniel levitin
TRANSCRIPT
A critical role for the right fronto-insular cortex inswitching between central-executive anddefault-mode networksDevarajan Sridharan*†‡, Daniel J. Levitin§, and Vinod Menon*†‡¶
*Department of Psychiatry and Behavioral Sciences, †Program in Neuroscience and ¶Neuroscience Institute at Stanford, Stanford University Schoolof Medicine, Stanford, CA 94305 and §Department of Psychology, School of Computer Science and Program in Behavioural Neuroscience,McGill University, 1205 Avenue Penfield, Montreal, QC, Canada H3A 1B1
Edited by Marcus E. Raichle, Washington University School of Medicine, St. Louis, MO, and approved June 20, 2008 (received for review January 1, 2008)
Cognitively demanding tasks that evoke activation in the brain’scentral-executive network (CEN) have been consistently shown toevoke decreased activation (deactivation) in the default-modenetwork (DMN). The neural mechanisms underlying this switchbetween activation and deactivation of large-scale brain networksremain completely unknown. Here, we use functional magneticresonance imaging (fMRI) to investigate the mechanisms underly-ing switching of brain networks in three different experiments. Wefirst examined this switching process in an auditory event seg-mentation task. We observed significant activation of the CEN anddeactivation of the DMN, along with activation of a third networkcomprising the right fronto-insular cortex (rFIC) and anterior cin-gulate cortex (ACC), when participants perceived salient auditoryevent boundaries. Using chronometric techniques and Grangercausality analysis, we show that the rFIC-ACC network, and therFIC, in particular, plays a critical and causal role in switchingbetween the CEN and the DMN. We replicated this causal connec-tivity pattern in two additional experiments: (i) a visual attention‘‘oddball’’ task and (ii) a task-free resting state. These resultsindicate that the rFIC is likely to play a major role in switchingbetween distinct brain networks across task paradigms and stim-ulus modalities. Our findings have important implications for aunified view of network mechanisms underlying both exogenousand endogenous cognitive control.
brain networks � cognitive control � insula � attention � prefrontal cortex
One distinguishing feature of the human brain, comparedwith brains lower on the phylogenetic ladder, is the amount
of cognitive control available for selecting, switching, and at-tending to salient events in the environment. Recent researchsuggests that the human brain is intrinsically organized intodistinct functional networks that support these processes (1–4).Analysis of resting-state functional connectivity, using bothmodel-based and model-free approaches, has suggested theexistence of at least three canonical networks: (i) a central-executive network (CEN), whose key nodes include the dorso-lateral prefrontal cortex (DLPFC), and posterior parietal cortex(PPC); (ii) the default-mode network (DMN), which includes theventromedial prefrontal cortex (VMPFC) and posterior cingu-late cortex (PCC); and (iii) a salience network (SN), whichincludes the ventrolateral prefrontal cortex (VLPFC) and an-terior insula (jointly referred to as the fronto-insular cortex; FIC)and the anterior cingulate cortex (ACC) (1, 2, 4, 5). During theperformance of cognitively demanding tasks, the CEN and SNtypically show increases in activation whereas the DMN showsdecreases in activation (1, 2, 6). However, what remains un-known is the crucial issue of how the operation of thesenetworks, identified in the resting state, relate to their functionduring cognitive information processing. Furthermore, the cog-nitive control mechanisms that mediate concurrent activationand deactivation within these large-scale brain networks duringtask performance are poorly understood.
In a recent meta-analysis, Dosenbach and colleagues hypoth-esized that several brain regions that overlap with the CEN andSN are important for multiple cognitive control functions,including initiation, maintenance, and adjustment of attention(7). However, no studies to date have directly assessed thetemporal dynamics and causal interactions of specific nodeswithin the CEN, SN, and DMN. Converging evidence from anumber of brain imaging studies across several task domainssuggests that the FIC and ACC nodes of the SN, in particular,respond to the degree of subjective salience, whether cognitive,homeostatic, or emotional (4, 8–11). The CEN, on the otherhand, is critical for the active maintenance and manipulation ofinformation in working memory, and for judgment and decisionmaking in the context of goal directed behavior (12–18). Wetherefore hypothesized a key role for the SN in the hierarchicalinitiation of cognitive control signals, specifically with respect toactivation and deactivation in the CEN and DMN, and thedynamics of switching between these two networks.
We used three functional magnetic resonance imaging (fMRI)experiments to examine the interaction between the SN, CEN,and DMN, with particular interest in the role of the FIC/ACC inregulating these networks. In the first experiment, we scanned 18participants as they listened with focused attention to classicalmusic symphonies inside the scanner. We analyzed brain re-sponses during the occurrence of ‘‘movement transitions:’’ sa-lient, orienting events arising from transitions between adjacent‘‘movements’’ in the music (19). To specifically elucidate the roleof the FIC in driving network changes, we used chronometry andGranger Causality Analysis (GCA), to provide informationabout the dynamics and directionality of signaling in corticalcircuits (20–22).
In the second experiment, we investigated the generality ofnetwork switching mechanisms involving the FIC by examiningbrain responses elicited during a visual “oddball” attention task(23). A third experiment examined whether the network switch-ing mechanism could be observed during task-free resting statewhere there was no overt task and no behavioral response (4).Our motivation for examining the resting-state fMRI data wasthe recent finding, based on computer simulation of large-scalebrain networks, that even in the absence of external stimuli,certain nodes can regulate other nodes and function as hubs (24).
Author contributions: V.M. designed research; D.S., D.J.L., and V.M. performed research;D.S. analyzed data; and D.S. and V.M. wrote the paper.
The authors declare no conflict of interest.
This article is a PNAS Direct Submission.
‡To whom correspondence may be addressed at: Program in Neuroscience and Departmentof Psychiatry and Behavioral Sciences, Stanford University School of Medicine, 780 WelchRoad, Room 201, Stanford, CA 94305-5778. E-mail: [email protected] or [email protected].
This article contains supporting information online at www.pnas.org/cgi/content/full/0800005105/DCSupplemental.
© 2008 by The National Academy of Sciences of the USA
www.pnas.org�cgi�doi�10.1073�pnas.0800005105 PNAS � August 26, 2008 � vol. 105 � no. 34 � 12569–12574
NEU
ROSC
IEN
CE
Our aim was to test the hypothesis that common networkswitching mechanisms apply across tasks with varying cognitivedemands and differing stimulus modalities. If confirmed, ourfindings would provide insights into fundamental control mech-anisms in the human brain.
ResultsWe describe findings from Experiment 1 in the first threesections. Convergent findings from Experiments 2 and 3 aredescribed subsequently.
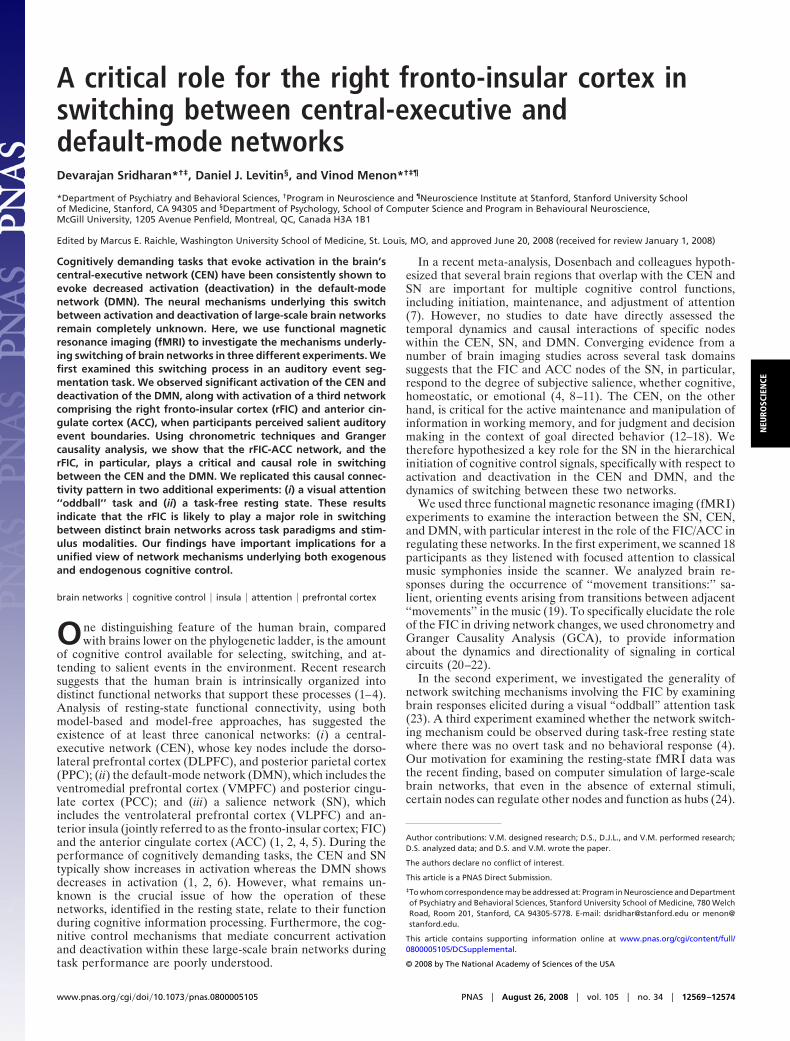
Activation of CEN and SN, and Deactivation of DMN During AuditoryEvent Segmentation. As reported previously (19), we found robustright-lateralized activation in the DLPFC, PPC, and FIC during‘‘movement transitions’’ in the auditory event segmentation task.Here, we extend these findings to characterize network-specificresponses in the CEN, DMN, and SN. Activations in the CENand SN were found to be accompanied by robust deactivation inthe DMN at the movement transition [Fig. 1A and GeneralLinear Model Analysis in supporting information (SI) Materialsand Methods]. To further confirm that these regions constitutecoherent networks, rather than isolated regional responses, weperformed independent component analysis (ICA) on the taskdata, which revealed the existence of statistically independentCEN, SN, and DMN (Fig. 1B, see also Table S1) [ICA is amodel-free analysis technique that produces a set of spatiallyindependent components and associated time courses for eachsubject (25)]. In the following two sections, we examine theputative causal mechanisms involved in switching between ac-tivation and deactivation in the context of the three networks,identified above, using a combination of mental chronometryand GCA (21, 22).
Latency Analysis Reveals Early Activation of the rFIC Relative to theCEN and DMN. First, we identified differences in the latency ofthe event-related fMRI responses across the entire brain usingthe method developed by Henson and colleagues (26). Briefly,
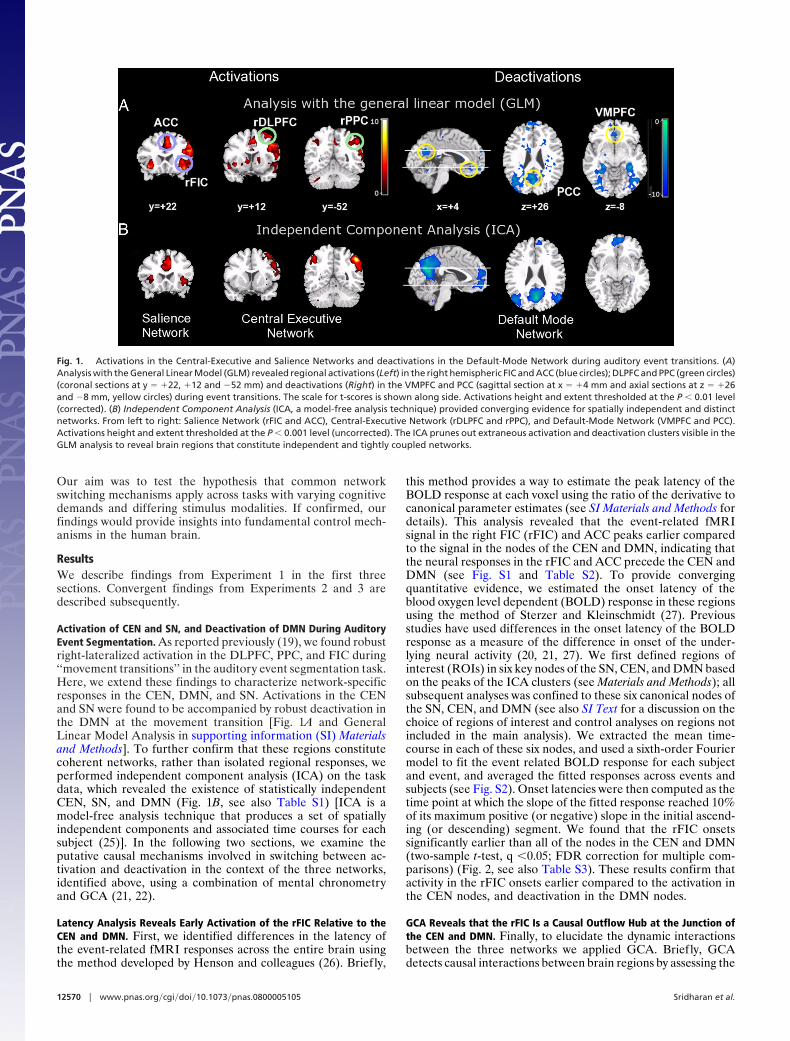
this method provides a way to estimate the peak latency of theBOLD response at each voxel using the ratio of the derivative tocanonical parameter estimates (see SI Materials and Methods fordetails). This analysis revealed that the event-related fMRIsignal in the right FIC (rFIC) and ACC peaks earlier comparedto the signal in the nodes of the CEN and DMN, indicating thatthe neural responses in the rFIC and ACC precede the CEN andDMN (see Fig. S1 and Table S2). To provide convergingquantitative evidence, we estimated the onset latency of theblood oxygen level dependent (BOLD) response in these regionsusing the method of Sterzer and Kleinschmidt (27). Previousstudies have used differences in the onset latency of the BOLDresponse as a measure of the difference in onset of the under-lying neural activity (20, 21, 27). We first defined regions ofinterest (ROIs) in six key nodes of the SN, CEN, and DMN basedon the peaks of the ICA clusters (see Materials and Methods); allsubsequent analyses was confined to these six canonical nodes ofthe SN, CEN, and DMN (see also SI Text for a discussion on thechoice of regions of interest and control analyses on regions notincluded in the main analysis). We extracted the mean time-course in each of these six nodes, and used a sixth-order Fouriermodel to fit the event related BOLD response for each subjectand event, and averaged the fitted responses across events andsubjects (see Fig. S2). Onset latencies were then computed as thetime point at which the slope of the fitted response reached 10%of its maximum positive (or negative) slope in the initial ascend-ing (or descending) segment. We found that the rFIC onsetssignificantly earlier than all of the nodes in the CEN and DMN(two-sample t-test, q �0.05; FDR correction for multiple com-parisons) (Fig. 2, see also Table S3). These results confirm thatactivity in the rFIC onsets earlier compared to the activation inthe CEN nodes, and deactivation in the DMN nodes.
GCA Reveals that the rFIC Is a Causal Outflow Hub at the Junction ofthe CEN and DMN. Finally, to elucidate the dynamic interactionsbetween the three networks we applied GCA. Briefly, GCAdetects causal interactions between brain regions by assessing the
Fig. 1. Activations in the Central-Executive and Salience Networks and deactivations in the Default-Mode Network during auditory event transitions. (A)Analysis with the General Linear Model (GLM) revealed regional activations (Left) in the right hemispheric FIC and ACC (blue circles); DLPFC and PPC (green circles)(coronal sections at y � �22, �12 and �52 mm) and deactivations (Right) in the VMPFC and PCC (sagittal section at x � �4 mm and axial sections at z � �26and �8 mm, yellow circles) during event transitions. The scale for t-scores is shown along side. Activations height and extent thresholded at the P � 0.01 level(corrected). (B) Independent Component Analysis (ICA, a model-free analysis technique) provided converging evidence for spatially independent and distinctnetworks. From left to right: Salience Network (rFIC and ACC), Central-Executive Network (rDLPFC and rPPC), and Default-Mode Network (VMPFC and PCC).Activations height and extent thresholded at the P � 0.001 level (uncorrected). The ICA prunes out extraneous activation and deactivation clusters visible in theGLM analysis to reveal brain regions that constitute independent and tightly coupled networks.
12570 � www.pnas.org�cgi�doi�10.1073�pnas.0800005105 Sridharan et al.
predictability of signal changes in one brain region based on thetime-course of responses in another brain region (28). Weperformed GCA using a bivariate model (22) on the time-courses extracted from the six key regions used in the onsetlatency analysis. We used bootstrap techniques (29) to create
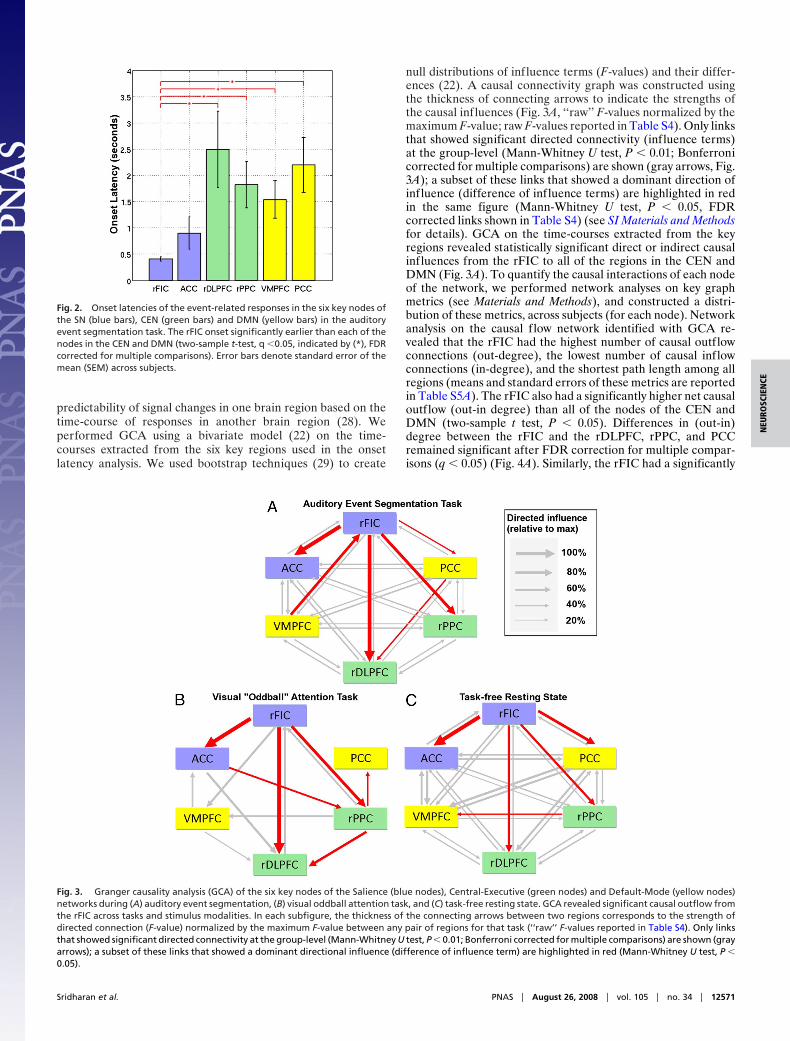
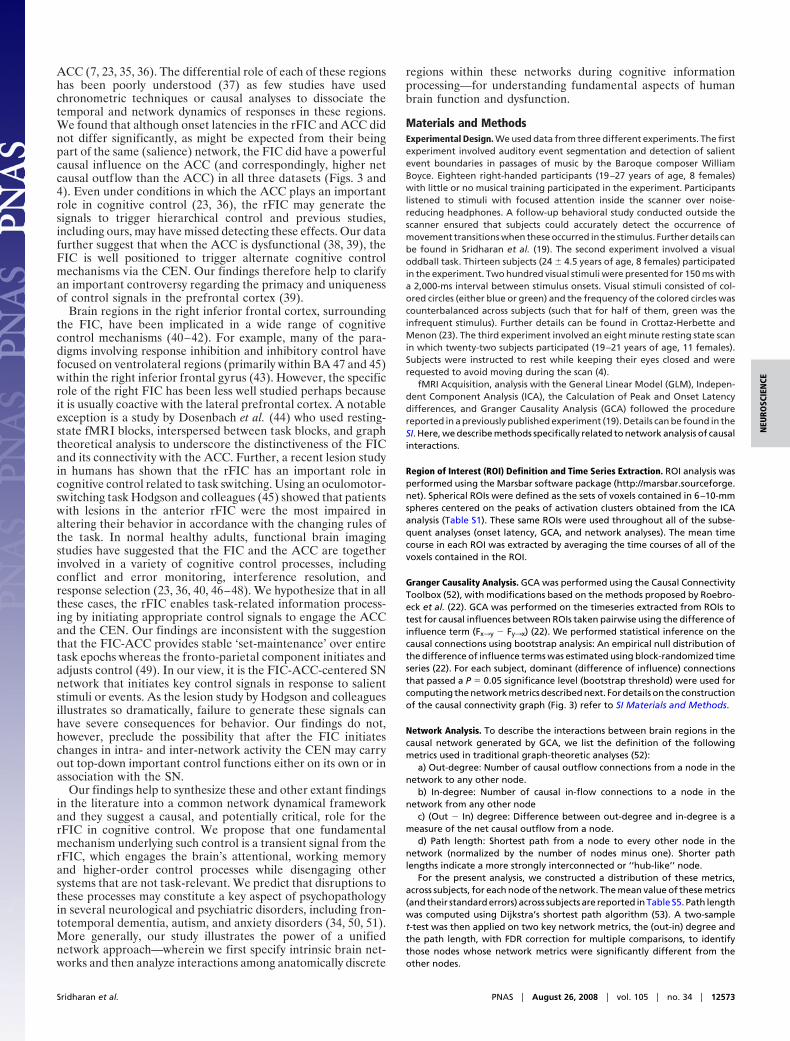
null distributions of influence terms (F-values) and their differ-ences (22). A causal connectivity graph was constructed usingthe thickness of connecting arrows to indicate the strengths ofthe causal influences (Fig. 3A, ‘‘raw’’ F-values normalized by themaximum F-value; raw F-values reported in Table S4). Only linksthat showed significant directed connectivity (influence terms)at the group-level (Mann-Whitney U test, P � 0.01; Bonferronicorrected for multiple comparisons) are shown (gray arrows, Fig.3A); a subset of these links that showed a dominant direction ofinfluence (difference of influence terms) are highlighted in redin the same figure (Mann-Whitney U test, P � 0.05, FDRcorrected links shown in Table S4) (see SI Materials and Methodsfor details). GCA on the time-courses extracted from the keyregions revealed statistically significant direct or indirect causalinfluences from the rFIC to all of the regions in the CEN andDMN (Fig. 3A). To quantify the causal interactions of each nodeof the network, we performed network analyses on key graphmetrics (see Materials and Methods), and constructed a distri-bution of these metrics, across subjects (for each node). Networkanalysis on the causal f low network identified with GCA re-vealed that the rFIC had the highest number of causal outflowconnections (out-degree), the lowest number of causal inflowconnections (in-degree), and the shortest path length among allregions (means and standard errors of these metrics are reportedin Table S5A). The rFIC also had a significantly higher net causaloutflow (out-in degree) than all of the nodes of the CEN andDMN (two-sample t test, P � 0.05). Differences in (out-in)degree between the rFIC and the rDLPFC, rPPC, and PCCremained significant after FDR correction for multiple compar-isons (q � 0.05) (Fig. 4A). Similarly, the rFIC had a significantly
Fig. 2. Onset latencies of the event-related responses in the six key nodes ofthe SN (blue bars), CEN (green bars) and DMN (yellow bars) in the auditoryevent segmentation task. The rFIC onset significantly earlier than each of thenodes in the CEN and DMN (two-sample t-test, q �0.05, indicated by (*), FDRcorrected for multiple comparisons). Error bars denote standard error of themean (SEM) across subjects.
Fig. 3. Granger causality analysis (GCA) of the six key nodes of the Salience (blue nodes), Central-Executive (green nodes) and Default-Mode (yellow nodes)networks during (A) auditory event segmentation, (B) visual oddball attention task, and (C) task-free resting state. GCA revealed significant causal outflow fromthe rFIC across tasks and stimulus modalities. In each subfigure, the thickness of the connecting arrows between two regions corresponds to the strength ofdirected connection (F-value) normalized by the maximum F-value between any pair of regions for that task (‘‘raw’’ F-values reported in Table S4). Only linksthat showed significant directed connectivity at the group-level (Mann-Whitney U test, P � 0.01; Bonferroni corrected for multiple comparisons) are shown (grayarrows); a subset of these links that showed a dominant directional influence (difference of influence term) are highlighted in red (Mann-Whitney U test, P �0.05).
Sridharan et al. PNAS � August 26, 2008 � vol. 105 � no. 34 � 12571
NEU
ROSC
IEN
CE

shorter path length than all of the other regions except theVMPFC (t test, P � 0.05); however, these differences did notremain significant after multiple comparison correction (datanot shown). These results suggest that the rFIC is an outflow hubat the junction of the CEN and DMN.
Converging Evidence from Two Additional fMRI Experiments. Toprovide converging evidence for the rFIC as a causal outflowhub, we analyzed fMRI data from two other experiments usingthe same GCA and network analyses methods described above:(i) a visual ‘‘oddball’’ attention experiment, and (ii) a task-freeresting state experiment (see also SI Materials and Methods). Wefound a pattern of significant causal outflow from the rFIC thatwas strikingly similar to the auditory event segmentation exper-iment (Fig. 3 B and C). We then constructed network metrics forthese tasks using a procedure identical to the one used for theauditory segmentation task. In each case, the rFIC had thehighest out-in degree and the shortest path length (Table S5 Band C). Again, the rFIC again had a significantly higher netcausal outflow than several of the other nodes of the CEN andDMN (Fig. 4 B and C). Specifically, the rFIC had a significantlyhigher (out-in) degree than all of the other CEN and DMNnodes in the resting state, and the rDLPFC in the visual oddballtask (two-sample t-test, q � 0.05, FDR correction for multiplecomparisons). These converging results indicate that that therFIC is a critical, causal outflow hub across task paradigms andstimulus modalities.
DiscussionICA revealed the existence of statistically independent CEN,DMN, and SN during task performance, extending our recentdiscovery of similar networks in task-free, resting-state, condi-tions (4). Our analysis indicates that the rFIC, a key node of theSN, plays a critical and causal role in switching between the CENand the DMN (we use the term ‘‘causal’’ here, and in thefollowing sections in the sense implied by, and consistent with,latency analysis, GCA and network analysis). The striking sim-ilarity of significant causal outflow from the rFIC across tasks,involving different stimulus modalities, indicates a general rolefor the rFIC in switching between two key brain networks.Furthermore, our replication of this effect in the task-freeresting state suggests that the rFIC is a network hub that can alsoinitiate spontaneous switching between the CEN and DMN (24).Our findings help to provide a more unified perspective on
exogenous and endogenous mechanisms underlying cognitivecontrol.
In the SI Discussion, we suggest that these interactions are theresult of neural, rather than vascular processes. Here, we focuson the neurobiological implications of our findings in the contextof the three networks that we set out to examine; analyses ofseveral other control regions (including the sensory and associ-ation cortices) that further clarify the crucial role of the FIC inthe switching process are discussed in the SI Text.
FIC-ACC Network Is Neuroanatomically Uniquely Positioned to Gen-erate Control Signals. In primates, anatomical studies have re-vealed that the insular cortex is reciprocally connected tomultiple sensory, motor, limbic, and association areas of thebrain (30, 31). The FIC and ACC themselves share significanttopographic reciprocal connectivity and form an anatomicallytightly coupled network ideally placed to integrate informationfrom several brain regions (9, 10, 32). Indeed, analysis of theauditory and visual experiments in our study found coactivationof these regions during task performance, as in many otherstudies involving cognitively demanding tasks (7). Previousneurophysiological and brain imaging studies have shown thatthe FIC-ACC complex moderates arousal during cognitivelydemanding tasks and that the rFIC, in particular, plays a criticalrole in the interoceptive awareness of both stimulus-induced andstimulus-independent changes in homeostatic states (9, 10).Furthermore, the FIC and ACC share a unique feature at theneuronal level: The human FIC-ACC network has a specializedclass of neurons with distinctive anatomical and functionalfeatures that might facilitate the network switching process thatwe report here. The von Economo neurons (VENs) are special-ized neurons exclusively localized to the FIC and ACC (33).Based on the dendritic architecture of the VENs, Allman andcolleagues have proposed that ‘‘the function of the VENs may beto provide a rapid relay to other parts of the brain of a simplesignal derived from information processed within FI and ACC.’’(34). We propose that the VENs may, therefore, constitute theneuronal basis of control signals generated by the FIC and ACCin our study. Taken together, these findings suggest that the FICand ACC, anchored within the SN, are uniquely positioned toinitiate control signals that activate the CEN and deactivatethe DMN.
Differential Roles of the rFIC, ACC, and Lateral Prefrontal Cortex inInitiating Control Signals. Many previous studies of attentional andcognitive control have reported coactivation of the FIC and
Fig. 4. Net Granger causal outflow (out-in degree) of the key nodes of the Salience, Central-Executive, and Default-Mode Networks in the three experiments.Comparison of the net causal outflow (out-in degree) for the six key nodes of the Salience, Central-Executive, and Default-Mode networks as assessed by Grangercausality analysis revealed that the rFIC has a significantly higher net causal outflow than the CEN and DMN regions across tasks (conventions as in Fig. 2).Specifically, the rFIC had a significantly higher net causal outflow than almost all of the other CEN and DMN regions for the auditory segmentation andresting-state tasks, and the rDLPFC for the visual oddball task (two-sample t-test, q � 0.05, indicated by (*), FDR corrected for multiple comparisons).
12572 � www.pnas.org�cgi�doi�10.1073�pnas.0800005105 Sridharan et al.
ACC (7, 23, 35, 36). The differential role of each of these regionshas been poorly understood (37) as few studies have usedchronometric techniques or causal analyses to dissociate thetemporal and network dynamics of responses in these regions.We found that although onset latencies in the rFIC and ACC didnot differ significantly, as might be expected from their beingpart of the same (salience) network, the FIC did have a powerfulcausal influence on the ACC (and correspondingly, higher netcausal outflow than the ACC) in all three datasets (Figs. 3 and4). Even under conditions in which the ACC plays an importantrole in cognitive control (23, 36), the rFIC may generate thesignals to trigger hierarchical control and previous studies,including ours, may have missed detecting these effects. Our datafurther suggest that when the ACC is dysfunctional (38, 39), theFIC is well positioned to trigger alternate cognitive controlmechanisms via the CEN. Our findings therefore help to clarifyan important controversy regarding the primacy and uniquenessof control signals in the prefrontal cortex (39).
Brain regions in the right inferior frontal cortex, surroundingthe FIC, have been implicated in a wide range of cognitivecontrol mechanisms (40–42). For example, many of the para-digms involving response inhibition and inhibitory control havefocused on ventrolateral regions (primarily within BA 47 and 45)within the right inferior frontal gyrus (43). However, the specificrole of the right FIC has been less well studied perhaps becauseit is usually coactive with the lateral prefrontal cortex. A notableexception is a study by Dosenbach et al. (44) who used resting-state fMRI blocks, interspersed between task blocks, and graphtheoretical analysis to underscore the distinctiveness of the FICand its connectivity with the ACC. Further, a recent lesion studyin humans has shown that the rFIC has an important role incognitive control related to task switching. Using an oculomotor-switching task Hodgson and colleagues (45) showed that patientswith lesions in the anterior rFIC were the most impaired inaltering their behavior in accordance with the changing rules ofthe task. In normal healthy adults, functional brain imagingstudies have suggested that the FIC and the ACC are togetherinvolved in a variety of cognitive control processes, includingconflict and error monitoring, interference resolution, andresponse selection (23, 36, 40, 46–48). We hypothesize that in allthese cases, the rFIC enables task-related information process-ing by initiating appropriate control signals to engage the ACCand the CEN. Our findings are inconsistent with the suggestionthat the FIC-ACC provides stable ‘set-maintenance’ over entiretask epochs whereas the fronto-parietal component initiates andadjusts control (49). In our view, it is the FIC-ACC-centered SNnetwork that initiates key control signals in response to salientstimuli or events. As the lesion study by Hodgson and colleaguesillustrates so dramatically, failure to generate these signals canhave severe consequences for behavior. Our findings do not,however, preclude the possibility that after the FIC initiateschanges in intra- and inter-network activity the CEN may carryout top-down important control functions either on its own or inassociation with the SN.
Our findings help to synthesize these and other extant findingsin the literature into a common network dynamical frameworkand they suggest a causal, and potentially critical, role for therFIC in cognitive control. We propose that one fundamentalmechanism underlying such control is a transient signal from therFIC, which engages the brain’s attentional, working memoryand higher-order control processes while disengaging othersystems that are not task-relevant. We predict that disruptions tothese processes may constitute a key aspect of psychopathologyin several neurological and psychiatric disorders, including fron-totemporal dementia, autism, and anxiety disorders (34, 50, 51).More generally, our study illustrates the power of a unifiednetwork approach—wherein we first specify intrinsic brain net-works and then analyze interactions among anatomically discrete
regions within these networks during cognitive informationprocessing—for understanding fundamental aspects of humanbrain function and dysfunction.
Materials and MethodsExperimental Design. We used data from three different experiments. The firstexperiment involved auditory event segmentation and detection of salientevent boundaries in passages of music by the Baroque composer WilliamBoyce. Eighteen right-handed participants (19–27 years of age, 8 females)with little or no musical training participated in the experiment. Participantslistened to stimuli with focused attention inside the scanner over noise-reducing headphones. A follow-up behavioral study conducted outside thescanner ensured that subjects could accurately detect the occurrence ofmovement transitions when these occurred in the stimulus. Further details canbe found in Sridharan et al. (19). The second experiment involved a visualoddball task. Thirteen subjects (24 � 4.5 years of age, 8 females) participatedin the experiment. Two hundred visual stimuli were presented for 150 ms witha 2,000-ms interval between stimulus onsets. Visual stimuli consisted of col-ored circles (either blue or green) and the frequency of the colored circles wascounterbalanced across subjects (such that for half of them, green was theinfrequent stimulus). Further details can be found in Crottaz-Herbette andMenon (23). The third experiment involved an eight minute resting state scanin which twenty-two subjects participated (19–21 years of age, 11 females).Subjects were instructed to rest while keeping their eyes closed and wererequested to avoid moving during the scan (4).
fMRI Acquisition, analysis with the General Linear Model (GLM), Indepen-dent Component Analysis (ICA), the Calculation of Peak and Onset Latencydifferences, and Granger Causality Analysis (GCA) followed the procedurereported in a previously published experiment (19). Details can be found in theSI. Here, we describe methods specifically related to network analysis of causalinteractions.
Region of Interest (ROI) Definition and Time Series Extraction. ROI analysis wasperformed using the Marsbar software package (http://marsbar.sourceforge.net). Spherical ROIs were defined as the sets of voxels contained in 6–10-mmspheres centered on the peaks of activation clusters obtained from the ICAanalysis (Table S1). These same ROIs were used throughout all of the subse-quent analyses (onset latency, GCA, and network analyses). The mean timecourse in each ROI was extracted by averaging the time courses of all of thevoxels contained in the ROI.
Granger Causality Analysis. GCA was performed using the Causal ConnectivityToolbox (52), with modifications based on the methods proposed by Roebro-eck et al. (22). GCA was performed on the timeseries extracted from ROIs totest for causal influences between ROIs taken pairwise using the difference ofinfluence term (Fx3y � Fy3x) (22). We performed statistical inference on thecausal connections using bootstrap analysis: An empirical null distribution ofthe difference of influence terms was estimated using block-randomized timeseries (22). For each subject, dominant (difference of influence) connectionsthat passed a P � 0.05 significance level (bootstrap threshold) were used forcomputing the network metrics described next. For details on the constructionof the causal connectivity graph (Fig. 3) refer to SI Materials and Methods.
Network Analysis. To describe the interactions between brain regions in thecausal network generated by GCA, we list the definition of the followingmetrics used in traditional graph-theoretic analyses (52):
a) Out-degree: Number of causal outflow connections from a node in thenetwork to any other node.
b) In-degree: Number of causal in-flow connections to a node in thenetwork from any other node
c) (Out � In) degree: Difference between out-degree and in-degree is ameasure of the net causal outflow from a node.
d) Path length: Shortest path from a node to every other node in thenetwork (normalized by the number of nodes minus one). Shorter pathlengths indicate a more strongly interconnected or ‘‘hub-like’’ node.
For the present analysis, we constructed a distribution of these metrics,across subjects, for each node of the network. The mean value of these metrics(and their standard errors) across subjects are reported in Table S5. Path lengthwas computed using Dijkstra’s shortest path algorithm (53). A two-samplet-test was then applied on two key network metrics, the (out-in) degree andthe path length, with FDR correction for multiple comparisons, to identifythose nodes whose network metrics were significantly different from theother nodes.
Sridharan et al. PNAS � August 26, 2008 � vol. 105 � no. 34 � 12573
NEU
ROSC
IEN
CE
ACKNOWLEDGMENTS. We thank Mike Greicius for useful discussions andElena Rykhlevskaia and Catie Chang for their comments on a preliminary draftof this manuscript. We acknowledge two anonymous reviewers for theirinsightful comments and suggestions. This research was supported by a Stan-
ford Graduate Fellowship to D.S. and by grants from the Natural Sciences andEngineering Research Council of Canada to D.J.L., the National Science Foun-dation (BCS-0449927) to V.M. and D.J.L., and the National Institutes of Health(HD047520, NS058899) to V.M.
1. Greicius MD, Krasnow B, Reiss AL, Menon V (2003) Functional connectivity in theresting brain: A network analysis of the default mode hypothesis. Proc Natl Acad SciUSA 100:253–258.
2. Fox MD, Corbetta M, Snyder AZ, Vincent JL, Raichle ME (2006) Spontaneous neuronalactivity distinguishes human dorsal and ventral attention systems. Proc Natl Acad SciUSA 103:10046–10051.
3. Golland Y, et al. (2007) Extrinsic and intrinsic systems in the posterior cortex of thehuman brain revealed during natural sensory stimulation. Cereb Cortex 17:766–777.
4. Seeley WW, et al. (2007) Dissociable intrinsic connectivity networks for salience pro-cessing and executive control. J Neurosci 27:2349–2356.
5. Beckmann CF, DeLuca M, Devlin JT, Smith SM (2005) Investigations into resting-stateconnectivity using independent component analysis. Philos Trans R Soc Lond B Biol Sci360:1001–1013.
6. Raichle ME, et al. (2001) A default mode of brain function. Proc Natl Acad Sci USA98:676–682.
7. Dosenbach NU, et al. (2006) A core system for the implementation of task sets. Neuron50:799–812.
8. Damasio AR (2000) The Feeling of What Happens: Body and Emotion in the Makingof Consciousness (Harcourt, Chicago)
9. Craig AD (2002) How do you feel? interoception: The sense of the physiologicalcondition of the body. Nat Rev Neurosci 3:655–666.
10. Critchley HD, Wiens S, Rotshtein P, Ohman A, Dolan RJ (2004) Neural systems support-ing interoceptive awareness. Nat Neurosci 7:189–195.
11. Naqvi NH, Rudrauf D, Damasio H, Bechara A (2007) Damage to the insula disruptsaddiction to cigarette smoking. Science 315:531–534.
12. Bunge SA, Ochsner KN, Desmond JE, Glover GH, Gabrieli JD (2001) Prefrontal regionsinvolved in keeping information in and out of mind. Brain 124:2074–2086.
13. Crottaz-Herbette S, Anagnoson RT, Menon V (2004) Modality effects in verbal workingmemory: Differential prefrontal and parietal responses to auditory and visual stimuli.Neuroimage 21:340–351.
14. Petrides M (2005) Lateral prefrontal cortex: Architectonic and functional organization.Philos Trans R Soc Lond B Biol Sci 360:781–795.
15. Muller NG, Knight RT (2006) The functional neuroanatomy of working memory:Contributions of human brain lesion studies. Neuroscience 139:51–58.
16. D’Esposito M (2007) From cognitive to neural models of working memory. Philos TransR Soc Lond B Biol Sci 362:761–772.
17. Koechlin E, Summerfield C (2007) An information theoretical approach to prefrontalexecutive function. Trends Cogn Sci 11:229–235.
18. Miller EK Cohen JD (2001) An integrative theory of prefrontal cortex function. AnnuRev Neurosci 24:167–202.
19. Sridharan D, Levitin DJ, Chafe CH, Berger J, Menon V (2007) Neural dynamics of eventsegmentation in music: Converging evidence for dissociable ventral and dorsal net-works. Neuron 55:521–532.
20. Menon RS, Luknowsky DC, Gati JS (1998) Mental chronometry using latency-resolvedfunctional MRI. Proc Natl Acad Sci USA 95:10902–10907.
21. Formisano E, Goebel R (2003) Tracking cognitive processes with functional MRI mentalchronometry. Curr Opin Neurobiol 13:174–181.
22. Roebroeck A, Formisano E, Goebel R (2005) Mapping directed influence over the brainusing granger causality and fMRI. Neuroimage 25:230–242.
23. Crottaz-Herbette S, Menon V (2006) Where and when the anterior cingulate cortexmodulates attentional response: Combined fMRI and ERP evidence. J Cogn Neurosci18:766–780.
24. Honey CJ, Kotter R, Breakspear M, Sporns O (2007) Network structure of cerebral cortexshapes functional connectivity on multiple time scales. Proc Natl Acad Sci USA104:10240–10245.
25. Beckmann CF, Smith SM (2004) Probablistic independent component analysis forfunctional magnetic resonance imaging. IEEE Trans Med Imaging 23:137–152.
26. Henson RN, Price CJ, Rugg MD, Turner R, Friston KJ (2002) Detecting latency differencesin event-related BOLD responses: Application to words versus nonwords and initialversus repeated face presentations. Neuroimage 15:83–97.
27. Sterzer P, Kleinschmidt A (2007) A neural basis for inference in perceptual ambiguity.Proc Natl Acad Sci USA 104:323–328.
28. Abler B, et al. (2006) Investigating directed influences between activated brain areasin a motor-response task using fMRI. Magn Reson Imaging 24:181–185.
31. Efron B, Tibshirani RJ (1993) An introduction to the bootstrap (Monographs onstatistics and applied probability #57) (CRC Press LLC, Boca Raton, Florida)
30. Mufson EJ, Mesulam MM (1982) Insula of the old world monkey. II: Afferent corticalinput and comments on the claustrum. J Comp Neurol 212:23–37.
31. Mesulam MM, Mufson EJ (1982) Insula of the old world monkey. III: Efferent corticaloutput and comments on function. J Comp Neurol 212:38–52.
32. Mesulam MM (1998) From sensation to cognition. Brain 121(Pt 6):1013–1052.33. Watson KK, Jones TK, Allman JM (2006) Dendritic architecture of the von economo
neurons. Neuroscience 141:1107–1112.34. Allman JM, Watson KK, Tetreault NA, Hakeem AY (2005) Intuition and autism: A
possible role for von Economo neurons. Trends Cogn Sci 9:367–373.35. Fan J, McCandliss BD, Fossella J, Flombaum JI, Posner MI (2005) The activation of
attentional networks. Neuroimage 26:471–479.36. Posner MI, Rothbart MK (2007) Research on attention networks as a model for the
integration of psychological science. Annu Rev Psychol 58:1–23.37. Milham MP, et al. (2001) The relative involvement of anterior cingulate and prefrontal
cortex in attentional control depends on nature of conflict. Brain Res Cogn Brain Res12:467–473.
38. Baird A, et al. (2006) Cognitive functioning after medial frontal lobe damage includingthe anterior cingulate cortex: A preliminary investigation. Brain Cogn 60:166–175.
39. Fellows LK, Farah MJ (2005) Is anterior cingulate cortex necessary for cognitive control?Brain 128:788–796.
40. Nee TE, Wagner TD, Jonides J (2007) Interference resolution: Insights from a meta-analysis of neuroimaging tasks. Cogn Affect Behav Neurosci 7:1–17.
41. Aron AR, Fletcher PC, Bullmore ET, Sahakian BJ, Robbins TW (2003) Stop-signal inhi-bition disrupted by damage to right inferior frontal gyrus in humans. Nat Neurosci6:115–116.
42. Robbins TW (2007) Shifting and stopping: Fronto-striatal substrates, neurochemicalmodulation and clinical implications. Philos Trans R Soc Lond B Biol Sci 362:917–932.
43. Aron AR, Robbins TW, Poldrack RA (2004) Inhibition and the right inferior frontalcortex. Trends Cogn Sci 8:170–177.
44. Dosenbach NU, et al. (2007) Distinct brain networks for adaptive and stable task controlin humans. Proc Natl Acad Sci USA 104:11073–11078.
45. Hodgson T, et al. (2007) The role of the ventrolateral frontal cortex in inhibitoryoculomotor control. Brain 130:1525–1537.
46. Roberts KL, Hall DA (2008) Examining a supramodal network for conflict processing: Asystematic review and novel functional magnetic resonance imaging data for relatedvisual and auditory stroop tasks. J Cogn Neurosci 20:1063–1078.
47. Cole MW, Schneider W (2007) The cognitive control network: Integrated corticalregions with dissociable functions. Neuroimage 37:343–360.
48. Eichele T, et al. (2008) Prediction of human errors by maladaptive changes in event-related brain networks. Proc Natl Acad Sci USA 105:6173–6178.
49. Dosenbach NU, Fair DA, Cohen AL, Schlaggar BL, Petersen SE (2008) A dual-networksarchitecture of top-down control. Trends Cogn Sci 12:99–105.
50. Paulus MP (2007) Decision-making dysfunctions in psychiatry–altered homeostaticprocessing? Science 318:602–606.
51. Seeley WW, et al. (2008) Frontal paralimbic network atrophy in very mild behavioralvariant frontotemporal dementia. Arch Neurol 65:249–255.
52. Seth AK (2005) Causal connectivity of evolved neural networks during behavior.Network Comput Neural Sys 16:35–54.
53. Dijkstra EW (1959) A note on two problems in connection with graphs. NumerischeMath 1:269–271.
12574 � www.pnas.org�cgi�doi�10.1073�pnas.0800005105 Sridharan et al.

Supporting InformationSridharan et al. 10.1073/pnas.0800005105SI TextMaterials and Methods. fMRI acquisition. Brain images were ac-quired on a 3T GE Signa scanner using a standard GE wholehead coil (software Lx 8.3). For the first (auditory event seg-mentation) experiment, images were acquired every 2 sec in tworuns that lasted 9 min 42 sec and 8 min 48 sec, respectively (fora total of 18 min and 30 sec). The second (visual oddball) andthird (resting state) scans were acquired in a single run of 7 min48 sec and 8 min, respectively. A custom-built head holder wasused to prevent head movement. Twenty-eight axial slices(4.0-mm thick, 0.5-mm skip) parallel to the AC-PC line andcovering the whole brain were imaged using a T2* weightedgradient echo spiral pulse sequence (TR � 2,000 msec, TE � 30msec, f lip angle � 70 deg, and 1 interleave, in-plane spatialresolution of 3.125 mm) (1). To reduce blurring and signal lossarising from field inhomogeneities, an automated high-ordershimming method based on spiral acquisitions was used beforeacquiring functional MRI scans (2). Images were reconstructedby gridding interpolation and inverse Fourier transform for eachtime point into 64 � 64 � 28 image matrices (voxel size 3.125 �3.125 � 4.5 mm). A linear shim correction was applied separatelyfor each slice during reconstruction using a magnetic field mapacquired automatically by the pulse sequence at the beginning ofthe scan (1). fMRI data acquisition was synchronized to stimuluspresentation using a TTL pulse sent by EPRIME to the scannertiming board.fMRI data analysis. fMRI data were preprocessed using SPM2(http://www.fil.ion.ucl.ac.uk/spm). Functional volumes were cor-rected for movement-related effects (3), spatially normalized tostereotaxic Talairach coordinates, resampled every 2 mm usingsinc interpolation, and smoothed with a 4-mm Gaussian kernelto reduce spatial noise. For the first (auditory segmentation) andsecond (visual oddball) experiments, statistical analysis wasperformed using the general linear model (GLM) and the theoryof Gaussian random fields as implemented in SPM2. A within-subjects procedure was used to model all of the effects of interestfor each subject. Confounding effects of fluctuations in globalmean were removed by proportional scaling where, for each timepoint, each voxel was scaled by the global mean at that time point(4). Low-frequency noise was removed with a high-pass filter(0.5 cycles/min) applied to the fMRI time series at each voxel.Effects of interest for each subject were then defined with therelevant contrasts of the parameter estimates. Group analysiswas performed using a random-effects model that incorporateda two-stage hierarchical procedure. In the first stage, contrastimages for each subject and each effect of interest were gener-ated as described above. In the second stage, these contrastimages were analyzed using a general linear model to determinevoxel-wise t statistics. Finally, the t statistics were normalized toZ scores, and significant clusters of activation were determinedusing the joint expected probability distribution of height andextent of Z scores (5), with height (Z �2.33; P � 0.01) and extentthresholds (P � 0.05). Maxima and all coordinates are reportedin MNI coordinates. Activations were overlaid on a structuralTalairach template image using MRIcro (http://www.sph.sc.edu/comd/rorden/mricro.html).Independent component analysis. Data from the first session of thescan were preprocessed with SPM2 as described above. Thepreprocessed data were then downsampled to one-half its orig-inal resolution (by sampling alternate points) in each dimensionto reduce the heavy memory requirements imposed by ICA. ICAwas then performed on the preprocessed, downsampled data
using the Melodic software package (http://www.fmrib.ox.ac.uk/fsl/). Similar independent components were grouped acrosssubjects using an in-house clustering algorithm; the algorithmcomputes a similarity metric using the inter-subject correlationsof both the spatial map and the associated time course to creategroups of similar components across subjects (6). Componentsin a cluster were then masked with a gray-matter mask andentered into a second random effects analysis (6) and heightthresholded at the P � 0.001 level, uncorrected, to create groupindependent component maps.Calculation of peak latency differences. We used the method devel-oped by Henson and colleagues (7) to identify brain regionswhere the peak of the BOLD response occurred earlier/laterrelative to the transition. Briefly, this method uses a first-orderTaylor approximation (including temporal derivative) in mod-eling the canonical hemodynamic response function; the ratio ofthe derivative to canonical parameter estimates provides ameasure of the latency differences at each voxel, from whichstatistical parametric maps may be constructed for each subject.A group map of BOLD latency was then created by entering theindividual subject latency images (smoothed with an 8-mmFWHM isotropic Gaussian kernel) into a second-level random-effects analysis. Group-level latency SPMs were masked withvoxels that survived the P � 0.05 (corrected) level in the F testsin the original SPMs. The group map was height thresholded atP � 0.025 uncorrected, and only regions comprising at least tencontiguous voxels are reported.Calculation of onset latency differences. Differences in peak latencyof the BOLD response between regions may arise from differ-ences in either the onset or the duration of neural activity (7).Onset latency of the BOLD response provides a means, inprinciple, of decoupling these possibilities so as to uncover theunderlying pattern of neural activity onsets (7–10). We calcu-lated onset latencies according to the method developed bySterzer and Kleinschmidt (8). This method uses a Fourier modelthat fits the BOLD response as a linear combination of Fourierbasis functions; this removes the need for assuming a responseshape a priori. The mean time-series extracted from each ROIfor each subject was fitted with a sixth-order Fourier basis set(windowed with a Hanning function). Onset latencies weredefined as the time at which the slope of the fitted responseexceeded 10% of the maximum slope of the ascending part of theresponse. We then performed a two-sample t-test to identifybrain regions significantly differing in the onsets of their neuralactivity (q �0.05, FDR corrected for multiple comparisons).Granger causality analysis (GCA). GCA was performed in accordancewith the methods of Roebroeck et al. (11). First, the mean timecourse from each ROI was extracted for all subjects. This timecourse was then high-pass filtered at 0.5 cycles per minute. GCAwas performed to test for causal influences between ROIs takenpairwise. The order of the autoregressive model used for com-putation of the influence measure was selected using the Bayes-ian information criterion. We report the raw values of thedirected influence terms for the three tasks in Table S4 A.1, B.1,and C.1. We proceeded to construct a causal connectivity graph(Fig. 3, main text) from these raw F-values as described next.
We performed statistical inference on the causal connectionsusing bootstrap analysis: block-randomized time courses wereused to generate an empirical null distribution of influence terms(F-values) and their differences (11) (the difference terms maybe obtained by subtracting terms symmetrically situated aboutthe main diagonal in Table S4 A.1, B.1, and C.1). Those directed
Sridharan et al. www.pnas.org/cgi/content/short/0800005105 1 of 16

connections whose median (across subjects) was significantlydifferent from the median of the null (F-value) distribution (grayarrows in Fig. 3, main text) were identified using a Mann-Whitney U test and a stringent threshold (P � 0.01, Bonferronicorrected for multiple comparisons). The stringent threshold(and correction) were chosen to avoid potentially spurious causallinks introduced by the low temporal resolution and hemody-namic blurring in the fMRI signal. In addition, a difference ofinfluence term (Fx3y - Fy3x) was used to assess links that showeda dominant direction of influence; the difference term furtherlimits potentially spurious links caused by hemodynamic blur-ring, and permits the use of a less stringent threshold forgroup-level testing (11). Again, these dominant links were thosewherein the median of the difference of influence term signif-icantly differed from the empirically constructed bootstrap (null)distribution (Mann-Whitney U test, P � 0.05). Red arrows Fig.3 (main text) and violet boxes in Table S4 (A.1, B.1, and C.1)highlight these dominant directed connections. P-values forthese connections are parenthetically mentioned inside theviolet boxes in Table S4 (A.1, B.1, and C.1); furthermore, thoseP values that passed the FDR correction for multiple compar-isons are highlighted in blue in the table.
To emphasize the complementarity of the causal and instan-taneous connectivity, we also report the instantaneous influenceterm (Fx.y) which is an indicator of the classic ‘‘zero-lag func-tional connectivity’’ between each pair of nodes (11) (Table S4A.2, B.2, and C.2). A separate analysis confirmed that Fx.y is anindicator of the ‘‘zero-lag’’ correlation (‘‘r’’ value) between pairsof regions: Fx.y and ‘‘r’’ values are tightly correlated across pairsof ROIs for all tasks (r �0.9, P � 10�4). The Fx.y and (Fx3y -Fy3x) terms may be used to infer the relative strength ofinstantaneous vs. causal(directed) interactions, with the caveatthat the instantaneous term is likely artificially inflated due tothe temporal smoothing introduced by the hemodynamic re-sponse (11). Further, to provide concurrent validity to the GCAapproach, we attempted to cluster the six ROIs pairwise tomaximize the sum of mutual (pairwise) instantaneous influences(�Fx.y). Across all experiments, the most optimal clusters (redboxes in Table S4 A.2, B.2, and C.2) were identical with the SN(rFIC, ACC), CEN (rDLPFC, rPPC), and DMN (VMPFC,PPC), further confirming the functional dissociation betweenthese networks that we observed with ICA.Granger causality and network analyses with two other task paradigms.GCA was performed in two other datasets: (a) A visual ‘‘odd-ball’’ attention task (12) employing 13 participants, and (b) aresting state scan employing 22 participants. These data werechosen because they involve entirely different stimulus modal-ities and task requirements. The visual oddball task showedright-lateralized activation of the SN and CEN regions anddeactivation of the DMN regions during the perception of theinfrequent (as contrasted with frequent) stimuli (data notshown). Similarly, statistical parametric latency maps, as com-puted by the method of Henson et al. (7) revealed that the rFICand ACC had earlier peak latency compared to other regions inthe CEN and DMN (data not shown).
For the visual oddball task, ROIs were defined at each key(SN/CEN/DMN) network region as spheres centered at thepeaks of activation (or deactivation) and with radii raging from6–10 mm. ROIs for the resting state task were the same as thoseused for the auditory event segmentation task. Time courseswere extracted from each ROI, and bivariate GCA was per-formed as described above for each ROI pair for each task.Network statistics were computed on these causal networks in amanner similar to that described in the main text (see Materialsand Methods).
Discussion. Potential confound: neural vs. vascular effects. Informationflow between networks of neurons occurs over the timescale of
several tens to hundreds of milliseconds, whereas with fMRI weare constrained to imaging the slow variations in the BOLDsignal that occurs on the order of a few seconds (albeit withexcellent spatial resolution that is impossible to achieve withother scalp-recording techniques that have better temporalresolution, such as electro-encephalograpy or magneto-enceph-alography). Hence, one potential caveat while performing chro-nometric and causal analyses on the BOLD signal is that theobserved effects may reflect vascular rather than neural dynam-ics. However, we present several lines of evidence that argueagainst this possibility:
(i) Previous studies have used chronometric techniques, suchas onset latency analysis, with carefully controlled experimentaldesigns, to show that the relative timing between onsets of theBOLD responses between different regions can be used as apredictor of differences in neural activity onset, and can resolvethese differences with a temporal accuracy of tens to hundredsof milliseconds (8–10)
(ii) In a previous analysis of a Sternberg working memory task,wherein a visual stimulus precedes motor response, we haveshown, using onset latency chronometric analysis, that theBOLD signal onsets earlier in sensory (visual), compared tomotor areas. Similarly, GCA detected a causal influence fromthe visual to motor areas (13), as expected.
(iii) Two recent studies have shown that the BOLD signal istightly coupled with gamma (30–70 Hz) band-limited-power(BLP) of the intracranial EEG in the visual and auditory cortices(14, 15). Several previous studies have shown that there isincreased gamma band activity during visual or tactile attentionin primates and humans (16, 17), and during human consciousperception [intracranial EEG recordings, (18)]. Hence, it isplausible that the BOLD signal f luctuations in the CEN andDMN that appear to be caused by the rFIC (Fig. 3, main text)reflect attentional control mechanisms, mediated by gammapower coupling between these regions, that underlie the CEN-DMN switch.
(iv) Consistent latency differences and causal effects wereobserved across three different datasets, each with a largenumber of subjects, using random effects analyses.
(v) The brain regions probed in our study are served bymultiple cerebral arteries, so the timing of vascular changes areunlikely to be coupled in any significant way. Moreover, it isplausible to assume that the distribution of vasculature is roughlysymmetric across hemispheres: in this case, one would expectthat the vascular dynamics in the right hemispheric regions to bemirrored (or closely approximated) by their left hemisphericcounterparts. However, in our analysis this was not the case:latency and causal connectivity analysis on the correspondingleft hemispheric regions indicated a less robust, and morevariable effects, the dynamics were not similar to those of theirright hemispheric counterparts (across tasks and subjects); lefthemispheric regions often failed to show statistically significantcausal and latency effects (Fig. S3).
These lines of evidence increase confidence, and furtherconfirm, that our findings directly reflect the underlying neuralprocesses.Choice of regions of interest. In the causal connectivity and networkanalyses outlined in the main text, we have confined ourselves tothe six key nodes of the SN, CEN, and DMN, and specifically tothe right hemisphere. Since our question of interest was themechanism of switching between the CEN and DMN, only thoseregions that showed significant latency differences with the CENand DMN regions (as assessed by the whole brain peak latencyanalysis, Fig. S1 and Table S2) were selected for further analysis.In our analysis, only the SN nodes (FIC and ACC) in theprefrontal cortex showed peak latency differences consistentlyacross both auditory segmentation and visual oddball tasks.Hence, we included only the FIC and the ACC (along with the
Sridharan et al. www.pnas.org/cgi/content/short/0800005105 2 of 16
nodes of the CEN and DMN) for subsequent GCA and networkanalyses. In this section we briefly discuss control analysesperformed with brain regions that could play a role in theswitching process, including the left hemispheric counterparts ofthe FIC, DLPFC, and PPC, the temporoparietal junction (TPJ),a key node implicated in directing bottom-up attention to salientenvironmental stimuli (19, 20) as well as sensory regions (pri-mary auditory and visual cortex) that could trigger bottom-upsignaling(i) Left hemispheric regions in the SN, CEN, and DMN. Our previousGLM analysis of the auditory event segmentation task datarevealed that level of activity in the left hemispheric regions(FIC, DLPFC, and PPC) was significantly lower than that of thecorresponding right hemispheric regions [figure 4 in (13)]. GLManalysis of the visual oddball task also indicated significant rightlateralization of responses in the regions of interest (12). Hence,we hypothesized that the signals in the left hemispheric regionsmight be less robust and other effects such as latency, andcausality would be correspondingly weaker. There was evidenceof this in an analysis of the auditory segmentation task: while themean onset latencies of the right and left FICs did not differsignificantly (two sample t-test, P � 0.05), the left FIC onsetlatencies were highly variable across subjects (0.61 � 0.62 s,mean � SD), compared with the right FIC (0.40 � 0.18 s). Thisled to far fewer regions showing significant onset latency dif-ferences with the left FIC (only PCC, data not shown), ascompared with the right FIC that showed significant latencydifferences with almost all of the CEN and DMN regions (Fig.2 in main text). Similarly, the left PPC did not show significantonset latency differences with any region.
To perform connectivity and network analyses on the lefthemispheric regions, we defined the following ROIs in the lefthemisphere: left-hemispheric FIC (lFIC) and left-hemisphericPPC (lPPC) ROIs were defined as spheres of 6–10-mm radiuscentered around the peaks of the ICA activation clusters (TableS1); the left-hemispheric DLPFC (lDLPFC) ROI was derivedfrom its right-hemispheric counterpart (Table S1) by reflectionabout the x � 0 mm sagittal plane. The ACC, VMPFC, and PCCROIs were identical to ones used in the analysis reported in themain text. Time courses were extracted using Marsbar, andconnectivity (GCA) and network analysis were performed asdescribed in the Materials and Methods section in the main text.This analysis revealed that the left FIC did not differ significantlyfrom any of the other regions in its causal outflow (out-indegree) (Fig. S3A), or path length (data not shown). Repeatingthis analysis with the visual oddball and task-free resting statedata revealed that the net causal outflow of the left FIC differedfrom very few regions (Fig. S3 B and C), whereas the right FIChad a much more robust difference in net causal outflow acrossall three tasks (compare with Fig. 4, main text).(ii) Sensory regions vis-a-vis the SN, CEN and DMN. In the present study,the auditory segmentation and visual oddball tasks used differ-ent sensory modalities, whereas the resting state task did notrequire any explicit (task-based) sensory information processing.In fact, analysis of the resting state data also showed that the FICcan exert causal influences across networks without any explicitstimulus. Hence, in the analysis reported in the main text,sensory regions were excluded from connectivity and networkanalysis to emphasize commonality of directional informationflow, and the critical role of the FIC across tasks.
However, examination of the influences of sensory signals onthe three networks remains an important open problem. Doesthe rFIC merely relay bottom-up sensory information from thesensory regions to the other nodes, or truly exert top-downcontrol on the other nodes? To address this question, weperformed onset latency and GCA on ROIs in the sensorycortices vis-a-vis the three networks. Briefly, we defined regionsof interest as spheres of 6–8-mm radius in the bilateral auditory
cortex (Heschl’s gyrus, for the auditory segmentation task, MNIcoordinates: [�53, �8, 4]mm) and bilateral visual cortex (lingualgyrus, Brodmann Area 18, for the visual oddball task, MNIcoordinates: [�9, �82, �7]mm). We extracted the time seriesfrom these regions as before (see Materials and Methods). Itmust be noted that, in Experiment 1 (auditory event segmenta-tion), activation in the auditory cortex was positively correlatedwith amplitude changes in the music; we did not detect anyregion in the auditory cortex that increased its activity inresponse to decreased sound amplitude (13). Thus, at the eventsof interest (musical movement transitions), which are accompa-nied by a brief silence, we expected auditory cortex activity to bediminished (and this was indeed what we found using a GLManalysis, data not shown). Hence, the time series of the auditorycortices were inverted before further analysis (similar to theVMPFC and PCC, as in Fig. S2), because we hypothesized thatthe onset of the decrease in activity could, in fact, provide asignal to higher areas and/or prefrontal regions. For Experiment2 (visual oddball), no such inversion of the signals from the visualcortex was considered necessary.
Latency analysis of the signals from the sensory corticesrevealed that the onset latency of these regions did not differsignificantly from the rFIC (two-sample t test, P � 0.05, Bon-ferroni correction for multiple comparisons). The auditory andvisual cortices demonstrated early onsets (median of 0.3 s to0.4 s; comparable to the rFIC) although these differences werenot statistically significantly different from the other regions(two-sample t test, P � 0.05). Similarly, GCA on a networkincluding the sensory regions for the auditory segmentation taskrevealed a mean Fx3y of 0.0365 from auditory cortex to the rFICand 0.0323 from the rFIC to the auditory cortex (P � 0.01,Mann-Whitney U test, Bonferroni correction for multiple com-parisons): the dominant direction of influence (difference term,Fx3y – Fy3x) was from the auditory cortex to the rFIC, but thisdid not reach significance (P � 0.05, Mann-Whitney U test). Onthe other hand, this trend was reversed in the visual oddball task,with a mean Fx3y of 0.0286 from visual cortex to rFIC and 0.0465from rFIC to visual cortex; again, the dominant direction ofinfluence (in this case from rFIC to visual cortex) did not reachsignificance. Overall, we found that while there was someevidence of early onset in the sensory cortices across tasks, thedirectionality of information flow (to and from the rFIC) couldnot be unambiguously resolved. One possibility here is that thereis some sort of early but weak signaling from the sensory regionsthat is amplified by the FIC. Again, the lack of robust latencydifferences between the sensory regions and the FIC may be dueto the relative insensitivity of fMRI to detect small latencydifferences. Hence, a proper examination of this issue mayrequire simultaneous EEG and fMRI recordings (12).(iii) The role of the right temporo-parietal junction (rTPJ) vis-a-vis the rightfronto-insular cortex (rFIC) in attention switching. Corbetta & Shulman(19) proposed that the rTPJ is an important component of thebottom-up salience detection system (redirecting endogenousattention to external stimuli). Our data suggest that the rFIC mayhave primacy in initiating the control signals responsible forswitching between endogenous (default-mode) and exogenousattentional systems. In a more recent study, Shulman et al. (20)investigated several coordinates in the TPJ region. Of specialrelevance are two subregions in the right TPJ (rTPJ): one moredorsal (Talairach coordinates: 45, �49, 46; or MNI coordinates:46, �52, 47), and the second more ventral (Talairach coordi-nates: 52, �49, 26; or MNI coordinates 53, �52, 26). The formerregion lies in close proximity to the rPPC region that was thefocus of our study (MNI coordinates: 54, �50, 50). Our analysisindicates that the rFIC had a consistently earlier peak and onsetlatency compared to the rPPC (Fig. 2, Fig. S1); connectivity andnetwork analyses also demonstrate that the rFIC also has asignificantly higher net causal outflow than the rPPC (see Fig. 4,
Sridharan et al. www.pnas.org/cgi/content/short/0800005105 3 of 16
main text). Intriguingly, the rPPC appeared to relay informationfrom the rFIC to the DMN regions (PCC and VMPFC) in thevisual oddball and resting state tasks (Fig. 3 B and C, main text)indicating that the rPPC may mediate deactivation of the DMNregions based on a control signal from the rFIC.
The latter (more ventral) rTPJ subregion is more proximal tothe classic TPJ implicated in detecting changes in the sensoryenvironment (19, 21). We performed control analyses on thisregion (identified on the basis of GLM activation clusters) forboth the auditory segmentation (8-mm sphere centered at [54,�44, 20]mm, MNI) and visual oddball (8-mm sphere centered at[57, �46, 18]mm, MNI) task. These analyses indicated that therTPJ has an onset that followed the rFIC (mean onset difference0.25 s for auditory segmentation task, and 0.8 s for the visualoddball task, rFIC leading), but these differences were notstatistically significant (two-sample t-test, P � 0.05). GCA andsubsequent network analyses indicated that the dominant causalinfluence direction in the auditory segmentation task was fromthe rFIC to the rTPJ with a mean Fx3y of 0.0350 from rFIC tothe rTPJ (F:rFIC3rTPJ) and 0.0219 in the reverse direction(F:rTPJ3rFIC) (P � 0.01, Mann-Whitney U test, Bonferronicorrection for multiple comparisons); however, the dominantdirection of influence (difference term, Fx3y – Fy3x) did notreach significance (P � 0.05, Mann-Whitney U test). For thevisual oddball task these numbers were 0.0620 (F:rFIC3rTPJ)and 0.0474 (F:rTPJ3rFIC), respectively (P � 0.01, Mann-Whitney U test, Bonferroni correction for multiple compari-sons). Moreover, the dominant direction of influence from rFICto rTPJ was significant at the P � 0.05 level (Mann-Whitney Utest) (Fig. S4). The rFIC also appeared to be more of a centralnetwork hub with a higher net causal outflow (1.9 and 1.8 for thetwo tasks) compared with the rTPJ (0.6 and 0.3 for the twotasks), and shorter path length (1.20 and 1.56 vs. 1.35 and 1.59)although these differences were not statistically significant(two-sample t-test, P � 0.05) after correcting for multiplecomparisons.
In summary, our findings indicate that the rFIC in factprecedes and exerts causal influences on the rTPJ, rather thanthe other way round, and leads us to hypothesize that the rFICmay, in fact, be the primal circuit breaker that helps redirectendogenous attention in response to salient environmentalstimuli.
A brief discussion on Granger Causality Analysis. (i) Latency (fMRImental chronometry) and Granger causality analyses. We have usedseveral analyses techniques, viz., peak, onset, and GrangerCausality analyses, to examine the dynamics of response in thesix key regions of the SN, CEN, and DMN. Here we provide abrief description of how these analyses relate to, and comple-ment each other. The peak latency analysis of (7), provides astatistical parametric map of peak BOLD latencies across theentire brain, which can be used as a starting point for identifyingkey regions wherein the BOLD response peaks earlier or later,which may be taken as a basic indicator of the relative latency ofthe underlying neural responses. However, a precise quantifica-tion of the latencies in these regions using this approach is notpossible due to high estimation errors in the derivative tocanonical ratio (7). Moreover, responses of different amplitudesthat onset at the same times may peak at different times (withthe larger amplitude response having a later peak). To overcomethese limitations, we performed onset latency analysis on keyregions in the SN, CEN, and DMN [according to the method ofSterzer and Kleinschmidt (8)], which provides a better measureof the relative underlying neural latency differences. Thus, theseanalyses are complementary, and while one expects early onsetregions to also have early peaks (such as we observe in the rFIC),
in theory the results from the two analyses need not necessarilyoverlap.
Again, while peak and onset latency analyses can demonstrateprecedence of activation between the CEN-DMN nodes andrFIC, these cannot directly address the presence (or absence) oftop-down control that the rFIC would exert on the CEN andDMN regions (22). On the other hand, GCA provides a moreprincipled way to assess top-down control across task paradigms,since it involves contributions from both the stimulus lockedBOLD signal as well as stochastic components that are notnecessarily stimulus locked (11). In this sense, the two types ofanalyses are complementary. Findings from onset latency re-solved chronometry (fMRI mental chronometry) and GCA neednot necessarily overlap, although in practice we do observesignificant overlap between these. For instance, the earlier peakand onset latencies of the FIC in the SN are reflective of theunderlying causal connectivity pattern with maximal outflowfrom the FIC across tasks. However, earlier onset alone does notnecessarily correspond to a high causal outflow, as evidenced inthe ACC, which has a relatively low, and sometimes evennegative net causal outflow. These findings are in line withprevious observations on these analyses (10, 11, 13, 22).(ii) Relationship between zero-lag functional connectivity, independentcomponent and Granger causality (causal connectivity) analyses. In ouranalysis, we have used ICA to show the statistical independencebetween the SN, CEN, and DMN. ICA performs spatial decom-position to generate maximally independent spatial maps eachwith an associated timecourse. Each voxel in a spatial ICA maphas an identical time-course (except for a scale factor) (23). Inthis sense, ICA is analogous to functional connectivity in that itidentifies spatial clusters of voxels in the brain that have highzero-lag correlations. Moreover, ICA goes beyond traditionalfunctional connectivity analyses by ensuring that noise relatedcomponents (related to movement, etc.) are factored out of thevoxels before the zero-lag spatial correlation maps are com-puted. There is a fundamental difference between ‘‘functionalconnectivity’’ as assessed by zero-lag correlation analysis (suchas ICA) and ‘‘causal connectivity’’ as assessed by GCA. WhileICA decouples these regions (shows them to be functionallydisconnected) based on instantaneous correlations, GCA at-tempts to capture the power of a region’s signal to predict thefuture signal in another region, and evaluates whether theseregions are functionally coupled based on the history of thesignals (24). For instance, while there is no instantaneouscorrelation between the different networks, it is possible thatthese regions are correlated in a time-shifted fashion. Whileprevious studies have shown that the signal in the DMN andCEN/SN are anti-correlated (25, 26), our study replicates thisresult, and further shows that the BOLD signal in the SN has ashorter onset latency compared to the CEN and the DMN (Fig.2 and Fig. S2 in our study). GCA exploits this temporal prece-dence information in a statistical (biviriate/multivariate autore-gressive) framework to compute ‘‘causal’’ connectivity betweenbrain regions. However, as a special case, GCA can also be usedto capture zero lag correlations using the ‘‘instantaneous’’ termFx.y, which approximately corresponds to the residual interac-tions remaining that could not be assigned a specific direction-ality (11). Indeed, we found that pairwise clustering of regionsbased on the instantaneous F term (described previously),revealed that across all experiments, the most optimal clusters(red boxes in Table S4 A.2, B.2, and C.2) were identical with theSN (rFIC, ACC), CEN (rDLPFC, rPPC), and DMN (VMPFC,PPC). Thus, we were able to provide concurrent validity to theGCA approach by confirming the functional dissociation be-tween these networks that we had already observed with ICA(Fig. 1, main text).
Sridharan et al. www.pnas.org/cgi/content/short/0800005105 4 of 16

1. Glover GH, Lai S (1998) Self-navigated spiral fMRI: Interleaved versus single-shot. MagnReson Med 39:361–368.
2. Kim DH, Adalsteinsson E, Glover GH, Spielman DM (2002) Regularized higher-order invivo shimming. Magn Reson Med 48:715–722.
3. Friston KJ, Williams S, Howard R, Frackowiak RS, Turner R (1996) Movement-relatedeffects in fMRI time-series. Magn Reson Med 35:346–355.
4. Macey PM, Macey KE, Kumar R, Harper RM (2004) A method for removal of globaleffects from fMRI time series. Neuroimage 22:360–366.
5. Poline JB, Worsley KJ, Evans AC, Friston KJ (1997) Combining spatial extent and peakintensity to test for activations in functional imaging. Neuroimage 5:83–96.
6. Esposito F, et al. (2005) Independent component analysis of fMRI group studies byself-organizing clustering. Neuroimage 25:193–205.
7. Henson RN, Price CJ, Rugg MD, Turner R, Friston KJ (2002) Detecting latency differencesin event-related BOLD responses: Application to words versus nonwords and initialversus repeated face presentations. Neuroimage 15:83–97.
8. Sterzer P, Kleinschmidt A (2007) A neural basis for inference in perceptual ambiguity.Proc Natl Acad Sci USA 104:323–328.
9. Formisano E, Goebel R (2003) Tracking cognitive processes with functional MRI mentalchronometry. Curr Opin Neurobiol 13:174–181.
10. Menon RS, Luknowsky DC, Gati JS (1998) Mental chronometry using latency-resolvedfunctional MRI. Proc Natl Acad Sci USA 95:10902–10907.
11. Roebroeck A, Formisano E, Goebel R (2005) Mapping directed influence over the brainusing granger causality and fMRI. Neuroimage 25:230–242.
12. Crottaz-Herbette S, Menon V (2006) Where and when the anterior cingulate cortexmodulates attentional response: Combined fMRI and ERP evidence. J Cogn Neurosci18:766–780.
13. Sridharan D, Levitin DJ, Chafe CH, Berger J, Menon V (2007) Neural dynamics of eventsegmentation in music: Converging evidence for dissociable ventral and dorsal net-works. Neuron 55:521–532.
14. Privman E, et al. (2007) Enhanced category tuning revealed by intracranial electroen-cephalograms in high-order human visual areas. J Neurosci 27:6234–6242.
15. Nir Y, et al. (2007) Coupling between neuronal firing rate, gamma LFP, and BOLD fMRIis related to interneuronal correlations. Curr Biol 17:1275–1285.
16. Womelsdorf T, Fries P, Mitra PP, Desimone R (2006) Gamma-band synchronization invisual cortex predicts speed of change detection. Nature 439:733–736.
17. Bauer M, Oostenveld R, Peeters M, Fries P (2006) Tactile spatial attention enhancesgamma-band activity in somatosensory cortex and reduces low-frequency activity inparieto-occipital areas. J Neurosci 26:490–501.
18. Meador KJ, Ray PG, Echauz JR, Loring DW, Vachtsevanos GJ (2002) Gamma coherenceand conscious perception. Neurology 59:847–854.
19. Corbetta M, Shulman GL (2002) Control of goal-directed and stimulus-driven attentionin the brain. Nat Rev Neurosci 3:201–215.
20. Shulman GL, Astafiev SV, McAvoy MP, d’Avossa G, Corbetta M (2007) Right TPJdeactivation during visual search: Functional significance and support for a filterhypothesis. Cereb Cortex 17:2625–2633.
21. Downar J, Crawley AP, Mikulis DJ, Davis KD (2000) A multimodal cortical network forthe detection of changes in the sensory environment. Nat Neurosci 3:277–283.
22. Goebel R, Roebroeck A, Kim DS, Formisano E (2003) Investigating directed corticalinteractions in time-resolved fMRI data using vector autoregressive modeling andgranger causality mapping. Magn Reson Imaging 21:1251–1261.
23. Beckmann CF, Smith SM (2004) Probabilistic independent component analysis forfunctional magnetic resonance imaging. IEEE Trans Med Imaging 23:137–152.
24. Miller BT, D’Esposito M (2005) Searching for ‘‘the top’’ in top-down control. Neuron48:535–538.
25. Greicius MD, Krasnow B, Reiss AL, Menon V (2003) Functional connectivity in theresting brain: A network analysis of the default mode hypothesis. Proc Natl Acad SciUSA 100:253–258.
26. Fox MD, Snyder AZ, Zacks JM, Raichle ME (2006) Coherent spontaneous activityaccounts for trial-to-trial variability in human evoked brain responses. Nat Neurosci9:23–25.
Sridharan et al. www.pnas.org/cgi/content/short/0800005105 5 of 16
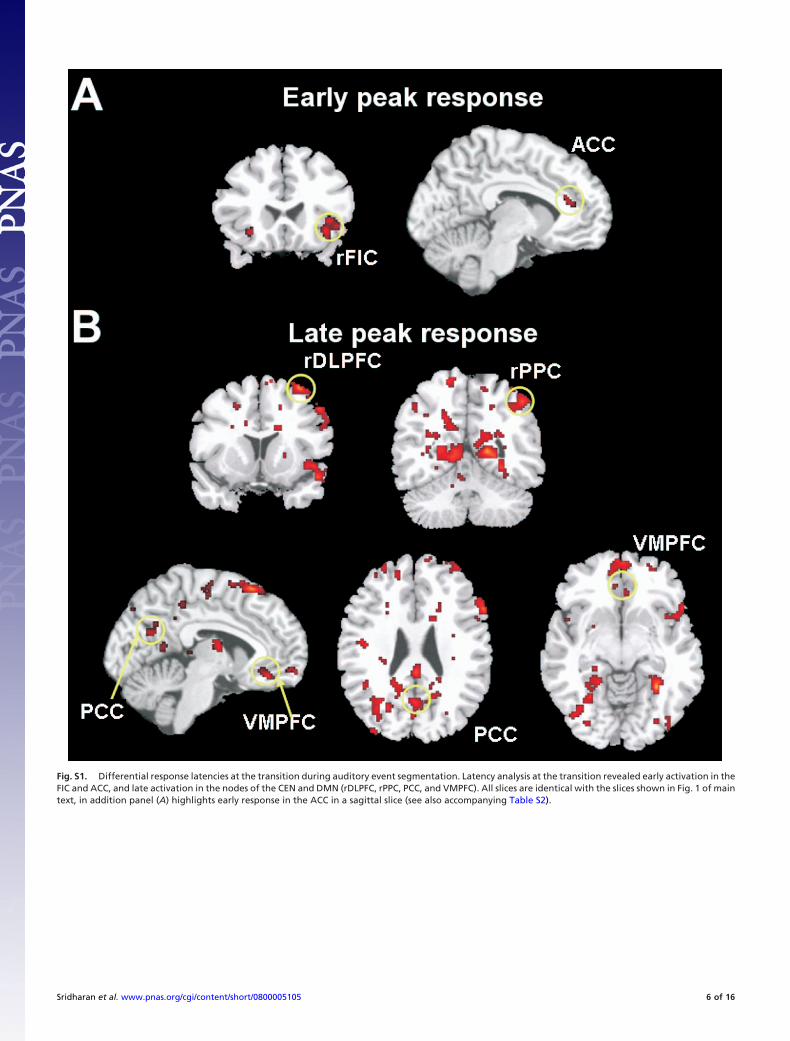
Fig. S1. Differential response latencies at the transition during auditory event segmentation. Latency analysis at the transition revealed early activation in theFIC and ACC, and late activation in the nodes of the CEN and DMN (rDLPFC, rPPC, PCC, and VMPFC). All slices are identical with the slices shown in Fig. 1 of maintext, in addition panel (A) highlights early response in the ACC in a sagittal slice (see also accompanying Table S2).
Sridharan et al. www.pnas.org/cgi/content/short/0800005105 6 of 16

Fig. S2. BOLD response fitted by a Fourier model in the key network regions during auditory event segmentation. The BOLD response was fitted by a sixth-orderFourier model in each of the key nodes of the networks. The fitted responses were averaged across events and subjects for each node and plotted as a percentagesignal change from baseline following the occurrence of the event (transition) at t � 0 s. It can be seen that peak activation in the FIC and ACC precedes bothpeak deactivation in the VMPFC and PCC, and peak activation in the rDLPFC and rPPC. For clarity, the inverted responses in the VMPFC and PCC are shown asdot-dashed lines. Error bars at each TR (2 s) show S.E.M. of the fitted responses across subjects. These fitted responses were further used to define the onset latencyfor each region (Fig. 2 in main text).
Sridharan et al. www.pnas.org/cgi/content/short/0800005105 7 of 16
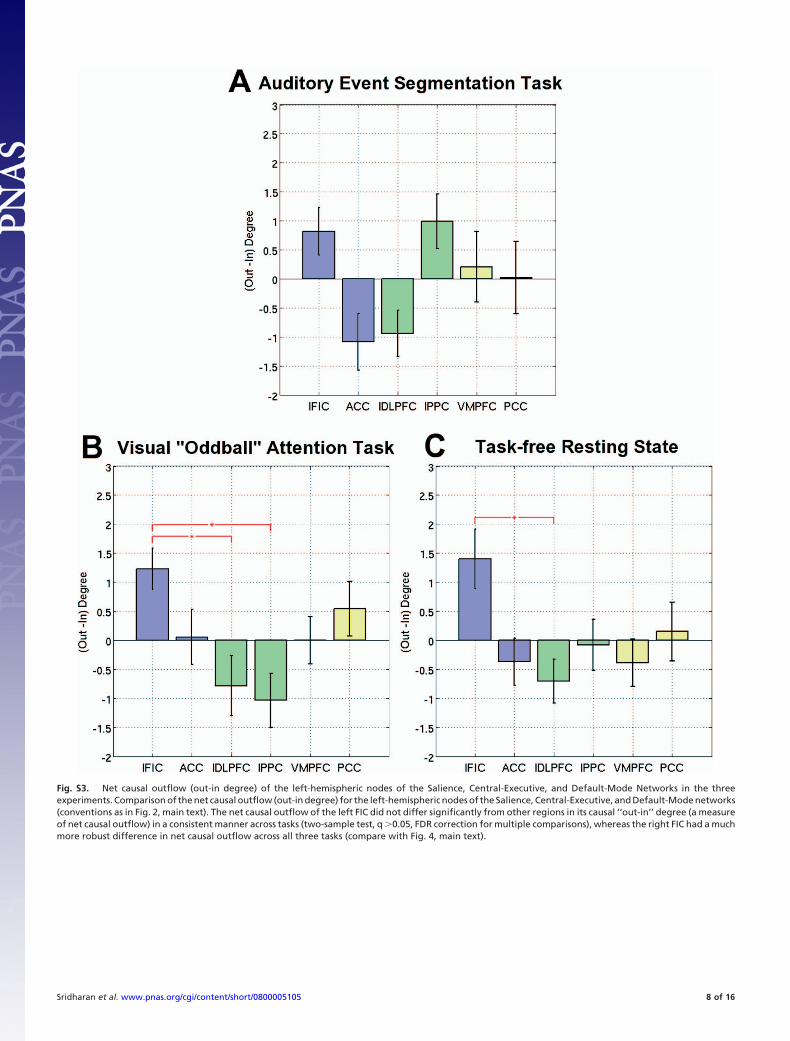
Fig. S3. Net causal outflow (out-in degree) of the left-hemispheric nodes of the Salience, Central-Executive, and Default-Mode Networks in the threeexperiments. Comparison of the net causal outflow (out-in degree) for the left-hemispheric nodes of the Salience, Central-Executive, and Default-Mode networks(conventions as in Fig. 2, main text). The net causal outflow of the left FIC did not differ significantly from other regions in its causal ‘‘out-in’’ degree (a measureof net causal outflow) in a consistent manner across tasks (two-sample test, q �0.05, FDR correction for multiple comparisons), whereas the right FIC had a muchmore robust difference in net causal outflow across all three tasks (compare with Fig. 4, main text).
Sridharan et al. www.pnas.org/cgi/content/short/0800005105 8 of 16

Fig. S4. Granger causality analysis network diagram of the rTPJ and rFIC for the auditory segmentation and visual oddball tasks. Bivariate GCA on the rTPJ (leftpanel) and rFIC (right panel) with the key nodes of the CEN and DMN in the auditory event segmentation (A) and visual oddball (B) tasks revealed that thedominant direction of influence was from the rFIC to the rTPJ for both tasks (conventions as in Fig. 3, main text). The rFIC also had a consistently higher net causaloutflow (out-in degree, indicated at the bottom of each panel) across both tasks, suggesting that the rFIC may have overall primacy in initiating the switchbetween exogenous and endogenous attentional systems in the brain [the apparent discrepancy between the net causal outflow values of the rFIC reported hereand Fig. 4 (main text), and Table S5, arises from the rTPJ being included here as an additional node in the network analysis].
Sridharan et al. www.pnas.org/cgi/content/short/0800005105 9 of 16
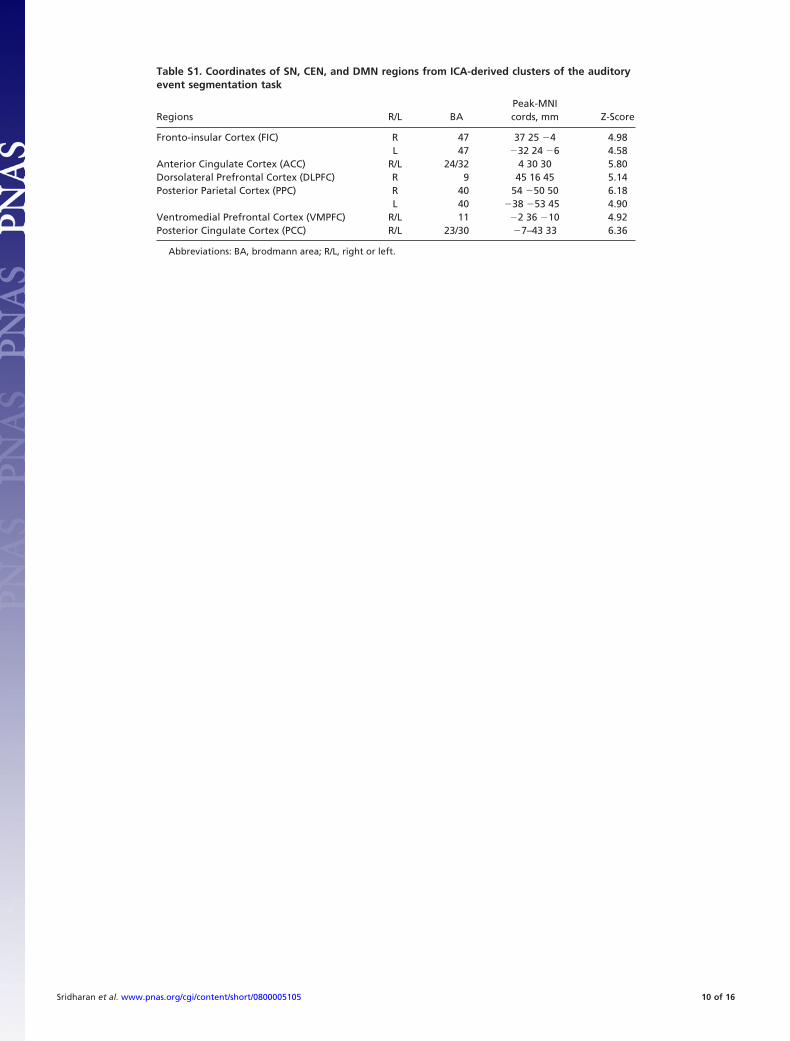
Table S1. Coordinates of SN, CEN, and DMN regions from ICA-derived clusters of the auditoryevent segmentation task
Regions R/L BAPeak-MNIcords, mm Z-Score
Fronto-insular Cortex (FIC) R 47 37 25 �4 4.98L 47 �32 24 �6 4.58
Anterior Cingulate Cortex (ACC) R/L 24/32 4 30 30 5.80Dorsolateral Prefrontal Cortex (DLPFC) R 9 45 16 45 5.14Posterior Parietal Cortex (PPC) R 40 54 �50 50 6.18
L 40 �38 �53 45 4.90Ventromedial Prefrontal Cortex (VMPFC) R/L 11 �2 36 �10 4.92Posterior Cingulate Cortex (PCC) R/L 23/30 �7–43 33 6.36
Abbreviations: BA, brodmann area; R/L, right or left.
Sridharan et al. www.pnas.org/cgi/content/short/0800005105 10 of 16

Table S2. Coordinates of SN, CEN, and DMN cluster peaks frompeak latency analysis of the auditory event segmentation task(refer to Figure S1)
Regions R/L BAPeak-MNI
cords (mm)
Fronto-insular Cortex (FIC) R 47 34 26 �6L 47 �32 25 �10
Anterior Cingulate Cortex (ACC) R/L 24/32 7 33 19Dorsolateral Prefrontal Cortex (DLPFC) R 9 50 15 43Posterior Parietal Cortex (PPC) R 40 50 �50 51
L 40 �46 �50 44Ventromedial Prefrontal Cortex (VMPFC) R/L 11 3 37 �14Posterior Cingulate Cortex (PCC) R/L 23/30 1 �60 30
Abbreviations: BA, brodmann area; R/L, right or left.
Sridharan et al. www.pnas.org/cgi/content/short/0800005105 11 of 16
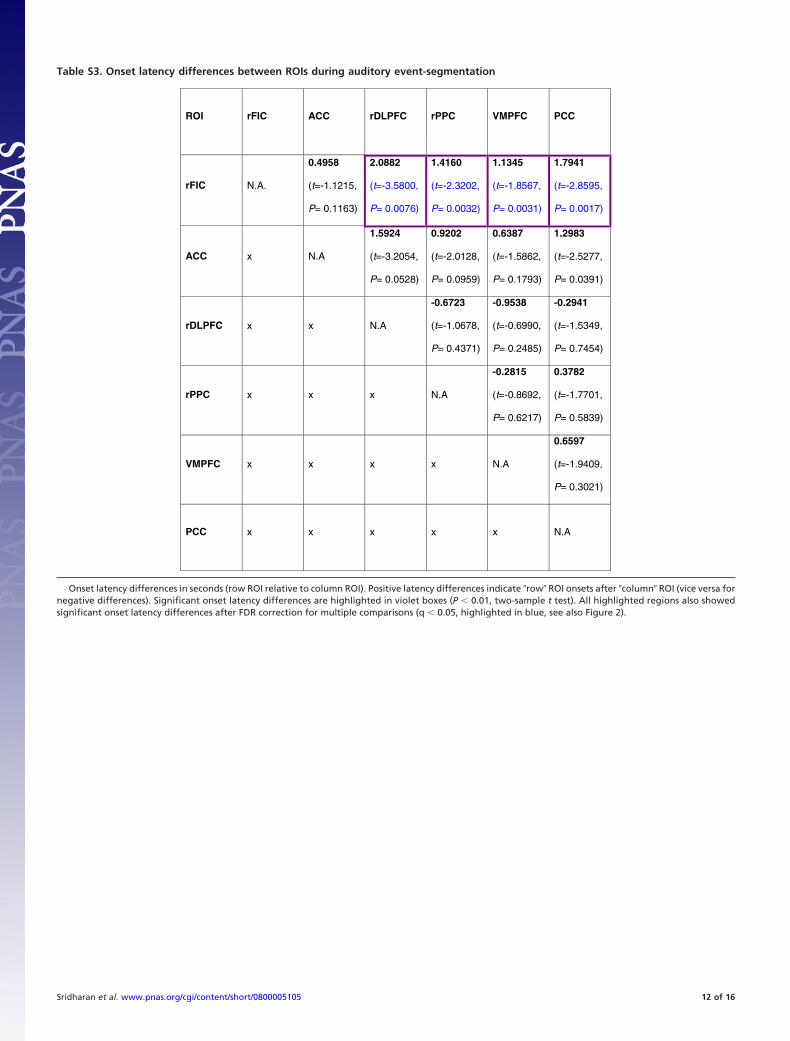
Table S3. Onset latency differences between ROIs during auditory event-segmentation
ROI rFIC ACC rDLPFC rPPC VMPFC PCC
rFIC N.A.
0.4958
(t=-1.1215,
P= 0.1163)
2.0882
(t=-3.5800,
P= 0.0076)
1.4160
(t=-2.3202,
P= 0.0032)
1.1345
(t=-1.8567,
P= 0.0031)
1.7941
(t=-2.8595,
P= 0.0017)
ACC x N.A
1.5924
(t=-3.2054,
P= 0.0528)
0.9202
(t=-2.0128,
P= 0.0959)
0.6387
(t=-1.5862,
P= 0.1793)
1.2983
(t=-2.5277,
P= 0.0391)
rDLPFC x x N.A
-0.6723
(t=-1.0678,
P= 0.4371)
-0.9538
(t=-0.6990,
P= 0.2485)
-0.2941
(t=-1.5349,
P= 0.7454)
rPPC x x x N.A
-0.2815
(t=-0.8692,
P= 0.6217)
0.3782
(t=-1.7701,
P= 0.5839)
VMPFC x x x x N.A
0.6597
(t=-1.9409,
P= 0.3021)
PCC x x x x x N.A
Onset latency differences in seconds (row ROI relative to column ROI). Positive latency differences indicate row ROI onsets after column ROI (vice versa fornegative differences). Significant onset latency differences are highlighted in violet boxes (P � 0.01, two-sample t test). All highlighted regions also showedsignificant onset latency differences after FDR correction for multiple comparisons (q � 0.05, highlighted in blue, see also Figure 2).
Sridharan et al. www.pnas.org/cgi/content/short/0800005105 12 of 16
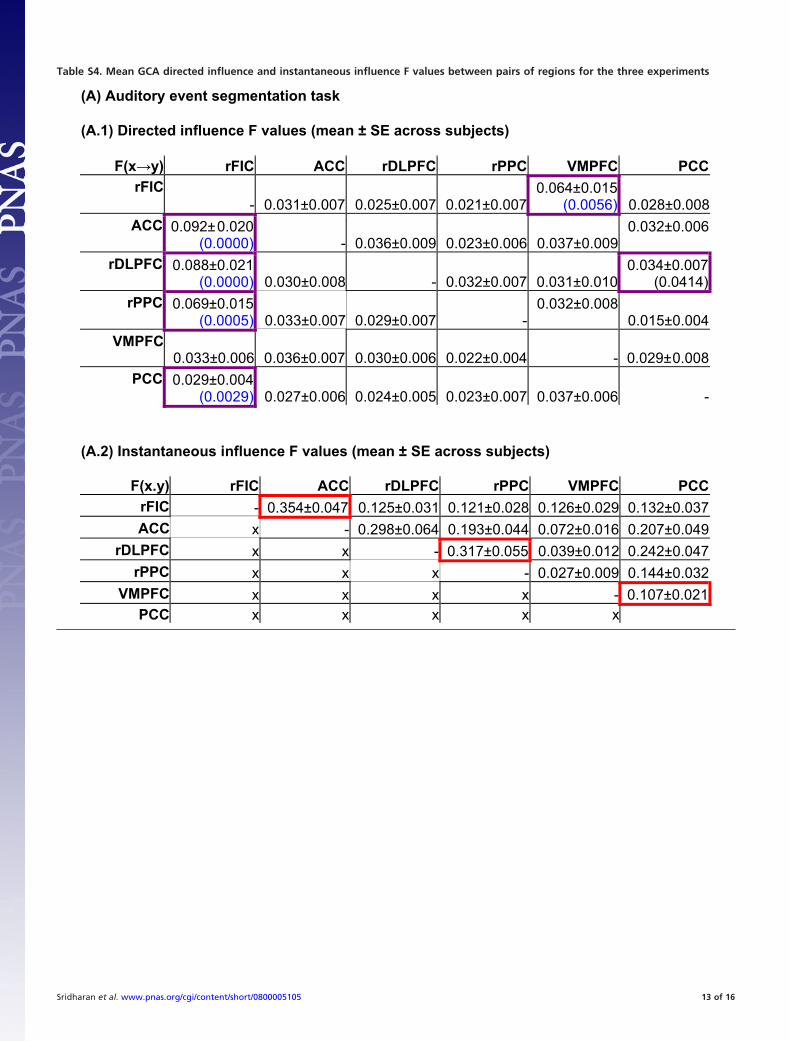
Table S4. Mean GCA directed influence and instantaneous influence F values between pairs of regions for the three experiments
(A) Auditory event segmentation task
(A.1) Directed influence F values (mean ± SE across subjects)
F(x y) rFIC ACC rDLPFC rPPC VMPFC PCCrFIC
- 0.031±0.007 0.025±0.007 0.021±0.0070.064±0.015
(0.0056) 0.028±0.008ACC 0.092± 0.020
(0.0000) - 0.036±0.009 0.023±0.006 0.037±0.0090.032±0.006
rDLPFC 0.088±0.021(0.0000) 0.030±0.008 - 0.032±0.007 0.031±0.010
0.034±0.007(0.0414)
rPPC 0.069±0.015(0.0005) 0.033±0.007 0.029±0.007 -
0.032± 0.0080.015±0.004
VMPFC0.033±0.006 0.036±0.007 0.030±0.006 0.022±0.004 - 0.029± 0.008
PCC 0.029±0.004(0.0029) 0.027±0.006 0.024±0.005 0.023±0.007 0.037±0.006 -
(A.2) Instantaneous influence F values (mean ± SE across subjects)
F(x.y) rFIC ACC rDLPFC rPPC VMPFC PCCrFIC - 0.354±0.047 0.125±0.031 0.121±0.028 0.126±0.029 0.132±0.037ACC x - 0.298±0.064 0.193±0.044 0.072±0.016 0.207±0.049
rDLPFC x x - 0.317±0.055 0.039±0.012 0.242±0.047rPPC x x x - 0.027±0.009 0.144±0.032
VMPFC x x x x - 0.107±0.021PCC x x x x x
Sridharan et al. www.pnas.org/cgi/content/short/0800005105 13 of 16

Table S4. (Continued).
(B) Visual oddball attention task
(B.1) Directed influence F values (mean ±± SE across subjects)
F(x y) rFIC ACC rDLPFC rPPC VMPFC PCCrFIC
- 0.036±0.010 0.036±0.011 0.034±0.005 0.065±0.021 0.042±0.022ACC 0.078±0.011
(0.0010) - 0.022±0.004 0.028±0.009 0.035±0.008 0.033±0.007rDLPFC 0.076±0.015
(0.0044) 0.045±0.014 -0.049±0.012
(0.0303) 0.028±0.005 0.043±0.024rPPC 0.058±0.015
(0.0286)0.036±0.007
(0.0500) 0.024±0.005 - 0.039±0.009 0.022±0.006VMPFC
0.042±0.009 0.034±0.010 0.034±0.011 0.036±0.010 - 0.051±0.021PCC
0.033±0.010 0.030±0.009 0.023±0.0050.032±0.006
(0.0052) 0.030±0.006 -
(B.2) Instantaneous influence F values (mean ± SE across subjects)
F(x.y) rFIC ACC rDLPFC rPPC VMPFC PCCrFIC - 0.420±0.069 0.176±0.027 0.232±0.037 0.101±0.065 0.126±0.038ACC x - 0.241±0.053 0.264±0.052 0.057±0.020 0.211±0.047
rDLPFC x x - 0.462±0.047 0.041±0.020 0.084±0.033rPPC x x x - 0.050±0.014 0.156±0.057
VMPFC x x x x - 0.082±0.022PCC x x x x x -
Sridharan et al. www.pnas.org/cgi/content/short/0800005105 14 of 16
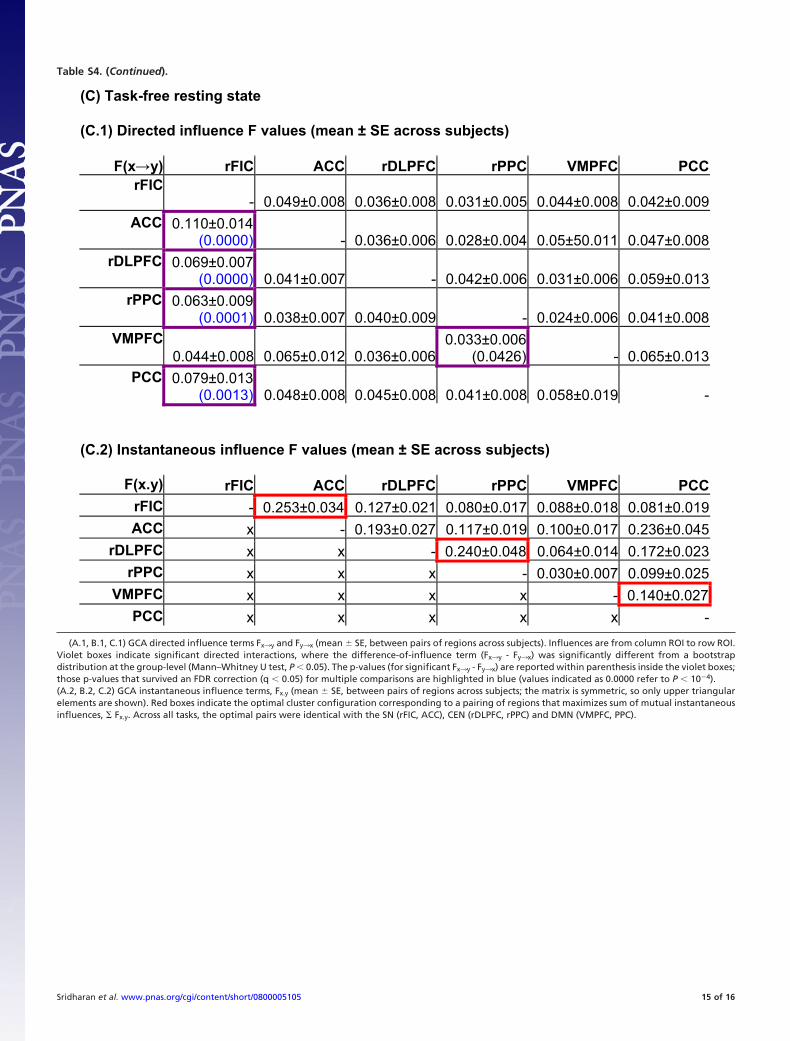
Table S4. (Continued).
(C) Task-free resting state
(C.1) Directed influence F values (mean ± SE across subjects)
F(x y) rFIC ACC rDLPFC rPPC VMPFC PCCrFIC
- 0.049±0.008 0.036±0.008 0.031±0.005 0.044±0.008 0.042±0.009ACC 0.110±0.014
(0.0000) - 0.036±0.006 0.028±0.004 0.05±50.011 0.047±0.008rDLPFC 0.069±0.007
(0.0000) 0.041±0.007 - 0.042±0.006 0.031±0.006 0.059±0.013rPPC 0.063±0.009
(0.0001) 0.038±0.007 0.040±0.009 - 0.024±0.006 0.041±0.008VMPFC
0.044±0.008 0.065±0.012 0.036±0.0060.033±0.006
(0.0426) - 0.065±0.013PCC 0.079±0.013
(0.0013) 0.048±0.008 0.045±0.008 0.041±0.008 0.058±0.019 -
(C.2) Instantaneous influence F values (mean ± SE across subjects)
F(x.y) rFIC ACC rDLPFC rPPC VMPFC PCCrFIC - 0.253±0.034 0.127±0.021 0.080±0.017 0.088±0.018 0.081±0.019ACC x - 0.193±0.027 0.117±0.019 0.100±0.017 0.236±0.045
rDLPFC x x - 0.240±0.048 0.064±0.014 0.172±0.023rPPC x x x - 0.030±0.007 0.099±0.025
VMPFC x x x x - 0.140±0.027PCC x x x x x -
(A.1, B.1, C.1) GCA directed influence terms Fx3y and Fy3x (mean � SE, between pairs of regions across subjects). Influences are from column ROI to row ROI.Violet boxes indicate significant directed interactions, where the difference-of-influence term (Fx3y - Fy3x) was significantly different from a bootstrapdistribution at the group-level (Mann–Whitney U test, P � 0.05). The p-values (for significant Fx3y - Fy3x) are reported within parenthesis inside the violet boxes;those p-values that survived an FDR correction (q � 0.05) for multiple comparisons are highlighted in blue (values indicated as 0.0000 refer to P � 10�4).(A.2, B.2, C.2) GCA instantaneous influence terms, Fx.y (mean � SE, between pairs of regions across subjects; the matrix is symmetric, so only upper triangularelements are shown). Red boxes indicate the optimal cluster configuration corresponding to a pairing of regions that maximizes sum of mutual instantaneousinfluences, � Fx.y. Across all tasks, the optimal pairs were identical with the SN (rFIC, ACC), CEN (rDLPFC, rPPC) and DMN (VMPFC, PPC).
Sridharan et al. www.pnas.org/cgi/content/short/0800005105 15 of 16

Table S5. Network analysis of the causal interactions in the three experiments
ROI Out-degree In-degree Out-In degree Path length
A. Auditory event segmentationrFIC 3.00 � 0.26 1.05 � 0.18 �1.95 � 0.38 1.22 � 0.06ACC 1.15 � 0.28 1.99 � 0.30 �0.84 � 0.53 1.44 � 0.07rDLPFC 1.06 � 0.26 2.09 � 0.24 �1.02 � 0.46 1.41 � 0.05rPPC 1.24 � 0.30 1.72 � 0.31 �0.49 � 0.55 1.47 � 0.08VMPFC 2.01 � 0.33 1.52 � 0.24 0.49 � 0.53 1.36 � 0.07PCC 1.57 � 0.31 1.66 � 0.31 �0.09 � 0.53 1.49 � 0.12
B. Visual oddball attentionrFIC 1.86 � 0.39 0.72 � 0.24 �1.14 � 0.54 1.61 � 0.15ACC 0.94 � 0.29 0.92 � 0.29 0.02 � 0.49 1.87 � 0.19rDLPFC 0.49 � 0.16 1.54 � 0.34 �1.05 � 0.36 1.68 � 0.11rPPC 0.87 � 0.24 0.95 � 0.23 �0.08 � 0.35 2.06 � 0.35VMPFC 0.85 � 0.29 0.87 � 0.30 �0.02 � 0.42 2.00 � 0.24PCC 0.67 � 0.36 0.68 � 0.23 �0.01 � 0.47 1.93 � 0.13
C. Task-free resting staterFIC 2.50 � 0.25 0.81 � 0.17 �1.70 � 0.36 1.40 � 0.07ACC 1.10 � 0.23 1.53 � 0.25 �0.43 � 0.42 1.53 � 0.05rDLPFC 0.99 � 0.28 1.56 � 0.26 �0.57 � 0.47 1.53 � 0.07rPPC 1.13 � 0.25 1.24 � 0.22 �0.11 � 0.41 1.79 � 0.24VMPFC 1.05 � 0.20 1.55 � 0.21 �0.50 � 0.33 1.62 � 0.09PCC 1.41 � 0.31 1.49 � 0.31 �0.08 � 0.56 1.54 � 0.12
Network analysis on the causal interactions identified with GCA revealed that the rFIC (boldface) had thehighest out-degree, lowest in-degree, highest out-in degree, and shortest path length among all regions of theSN, CEN, and DMN. This indicates that the rFIC is a critical outflow hub at the intersection of the CEN and DMN.Out-degree: Number of causal outflow connections from a nodeIn-degree: Number of causal in-flow connections to a nodeOut-In-degree: Difference between Out-degree and In-degree (a measure of net causal outflow from a node)Path length: Shortest path from a node to every other node in the network calculated by Dijkstra’s algorithm(normalized by the number of nodes minus one).Values of the metrics reported are mean � SE across subjects.
Sridharan et al. www.pnas.org/cgi/content/short/0800005105 16 of 16